Highlights
Evaluating forest cover and carbon stock variability is crucial for developing climate change resilience strategies.
Satellite images are fundamental tools for assessing forest cover and carbon stock dynamics.
The Middle Awash River basin has experienced significant variations in forest cover and carbon stock.
It is essential to consider forest regeneration practices to mitigate the resulting climate change crisis.
1. Introduction
The Earth is a dynamic planet, constantly changing, driven by internal and external forces (Pandey & Mishra, 2015). Among many alterations, forest cover change, which results in carbon stock dynamics, is among the prominent ones subjected to continuous alteration. Forests account for approximately 30 percent of the Earth's terrestrial surface. Forests serve as vital sources of income for millions of people and play a significant role in the economic growth of numerous countries (Othow et al., 2017). Although they are vital for livelihoods and climate regulation, forest resources worldwide face significant pressure and transformation (Solomon et al., 2018). Over the last 50 years, there has been substantial alteration in global forest cover, which has had a considerable direct or indirect effect on changes in the global environment (S. A. Khan et al., 2022). The global forest area decreased by 5% between 1990 and 2020, falling from 4,022 million hectares to 3,812 million hectares (a reduction of 210 million hectares) (Pan et al., 2024). The occurrence of changes in forest cover is especially noticeable in Africa, where considerable deforestation has taken place in recent decades (Solomon & Moon, 2018). Between 2010 and 2020, Africa indeed had the highest annual rate of net forest loss among all continents, totaling 3.9 million hectares lost each year (Wlodarczyk et al., 2022). Forest losses can result from both human activities and natural events. However, human activities are more prevalent than natural events (Tola, 2023). Forest cover dynamics causes threat and losses to different aspects the environment and activities of human being: Climate change (Lawrence et al., 2022), biodiversity (Xiao et al., 2022), water yield (Q. Li et al., 2017), floods (Tran et al., 2010), land degradation (Ahammad et al., 2019) and others. Forest cover dynamics is one of the main drivers alteration of global climate change (Prevedello et al., 2019).
Climate change is a significant and urgent global issue at present (Morris et al., 2019). Climate change is no longer a distant threat but a stark reality, wreaking havoc on societies and ecosystems across the globe. The effects of climate change are evident in rising global temperatures, melting ice caps, and changing weather patterns, which all contribute to the dynamic nature of Earth. Its impacts are far-reaching, deeply intertwined, and causing widespread socioeconomic and environmental damage that spans continents. The ocean level increased by 0.19 meters from 1901 to 2010, with an accelerating average rate of 3.2 millimeters per year from 1993 to 2010, compared to an average rate of 1.7 millimeters per year from 1901 to 2010 (David, 2015). Sub-Saharan Africa is especially vulnerable to climate change because of its current environmental circumstances, limited economic diversity, struggling rural economies, and underdeveloped agriculture, which plays a crucial role in the overall economy (Yalew et al., 2018). Climate change-related disasters such as floods and droughts account for 80% of fatalities and 70% of economic losses in Sub-Saharan Africa (Case & Baylie, 2022). Particularly, the East African area has faced ongoing climate change-induced water insecurity in recent decades, resulting in substantial alterations in water levels necessary for sustainable livelihoods. The ongoing conflicts, widespread poverty, and food insecurity in the region exacerbate vulnerability and hinder the capacity to manage droughts and other natural disasters (GDO 2022). Ethiopia serves as a prime example in this context. The country is prone to regular climate extremes that have had considerable negative impacts on its economy and society, and these effects are anticipated to intensify in the future due to climate change (You & Ringler, 2013). If the present levels of greenhouse gas (GHG) emissions persist, it is forecasted that there will be significant transformations, such as flooding, more severe heat waves, and storms, along with a rise in diseases (Braun et al., 2007). The possible effects and strategies to address climate change must be examined in relation to sustainable development (Munasinghe & Swart, 2005).
Alterations in forest cover directly influence the carbon reserves which are prime responsible for global warming and climate change (Kassaye et al., 2024). Forests have a substantial capacity for carbon storage, making them a vital approach for achieving carbon equilibrium and alleviating the effects of climate change (Tadese et al., 2023). Carbon storage or stock refers to the quantity of carbon that has been absorbed from the atmosphere and retained within a forest ecosystem (Mukul et al., 2021). Forests are regarded as a significant contributor to global human-caused carbon emissions released into the atmosphere, ranking second only to the combustion of fossil fuels, mainly due to deforestation and the degradation of forested areas (Kumar et al., 2014). Changes in forest cover, which include losses, increases, and shifts in forest types, greatly influence carbon sequestration and capture, thereby directly influencing climate change on both local and global scales. Therefore, it is vital to thoroughly assess and map forest cover and carbon stocks in a specific region to understand its role in mitigating climate change (Bantider, 2021). Remote sensing is crucial for evaluating and mapping the dynamics of forest cover and carbon stocks by delivering extensive, spatially detailed, and consistently timed data (Legesse et al., 2024). It facilitates effective mapping and monitoring of forest cover, estimation of aboveground biomass, and mapping of carbon stock distribution. This data is essential for comprehending deforestation and degradation, tracking regeneration and restoration initiatives, and enhancing forest management strategies for carbon sequestration and sustainable utilization of forest resources. Google Earth Engine (GEE) is currently a vital tool for analyzing forest cover changes. This powerful platform plays a crucial role in assessing and monitoring shifts in forest cover by utilizing extensive satellite imagery and geospatial data and providing user friendly and advanced analysis technique.
The objective of the present study is to assess the temporal variation of forest cover and carbon stock over the Middle Awash River Basin in Ethiopia, a region undergoing significant forest cover changes. Spanning 28 years from 1995 to 2023, the research leverages remote sensing imagery and the GEE cloud API to analyze LULC patterns and extract precise forest cover data. This detailed analysis reveals the extent of forest cover changes (loss/gain) over time. In the present study, the carbon stock at a given point in time is computed using the total forest cover (TFC) which can be obtained from classified forest cover images. The research focuses on aboveground carbon stock, which represents a significant component of the overall carbon pool, as noted by the Intergovernmental Panel on Climate Change (IPCC) (Pechanec et al., 2022). The research benefits land use planning, forest management, and climate change mitigation by understanding the relationship between forest cover changes, carbon storage, and their temporal fluctuations.
2. Methods and Materials
2.1. Study Area
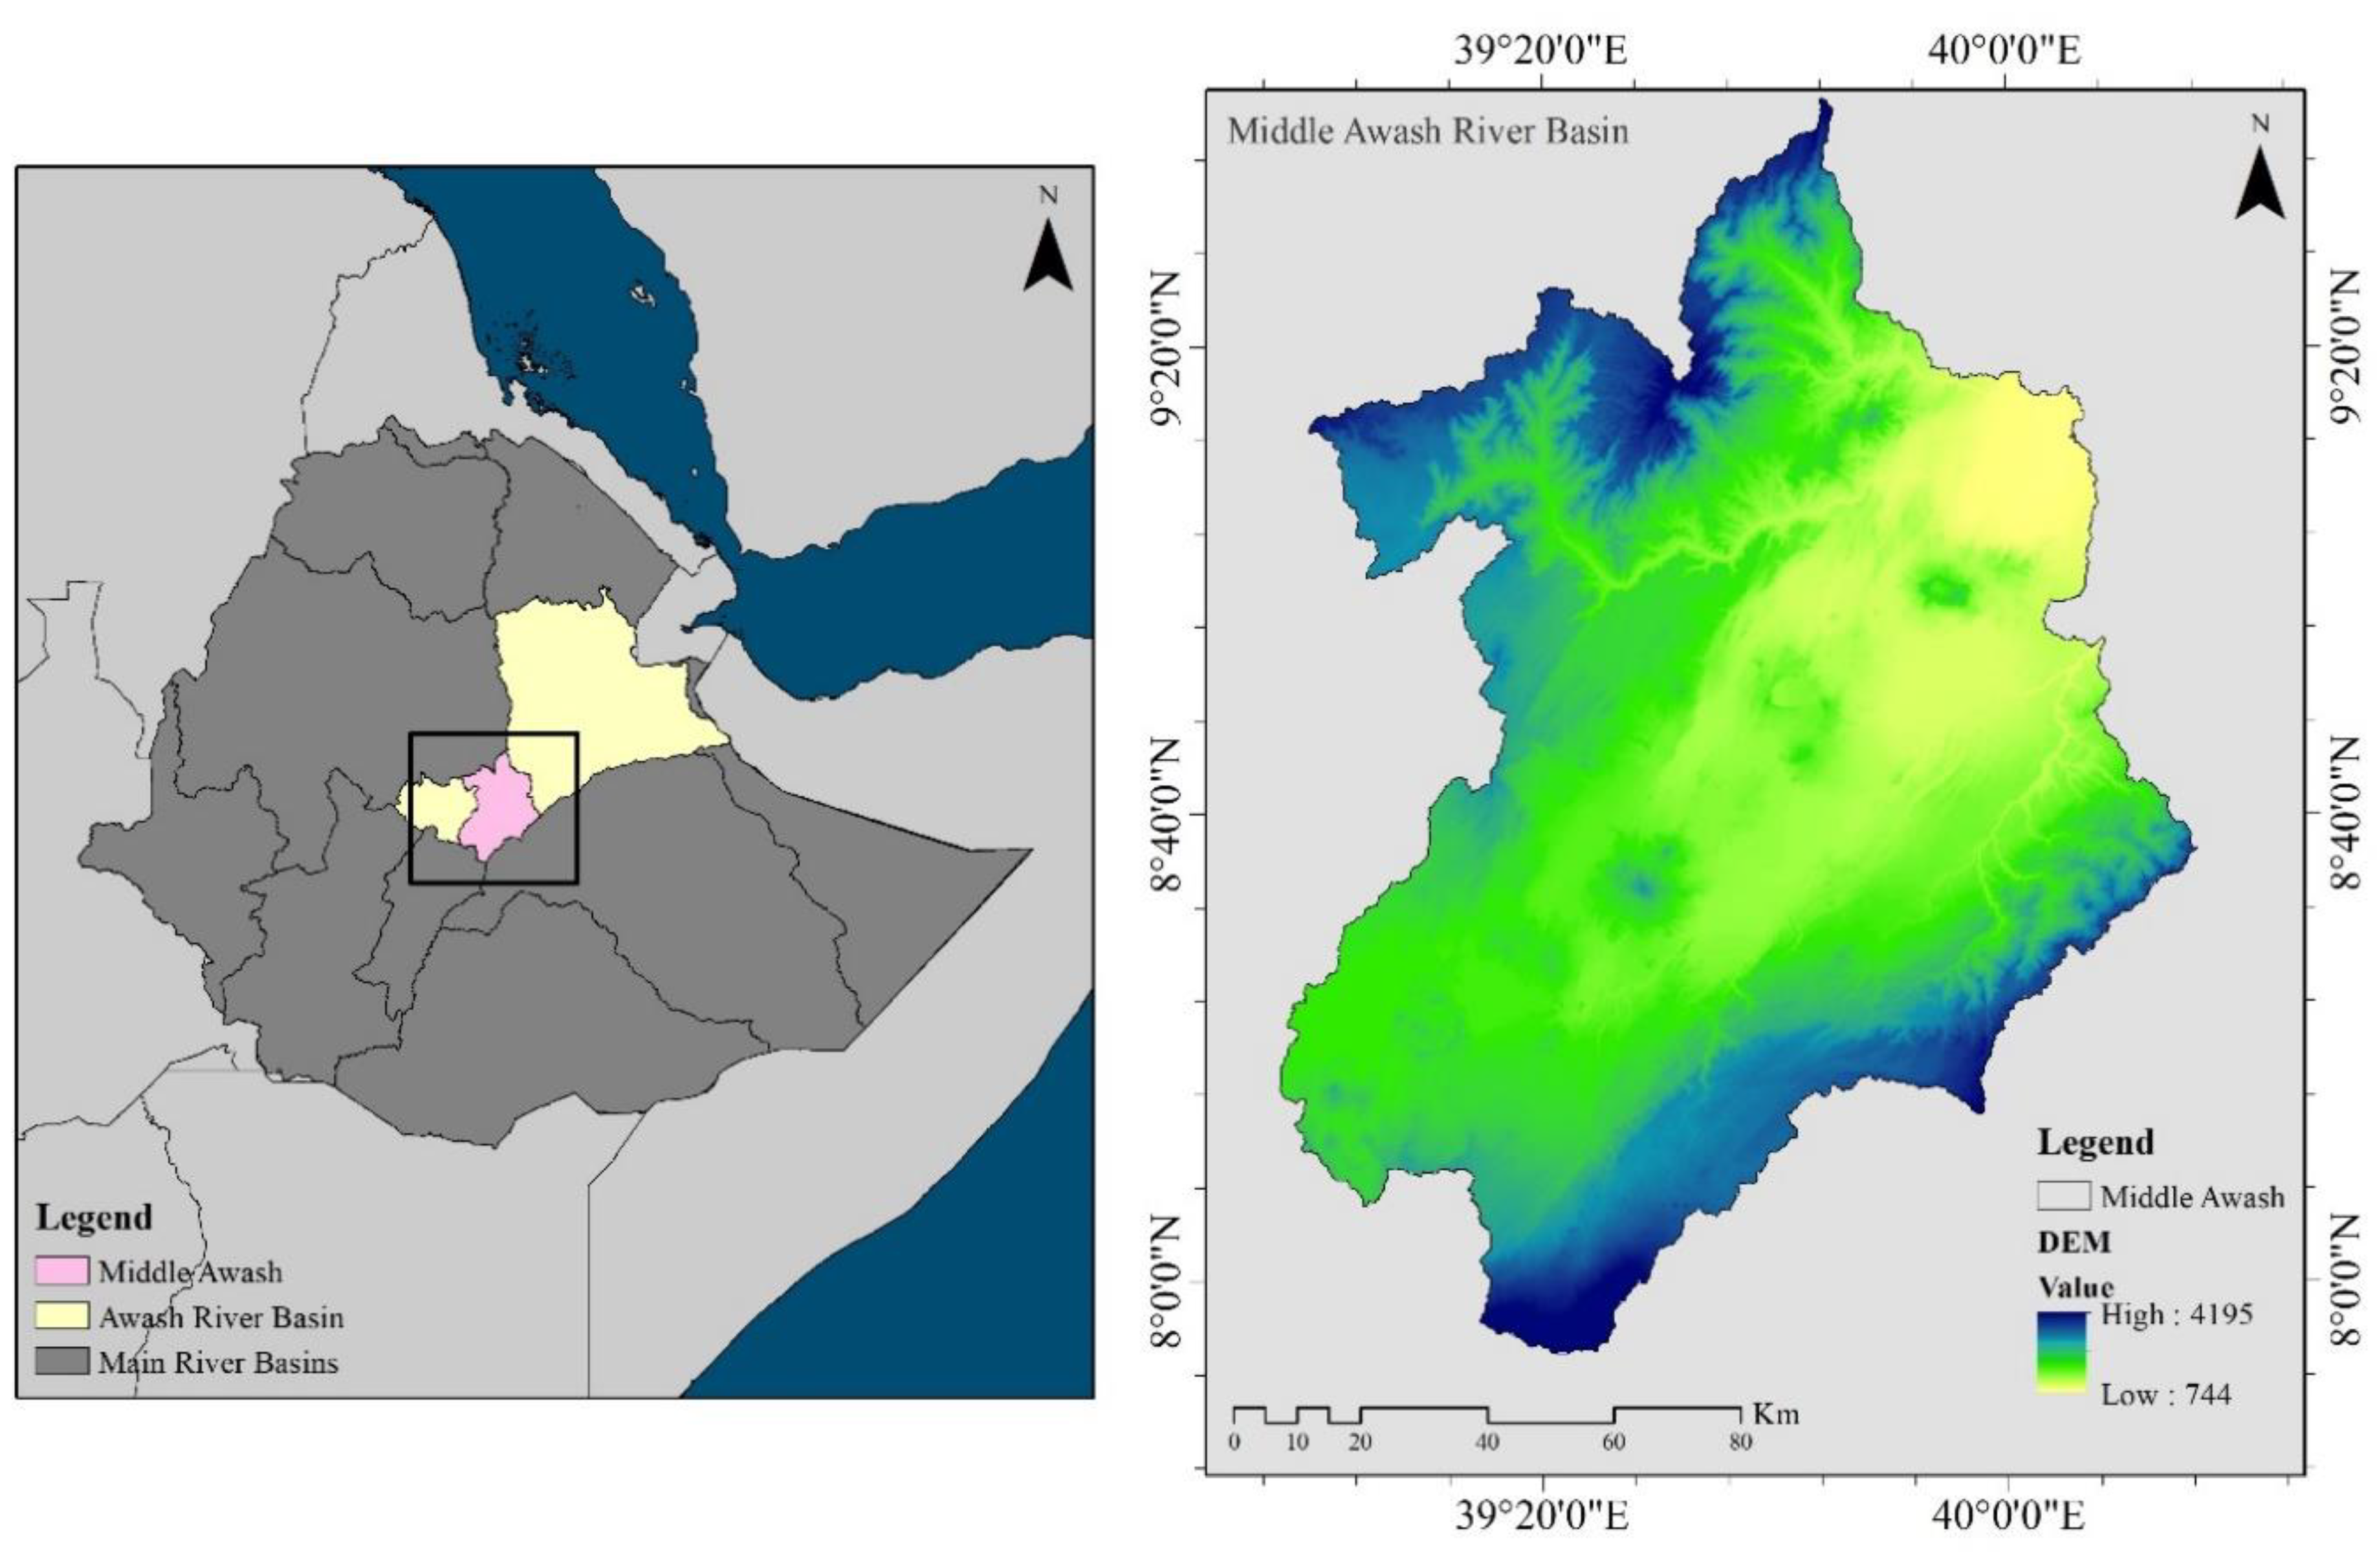
The Middle Awash River basin was the focus of this study. The Middle Awash River basins are located in the central Ethiopian rift, spanning latitudes 7°40'N to 9°50'N and longitudes 38°50'E to 40°40'E, covering a total area of 30,464 km², as illustrated in
Figure 1. The total area of the basin is around 15480 km
2.
The basin has different physiographic features. The elevation within the basin ranges from 744 m to 4,195 m. This variation in elevation contributes to both temporal and spatial differences in rainfall. The edges of the basin receive higher rainfall, while the downstream areas experience lower precipitation. Mean annual rainfall fluctuates between 300 mm and 1,400 mm. The temperature in the study area exhibits slight spatial variation, ranging from 23°C to 34°C, with peak temperatures typically occurring in April and May. The Middle Awash River basin is predominantly comprised of agricultural lands and is significantly influenced by agricultural activities, which are vital to the local economy. The region is characterized by several major soil types, including Eutric fluvisol, Eutric nitosols, Lithosol, Eutric cambisol, Haplic xerosols, Calcic xerosol, Chromic cambisol, and Chromic vertisol. The rainfall pattern in the catchment is bi-modal, featuring two distinct peaks occurring in April and August.
2.2. Data Used
The most effective way to provide information about the various geographic variations present on the Earth's surface is through satellite imagery (Regassa et al., 2020). The primary data source for this research consists of multi-temporal Landsat imagery acquired from the USGS, covering the years 1995, 2010, and 2023 (see
Table 1). Landsat images are currently extensively used and provide multi-spectral data, extensive temporal coverage, and accessibility, which collectively enhance the accuracy and reliability of LULC analyses.
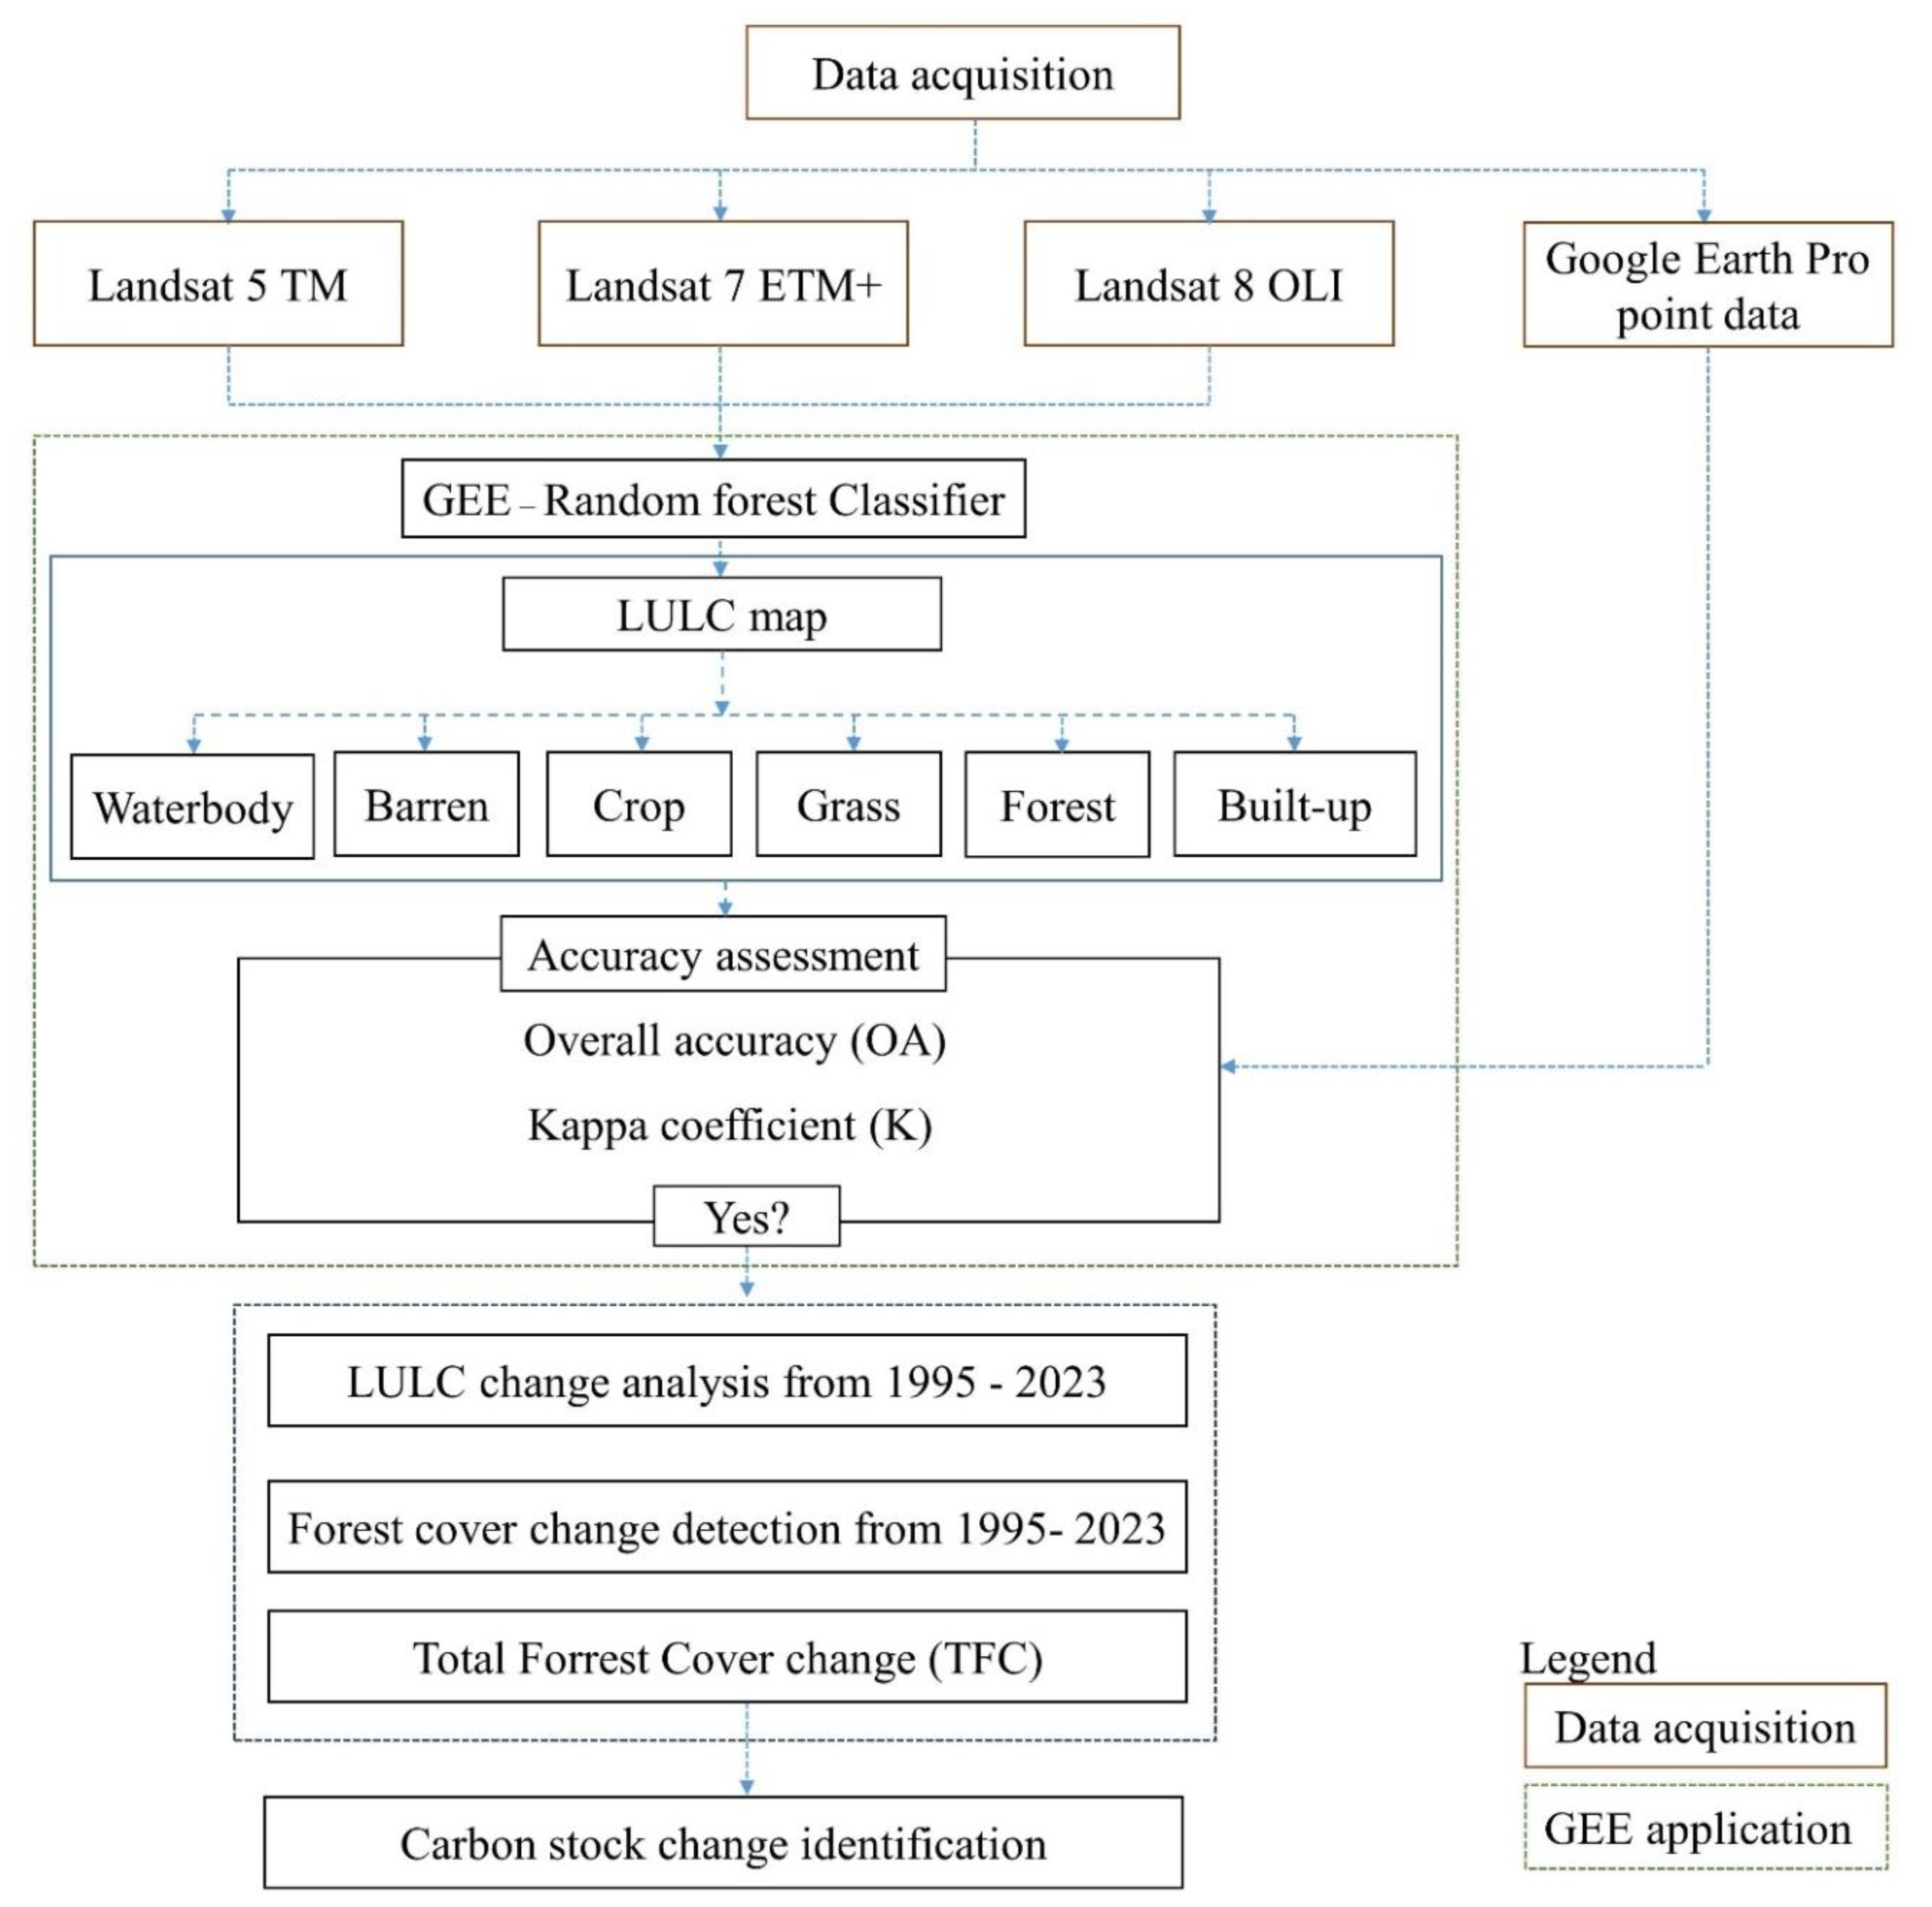
This research employed GEE to examine and quantify alterations in forest cover within the Middle Awash River Basin over a span of 28 years, from 1995 to 2023. The subsequent framework (
Figure 2) offers a concise depiction of the methodology used in this study and serves as a helpful reference for understanding the entire research.
2.3. LULC Derivation
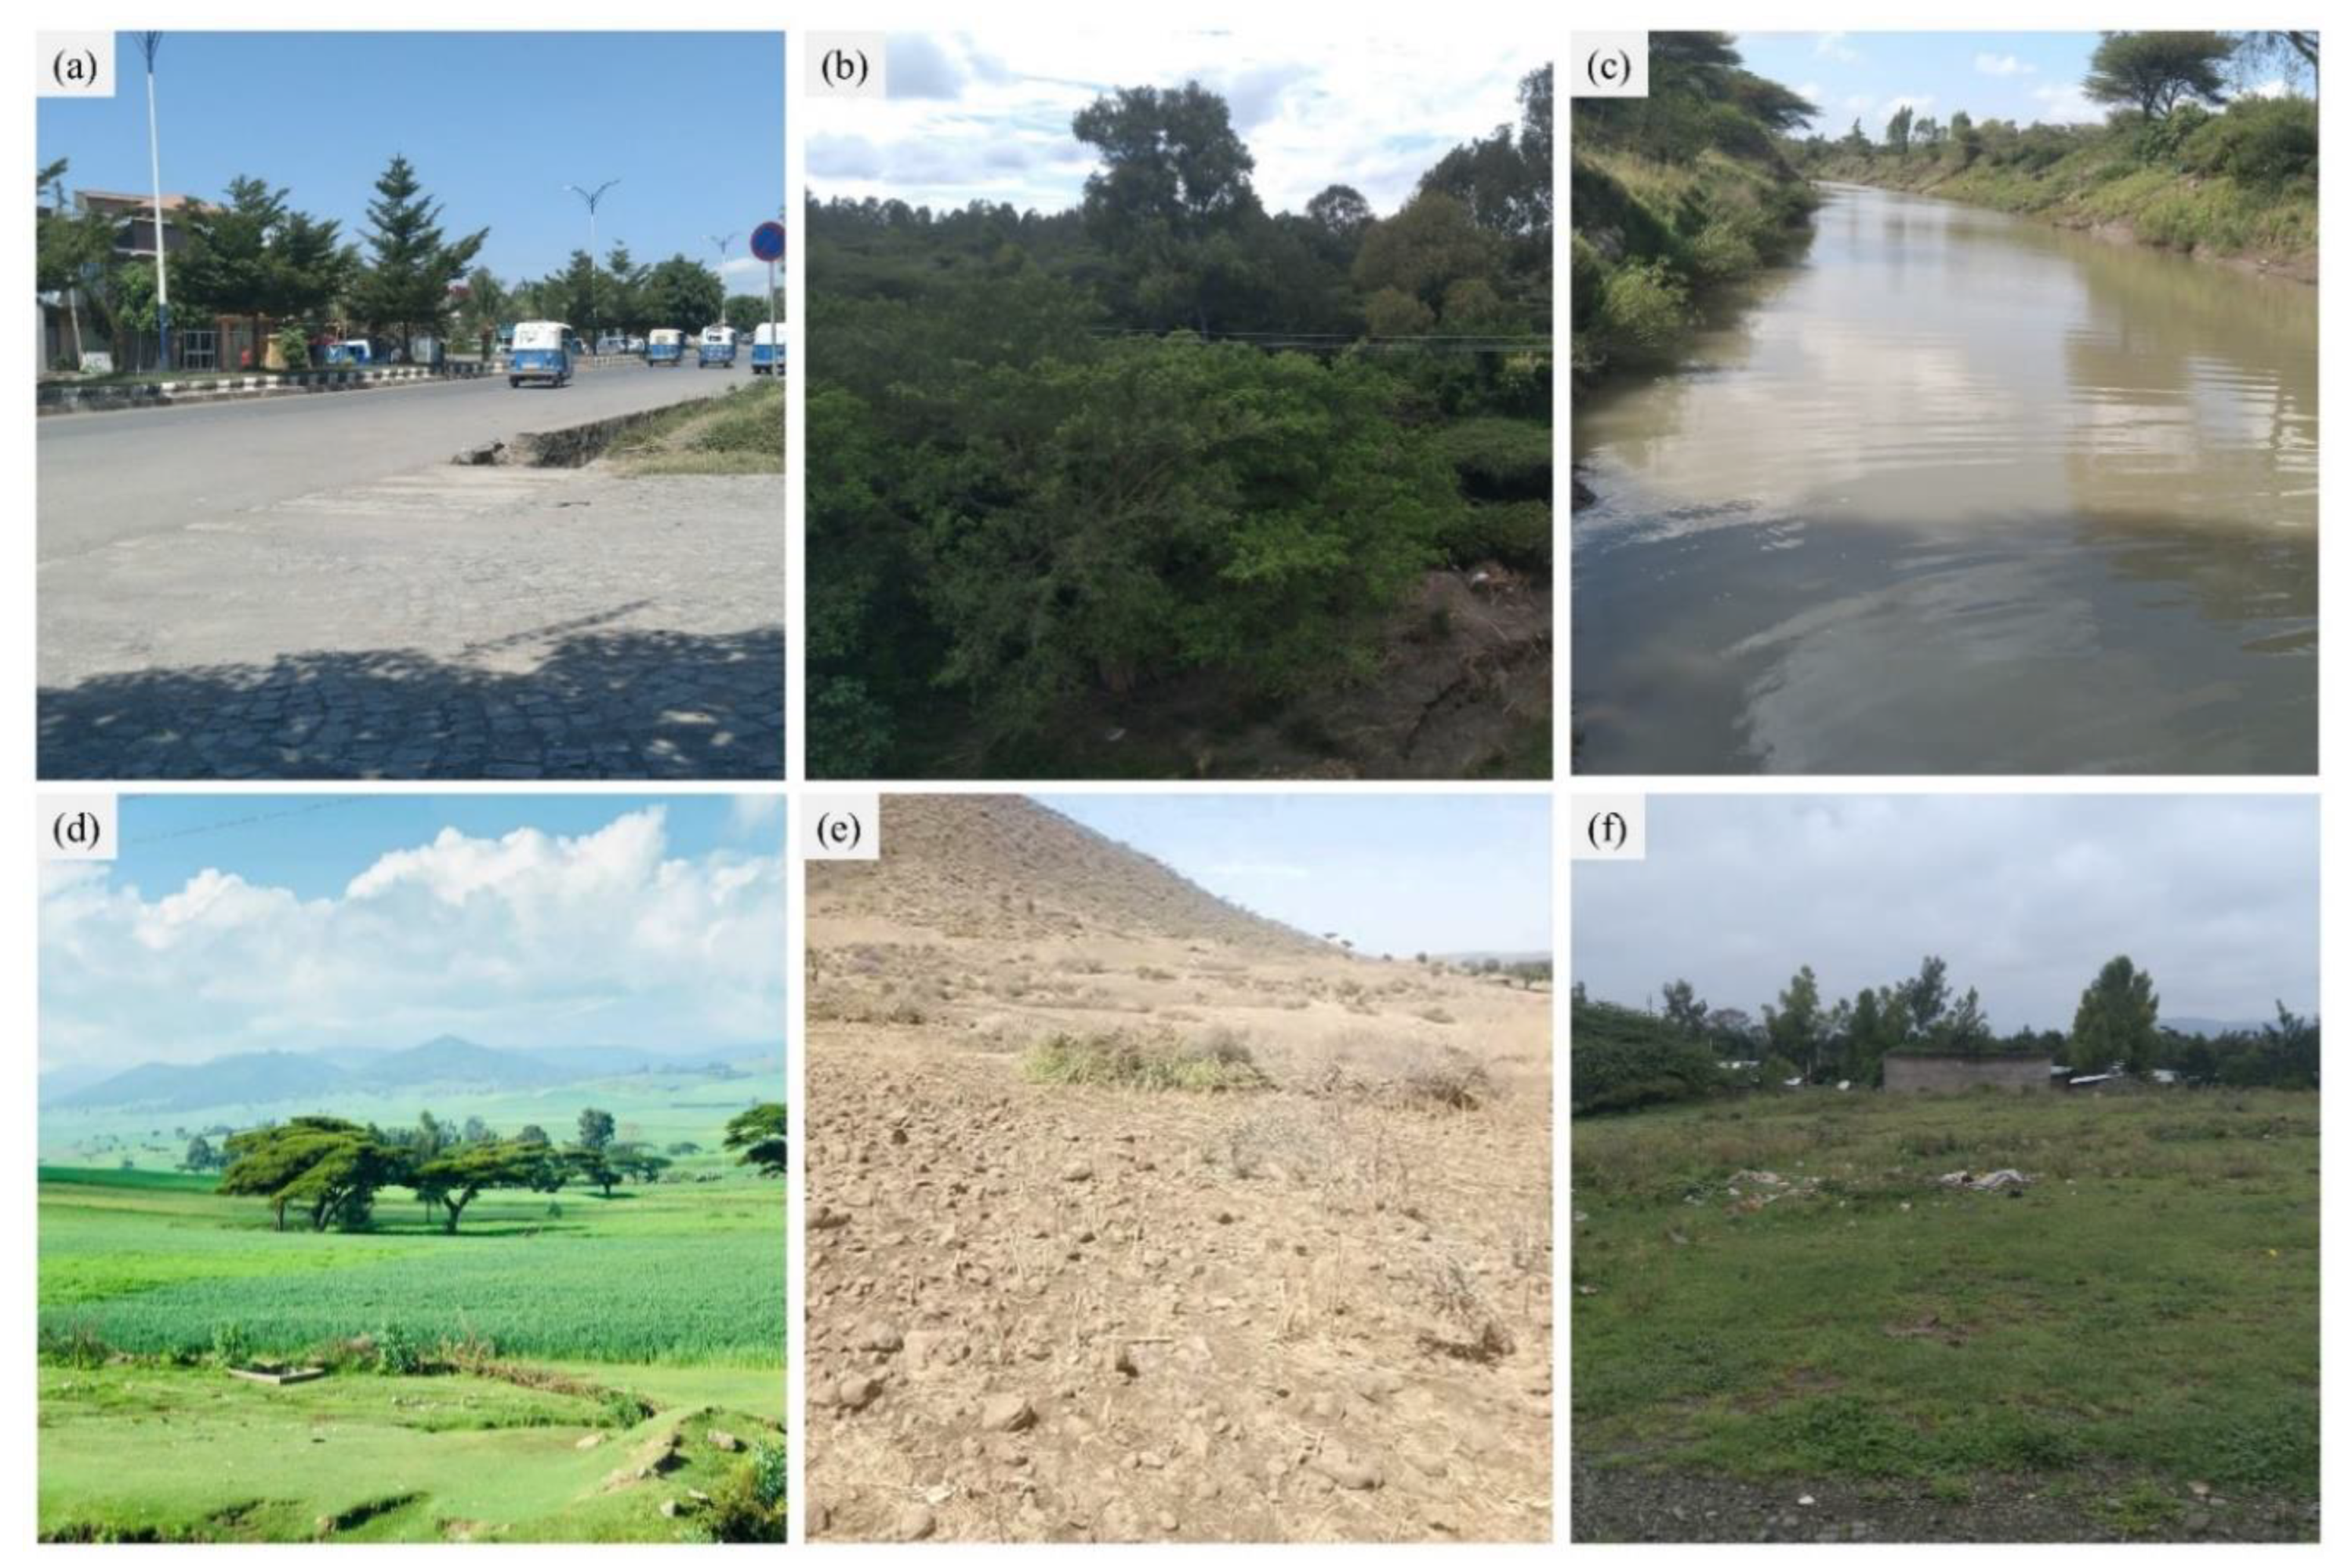
Accurate estimation and evaluation of the extent and temporal changes in forest cover are crucial for the development of effective and sustainable strategies to mitigate climate change. Forest ecosystems are essential carbon sinks, capable of absorbing and storing significant amounts of carbon dioxide from the atmosphere. It is vital to understand how forest cover evolves over time, whether through deforestation, degradation, or regeneration, to grasp the dynamic relationship between forest ecosystems and the global carbon cycle. This understanding is key to formulating informed conservation and management strategies that safeguard existing forests and encourage the restoration of degraded areas. In the present study GEE was utilized to generate the LULC map for the basin for the years 1995, 2010, and 2023. This cloud-based computing platform can help address large-scale land cover mapping challenges (Phan et al., 2020). The rise of these proprietary web-based platforms is significantly decreasing computation times and increasing the capacity for analyzing large geospatial data (Loukika et al., 2021). Users can view all available remotely sensed images without needing to download them to their local devices. In this study, the Landsat images were categorized using a random forest classifier algorithm, which has been noted for its significant accuracy in various studies (Tikuye et al., 2023). The images were classified using the "classifier.smileRandomForest" method available in GEE. All analyses in the study were performed during the same season to eliminate discrepancies arising from seasonal differences. The study selects the dry season for analysis, as the driest month is typically the most effective for distinguishing between different land uses. The resulting maps were utilized to determine the areas of LULC classes, and the rates of LULC analysis and change were computed. The land cover categories in this study are divided into six sub-classes, which are outlined in
Table 2, and examples of these land covers are presented in
Figure 3.
2.4. Accuracy Assessment
The precision of the classified maps was verified through an accuracy assessment. The confusion matrix method is currently the most commonly used technique for evaluating the classification effectiveness of remote-sensing images (Congalton & Green, 2008). By utilizing an irregular stratified sampling method, confusion matrices were generated by comparing the classification outcomes of these reference sites at various times with the results from corresponding field studies and high-resolution remote sensing data. This process requires precise and comprehensive ground-truth data for supervised classification and validation of classification products. Each year, multiple samples were employed to associate reference locations with categorized image cells. The accuracy of land use classification in this study was evaluated using the Kappa coefficient (K) alongside overall accuracy (OA). A post-classification comparison was conducted in ArcGIS 10.8 utilizing overlay change detection for the chosen years. The agreement between the labeled and anticipated results can be illustrated using nonparametric tests such as OA and the K (Yesuph & Dagnew, 2019), and are calculated using Equation (1) and Equation (2), respectively (Sun et al., 2020).
In the confusion matrix, n represents the number of columns, Kii indicates the number of pixels located at the intersection of the ith row and column, while Ki+ and K+j denote the total pixel counts in the ith row and column, respectively. T signifies the overall number of pixels utilized for accuracy assessment.
2.5. LULC Change Detection
Once sufficient accuracy has been achieved, the LULC change analysis will proceed with a particular focus on forest cover, specifically examining both the quantity of altered areas and the extent of change. The analysis of the LULC distribution and change was computed based on Equation (3) and Equation (4) (Dibaba, 2023):
Where A
i area of specific land cover, A
T is total area, Af is the final produced LULC area (i.e., LULC in 2023) in km
2, and Ap is the previous area of LULC (i.e., LULC in earlier 2023) in km
2.
2.6. Carbon Stock Quantification
The forest ecosystem plays a crucial role in the global carbon sink and cycle by storing a significant amount of terrestrial organic carbon through the exchange of carbon dioxide with the atmosphere (Nam et al., 2015). A land-use system that includes tree species with high wood density will exhibit greater biomass carbon compared to one that features tree species with low wood density (Rahayu et al., 2005). Carbon stocks in all forest types must be measured to fulfill the reporting requirements of the Kyoto Protocol (I. A. Khan et al., 2021). In the present study, the carbon stock at a given point in time is calculated using the total forest cover adopted from von Mirbach's method (Mirbach, 2000), and used in Ethiopia and worldwide studies (Goheer et al., 2022, 2023; C. Li et al., 2008; Moisa et al., 2023). This procedure consists of several specific steps aimed at ensuring a thorough and precise assessment of carbon storage within the forested region. Initially, the total volume of wood was calculated based on previously gathered data on total forest cover Equation (5) (Ali, 2017). Equation (6) was utilized to transform the total wood volume into total dry matter biomass (DMB).
To determine carbon stock, the wood volume was multiplied by the basic wood density (BWD), 0.5, and the biomass expansion factor (BEF), 1.3. A conversion factor (CF) of 0.47 was applied to convert above-ground biomass (AGB) into above-ground carbon (AGC) Equation (7) (Habib & Al-Ghamdi, 2021).
Finally, to calculate total carbon dioxide (CO
2), carbon stock is multiplied by a constant of 3.6667 Equation (8) (J. Li et al., 2023).
3. Results and Discussions
3.1. Training Data for Landsat Image Classification
In the realm of remote sensing image classification, training data is vital for generating precise maps. The effectiveness of the classification process is directly impacted by both the quality and quantity of this data. There is no specific guideline regarding the number of training data samples that should be used for image classification, as it largely depends on the size of the area being analyzed. However, it is generally advisable to provide high-quality data in sufficient quantities to ensure optimal classification results. The current research provides accurate data with a significant number of points using the Google Earth Engine (GEE) platform. The number of training data across each land cover class for each year is illustrated in the following table (
Table 3).
3.2. Accuracy Assessment
Evaluating the accuracy of remote sensing image classifications is essential for assessing their effectiveness. Two key metrics, OA and K, were employed to evaluate this accuracy. These metrics quantify how closely the classified image aligns with the actual land cover. Additionally, the time-lapse feature of Google Earth Pro provided historical remote sensing data utilized in this research. The results of the accuracy assessment are described in
Table 4, and achieving a significant accuracy indicates that the findings were sufficient to proceed with further analysis.
3.3. LULC Dynamics Assessment
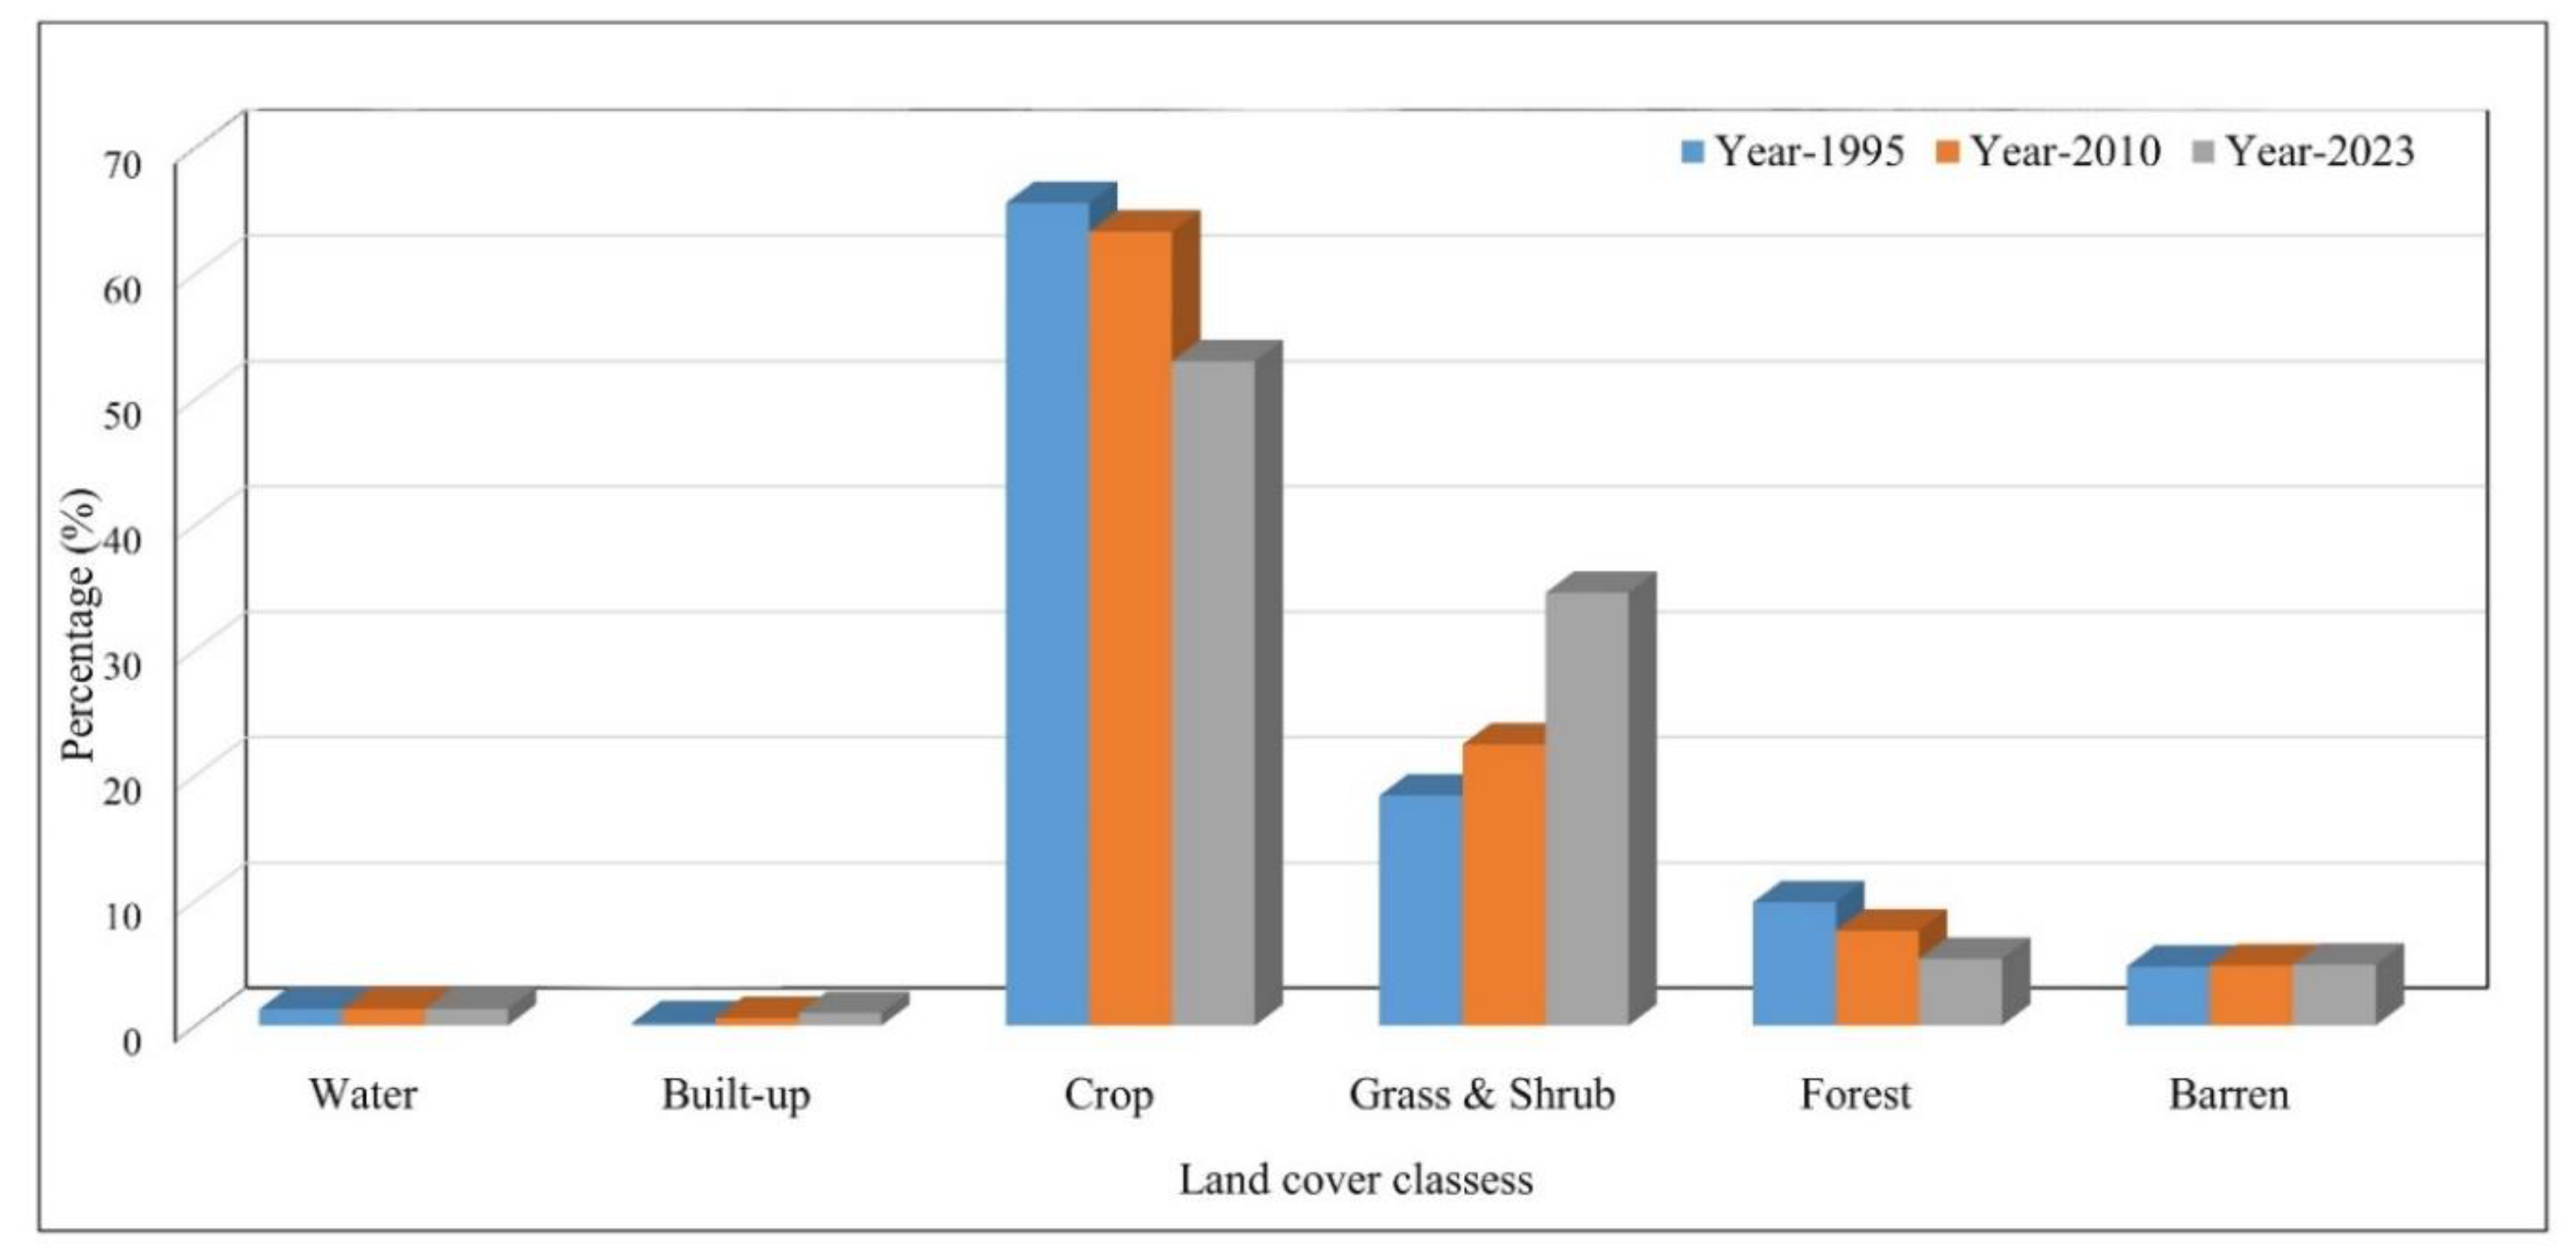
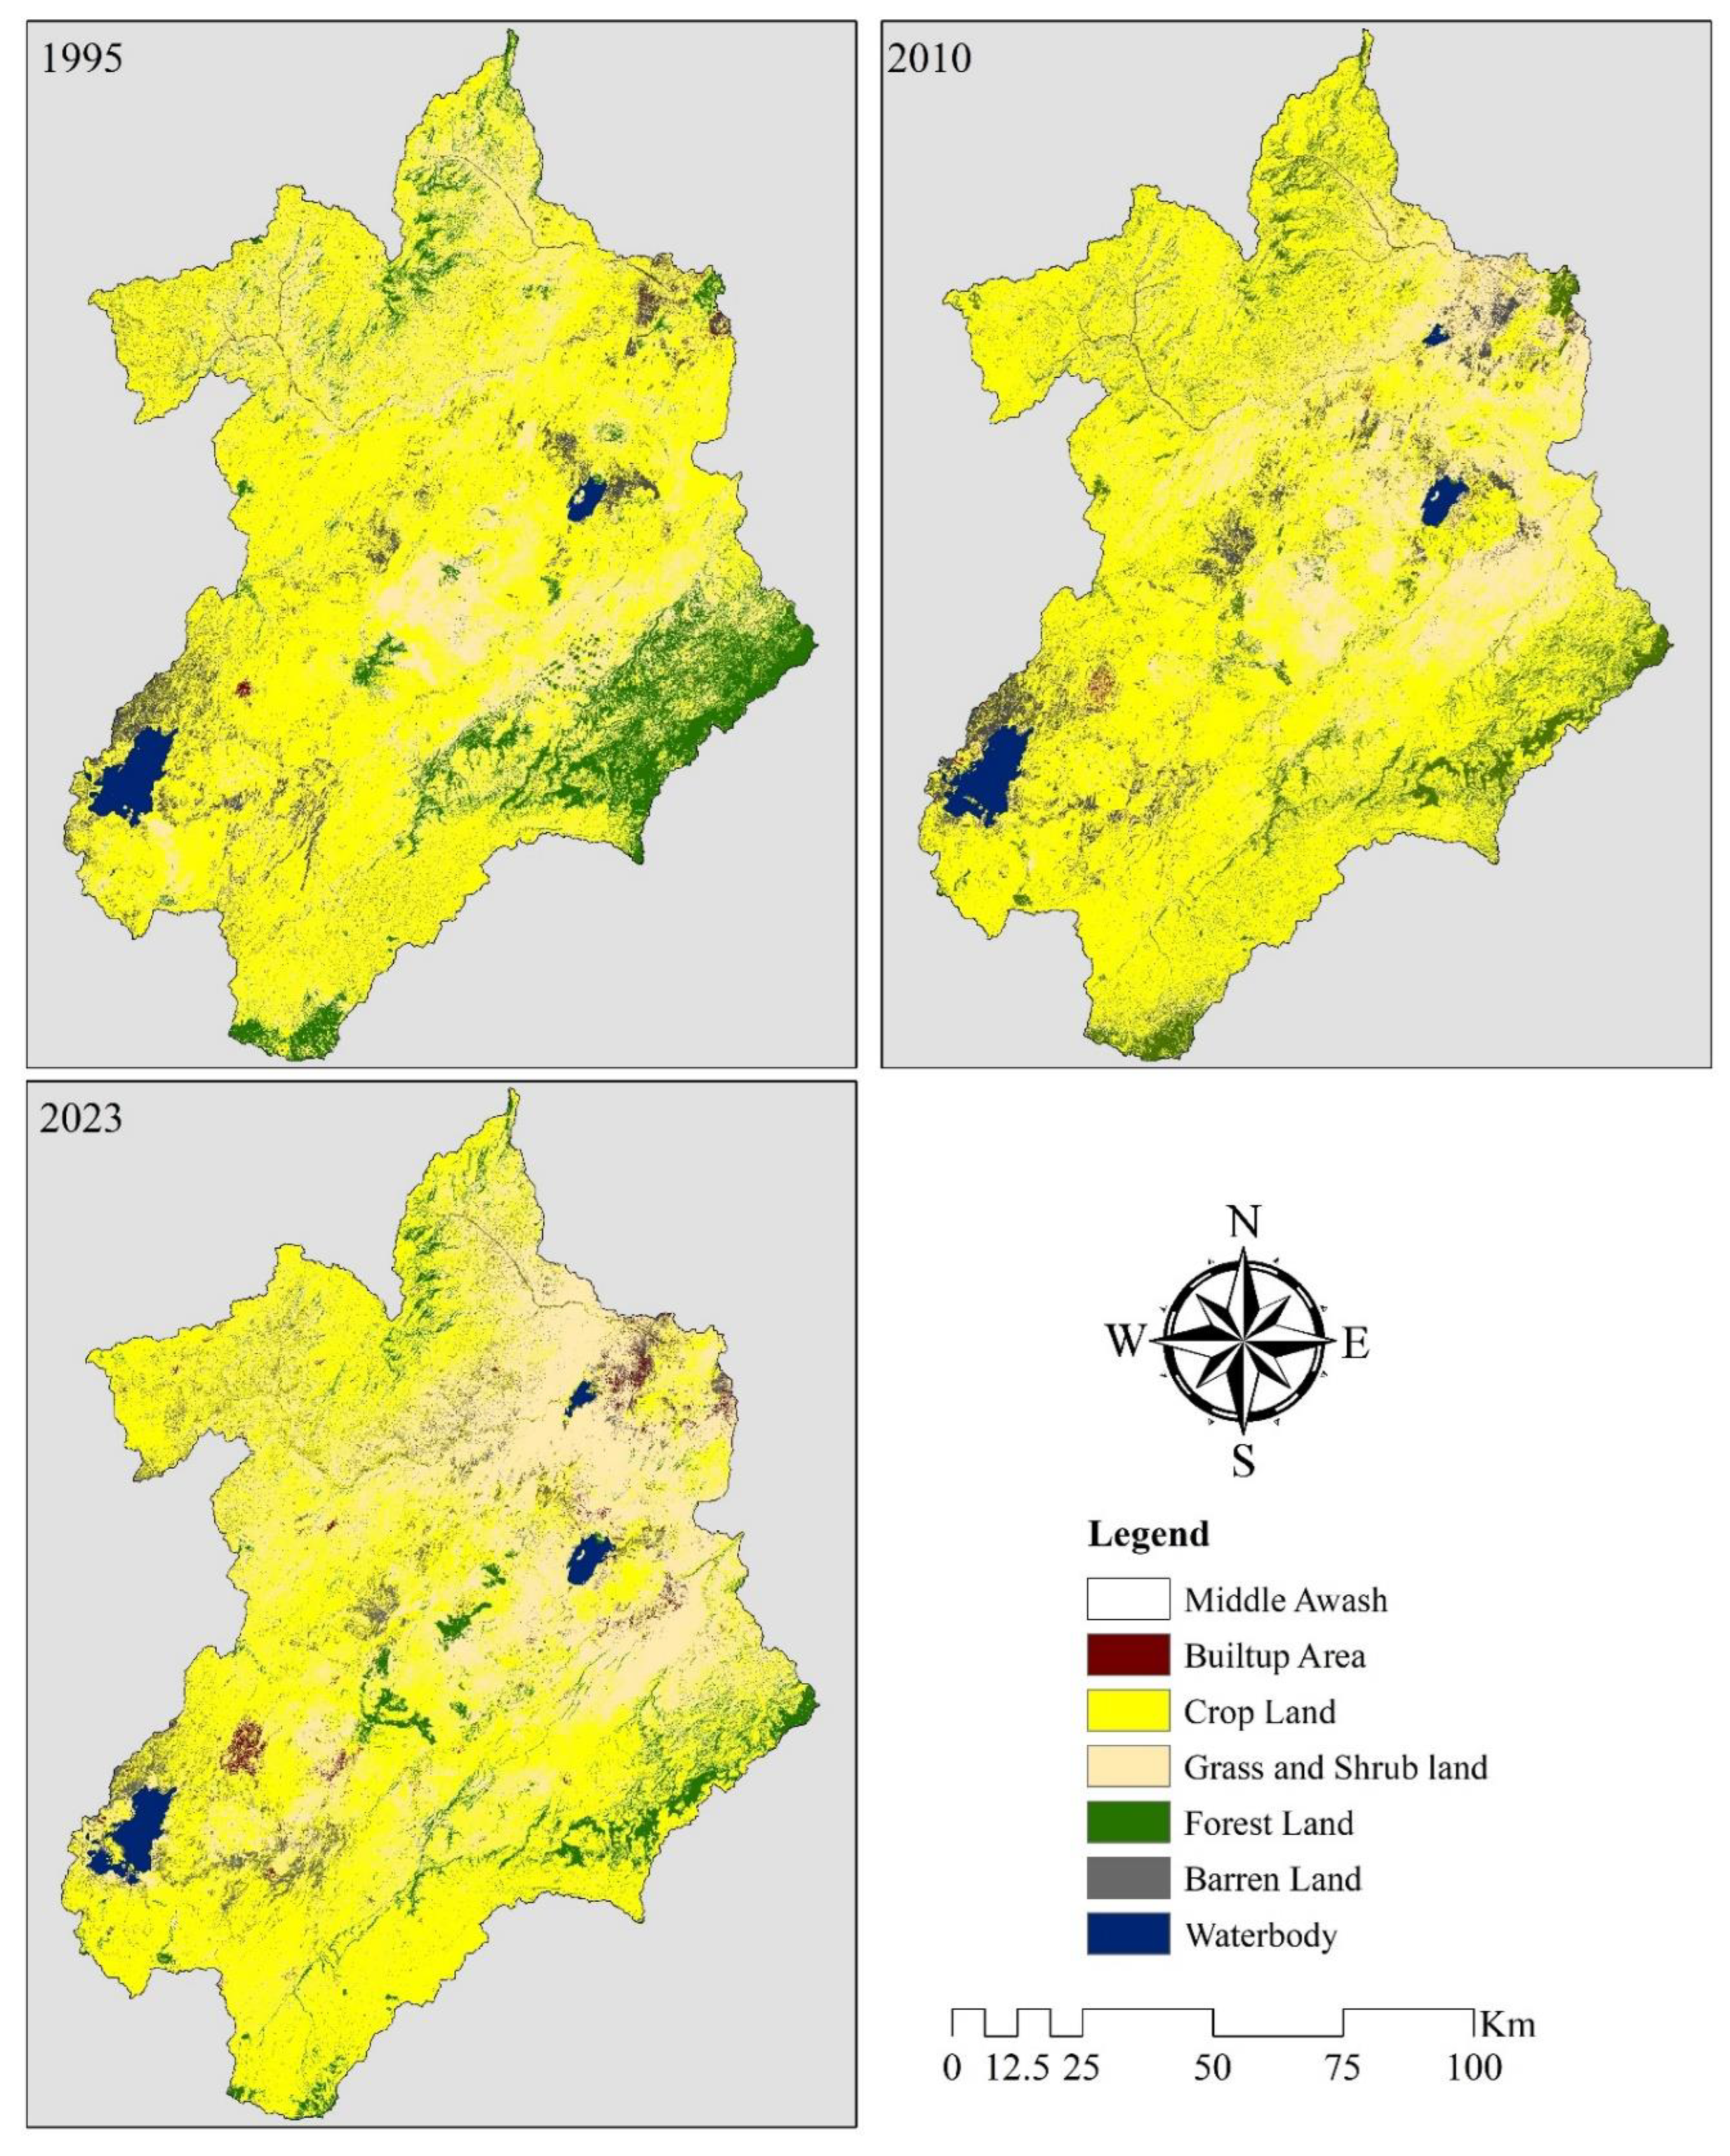
The analysis of LULC changes in the Middle Awash River Basin from 1995 to 2023 reveals significant dynamics across various land cover types as shown in
Figure 4 and Figure 5. In 1995, built-up areas were minimal, occupying only 39.50 km² (0.26%) of the total land area. By 2010, the built-up area had increased to 96.76 km² (0.63%), and by 2023, it further expanded to 153.67 km² (0.99%). This gradual increase in built-up land indicates a trend toward urbanization, likely driven by population growth and economic development in the region. The rise in built-up areas reflects the growing demand for housing, infrastructure, and services, which is characteristic of many developing regions experiencing rapid urban expansion. In contrast, the area dedicated to cropland, which was predominant in 1995 at 10,155.70 km² (65.60%), has experienced a notable decline over the years. By 2010, cropland decreased to 9,796.42 km² (63.28%), and by 2023, it further reduced to 8,202.61 km² (52.99%). This reduction suggests a shift in land use priorities, possibly influenced by urban encroachment and changing agricultural practices. Grass and shrub areas have shown a significant increase, rising from 2,839.30 km² (18.34%) in 1995 to 3,467.20 km² (22.40%) in 2010, and further to 5,341.56 km² (34.51%) by 2023. This increase may indicate a recovery or expansion of these ecosystems, potentially due to reduced agricultural pressure or successful land management strategies aimed at promoting natural vegetation. The rise in grass and shrub areas could also be a response to changing climatic conditions or land abandonment, where previously cultivated lands are left to revert to natural states.
The data also reveals relatively stable trends for barren land and water bodies. Barren land has remained mostly unchanged, with a slight fluctuation from 725.71 km² (4.69%) in 1995 to 741.84 km² (4.79%) in 2010, and reaching 751.14 km² (4.85%) by 2023 (
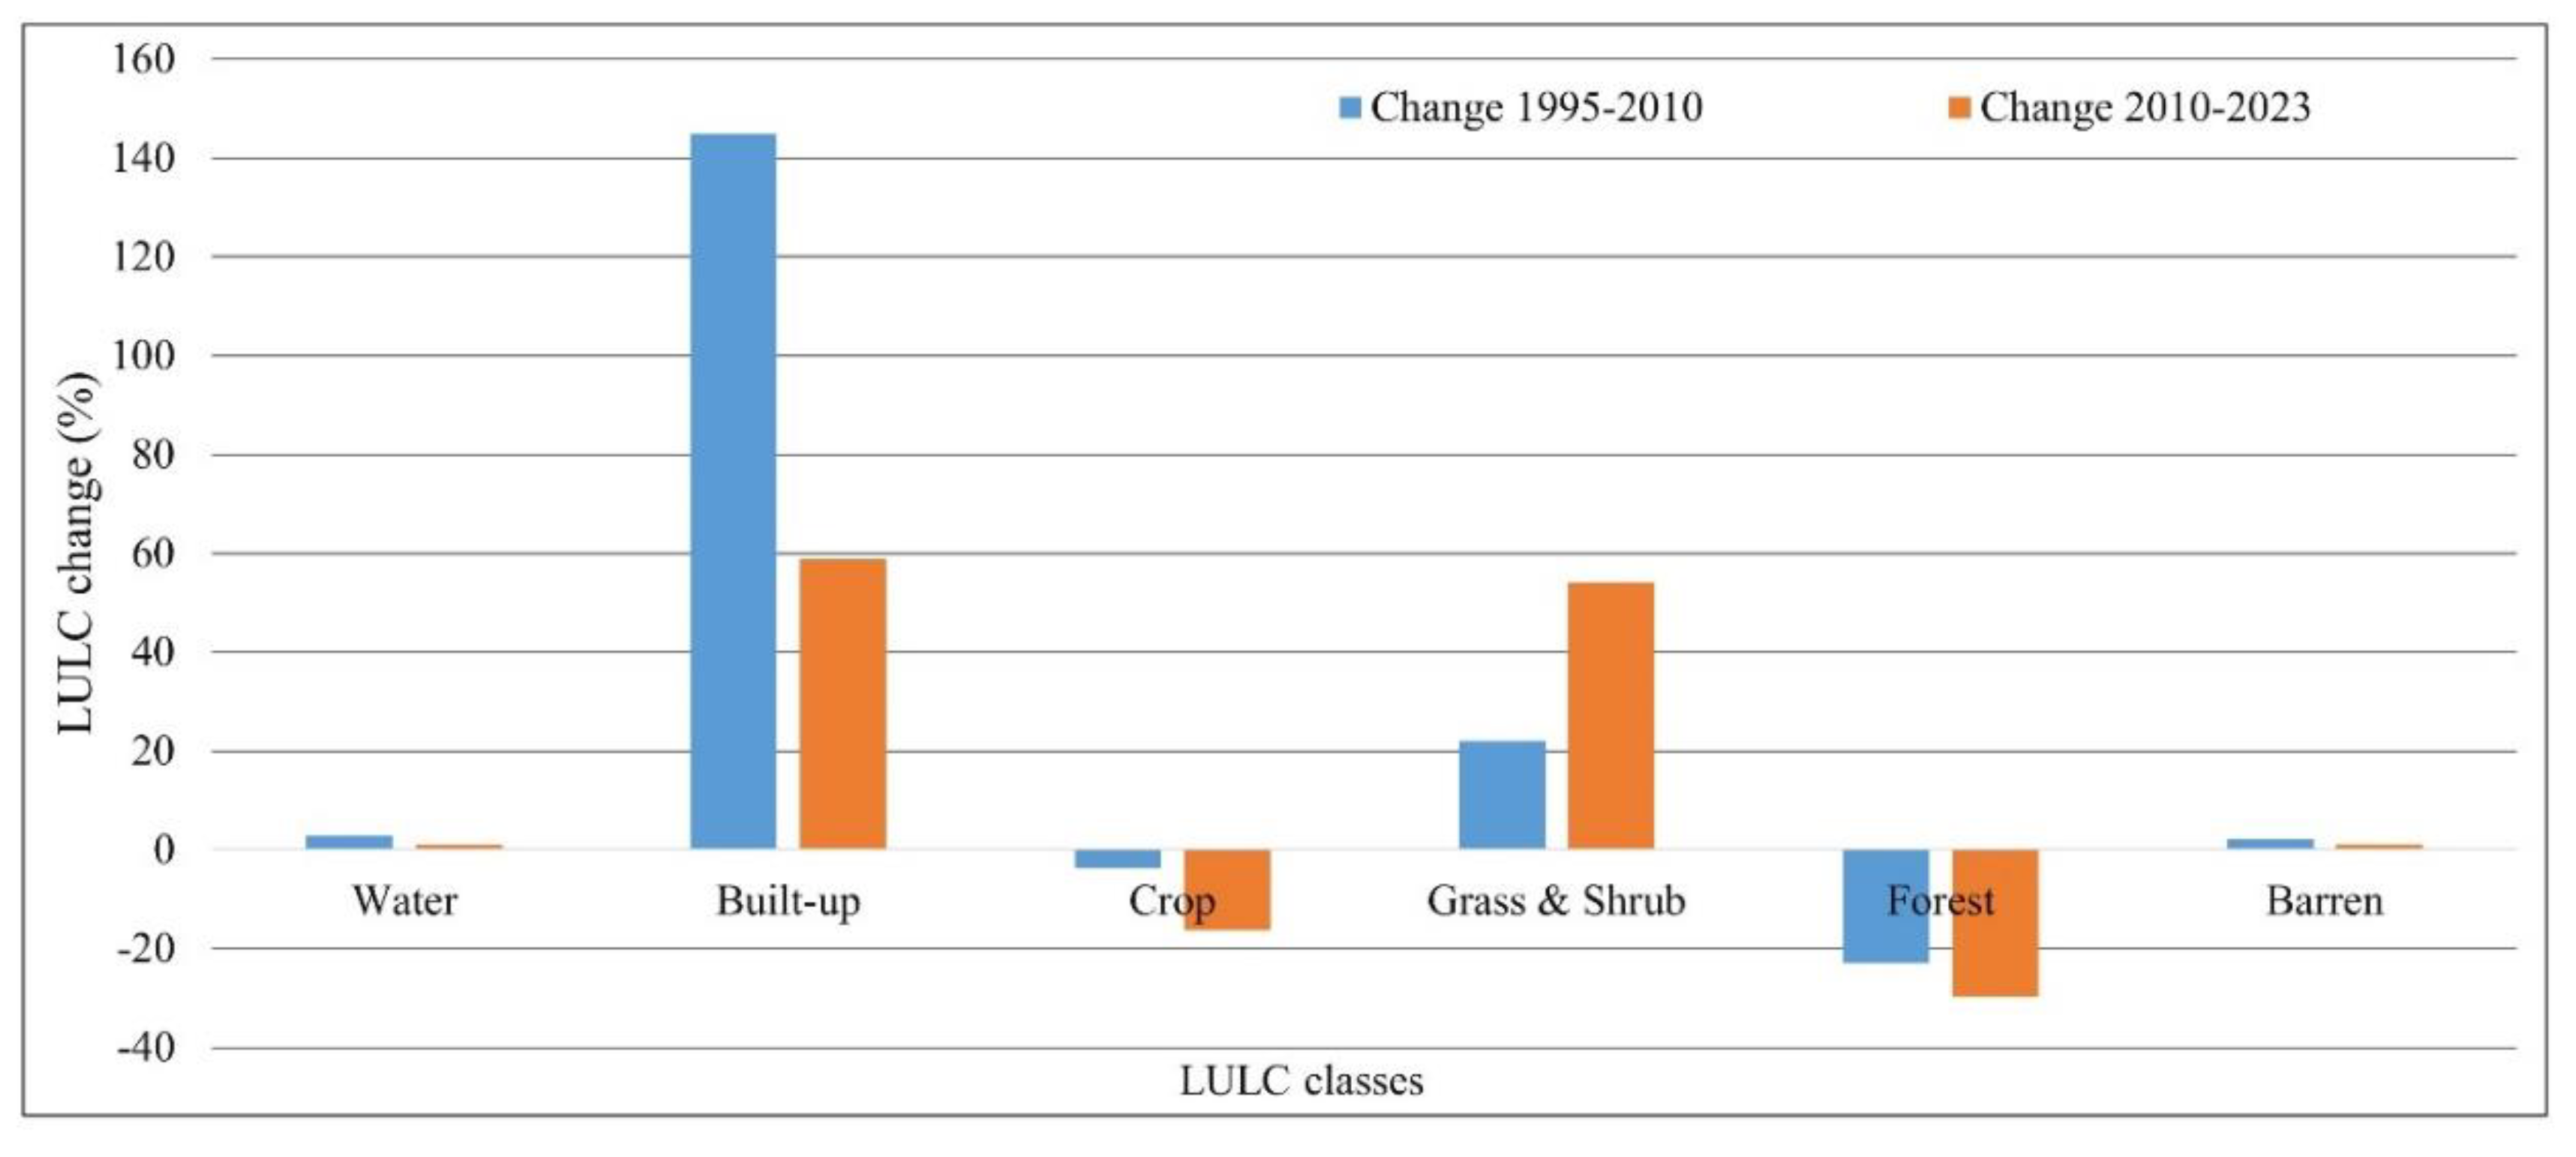
Table 5). This stability indicates that the extent of unproductive land has not significantly altered over the years. Water bodies, on the other hand, have shown a modest increase, rising from 198.19 km² (1.28%) in 1995 to 203.97 km² (1.32%) in 2010, and reaching 206.09 km² (1.33%) by 2023. From 1995 to 2010, LULC changes show significant urban growth with built-up areas increasing by 144.96% and cropland decreasing by 3.54% (
Figure 6). Water bodies grew by 2.92%, indicating some positive environmental management, while grass and shrubland increased by 22.11%, possibly due to land abandonment or restoration. Additionally, barren land rose by 2.22%, suggesting a decline in productivity. The LULC changes from 2010 to 2023 indicate substantial urban growth, with built-up areas increasing by 58.82% while cropland decreased significantly by 16.27%, raising concerns about agricultural sustainability. Water bodies saw a modest increase of 1.04%, suggesting limited improvements in environmental management. Grass and shrubland surged by 54.06%, potentially due to land abandonment or restoration efforts, while barren land increased by 1.25%. The increase in water bodies may be linked to the gradual expansion of Beseka Lake within the catchment area. These land cover changes reflect the complex interactions between human activities and natural processes in the Middle Awash River Basin, illustrating the landscape's ongoing transformation over the past three decades. The overall trends point to a shift toward urbanization, a decline in agricultural land, and alterations in natural vegetation and forest cover, collectively portraying a dynamic and evolving environment. The decline in cropland and forest cover, alongside the increase in built-up areas, may exacerbate issues related to water management, soil erosion, and land degradation. Addressing these challenges is crucial for ensuring the long-term viability of the basin's ecosystems and the livelihoods of communities that depend on its resources, particularly in the context of climate change and increasing water scarcity.
3.3.1. Forest Cover Dynamics
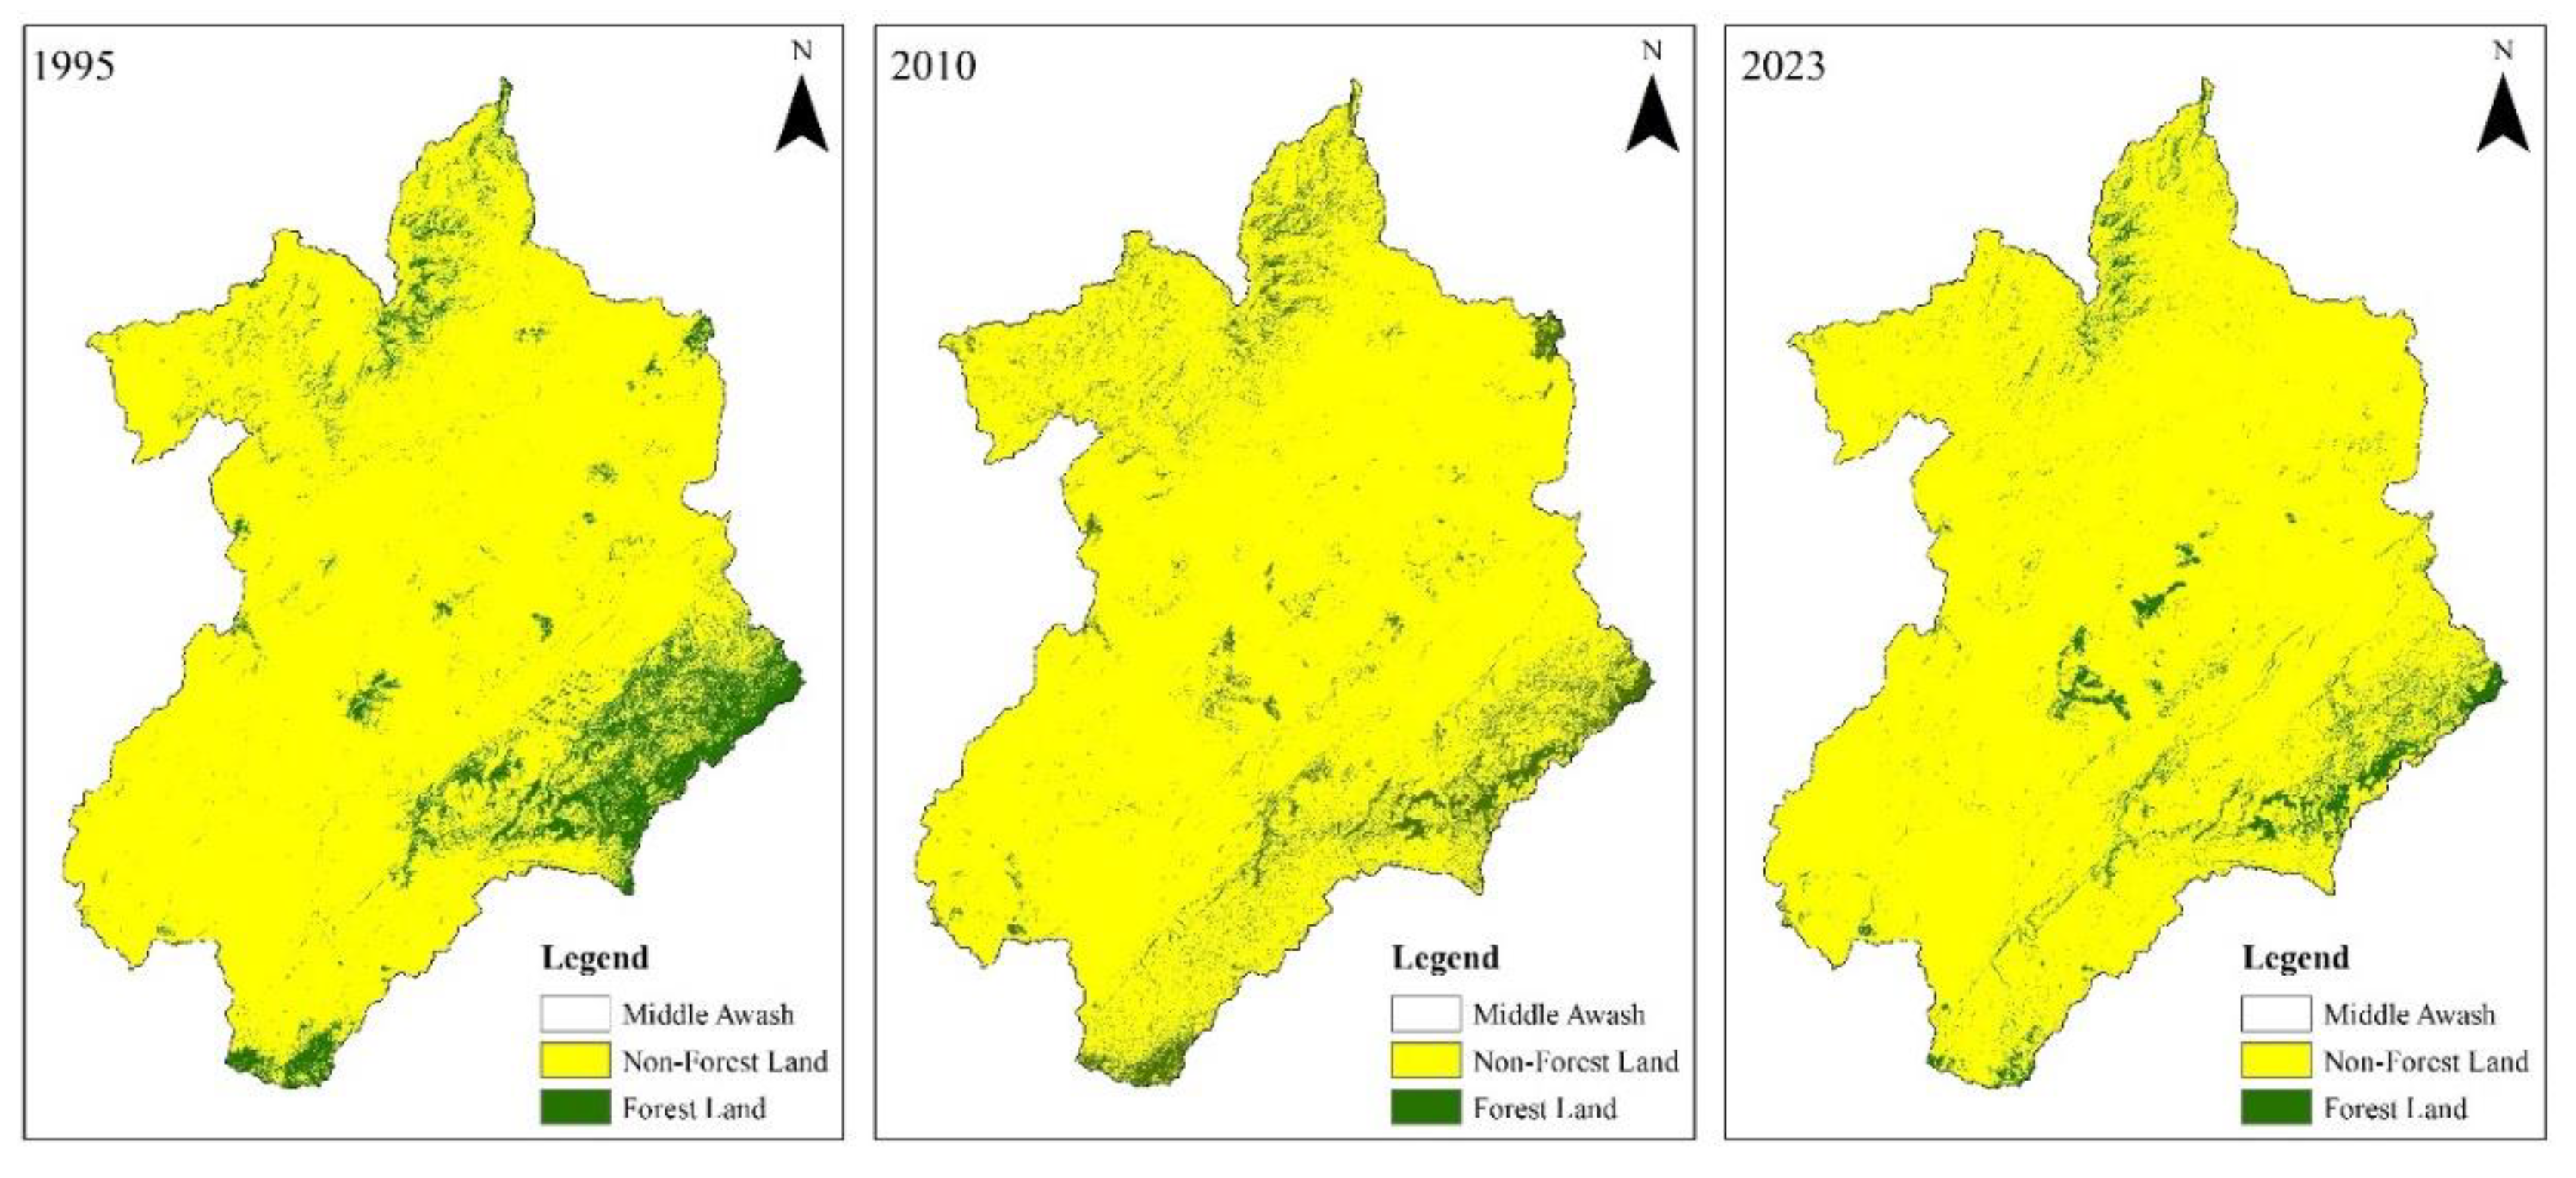
The analysis of forest cover in the Middle Awash River Basin from 1995 to 2023 paints a concerning picture of a significant decline over the years (
Figure 7). In 1995, the region’s forests covered 1,521.88 km², accounting for about 9.83% of the total land area. By 2010, this had dropped to 1,174.10 km² (7.58%), reflecting a sharp decrease of 22.85% over just 15 years. The decline suggests a disruption in the region’s ecological balance, with potential impacts on biodiversity and vital ecosystem services. By 2023, the forest area had dwindled further to 825.20 km² or 5.33% of the total land area. This marked an even more dramatic decline of 29.72% from 2010. The forested area has almost halved since 1995, highlighting a concerning trajectory of deforestation. This loss points to troubling trends driven by factors such as Land conversion to agricultural and shrub land, growing land demand due to population growth, urban sprawl, and possibly illegal logging likely continue to drive this loss. The shrinking forest cover is not just a blow to local wildlife but also threatens the health of the watershed, as forests are essential for regulating water cycles and maintaining soil stability.
3.4. Carbon Stock Dynamics
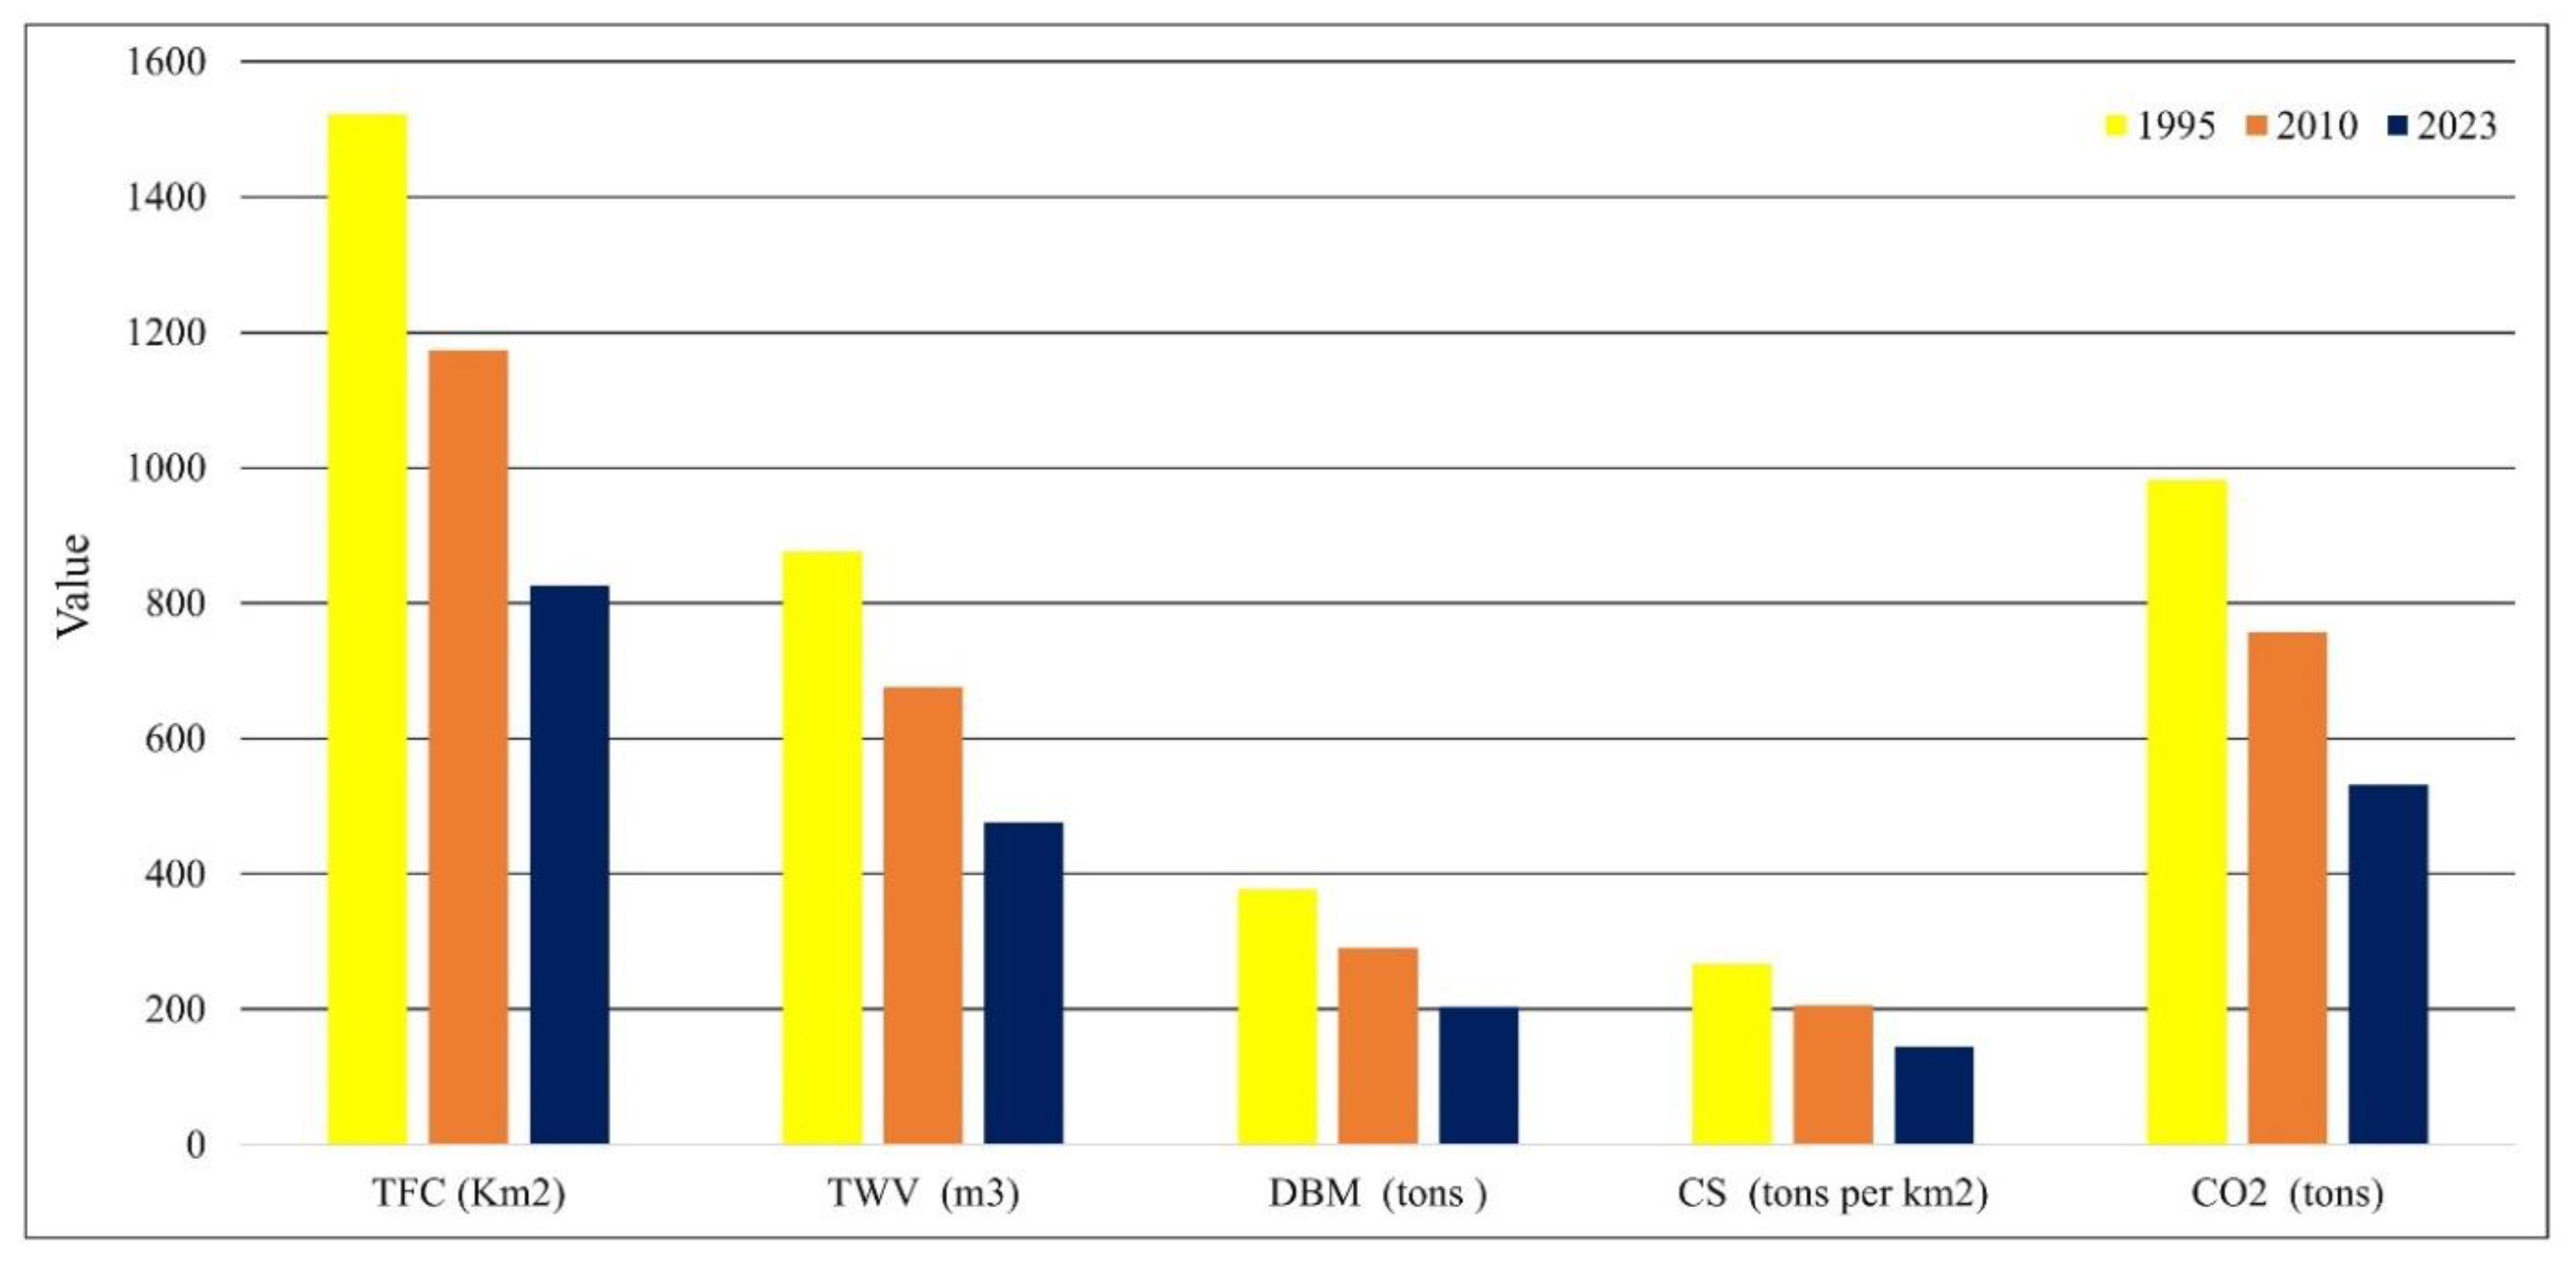
The examination of total wood volume, dry matter biomass, carbon stock, and carbon dioxide emissions in the Middle Awash River Basin from 1995 to 2023 reveals a concerning trend of decline across all measured parameters as shown in
Table 6 and Figure 8. In 1995, the total wood volume was recorded at 876.28 m³, which reflects a robust forest ecosystem capable of supporting significant biomass. However, by 2010, this volume had decreased to 676.03 m³, indicating a loss of approximately 22.85% over the five years. This reduction in wood volume is mirrored by a decline in dry matter biomass, which fell from 376.80 tons in 1995 to 290.69 tons in 2010. The decrease in both wood volume and biomass suggests a diminishing capacity of the forest to sustain its ecological functions, including habitat provision and carbon sequestration. The downward trend continued into the following years, with total wood volume further declining to 475.14 m³ by 2023. This represents a significant loss of 29.72% from the 2010, highlighting an ongoing degradation of forest resources. Correspondingly, dry matter biomass also decreased to 204.31 tons in 2023, indicating a continued reduction in the forest's ability to store organic matter. The carbon stock per square kilometer followed a similar trajectory, decreasing from 267.70 tons/km² in 1995 to 206.53 tons/km² in 2010 and further down to 145.15 tons/km² by 2023. This decline in carbon stock reflects the loss of forest cover and the associated decrease in biomass, which is critical for carbon storage and climate regulation. The total carbon dioxide emissions associated with the forest cover loss also illustrate the impact of these changes, decreasing from 981.59 tons in 1995 to 757.27 tons in 2010, and further to 532.24 tons by 2023. This decline in carbon dioxide storage reflects a reduction in the carbon stored within the forest ecosystem of the basin, as well as a diminished capacity for the forest to function as a carbon sink, which is crucial for mitigating climate change. Overall, the data presents a concerning picture of the forest dynamics in the Middle Awash River Basin, highlighting a substantial decline in wood volume, biomass, carbon stock, and carbon dioxide emissions over the past three decades.
3.5. Result Comparison
The findings of this study resonate with a broader body of research, underscoring the alarming trend of forest cover loss and its associated impact on carbon stock dynamics. This study's findings on forest loss and carbon stock dynamics are consistent with other research in Ethiopia. Research by (Legesse et al., 2024) on the Upper Awash River basin reported a similar level of forest loss along with significant biomass, carbon stock and carbon di oxide emissions changes. Similarly, (Moisa et al., 2023) research in the Baro Akobo basin showed a 17% forest cover decline and substantial carbon dioxide emissions, aligning with our findings. Further support comes from studies by (Deribew & Dalacho, 2019), (Negassa et al., 2020), and (Debebe et al., 2023) across various Ethiopian regions (central highlands, western, and northwestern), all reporting significant forest loss exceeding 10%, mirroring the trends observed in this study. This convergence of results emphasizes the widespread nature of deforestation and its impact on carbon stocks across Ethiopia. The convergence of findings from various studies across different regions highlights the urgency of addressing this critical issue. It underscores the imperative to implement proactive forest conservation and sustainable management practices worldwide. Such efforts are crucial to reversing the trend of deforestation, protecting remaining forest ecosystems, and fostering the restoration of degraded areas.
3.6. Implication for Climate Change Resilience
Forest cover deterioration and carbon stock variations have significant implications for both local and global environments. The loss of forest cover reduces carbon sequestration, leading to increased atmospheric carbon dioxide, contributing to climate change. Forest cover deterioration and carbon stock variation have profound implications for climate change mitigation and resilience. Decreasing forest cover diminishes the ability of ecosystems to absorb and store carbon, exacerbating climate change. This loss also weakens natural resilience to climate impacts, as forests play a crucial role in regulating water cycles, mitigating extreme weather events, and providing habitat for biodiversity. Furthermore, variations in carbon stock indicate changes in the forest's ability to act as a carbon sink, potentially leading to increased emissions. This transformation can lead to a loss of biodiversity, disruption of ecosystems, and alterations in hydrological cycles, which can have cascading effects on the environment and local communities. To enhance climate change resilience, it is essential to adopt sustainable land management practices that prioritize forest conservation and restoration. By doing so, the basin can improve carbon stocks, safeguard vital ecosystem services, and bolster the adaptive capacity of local populations in the face of ongoing climate challenges.
3.7. Limitations of the Study and Recommendations for Future Research
Recognizing the limitations and shortcomings of a study is vital for fostering advancement and improving future research initiatives. The study exclusively focuses on computing aboveground carbon stock, which may overlook significant contributions from belowground carbon that are essential for a comprehensive understanding of total carbon dynamics. Furthermore, the reliance solely on the Von Mirbach carbon stock estimation technique may limit the accuracy and applicability of the findings, as this method might not account for variations in biomass estimation that could arise from different forest types or environmental conditions. To address these limitations, the present study recommends that future research incorporate assessments of belowground carbon stock to explore variations and employ alternative techniques for calculating carbon stock. This approach would facilitate a comparison of results with the current study's findings, thereby enhancing the overall understanding of carbon dynamics in the region. Including below-ground measurements is crucial, as they can significantly contribute to the total carbon stock and provide a more comprehensive view of carbon storage in forest ecosystems.
4. Conclusion and Recommendations
The study aims to examine changes in forest cover and carbon stock in the Middle Awash River Basin, Ethiopia, for the years 1995, 2010, and 2023. The multi-temporal Landsat image-based LULC classification results for the Middle Awash River Basin show notable changes from 1995 to 2023. Built-up areas increased from 39.50 km² (0.26%) in 1995 to 153.67 km² (0.99%) in 2023, indicating urban expansion. Cropland decreased from 10,155.70 km² (65.60%) to 8,202.61 km² (52.99%), reflecting a decline in agricultural land. Grass and shrubland rose significantly from 2,839.30 km² (18.34%) to 5,341.56 km² (34.51%), suggesting a shift towards more natural vegetation. Forest cover decreased from 1,521.88 km² (9.83%) to 825.20 km² (5.33%), indicating a loss of forest resources. Barren land slightly increased from 725.71 km² (4.69%) to 751.14 km² (4.85%), while water bodies experienced a minor increase from 198.19 km² (1.28%) to 206.09 km² (1.33%). Overall, these changes highlight a complex interplay of urbanization, agricultural decline, and shifts in natural vegetation within the basin. Total forest cover decreased from 1,521.88 km² in 1995 to 1174.1 Km2 in 2010 then finally to 825.20 km² in 2023, accompanied by a reduction in total wood volume from 876.28 m³ to 475.14 m³. Dry matter biomass also fell from 376.80 tons to 204.31 tons, while carbon stock decreased from 267.70 tons/km² to 145.15 tons/km². Consequently, carbon dioxide found in the forest ecosystem dropped from 981.59 tons to 532.24 tons, highlighting a significant loss of carbon storage capacity and raising concerns about GHG emissions, ecological health and sustainability of the basin. The findings of the study emphasize the pressing need for focused actions to address the loss of forest cover and changes in carbon stock within the Middle Awash River Basin, stressing the importance of incorporating these insights into effective approaches for forest regeneration, protection, land management, and climate adaptation.
Funding
This research received no external funding.
Declaration of competing interest
The author has no relevant financial or non-financial interests to disclose. There are not any disclosed conflicts of interest.
Availability of data and materials
All relevant data are included in the paper.
References
- Ahammad, R., Stacey, N., Eddy, I. M. S., Tomscha, S. A., & Sunderland, T. C. H. (2019). Recent trends of forest cover change and ecosystem services in eastern upland region of Bangladesh. Science of the Total Environment, 647, 379–389. [CrossRef]
- Ali, S. (2017). Forest cover change and carbon stock assessment in Swat valley using remote sensing and geographical information systems. Pure and Applied Biology, 6(3). [CrossRef]
- Bantider, A. (2021). Mapping Aboveground Carbon Stocks and Emissions Induced by Land Use and Land Cover Changes in Ethiopia: A Remote Sensing Approach Working Paper No . 3 MoARD; SLMPCM Recommended Cita ... 3. [CrossRef]
- Braun, G., Hellwig, M. K., & Byrnes, W. M. (2007). Global Climate Change and Catholic Responsibility. Journal of Catholic Social Thought, 4(2), 373–401. [CrossRef]
- Case, F. A., & Baylie, M. M. (2022). Decision Analysis of the Adaptation of Households to Extreme Floods Using an Extended Protection Motivation.
- Congalton, R. G., & Green, K. (2008). Assessing the accuracy of remotely sensed data: Principles and practices, second edition. In Assessing the Accuracy of Remotely Sensed Data: Principles and Practices, Second Edition.
- David, B. (2015). Global Warming and Global Change: Facts and Myths. International Journal of Earth Science and Geophysics, 1(1), 1–5. [CrossRef]
- Debebe, B., Senbeta, F., Teferi, E., Diriba, D., & Teketay, D. (2023). Analysis of Forest Cover Change and Its Drivers in Biodiversity Hotspot Areas of the Semien Mountains National Park , Northwest Ethiopia. 1–22.
- Deribew, K. T., & Dalacho, D. W. (2019). Land use and forest cover dynamics in the North - eastern Addis Ababa , central highlands of Ethiopia. Environmental Systems Research, 1–18. [CrossRef]
- Dibaba, W. T. (2023). Urbanization-induced land use/land cover change and its impact on surface temperature and heat fluxes over two major cities in Western Ethiopia. Environmental Monitoring and Assessment, 195(9), 1–20. [CrossRef]
- Goheer, M. A., Fatima, L., Farah, H., Hassan, S. S., & Abbas, N. (2023). Assessment of change in forests land, carbon stock and carbon emissions of KPK, Pakistan for past three decades using geospatial techniques. Journal of Water and Climate Change, 14(2), 442–453. [CrossRef]
- Goheer, M. A., Hassan, S. S., Gul, K., Waqar, M., & Parveen, N. (2022). GIS-based spatio-temporal assessment of forest cover change and carbon sequestrations of District Abbottabad, Pakistan. Journal of Water and Climate Change, 13(8), 2962–2971. [CrossRef]
- Habib, S., & Al-Ghamdi, S. G. (2021). Estimation of Above-Ground Carbon-Stocks for Urban Greeneries in Arid Areas: Case Study for Doha and FIFA World Cup Qatar 2022. Frontiers in Environmental Science, 9(June 2021), 1–17. [CrossRef]
- Kassaye, M., Derebe, Y., Kibrie, W., Debebe, F., Emiru, E., Gedamu, B., & Tamir, M. (2024). The effects of environmental variability and forest management on natural forest carbon stock in northwestern Ethiopia. Ecology and Evolution, 14(6), 1–19. [CrossRef]
- Khan, I. A., Khan, W. R., Ali, A., & Nazre, M. (2021). Assessment of above-ground biomass in pakistan forest ecosystem’s carbon pool: A review. Forests, 12(5), 1–18. [CrossRef]
- Khan, S. A., Gulfishan, M., Mir, R. A., & Andrabi, S. A. H. (2022). Forest cover change detection through modern applications and its environmental impacts, A review “Constraints and Prospects for Income generation from NWFP Commercialization in Jammu & Kashmir” View project forest conservation View project. 4(July), 75–82. https://www.researchgate.net/publication/362133210.
- Kumar, R., Nandy, S., Agarwal, R., & Kushwaha, S. P. S. (2014). Forest cover dynamics analysis and prediction modeling using logistic regression model Forest cover dynamics analysis and prediction modeling using logistic regression model. Ecological Indicators, 45(June 2018), 444–455. [CrossRef]
- Lawrence, D., Coe, M., Walker, W., Verchot, L., & Vandecar, K. (2022). The Unseen Effects of Deforestation: Biophysical Effects on Climate. Frontiers in Forests and Global Change, 5(March), 1–13. [CrossRef]
- Legesse, F., Degefa, S., & Soromessa, T. (2024). Carbon stock dynamics in a changing land use land cover of the Upper Awash River Basin: Implications for climate change management. Sustainable Environment, 10(1), 1–18. [CrossRef]
- Li, C., Canada, N. R., Liu, S., & Zhang, Y. (2008). Forest Management and Carbon Sink Dynamics: a Study in Boreal and Sub- Alpine Forest Regions. January. [CrossRef]
- Li, J., Ren, J., Ma, X., & Xiao, G. (2023). Environmental efficiency of ports under the dual carbon goals: Taking China’s Bohai-rim ports as an example. Frontiers in Marine Science, 10(April), 1–10. [CrossRef]
- Li, Q., Wei, X., Zhang, M., Liu, W., Fan, H., Zhou, G., Giles-Hansen, K., Liu, S., & Wang, Y. (2017). Forest cover change and water yield in large forested watersheds: A global synthetic assessment. Ecohydrology, 10(4), 1–7. [CrossRef]
- Loukika, K. N., Keesara, V. R., & Sridhar, V. (2021). Analysis of land use and land cover using machine learning algorithms on google earth engine for Munneru river basin, India. Sustainability (Switzerland), 13(24). [CrossRef]
- Mirbach, V. (2000). Carbon budget accounting at the forest management unit level: an overview of issues and methods. July, 13.
- Moisa, M. B., Dejene, I. N., Deribew, K. T., Gurmessa, M. M., & Gemeda, D. O. (2023). Impacts of forest cover change on carbon stock, carbon emission and land surface temperature in Sor watershed, Baro Akobo Basin, Western Ethiopia. Journal of Water and Climate Change, 14(8), 2842–2860. [CrossRef]
- Morris, B. S., Chrysochou, P., Christensen, J. D., Orquin, J. L., Barraza, J., Zak, P. J., & Mitkidis, P. (2019). Stories vs. facts: triggering emotion and action-taking on climate change. Climatic Change, 154(1–2), 19–36. [CrossRef]
- Mukul, S. A., Halim, M. A., & Herbohn, J. (2021). Forest Carbon Stock and Fluxes: Distribution, Biogeochemical Cycles, and Measurement Techniques (pp. 361–376). [CrossRef]
- Munasinghe, M., & Swart, R. (2005). Primer on climate change and sustainable development: Facts, policy analysis, and applications. In Primer on Climate Change and Sustainable Development: Facts, Policy Analysis, and Applications. [CrossRef]
- Nam, K., Lee, W. K., Kim, M., Kwak, D. A., Byun, W. H., Yu, H., Kwak, H., Kwon, T., Sung, J., Chung, D. J., & Lee, S. H. (2015). Spatio-temporal change in forest cover and carbon storage considering actual and potential forest cover in South Korea. Science China Life Sciences, 58(7), 713–723. [CrossRef]
- Negassa, M. D., Mallie, D. T., & Gemeda, D. O. (2020). Forest cover change detection Forest cover change detection using Geographic Information Systems and remote sensing techniques: a spatio-temporal study on Komto Protected forest priority area, East Wollega Zone, Ethiopia. Environmental Systems Research, 1–14. [CrossRef]
- Othow, O. O., Legesse Gebre, S., & Obsi Gemeda, D. (2017). Analyzing the Rate of Land Use and Land Cover Change and Determining the Causes of Forest Cover Change in Gog District, Gambella Regional State, Ethiopia. Journal of Remote Sensing & GIS, 06(04). [CrossRef]
- Pan, Y., Birdsey, R. A., Phillips, O. L., Houghton, R. A., Fang, J., Kauppi, P. E., Keith, H., Kurz, W. A., Ito, A., Lewis, S. L., Nabuurs, G. J., Shvidenko, A., Hashimoto, S., Lerink, B., Schepaschenko, D., Castanho, A., & Murdiyarso, D. (2024). The enduring world forest carbon sink. Nature, 631(8021), 563–569. [CrossRef]
- Pandey, V. K., & Mishra, A. (2015). Facts and trend of Climate Change - with reference to Geological time frame. International Journal of Current Research in Science and Technology, 1(3), 43–60.
- Pechanec, V., Štěrbová, L., Purkyt, J., Prokopová, M., Včeláková, R., Cudlín, O., Vyvlečka, P., Cienciala, E., & Cudlín, P. (2022). Selected Aspects of Carbon Stock Assessment in Aboveground Biomass. Land, 11(1), 1–16. [CrossRef]
- Phan, T. N., Kuch, V., & Lehnert, L. W. (2020). Land cover classification using google earth engine and random forest classifier-the role of image composition. Remote Sensing, 12(15). [CrossRef]
- Prevedello, J. A., Winck, G. R., Weber, M. M., Nichols, E., & Sinervo, B. (2019). Impacts of forestation and deforestation on local temperature across the globe. PLoS ONE, 14(3), 1–18. [CrossRef]
- Rahayu, S., Lusiana, B., & van Noordwijk, M. (2005). Above ground carbon stock assessment for various land use systems in Nunukan, East Kalimantan. Carbon Stock Monitoring in Nunukan, East Kalimantan: A Spatial and Modelling Approach. World Agroforestry Centre, SE Asia, Bogor, Indonesia, 21–34.
- Regassa, B., Kassaw, M., & Bagyaraj, M. (2020). Analysis of Urban Expansion and Modeling of LULC Changes Using Geospatial Techniques: The Case of Adama City. Remote Sensing of Land, 4(1–2), 40–58. [CrossRef]
- Report, G. D. O. A. (2022). Drought in East Africa August 2022. August. [CrossRef]
- Solomon, & Moon, H. (2018). Expansion of Exotic Tree Species and Impacts on Management of the Indigenous Trees; Emphasis on Eucalyptus Species in Wolaita, South Ethiopia-A. Communities, 19, 20.
- Solomon, N., Annang, T., Hishe, H., Pabi, O., Asante, I. K., & Birhane, E. (2018). Forest cover change, key drivers and community perception in Wujig Mahgo Waren forest of northern Ethiopia. Land, 7(1). [CrossRef]
- Sun, W., Shan, J., Wang, Z., Wang, L., Lu, D., Jin, Z., & Yu, K. (2020). Geospatial Analysis of Urban Expansion Using Remote Sensing Methods and Data: A Case Study of Yangtze River Delta, China. Complexity, 2020. [CrossRef]
- Tadese, S., Soromessa, T., Aneseye, A. B., & Gebeyehu, G. (2023). The impact of land cover change on the carbon stock of moist afromontane forests in the Majang Forest Biosphere Reserve. Carbon Balance and Management, 1–20. [CrossRef]
- Tikuye, B. G., Rusnak, M., Manjunatha, B. R., & Jose, J. (2023). Land Use and Land Cover Change Detection Using the Random Forest Approach: The Case of The Upper Blue Nile River Basin, Ethiopia. Global Challenges, 7(10), 1–11. [CrossRef]
- Tola, F. K. (2023). Drivers of Forest cover changes in and around Jorgo Wato Forest, West Wallagga, Oromia, Ethiopia. Heliyon, 9(8), e19053. [CrossRef]
- Tran, P., Marincioni, F., & Shaw, R. (2010). Catastrophic flood and forest cover change in the Huong river basin, central Viet Nam: A gap between common perceptions and facts. Journal of Environmental Management, 91(11), 2186–2200. [CrossRef]
- Wlodarczyk, J., Bielen, M., & Gibas, P. (2022). Trying to See the Forest for the Trees: Forest Cover and Economic Activity in Africa.
- Xiao, H., Liu, J., He, G., Zhang, X., Wang, H., Long, T., Zhang, Z., Wang, W., Yin, R., Guo, Y., Cheng, B., & Cao, Q. (2022). Data-Driven Forest Cover Change and Its Driving Factors Analysis in Africa. Frontiers in Environmental Science, 9(January), 1–13. [CrossRef]
- Yalew, A. W., Hirte, G., Lotze-Campen, H., & Tscharaktschiew, S. (2018). Climate change, agriculture, and economic development in Ethiopia. Sustainability (Switzerland), 10(10). [CrossRef]
- Yesuph, A. Y., & Dagnew, A. B. (2019). Land use/cover spatiotemporal dynamics, driving forces and implications at the Beshillo catchment of the Blue Nile Basin, North Eastern Highlands of Ethiopia. Environmental Systems Research, 8(1). [CrossRef]
- You, G. J., & Ringler, C. (2013). Hydro-economic modeling of climate change impacts in Ethiopia IFPRI Discussion Paper 00960 Hydro-Economic Modeling of Climate Change Impacts in Ethiopia Gene Jiing-Yun You Environment and Production Technology Division. January 2010.
|
Disclaimer/Publisher’s Note: The statements, opinions and data contained in all publications are solely those of the individual author(s) and contributor(s) and not of MDPI and/or the editor(s). MDPI and/or the editor(s) disclaim responsibility for any injury to people or property resulting from any ideas, methods, instructions or products referred to in the content. |
© 2024 by the authors. Licensee MDPI, Basel, Switzerland. This article is an open access article distributed under the terms and conditions of the Creative Commons Attribution (CC BY) license (http://creativecommons.org/licenses/by/4.0/).