1. Introduction
Cancer remains the second leading cause of death globally, and despite advances in treatment, conventional therapies such as chemotherapy are often limited by severe side effects and the frequent emergence of drug resistance [
1]. These limitations underscore the urgent need for more effective and tolerable therapeutic strategies.
Recent research has highlighted gut microbiota as a novel and influential player in cancer development and therapy response. Beyond its traditional roles in immune system modulation, xenobiotic metabolism, and toxin elimination, microbiota has emerged as a key factor in tumor suppression and progression [
2,
3,
4]. Disruptions in microbial composition, referred to as dysbiosis, have been associated with several malignancies, including pancreatic cancer (PC) and colorectal cancer (CRC) [
5]. Moreover, the emerging field of pharmacomicrobiomics reveals a bidirectional relationship between microbiota and cancer therapies; while certain microbial profiles can enhance the efficacy of anticancer treatments, these treatments can in turn alter microbiota, often worsening dysbiosis [
6,
7].
Given this interplay, restoring a favorable microbiota has become a promising adjunct strategy in cancer care. Approaches such as probiotics, prebiotics, and postbiotics are being explored to modulate the gut ecosystem. Probiotics, live microorganisms that confer health benefits, have shown potential in reducing chemotherapy-induced toxicity, enhancing therapeutic efficacy, and even preventing tumor development. For instance, in a murine model of pancreatic ductal adenocarcinoma (PDAC) treated with gemcitabine, gut dysbiosis was observed alongside an increase in pro-inflammatory bacteria [
7]. However, the administration of a probiotic blend (PRO2101) in a follow-up study mitigated these effects, improving microbiota composition and enhancing therapeutic outcomes [
8].
Further investigation into the individual strains within a probiotic blend (PRO2101), particularly
Bifidobacterium bifidum and
Bifidobacterium breve¸ revealed that their cell-free supernatants (CFSs) could prevent epithelial-mesenchymal transition (EMT) in BxPC-3 pancreatic cancer cells, especially when combined with gemcitabine. This led to metabolomic profiling of the CFSs to identify specific metabolites, or postbiotics, that might be responsible for the observed anticancer effects [
8]. From this metabolomic analysis, two compounds emerged as promising candidates, N-acetylcysteine (NAC) and tetrahydro β-carboline carboxylic acid (THC).
Postbiotics, defined as non-viable microbial products or metabolic byproducts that confer health benefits, offer several practical advantages over probiotics, including greater stability, easier storage, and faster biological activity [
7,
9]. This study investigates the anticancer potential of the postbiotics NAC and THC in PC and CRC models. Specifically, we examine their individual effects on cancer cell viability and some cancer hallmark behaviors, as well as their potential to enhance the efficacy of standard chemotherapeutic agents, gemcitabine for PC and 5-fluorouracil (5-FU) for CRC.
2. Materials and Methods
Compounds analyzed. N-acetyl-L-cysteine was purchased from Sigma-Aldrich (St. Louis, MO) and was dissolved in sterile water. The compound 1,2,3,4- Tetrahydro β-carboline-1-carboxylic-acid was purchased from TRC (North York, ON) and was dissolved in 100 % dimethyl sulfoxide (DMSO). The 5-fluorouracil (5-FU) chemotherapeutic agent, purchased from Sigma-Aldrich (St. Louis, MO), was dissolved in DMSO; and the chemotherapy drug gemcitabine, purchased from Sigma-Aldrich (St. Louis, MO), was dissolved in sterile water.
Cell lines and conditions. The experiments were carried out in two-human derived CRC cell lines: RKO (BRAFV600E mutation; valine at position 600 is mutated to glutamic acid in the BRAF V600E mutant) and SW480 (KRASG12V mutation; glycine at position 12 is mutated to valine in the KRAS G12V mutant), a normal colon epithelial cell line derived from the human colon, NCM460, and two human-derived PC cell lines: BxPC-3 (KRASWT) and Panc-1 (KRASG12D mutation; glycine at position 12 is mutated to aspartate in the KRAS G12D), and an hTERT-immortalized fibroblast cell, BJ-5ta. Cell lines were maintained in either Petri dishes (100 x 20 mm) or in T25 cm2 polystyrene tissue culture flasks with Roswell Park Memorial Institute (RPMI) 1640 medium for SW480, NCM460, and BxPC-3, and Dulbecco’s Modified Eagle’s Medium (DMEM) for RKO, Panc-1 and BJ-5ta. Both culture media were supplemented with 10 % (v/v) fetal bovine serum (FBS) and 1 % (v/v) of PenStrep, an antibiotic solution. In the case of BJ-5ta cell line, DMEM medium was supplemented with 10 % (v/v) of FBS, one part of 199 Medium and 100 µL of hygromycin. For all the assays, all cell lines were grown to 70-90 % confluence at a 37 °C, 5 % CO2 incubator with humidified atmosphere. Three independent experiments were conducted in each cell line with each compound for all the assays. For 6-well-plates all cell lines were seeded at a density of 3.5 X 10⁵ cells/mL, meanwhile, for 24-well-plate all cell lines were seeded at a density of 1 X 10⁵ cells/mL.
Cell viability assays and IC
50 determination. To evaluate the effects of the postbiotics on the tested cell lines and to determine the half-maximum inhibitory concentration (IC
50), cell viability was assessed using either the Muse™ Count & Viability Kit (Catalog No. MCH100102) or the Sulforhodamine B (SRB) assay. Two distinct assays were used because the experiments involving PC cell lines were conducted at “Fondazione Casa Sollievo della Sofferenza” while studies performed in CRC cell lines and control cell lines were conducted at the Centre of Molecular and Environmental Biology. To evaluate cell growth and calculate the IC
50, cells were seeded in 24-well plates and left to adhere for 24 h, to later incubate with different concentrations of the compounds for 48 h. The range of concentrations varied for each compound and cell line, the maximum concentration tested being 180 mM and the minimum being 0.5 mM. For each cell line and compound, a negative control was performed where the cells were exposed to complete growth medium with the vehicle in the highest concentration tested (H
2O concentration in conditions with NAC and DMSO concentration in conditions with THC) and this was considered as 100 % of cell growth. After a 48-h treatment with different compounds, two approaches were used depending on the assay. For analyses performed with the Muse™ Cell Analyzer, the adherent cells were washed with 1x PBS, harvested using trypsin 0.05 % (v/v), resuspended in complete medium and stained with the Count & Viability Reagent (200X) from the Muse™ Count & Viability Kit (Catalog No. MCH100102). This reagent differentially stains viable and non-viable cells based on membrane permeability to two DNA-binding dyes: a membrane-impermeant dye that stains only cells with compromised membrane integrity (dead or dying cells), and a membrane-permeant dye that stains all nucleated cells, allowing distinction between intact cells, debris, and non-nucleated particles. For the SRB assay, the Sulforhodamine B dye binds stoichiometrically to basic amino acid residues of cellular proteins. After fixation and staining, the bound dye is extracted under mild acidic conditions, and absorbance is measured at 540 nm in a Molecular Devices SpectraMax Plus 384 Microplate Reader. The absorbance values are proportional to the total cellular protein content and thus reflect the number of viable cells [
10]. Moreover, to calculate the selectivity index (SI) the IC
50 values of each compound for normal cells, BJ-5ta and NCM460, were divided by the corresponding PC and CRC cancer cell lines, respectively [
11].
Enhancement of the effect of gemcitabine or 5-FU in cell proliferation. To observe if each compound enhanced the effect of the chemotherapy drug, gemcitabine in the two PC (BxPC-3 and Panc-1) and 5-FU in the two CRC (SW480 and RKO) cell lines, the Muse™ Cell Analyzer and SRB assay was performed, respectively. Similarly to the procedure performed to determine the IC50 of each compound, a 48-h treatment was done in each cell line with each compound at their IC50 concentration alone and mixed with gemcitabine for the PC cell lines or with 5-FU for the CRC cell lines. The negative control was the same as the one used in the previous assay and for a positive control, the cells were treated with either gemcitabine or 5-FU for PC and CRC cell lines, respectively.
Cell death assessed by Annexin V/Propidium Iodide. When evaluating the induction of cell death the cells were seeded in 6-well plates and after 24-h incubation the cells were treated, and left to incubate for another 48h, with: complete growth medium with the vehicle in the highest concentration tested (negative control), IC50 concentration of the compounds, chemotherapy agent (positive control) and these two latter conditions combined. Annexin V (AV) is a calcium-dependent phospholipid-binding protein with a high affinity for phosphatidylserine (PS), therefore, in the early stages of apoptosis, when the externalization of PS molecules occurs AV binds to them which helps measure its externalization. Moreover, a marker such as propidium iodide (PI) was used to detect necrosis by measuring the structural integrity of the cell membrane. Therefore, this method differentiates normal/non-apoptotic cells from apoptotic cells, including early and late apoptotic cells. After 48-h, the cells were washed with 1x PBS, harvested using trypsin 0.05 % (v/V), resuspended in complete medium, incubated with both dyes at RT in the dark and analyzed by flow cytometry.
Cell cycle analysis by flow cytometry. Similarly, as performed in the previous assay, the same four treatments were performed in 6-well plates and left for 48-h in each cell line (SW480, RKO, BxPC-3, and Panc-1) with each compound. After 48-h treatment, the cells were washed with 1x PBS, collected using 0.05 % trypsin and resuspended in medium. The suspensions were centrifuged, the pellet was resuspended in 1x PBS, and the cells were fixed with ice-cold 96 % (v/v) ethanol was added dropwise to the suspension while slowly vortexing and incubated at -20 °C. After the incubation, the samples were once again centrifuged and washed with 1x PBS. A final centrifugation was performed; the pellet was resuspended, treated with ribonuclease A and stained with PI.
Statistical analysis. Statistical analysis was performed with the GraphPad Prism version 8.4.3 for Windows (GraphPad Software, San Diego, California, USA). A nonlinear regression analysis was performed for each compound in each cell line using a best-fit approach. Data are expressed as mean ± standard deviation (SD) of the mean from at least three independent experiments. Student t-test was used to assess statistical differences among groups and statistical significance was assumed as p-values < 0.05 (*), p-values < 0.01 (**) or p-values < 0.001(***) for a confidence level of 95 %.
3. Results
3.1. Evaluation of Cytotoxic Effects of NAC and THC on Pancreatic and Colorectal Cancer Cell Lines
To evaluate the anticancer potential of the postbiotics NAC and THC, dose-response studies were conducted across a panel of pancreatic (BxPC-3 and Panc-1) and colorectal (SW480 and RKO) cancer cell lines. Two non-cancerous cell lines, BJ-5ta (immortalized fibroblasts) and NCM460 (normal colon epithelial cells) served as control for PC and CRC cell lines, respectively.
Cell viability assays using increasing concentrations of NAC and THC (from a range of 0.5 to 180 mM) revealed a dose-dependent cytotoxic effect on all cancer cell lines tested. The IC
50 was calculated for each cell line (
Figure 1 and
Figure 2;
Table 1 and
Table 2). The selectivity index (SI) was calculated to assess the compounds preferential cytotoxicity toward cancer cells over normal cells [
13].
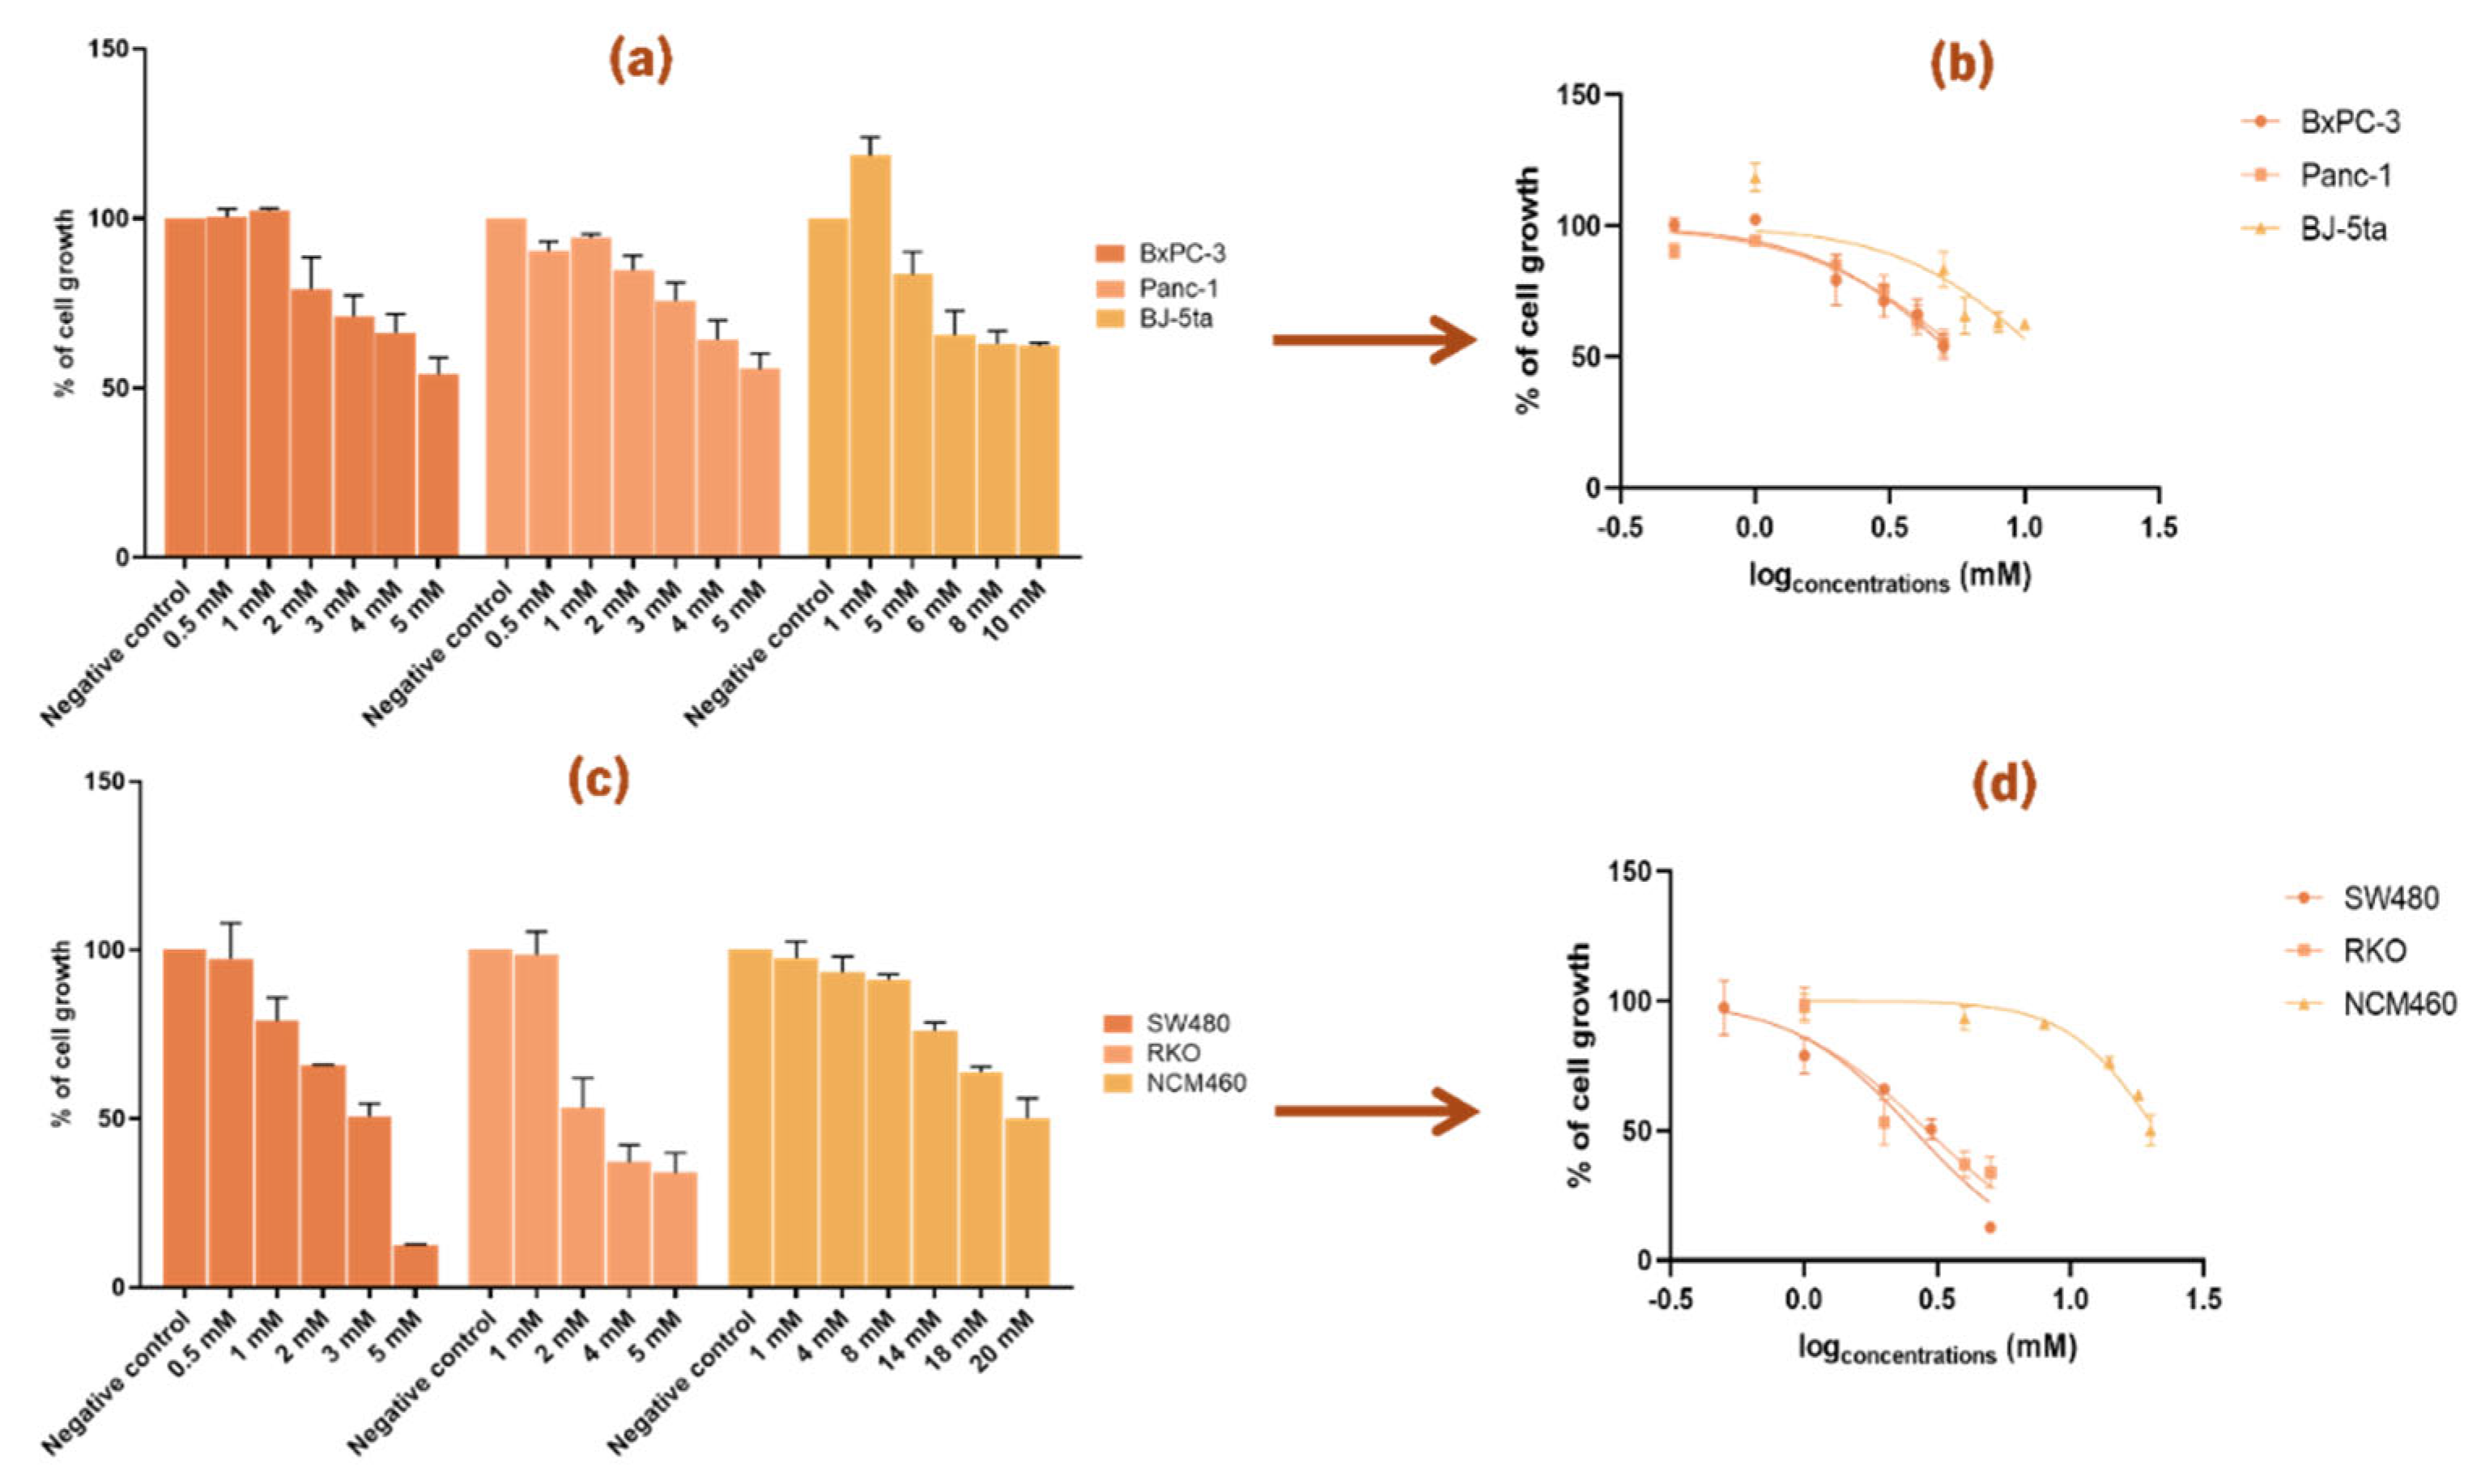
3.1.1. N-Acetylcysteine Inhibits the Growth of Pancreatic and Colorectal Cancer Cell Lines
For PC cell lines, distinct concentration ranges were required: BxPC-3 cells responded to lower doses (2.5-20 mM), while Panc-1 cells required higher concentrations, up to 50 mM, to achieve a comparable effect (
Figure 1a). The corresponding IC
50 curves (
Figure 1b) revealed greater sensitivity to NAC for BxPC-3 cells, as reflected by a lower IC
50 value compared to Panc-1 (
Table 1). In CRC cell lines, a broader range (2.5-100 mM) was tested due to their reduced sensitivity to NAC (
Figure 1c). As shown in
Figure 1d, RKO cells were slightly more responsive to NAC than SW480, which are reflected with the modest differences in IC
50 values (
Table 1).
Control cell lines also exhibited a dose-dependent response but at notably higher NAC concentrations: BJ-5ta (0.5-120 mM) and NCM460 (0.5-180 mM) (
Figure 1a and
Figure 1c). Accordingly, both controls showed higher IC
50 values than their cancerous counterparts, resulting in SI values greater than 1 (
Table 1). This indicates that NAC preferentially reduced the viability of cancer cells while sparing normal cells, suggesting selectivity toward cancer cells. Based on these findings, further functional assays were performed to explore the effects of NAC on the growth of BxPC-3, Panc-1, SW480, and RKO cells.
3.1.2. Tetrahydro β-Carboline Carboxylic Acid Influences the Cell Growth of Pancreatic and Colorectal Cancer Cell Lines
For THC, concentrations ranging from 0.5 to 20 mM were tested, and a clear dose-dependent reduction in cell growth was observed in both PC and CRC cell lines (
Figure 2). For the cancer cell lines, concentrations between 0.5 and 5 mM were tested, while for the control cell lines higher ranges were required: BJ-5ta was tested from 1 to 10 mM, and NCM460 from 1 to 20 mM (
Figure 2a and
Figure 2c). These ranges were chosen to allow comparison of the dose-dependent effects between normal and cancer cells.
In PC cell lines, the IC
50 curves (
Figure 2b) showed that Panc-1 had a slightly higher IC
50 value than BxPC-3 (
Table 2), indicating that BxPC-3 was more sensitive to THC. A similar effect was observed in CRC cell lines, where both SW480 and RKO were inhibited to a similar extent, still, the IC
50 curve of SW480 was slightly lower than that of RKO (
Figure 2d), which corresponds to the lower IC
50 value of SW480 shown in
Table 2.
When comparing the two compounds, THC showed lower IC
50 values than NAC across all six cell lines (BxPC-3, Panc-1, BJ-5ta, SW480, RKO, and NCM460) (
Table 1 and
Table 2). In both control cell lines, BJ-5ta and NCM460, the IC
50 values were higher than those of their corresponding cancer cell lines, resulting in SI values greater than 1 (
Table 2). Notably, for CRC cell lines, the SI values were higher with THC than with NAC, while in PC cell lines the SI values were higher with NAC than with THC.
Based on these results, further assays were carried out to examine how THC affects the growth of BxPC-3, Panc-1, SW480, and RKO cells.
3.2. Influence of Postbiotics on the Anticancer Effect of Chemotherapeutic Drugs in Pancreatic and Colorectal Cancer Cell Lines
A cell viability assay was performed to determine whether the presence of postbiotics (NAC or THC) modulated the effect of classical chemotherapeutic agents in colorectal (SW480 and RKO) and pancreatic (BxPC-3 and Panc-1) cancer cell lines, respectively 5-FU and gemcitabine. For this analysis, the IC
50 values of NAC and THC previously calculated (
Table 1 and
Table 2) were used. The concentration of 5-FU in CRC cells (46.68 µM for SW480 and 4.85 µM for RKO) were previously determined using the SRB assay [
12], and the concentration of gemcitabine in PC cells (1 µM for both BxPC-3 and Panc-1) were determined using the Trypan Blue Viability test [
13].
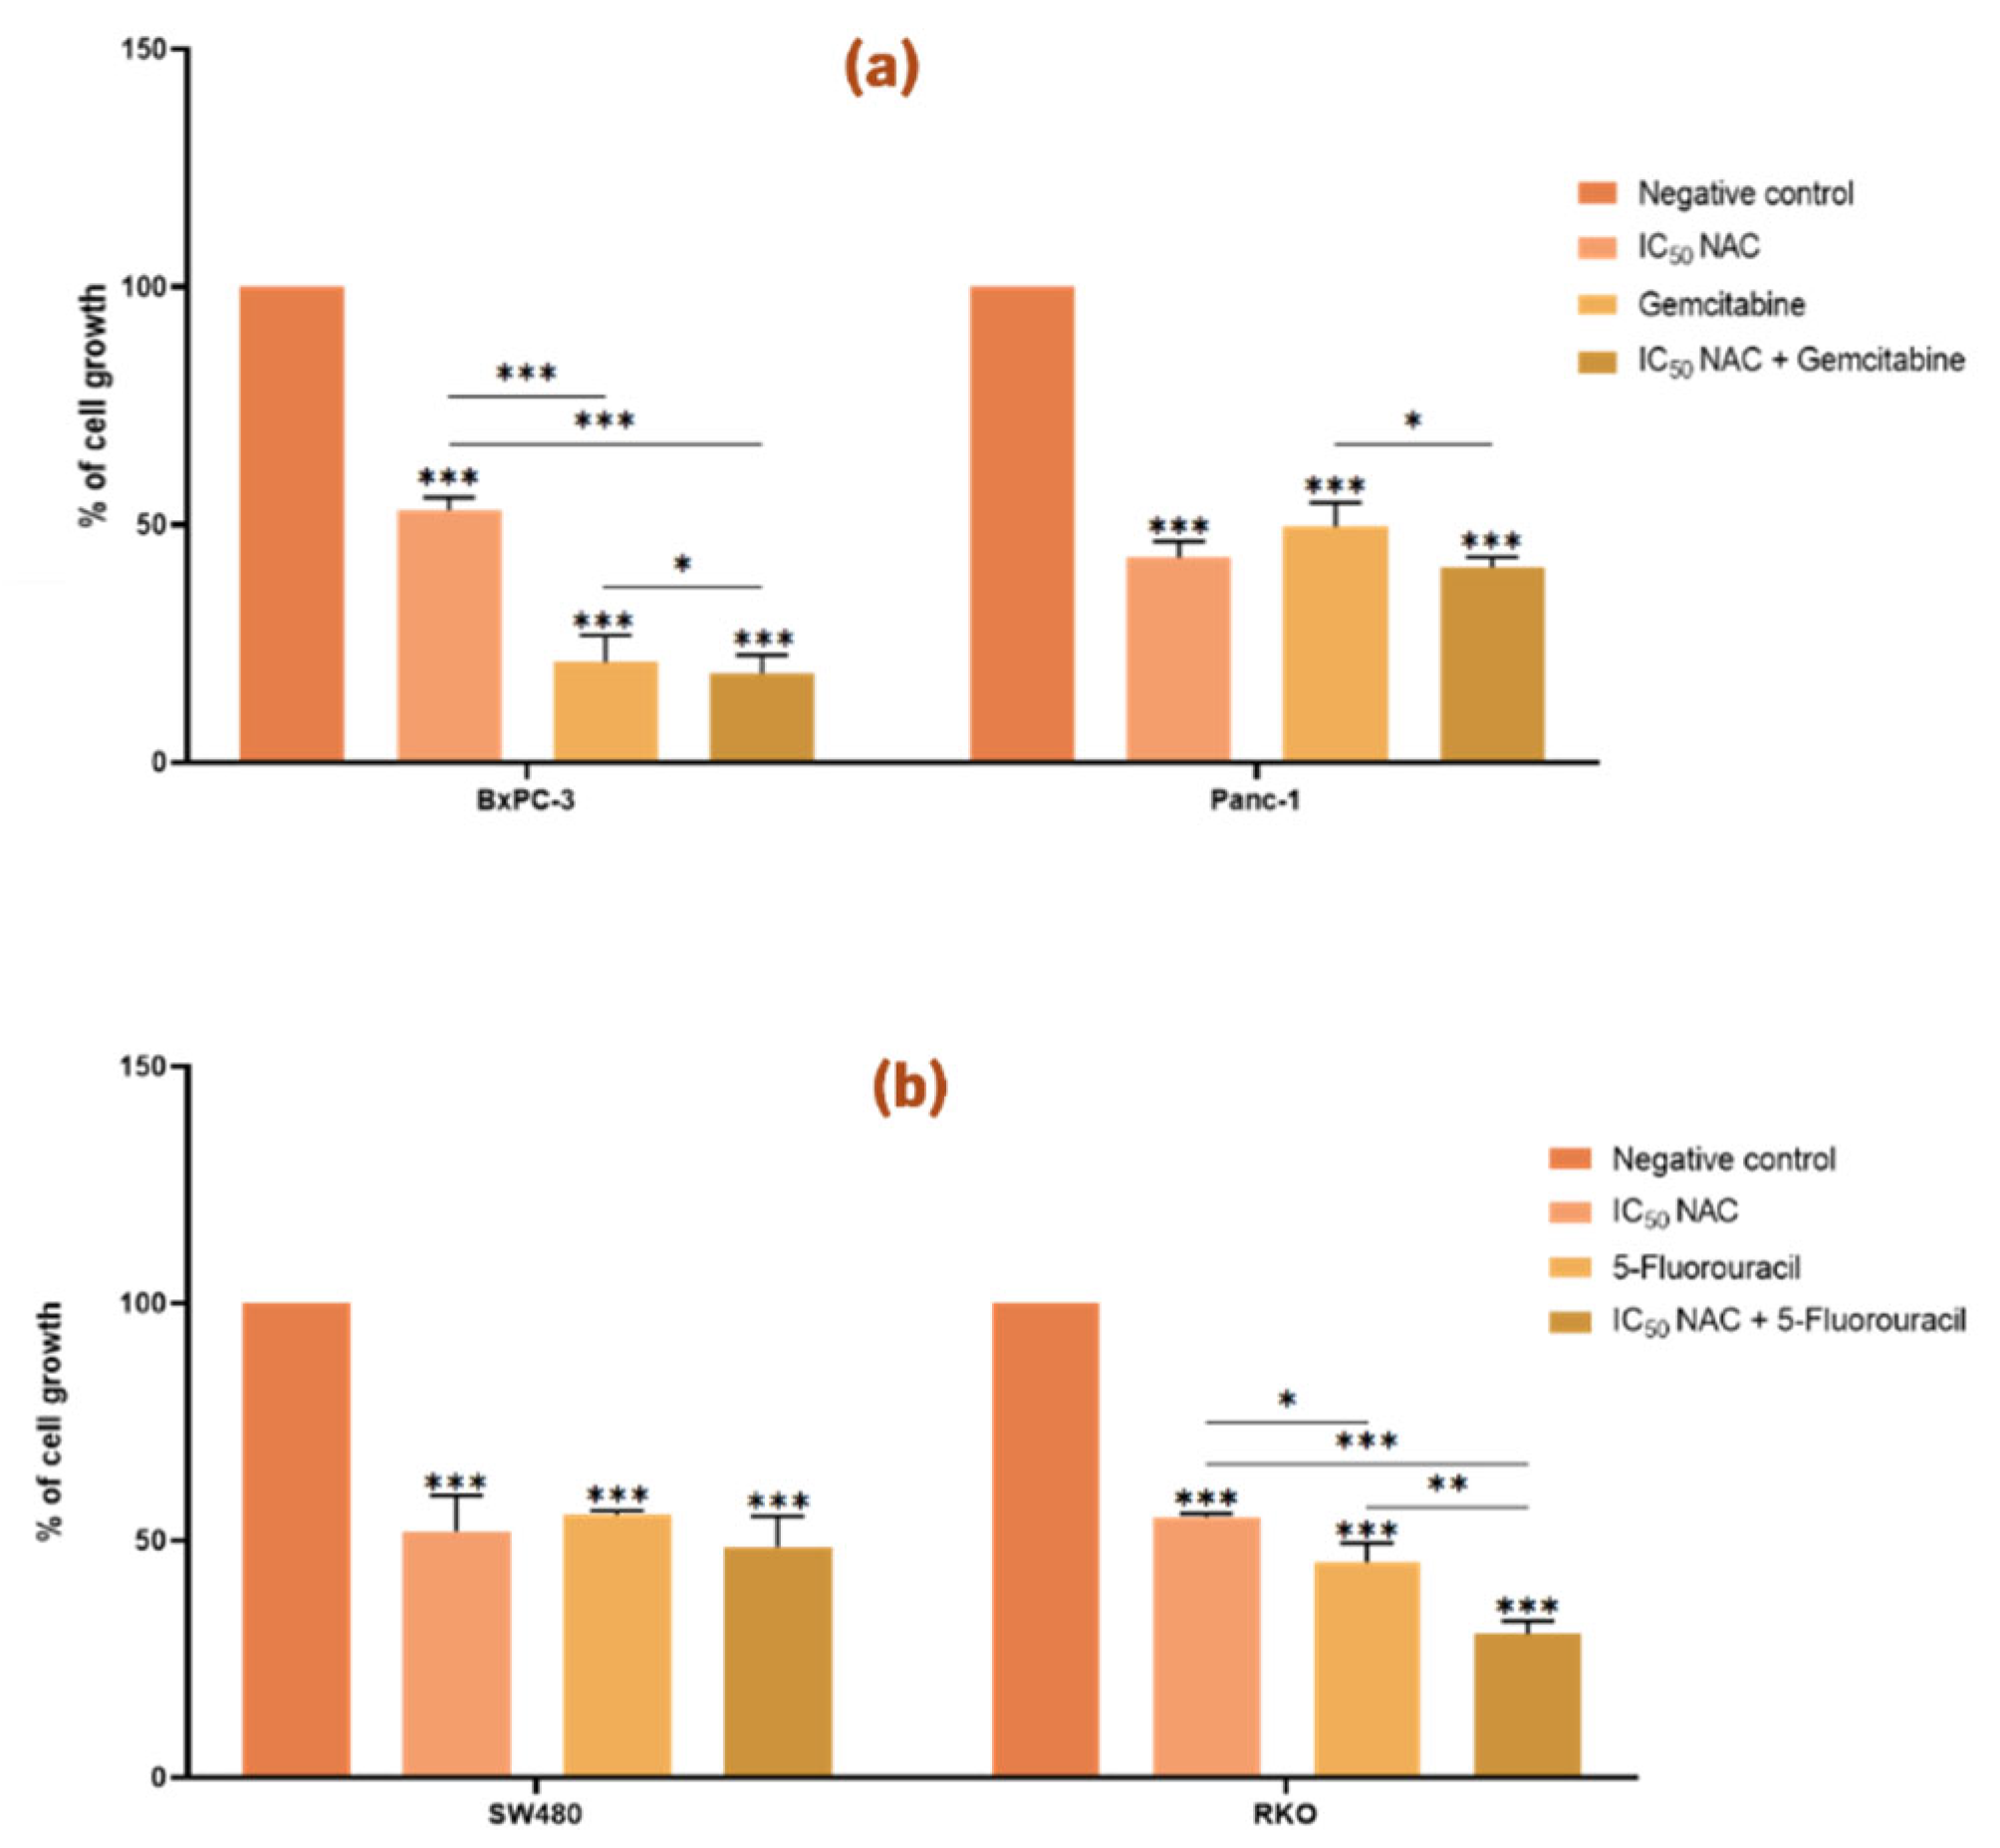
3.2.1. N-Acetylcysteine Enhances the Effect of Gemcitabine and 5-Fluorouracil in the Growth of BxPC-3 and RKO Cell Lines, Respectively
Treatment of both PC and CRC cell lines with NAC in their IC
50 value resulted in a reduction in cell viability compared to the negative control (p < 0.05,
Figure 3). These findings support the cytotoxic effect of NAC on Panc-1, BxPC-3, SW480, and RKO cells, consistent with the results described above.
In PC cells, co-treatment with NAC and gemcitabine significantly enhanced the effect of gemcitabine in BxPC-3, but not in Panc-1 (
Figure 3a). In BxPC-3 cells, cell growth was reduced to 53 % with NAC, 21 % with gemcitabine, and 19 % with the combination, indicating an enhancement in the effect of gemcitabine. In contrast, Panc-1 cells showed a significant difference only between gemcitabine alone and gemcitabine combined with NAC, but not between NAC alone and the combined treatment.
In CRC cells, NAC enhanced the effect of 5-FU in RKO, but not in SW480 (
Figure 3b). In RKO, cell growth was reduced to 55 % with NAC, 46 % with 5-FU, and 30 % with the combination.
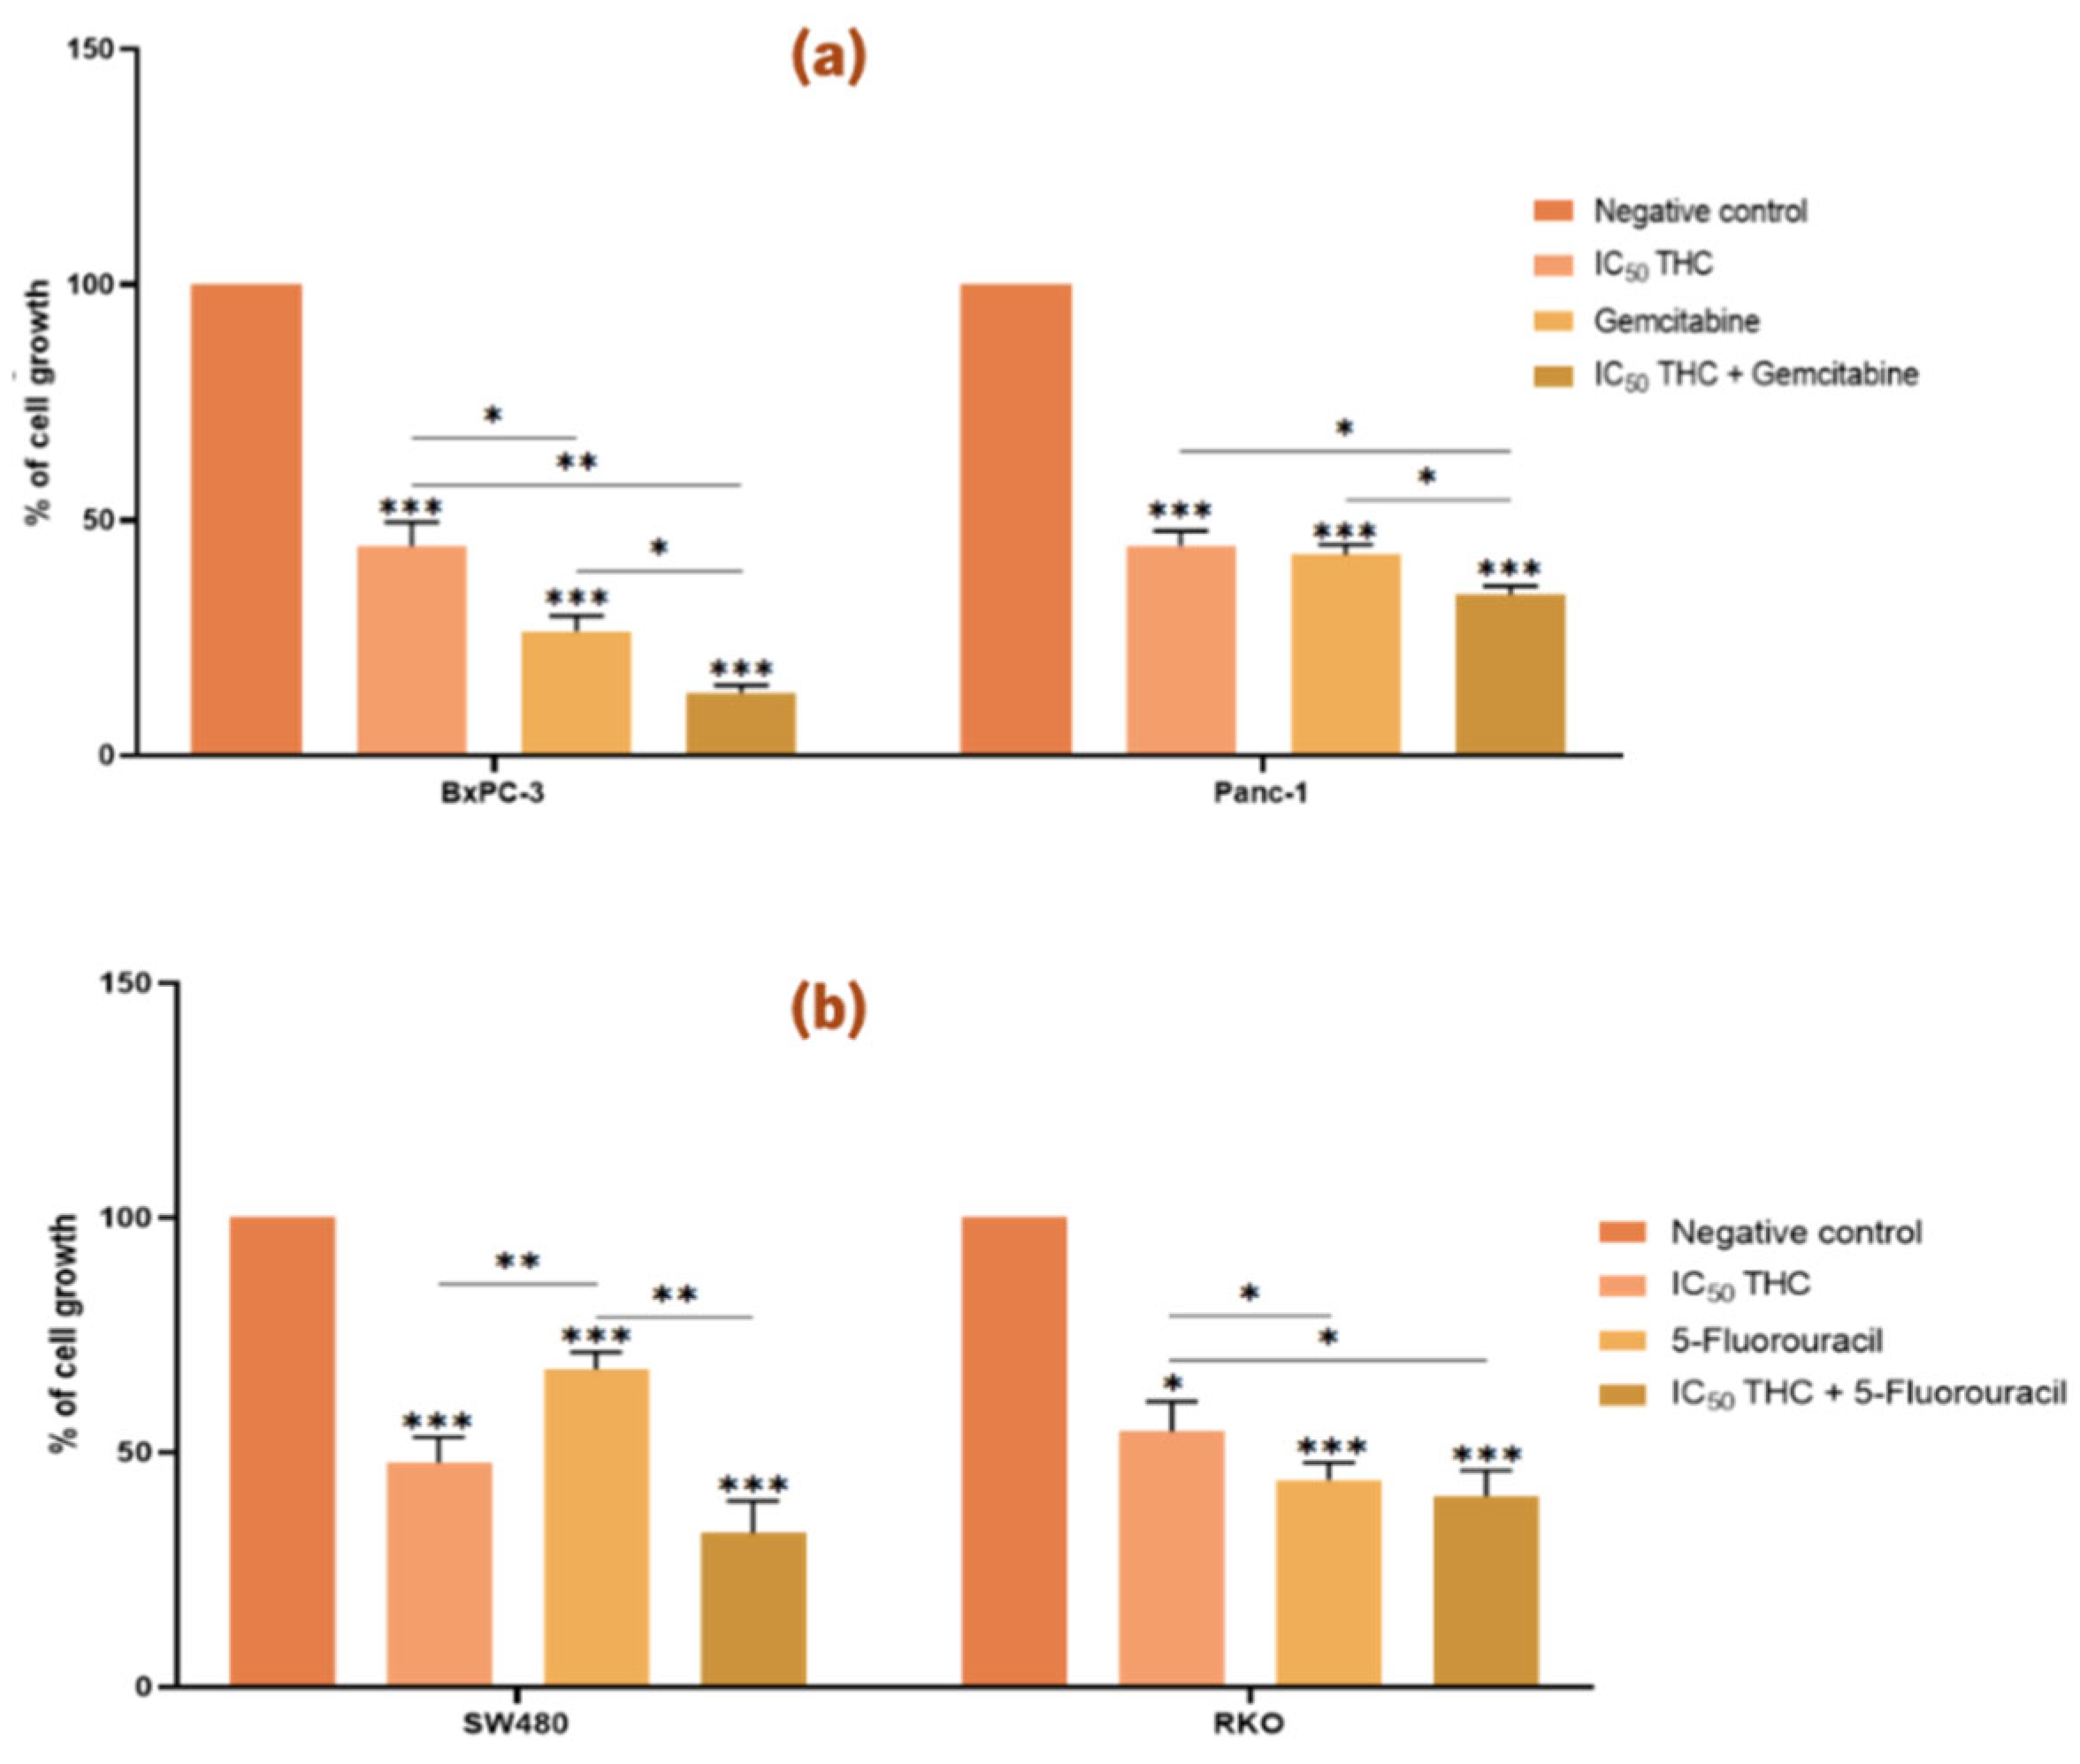
3.2.2. Tetrahydro β-Carboline Carboxylic Acid Enhances the Effect of Gemcitabine on the Growth of Pancreatic Cancer Cell Lines
As shown in
Figure 4, treatment with the IC
50 values of THC resulted in a significant reduction in viability across all four cancer cell lines compared to the negative control.
In PC cells, THC significantly enhanced the effect of gemcitabine in both BxPC-3 and Panc-1 (
Figure 4a). Cell growth was reduced to 45 % (BxPC-3) and 45 % (Panc-1) with THC alone, to 26 % (BxPC-3) and 42 % (Panc-1) with gemcitabine alone, and to 13 % (BxPC-3) and 34 % (Panc-1) with the combination, indicating a stronger inhibitory effect.
In CRC cells, however, THC did not enhance the effect of 5-FU in either SW480 or RKO (
Figure 4b). No significant differences were observed between treatment with each compound alone and the combined treatment.
3.3. Analysis of the Effect of Newly Identified Postbiotics on Apoptosis in Pancreatic and Colorectal Cancer Cell Lines
The effect in programmed cell death, apoptosis, was quantitively analyzed using AV and PI staining. Apoptosis represents a key barrier that cancer cells must overcome to sustain growth and proliferation. It is characterized by specific physiological changes, including the externalization of phosphatidylserine to the outer leaflet of the plasma membrane during the early stages, followed in later stages by the loss of membrane integrity.
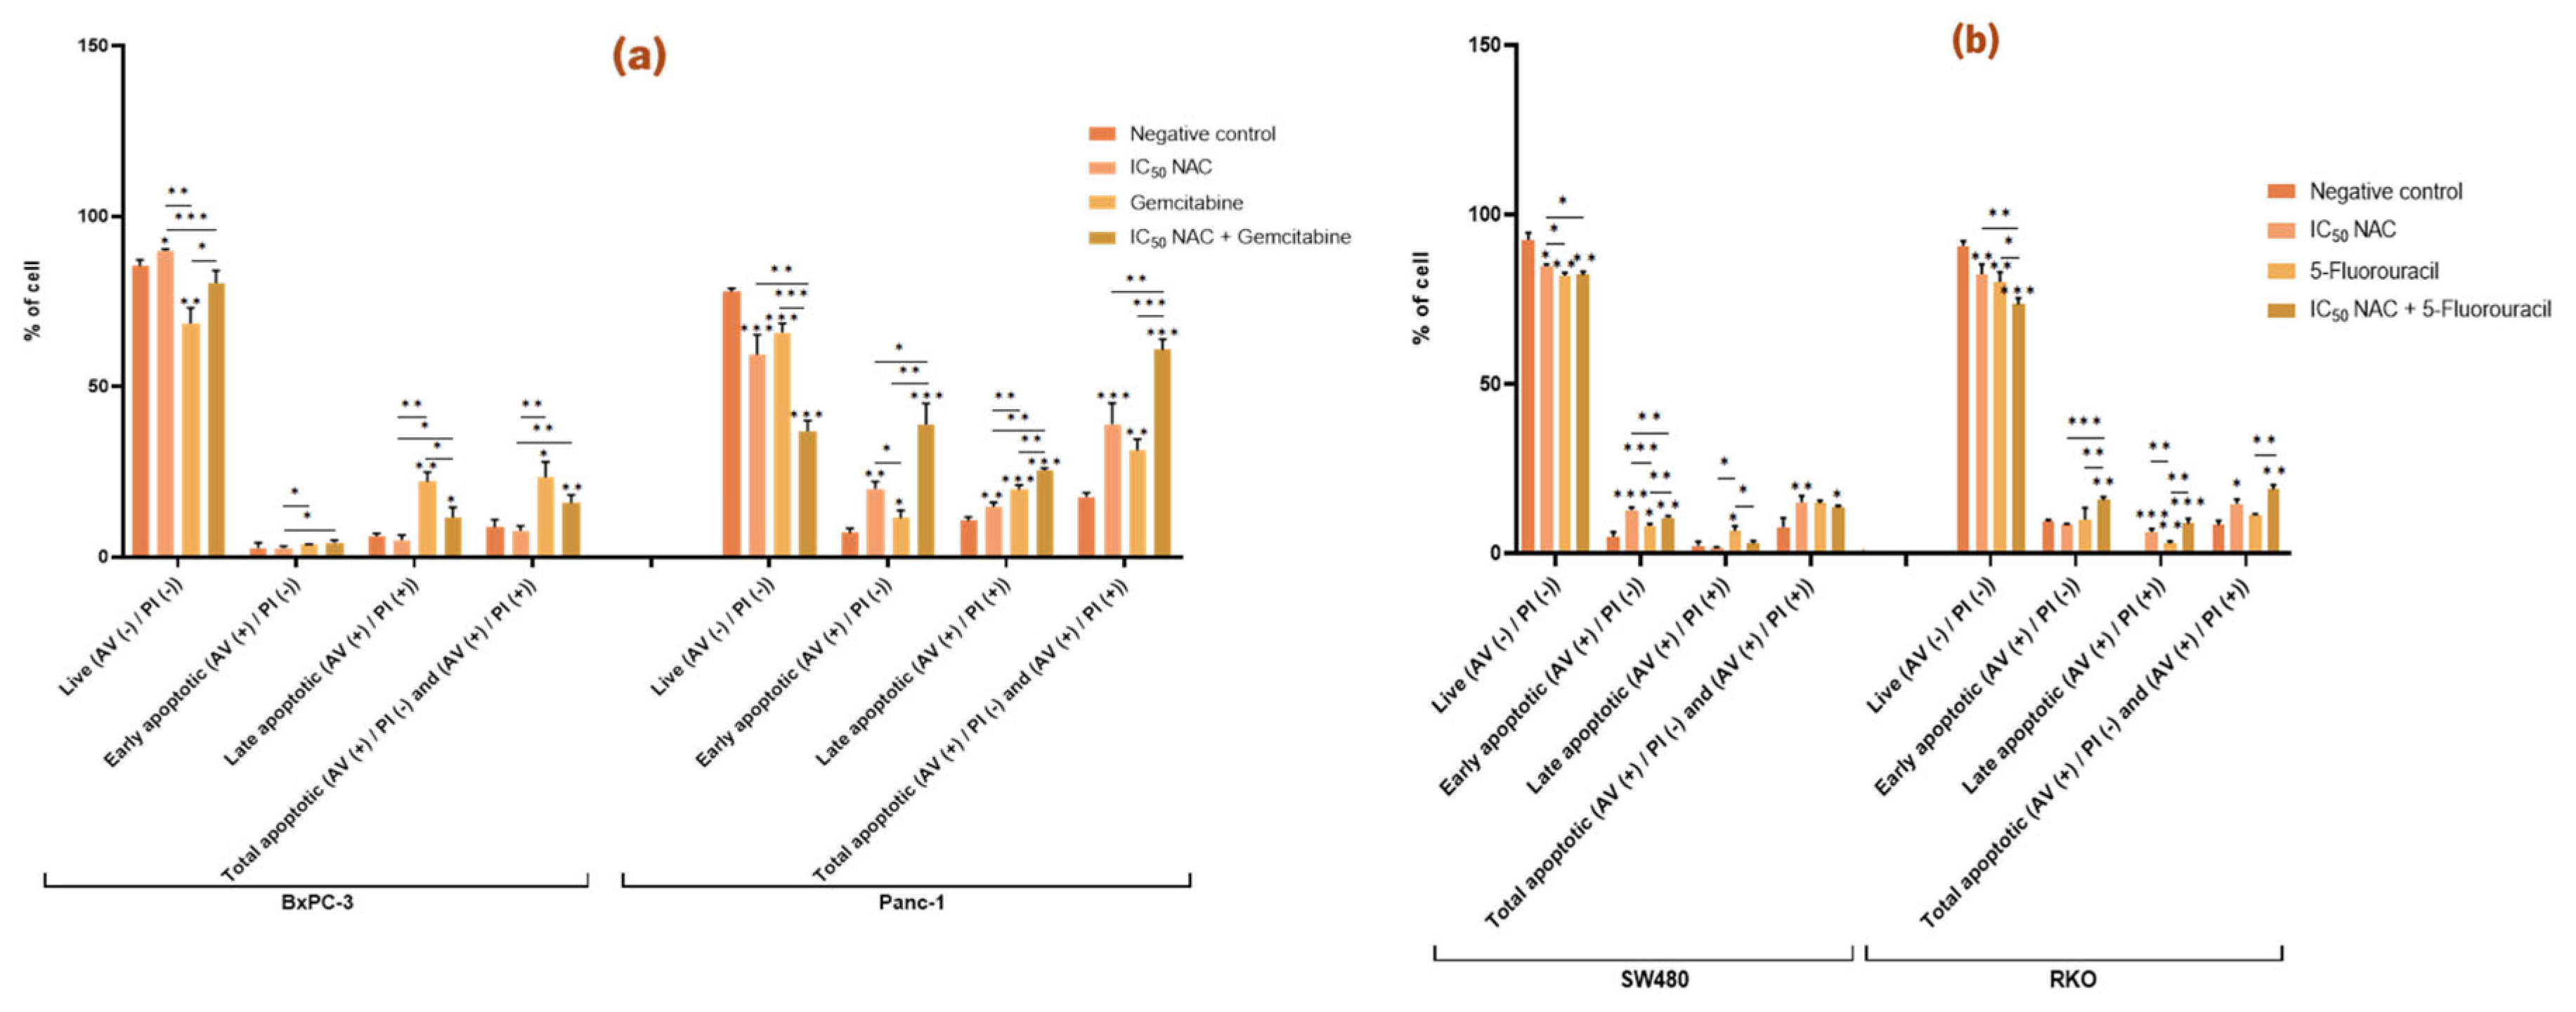
3.3.1. N-Acetylcysteine Induces Apoptosis in Panc-1, SW480, and RKO and Enhances the Pro-Apoptotic Effect of Gemcitabine and 5-Fluorouracil
In BxPC-3 cells, NAC significantly reduced the proportion of live cells compared to the negative control but did not significantly affect the proportion of apoptotic cells. In contrast, NAC treatment in Panc-1 cells significantly decreased the percentage of live cells and increased both early and late apoptosis. Compared with the control (live 78 %, early apoptotic 7 %, late apoptotic 11 %, total apoptotic 18 %), NAC reduced live cells to 59 % and increased apoptosis (early 20 %, late 15 %, total 39 %). These findings indicate that NAC promotes apoptosis in Panc-1 cells (
Figure 5a).
When NAC was combined with gemcitabine, BxPC-3 cells showed significant changes in viability and apoptosis (live cells: NAC 90 %, gemcitabine 69 %, combination 80 %; late apoptotic cells: NAC 5 %, gemcitabine 22 %, combination 12 %). This suggests that NAC modifies gemcitabine’s effect by reducing its impact on both live and late apoptotic cells. In Panc-1, however, co-treatment with NAC and gemcitabine enhanced the cytotoxic effect, with reductions in live cells (NAC 59 %, gemcitabine 66 %, combination 37 %) and increases in early (NAC 20 %, gemcitabine 12 %, combination 39 %), late (NAC 15 %, gemcitabine 20 %, combination 26 %), and total apoptotic cells (NAC 39 %, gemcitabine 31 %, combination 61 %) (
Figure 5a).
In CRC cell lines, NAC also affected apoptosis. In SW480, NAC reduced live cells from 93 % (control) to 85 % and increased early apoptosis from 5 % to 13 %, raising total apoptosis from 8 % to 15 %. In RKO, NAC reduced live cells (91 % to 83 %) and increased late apoptosis (0.3 % to 6 %) and total apoptosis (8% to 15 %) (
Figure 5b).
NAC also enhanced the effect of 5-FU. In SW480, co-treatment resulted in a higher proportion of early apoptotic cells compared to NAC or 5-FU alone (NAC 13 %, 5-FU 8 %, combination 11 %). In RKO, co-treatment reduced live cells (NAC 83 %, 5-FU 80 %, combination 74 %) and increased early apoptosis (NAC 8 %, 5-FU 10 %, combination 16 %). These results indicate that NAC potentiates the pro-apoptotic effect of 5-FU in RKO cells (
Figure 5b).
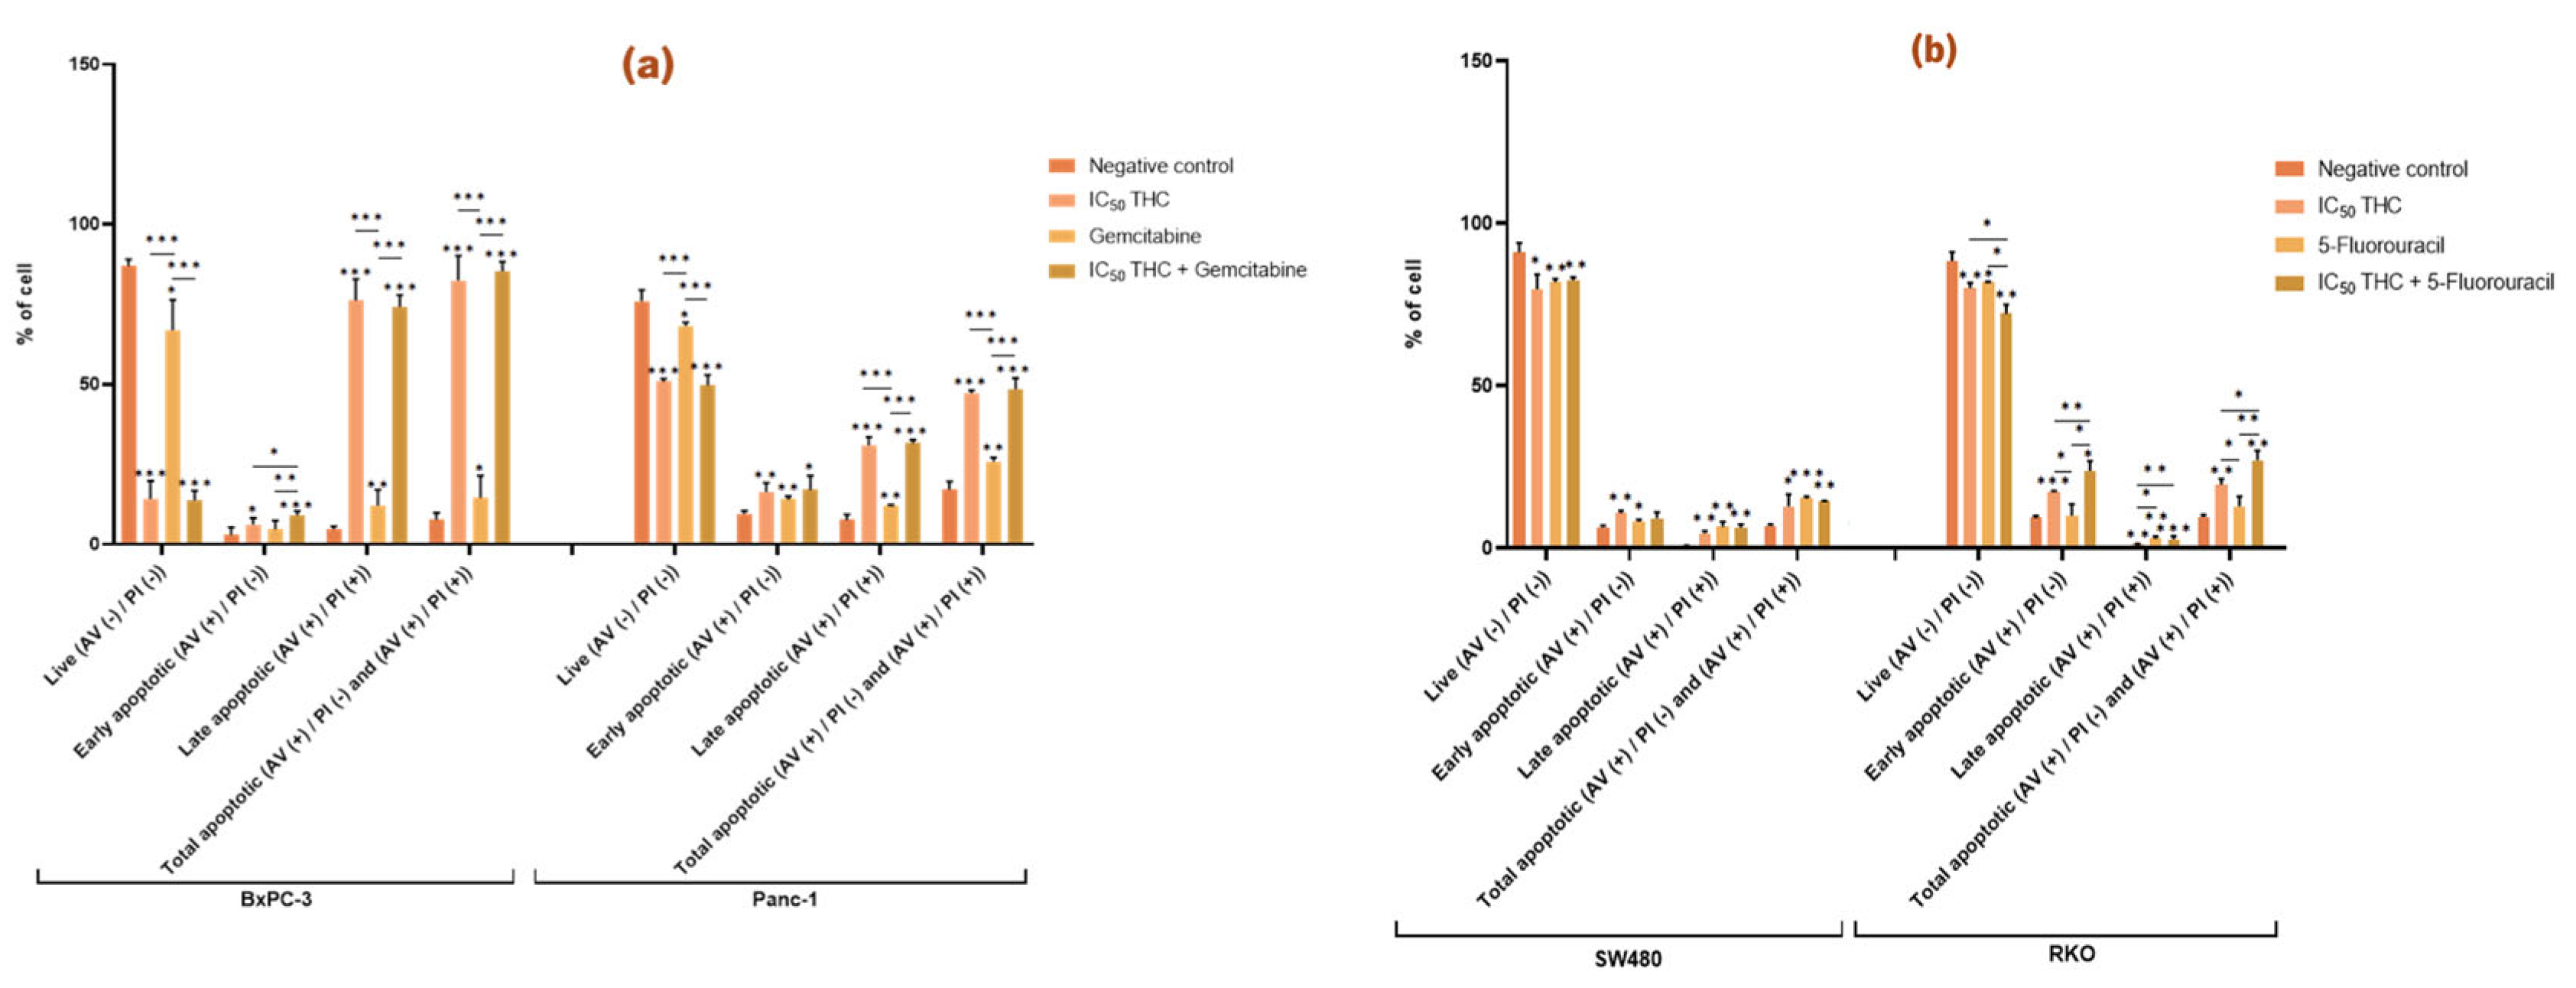
3.3.2. Tetrahydro β-Carboline Carboxylic Acid Affects and Enhances the Effect Gemcitabine and 5-Fluorouracil Have in the Apoptosis of BxPC-3 and RKO Cells, Respectively
THC significantly altered apoptosis in all four cancer cell lines compared to the negative control (
Figure 6). In BxPC-3, THC reduced live cells from 87 % to 14 % and increased apoptosis from 8 % to 83 % (early 6 %, late 76 %). In Panc-1, THC reduced live cells from 76 % to 51 % and increased total apoptosis from 17 % to 47 % (early 16 %, late 31 %) (
Figure 6a).
In BxPC-3 cells, the combination of THC and gemcitabine further increased early apoptosis compared with either treatment alone (gemcitabine 5 %, THC 6 %, and combination 9 %), indicating that THC enhances gemcitabine’s pro-apoptotic effect. This effect, however, was not observed in Panc-1 %) (
Figure 6a).
In CRC cells, THC also significantly increased apoptosis. In SW480, THC reduced live cells (91% to 80 %) and increased early apoptosis (7 % to 11 %), late apoptosis (0.7 % to 5 %) and total apoptosis (7 % to 13 %). In RKO, THC reduced live cells (89 % to 80 %) and increased early apoptosis (9 % to 17 %) and total apoptosis (8 % to 20 %) (
Figure 6b).
Although THC did not enhance the effect of 5-FU in SW480, it did so in RKO. In RKO cells, co-treatment with THC and 5-FU reduced live cells (THC 80 %, 5-FU 82 %, combination 72 %) and increased early apoptosis (THC 17 %, 5-FU 10 %, combination 24 %) and total apoptosis (THC 20 %, 5-FU 13 %, combination 27 %). These findings demonstrate that THC significantly enhances the pro-apoptotic effect of 5-FU in RKO cells (
Figure 6b).
3.4. Analysis of the Effect of Postbiotics on the Cell Cycle of Pancreatic and Colorectal Cancer Cell Lines
Cell cycle analysis was performed by flow cytometry. Ribonuclease A (RNAse A) was added to enhance the specificity of DNA staining performed by PI, which binds stoichiometrically to nucleic acids, thereby allowing discrimination of cells of different stages of the cell cycle (G0/G1, S, and G2/M) based on DNA content.
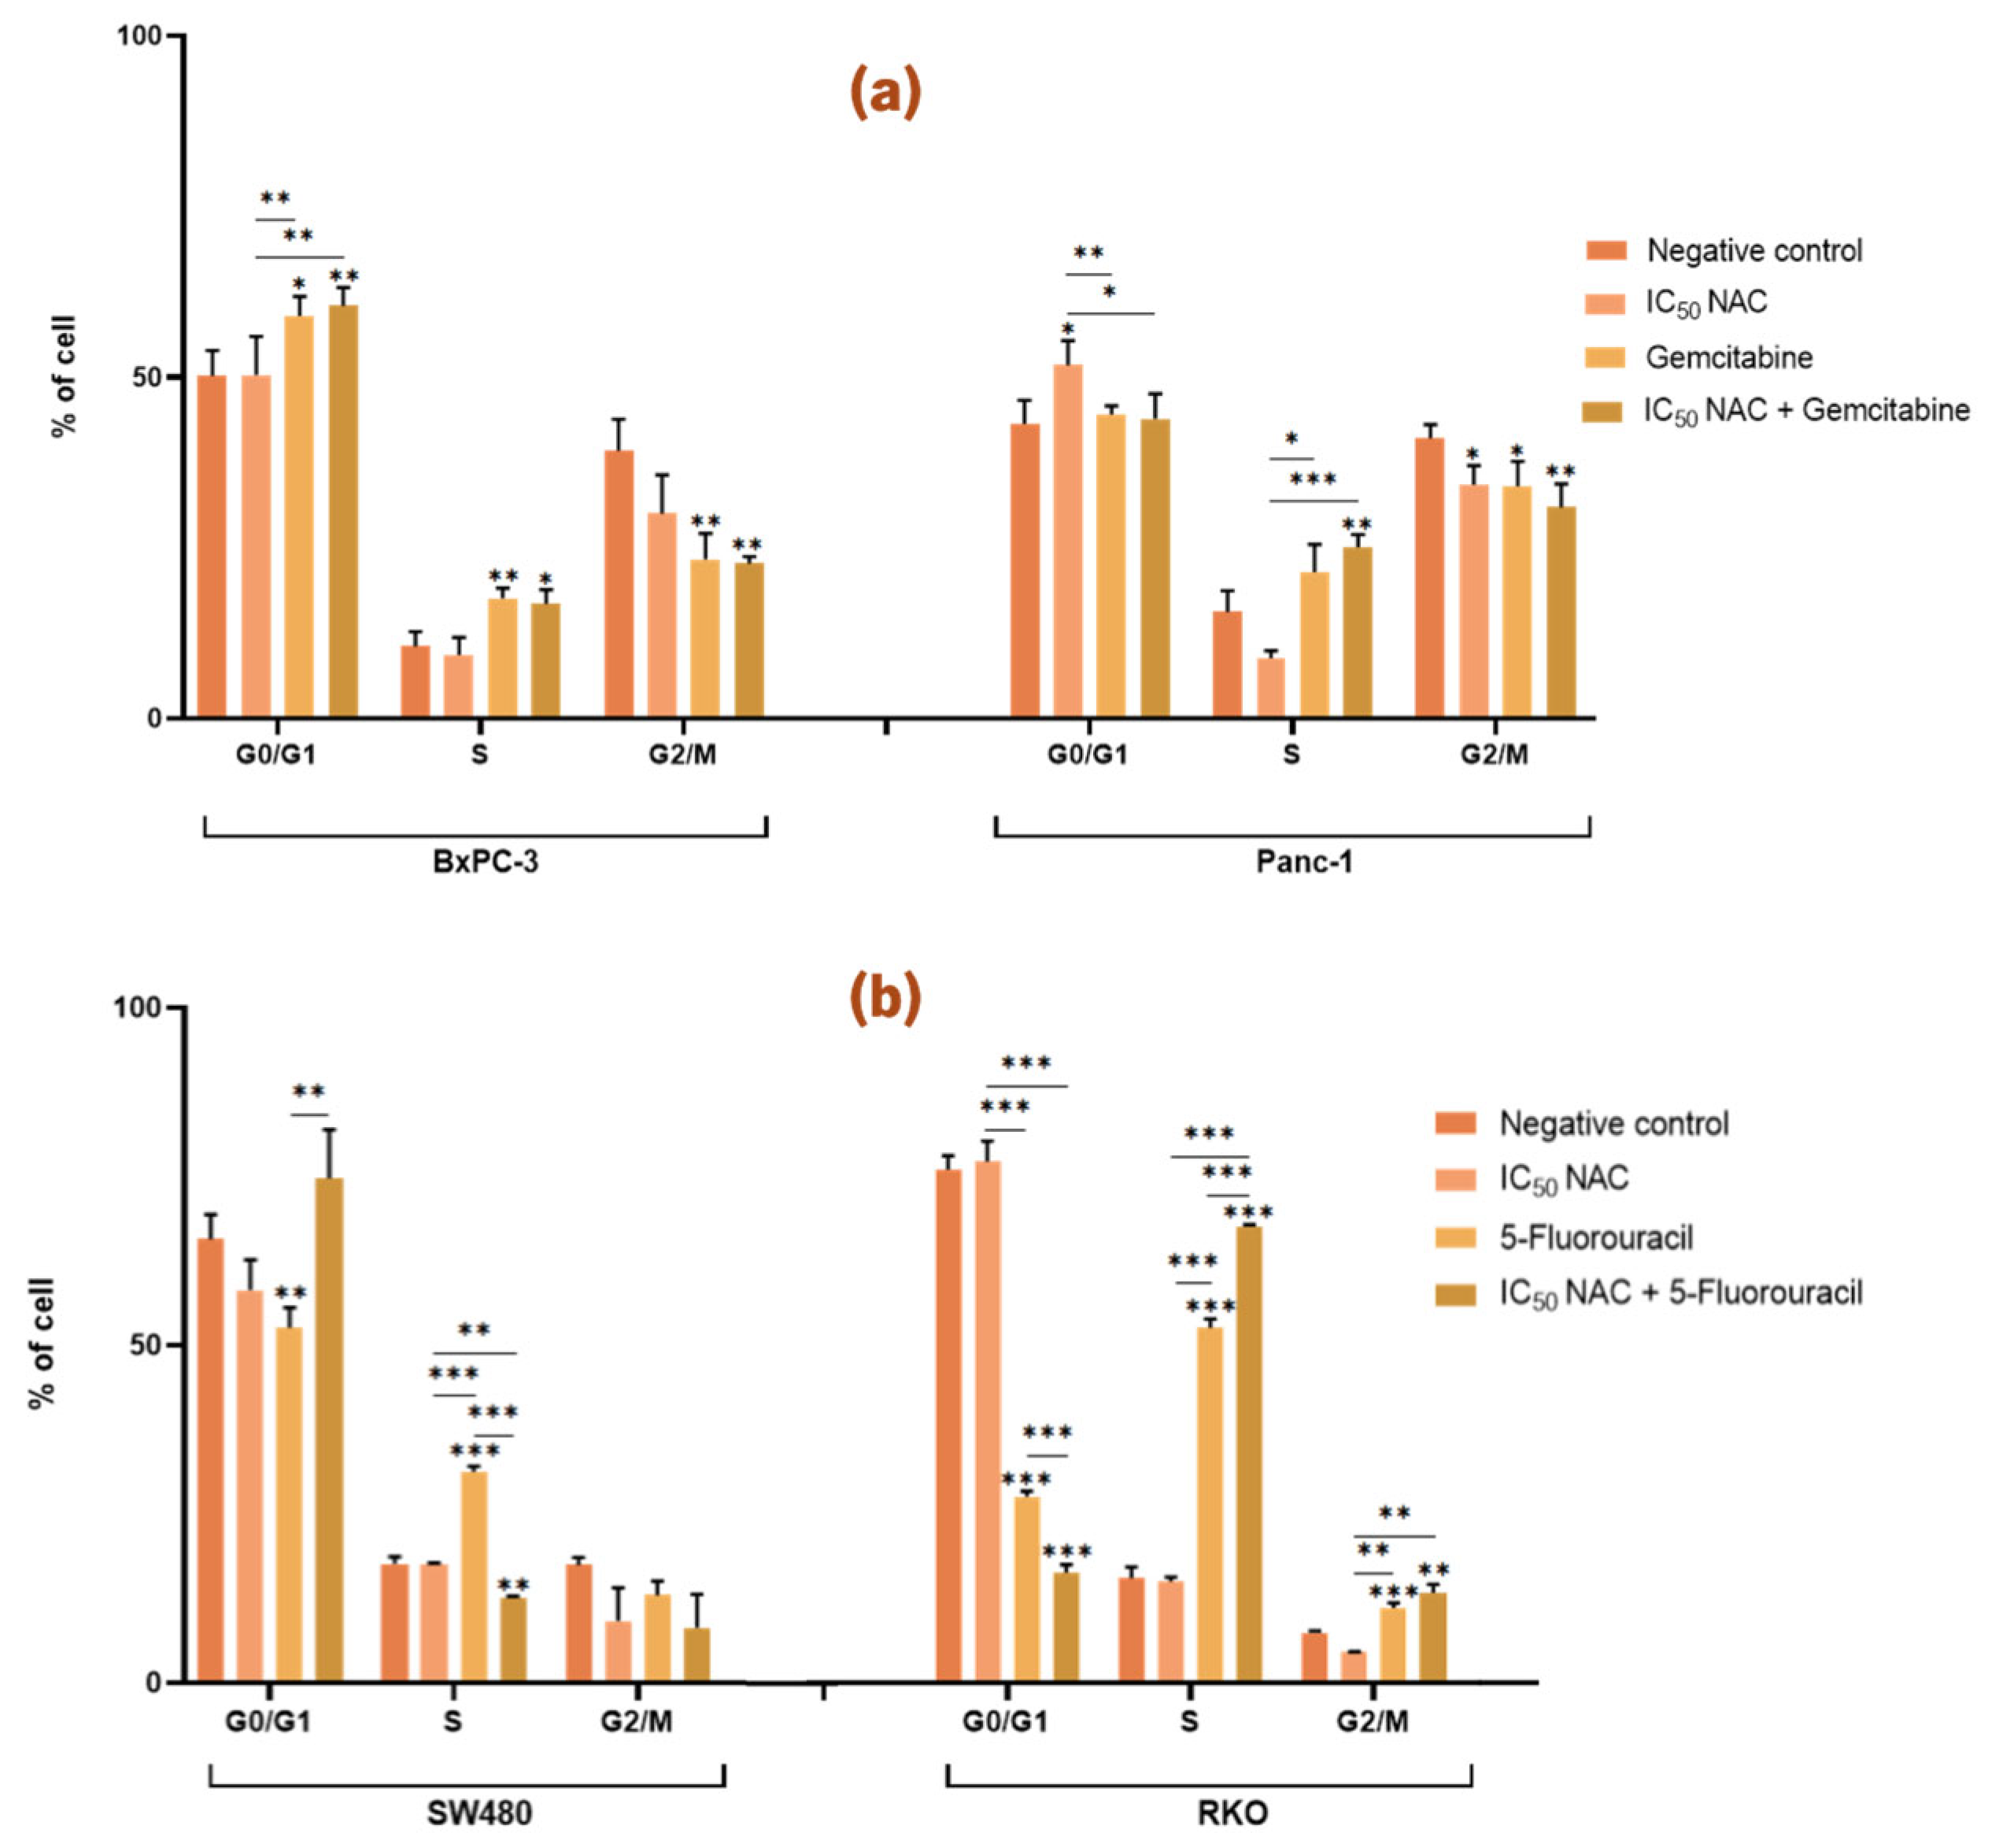
3.4.1. N-Acetylcysteine Affects the Cell Cycle of Panc-1 and Enhances the Effect of 5-Fluorouracil in Colorectal Cancer Cell Lines
In the case of PC cell lines,
Figure 7a shows that treatment with NAC did not affect the cell cycle distribution of BxPC-3 cells when compared with the negative control. Meanwhile, in Panc-1 cells, treatment with NAC resulted in a significant increase in the proportion of cells in the G0/G1 phase and a significant decrease in the proportion of cells in the G2/M phase (G0/G1: 52 %; G2/M: 34 %) compared with the negative control (G0/G1: 43 %; G2/M: 41 %). However, treatment with gemcitabine alone or in combination with NAC did not have any significant differences in cell cycle distribution in either BxPC-3 or Panc-1 cells (
Figure 7a).
For CRC cell lines,
Figure 7b shows that NAC treatment alone did not significantly affect the cell cycle distribution of SW480 or RKO cells compared with the negative control. However, NAC enhanced the effect of 5-FU on both CRC cell lines. In SW480 cells, there was a significant difference in the proportion of cells in the S phase between treatments with NAC, 5-FU and the combination of NAC with 5-FU (NAC: 18 %; 5-FU: 31 %; NAC + 5-FU: 13 %). In RKO cells, significant differences were observed in the G0/G1 and S phases when comparing cells treated with NAC (G0/G1: 77 %; S: 15 %), 5-FU alone (G0/G1: 28 %; S: 53 %), and the combination of NAC with 5-FU (G0/G1: 16 %; S: 68 %). These results suggest that NAC enhances the activity of 5-FU in modulating the cell cycle of CRC cells (
Figure 7b).
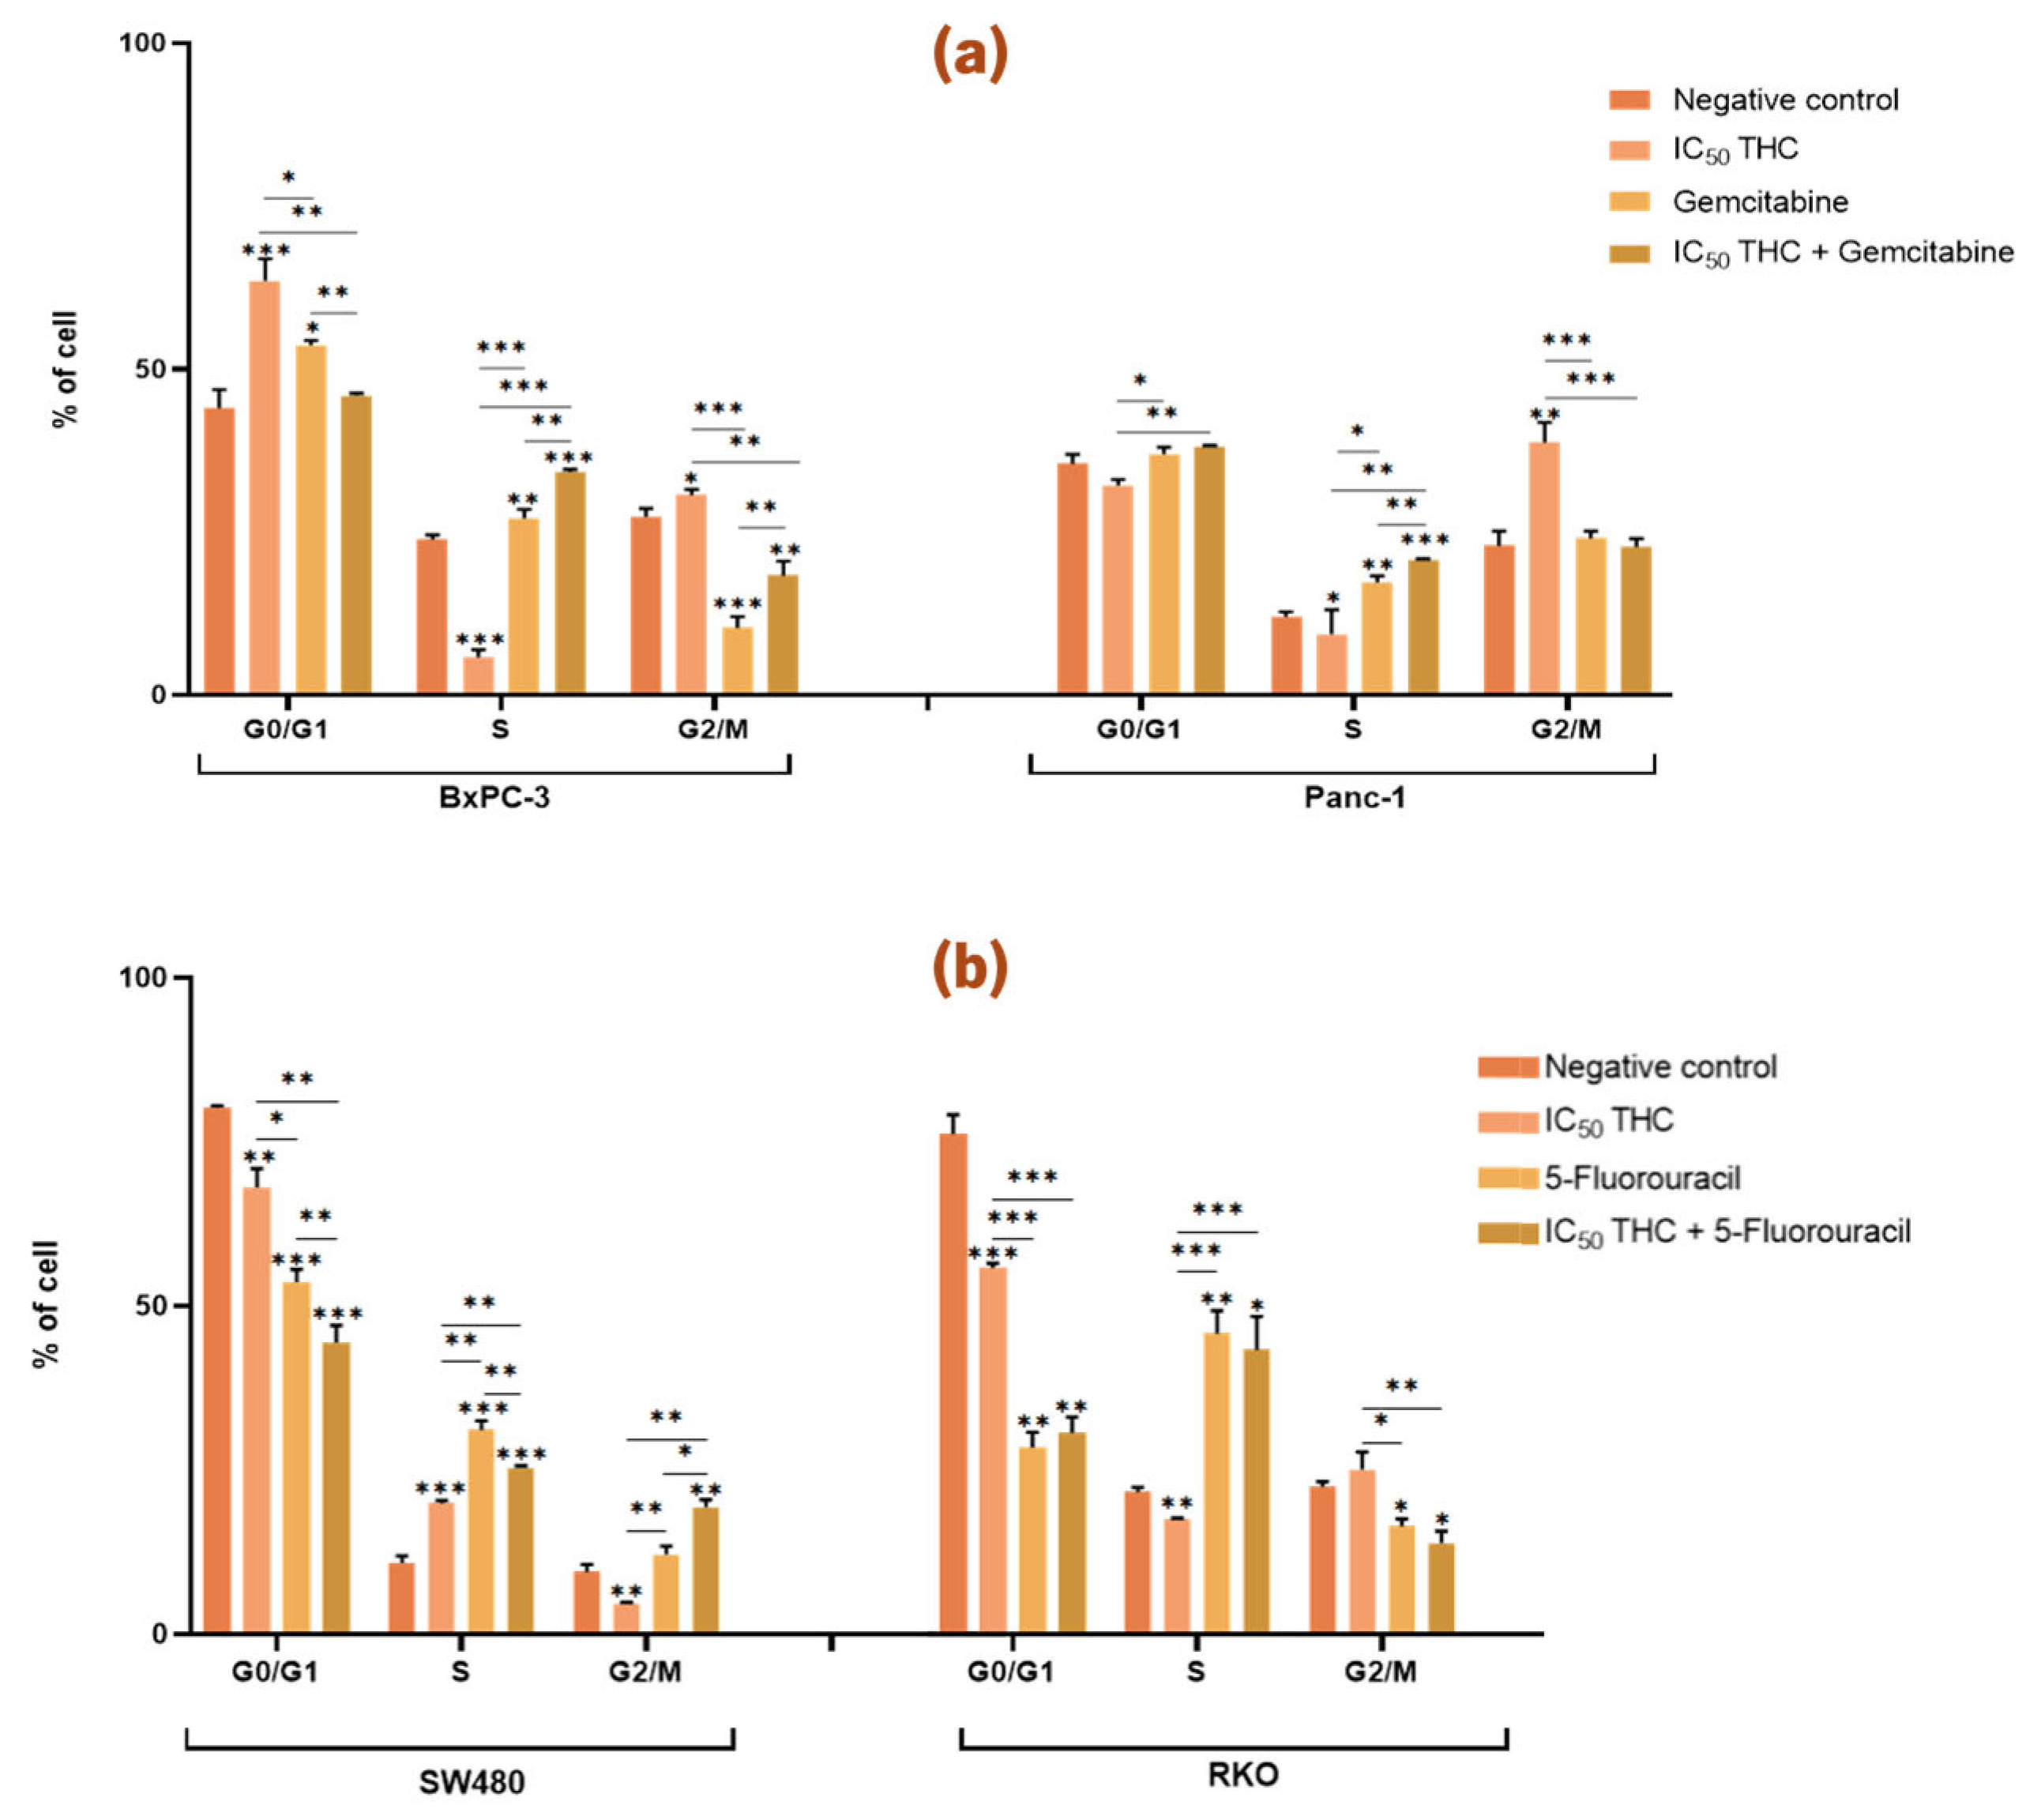
3.4.2. Tetrahydro β-Carboline Carboxylic acid Influences the Cell Cycle of Both Pancreatic and Colorectal Cancer Cell Lines and Enhances the Effects of Gemcitabine and 5-Fluorouracil
Figure 8a illustrates the effects of THC on PC cell lines. In BxPC-3 cells, THC treatment resulted in a significant increase in the proportion of cells in the G0/G1 and G2/M phases, accompanied by a significant decrease in the S phase population (G0/G1: 64 %; S: 6 %; G2/M: 31 %) compared with the negative control (G0/G1: 44 %; S: 24 %, G2/M: 27 %). In Panc-1 cells, THC induced a significant decrease in S phase cells and a significant increase in G2/M cells (S: 9 %; G2/M: 39 %) compared with the negative control (S: 12 %; G2/M: 23 %) (
Figure 8a).
Furthermore, in BxPC-3 cells, comparison of gemcitabine treatment alone with the combination of THC and gemcitabine showed a significant decrease in G0/G1 phase cells (THC: 64 %; Gemcitabine: 54 %; THC + Gemcitabine: 46 %) and a significant increase in S (THC: 6 %; Gemcitabine: 27 %; THC + Gemcitabine: 34 %) and G2/M phase cells (THC: 31 %; Gemcitabine: 10 %; THC + Gemcitabine: 18 %). In Panc-1 cells, the combination of THC and gemcitabine significantly increased the proportion of cells in the S phase (THC: 9 %; Gemcitabine: 17 %; THC + Gemcitabine: 21 %). These results indicate that THC enhances the effects of gemcitabine on the cell cycle of both BxPC-3 and Panc-1 cells (
Figure 8a).
In CRC cell lines,
Figure 8b shows that THC significantly altered the cell cycle of SW480 cells, with differences observed in G0/G1 (68 %), S (20 %), and G2/M (5 %) phases compared with the negative control (G0/G1: 80 %; S: 11 %; G2/M: 10 %). In RKO cells, THC treatment significantly decreased G0/G1 phase cells (56 %) and increased S phase cells (18 %) compared with the negative control (G0/G1: 76 %; S: 22 %) (
Figure 8b).
Moreover, THC enhanced the effect of 5-FU in SW480 cells. Specifically, combined treatment with THC and 5-FU significantly reduced the proportion of cells in G0/G1 and increased the proportion of cells in the S and G2/M phases (G0/G1: 44 %; S: 25 %; G2/M: 19 %) compared with either treatment with THC (G0/G1: 68 %; S: 20 %; G2/M: 5 %) or 5-FU (G0/G1: 54 %; S: 31 %; G2/M: 12 %). In contrast, in RKO cells, THC did not enhance the effects of 5-FU on cell cycle distribution (
Figure 8b).
4. Discussion
Restoring a favorable microbiota has been shown to decrease cancer progression, enhance the efficacy of chemotherapy, and reduce the toxic side effects of anticancer drugs. Consequently, the study of postbiotics in cancer-derived cell lines has gained increasing relevance. The present work aimed to evaluate the effects of two postbiotics, NAC and THC, on cell viability, cell cycle progression, and apoptosis in PC and CRC cell lines. Moreover, the study assessed whether co-administration of these postbiotics with standard chemotherapeutic agents, gemcitabine for PC and 5-FU for CRC, could potentiate their anticancer effects.
Cancer-derived cell lines were selected for this work because they represent reliable and widely used models in cancer research, particularly for testing novel anticancer agents and therapies [
14]. In PC, gemcitabine has demonstrated greater improvements in overall survival and patient-reported outcomes, such as pain reduction, compared to 5-FU, and is therefore considered the standard-of-care treatment [
15,
16,
17,
18]. Nevertheless, resistance to both 5-FU and gemcitabine frequently develop through multifactorial mechanisms. In CRC, 5-FU remains the standard adjuvant chemotherapy for early-stage disease and the first-line option for metastatic CRC.
The genetic background of the selected PC and CRC cell lines was also taken into consideration. KRAS is the most frequently mutated oncogene in cancer and is constitutively active in approximately 95 % of PC cases. For this reason, a KRAS wild-type cell line (BxPC-3) and a KRAS
G12D mutant cell line (Panc-1) were included in this study. In CRC, KRAS mutations are present in ~40 % of patients, while BRAF mutations occur in 8-15 % of cases. Importantly, KRAS and BRAF mutations are mutually exclusive [
19,
20,
21]. Oncogenic KRAS mutations activate downstream signaling pathways, most notably phosphatidylinositol 3-kinase (PI3K) and mitogen-activated protein kinase (MAPK), which regulate cell proliferation, differentiation, and survival [
22,
23,
24,
25,
26,
27,
28,
29]. Thus, to include these molecular features, two CRC cell lines were used, SW480 carrying the KRAS
G12V mutation, and RKO, harboring the BRAF
V600E mutation.
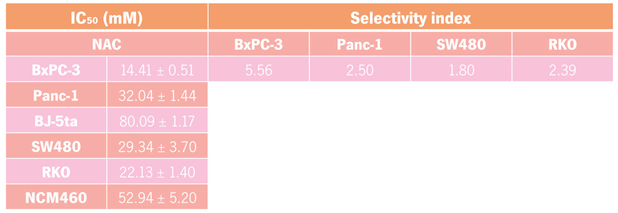
The experiments demonstrated that NAC exerts a dose-dependent cytotoxic response across the four cancer cell lines. In BxPC-3 cells, the IC
50 value was 14.41 mM, with a SI of 5.56 when compared to the non-malignant BJ-5ta control. Although NAC significantly reduced cell viability, it did not markedly affect the cell cycle. Apoptosis assays indicated an increase in live cells, suggesting that NAC may induce alternative non-apoptotic forms of cell death, such as necroptosis, autophagic cell death, pyroptosis or caspase-independent pathways [
30]. This aligns with studies showing that NAC promotes necroptosis and autophagy in BxPC-3 cells by modulating ROS production [
31].
In Panc-1 cells, NAC displayed an IC
50 of 32.04 mM (SI = 2.50) and induced cell cycles alterations, including an increase in G0/G1 and a decrease in G2/M phase cells, consistent with cell cycle arrest. This finding corroborates previous reports showing NAC-mediated G0/G1 accumulation in other pancreatic cell lines [
32]. Apoptosis assays further suggested that NAC enhances apoptotic pathways, consistent with studies in cardiac H9c2 cells and gastrointestinal cancer cell lines, where NAC activated caspase cascades, cytochrome c release, and altered Bax/Bcl-2 ratios [
33,
34,
35]. A study in human leukemia HL-60 and U937 cells treated with NAC showed an increase in ROS levels, particularly superoxide radical O
2•− which is converted into H
2O
2 by superoxide dismutase (SOD) ultimately leading to cell death which could indicate an increase in cell damage and death [
36].
In SW480 cells, the IC
50 was 29.34 mM (SI = 1.80). Although NAC did not significantly alter the cell cycle, it reduced viability by increasing apoptotic cell populations. However, contradictory evidence exists, for instance, NAC has been shown to reduce ROS and apoptosis in other CRC lines exposed to pro-apoptotic agents [
37]. In RKO cells, the IC
50 was 22.13 mM (SI = 2.39). NAC did not significantly affect cell cycle but decreased live cell populations while increasing apoptotic cells, suggesting activation of apoptotic pathways. Interestingly, NAC has also been reported to enhance necrosis and inflammatory responses through TNF-α/TNF-R signaling, which could influence the tumor microenvironment by promoting immune activity but also potentially harming surrounding tissues [
38,
39,
40].
THC exhibited greater potency than NAC, with lower IC50 values across all cancer cell lines. In BxPC-3 cells, THC showed an IC50 of 6.05 mM (SI = 1.86) and induced cell cycle arrest, reducing S phase cells while increasing G0/G1 and G2/M populations. This suggests disrupted DNA replication and potential apoptosis, confirmed by increased apoptotic cell populations. Similar effects were observed in Panc-1 cells (IC50 = 7.47 mM; SI = 1.51), where THC reduced S phase cells and increased G2/M populations, consistent with apoptosis induction.
THC was particularly effective in CRC cell lines. In SW480, it displayed an IC
50 of 2.22 mM (SI = 9.29), inducing apoptosis by promoting S phase accumulation and reducing G0/G1 and G2/M phases. In RKO cells, THC (IC
50 =2.90 mM; SI = 7.11) disrupted cell cycle regulation, decreasing G0/G1 and S phases while increasing apoptotic populations. These findings are consistent with previous studies showing β-carboline derivatives induce apoptosis via Bax/Bcl-2 modulation, cytochrome c release, caspase activation, and inhibition of NF-κB signaling [
41,
42,
43,
44].
For both postbiotics, SI values were consistently > 1, indicating preferential cytotoxicity toward cancer cells over non-malignant controls [
45]. This result strongly suggests that these postbiotics NAC and THC are selective to cancer cells. The calculated IC
50 values for both PC and CRC cell lines seem in accordance with previous doses used in other work where the IC
50 dose calculated for bladder cancer cells was 33.33 mM [
46]. In Wang et al., 2012 it was observed that THC had a dose-dependent response at 0.5-4 μM in HCT-8 cells with an IC
50 of 4 μM, which is almost 1000x more than the observed IC
50 values in the PC and CRC cell lines in our study [
46]. The difference in the resistant of SW480 and RKO cells when compared to HCT-8 cell could be explained by the mutations present in SW480 and RKO, while the difference between the PC cell lines and the HCT-8 cells suggests that the colorectal HCT-8 cell line is more sensitive to PC cells which is corroborated by an in vitro study performed to understand the sensitivity of colorectal and PC to 5-FU in 2D and 3D culture models showed that colorectal SW948 and HCT116 cells were more sensitive than pancreatic MIA PaCa-2 and Panc-1 cells [
47]. Notably, Panc-1 cells exhibited higher IC
50 values than BxPC-3, potentially due to their EMT phenotype, which is associated with increased invasiveness and drug resistance [
48,
49]. Similarly, RKO cells showed lower IC
50 values than SW480, consistent with EMT features and enhanced invasiveness [
50]. These differences highlight the impact of genetic and phenotypic backgrounds on postbiotic sensitivity.
Both postbiotics seem promising and because of the known effects of postbiotics in chemotherapy drugs [
7,
51], the combination studies were performed and revealed that NAC enhanced gemcitabine efficacy only in BxPC-3 cells, particularly by increasing apoptosis. This is in agreement with studies showing NAC reduced NF-κB activity and enhances ROS production, thereby sensitizing PC cells to gemcitabine [
40,
52]. Conversely, NAC enhanced 5-FU effects in RKO but not SW480 cells. Interestingly, NAC promoted progression into S phase in RKO when combined with 5-FU, suggesting potential antagonism in cell cycle regulation despite pro-apoptotic effects.
THC demonstrated more consistent synergistic effects with gemcitabine in both BxPC-3 and Panc-1 cells, enhancing S phase arrest and apoptosis. However, no significant enhancement was observed with 5-FU in CRC lines, except for modest effects on apoptosis in RKO cells. Overall, THC appeared more potent and consistent than NAC across both PC and CRC cell lines. The co-administration experiments demonstrated that postbiotics can enhance chemotherapy effectiveness, particularly with gemcitabine in PC. This aligns with studies showing β-carboline derivatives increase chemotherapy sensitivity [
53,
54,
55,
56]. Notably, the potential involvement of PDE5 inhibition by THC derivatives may further explain the enhancement effects with chemotherapeutics.
Overall, this work provides new evidence that postbiotics can differentially modulate cancer cell behavior and selectively enhance chemotherapy responses depending on the genetic background of the tumor.
5. Conclusions
This study demonstrated that the postbiotics NAC and THC exert anticancer effects in PC and CRC cell lines by modulating cell viability, cell cycle progression, and apoptosis. Both compounds exhibited dose-dependent cytotoxicity with selectivity index above 1, suggesting reduced effect toward non-malignant cells and increased cytotoxicity to cancer cells. Importantly, THC consistently disrupted the cell cycle and induced apoptosis across all tested cell lines, indicating a stronger potential use as an adjuvant anticancer agent compared with NAC.
Furthermore, the co-administration of NAC or THC with standard chemotherapeutic drugs enhanced the anticancer efficacy of these agents in specific cell lines. The combination treatments reduced cell viability and promoted apoptosis more effectively than single treatments, supporting the hypothesis that postbiotics may act synergistically with conventional chemotherapy. Taken together, these findings provide new insights into the potential application of postbiotics as adjuvants in both PC and CRC cancer therapy.
Author Contributions
Conceptualization, AP. and VP.; methodology, VR, AV, CP.; software, VR; validation, VR, AV, CP.; formal analysis, VR, AV, CP, VP, AP; investigation, VR, AV, CP, VP, AP; resources, VP, AP.; data curation, AP, VP.; writing—original draft preparation, VR.; writing—review and editing, VR, AV, CP, VP, AP.; visualization, VR, AV, CP, VP, AP.; supervision, VP, AP.; project administration, VP, AP.; funding acquisition, VP, AP. All authors have read and agreed to the published version of the manuscript.
Funding
“ V.P. research was funded by “Associazione Italiana Ricerca sul Cancro (AIRC) under IG 2019 - ID. 23006 project”. This work was also supported by “Contrato-Programa” UIDB/04050/2020 funded by national funds through the Portuguese Foundation for Science and Technology (Fundação para a Ciência e a Tecnologia, FCT) I.P; UID/04050 – Centre of Molecular and Environmental Biology. VR thanks ERASMUS program for her Grant. VR acknowledges support from the Erasmus+ Programme of the European Union through a mobility/traineeship grant.
Institutional Review Board Statement
Not applicable
Informed Consent Statement
Not applicable
Data Availability Statement
The raw data supporting the conclusions of this article will be made available by the authors on request.
Acknowledgments
Not applicable
Conflicts of Interest
The authors declare no conflicts of interest.
Abbreviations
The following abbreviations are used in this manuscript:
| 5-FU |
5-Fluorouracil |
| AV |
Annexin V |
| CFSs |
Cell-free supernatants |
| CRC |
Colorectal cancer |
| DMEM |
Dulbecco’s Modified Eagle’s Medium |
| DMSO |
Dimethyl sulfoxide |
| DNA |
Deoxyribonucleic acid |
| EMT |
Epithelial-mesenchymal transition |
| FBS |
Fetal bovine serum |
| IC50 |
Half-maximal inhibitory concentration |
| KRAS |
Kirsten RAS |
| MAPK |
Mitogen-activated protein kinase |
| NAC |
N-acetylcysteine |
| PBS |
Phosphate buffer saline |
| PC |
Pancreatic cancer |
| PDAC |
Pancreatic ductal adenocarcinoma |
| PDE5 |
Phosphodiesterase 5 |
| PI |
Propidium iodide |
| PI3K |
Phosphatidylinositol 3-kinase |
| PS |
Phosphatidylserine |
| RNAse A |
Ribonuclease A |
| ROS |
Reactive oxygen species |
| RPMI |
Roswell Park Memorial Institute Medium |
| SD |
Standard deviation |
| SI |
Selectivity index |
| SOD |
Superoxide dismutase |
| SRB |
Sulforhodamine B assay |
| THC |
Tetrahydro β carboline carboxylic acid |
| TNF-R |
Tumor necrosis factor receptor |
| TNFα |
Tumor necrosis factor α |
References
- Davodabadi, F.; Sajjadi, S.F.; Sarhadi, M.; Mirghasemi, S.; Hezaveh, M.N.; Khosravi, S.; Andani, M.K.; Cordani, M.; Basiri, M.; Ghavami, S. Cancer chemotherapy resistance: Mechanisms and recent breakthrough in targeted drug delivery. Eur. J. Pharmacol. 2023, 958, 176013. [Google Scholar] [CrossRef] [PubMed]
- Curini, L.; Amedei, A. Cardiovascular Diseases and Pharmacomicrobiomics: A Perspective on Possible Treatment Relevance. Biomedicines 2021, 9, 1338. [Google Scholar] [CrossRef]
- Hanahan, D. Hallmarks of Cancer: New Dimensions. Cancer Discov. 2022, 12, 31–46. [Google Scholar] [CrossRef] [PubMed]
- Hou, K.; Wu, Z.-X.; Chen, X.-Y.; Wang, J.-Q.; Zhang, D.; Xiao, C.; Zhu, D.; Koya, J.B.; Wei, L.; Li, J.; et al. Microbiota in health and diseases. Signal Transduct. Target. Ther. 2022, 7, 1–28. [Google Scholar] [CrossRef] [PubMed]
- Bagheri, Z.; Moeinzadeh, L.; Razmkhah, M. Roles of Microbiota in Cancer: From Tumor Development to Treatment. J. Oncol. 2022, 2022, 1–15. [Google Scholar] [CrossRef] [PubMed]
- Pandey, K.R.; Naik, S.R.; Vakil, B.V. Probiotics, prebiotics and synbiotics—A review. J. Food Sci. Technol. 2015, 52, 7577–7587. [Google Scholar] [CrossRef]
- Panebianco, C.; Andriulli, A.; Pazienza, V. Pharmacomicrobiomics: exploiting the drug-microbiota interactions in anticancer therapies. Microbiome 2018, 6, 1–13. [Google Scholar] [CrossRef]
- Panebianco, C.; Pisati, F.; Ulaszewska, M.; Andolfo, A.; Villani, A.; Federici, F.; Laura, M.; Rizzi, E.; Potenza, A.; Latiano, T.P.; et al. Tuning gut microbiota through a probiotic blend in gemcitabine-treated pancreatic cancer xenografted mice. Clin. Transl. Med. 2021, 11, e580. [Google Scholar] [CrossRef]
- Tsilingiri, K.; Rescigno, M. Postbiotics: what else? Benef. Microbes 2013, 4, 101–107. [Google Scholar] [CrossRef]
- Skehan, P.; Storeng, R.; Scudiero, D.; Monks, A.; McMahon, J.; Vistica, D.; Warren, J.T.; Bokesch, H.; Kenney, S.; Boyd, M.R. New Colorimetric Cytotoxicity Assay for Anticancer-Drug Screening. J. Natl. Cancer Inst. 1990, 82, 1107–1112. [Google Scholar] [CrossRef]
- Aykul, S.; Martinez-Hackert, E. Determination of half-maximal inhibitory concentration using biosensor-based protein interaction analysis. Anal. Biochem. 2016, 508, 97–103. [Google Scholar] [CrossRef] [PubMed]
- Teixeira-Guedes, C.; Brás, A.R.; Teixeira, R.G.; Valente, A.; Preto, A. Ruthenium(II)–Cyclopentadienyl-Derived Complexes as New Emerging Anti-Colorectal Cancer Drugs. Pharmaceutics 2022, 14, 1293. [Google Scholar] [CrossRef]
- D’aRonzo, M.; Vinciguerra, M.; Mazza, T.; Panebianco, C.; Saracino, C.; Pereira, S.P.; Graziano, P.; Pazienza, V. Fasting cycles potentiate the efficacy of gemcitabine treatment inin vitroandin vivopancreatic cancer models. Oncotarget 2015, 6, 18545–18557. [Google Scholar] [CrossRef] [PubMed]
- Barretina, J.; Caponigro, G.; Stransky, N.; Venkatesan, K.; Margolin, A.A.; Kim, S.; Wilson, C.J.; Lehár, J.; Kryukov, G.V.; Sonkin, D.; et al. The Cancer Cell Line Encyclopedia enables predictive modelling of anticancer drug sensitivity. Nature 2012, 483, 603–607. [Google Scholar] [CrossRef]
- Amrutkar, M.; Gladhaug, I.P. Pancreatic Cancer Chemoresistance to Gemcitabine. Cancers 2017, 9, 157. [Google Scholar] [CrossRef] [PubMed]
- Gmeiner, W.H.; Okechukwu, C.C. Review of 5-FU resistance mechanisms in colorectal cancer: clinical significance of attenuated on-target effects. Cancer Drug Resist. 2023, 6, 257–272. [Google Scholar] [CrossRef]
- de Sousa Cavalcante, L.; Monteiro, G. Gemcitabine: Metabolism and molecular mechanisms of action, sensitivity and chemoresistance in pancreatic cancer. Eur. J. Pharmacol. 2014, 741, 8–16. [Google Scholar] [CrossRef]
- Zhang, N.; Yin, Y.; Xu, S.-J.; Chen, W.-S. 5-Fluorouracil: Mechanisms of Resistance and Reversal Strategies. Molecules 2008, 13, 1551–1569. [Google Scholar] [CrossRef]
- Janku, F.; Lee, J.J.; Tsimberidou, A.M.; Hong, D.S.; Naing, A.; Falchook, G.S.; Fu, S.; Luthra, R.; Garrido-Laguna, I.; Kurzrock, R. PIK3CA Mutations Frequently Coexist with RAS and BRAF Mutations in Patients with Advanced Cancers. PLOS ONE 2011, 6, e22769. [Google Scholar] [CrossRef]
- Saiki, Y.; Jiang, C.; Ohmuraya, M.; Furukawa, T. Genetic Mutations of Pancreatic Cancer and Genetically Engineered Mouse Models. Cancers 2021, 14, 71. [Google Scholar] [CrossRef]
- Tardito, S.; Matis, S.; Zocchi, M.R.; Benelli, R.; Poggi, A. Epidermal Growth Factor Receptor Targeting in Colorectal Carcinoma: Antibodies and Patient-Derived Organoids as a Smart Model to Study Therapy Resistance. Int. J. Mol. Sci. 2024, 25, 7131. [Google Scholar] [CrossRef]
- De Roock, W.; Claes, B.; Bernasconi, D.; De Schutter, J.; Biesmans, B.; Fountzilas, G.; Kalogeras, K.T.; Kotoula, V.; Papamichael, D.; Laurent-Puig, P.; et al. Effects of KRAS, BRAF, NRAS, and PIK3CA mutations on the efficacy of cetuximab plus chemotherapy in chemotherapy-refractory metastatic colorectal cancer: a retrospective consortium analysis. Lancet Oncol. 2010, 11, 753–762. [Google Scholar] [CrossRef]
- Ersahin, T.; Tuncbag, N.; Cetin-Atalay, R. The PI3K/AKT/mTOR interactive pathway. Mol. Biosyst. 2015, 11, 1946–1954. [Google Scholar] [CrossRef]
- Mehra, S.; Deshpande, N.; Nagathihalli, N. Targeting PI3K Pathway in Pancreatic Ductal Adenocarcinoma: Rationale and Progress. Cancers 2021, 13, 4434. [Google Scholar] [CrossRef] [PubMed]
- Porta, C.; Paglino, C.; Mosca, A. Targeting PI3K/Akt/mTOR Signaling in Cancer. Front. Oncol. 2014, 4, 64. [Google Scholar] [CrossRef]
- Temraz, S.; Mukherji, D.; Shamseddine, A. Dual Inhibition of MEK and PI3K Pathway in KRAS and BRAF Mutated Colorectal Cancers. Int. J. Mol. Sci. 2015, 16, 22976–22988. [Google Scholar] [CrossRef] [PubMed]
- Morrison, D.K. MAP Kinase Pathways. Cold Spring Harb. Perspect. Biol. 2012, 4, a011254. [Google Scholar] [CrossRef]
- Shi, X.; Wang, J.; Lei, Y.; Cong, C.; Tan, D.; Zhou, X. Research progress on the PI3K/AKT signaling pathway in gynecological cancer (Review). Mol. Med. Rep. 2019, 19, 4529–4535. [Google Scholar] [CrossRef]
- Stefani, C.; Miricescu, D.; Stanescu-Spinu, I.-I.; Nica, R.I.; Greabu, M.; Totan, A.R.; Jinga, M. Growth Factors, PI3K/AKT/mTOR and MAPK Signaling Pathways in Colorectal Cancer Pathogenesis: Where Are We Now? Int. J. Mol. Sci. 2021, 22, 10260. [Google Scholar] [CrossRef]
- Tait, S.W.G.; Ichim, G.; Green, D.R. Die another way – non-apoptotic mechanisms of cell death. J. Cell Sci. 2014, 127, 2135–2144. [Google Scholar] [CrossRef]
- Zhang, M.; Harashima, N.; Moritani, T.; Huang, W.; Harada, M. The Roles of ROS and Caspases in TRAIL-Induced Apoptosis and Necroptosis in Human Pancreatic Cancer Cells. PLOS ONE 2015, 10, e0127386. [Google Scholar] [CrossRef]
- Kusano, C.; Takao, S.; Noma, H.; Yoh, H.; Aikou, T.; Okumura, H.; Akiyama, S.; Kawamura, M.; Makino, M.; Baba, M. N-acetyl cysteine inhibits cell cycle progression in pancreatic carcinoma cells. 2000, 13, 213–20. [Google Scholar] [PubMed]
- Liu, Y.; Liu, K.; Wang, N.; Zhang, H. N-acetylcysteine induces apoptosis via the mitochondria-dependent pathway but not via endoplasmic reticulum stress in H9c2 cells. Mol. Med. Rep. 2017, 16, 6626–6633. [Google Scholar] [CrossRef]
- Hussar, P. Apoptosis Regulators Bcl-2 and Caspase-3. Encyclopedia 2022, 2, 1624–1636. [Google Scholar] [CrossRef]
- Amini, A.; Masoumi-Moghaddam, S.; Ehteda, A.; Morris, D.L. Bromelain and N-acetylcysteine inhibit proliferation and survival of gastrointestinal cancer cells in vitro: significance of combination therapy. J. Exp. Clin. Cancer Res. 2014, 33, 92–92. [Google Scholar] [CrossRef]
- Mlejnek, P.; Dolezel, P.; Kriegova, E.; Pastvova, N. N-acetylcysteine Can Induce Massive Oxidative Stress, Resulting in Cell Death with Apoptotic Features in Human Leukemia Cells. Int. J. Mol. Sci. 2021, 22, 12635. [Google Scholar] [CrossRef]
- Lim, H.M.; Lee, J.; Nam, M.J.; Park, S.-H. Acetylshikonin Induces Apoptosis in Human Colorectal Cancer HCT-15 and LoVo Cells via Nuclear Translocation of FOXO3 and ROS Level Elevation. Oxidative Med. Cell. Longev. 2021, 2021. [Google Scholar] [CrossRef]
- Delneste, Y.; Jeannin, P.; Potier, L.; Romero, P.; Bonnefoy, J.-Y. N-acetyl-L-cysteine Exhibits Antitumoral Activity by Increasing Tumor Necrosis Factor α-Dependent T-Cell Cytotoxicity. Blood 1997, 90, 1124–1132. [Google Scholar] [CrossRef] [PubMed]
- Wang, X.; Lin, Y. Tumor necrosis factor and cancer, buddies or foes? Acta Pharmacol. Sin. 2008, 29, 1275–1288. [Google Scholar] [CrossRef] [PubMed]
- Qanungo, S.; Uys, J.D.; Manevich, Y.; Distler, A.M.; Shaner, B.; Hill, E.G.; Mieyal, J.J.; Lemasters, J.J.; Townsend, D.M.; Nieminen, A.-L. N-acetyl-l-cysteine sensitizes pancreatic cancers to gemcitabine by targeting the NFκB pathway. Biomed. Pharmacother. 2014, 68, 855–864. [Google Scholar] [CrossRef]
- Wang, F.-X.; Deng, A.-J.; Li, M.; Wei, J.-F.; Qin, H.-L.; Wang, A.-P. (3S)-1,2,3,4-Tetrahydro-β-carboline-3-carboxylic Acid from Cichorium endivia. L Induces Apoptosis of Human Colorectal Cancer HCT-8 Cells. Molecules 2012, 18, 418–429. [Google Scholar] [CrossRef]
- Xu, Q.-B.; Chen, X.-F.; Feng, J.; Miao, J.-F.; Liu, J.; Liu, F.-T.; Niu, B.-X.; Cai, J.-Y.; Huang, C.; Zhang, Y.; et al. Design, synthesis and biological evaluation of hybrids of β-carboline and salicylic acid as potential anticancer and apoptosis inducing agents. Sci. Rep. 2016, 6, 36238. [Google Scholar] [CrossRef]
- Xi, T.; Xia, H.; Fan, Y.-X.; Cao, Y.-C.; Zhang, H.-L. Mechanism of β-carboline alkaloids inhibiting migration and invasion of SGC-7901 cells. 2019, 44, 119–124. [Google Scholar]
- Lin, Y.; Xia, X.; Yao, R.; Ni, L.; Hu, J.; Guo, W.; Zhu, B. Synthesis and in Vitro Biological Evaluation of Hybrids from Tetrahydro-β-carboline and Hydroxylcinnamic Acid as Antitumor Carcinoma Agents. Chem. Pharm. Bull. 2014, 62, 343–349. [Google Scholar] [CrossRef] [PubMed]
- Krzywik, J.; Mozga, W.; Aminpour, M.; Janczak, J.; Maj, E.; Wietrzyk, J.; Tuszyński, J.A.; Huczyński, A. Synthesis, Antiproliferative Activity and Molecular Docking Studies of Novel Doubly Modified Colchicine Amides and Sulfonamides as Anticancer Agents. Molecules 2020, 25, 1789. [Google Scholar] [CrossRef]
- Supabphol, A.; Muangman, V.; Chavasiri, W.; Supabphol, R.; Gritsanapan, W. N-acetylcysteine inhibits proliferation, adhesion, migration and invasion of human bladder cancer cells. 2009, 92, 1171–7. [Google Scholar] [PubMed]
- Tidwell, T.R.; Røsland, G.; Tronstad, K.J.; Søreide, K.; Hagland, H.R. Comparing in vitro cytotoxic drug sensitivity in colon and pancreatic cancer using 2D and 3D cell models: Contrasting viability and growth inhibition in clinically relevant dose and repeated drug cycles. Cancer Med. 2024, 13, e7318. [Google Scholar] [CrossRef] [PubMed]
- Kim, Y.; Han, D.; Min, H.; Jin, J.; Yi, E.C.; Kim, Y. Comparative Proteomic Profiling of Pancreatic Ductal Adenocarcinoma Cell Lines. Mol. Cells 2014, 37, 888–898. [Google Scholar] [CrossRef]
- Kalluri, R.; Weinberg, R.A. The basics of epithelial-mesenchymal transition. J. Clin. Investig. 2009, 119, 1420–1428. [Google Scholar] [CrossRef]
- Halvey, P.J.; Wang, X.; Wang, J.; Bhat, A.A.; Dhawan, P.; Li, M.; Zhang, B.; Liebler, D.C.; Slebos, R.J. Proteogenomic Analysis Reveals Unanticipated Adaptations of Colorectal Tumor Cells to Deficiencies in DNA Mismatch Repair. Cancer Res. 2014, 74, 387–397. [Google Scholar] [CrossRef]
- Panebianco, C.; Villani, A.; Pisati, F.; Orsenigo, F.; Ulaszewska, M.; Latiano, T.P.; Potenza, A.; Andolfo, A.; Terracciano, F.; Tripodo, C.; et al. Butyrate, a postbiotic of intestinal bacteria, affects pancreatic cancer and gemcitabine response in in vitro and in vivo models. Biomed. Pharmacother. 2022, 151, 113163. [Google Scholar] [CrossRef]
- Li, X.; Hou, Y.; Zhao, J.; Li, J.; Wang, S.; Fang, J. Combination of chemotherapy and oxidative stress to enhance cancer cell apoptosis. Chem. Sci. 2020, 11, 3215–3222. [Google Scholar] [CrossRef]
- Cui, W.-L.; Guo, D.-X.; Wang, N.; Wang, Z.-F.; Ji, J.-B.; Wang, X.; Yang, C.-G.; Lin, Y.-Q.; Wang, S.-Q. Identification of chemosensitizing agents of colorectal cancer in Rauvolfia vomitoria using an NMR-based chemometric approach. Front. Chem. 2023, 10, 1069591. [Google Scholar] [CrossRef]
- Cichero, E.; Bruno, O.; Fossa, P. Docking-based CoMFA and CoMSIA analyses of tetrahydro-β-carboline derivatives as type-5 phosphodiesterase inhibitors. J. Enzym. Inhib. Med. Chem. 2011, 27, 730–743. [Google Scholar] [CrossRef] [PubMed]
- Mohamed, H.A.; Girgis, N.M.R.; Wilcken, R.; Bauer, M.R.; Tinsley, H.N.; Gary, B.D.; Piazza, G.A.; Boeckler, F.M.; Abadi, A.H. Synthesis and Molecular Modeling of Novel Tetrahydro-β-carboline Derivatives with Phosphodiesterase 5 Inhibitory and Anticancer Properties. J. Med. Chem. 2010, 54, 495–509. [Google Scholar] [CrossRef] [PubMed]
- Das, A.; Durrant, D.; Salloum, F.N.; Xi, L.; Kukreja, R.C. PDE5 inhibitors as therapeutics for heart disease, diabetes and cancer. Pharmacol. Ther. 2015, 147, 12–21. [Google Scholar] [CrossRef] [PubMed]
Figure 1.
Effect of N-acetylcysteine (NAC) on cell growth in pancreatic cancer (PC) cell lines (BxPC-3 and Panc-1), colorectal cancer (CRC) cell lines (SW480 and RKO), and corresponding control cell lines (BJ-5ta and NCM460). Panels (a) and (c) show bar graphs of cell growth (%) ± S.D. across NAC concentrations, while panels (b) and (d) show nonlinear regression curves of cell growth (%) ± S.D. versus log [NAC]. Panels (a, b) correspond to PC lines and their control; panels (c, d) correspond to CRC cell lines and their control. NAC concentrations ranged from 0.5-120 mM (PC) and 0.5-180 mM (CRC). For PC cell lines we used the Muse™ Count & Cell Viability Reagent and for CRC cell lines we performed the Sulforhodamine B assay.
Figure 2.
Effect of tetrahydro-β-carboline carboxylic acid (THC) on cell growth in pancreatic cancer (PC) cell lines (BxPC-3 and Panc-1), colorectal cancer (CRC) cell lines (SW480 and RKO), and corresponding control cell lines (BJ-5ta and NCM460). Panels (a) and (c) show bar graphs of cell growth (%) ± S.D. across THC concentrations, while panels (b) and (d) show nonlinear regression curves of cell growth (%) ± S.D. versus log [THC]. Panels (a, b) correspond to PC lines and their control; panels (c, d) correspond to CRC cell lines and their control. THC concentrations ranged from 0.5-10 mM (PC) and 0.5-20 mM (CRC). For PC cell lines we used the Muse™ Count & Cell Viability Reagent whilst for CRC cell lines we performed the Sulforhodamine B assay.
Figure 3.
N-acetylcysteine enhances the effect of gemcitabine in BxPC-3 cells and of 5-fluorouracil in RKO cells. Bar graphs represent the mean percentage of cell growth from at least three independent experiments, with standard deviation (S.D.) shown as error bars. Columns correspond to negative control, positive control, IC50 NAC alone, and NAC combined with positive control. Statistical significance: p < 0.05 (*), p < 0.01 (**), p < 0.001 (***). (a) Results for pancreatic cancer cell lines BxPC-3 and Panc-1, with gemcitabine (1 µM) as positive control. (b) Results for colorectal cancer cell lines SW480 and RKO, with 5-fluorouracil (46.68 µM for SW480, 4.85 µM for RKO) as positive control. For PC cell lines we used the Muse™ Count & Cell Viability Reagent whilst for CRC cell lines we performed the Sulforhodamine B assay.
Figure 4.
Tetrahydro β-carboline carboxylic acid enhances the effect of gemcitabine in BxPC-3 cells and Panc-1 cells but not the effect of 5-fluorouracil in colorectal cancer cell lines. Bar graphs represent the mean percentage of cell growth from at least three independent experiments, with standard deviation (S.D.) shown as error bars. Columns correspond to negative control, positive control, IC50 THC, and THC combined with positive control. Statistical significance: p < 0.05 (*), p < 0.01 (**), p < 0.001 (***). (a) Results for pancreatic cancer cell lines BxPC-3 and Panc-1, with gemcitabine (1 µM) as positive control. (b) Results for colorectal cancer cell lines SW480 and RKO, with 5-fluorouracil (46.68 µM for SW480, 4.85 µM for RKO) as positive control. For PC cell lines we used the Muse™ Count & Cell Viability Reagent whilst for CRC cell lines we performed the Sulforhodamine B assay.
Figure 5.
N-acetylcysteine affects apoptosis in Panc-1, SW480, and RKO cells and enhances the effect of gemcitabine and 5-fluorouracil in pancreatic and colorectal cancer cell lines, respectively. Bar graphs show the percentage of cells from at least three independent experiments, with standard deviation (S.D.) shown as error bars. The x-axis displays different cell populations for each condition (negative control, positive control, IC50 NAC alone, and NAC combined with positive control). Statistical significance: p < 0.05 (*), p < 0.01 (**), p < 0.001 (***). (a) Results for pancreatic cancer cell lines BxPC-3 and Panc-1, with gemcitabine (1 µM) as positive control. (b) Results for colorectal cancer cell lines SW480 and RKO, with 5-fluorouracil (46.68 µM for SW480, 4.85 µM for RKO) as positive control. Cell death was assessed by Annexin V/Propidium Iodide.
Figure 6.
Tetrahydro β-carboline carboxylic acid affects apoptosis in pancreatic and colorectal cancer cell lines and enhances the effect of gemcitabine and 5-fluorouracil in BxPC-3 and RKO cells, respectively. Bar graphs show the percentage of cells from at least three independent experiments, with standard deviation (S.D.) shown as error bars. The x-axis displays different cell populations for each condition (negative control, positive control, IC50 THC, and THC combined with positive control). Statistical significance: p < 0.05 (*), p < 0.01 (**), p < 0.001 (***). (a) Results for pancreatic cancer cell lines BxPC-3 and Panc-1, with gemcitabine (1 µM) as positive control. (b) Results for colorectal cancer cell lines SW480 and RKO, with 5-fluorouracil (46.68 µM for SW480, 4.85 µM for RKO) as positive control. Cell death was assessed by Annexin V/Propidium Iodide.
Figure 7.
N-acetylcysteine affects the cell cycle of Panc-1 cells and enhances the effect of 5-fluorouracil in colorectal cancer cell lines. Bar graphs represent the show the percentage of cells from at least three independent experiments, with standard deviation (S.D.) shown as error bars. The x-axis indicates cell cycle phases for each condition (negative control, positive control, IC50 NAC alone, and NAC combined with positive control). Statistical significance: p < 0.05 (*), p < 0.01 (**), p < 0.001 (***). (a) Results for pancreatic cancer cell lines BxPC-3 and Panc-1, with gemcitabine (1 µM) as positive control. (b) Results for colorectal cancer cell lines SW480 and RKO, with 5-fluorouracil (46.68 µM for SW480, 4.85 µM for RKO) as positive control. Cell cycle analysis was performed by flow cytometry.
Figure 8.
Tetrahydro β-carboline carboxylic acid affects the cell cycle of pancreatic and colorectal cancer cell lines and enhances the effect of gemcitabine and 5-fluorouracil in pancreatic cancer and SW480 cells, respectively. Bar graphs show the percentage of cells from at least three independent experiments, with standard deviation (S.D.) shown as error bars. The x-axis indicates cell cycle phases for each condition (negative control, positive control, IC50 THC, and THC combined with positive control). Statistical significance: p < 0.05 (*), p < 0.01 (**), p < 0.001 (***). (a) Results for pancreatic cancer cell lines BxPC-3 and Panc-1, with gemcitabine (1 µM) as positive control. (b) Results for colorectal cancer cell lines SW480 and RKO, with 5-fluorouracil (46.68 µM for SW480, 4.85 µM for RKO) as positive control. Cell cycle analysis was performed by flow cytometry.
Table 1.
IC50 values of N-acetylcysteine (NAC) in pancreatic cancer (PC) cell lines (BxPC-3 and Panc-1), colorectal cancer (CRC) cell lines (SW480 and RKO), and corresponding control cell lines (BJ-5ta and NCM460) after 48 h incubation. Values are presented as mean ± S.D. The selectivity index (SI) was calculated as the ratio of IC50 values in control versus cancer cell lines.
Table 2.
IC50 values of tetrahydro-β-carboline carboxylic acid (THC) in pancreatic cancer (PC) cell lines (BxPC-3 and Panc-1), colorectal cancer (CRC) cell lines (SW480 and RKO), and corresponding control cell lines (BJ-5ta and NCM460) after 48 h incubation. Values are presented as mean ± S.D. The selectivity index (SI) was calculated as the ratio of IC50 values in control versus cancer cell lines.
|
Disclaimer/Publisher’s Note: The statements, opinions and data contained in all publications are solely those of the individual author(s) and contributor(s) and not of MDPI and/or the editor(s). MDPI and/or the editor(s) disclaim responsibility for any injury to people or property resulting from any ideas, methods, instructions or products referred to in the content. |
© 2025 by the authors. Licensee MDPI, Basel, Switzerland. This article is an open access article distributed under the terms and conditions of the Creative Commons Attribution (CC BY) license (http://creativecommons.org/licenses/by/4.0/).