Submitted:
19 June 2025
Posted:
19 June 2025
You are already at the latest version
Abstract
Lymphoma continues to pose a significant global health burden, highlighting the urgent need for novel therapeutic strategies. Recent advances in microbiome research have identified gut microbiota-derived metabolites, or postbiotics, as promising candidates in cancer therapy. This study investigates the antiproliferative and mechanistic effects of two postbiotics, Nisin (N) and urolithin B (UB), individually and in combination, against the human lymphoma cell line HKB-11. Moreover, this study evaluated cytotoxic efficacy and underlying molecular pathways using a comprehensive experimental approach, including Alamar Blue assay, combination index (CI) analysis, flow cytometry, reactive oxygen species (ROS) quantification, and bottom-up proteomics. N and UB displayed notable antiproliferative effects, with IC₅₀ values of 1467 µM and 87.56 µM, respectively. Importantly, their combination at a 4:6 ratio demonstrated strong synergy (CI = 0.09 at IC₉₅), significantly enhancing apoptosis (p < 0.0001) and modulating oxidative stress. Proteomic profiling revealed significant regulation of key proteins related to lipid metabolism, mitochondrial function, cell cycle control, and apoptosis, including upregulation of COX6C (Log₂FC = 2.07) and downregulation of CDK4 (Log₂FC = –1.26). These findings provide mechanistic insights and underscore the translational potential of postbiotics in lymphoma treatment. Further preclinical and clinical investigations are warranted to explore their role in therapeutic regimens.
Keywords:
Lymphoma
; Postbiotics
; Nisin
; Urolithin B
; Synergy
; Proteomics
; Apoptosis
1. Introduction
Lymphoma, a heterogeneous group of malignancies originating from lymphocytes, remains a significant global health burden despite advancements in cancer research and treatment modalities. According to recent global cancer statistics, lymphoma ranks among the ten most common cancers worldwide, with an increasing incidence and mortality rate (Ferlay et al., 2021). Non-Hodgkin’s lymphoma (NHL) and Hodgkin’s lymphoma (HL) are the two primary subtypes, characterised by distinct clinical and molecular features. Moreover, while advancements in immunotherapy and targeted treatments have improved outcomes for many patients, the prognosis for aggressive or refractory lymphoma remains suboptimal, necessitating novel therapeutic approaches (Ansell, 2015; Swerdlow et al., 2016).
HKB-11, a hybrid cell line that exhibits key characteristics of non-Hodgkin B-cell lymphoma, serves as a relevant model for investigating therapeutic interventions. Also, HKB-11 shows a doubling time of approximately forty-one hours in serum medium, with similar growth rates in chemically defined formulations, confirming its robust proliferation across various culture systems (Costa e Silva et al., 2020). For instance, Mei and colleagues demonstrated that HKB-11 supports eight to thirty times higher factor VIII secretion than HEK293 or BHK21, highlighting its efficient endoplasmic reticulum trafficking and secretory capacity (Mei et al., 2006). Moreover, HKB-11 can grow to high densities in serum-free suspension without aggregation, ensuring uniform drug exposure during viability, apoptosis, and proteomics assays (Cho et al., 2002; Costa e Silva et al., 2020). Additionally, these characteristics establish HKB-11 as a scalable human Burkitt lymphoma model that encapsulates MYC dependence, EBV latency, rapid growth, and uncomplicated assay logistics, justifying its selection for antiproliferative and synergy studies while exploring novel therapies.
Emerging evidence suggests a critical role for the gut microbiota in modulating cancer pathogenesis, treatment responses, and patient outcomes. The gut microbiota comprises a complex ecosystem of bacteria, fungi, archaea, and viruses that interact with the host to maintain homeostasis and influence various physiological processes, including immune regulation, metabolism, and inflammatory responses (Kho & Lal, 2018). Recent studies highlighted the intricate relationship between gut microbial dysbiosis and lymphoma, suggesting that specific microbial metabolites may modulate tumour growth, immune evasion, and responses to therapy (Thaiss et al., 2015; Zhu et al., 2023; Zitvogel et al., 2017). Gut microbial metabolites, often called postbiotics, represent bioactive molecules derived from microbial metabolism that may exhibit diverse biological functions, including anticancer and immunomodulatory activities (O’keefe, 2016; Peluzio et al., 2021; Rafique et al., 2023). Nonetheless, studies investigating the interactions of postbiotics with cancer and other diseases are still in their early stages and warrant further exploration.
Among the most studied postbiotics are inosine, N, Urolithin A (UA), UB, and short-chain fatty acids (SCFAs), which have shown potential therapeutic benefits in various cancer models (Al-Khazaleh et al., 2024; Lewies et al., 2018; Mager et al., 2020; Niamah et al., 2024). Inosine, a purine metabolite, has demonstrated immunostimulatory effects by enhancing T-cell activation and modulating the tumour microenvironment (Mager et al., 2020). N, a bacteriocin produced by certain strains of Lactococcus lactis, has exhibited antiproliferative and pro-apoptotic effects in in vitro and in vivo cancer studies, including lymphoma models (Lewies et al., 2018; Niamah et al., 2024). Urolithins, metabolites derived from dietary ellagitannins through gut microbial metabolism, have shown anti-inflammatory and anticancer properties, particularly by inducing apoptosis and modulating cell signalling pathways in haematological malignancies (Al-Khazaleh et al., 2024; Gandhi et al., 2024; Hasheminezhad et al., 2022; Shetty et al., 2024). SCFAs, primarily acetate, propionate, and butyrate, are by-products of the fermentation of dietary fibres by gut bacteria. They have been extensively studied for their role in immune modulation, epigenetic regulation, and tumour suppression (Bhat & Kapila, 2017; Cui et al., 2019; Eladwy et al., 2024; Jaye et al., 2023; Tan et al., 2023). The mechanisms through which these metabolites exert their anticancer effects can be multifaceted and involve modulation of immune responses, alteration of cell signalling pathways, and induction of programmed cell death (Cui et al., 2019; Nan et al., 2023). For instance, butyrate has been shown to inhibit histone deacetylases (HDACs), leading to epigenetic reprogramming and apoptosis in lymphoma cells (Berni Canani et al., 2012; Peng et al.; Steliou et al., 2012). Similarly, UA has been reported to enhance the efficacy of chemotherapeutic agents by inhibiting key pathways associated with cell proliferation and survival in colorectal cancer cells (El-Wetidy et al., 2021; Zhang et al., 2023). Despite these promising findings, the molecular mechanisms underlying the antiproliferative effects of these metabolites against lymphoma remain inadequately explored. Against this backdrop, proteomics offers a powerful and comprehensive approach to characterise cellular responses, enabling deeper insights into the pathways and molecular networks modulated by these metabolites.
In this context, the current study investigated the antiproliferative activities of postbiotics, including inosine, N, UA, UB, and SCFA salts, in cellular models of lymphoma. The study also evaluated the potential synergistic effects of these metabolites when combined. By employing advanced proteomic and cell-based approaches, we elucidated the molecular mechanisms underlying their anticancer activities and identified potential biomarkers for therapeutic targeting.
2. Materials and Methods
2.1. Chemicals and Drug Preparation
All the metabolites used in the study, N and UB, were purchased from Sapphire Bioscience (Redfern, NSW, Australia). Magnesium acetate (MgA), sodium propionate (NaP), sodium butyrate (NaB), and Doxorubicin (Dox) were also purchased from Sigma Aldrich (Castle Hill, NSW, Australia). Furthermore, all reagents were prepared according to the standard methods and protocols provided with the assay kits.
2.2. Cell Culture
Hs 313.T (ATCC CRL-7235) passage (4), HKB-11 (ATCC CRL-12568; human kidney/B cell Hybrid) passage (4–10) and HS-5 (ATCC CRL-3611) passage (5) were purchased from the American Type Culture Collection (ATCC, Manassas, Virginia, United States). Hs 313.T lymphoma cells were grown in the ATCC-formulated Dulbecco’s Modified Eagle’s Medium (DMEM; ATCC 30-2002), comprised of 4.5 g/L glucose, L-glutamine, and sodium pyruvate supplemented with 10% foetal bovine serum (FBS; Bio-Strategy PTY Campbellfield, VIC, Australia), and supplemented with 1% penicillin and streptomycin (Sigma Aldrich, Castle Hill, NSW, Australia). The HKB-11 cells were grown in the ATCC-formulated DMEM: F12 (1:1 mixture of DMEM and Ham’s F-12) supplemented with 10% FBS (Bio-Strategy PTY Campbellfield, VIC, Australia) and supplemented with 1% penicillin and streptomycin (Sigma Aldrich, Castle Hill, NSW, Australia). HS-5 normal cells were grown in the ATCC-formulated DMEM (ATCC 30-2002), comprised of 4.5 g/L glucose, L-glutamine, and sodium pyruvate, supplemented with 10% FBS (Bio-Strategy PTY Campbellfield, VIC, Australia), and supplemented with 1% penicillin and streptomycin (Sigma Aldrich, Castle Hill, NSW, Australia). These cells were maintained at 37°C in a 5% controlled CO2 atmosphere, and cell maintenance was performed every 48–72 h, which is the time necessary for cells to achieve confluent monolayers.
2.3. Cell Viability Assays
The cell viability of the HKB-11, Hs313.T and HS-5 cells after treatment with different concentrations of the seven different postbiotics, including SCFA salts (magnesium acetate, sodium propionate and sodium butyrate), UA and UB, purine nucleoside (inosine) and bacteriocin (N) were determined using the Alamar Blue assay as per the method described earlier (Alsherbiny et al., 2021; Dissanayake et al., 2023). Briefly, 100 μL of cells were cultured in 96-well plates at a 3 × 10⁵ cells/mL seeding density. After 24 h, the cells were treated with 16,000 µM of each postbiotic except for the urolithins, which were applied at 500 µM using a 1:2 serial dilution across a 10-point dose-response curve, followed by a 72-h incubation. A positive control using doxorubicin was prepared at a concentration of 4 μM, and an untreated control with 0.1% DMSO was added to every plate. At the end of the incubation period, the culture media were removed, and 100 μL of a 0.1 mg/mL Alamar Blue solution (resazurin, prepared as a stock solution at 1 mg/mL in freshly made PBS, followed by a 1:10 dilution with serum-free media) was added to each well. The fluorescence levels were assessed using a microplate spectrophotometer (BMG CLARIOstar, Mornington, VIC, Australia) with an excitation wavelength of 555 nm and emission measurement at 595 nm. The compounds were tested in triplicate, with the untreated control taken as 100% cell viability.
2.4. Synergy Analysis
The most potent metabolites (N and UB) were combined at nine different ratios 1:9 v/v (800:450 μM), 2:8 v/v (1600:400 μM), 3:7 v/v (2400:350 μM), 4:6 v/v (3200:300 μM), 5:5 v/v (4000:250 μM), 6:4 v/v (4800:200 μM), 7:3 v/v (5600:150 μM), 8:2 v/v (6400:100 μM), and 9:1 v/v (7200:50 μM), with serial dilution 1:2 ratio, for combination index (CI) analyses. This study used the CI model to show the interaction between N and UB. CompuSyn version 2.0 (Biosoft, CA, United States) was used for our calculations. Moreover, this software calculates CI based on the median-effect equation from the mass action law (Alsherbiny et al., 2021). The current study used the CI model to study the nine pairwise postbiotic combinations with a six-point dose-response curve. The CI model quantifies the potential interactions between drug-drug combinations into three categories: (a) synergistic effect: CI value <1, (b) additive effect: CI = 1, and (c) antagonistic effect: CI value >1.
2.5. Analysis of ROS Production
The effect of the most active gut metabolites and their most synergistic combinations on the oxidative stress of the lymphoma cells was studied as per the protocol using the H2DCFDA (2′,7′-dichlorofluorescein diacetate) cellular ROS Detection Assay Kit (#ab113851; Abcam, Melbourne, VIC, Australia) (Dissanayake et al., 2023; Jaye et al., 2023). Briefly, HKB-11 lymphoma cells (2.5 × 10⁵ cells/mL) were cultured in a 96-well plate, allowed to adhere overnight, and treated with 20 μM H2DCFDA for 45 min to assess ROS levels. The dye solution was removed, and cells were washed with 1× buffer. Next, the cells were treated with N (8000 μM), N (4000 μM), UB (500 μM), UB (250 μM), N:UB (3500 μM), N:UB (1750 μM), N:UB (5750 μM), N:UB (2875 μM), Dox (4 μM) , and tert-Butyl hydroperoxide (TBHP) (150 μM), and then incubated at 37°C for 4 h. Finally, the plate was immediately read at Ex/Em = 485/535 nm using a microplate spectrophotometer (BMG CLARIOstar, VIC, Australia). The fold-change in ROS production was determined relative to the untreated control (cells treated with the supplement buffer according to the manufacturer’s protocol).
2.6. Flow Cytometry Analyses of the Apoptotic Profiles
The impact of the most potent postbiotics and their most synergistic combinations on the apoptosis profiles of the HKB-11 lymphoma cells after 24 h treatment was studied using an annexin V and 7-AAD-based kit (#ab214663, Abcam, Melbourne, VIC, Australia) (Dissanayake et al., 2023; Jaye et al., 2023). The HKB-11 cells were cultured in T75 cell culture flasks with an initial density of 1 × 10⁶ cells per 10 mL at 37°C in the presence of 5% CO2 for 24 h. The following day, the cell culture media was removed from each flask and replaced with fresh FBS-containing media. The cultured flasks were then treated with the highest concentration of the most active postbiotics N (8000 μM), UB (500 μM) and the positive control Dox (4 μM). FBS-containing medium was used as the untreated control. The flasks were then incubated at 37°C with 5% CO2 for 24 h. Then, the cell culture media from each flask was collected. Subsequently, trypsin (0.25% w/v) was applied to the flasks for 4 min at 37°C. The trypsin reaction was neutralised with an equal volume of 10% FBS serum-containing media, and the cells were combined with the previously collected media. The cell pellets were obtained by centrifuging at 500 × g for 5 min at room temperature (RT). This procedure was repeated by suspending the cell pellets in 1 mL of PBS each time. The collected cell pellets from each treatment were immediately suspended in 500 μL of 1× binding buffer and gently mixed by pipetting. Annexin V-CF Blue (5 μL) and 7-AAD (5 μL) staining solutions were added to 100 μL cell suspension. The stained cells were incubated for 15 min in the dark at RT, after which 400 μL of a 1x assay buffer was added to each cell suspension. Subsequently, the cells were examined using a flow cytometer (Novocyte 3,000, ACEA Biosciences Inc., CA, United States), and data analysis and processing was performed using NovoExpress software (version 1.5.0, ACEA Biosciences Inc., CA, United States). In the initial step, the cells were gated on forward and side scatter modes to exclude cell aggregates and debris near the origin. The cells were then gated on dot plots, where Annexin V-CF in Pacific Blue was plotted against 7-AAD fluorescence in PerCP. Quadrants were positioned relative to the untreated control, indicating live cells (+Annexin V and − 7-AAD) appearing in the lower-left quadrant, early apoptotic cells (+Annexin V and − 7-AAD) in the lower-right quadrant, late apoptotic cells (+Annexin V and + 7-AAD) in the upper-right quadrant, and necrotic cells (−Annexin V and + 7-AAD) in the upper-left quadrant. For statistical analyses and visualisation, the percentage data of cells in each quadrant after different treatments (n = 3) were exported to GraphPad Prism software (version 9.0, San Diego, CA, United States).
2.7. Liquid Chromatography-Mass Spectrometry (LC–MS)-Driven Bottom-Up Proteomics Analysis
2.7.1. Cell Culture, Treatment, and Protein Extraction
The HKB-11 lymphoma cells were placed in 6-well plates at a density of 3.0 × 10⁶ cells/well and incubated overnight at 37°C in 5% CO2. After removing the media, it was replaced with fresh DMEM/F-12 medium supplemented with 10% FBS, and the cultured flasks were treated with specific doses of the most active postbiotics and their combinations. Treatments were done in triplicate and incubated for 24 h under the same conditions. Following incubation, each flask of cells was subjected to a 0.25% w/v trypsin treatment for 4 min at 37°C, and the cell culture medium was collected. Additionally, an equal volume of DMEM F-12 medium (containing 10% FBS) was added before mixing with the previously collected media to neutralise the trypsin. The cells were spun in a centrifuge at 500 × g for 5 min at RT. The cell pellets were washed twice with ice-cold PBS and spun again at 500× g for 5 min. These cell pellets were then suspended in a lysis buffer that included 1 μL of universal nuclease (Easypep Mini Kit) and supplemented with Halt™ Protease and Phosphatase Inhibitor Cocktail in 1:100 ratio (Thermo Fisher Scientific, Sydney, NSW, Australia). The cells were gently pipetted 10–15 times to reduce the sample’s viscosity and then placed on ice for 20 min. The lysate was centrifuged at 14,000 rpm for 20 min at 4°C, and the resulting liquid was collected.
2.7.2. Protein Quantification
The Pierce™ Rapid Gold BCA Protein Assay Kit (#A53226, Thermo Fisher Scientific, Sydney, NSW, Australia) was used to determine the protein concentration of the cell lysate in triplicate, using a bovine serum albumin (BSA) standard, following the manufacturer’s protocol (Eladwy et al., 2024; Jaye et al., 2023). In brief, 1 μL of each sample replicate was diluted 1:20 in Milli-Q water, along with 20 μL of each standard, and then placed in a 96-well plate with 200 μL of working reagent in each well. Samples were diluted to a concentration within the 20–2,000 μg/mL working range. The plate was thoroughly mixed on a plate shaker for 30 s, incubated at RT for 5 min, and then the absorbance was measured within 20 min at 480 nm using a microplate spectrophotometer (BMG CLARIOstar, Melbourne, VIC, Australia). The blank absorbance was subtracted from all other readings of standards and samples, and the sample concentration was determined using the established BSA standard calibration curve. The samples were then stored at −80°C for further analysis.
2.7.3. Peptides Preparation and Clean-Up
The protein samples (100 μg) were subjected to chemical and enzymatic sample processing using the EasyPep™ Mini MS Sample Prep Kit following the manufacturer’s instructions (Thermo Fisher Scientific, Sydney, NSW, Australia) and as reported in the literature (Dang et al., 2024; Eladwy et al., 2024; Jaye et al., 2023). Briefly, the sample volume was adjusted to 100 μL using a lysis buffer in a microcentrifuge tube. Subsequently, the reduction and alkylation solutions (50 μL each) were introduced, gently mixed, and incubated at 95°C with a heat block for 10 min. The samples were allowed to cool to RT, after which 50 μL of the reconstituted trypsin/lys-C protease mixture was added to each sample and incubated with shaking at 37°C for 3 h. Following incubation, 50 μL of a digestion stop solution was gently mixed into the samples. Peptide clean-up columns were used to remove both hydrophilic and hydrophobic impurities. The resulting clean peptide samples were dehydrated using a vacuum centrifuge and reconstituted in 100 μL of a 0.1% formic acid solution in water for LC–MS analysis. Subsequently, these samples were carefully transferred to maximum recovery sample vials (Waters Corp., Milford, MA, United States).
2.7.4. Label-Free Quantitative Proteomics Using Micro-High-Performance Liquid Chromatography Coupled with Quadruple Time-of-Flight Mass Spectrometry (Micro-HPLC-QTOF-MS)
Liquid Chromatography and Mass Spectrometry Setup
Label-free, bottom-up proteomic quantification was performed using a micro-high-performance liquid chromatography system (Waters M-Class) coupled with a SCIEX™ TripleTOF® 6600 quadrupole time-of-flight mass spectrometer, operated in positive electrospray ionisation mode (ESI+). A total of 4 µg of tryptic peptide digest was injected onto a nanoEase M/Z HSS T3 column (1.8 µm, 300 µm × 150 mm; Waters, 186009249) with an in-line Zorbax 300SB-C18 guard column (5 µm, 5 × 0.3 mm; Agilent Technologies, USA). The column temperature was maintained at 40 °C. Mobile phase A consisted of 98% water and 2% acetonitrile, and mobile phase B consisted of acetonitrile with 0.1% formic acid. The system operated at a 5 µL/min flow rate, with loading and column washing steps conducted at 7 µL/min. The LC gradient was as follows: 2–10% B over 1.66 min at 7 µL/min, 10–25% B from 1.67 to 21.67 min at 5 µL/min, followed by a sharp increase to 95% B from 23.33 to 24.67 min, held for 2 min, and re-equilibrated at 2% B for 9 min at 7 µL/min.
Mass Spectrometry Acquisition Parameters
The mass spectrometer had a DuoSpray™ ion source and a 25 μm internal diameter electrode. Data were acquired using the Analyst 1.8.1 software suite and associated LC control drivers. Key ion source parameters were: GS1 = 25, GS2 = 15, curtain gas = 20, ion spray voltage floating = 5500 V, and ion source temperature = 150 °C. The acquisition employed the SWATH™ data-independent acquisition (DIA) strategy, comprising an MS1 survey scan (m/z 350–1250, 50 ms accumulation) followed by 40 variable-width MS2 windows (m/z 400–1250), each with a 35 ms accumulation time, covering the full precursor m/z range. MS2 spectra were acquired in high-resolution mode across m/z 100–2000, with an overall cycle time of approximately 1.5 s.
Mass Calibration and Library Generation
PepCalMix calibrant (SCIEX, P/N 5045759; 10 fmol/µL), diluted 1:100 in 5% acetic acid and 2% acetonitrile, was injected every 12 samples to ensure mass accuracy. Six pooled quality control (QC) samples were used to construct a DIA-only spectral library using a gas-phase fractionation approach (Pino et al., 2020), covering m/z segments: 400–500, 500–600, 600–700, 700–800, 800–900, and 900–1000. The precursor isolation window was set to 5 m/z, with a collision energy spread of 5 eV, except for m/z 700–990 (8 eV) and 990–1000 (10 eV). Each DIA segment cycle time was 2.14 s, incorporating low- and high-energy scans with 40 ms MS2 accumulation.
Data Processing and Statistical Analysis
Data were processed using Spectronaut v19.5, which implemented the DirectDIA+ workflow with the Biognosys Standard (BGS) analysis framework. The canonical human reference proteome (UniProt, released 24 January 2024; 17,179 entries) was used as the reference database. Searches were conducted using Pulsar, with enzymatic specificity for trypsin/P and LysC/P, allowing up to 2 missed cleavages. Peptide lengths were restricted to 7–52 amino acids. Carbamidomethylation (C) was set as a fixed modification, while variable modifications included protein N-terminal acetylation, methionine oxidation, and methylation and demethylation. A maximum of five variable modifications per peptide was permitted. Peptide-spectrum matches (PSMs), peptides, and protein groups were filtered at a % false discovery rate (FDR) of 1%. Label-free quantification (LFQ) was performed automatically using MS2 area integration with default normalisation strategies. Protein inference employed the IDPicker algorithm.
Ingenuity Pathway Analysis (IPA, Qiagen)was implemented for pathway enrichment analyses using differentially expressed proteins (DEPs at absolute Log2FC 0.58 and Q 0.05) to identify canonical pathways responsible for the anticancer mechanisms of mono treatment vs. control and the synergistic effects of the combinations vs. the mono-treatments against the HKB-11 lymphoma cells.
Data Availability
The mass spectrometry proteomics data have been deposited in the ProteomeXchange Consortium via the PRIDE (Perez-Riverol et al., 2025) partner repository with the dataset identifier PXD063948.
2.8. Statistical Analysis
Data were collected and managed using MS Office Excel and GraphPad Prism for statistical analyses and visualisation. Data collection and analyses were carried out in triplicate, and the outcomes were presented as the mean ± standard deviation. Statistical significance between the mean values was determined at p < 0.05 employing a two-way ANOVA. Tukey and Dunnett’s tests were utilised within the GraphPad Prism software to perform nonlinear regression and multiple comparisons. Furthermore, GraphPad Prism software computed the IC50 value (representing the drug concentration required to achieve a 50% cell growth inhibition). The experimental groups in the proteomics study were compared statistically using unpaired t-tests, assuming equal variances. Candidate proteins were selected based on an absolute log2 fold change ≥ 0.58 and a Q-value ≤ 0.05. Enrichment analysis was subsequently conducted using Ingenuity Pathway Analysis (IPA), applying a significance threshold of adjusted Q ≤ 0.05 to identify functionally enriched pathways, focusing on those with an absolute z-score of ≥1.
3. Results and Discussions
3.1. Antiproliferative Activity of the Seven Postbiotics Against the HKB-11 (BL) Human Cell Line
The antiproliferative activities of seven postbiotics, including magnesium acetate, sodium propionate, sodium butyrate, inosine, N, UA, and UB, were evaluated against HKB-11 lymphoma cells over 72 hours using the Alamar Blue assay (Table 1).
Among these, N (IC50 = 1467 µM) and UB (IC50 = 87.56 µM) demonstrated the most potent inhibitory effects (p < 0.05). The comparative analysis of antiproliferative effects against HKB-11 lymphoma cells revealed statistically significant differences among the tested metabolites.
For instance, at 8000 µM, N showed complete inhibition of cell growth (100.26 ± 0.09%), which was significantly greater (p < 0.05) than sodium butyrate (57.83 ± 9.95%), sodium propionate (38.07 ± 10.39%), magnesium acetate (9.97 ± 3.12%), and inosine (30.91 ± 6.27%).
Moreover, similar trends were observed at 4000 µM, where N maintained total inhibition (100.21 ± 0.18%), statistically exceeding sodium butyrate, sodium propionate, magnesium acetate, and inosine. Furthermore, at 2000 µM, N (65.22 ± 1.35%) showed similar activity to that of sodium butyrate (45.36 ± 9.08%; p > 0.05), and greater activity compared to sodium propionate, magnesium acetate, and inosine (p < 0.05). This trend continued at 1000 and 500 µM of N. All postbiotics exhibited dose-dependent activity, exhibiting greater efficacy at higher doses.
As a bacteriocin, N has a well-established role in antimicrobial applications, but its anticancer potential is recently gaining recognition. Studies have demonstrated that N induces apoptosis in cancer cells through mitochondrial membrane disruption, generation of ROS, and modulation of pathways such as caspase activation and autophagy (Ahmed et al., 2023; Jaye et al., 2023; Preet et al., 2015; Shen et al., 2018). For example, Shen et al. (2018) reported that N significantly inhibited the proliferation of head and neck squamous cell carcinoma cells by increasing intracellular ROS and downregulating the Akt/mTOR signaling pathway (Shen et al., 2018). Furthermore, N’s ability to target cancer stem cells and enhance the efficacy of conventional chemotherapeutic agents such as doxorubicin makes it a desirable candidate for further research (Ahmed et al., 2023; Preet et al., 2015). Recent research by our group has provided additional mechanistic insights into the anti-proliferative action of N in breast adenocarcinoma (Jaye et al., 2023). Specifically, N induced significant apoptotic cell death in breast adenocarcinoma cell lines (MCF7 and MDA-MB-231) by modulating ROS production and potentially triggering cell cycle arrest (Jaye et al., 2023). Furthermore, proteomic analyses revealed alterations in proteins associated with cell cycle regulation, apoptosis, and cellular stress responses, indicating a multifaceted mode of action (Jaye et al., 2023). N’s impact on these cellular processes suggested that its anticancer effects extend beyond simple cytotoxicity, as it also interferes with the molecular machinery required for cancer cell survival and proliferation (Jaye et al., 2023). These findings underline N’s potential as a therapeutic agent, particularly in combination with other postbiotics or chemotherapeutic agents, to exploit synergistic effects and maximise efficacy.
UB also demonstrated significantly greater antiproliferative activity across all nine tested doses compared to UA (p < 0.05; Table 1). For instance, at 500 µM, UB inhibited cell growth by 81.81 ± 9.51%, significantly greater than UA (61.51 ± 13.44%; p < 0.05). This trend continued even at the lowest tested concentration of 1.953 µM. The IC50 values supported these findings, with UB showing the greatest potency with an IC50 of 87.56 µM, followed by UA at 384.41 µM; both substantially more active than N (1467 µM), sodium butyrate (2022 µM), and sodium propionate (14,597.14 µM). UB has been previously shown to induce apoptosis, impair cell proliferation, and modulate key signalling pathways in cancer cells. For instance, studies have demonstrated that UB can inhibit the NF-κB pathway, reducing inflammation and enhancing apoptosis in breast and colorectal cancer models (Stanisławska et al., 2017). Additionally, its ability to induce oxidative stress and mitochondrial dysfunction in cancer cells further underscores its potential (Djedjibegovic et al., 2020). UA, though less potent than UB, has been associated with beneficial effects on mitochondrial biogenesis and autophagy, which may contribute to its anticancer properties (Ryu et al., 2016).
The IC50 values of magnesium acetate and inosine could not be calculated due to insufficient antiproliferative activity at the tested doses (< 50%). Magnesium acetate consistently produced the weakest activity, with no apparent dose-dependent response, and was significantly less effective than the other treatments across all tested concentrations. Also, among the tested SCFAs, sodium butyrate demonstrated significantly greater activity (p < 0.05) and a clear dose-response than sodium propionate and magnesium acetate. Sodium butyrate was reported previously for its role as a HDAC inhibitor, inducing cell cycle arrest and apoptosis in various cancer types (Chen et al., 2015; Conaty, 2013; Lin et al., 2015; Riester et al., 2007). Overall, sodium propionate, magnesium acetate, and inosine exhibited limited efficacy in this study, suggesting a lower therapeutic priority for lymphoma models.The significant antiproliferative effects of N and UB against HKB-11 lymphoma cells highlight their potential as therapeutic agents. N’s strong efficacy and established safety profile make it an excellent candidate for immediate preclinical studies. Moreover, with its potent activity at low concentrations, UB provides a complementary avenue for therapeutic exploration. Therefore, the promising activities of N and UB make them suitable candidates for combination therapy.
3.2. The synergy of N with UB Against the HKB-11 Lymphoma Cells
Nine different ratios of N and UB- 1:9 v/v (800:450 μM), 2:8 v/v (1600:400 μM), 3:7 v/v (2400:350 μM), 4:6 v/v (3200:300 μM), 5:5 v/v (4000:250 μM), 6:4 v/v (4800:200 μM), 7:3 v/v (5600:150 μM), 8:2 v/v (6400:100 μM), and 9:1 v/v (7200:50 μM), were evaluated using Alamar Blue against the HKB-11 lymphoma cells. Synergistic interactions (CI values <1; Table 2) were observed between N and UB between IC75 and IC95 at all combinations. At the 4:6 combination (N 3200 μM and UB 300 μM), the CI value was observed to be as low as 0.09 at IC95 (Table 2).
Following the synergy study on HKB-11 human lymphoma cells, the most potent synergistic combination- N and UB at the 4:6 ratio, was further evaluated for its antiproliferative effects against Hs 313.T human lymphoma and HS-5 normal stromal cells (Table 3). The aim was to assess antiproliferative potency, selectivity, and therapeutic potential. The combination exhibited a dose-dependent inhibitory effect on both lymphoma cell lines. At the highest tested concentration of 3500 μM, the combination showed statistically similar cell growth inhibition values against both HKB-11 and Hs 313.T cell lines (p > 0.05; Table 3). Overall, Hs 313.T was more sensitive to the combination with a lower IC50 of 335.4 μM than HKB-11 cells (IC50 = 1304 μM). Specifically, at lower concentrations (1750, 875 and 437.5 μM), the combination exhibited significantly greater inhibition of Hs 313.T cells than the HKB-11 cells (p < 0.05; Table 3).
The impact of the combination on HS-5 normal stromal cells also followed a dose-dependent response (IC50 = 551.6 μM). At 3500 μM, cell viability was significantly reduced to 10.08 ± 4.01%, indicating cytotoxicity (Table 3). However, at lower concentrations, stromal cell viability improved markedly, reaching 92.32 ± 7.72% at 109.375 μM. At intermediate concentrations, such as 437.5 μM, stromal cell viability (66.37 ± 11.53%) remains high while inhibiting the growth of Hs 313.T lymphoma cells by 76.06 ± 4.43% (Table 3), highlighting a potential therapeutic window where cancer cells are effectively targeted while sparing normal cells (Blagosklonny, 2006; Chou & Talalay, 1984). Furthermore, the combination’s selectivity was further underscored by its lower IC50 against Hs 313.T, making it a promising candidate for subtype-specific therapies. These results suggested a dose-dependent inhibition pattern across all of the lymphoma cell lines. The Hs 313.T line consistently showed higher sensitivity to both combinations, implying a biological distinction potentially rooted in genetic or metabolic vulnerabilities. Additionally, the significantly lower IC50 values for Hs 313.T underscored the possibility of subtype-selective efficacy. Such differential sensitivity is a known phenomenon in cancer pharmacology and reflects the heterogeneous nature of tumour biology and potential variations in cellular mechanisms or metabolic responses between the two cancer cell lines (Du et al., 2019; Liu & Wang, 2024). The HKB-11 is a hybrid cell line derived from HEK293S and 2b8 Burkitt lymphoma cells (Mei et al., 2006). It carries a MYC rearrangement, mimicking the behaviour of high-grade B-cell lymphoma (Mei et al., 2006). Moreover, HKB-11 cells are more likely to exhibit aggressive or proliferative traits, making them a better model for studying oncogenic signalling, resistance, and treatment-induced pathway modulation (Mei et al., 2006). HKB-11 exhibits better growth characteristics, higher transfection efficiency, and a greater protein yield, making it more suitable for proteomic studies. These technical advantages are critical for mass spectrometry-based analyses and pathway enrichment.
3.3. ROS Production in the HKB-11 Lymphoma Cells After Treatment with Different Concentrations of N, UB and N: UB (4:6)
Oxidative stress, characterised by an increase in ROS, is a hallmark of carcinogenesis, playing a pivotal role in cancer initiation, progression, and metastasis (Pelicano et al., 2004; Trachootham et al., 2009). Inhibiting ROS production is a promising strategy for developing anticancer drugs (Schumacker, 2006). This study investigated the effects of N, UB and their synergistic combination (4:6) on oxidative stress in HKB-11 lymphoma cells (Figure 1). The results are expressed as fold changes in ROS levels, providing insight into the potential of these compounds to modulate oxidative stress. N, UB, and their combination (N:UB) at the highest concentrations reduced ROS production in HKB-11 lymphoma cells compared to the established ROS inducer, tert-butyl hydroperoxide (TBHP), as shown in Figure 1. Doxorubicin (Dox) was included for comparative purposes.
Treatment with N alone, at concentrations of 8000 μM, resulted in a statistically significant increase in ROS levels compared to the untreated control (p ≤ 0.01), emphasising N’s strong oxidative potential. Furthermore, this dose-dependent rise of ROS supported the hypothesis that N possesses pro-oxidative activity, potentially inducing oxidative stress-mediated apoptosis in lymphoma cells. Elevated ROS levels can disrupt mitochondrial function, induce DNA damage, and promote cancer cell death (Trachootham et al., 2009; Valko et al., 2006). In contrast, UB administered alone (at 500 μM and 250 μM) induced only minimal changes in ROS levels, which were statistically comparable to those of the untreated control (p > 0.05). This suggested that UB may have a neutral or possibly antioxidant role, consistent with findings that some compounds help modulate oxidative environments without directly elevating ROS (Reuter et al., 2010).
Interestingly, the combination of N and UB (4:6; 3500 μm N:1750 μm UB) showed a modest increase in ROS levels; however, this increase was statistically similar to that of the untreated control (p > 0.05). Also, the positive controls, Dox (4 μM) and TBHP (150 μM), induced high ROS production, validating the assay’s sensitivity and serving as benchmarks for oxidative stress induction. Dox is well-known for its redox cycling properties and mitochondrial disruption, which leads to cell death (Minotti et al., 2004). Additionally, these results have important therapeutic implications. The strong ROS induction by N at 8000 μM alone suggested its potential use as a pro-oxidative agent in cancer therapy, capitalising on the vulnerability of cancer cells to oxidative stress (Pelicano et al., 2004). Meanwhile, the antioxidative effect of UB in combination therapy could help mitigate collateral damage to normal cells, offering a more selective and safer treatment strategy. In summary, our findings demonstrated that while N can significantly elevate ROS at higher doses and potentially induce apoptosis in cancer cells, its combination with UB provides a balanced oxidative profile. This approach may enable effective tumour targeting with reduced toxicity, thereby supporting the development of synergistic combination therapies for lymphoma.
3.4. Flow Cytometric Analyses of Apoptotic Profiles of HKB-11 Lymphoma Cells After Treatment with Different Concentrations of N, UB and N: UB (4:6)
Flow cytometry was used to assess the apoptotic responses in HKB-11 lymphoma cells following 24-h exposure to the most potent N (8000 μM) and UB (500 μM) (chosen based on the findings of the Alamar Blue and ROS assays), and the most potent synergistic combination 4:6 (3500 μM) and its individual components N (3200 μM) and UB (300 μM). As shown in Figure 2A, N at 8000 μM significantly increased cell death relative to untreated controls (p < 0.01), with marked elevations in both apoptotic and necrotic populations. However, at 3200 µM, N induced apoptosis with greater potency (p < 0.01) than at 8000 μM. UB demonstrated a dose-dependent apoptotic effect, i.e., the 500 µM concentration of UB produced a greater apoptotic induction (p < 0.0001) compared to the untreated control, followed by 300 µM. Moreover, combination treatments of N and UB (4:6; 3500 µM) produced significantly higher apoptosis levels than their mono treatments (p < 0.05). This combination triggered an increase in both apoptotic (p < 0.05) and necrotic cell populations (p < 0.01) compared to the untreated control, indicating a synergistic effect. Additionally, Dox (4 µM) significantly induced apoptosis as a positive control (p < 0.0001), and its efficacy was comparable to high-dose UB treatments (p < 0.0001), validating the assay sensitivity and providing a reference for therapeutic comparison. However, Dox treatment also induced a markedly higher proportion of necrotic cell death compared to the untreated control and other treatment groups.
This increase in necrosis is not considered therapeutically advantageous. Unlike apoptosis, a controlled and non-inflammatory form of cell death, necrosis results in the rupture of the cell membrane and the release of intracellular contents into the surrounding tissue (D’arcy, 2019; Davidovich et al., 2014) , triggering local inflammation and recruiting immune cells, potentially exacerbating tissue damage and systemic side effects (Davidovich et al., 2014). Clinically, this inflammatory response can contribute to cardiotoxicity, mucositis, and fatigue, all of which are commonly reported complications of Dox therapy (Sheibani et al., 2022). Furthermore, these findings are consistent with emerging studies linking necroptotic signatures to chemotherapeutic overload (Kuszczak et al., 2025). In contrast, treatments that primarily induce apoptosis, such as N and UB in this study, are more favourable for targeted tumour clearance with reduced collateral damage. Therefore, while Dox effectively reduces tumour burden, its necrotic profile highlights the need for safer alternatives or combinatorial strategies that minimise necrosis and its associated toxicities.
In summary, UB at 500 µM induced the greatest level of apoptosis in HKB-11 lymphoma cells, significantly outperforming both the untreated control (p < 0.0001) and the high-dose N treatment. However, the combination of N and UB in a 4:6 ratio (p < 0.01) triggered a stronger apoptotic response than either compound alone, including UB at 300 µM (p < 0.05). Therefore, this suggested a synergistic effect where the combined treatment enhances cell death more efficiently than the individual compounds. Mechanistically, UB promotes mitochondrial-driven apoptosis by modulating oxidative phosphorylation and activating pro-apoptotic signalling, while N induces membrane disruption and oxidative stress through ROS generation (Bhutia et al., 2019; Sadri et al., 2022). These distinct yet converging mechanisms likely account for the superior efficacy of the combination. Using N and UB together may also allow for lower individual doses, minimising toxicity while maximising therapeutic impact, highlighting the N:UB (4:6) combination as a more effective and rational approach for lymphoma treatment. The apoptosis induced by N and UB may involve the intrinsic (mitochondrial) and extrinsic (death receptor-mediated) pathways (Kuszczak et al., 2025). Moreover, these findings align with contemporary research demonstrating that modulation of apoptosis through novel drug conjugates or dual-target inhibitors is pivotal in overcoming resistance in lymphoma (Rossi et al., 2025; Wang et al., 2025).
3.5. Proteomics Study of the HKB-11 Lymphoma Cells Treated with the Synergistic Combination vs. Mono Treatments
A bottom-up, label-free quantification proteomics analysis was carried out using Micro-UPLC-QTOF-MS/MS, based on a recent protocol developed by our group. The goal was to identify significant changes in the expressed proteins related to apoptosis, cancer development, cell cycle and broad cell death functions. HKB-11 lymphoma cells were treated with: N (3200 µM), UB (300 µM), and their combination 4:6 (3500 µM). Furthermore, each treatment group was compared to the control group to detect changes in the global proteome that might be associated with the antiproliferative effects. Differentially expressed proteins were selected based on strict statistical thresholds of absolute log2 FC ≥ 0.58 and Q ≤ 0.05.
3.5.1. Differentially Expressed Proteins (DEPs) in N (3200 µM) Treated HKB-11 Lymphoma Cells Compared to Untreated Control (abs log2FC ≥ 0.58 and Q ≤ 0.05)
LCMS-based bottom-up proteomic profiling of HKB-11 lymphoma cell lysate after treatment with N at 3200 µM, and DEPS were listed in Table S1, with the Ingenuity Pathway Analysis (IPA) enrichment report listed in Table S2 (Supplementary File A). Moreover, Table 4 lists the anticancer-related proteins dysregulated upon N treatment. Furthermore, Figure 3A shows the IPA graphical summary, along with the volcano plot in Figure 3B of N compared to the untreated control cell lysate.
The IPA graphical summary in Figure 3A offers a concise visualisation of the key biological insights derived from the IPA Core Analysis. It highlights and links a selected subset of the most statistically relevant entities, such as upstream regulators and biological functions, into an integrated overview. By leveraging machine learning, the system prioritises these entities and infers potential relationships, even when direct connections are not yet documented in the QIAGEN Knowledge Graph. These inferred links help depict the broader biological context and interactions uncovered in the analysis.
IPA summary upon using DEPs of N vs untreated control revealed several key biological themes central to the network that emerged as a dominant concept, influenced by regulators such as C3, CTNNB1, HGF, NRAS, and TBX3, all of which contribute to maintaining or disrupting cellular survival (Szilveszter et al., 2024). The inhibition of cell cycle progression is closely linked and regulated by similar factors, including CTNNB1 and HGF, indicating their role in governing cell division and growth processes essential for proper cellular and organismal development (Santos et al., 1993; Szilveszter et al., 2024). Cell migration and motility also play a critical role in the network, with CTNNB1 and HGF significantly impacting carcinoma cell movement, thereby connecting this theme to processes such as tissue repair and cancer metastasis. Lastly, organismal growth is strongly affected by CTNNB1, HGF, and TBX3, pointing to their influence on developmental biology (Khan et al., 2020; Santos et al., 1993; Szilveszter et al., 2024). The N treatment also inhibited several vital proliferative and survival pathways in the HKB-11 cells. Proteins essential for nucleotide synthesis, DNA replication, and stress response, such as TYMS (Log2FC = -1.54), LARP1 (Log2FC = -1.27), MAPK14 (Log2FC = -0.80), SRPK2 (Log2FC = -0.70), CDK4 (Log2FC = -1.26), PRC1 (Log2FC = -0.72), RFC1 (Log2FC = -0.85), RFC2 (Log2FC = -0.59), and PCNA (Log2FC = -0.63), were notably downregulated. The reduced expression of TYMS directly inhibits DNA synthesis, thereby impairing cell proliferation (Matuszyk, 2022; Peplow, 2024). Likewise, diminished LARP1 and MAPK14 levels indicated potential suppression of mTOR-mediated translation and stress-responsive mitogenic signalling pathways, crucial for cancer cell survival (García-Hernández et al., 2021; Mura et al., 2015). Furthermore, downregulation of CDK4, PRC1, RFC1, RFC2, and PCNA was previously linked to a significant inhibition of cell cycle progression, particularly halting the G1/S transition and DNA synthesis phase, resulting in cell cycle arrest and apoptosis (Schmidt et al., 2001; Strzalka & Ziemienowicz, 2011; Sturm et al., 2016). Moreover, decreased HDAC1 expression (Log2FC = -0.67) observed in this study may contribute to tumour inhibition through epigenetic modulation, enhancing susceptibility to apoptosis (Gallinari et al., 2007).
Figure 3 illustrates enriched pathways (IPA, Q < 0.05, absolute z-score ≥ 2 or ≤ -2) linked explicitly to cell adhesion, cancer proliferation, and mRNA processing. The altered expression profiles suggested a dual impact of N treatments, suppressing key cell cycle and DNA replication pathways while disrupting metabolic processes essential for tumour survival. Additionally, proteins such as CTNNB1, HGF, and TBX3, which are involved in cell viability, movement, migration, and organismal growth, indicate broader implications of genetic modulation on developmental biology and disease dynamics, as the same genes that control development often drive disease when dysregulated. However, mutations or altered expression can lead to cancer, fibrosis, or developmental disorders (Ghosh et al., 2025; Li et al., 2021; Wang, 2021). In summary, these findings depict a complex interplay induced by N treatment, balancing proliferative adaptations with robust inhibitory mechanisms, ultimately influencing lymphoma cell viability and tumour progression pathways.
3.5.2. Differentially Expressed Proteins (DEPs) in UB (300 µM) Treated HKB-11 Lymphoma Cells Compared to Untreated Control (abs log2FC > 0.58 and Q < 0.05)
The IPA graphical summary in Figure 4B highlights several biological themes enriched by significantly regulated proteins (Q ≤ 0.05, Abs log2FC ≥ 0.58) upon UB treatment. One major theme is metabolic regulation and mitochondrial function, which suggested significant regulation of metabolic pathways and mitochondrial activities, particularly via PPARGC1A (PGC-1α). This component plays a central role in fatty acid metabolism, molecule transport, and mitigating mitochondrial dysfunction, positioning it as a key regulator of mitochondrial biogenesis and energy metabolism (Rius-Pérez et al., 2020). Another important theme is the proliferation and invasion of cancer cells, where proteins such as CDK4, EGF, and ERBB2 play a crucial role in controlling the growth and metastasis of carcinoma cell lines. This theme is crucial for understanding the mechanisms of cancer progression and identifying potential therapeutic targets. The theme of insulin resistance and hepatic steatosis was also prominent, with genes such as CLPP, IGF1R, and PPARGC1A influencing metabolic disorders like diabetes and non-alcoholic fatty liver disease (NAFLD), indicating potential pathways for intervention (Qiu et al., 2023). Lastly, the theme of genitourinary tumours is highlighted, where ERBB2 and IGF1R are involved in pathways leading to the development and progression of genitourinary cancers. This theme offers insights into cancers affecting the urinary and reproductive systems and explores potential therapeutic options.
Comprehensive proteomic profiling of HKB-11 lymphoma cells after treatment with UB at 300 µM is in the attached supplementary_1, with tables S1 and S3 summarised in Table 5 and visualised in Figure 4 (A and B). Treatment with UB significantly enhanced mitochondrial activity in lymphoma cells, prominently upregulating key components of the mitochondrial respiratory chain, including COX6C (Log2FC = 2.07), COX7C (Log2FC = 2.08), MT-CO2 (Log2FC = 2.34), MT-ND4 (Log2FC = 2.24), and NDUFA11 (Log2FC = 2.01), as illustrated in Figure 4. This mitochondrial reprogramming was underscored by enhanced oxidative phosphorylation, which is essential for ATP production and cellular survival under oxidative stress conditions commonly present in tumour microenvironments (Vikramdeo et al., 2022; Xu et al., 2023). In contrast, treatment with UB also induced notable downregulation of critical proteins involved in mitotic progression and proteostasis, such as MAD2L1 (Log2FC = -1.45), UBE2S (Log2FC = -1.21), and UBE2E1 (Log2FC = -1.69). However, these proteins are pivotal in ensuring accurate cell cycle progression and genomic stability. Their suppression indicated disruption of mitotic control mechanisms, leading to mitotic arrest, increased genomic instability, and apoptosis (Bates et al., 2020; Garnett et al., 2009; Maffeo & Cilloni, 2024). Thus, UB treatment reveals a dual action mechanism that simultaneously enhances mitochondrial metabolic resilience and impairs cell division pathways, collectively influencing lymphoma cell fate.
3.5.3. Differentially Expressed Proteins (DEPs) in Combo N:UB (4:6) Treated HBK-11 Cells vs Mono Treatments (N 3200 µM and UB 300 µM) (abs log2FC ≥ 0.58 and Q ≤ 0.05)
The IPA graphical summary Figure 5B reveals key biological themes enriched within the gene network, based on significantly regulated proteins (Q ≤ 0.05, Abs log2FC ≥ 0.58). A central theme is the inflammatory response, prominently influenced by genes such as EDN1, F2, and HNF4A, which drive increased inflammation by activating pathways associated with myeloid cells and immune signalling (Subbian et al., 2013; Yang et al., 2022). Closely related is the activation of immune cells, with EDN1, INSR, IL4, and others playing roles in stimulating antigen-presenting cells, leukocytes, and phagocytes, highlighting immune activation as a core network component. Another key theme is fatty acid metabolism, governed by the actions of EDN1, F2, and SREBF1, underscoring the relevance of lipid processing and energy utilisation in the system (Bionaz et al., 2012; Khan et al., 2024; Shimano & Sato, 2017). Cell movement, especially that of phagocytes, also emerges as a significant motif, facilitated by ACSS2, EDN1, and IL4, which are critical for immune surveillance and tissue remodelling (Mohammad; Parra-Medina et al.). Lastly, the transport of molecules is a recurring and interconnected theme, with involvement from F2, HNF4A, INSR, IL4, NTRK1, and SREBF1, indicating the pivotal role of intracellular and intercellular transport in maintaining functional homeostasis within the biological network (Errafii, 2022).
Comprehensive proteomic profiling of HKB-11 lymphoma cells after treatment with N:UB (4:6), N 3200 µM and UB 300 µM is in the attached supplementary_1, with tables S1 and S4 summarised in Table 5 and visualised in Figure 5 (A and B). Combination therapy using N and UB (4:6) intensified anticancer effects via multiple complementary mechanisms. Notably, proteins crucial to metabolic reprogramming were significantly upregulated, including NNMT (log2FC = 2.46), which alters NAD+ metabolism, potentially restricting tumour growth through metabolic modulation (Sun et al., 2024). Additionally, proteins involved in immune modulation and tumour microenvironment remodelling, such as A2M (log2FC = 2.30) and SERPINF1 (log2FC = 2.27), were also elevated, suggesting a potential reduction in tumour invasiveness and angiogenesis (Lagrange et al., 2022; Mathew et al., 2024). Conversely, key regulators of cell cycle progression and chromosome segregation BUB3 (log2FC = -0.75), CCNB1 (log2FC = -1.18), CDCA8 (log2FC = -0.60), and CDK1 (log2FC = -0.66) were markedly downregulated. This suppression potentially indicated disrupted mitotic progression, genomic instability, and potential mitotic catastrophe, ultimately arresting tumour proliferation (Fatma & Kumar, 2021; Li, 2024; Sarkar et al., 2021; Zhang et al., 2020).
Comparative pathway analysis demonstrated enhanced effects unique to the combination treatment. Figure 6A reveals significantly altered canonical pathways, notably those governing cell cycle regulation, oxidative stress response, and immune-related signalling such as IL-6, TREM1, and NF-κB. Figure 6B presents enriched disease and biological functions, emphasising the suppression of tumour proliferation, reduced metastatic potential, and heightened activation of leukocyte migration and immune cell responses. Figure 6C shows key upstream regulators affected by the combination, with predicted inhibition of MYC and activation of tumour-suppressive mediators including TP53 and IFNG, reinforcing the synergistic modulation of oncogenic and immunological networks. Collectively, these proteomic findings highlighted a nuanced interplay among metabolic adjustments, mitochondrial flexibility, immune regulation, and cell cycle inhibition. Thus, the data robustly supported the therapeutic efficacy of N and UB, individually and synergistically, in lymphoma management by targeting pivotal cellular pathways essential for tumour cell survival and proliferation.
4. Conclusions
This research provided robust evidence supporting the therapeutic potential of N and UB against lymphoma, with significant antiproliferative and pro-apoptotic effects individually and synergistically against the HKB-11 lymphoma cell line. Moreover, the monotherapies and their combination significantly outperformed in both HKB-11 and Hs 313.T lymphoma cell lines, with selective cytotoxicity sparing HS-5 normal stromal cells at lower concentrations, suggesting a favourable therapeutic window. Furthermore, flow cytometry results revealed that a higher dose of UB (500 µM) was the most potent inducer of apoptosis. However, the combination of N and UB in a 4:6 ratio triggered a stronger apoptotic response than either monotherapy- N at 3200 and UB at 300 µM. Our findings demonstrated that while N can significantly elevate ROS at higher doses and potentially induce apoptosis in cancer cells, its combination with UB provides a balanced oxidative profile. Additionally, proteomics analysis further indicated that N (3200 µM) treatment resulted in widespread downregulation of proteins essential for cell cycle progression and nucleotide metabolism, such as CDK4, PRC1, RFC1, PCNA, and TYMS. These changes reflected a potential blockade of cell cycle progression and DNA synthesis stages, promoting replication stress and apoptotic signalling. Additionally, suppression of LARP1 and MAPK14 indicated probable impairment of mTOR signalling and cellular stress responses in the HKB-11 cells, further reducing proliferative potential. UB (300 µM) treatment induced a significant mitochondrial shift, upregulating components of the electron transport chain, including COX6C, MT-CO2, and NDUFA11, which suggests an enhanced oxidative phosphorylation capacity. Furthermore, this metabolic reprogramming likely supported energy-dependent survival under oxidative stress. However, it was counterbalanced by marked downregulation of mitotic checkpoint proteins, including MAD2L1, UBE2S, and UBE2E1, indicating potential mitotic arrest and increased genomic instability. Notably, the N and UB combination elicited a synergistic response, characterised by coordinated effects on metabolism, cell division, and immune evasion. Notable upregulation of NNMT indicated altered NAD+ metabolism and tumour metabolic stress in the HKB-11 cells. Additionally, the upregulation of A2M and SERPINF1 suggested enhanced immune-modulatory and anti-angiogenic effects, potentially limiting tumour invasion and vascularisation. Similarly, suppression of BUB3, CCNB1, CDCA8, and CDK1 supported mitotic disruption and proliferative collapse in the HKB-11 lymphoma cells upon treatment with the N and UB combination. In conclusion, these findings presented compelling evidence that postbiotic therapies, particularly the N and UB combination, could significantly advance research on lymphoma treatment. This study has its limitations as it is primarily focused on cellular models. Future research should include preclinical validation in animal models, pharmacokinetic and pharmacodynamic assessments, and eventual clinical trials to establish the safety, efficacy, and therapeutic applicability of N and UB. Overall, the combination therapy significantly enhanced cancer cell apoptosis, modulated oxidative stress, and induced substantial proteomic changes in key cancer-related pathways, including lipid metabolism, mitochondrial respiration, and cell cycle regulation, in the HKB-11 lymphoma cell line.
Supplementary Materials
The following supporting information can be downloaded at the website of this paper posted on Preprints.org.
Author Contributions
A.K.: designed the experiments and drafted the manuscript, performed the experiments, conceptualisation, Data analysis, Formal analysis, Investigation, Project administration, methodology, writing, original draft, review & editing, figures, visualisation. M.A.: Data analysis, Methodology, Writing—review & editing. G.W.M.: Writing—review & editing. D.C.: Writing—review & editing. D.J.B.: designed the experiments and drafted the manuscript, conceptualisation, investigation, visualisation, funding, supervision, Writing—original draft, Writing—review & editing. All authors have read and agreed to the published version of the manuscript.
Funding
This research received no external funding.
Institutional Review Board Statement
In this section, you should add the Institutional Review Board Statement and approval number, if relevant to your study. You might choose to exclude this statement if the study did not require ethical approval. Please note that the Editorial Office might ask you for further information. Please add “The study was conducted in accordance with the Declaration of Helsinki, and approved by the Institutional Review Board (or Ethics Committee) of NAME OF INSTITUTE (protocol code XXX and date of approval).” for studies involving humans. OR “The animal study protocol was approved by the Institutional Review Board (or Ethics Committee) of NAME OF INSTITUTE (protocol code XXX and date of approval).” for studies involving animals. OR “Ethical review and approval were waived for this study due to REASON (please provide a detailed justification).” OR “Not applicable” for studies not involving humans or animals.
Informed Consent Statement
Any research article describing a study involving humans should contain this statement. Please add “Informed consent was obtained from all subjects involved in the study.” OR “Patient consent was waived due to REASON (please provide a detailed justification).” OR “Not applicable.” for studies not involving humans. You might also choose to exclude this statement if the study did not involve humans.Written informed consent for publication must be obtained from participating patients who can be identified (including by the patients themselves). Please state “Written informed consent has been obtained from the patient(s) to publish this paper” if applicable.
Acknowledgments
We acknowledge the support of Western Sydney University, Australia, through the PhD Scholarship Program (Ahmad K. Al-Khazaleh) and the Research Support Program Fellowship (Deep Jyoti Bhuyan), which enabled us to conduct this research. The authors also acknowledge the Freedman Foundation Metabolomics Facility at the Innovation Centre, Victor Chang Cardiac Research Institute, which is supported by funding from the New South Wales (NSW) Government. The authors acknowledge and pay respect to the traditional owners, the Darug People (the Darug Nation: Western Sydney University, Westmead and Penrith Campuses), the Bidigal People (the Dharawal Nation: Western Sydney University, Campbelltown Campus).
Data Availability Statement
The original contributions presented in this study are included in the article and supplementary material. Further inquiries can be directed to the corresponding author.
Conflicts of Interest
As a medical research institute, the NICM Health Research Institute (NICM HRI) receives grants and donations from various sources, including foundations, universities, government agencies, individuals, and the private sector. Sponsors and donors also provide untied funding to advance the vision and mission of NICM HRI. The authors declare that the research was conducted in the absence of any commercial or financial relationships that could be construed as a potential conflict of interest.
References
- Ahmed, S. S. T. S., Abdulrahman, Z. F. A., & Othman, R. T. (2023). Anticancer activity of cloned Nisin as an alternative therapy for MCF-7 brest cancer cell line. Cellular and Molecular Biology, 69(9), 149-155. [CrossRef]
- Al-Khazaleh, A. K., Chang, D., Münch, G. W., & Bhuyan, D. J. (2024). The Gut Connection: Exploring the Possibility of Implementing Gut Microbial Metabolites in Lymphoma Treatment. Cancers, 16(8), 1464. https://www.mdpi.com/2072-6694/16/8/1464. [CrossRef] [PubMed]
- Alexander, E. T., & Gilmour, S. K. (2022). Immunomodulatory role of thrombin in cancer progression. Molecular Carcinogenesis, 61(6), 527-536. [CrossRef] [PubMed]
- Alsherbiny, M. A., Bhuyan, D. J., Low, M. N., Chang, D., & Li, C. G. (2021). Synergistic interactions of cannabidiol with chemotherapeutic drugs in mcf7 cells: Mode of interaction and proteomics analysis of mechanisms. International Journal of Molecular Sciences, 22(18), 10103. [CrossRef]
- Alsofyani, A. A., & Nedjadi, T. (2023). Gelsolin, an actin-binding protein: bioinformatic analysis and functional significance in urothelial bladder carcinoma. International Journal of Molecular Sciences, 24(21), 15763. [CrossRef] [PubMed]
- Ansell, S. M. (2015). Non-Hodgkin lymphoma: diagnosis and treatment. Mayo Clinic Proceedings,.
- Bano, D., Dinsdale, D., Cabrera-Socorro, A., Maida, S., Lambacher, N., McColl, B., Ferrando-May, E., Hengartner, M., & Nicotera, P. (2010). Alteration of the nuclear pore complex in Ca2+-mediated cell death. Cell Death & Differentiation, 17(1), 119-133.
- Bao, Y., Ni, Y., Zhang, A., & Chen, J. (2024). PPP1R14B as a potential biomarker for the identification of diagnosis and prognosis affecting tumor immunity, proliferation and migration in prostate cancer. Journal of Cancer, 15(20), 6545. [CrossRef]
- Bates, M., Furlong, F., Gallagher, M. F., Spillane, C. D., McCann, A., O’Toole, S., & O’Leary, J. J. (2020). Too MAD or not MAD enough: The duplicitous role of the spindle assembly checkpoint protein MAD2 in cancer. Cancer Letters, 469, 11-21. [CrossRef]
- Berni Canani, R., Di Costanzo, M., & Leone, L. (2012). The epigenetic effects of butyrate: potential therapeutic implications for clinical practice. Clinical epigenetics, 4, 1-7. [CrossRef]
- Bhat, M. I., & Kapila, R. (2017). Dietary metabolites derived from gut microbiota: critical modulators of epigenetic changes in mammals. Nutrition reviews, 75(5), 374-389. [CrossRef]
- Bhutia, S. K., Naik, P. P., Panigrahi, D. P., Bhol, C. S., & Mahapatra, K. K. (2019). Mitophagy, Diseases, and Aging. Models, Molecules and Mechanisms in Biogerontology: Physiological Abnormalities, Diseases and Interventions, 177-191.
- Bionaz, M., Thering, B. J., & Loor, J. J. (2012). Fine metabolic regulation in ruminants via nutrient–gene interactions: saturated long-chain fatty acids increase expression of genes involved in lipid metabolism and immune response partly through PPAR-α activation. British Journal of Nutrition, 107(2), 179-191. [CrossRef]
- Blagosklonny, M. V. (2006). Target for cancer therapy: proliferating cells or stem cells. Leukemia, 20(3), 385-391. [CrossRef] [PubMed]
- Blom, A. M., Villoutreix, B. O., & Dahlbäck, B. (2004). Complement inhibitor C4b-binding protein—friend or foe in the innate immune system? Molecular immunology, 40(18), 1333-1346. [CrossRef]
- Brandão, S. R., Carvalho, F., Amado, F., Ferreira, R., & Costa, V. M. (2022). Insights on the molecular targets of cardiotoxicity induced by anticancer drugs: A systematic review based on proteomic findings. Metabolism, 134, 155250. [CrossRef] [PubMed]
- Chen, C., Liu, P., Duan, X., Cheng, M., & Xu, L. X. (2019). Deferoxamine-induced high expression of TfR1 and DMT1 enhanced iron uptake in triple-negative breast cancer cells by activating IL-6/PI3K/AKT pathway. OncoTargets and therapy, 4359-4377.
- Chen, P.-J., Huang, C., Meng, X.-M., & Li, J. (2015). Epigenetic modifications by histone deacetylases: Biological implications and therapeutic potential in liver fibrosis. Biochimie, 116, 61-69. [CrossRef]
- Cho, M. S., Yee, H., & Chan, S. (2002). Establishment of a human somatic hybrid cell line for recombinant protein production. Journal of Biomedical Science, 9(6), 631-638. [CrossRef]
- Chou, T.-C., & Talalay, P. (1984). Quantitative analysis of dose-effect relationships: the combined effects of multiple drugs or enzyme inhibitors. Advances in enzyme regulation, 22, 27-55. [CrossRef]
- Ciciarello, M., Mangiacasale, R., & Lavia, P. (2007). Spatial control of mitosis by the GTPase Ran. Cellular and Molecular Life Sciences, 64, 1891-1914.
- Conaty, L. D. (2013). The effects of sodium butyrate on Hox gene expression in a human colorectal adenocarcinoma cell line, HT29 East Carolina University].
- Costa e Silva, L., dos Santos, M. H., Heluy, T. R., Biaggio, R. T., Ferreira, A. R., Milhomens, J., Kashima, S., El Nemer, W., El Hoss, S., & Picanço-Castro, V. (2020). Serum-free suspension cultured human cells can produce a high-level of recombinant human erythropoietin. Engineering Reports, 2(6), e12172. [CrossRef]
- Cramer, P. (2004). Structure and function of RNA polymerase II. Advances in protein chemistry, 67, 1-42.
- Cui, J., Lian, Y., Zhao, C., Du, H., Han, Y., Gao, W., Xiao, H., & Zheng, J. (2019). Dietary fibers from fruits and vegetables and their health benefits via modulation of gut microbiota. Comprehensive Reviews in Food Science and Food Safety, 18(5), 1514-1532. [CrossRef]
- D’Arca, D., Severi, L., Ferrari, S., Dozza, L., Marverti, G., Magni, F., Chinello, C., Pagani, L., Tagliazucchi, L., & Villani, M. (2023). Serum mass spectrometry proteomics and protein set identification in response to FOLFOX-4 in drug-resistant ovarian carcinoma. Cancers, 15(2), 412.
- D’arcy, M. S. (2019). Cell death: a review of the major forms of apoptosis, necrosis and autophagy. Cell biology international, 43(6), 582-592.
- Dang, V. B., Alsherbiny, M. A., Lin, R., Gao, Y., Li, C., & Bhuyan, D. J. (2024). Impact of a Functional Dairy Powder and Its Primary Component on the Growth of Pathogenic and Probiotic Gut Bacteria and Human Coronavirus 229E. International Journal of Molecular Sciences, 25(17), 9353. https://pmc.ncbi.nlm.nih.gov/articles/PMC11394815/pdf/ijms-25-09353.pdf. [CrossRef] [PubMed]
- Davidovich, P., Kearney, C. J., & Martin, S. J. (2014). Inflammatory outcomes of apoptosis, necrosis and necroptosis. Biological chemistry, 395(10), 1163-1171.
- De Francesco, E. M., Bonuccelli, G., Maggiolini, M., Sotgia, F., & Lisanti, M. P. (2017). Vitamin C and Doxycycline: A synthetic lethal combination therapy targeting metabolic flexibility in cancer stem cells (CSCs). Oncotarget, 8(40), 67269.
- Dissanayake, I. H., Alsherbiny, M. A., Chang, D., Li, C. G., & Bhuyan, D. J. (2023). Antiproliferative effects of Australian native plums against the MCF7 breast adenocarcinoma cells and UPLC-qTOF-IM-MS-driven identification of key metabolites. Food Bioscience, 54, 102864. [CrossRef]
- Djedjibegovic, J., Marjanovic, A., Panieri, E., & Saso, L. (2020). Ellagic acid-derived urolithins as modulators of oxidative stress. Oxidative medicine and cellular longevity, 2020(1), 5194508.
- Du, F.-Y., Zhou, Q.-F., Sun, W.-J., & Chen, G.-L. (2019). Targeting cancer stem cells in drug discovery: Current state and future perspectives. World journal of stem cells, 11(7), 398. [CrossRef] [PubMed]
- El-Wetidy, M. S., Ahmad, R., Rady, I., Helal, H., Rady, M. I., Vaali-Mohammed, M.-A., Al-Khayal, K., Traiki, T. B., & Abdulla, M.-H. (2021). Urolithin A induces cell cycle arrest and apoptosis by inhibiting Bcl-2, increasing p53-p21 proteins and reactive oxygen species production in colorectal cancer cells. Cell stress and chaperones, 26, 473-493.
- Eladwy, R. A., Alsherbiny, M. A., Chang, D., Fares, M., Li, C.-G., & Bhuyan, D. J. (2024). The postbiotic sodium butyrate synergizes the antiproliferative effects of dexamethasone against the AGS gastric adenocarcinoma cells. Frontiers in Nutrition, 11, 1372982. [CrossRef]
- Errafii, K. (2022). Identification of the Long Non-Coding RNAs and the Signaling Pathways Involved in the Protective Effect of the Glucagon-Like Peptide-1 Receptor Agonist Exendin-4 on Hepatic Steatosis Hamad Bin Khalifa University (Qatar)].
- Fang, W., Wan, D., Yu, Y., & Zhang, L. (2024). CLEC11A expression as a prognostic biomarker in correlation to immune cells of gastric cancer. Biomolecules and Biomedicine, 24(1), 101.
- Fatma, F., & Kumar, A. (2021). The Cell Cycle, Cyclins, Checkpoints and Cancer.
- Ferlay, J., Ervik, M., Lam, F., Colombet, M., Mery, L., Piñeros, M., Znaor, A., Soerjomataram, I., & Bray, F. (2021). Global cancer observatory: cancer today. Lyon: International Agency for Research on Cancer; 2020. Cancer Tomorrow.
- Gallinari, P., Marco, S. D., Jones, P., Pallaoro, M., & Steinkühler, C. (2007). HDACs, histone deacetylation and gene transcription: from molecular biology to cancer therapeutics. Cell research, 17(3), 195-211. [CrossRef]
- Gandhi, G. R., Antony, P. J., Ceasar, S. A., Vasconcelos, A. B. S., Montalvão, M. M., Farias de Franca, M. N., Resende, A. d. S., Sharanya, C. S., Liu, Y., & Hariharan, G. (2024). Health functions and related molecular mechanisms of ellagitannin-derived urolithins. Critical Reviews in Food Science and Nutrition, 64(2), 280-310. [CrossRef]
- García-Hernández, L., García-Ortega, M. B., Ruiz-Alcalá, G., Carrillo, E., Marchal, J. A., & García, M. Á. (2021). The p38 MAPK components and modulators as biomarkers and molecular targets in cancer. International Journal of Molecular Sciences, 23(1), 370.
- Garnett, M. J., Mansfeld, J., Godwin, C., Matsusaka, T., Wu, J., Russell, P., Pines, J., & Venkitaraman, A. R. (2009). UBE2S elongates ubiquitin chains on APC/C substrates to promote mitotic exit. Nature cell biology, 11(11), 1363-1369. [CrossRef] [PubMed]
- Ghosh, P., Dey, A., Nandi, S., Majumder, R., Das, S., & Mandal, M. (2025). CTGF (CCN2): a multifaceted mediator in breast cancer progression and therapeutic targeting. Cancer and Metastasis Reviews, 44(1), 32. [CrossRef]
- Gonçalves, V., Pereira, J. F., & Jordan, P. (2017). Signaling pathways driving aberrant splicing in cancer cells. Genes, 9(1), 9.
- Gout, S., Brambilla, E., Boudria, A., Drissi, R., Lantuejoul, S., Gazzeri, S., & Eymin, B. (2012). Abnormal expression of the pre-mRNA splicing regulators SRSF1, SRSF2, SRPK1 and SRPK2 in non small cell lung carcinoma.
- Guo, Q., Zhu, L., Wang, C., Wang, S., Nie, X., Liu, J., Liu, Q., Hao, Y., Li, X., & Lin, B. (2019). SERPIND1 affects the malignant biological behavior of epithelial ovarian cancer via the PI3K/AKT pathway: a mechanistic study. Frontiers in Oncology, 9, 954. [CrossRef] [PubMed]
- Guo, Y., Dong, X., Jin, J., & He, Y. (2021). The expression patterns and prognostic value of the proteasome activator subunit gene family in gastric cancer based on integrated analysis. Frontiers in cell and developmental biology, 9, 663001.
- Hasheminezhad, S. H., Boozari, M., Iranshahi, M., Yazarlu, O., Sahebkar, A., Hasanpour, M., & Iranshahy, M. (2022). A mechanistic insight into the biological activities of urolithins as gut microbial metabolites of ellagitannins. Phytotherapy Research, 36(1), 112-146. [CrossRef] [PubMed]
- Hosoi, H., Tabata, S., Kosako, H., Hori, Y., Okamura, T., Yamashita, Y., Fujimoto, K., Kajioka, D., Suzuki, K., & Osato, M. (2024). IGLL5 controlled by super-enhancer affects cell survival and MYC expression in mature B-cell lymphoma. Leukemia Research Reports, 21, 100451.
- Hu, X., Ding, S., Lu, G., Lin, Z., Liao, L., Xiao, W., Ding, Y., Zhang, Y., Wang, Z., & Gong, W. (2023). Apolipoprotein C-III itself stimulates the Syk/cPLA2-induced inflammasome activation of macrophage to boost anti-tumor activity of CD8+ T cell. Cancer Immunology, Immunotherapy, 72(12), 4123-4144. [CrossRef]
- Huang, J.-X., Zhang, X., Tang, M., Zhang, Q., Deng, L., Song, C.-H., Li, W., Shi, H.-P., & Cong, M.-H. (2024). Comprehensive evaluation of serum hepatic proteins in predicting prognosis among cancer patients with cachexia: an observational cohort study. BMC cancer, 24(1), 293.
- Huang, J., Wang, H., Xu, Y., Li, C., Lv, X., Han, X., Chen, X., Chen, Y., & Yu, Z. (2023). The role of CTNNA1 in malignancies: An updated review. Journal of Cancer, 14(2), 219.
- Huth, S., Huth, L., Marquardt, Y., Fietkau, K., Dahl, E., Esser, P. R., Martin, S. F., Heise, R., Merk, H. F., & Baron, J. M. (2020). Inter-α-trypsin inhibitor heavy chain 5 (ITIH5) is a natural stabilizer of hyaluronan that modulates biological processes in the skin. Skin Pharmacology and Physiology, 33(4), 198-206. [CrossRef]
- Jaye, K., Alsherbiny, M. A., Chang, D., Li, C.-G., & Bhuyan, D. J. (2023). Mechanistic insights into the anti-proliferative action of gut microbial metabolites against breast adenocarcinoma cells. International Journal of Molecular Sciences, 24(20), 15053.
- Kasahara, H., Hanada, A., Kuzuyama, T., Takagi, M., Kamiya, Y., & Yamaguchi, S. (2002). Contribution of the Mevalonate and Methylerythritol Phosphate Pathways to the Biosynthesis of Gibberellins inArabidopsis *. Journal of Biological Chemistry, 277(47), 45188-45194. [CrossRef]
- Khan, F., Elsori, D., Verma, M., Pandey, S., Obaidur Rab, S., Siddiqui, S., Alabdallah, N. M., Saeed, M., & Pandey, P. (2024). Unraveling the intricate relationship between lipid metabolism and oncogenic signaling pathways. Frontiers in cell and developmental biology, 12, 1399065. [CrossRef] [PubMed]
- Khan, S. F., Damerell, V., Omar, R., Du Toit, M., Khan, M., Maranyane, H. M., Mlaza, M., Bleloch, J., Bellis, C., & Sahm, B. D. (2020). The roles and regulation of TBX3 in development and disease. Gene, 726, 144223. [CrossRef] [PubMed]
- Kho, Z. Y., & Lal, S. K. (2018). The human gut microbiome–a potential controller of wellness and disease. Frontiers in microbiology, 9, 1835. [CrossRef] [PubMed]
- Kim, S.-E., Mori, R., Komatsu, T., Chiba, T., Hayashi, H., Park, S., Sugawa, M. D., Dencher, N. A., & Shimokawa, I. (2015). Upregulation of cytochrome c oxidase subunit 6b1 (Cox6b1) and formation of mitochondrial supercomplexes: implication of Cox6b1 in the effect of calorie restriction. Age, 37, 1-17.
- Kuszczak, B., Łacina, P., Dratwa-Kuźmin, M., Bogunia-Kubik, K., Wróbel, T., & Rybka, J. (2025). Evaluation of polymorphism in BCL-2, PD-1, and PD-L1 genes in myelodysplastic neoplasms. Acta Haematologica Polonica.
- Lagrange, J., Lecompte, T., Knopp, T., Lacolley, P., & Regnault, V. (2022). Alpha-2-macroglobulin in hemostasis and thrombosis: an underestimated old double-edged sword. Journal of Thrombosis and Haemostasis, 20(4), 806-815.
- Lefort, N., Yi, Z., Bowen, B., Glancy, B., De Filippis, E. A., Mapes, R., Hwang, H., Flynn, C. R., Willis, W. T., & Civitarese, A. (2009). Proteome profile of functional mitochondria from human skeletal muscle using one-dimensional gel electrophoresis and HPLC-ESI-MS/MS. Journal of proteomics, 72(6), 1046-1060. [CrossRef]
- Lewies, A., Du Plessis, L. H., & Wentzel, J. F. (2018). The cytotoxic, antimicrobial and anticancer properties of the antimicrobial peptide nisin Z alone and in combination with conventional treatments. Cytotoxicity, 25, 21.
- Li, C.-H., Hsu, T.-I., Chang, Y.-C., Chan, M.-H., Lu, P.-J., & Hsiao, M. (2021). Stationed or relocating: The seesawing emt/met determinants from embryonic development to cancer metastasis. Biomedicines, 9(9), 1265. [CrossRef] [PubMed]
- Li, J., Dallmayer, M., Kirchner, T., Musa, J., & Grünewald, T. G. (2018). PRC1: linking cytokinesis, chromosomal instability, and cancer evolution. Trends in cancer, 4(1), 59-73.
- Li, L., Zhang, G., Yang, Z., & Kang, X. (2024). Stress-Activated Protein Kinases in Intervertebral Disc Degeneration: Unraveling the Impact of JNK and p38 MAPK. Biomolecules, 14(4), 393. [CrossRef]
- Li, X. (2024). Role of FOXM1, GPX1, and CCNB1 in cisplatin resistance in malignant thymomas and thymic carcinomas.
- Liao, L., Zhang, Y.-L., Deng, L., Chen, C., Ma, X.-Y., Andriani, L., Yang, S.-Y., Hu, S.-Y., Zhang, F.-L., & Shao, Z.-M. (2023). Protein phosphatase 1 subunit PPP1R14B stabilizes STMN1 to promote progression and paclitaxel resistance in triple-negative breast cancer. Cancer research, 83(3), 471-484.
- Lin, M. Y., De Zoete, M. R., Van Putten, J. P., & Strijbis, K. (2015). Redirection of epithelial immune responses by short-chain fatty acids through inhibition of histone deacetylases. Frontiers in immunology, 6, 554.
- Liu, Y., & Wang, H. (2024). Biomarkers and targeted therapy for cancer stem cells. Trends in Pharmacological Sciences, 45(1), 56-66. [CrossRef]
- Maffeo, B., & Cilloni, D. (2024). The ubiquitin-conjugating enzyme E2 O (UBE2O) and its therapeutic potential in human leukemias and solid tumors. Cancers, 16(17), 3064.
- Mager, L. F., Burkhard, R., Pett, N., Cooke, N. C., Brown, K., Ramay, H., Paik, S., Stagg, J., Groves, R. A., & Gallo, M. (2020). Microbiome-derived inosine modulates response to checkpoint inhibitor immunotherapy. Science, 369(6510), 1481-1489. [CrossRef] [PubMed]
- Majka, J., & Burgers, P. M. (2004). The PCNA-RFC families of DNA clamps and clamp loaders. Progress in nucleic acid research and molecular biology, 78, 227-260.
- Mathew, M., Nguyen, N. T., Bhutia, Y. D., Sivaprakasam, S., & Ganapathy, V. (2024). Metabolic signature of Warburg effect in cancer: An effective and obligatory interplay between nutrient transporters and catabolic/anabolic pathways to promote tumor growth. Cancers, 16(3), 504. [CrossRef]
- Matuszyk, J. (2022). MALAT1-miRNAs network regulate thymidylate synthase and affect 5FU-based chemotherapy. Molecular Medicine, 28(1), 89.
- Mei, B., Chen, Y., Chen, J., Pan, C. Q., & Murphy, J. E. (2006). Expression of human coagulation factor VIII in a human hybrid cell line, HKB11. Molecular Biotechnology, 34, 165-178.
- Minotti, G., Menna, P., Salvatorelli, E., Cairo, G., & Gianni, L. (2004). Anthracyclines: molecular advances and pharmacologic developments in antitumor activity and cardiotoxicity. Pharmacological reviews, 56(2), 185-229.
- Mohammad, S. The influence of stromal fibroblast on antigen-presenting cell function and alteration of their biology University of Nottingham].
- Mura, M., Hopkins, T. G., Michael, T., Abd-Latip, N., Weir, J., Aboagye, E., Mauri, F., Jameson, C., Sturge, J., & Gabra, H. (2015). LARP1 post-transcriptionally regulates mTOR and contributes to cancer progression. Oncogene, 34(39), 5025-5036. [CrossRef] [PubMed]
- Nan, Y., Su, H., Zhou, B., & Liu, S. (2023). The function of natural compounds in important anticancer mechanisms. Frontiers in Oncology, 12, 1049888.
- Niamah, A. K., Al-Sahlany, S. T. G., Verma, D. K., Shukla, R. M., Patel, A. R., Tripathy, S., Singh, S., Baranwal, D., Singh, A. K., & Utama, G. L. (2024). Emerging lactic acid bacteria bacteriocins as anti-cancer and anti-tumor agents for human health. Heliyon, 10(17).
- O’keefe, S. J. (2016). Diet, microorganisms and their metabolites, and colon cancer. Nature reviews Gastroenterology & hepatology, 13(12), 691-706.
- Odiase, P., Ma, J., Ranganathan, S., Ogunkua, O., Turner, W. B., Marshall, D., & Ochieng, J. (2024). The Role of Fetuin-A in Tumor Cell Growth, Prognosis, and Dissemination. International Journal of Molecular Sciences, 25(23), 12918. [CrossRef] [PubMed]
- Oquendo, C. J., Parker, H., Oscier, D., Ennis, S., Gibson, J., & Strefford, J. C. (2021). The (epi)genomic landscape of splenic marginal zone lymphoma, biological implications, clinical utility, and future questions. Journal of Translational Genetics and Genomics, 5(2), 89-111. https://www.oaepublish.com/articles/jtgg.2021.04.
- Osman, S., & Cramer, P. (2020). Structural biology of RNA polymerase II transcription: 20 years on. Annual Review of Cell and Developmental Biology, 36(1), 1-34.
- Parra-Medina, R., Cardona, A. G., Quintero-Ronderos, P., & Rodríguez, É. G. CYTOKINES, CHEMOKINES AND GROWTH FACTORS.
- Pelicano, H., Carney, D., & Huang, P. (2004). ROS stress in cancer cells and therapeutic implications. Drug resistance updates, 7(2), 97-110. [CrossRef]
- Peluzio, M. d. C. G., Martinez, J. A., & Milagro, F. I. (2021). Postbiotics: Metabolites and mechanisms involved in microbiota-host interactions. Trends in Food Science & Technology, 108, 11-26.
- Peng, F., Li, S., Wang, L., Han, M., Fan, H., Tang, H., Peng, C., Du, J., & Zhou, Z. Combination of Hdac Inhibitor Sodium Butyrate and Immunotherapy in Glioma: Regulation of Immunologically Hot and Cold Tumors Via Gut Microbiota and Metabolites. Available at SSRN 4942877.
- Peplow, P. V. (2024). Reprogramming T cells as an emerging treatment to slow human age-related decline in health [Opinion]. Frontiers in Medical Technology, Volume 6—2024. [CrossRef]
- Perez-Riverol, Y., Bandla, C., Kundu, D. J., Kamatchinathan, S., Bai, J., Hewapathirana, S., John, N. S., Prakash, A., Walzer, M., & Wang, S. (2025). The PRIDE database at 20 years: 2025 update. Nucleic acids research, 53(D1), D543-D553. [CrossRef] [PubMed]
- Pino, L. K., Just, S. C., MacCoss, M. J., & Searle, B. C. (2020). Acquiring and analyzing data independent acquisition proteomics experiments without spectrum libraries. Molecular & Cellular Proteomics, 19(7), 1088-1103.
- Preet, S., Pandey, S., Saini, N., Koul, A., & Rishi, P. (2015). Nisin augments doxorubicin permeabilization and ameliorates signaling cascade during skin carcinogenesis. Transl Med, 6(161), 2161-1025.1000161.
- Qiu, Y.-Y., Zhang, J., Zeng, F.-Y., & Zhu, Y. Z. (2023). Roles of the peroxisome proliferator-activated receptors (PPARs) in the pathogenesis of nonalcoholic fatty liver disease (NAFLD). Pharmacological Research, 192, 106786.
- Rafique, N., Jan, S. Y., Dar, A. H., Dash, K. K., Sarkar, A., Shams, R., Pandey, V. K., Khan, S. A., Amin, Q. A., & Hussain, S. Z. (2023). Promising bioactivities of postbiotics: A comprehensive review. Journal of agriculture and Food Research, 100708. [CrossRef]
- Reeder, B. J. (2017). Redox and peroxidase activities of the hemoglobin superfamily: relevance to health and disease. Antioxidants & Redox Signaling, 26(14), 763-776.
- Reuter, S., Gupta, S. C., Chaturvedi, M. M., & Aggarwal, B. B. (2010). Oxidative stress, inflammation, and cancer: how are they linked? Free radical biology and medicine, 49(11), 1603-1616.
- Riester, D., Hildmann, C., & Schwienhorst, A. (2007). Histone deacetylase inhibitors—turning epigenic mechanisms of gene regulation into tools of therapeutic intervention in malignant and other diseases. Applied microbiology and biotechnology, 75, 499-514. [CrossRef]
- Rius-Pérez, S., Torres-Cuevas, I., Millán, I., Ortega, Á. L., & Pérez, S. (2020). PGC-1α, inflammation, and oxidative stress: an integrative view in metabolism. Oxidative medicine and cellular longevity, 2020(1), 1452696. [CrossRef]
- Rossi, A., Mazzara, S., Salemi, D., Zanetti, S., Sapienza, M. R., Orecchioni, S., Talarico, G., Falvo, P., Davini, A., & Ceccarelli, C. (2025). Downregulation of rRNA synthesis by BCL-2 induces chemoresistance in Diffuse Large B-cell Lymphoma. iScience.
- Ryu, D., Mouchiroud, L., Andreux, P. A., Katsyuba, E., Moullan, N., Nicolet-dit-Félix, A. A., Williams, E. G., Jha, P., Lo Sasso, G., & Huzard, D. (2016). Urolithin A induces mitophagy and prolongs lifespan in C. elegans and increases muscle function in rodents. Nature medicine, 22(8), 879-888. [CrossRef]
- Sadri, H., Aghaei, M., & Akbari, V. (2022). Nisin induces apoptosis in cervical cancer cells via reactive oxygen species generation and mitochondrial membrane potential changes. Biochemistry and Cell Biology, 100(2), 136-141.
- Samban, S. S., Hari, A., Nair, B., Kumar, A. R., Meyer, B. S., Valsan, A., Vijayakurup, V., & Nath, L. R. (2024). An insight into the role of alpha-fetoprotein (AFP) in the development and progression of hepatocellular carcinoma. Molecular Biotechnology, 66(10), 2697-2709.
- Santos, O. F., Moura, L. A., Rosen, E. M., & Nigam, S. K. (1993). Modulation of HGF-induced tubulogenesis and branching by multiple phosphorylation mechanisms. Developmental biology, 159(2), 535-548.
- Sarkar, S., Sahoo, P. K., Mahata, S., Pal, R., Ghosh, D., Mistry, T., Ghosh, S., Bera, T., & Nasare, V. D. (2021). Mitotic checkpoint defects: en route to cancer and drug resistance. Chromosome Research, 29(2), 131-144. [CrossRef] [PubMed]
- Schmidt, S. L. G., Gomes, X. V., & Burgers, P. M. (2001). ATP utilization by yeast replication factor C: III. The ATP-binding domains of Rfc2, Rfc3, and Rfc4 are essential for DNA recognition and clamp loading. Journal of Biological Chemistry, 276(37), 34784-34791.
- Schumacker, P. T. (2006). Reactive oxygen species in cancer cells: live by the sword, die by the sword. Cancer cell, 10(3), 175-176.
- Sheibani, M., Azizi, Y., Shayan, M., Nezamoleslami, S., Eslami, F., Farjoo, M. H., & Dehpour, A. R. (2022). Doxorubicin-induced cardiotoxicity: an overview on pre-clinical therapeutic approaches. Cardiovascular Toxicology, 22(4), 292-310. [CrossRef]
- Shen, Y. Q., Guerra-Librero, A., Fernandez-Gil, B. I., Florido, J., García-López, S., Martinez-Ruiz, L., Mendivil-Perez, M., Soto-Mercado, V., Acuña-Castroviejo, D., & Ortega-Arellano, H. (2018). Combination of melatonin and rapamycin for head and neck cancer therapy: Suppression of AKT/mTOR pathway activation, and activation of mitophagy and apoptosis via mitochondrial function regulation. Journal of pineal research, 64(3), e12461.
- Shetty, S. S., Shetty, S., & Kumari, N. S. (2024). Therapeutic efficacy of gut microbiota-derived polyphenol metabolite Urolithin A. Beni-Suef University Journal of Basic and Applied Sciences, 13(1), 31. [CrossRef]
- Shimano, H., & Sato, R. (2017). SREBP-regulated lipid metabolism: convergent physiology—divergent pathophysiology. Nature Reviews Endocrinology, 13(12), 710-730. [CrossRef]
- Sivakumar, S., & Gorbsky, G. J. (2015). Spatiotemporal regulation of the anaphase-promoting complex in mitosis. Nature reviews Molecular cell biology, 16(2), 82-94.
- Stanisławska, I., Piwowarski, J., Granica, S., & Kiss, A. (2017). Urolithins, gut microbiota metabolites of ellagitannins, in prostate cancer chemoprevention. Planta Medica International Open, 4(S 01), Mo-PO-16.
- Steliou, K., Boosalis, M. S., Perrine, S. P., Sangerman, J., & Faller, D. V. (2012). Butyrate histone deacetylase inhibitors. BioResearch open access, 1(4), 192-198. [CrossRef] [PubMed]
- Strzalka, W., & Ziemienowicz, A. (2011). Proliferating cell nuclear antigen (PCNA): a key factor in DNA replication and cell cycle regulation. Annals of botany, 107(7), 1127-1140.
- Sturm, D., Orr, Brent A., Toprak, Umut H., Hovestadt, V., Jones, David T. W., Capper, D., Sill, M., Buchhalter, I., Northcott, Paul A., Leis, I., Ryzhova, M., Koelsche, C., Pfaff, E., Allen, Sariah J., Balasubramanian, G., Worst, Barbara C., Pajtler, Kristian W., Brabetz, S., Johann, Pascal D.,... Kool, M. (2016). New Brain Tumor Entities Emerge from Molecular Classification of CNS-PNETs. cell, 164(5), 1060-1072. [CrossRef]
- Su, C., Mo, J., Dong, S., Liao, Z., Zhang, B., & Zhu, P. (2024). Integrinβ-1 in disorders and cancers: molecular mechanisms and therapeutic targets. Cell Communication and Signaling, 22(1), 71.
- Subbian, S., Bandyopadhyay, N., Tsenova, L., O’Brien, P., Khetani, V., Kushner, N. L., Peixoto, B., Soteropoulos, P., Bader, J. S., & Karakousis, P. C. (2013). Early innate immunity determines outcome of Mycobacterium tuberculosis pulmonary infection in rabbits. Cell Communication and Signaling, 11, 1-17. [CrossRef]
- Sun, W.-D., Zhu, X.-J., Li, J.-J., Mei, Y.-Z., Li, W.-S., & Li, J.-H. (2024). Nicotinamide N-methyltransferase (NNMT): A key enzyme in cancer metabolism and therapeutic target. International Immunopharmacology, 142, 113208.
- Swerdlow, S. H., Campo, E., Pileri, S. A., Harris, N. L., Stein, H., Siebert, R., Advani, R., Ghielmini, M., Salles, G. A., & Zelenetz, A. D. (2016). The 2016 revision of the World Health Organization classification of lymphoid neoplasms. Blood, The Journal of the American Society of Hematology, 127(20), 2375-2390. [CrossRef]
- Szilveszter, R.-M., Muntean, M., & Florea, A. (2024). Molecular Mechanisms in Tumorigenesis of Hepatocellular Carcinoma and in Target Treatments—An Overview. Biomolecules, 14(6), 656.
- Tan, J. K., Macia, L., & Mackay, C. R. (2023). Dietary fiber and SCFAs in the regulation of mucosal immunity. Journal of allergy and clinical immunology, 151(2), 361-370. [CrossRef] [PubMed]
- Thaiss, C. A., Zeevi, D., Levy, M., Segal, E., & Elinav, E. (2015). A day in the life of the meta-organism: diurnal rhythms of the intestinal microbiome and its host. Gut microbes, 6(2), 137-142. [CrossRef] [PubMed]
- Trachootham, D., Alexandre, J., & Huang, P. (2009). Targeting cancer cells by ROS-mediated mechanisms: a radical therapeutic approach? Nature reviews Drug discovery, 8(7), 579-591.
- Valko, M., Rhodes, C., Moncol, J., Izakovic, M., & Mazur, M. (2006). Free radicals, metals and antioxidants in oxidative stress-induced cancer. Chemico-biological interactions, 160(1), 1-40.
- Vikramdeo, K. S., Sudan, S. K., Singh, A. P., Singh, S., & Dasgupta, S. (2022). Mitochondrial respiratory complexes: Significance in human mitochondrial disorders and cancers. Journal of Cellular Physiology, 237(11), 4049-4078.
- Wang, C., Wu, Y., Gong, B., Mou, J., Cheng, X., Zhang, L., & Wei, J. (2025). Agarwood Chromone Alleviates Gastric Ulcers by Inhibiting the NF-κB and Caspase Pathways Based on Network Pharmacology and Molecular Docking. Pharmaceuticals, 18(4), 514. [CrossRef]
- Wang, P., Song, M., Zeng, Z.-l., Zhu, C.-f., Lu, W.-h., Yang, J., Ma, M.-z., Huang, A.-m., Hu, Y., & Huang, P. (2015). Identification of NDUFAF1 in mediating K-Ras induced mitochondrial dysfunction by a proteomic screening approach. Oncotarget, 6(6), 3947.
- Wang, Z. (2021). Regulation of cell cycle progression by growth factor-induced cell signaling. Cells, 10(12), 3327.
- Woodard, K. J. (2021). Genomic Characterization of Sickle Cell Mouse Models for Therapeutic Genome Editing Applications. The University of Tennessee Health Science Center.
- Wu, X., Yu, X., Chen, C., Chen, C., Wang, Y., Su, D., & Zhu, L. (2024). Fibrinogen and tumors. Frontiers in Oncology, 14, 1393599.
- Xu, Y.-c., Su, J., Zhou, J.-j., Yuan, Q., & Han, J.-s. (2023). Roles of MT-ND1 in Cancer. Current Medical Science, 43(5), 869-878. [CrossRef]
- Yang, J., Bai, X., Liu, G., & Li, X. (2022). A transcriptional regulatory network of HNF4α and HNF1α involved in human diseases and drug metabolism. Drug Metabolism Reviews, 54(4), 361-385.
- Yue, J., & López, J. M. (2020). Understanding MAPK signaling pathways in apoptosis. International Journal of Molecular Sciences, 21(7), 2346.
- Zhang, C., Zhao, L., Leng, L., Zhou, Q., Zhang, S., Gong, F., Xie, P., & Lin, G. (2020). CDCA8 regulates meiotic spindle assembly and chromosome segregation during human oocyte meiosis. Gene, 741, 144495. [CrossRef]
- Zhang, Y., Jiang, L., Su, P., Yu, T., Ma, Z., Liu, Y., & Yu, J. (2023). Urolithin A suppresses tumor progression and induces autophagy in gastric cancer via the PI3K/Akt/mTOR pathway. Drug Development Research, 84(2), 172-184.
- Zhou, B., Zhao, Y. C., Liu, H., Luo, S., Amos, C. I., Lee, J. E., Li, X., Nan, H., & Wei, Q. (2020). Novel genetic variants of ALG6 and GALNTL4 of the glycosylation pathway predict cutaneous melanoma-specific survival. Cancers, 12(2), 288.
- Zhu, Y., Dwidar, M., Nemet, I., Buffa, J. A., Sangwan, N., Li, X. S., Anderson, J. T., Romano, K. A., Fu, X., & Funabashi, M. (2023). Two distinct gut microbial pathways contribute to meta-organismal production of phenylacetylglutamine with links to cardiovascular disease. Cell host & microbe, 31(1), 18-32. e19.
- Zitvogel, L., Daillère, R., Roberti, M. P., Routy, B., & Kroemer, G. (2017). Anticancer effects of the microbiome and its products. Nature Reviews Microbiology, 15(8), 465-478. [CrossRef]
Figure 1.
The effect of two different concentrations of N (8000, 4000, 3200 and 1600 μM), UB (500, 250, 300 and 150 μM), N: UB 4:6 (3500 μM and 1750 μM) on the production of ROS in the HKB-11 lymphoma cell line. Dox (4 μM) and tert-Butyl hydroperoxide (TBHP; 150 μM) were included for comparative purposes. The values are expressed as mean ± SD. ** indicates p ≤ 0.01; **** indicates p ≤ 0.0001 compared to untreated control.
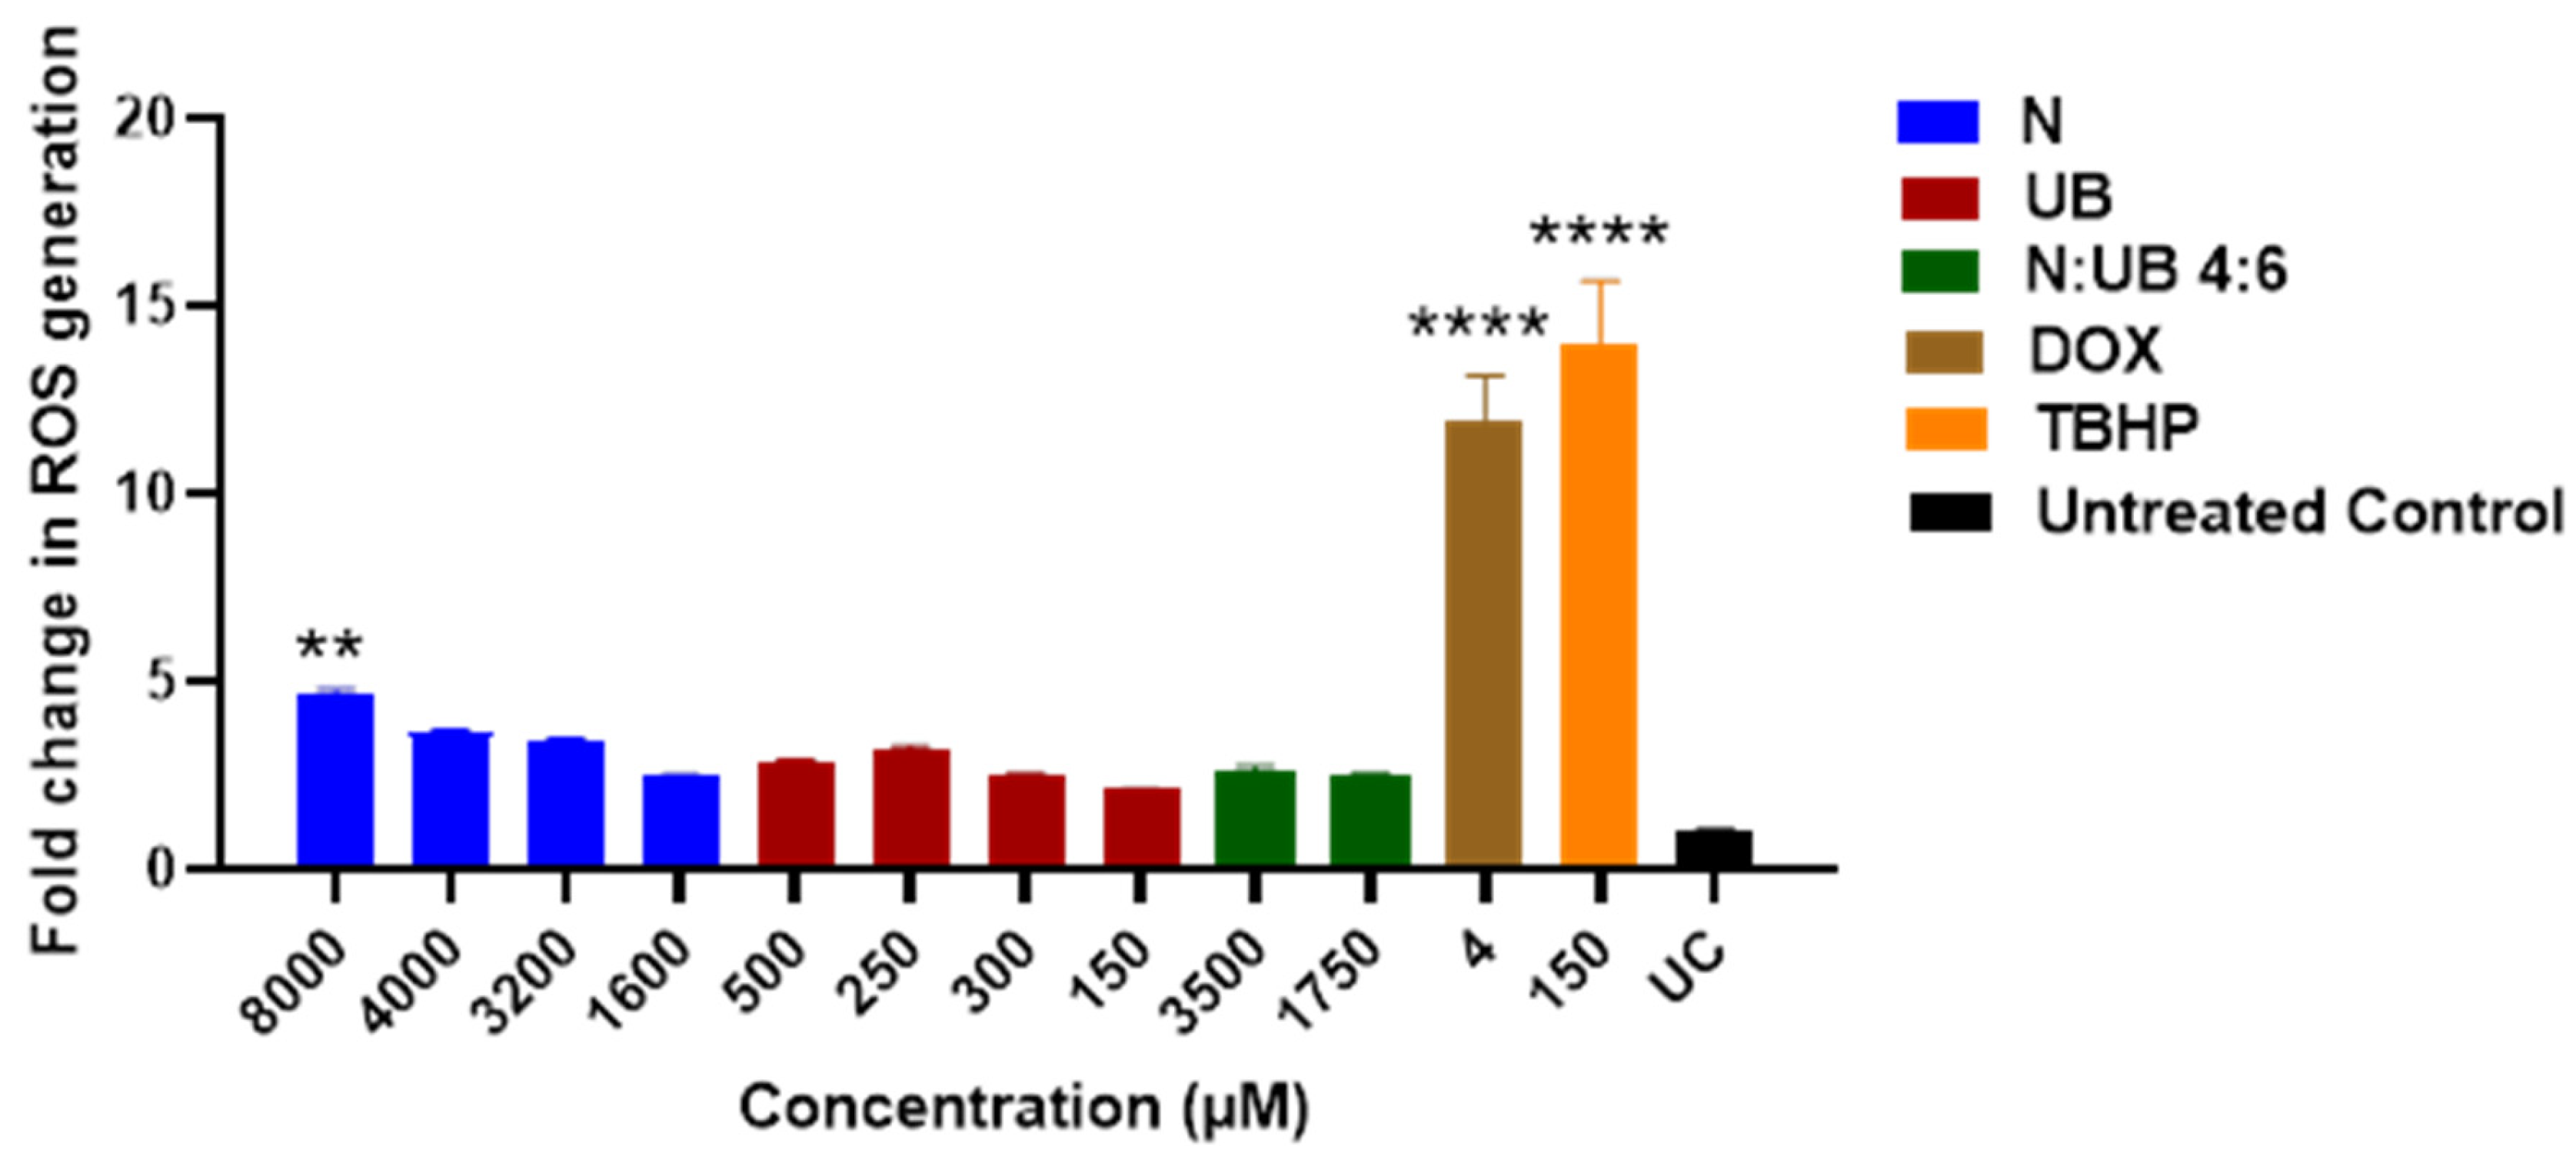
Figure 2.
Flow cytometric assessment of the apoptotic profiles of the HKB-11 lymphoma cancer cells after 24 h of treatment. (A) The live, early apoptotic, late apoptotic, and necrotic cell percentages after 24 h treatment with N (8000 μM), UB (500 μM), N (3200 μM), UB (300 μM), N:UB 4:6 (3500 μM), Dox (4 μM) and untreated control (n = 6), respectively. * indicates 0.01 < value of p <0.05; ** indicates p < 0.01; *** indicates p < 0.001; **** indicates p < 0.0001 compared to the untreated control. (B) Represented are the density plots of each drug treatment, most representative of the average data from the flow cytometric analyses, with Q4-1 = necrotic cells, Q4-2 = late-stage apoptotic cells, Q4-3 = live cells, and Q4-4 = early-stage apoptotic cells.
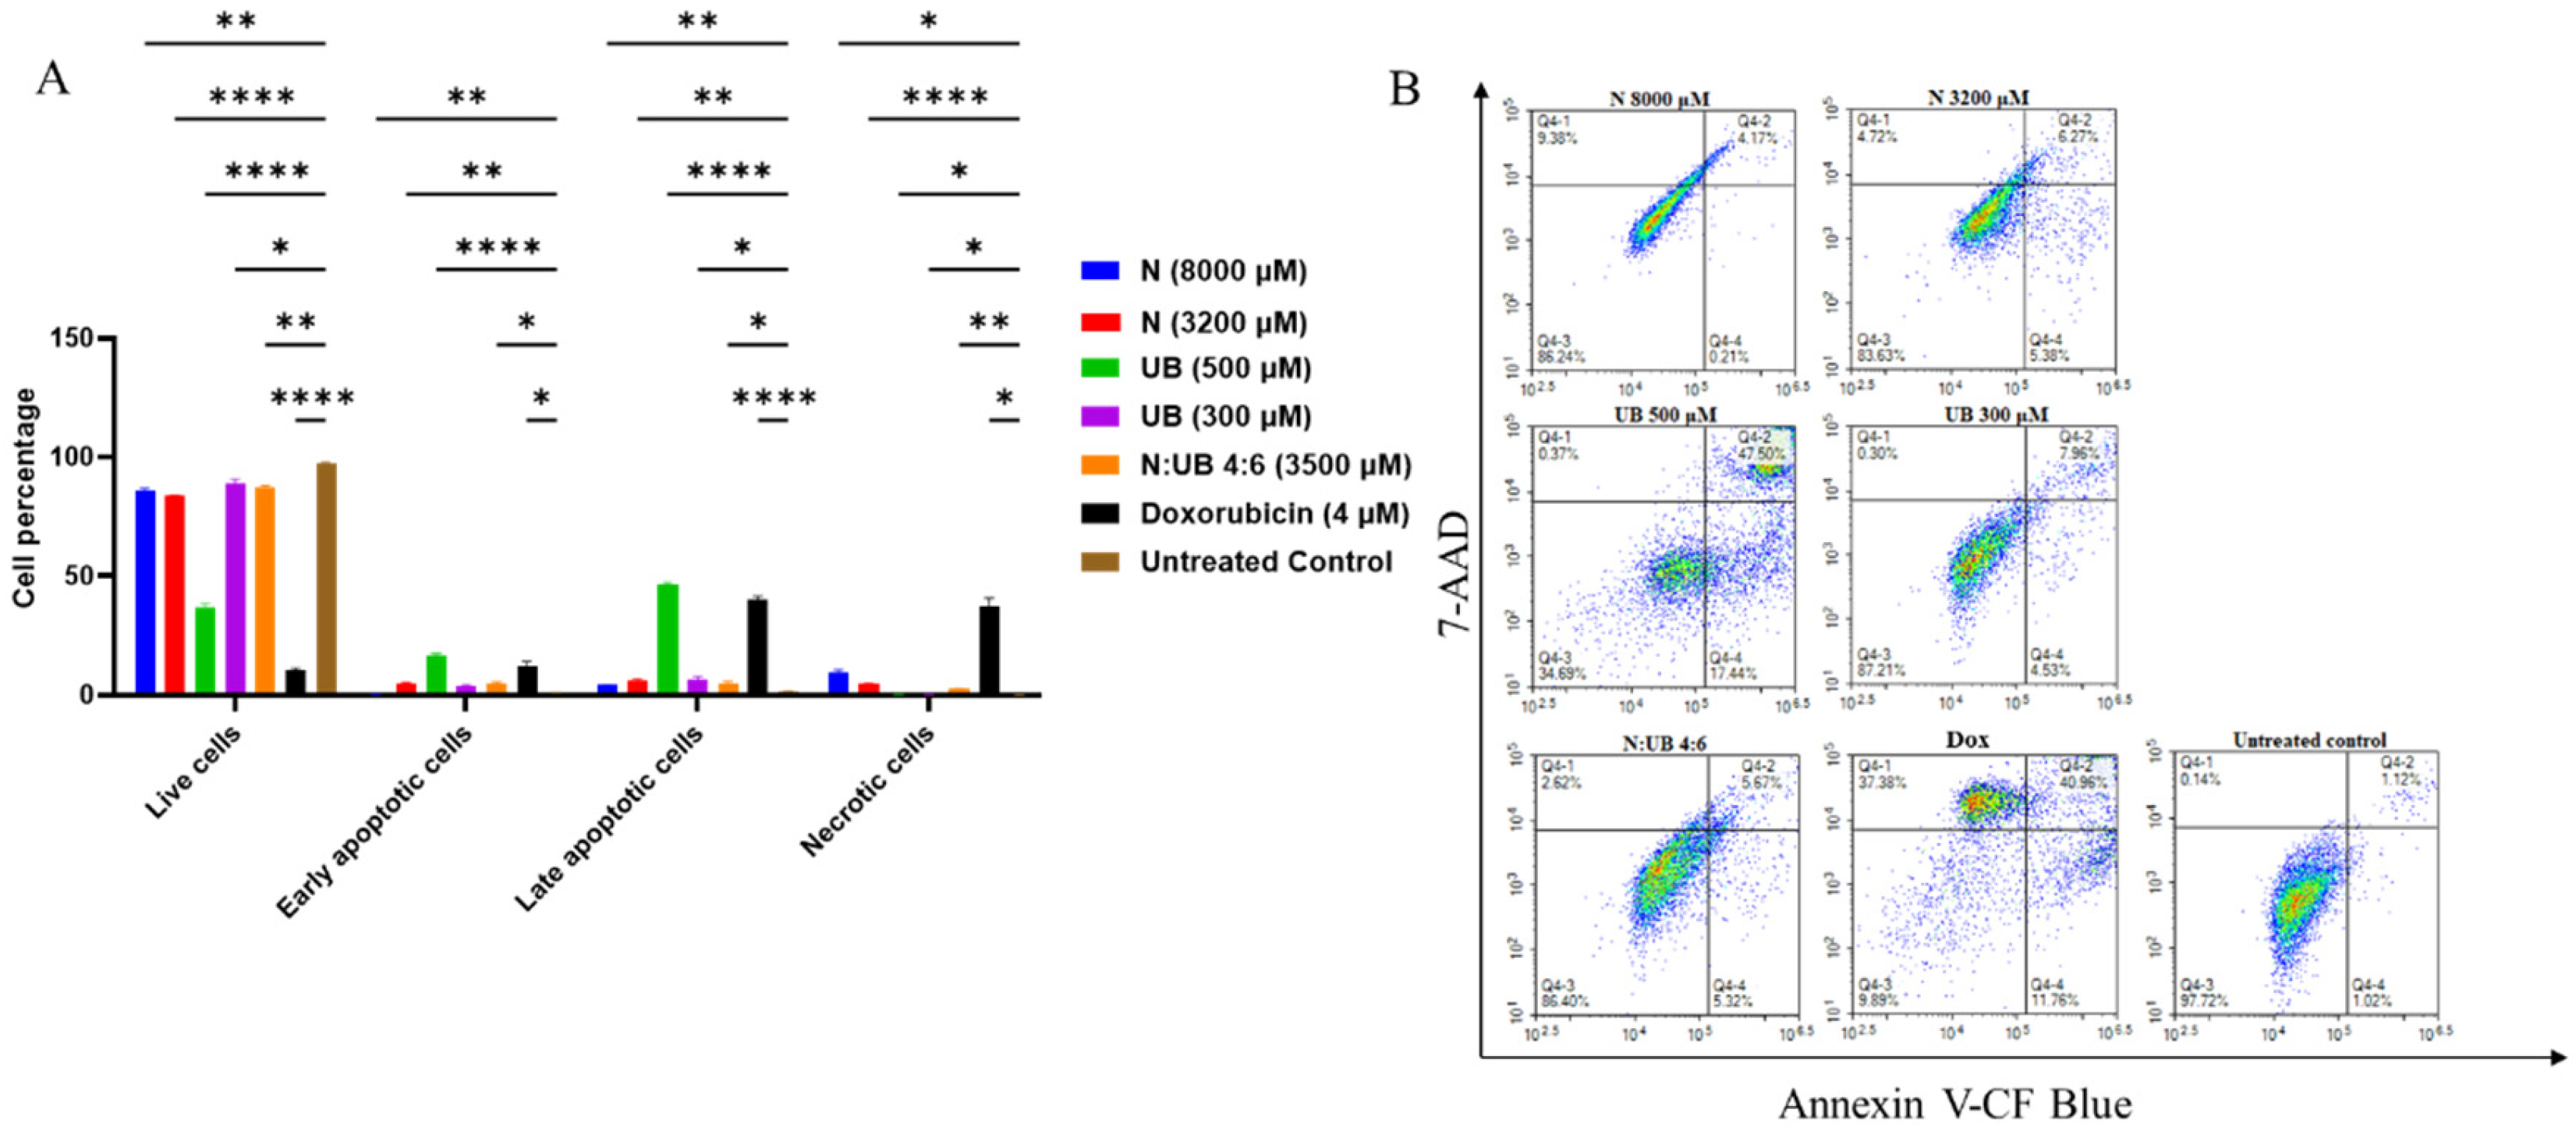
Figure 3.
Proteomics analysis of nisin (N; 3200 µM)-treated HKB-11 lymphoma cells vs untreated control, showing A) IPA graphical summary showing two biologically enriched themes. The significantly regulated proteins were identified (Q ≤ 0.05, log2 fold change ≥ 0.58). B) Volcano plot of significantly regulated proteins (Absolute Log2 fold change ≥ 0.58 and Q ≤ 0.05).
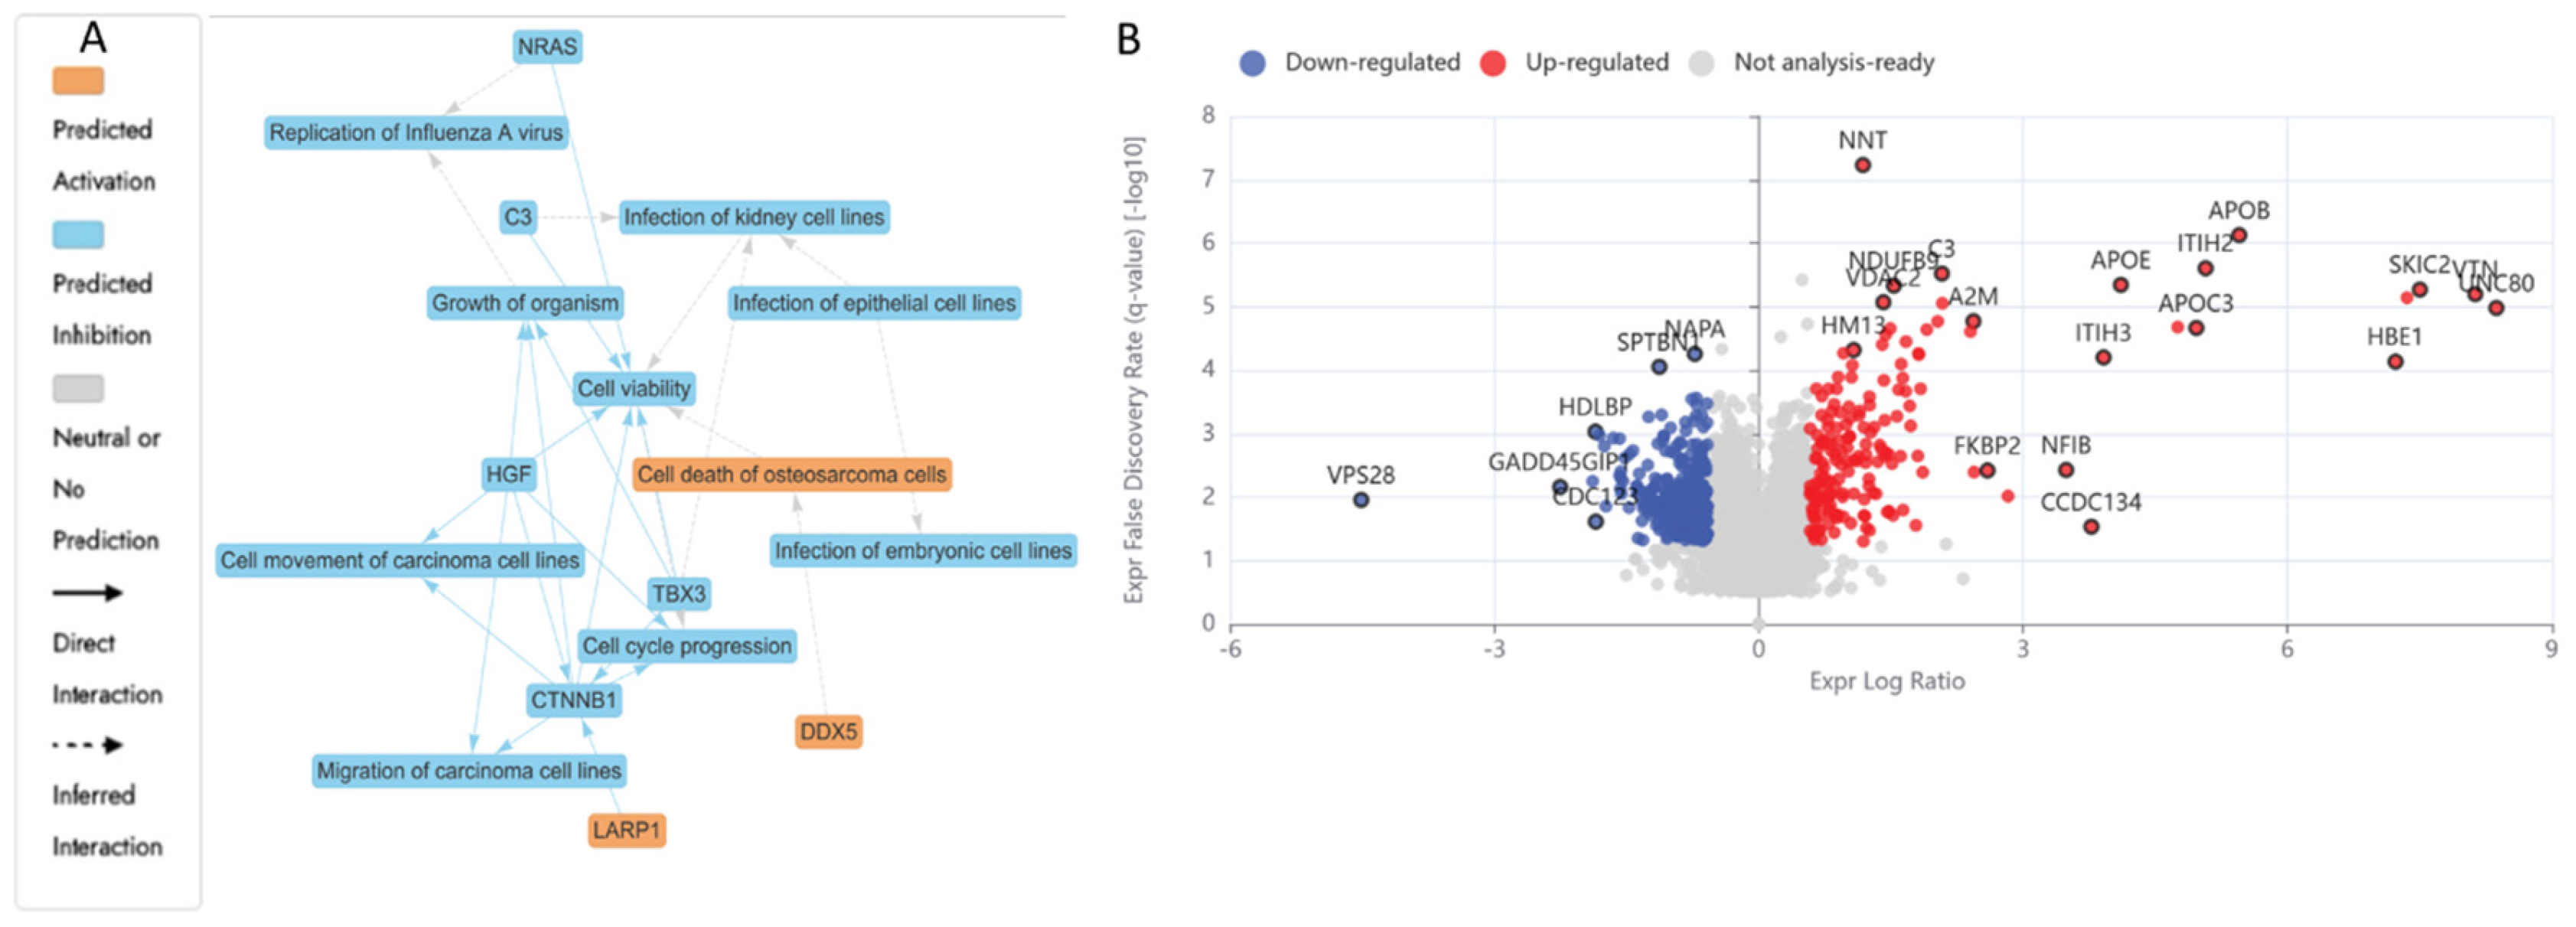
Figure 4.
Proteomics analysis of urolithin B-treated (UB; 300 µM) HKB-11 lymphoma cells vs untreated control, showing A) IPA graphical summary showing two biologically enriched themes. The significantly regulated proteins were identified (Q ≤ 0.05, log2 fold change ≥ 0.58). B) Volcano plot of significantly regulated proteins (Absolute Log2 fold change ≥0.58 and Q ≤ 0.05).
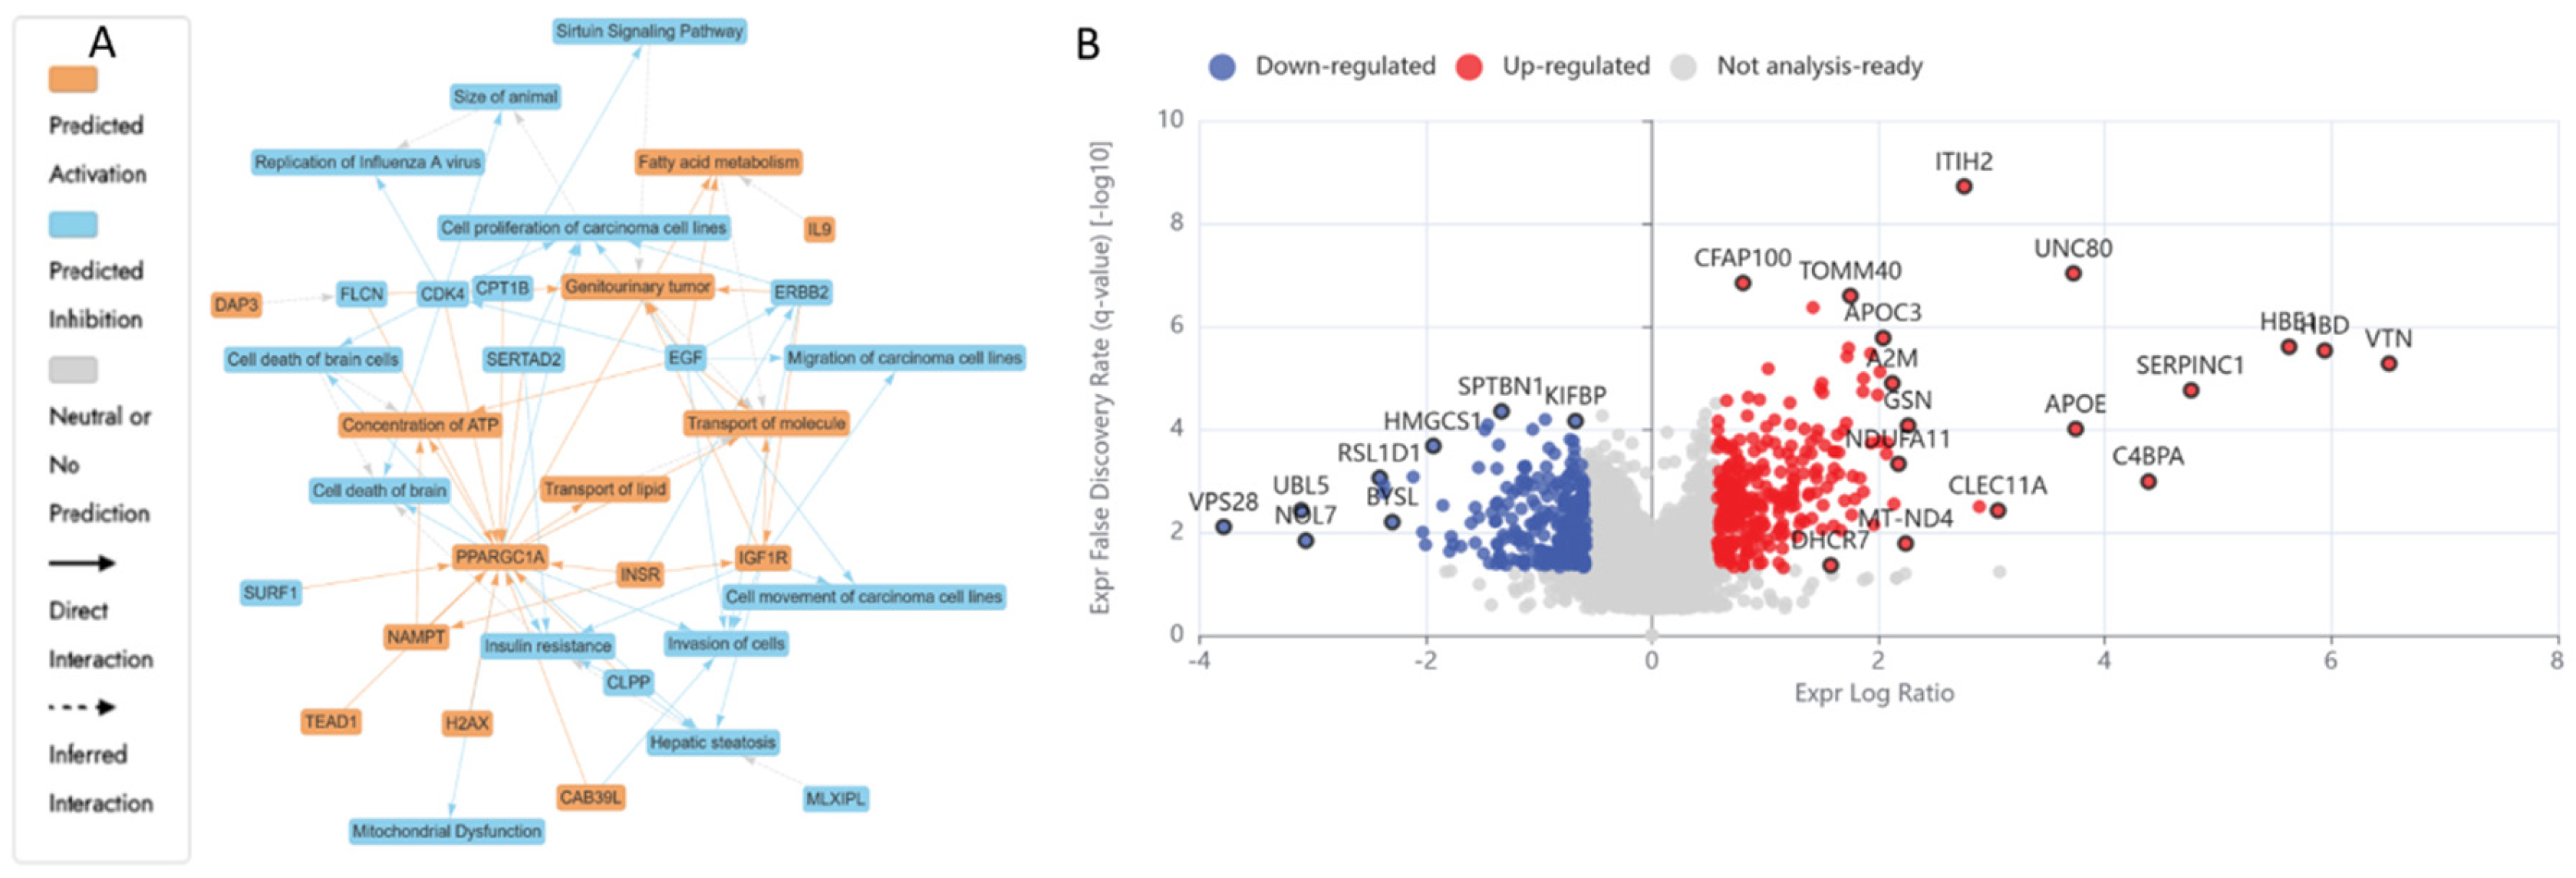
Figure 5.
Proteomics analysis of nisin (N) and urolithin B (UB) combination (4:6; 3200: 300 µM) vs mono treatment- N (3200 µM) and UB (300 µM) in HKB-11 lymphoma cells showing, A) IPA graphical summary showing two biological enriched themes. The significantly regulated proteins were identified (Q ≤ 0.05, log2 fold change ≥ 0.58). B) Volcano plot of significantly regulated proteins (absolute Log2 fold change ≥0.58 and Q ≤ 0.05).
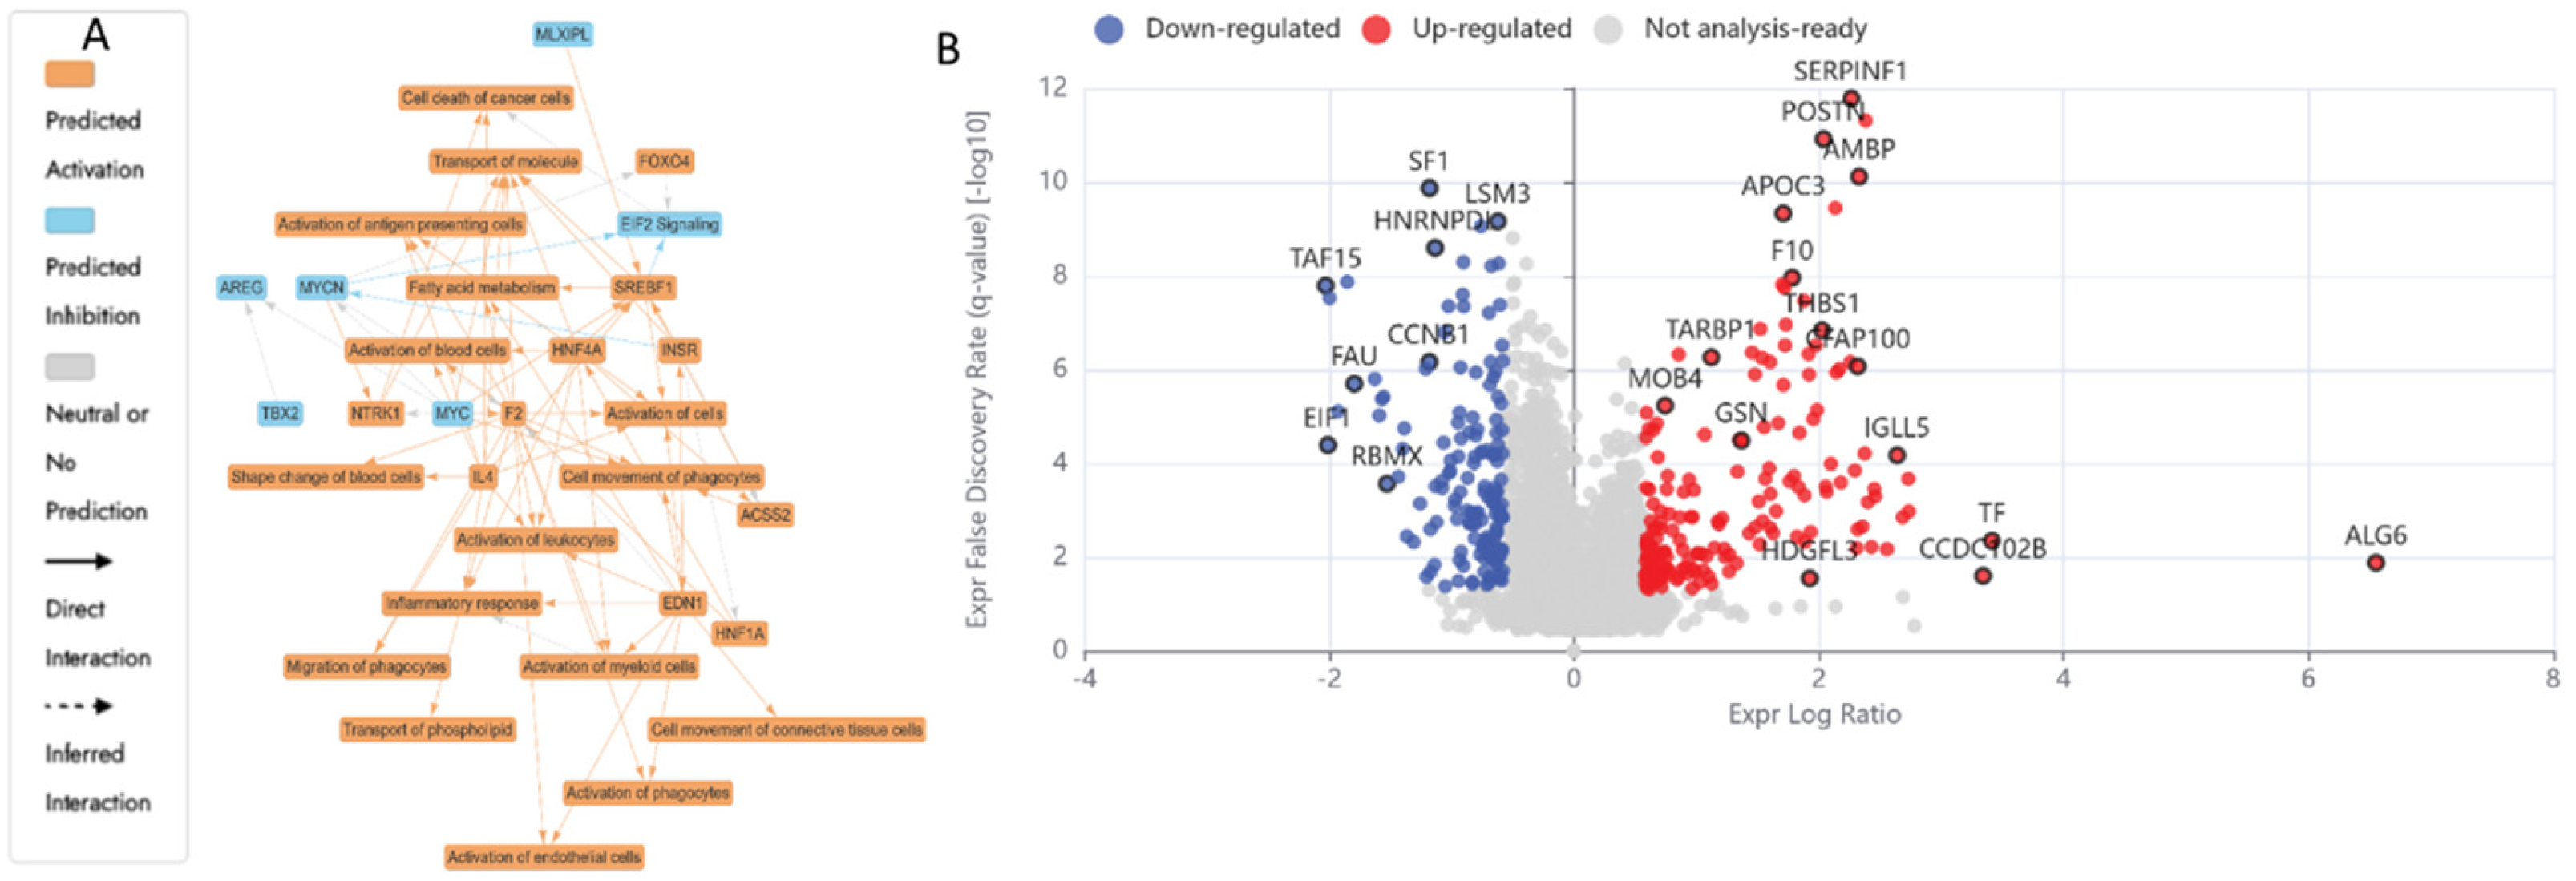
Figure 6.
Comparison analyses of nisin (N) and urolithin B (UB) combination (4:6; 3200: 300 µM) vs mono treatment- N (3200 µM) and UB (300 µM) in HKB-11 lymphoma cells. A) Cannonical pathways, B) Enriched disease functions, C) Upstream regulators. All filtered by Q <0.001 and abs Z score >2.
Figure 6.
Comparison analyses of nisin (N) and urolithin B (UB) combination (4:6; 3200: 300 µM) vs mono treatment- N (3200 µM) and UB (300 µM) in HKB-11 lymphoma cells. A) Cannonical pathways, B) Enriched disease functions, C) Upstream regulators. All filtered by Q <0.001 and abs Z score >2.
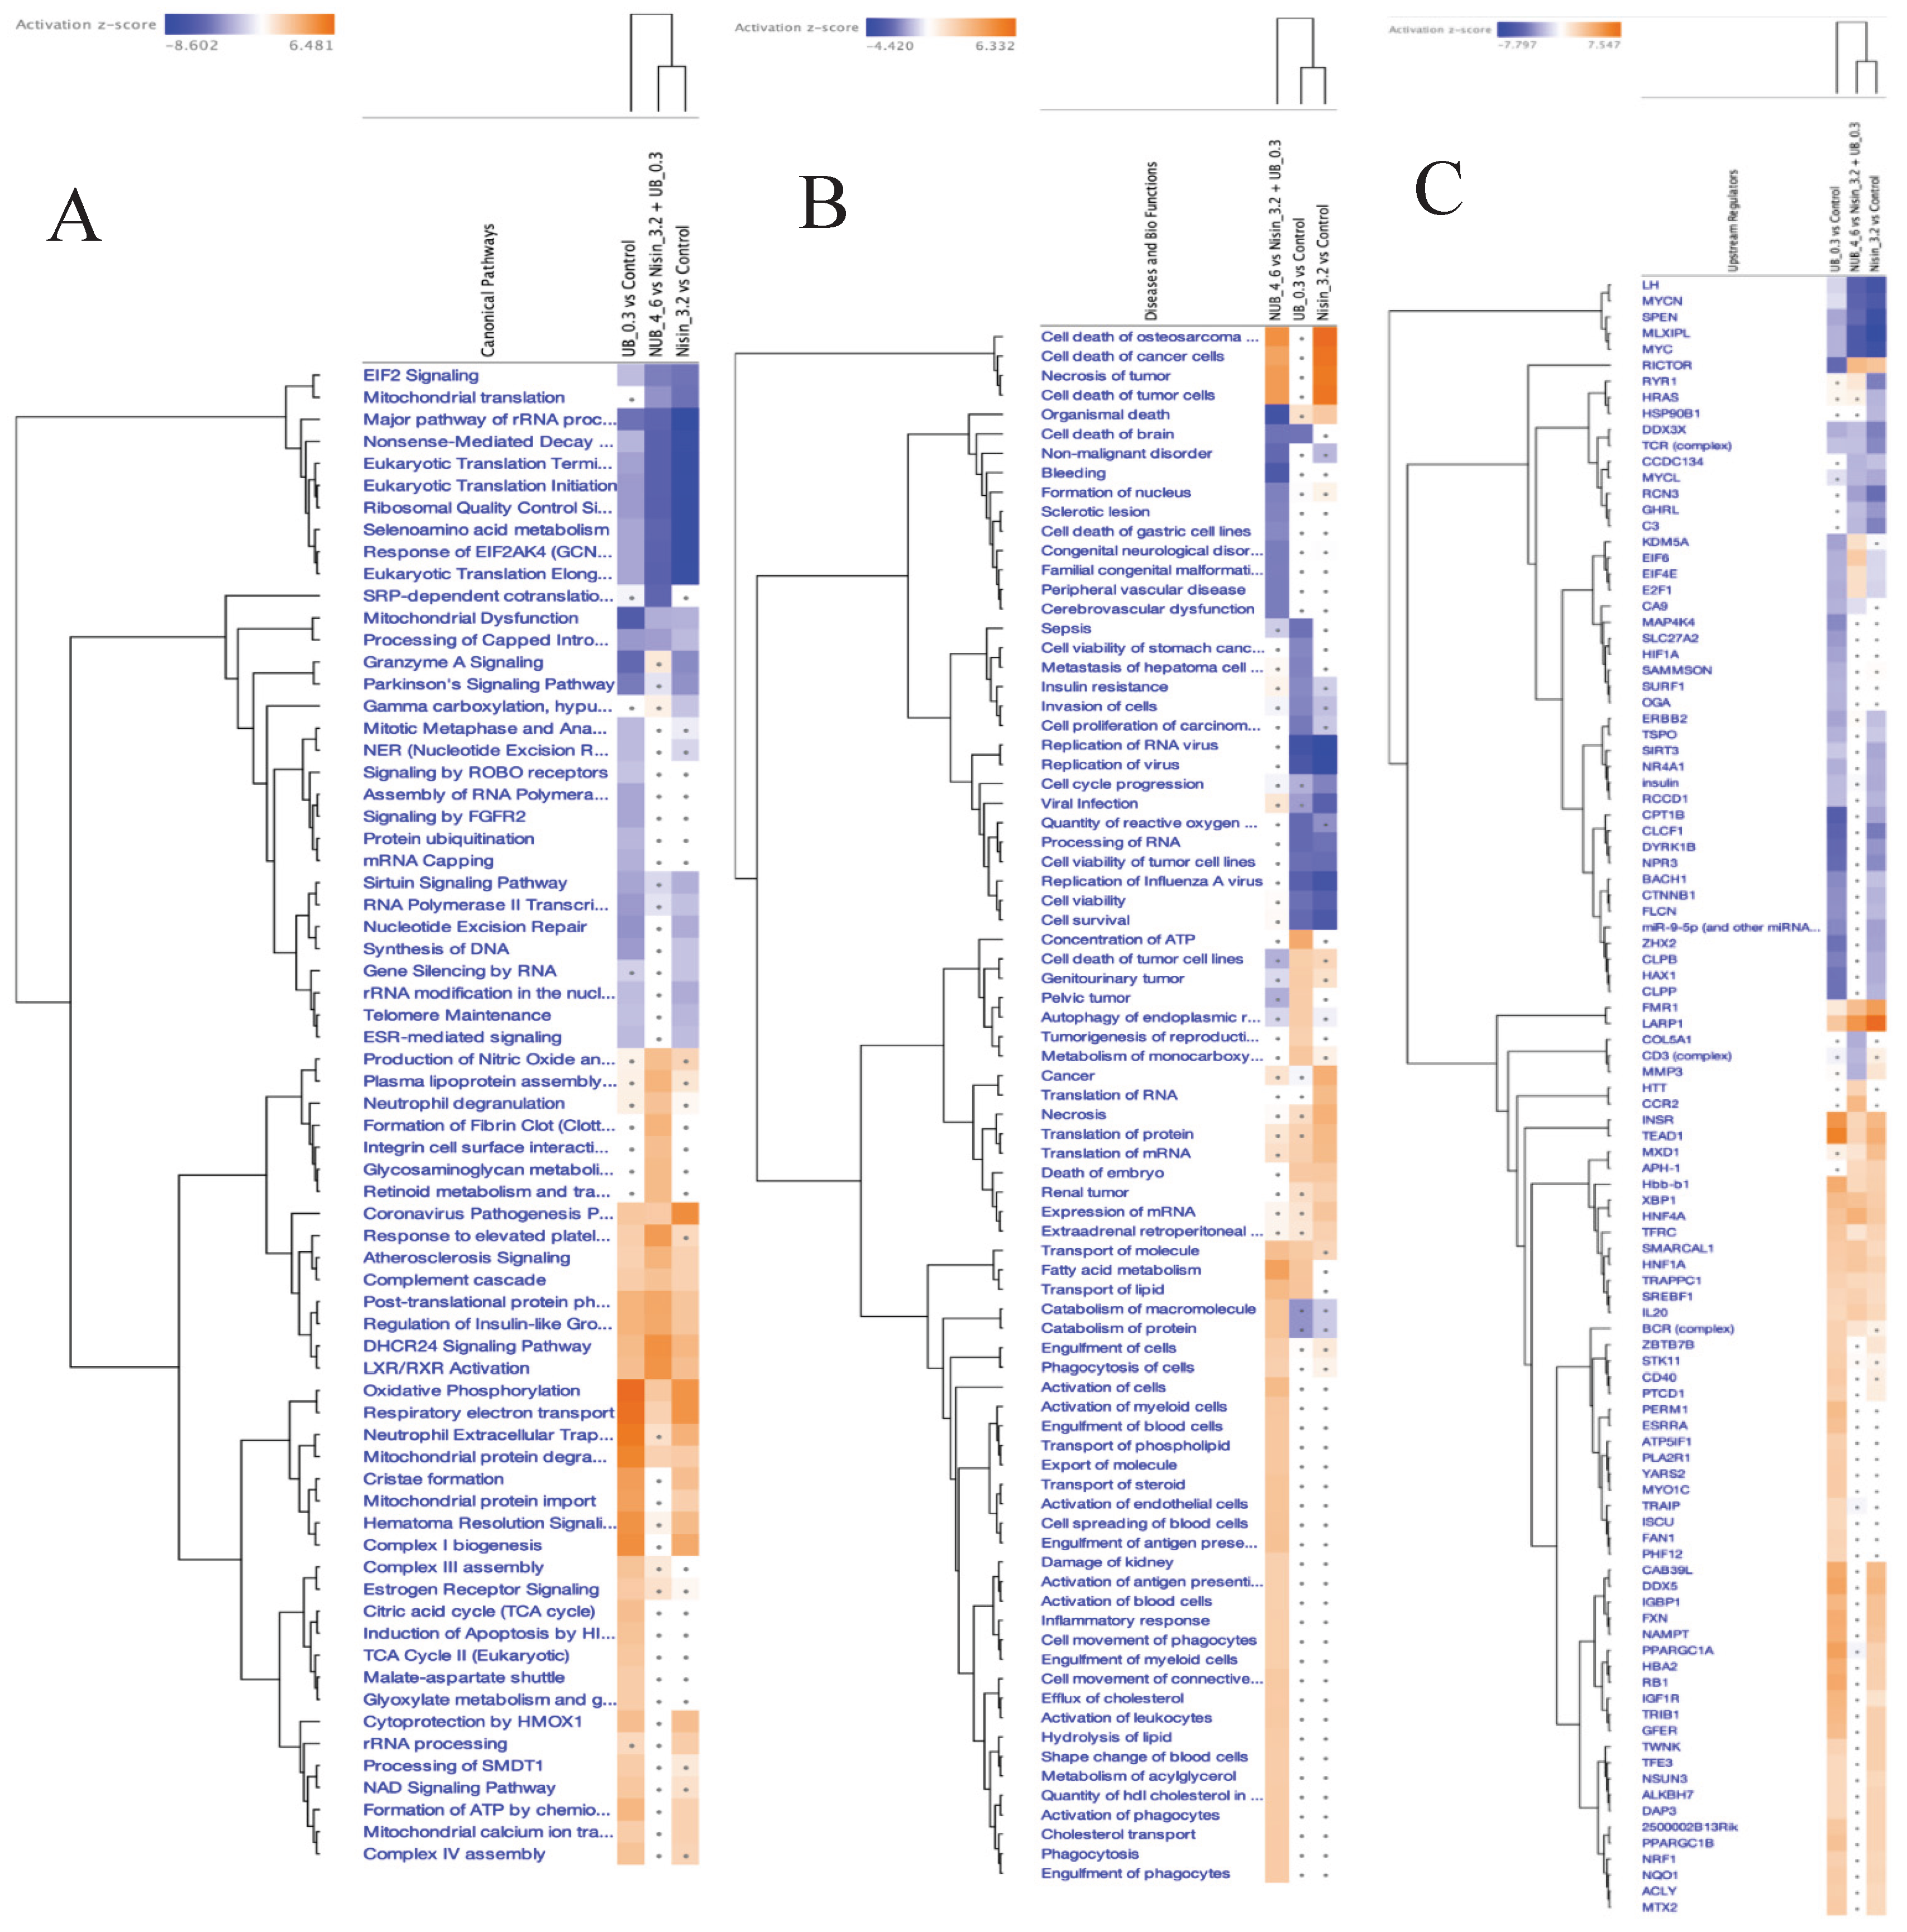

Table 1.
Cell growth inhibition (%) of Nisin, inosine, Urolithin A, Urolithin B and SCFA’s (Sodium butyrate, Sodium propionate and Magnesium acetate), against the HKB-11 lymphoma cells at concentrations of 1.953125 –16000 µM for 72 h using the Alamar Blue assay (n = 9).
Table 1.
Cell growth inhibition (%) of Nisin, inosine, Urolithin A, Urolithin B and SCFA’s (Sodium butyrate, Sodium propionate and Magnesium acetate), against the HKB-11 lymphoma cells at concentrations of 1.953125 –16000 µM for 72 h using the Alamar Blue assay (n = 9).
| Cell growth inhibition (%) of HKB-11 lymphoma cell line | ||||||||
|---|---|---|---|---|---|---|---|---|
| Concentration (µM) |
N | Sodium butyrate | Sodium propionate | Magnesium acetate | Inosine | Concentration (µM) |
UA | UB |
| 16000 | NA | 63.83 ± 8.99 a | 51.45 ± 12.41 b | 18.23 ± 5.66 c | 35.2 ± 10.76 d | 500 | 61.51 ± 13.44 a | 81.81 ± 9.51 b |
| 8000 | 100.26 ± 0.09 a | 57.83 ± 9.95 b | 38.07 ± 10.39 c | 9.97 ± 3.12 d | 30.91 ± 6.27 e | 250 | 39.31 ± 12.18 a | 74.24 ± 4.91 b |
| 4000 | 100.21 ± 0.18 a | 53.18 ± 10.22 b | 16.31 ± 7.30 c | 9.86 ± 4.18 d | 27.02 ± 8.27 e | 125 | 18.22 ± 10.15 a | 55.51 ± 7.58 b |
| 2000 | 65.22 ± 1.35 a | 45.36 ± 9.08 b | 11.82 ± 2.51 c | 8.57 ± 4.41 d | 19.32 ± 7.15 e | 62.5 | 12.03 ± 5.16 a | 39.63 ± 7.48 b |
| 1000 | 34.84 ± 3.52 a | 23.33 ± 6.66 b | 10.26 ± 3.23 c | 7.85 ± 4.89 d | 14.41 ± 5.2 e | 31.25 | 10.77 ± 6.16 a | 36.16 ± 11.92 b |
| 500 | 15.18 ± 6.98 a | 18.58 ± 3.59 b | 10.99 ± 2.83 c | 7.61 ± 5.66 d | 13.54 ± 4.57 e | 15.625 | 8.16 ± 5.42 a | 30.96 ± 15.63 b |
| 250 | 2.64 ± 3.47 a | 15.31 ± 3.23 b | 9.47 ± 2.61 c | 6.82 ± 6.07 d | 12.42 ± 6.04 e | 7.8125 | 6.84 ± 4.75 a | 23.05 ± 2.71 b |
| 125 | ND | 13.38 ± 3.51 a | 7.75 ± 4.79 b | 6.66 ± 4.01 c | 9.45 ± 4.76 d | 3.90625 | 5.72 ± 5.12 a | 17.99 ± 3.26 b |
| 62.5 | ND | 11.64 ± 3.91 a | 5.7 ± 4.21 b | 5.47 ± 3.16 c | 7.69 ± 5.33 d | 1.953125 | 5.64 ± 5.61 a | 12.22 ± 2.73 b |
| IC50 | 1467 µM | 2022 µM | 14597.14 µM | NA | NA | 384.41 µM | 87.56 µM | |
All cell growth inhibition (%) values are means ± standard deviations. a,b,c,d,e Values in the same row not having the same superscript letter are significantly different (p < 0.05) from each other at the same concentration. “NA” indicates not analysed. “ND” indicates no activity detected.
Table 2.
Drug interaction analysis of N and UB combinations in the HKB-11 lymphoma cells.
| Combinations N: UB |
IC50 | IC75 | IC90 | IC95 |
|---|---|---|---|---|
| 1:9 (800:450 μM) | 1.02 | 0.74 | 0.54 | 0.44 |
| 2:8 (1600:400 μM) | 1.03 | 0.88 | 0.76 | 0.69 |
| 3:7 (2400:350 μM) | 0.95 | 0.61 | 0.40 | 0.31 |
| 4:6 (3200:300μM) | 0.77 | 0.33 | 0.15 | 0.09 |
| 5:5 (4000:250 μM) | 0.94 | 0.53 | 0.31 | 0.22 |
| 6:4 (4800:200 μM) | 1.09 | 0.66 | 0.42 | 0.32 |
| 7:3 (5600:150 μM) | 0.91 | 0.46 | 0.25 | 0.17 |
| 8:2 (6400:100 μM) | 0.61 | 0.41 | 0.30 | 0.26 |
| 9:1 (7200:50 μM) | 1.32 | 0.92 | 0.70 | 0.61 |
CI, combination index; IC, inhibitory concentration. The bold numbers (CI values < 1) indicate synergistic interactions between N and UB.
Table 3.
Cell growth inhibition (%) against HKB-11 and Hs 313.T lymphoma cell lines and cell viability (%) of HS-5 normal stromal cell line at different concentrations of N: UB (4:6).
Table 3.
Cell growth inhibition (%) against HKB-11 and Hs 313.T lymphoma cell lines and cell viability (%) of HS-5 normal stromal cell line at different concentrations of N: UB (4:6).
| Concentration (μM) N: UB 4:6 (3200 : 300) | Cell growth inhibition (%) | Cell viability (%) | |
|---|---|---|---|
| HKB-11 | Hs 313.T | HS-5 | |
| 3500 | 98.49 ± 2.43 a | 100.55 ± 0.04 a | 10.08 ± 4.01 |
| 1750 | 65.77 ± 9.03 a | 90.26 ± 1.17 b | 17.92 ± 2.52 |
| 875 | 46.80 ± 1.32 a | 86.33 ± 1.59 b | 23.46 ± 3.96 |
| 437.5 | 30.04 ± 7.51 a | 76.06 ± 4.43 b | 66.37 ± 11.53 |
| 218.75 | 25.74 ± 17.07 a | 29.84 ± 7.04 a | 89.08 ± 9.20 |
| 109.375 | 21.86 ± 16.07 a | 9.99 ± 8.81 a | 92.32 ± 7.72 |
| IC50 | 1304 μM | 335.4 μM | 551.6 μM |
Data are presented as mean ± standard deviation (SD). a, b values in the same row not having the same superscript letter are significantly different (p < 0.05) from each other at the same concentration.
Table 4.
The upregulation (red) and downregulation (blue) of the relevant differentially expressed proteins and genes and their associated molecular pathways and mechanisms of action (Q ≤ 0.05) by the nisin (N; 3200 µM), urolithin B (UB; 300 µM), and their combination 4:6 (3500 µM) in the HKB-11 lymphoma cell line.
| Treatment | Log2FC | Gene ID | Protein Descriptions | Molecular pathway | Mechanism of action | Reference |
|---|---|---|---|---|---|---|
| N 3200 μM | -1.27 | LARP1 | La-related protein 1 | mTOR signalling and RNA binding | Regulates mRNA stability and translation of survival genes. | (Mura et al., 2015; Oquendo et al., 2021) |
| -1.54 | TYMS | Thymidylate synthase | Nucleotide synthesis and DNA replication | Catalyzes thymidylate synthesis; target of 5-FU chemotherapy. | (Matuszyk, 2022; Peplow, 2024) | |
| -0.80 | MAPK14 | Mitogen-activated protein kinase 14 | MAPK/p38 signaling pathway | Mediates cellular response to stress, inflammation, and proliferation. | (García-Hernández et al., 2021) | |
| -0.72 | PRC1 | Protein regulator of cytokinesis 1 | Cell cycle progression and mitosis | Regulates cytokinesis and mitotic spindle formation. | (Li et al., 2018) | |
| -0.70 | SRPK2 | SRSF protein kinase 2 | RNA splicing and nuclear mRNA processing | Works with SRPK1 in regulating alternative splicing. | (Gonçalves et al., 2017; Gout et al., 2012) | |
| -1.26 | CDK4 | Cyclin-dependent kinase 4 | Cell cycle (G1/S transition) | Phosphorylates RB1, promoting E2F release and progression through G1 phase | (Sturm et al., 2016) | |
| -0.62 | POLR2E | DNA-directed RNA polymerases I, II, and III subunit RPABC1 | Transcription (RNA Polymerase II complex) | Essential subunit for RNA Polymerase II assembly and mRNA transcription | (Kasahara et al., 2002) | |
| -0.63 | POLR2G | DNA-directed RNA polymerase II subunit RPB7 | Transcription (RNA Polymerase II complex) | Structural component maintaining polymerase II processivity | (Cramer, 2004; Osman & Cramer, 2020) | |
| -0.59 | POLR2H | DNA-directed RNA polymerases I, II, and III subunit RPABC3 | Transcription (RNA Polymerase II complex) | Stabilizes RNA Pol II structure; shared across all RNA polymerases | (Brandão et al., 2022; Osman & Cramer, 2020) | |
| -0.85 | RFC1 | Replication factor C subunit 1 | DNA replication (clamp loader complex) | Loads PCNA onto DNA, facilitating DNA polymerase binding during replication | (Majka & Burgers, 2004) | |
| -0.59 | RFC2 | Replication factor C subunit 2 | DNA replication and repair | Binds RFC1 to form RFC complex; essential for DNA synthesis fidelity | (Schmidt et al., 2001) | |
| -0.60 | NUP62 | Nuclear pore glycoprotein p62 | Nucleocytoplasmic transport (nuclear pore complex) | Central channel component; regulates import/export of macromolecules | (Bano et al., 2010) | |
| -0.93 | PPP1R14B | Protein phosphatase 1 regulatory subunit 14B | Actin cytoskeleton regulation | Inhibits protein phosphatase 1, affecting the cytoskeleton and cell motility | (Bao et al., 2024; Liao et al., 2023) | |
| -0.97 | CTNNA1 | Catenin alpha-1 | Cell adhesion (cadherin complex) | Links cadherins to actin cytoskeleton; maintains epithelial integrity | (Huang et al., 2023) | |
| -0.67 | HDAC1 | Histone deacetylase 1 | Epigenetic regulation (histone deacetylation) | Removes acetyl groups from histones, repressing transcription | (Gallinari et al., 2007) | |
| UB 300 μM |
2.04 | APOC3 | Apolipoprotein C-III | Triglyceride metabolism | Alters lipid signalling; enhances inflammatory microenvironment | (Hu et al., 2023) |
| 4.39 | C4BPA | C4b-binding protein alpha chain | Complement pathway | Inhibits complement-mediated lysis; immune evasion | (Blom et al., 2004) | |
| 3.06 | CLEC11A | C-type lectin domain family 11 member A | Cytokine signaling | Promotes endothelial and hematopoietic support in TME | (Fang et al., 2024) | |
| 2.07 | COX6C | Cytochrome c oxidase subunit 6C | Respiratory chain complex IV | Boosts mitochondrial respiration | (Kim et al., 2015) | |
| 2.08 | COX7C | Cytochrome c oxidase subunit 7C, mitochondrial | Cytochrome c oxidase | Increases mitochondrial adaptability in tumours | (De Francesco et al., 2017) | |
| 2.14 | FGB | Fibrinogen beta chain | Coagulation cascade | Promotes vascularisation and fibrin scaffolding in tumours | (Wu et al., 2024) | |
| 2.26 | GSN | Gelsolin | Actin regulation | Modulates the actin cytoskeleton for migration and invasion | (Alsofyani & Nedjadi, 2023) | |
| 5.94 | HBD | Hemoglobin subunit delta;Hemoglobin subunit beta | Hemoglobin complex | Facilitates oxygen delivery; modulates redox status | (Reeder, 2017) | |
| 5.63 | HBE1 | Hemoglobin subunit epsilon;Hemoglobin subunit gamma-1;Hemoglobin subunit gamma-2 | Fetal hemoglobin pathway | Reactivation may aid hypoxic survival in tumours | (Woodard, 2021) | |
| 2.76 | ITIH2 | Inter-alpha-trypsin inhibitor heavy chain H2 | Matrix stability | Regulates hyaluronic acid and ECM stiffness | (Huth et al., 2020) | |
| 2.34 | MT-CO2 | Cytochrome c oxidase subunit 2 | Mitochondrial respiration | Supports tumour ATP production and ROS balance | (Vikramdeo et al., 2022) | |
| 2.24 | MT-ND4 | NADH-ubiquinone oxidoreductase chain 4 | Complex I, OXPHOS | Enhances mitochondrial respiration and survival under stress | (Xu et al., 2023) | |
| 2.18 | NDUFA11 | NADH dehydrogenase [ubiquinone] 1 alpha subcomplex subunit 11 | OXPHOS complex I | Maintains mitochondrial metabolism in cancer cells | (Wang et al., 2015) | |
| 2.01 | SAMM50 | Sorting and assembly machinery component 50 homolog | Protein import | Preserves outer membrane; supports anti-apoptotic signals | (Lefort et al., 2009) | |
| -1.45 | MAD2L1 | Mitotic spindle assembly checkpoint protein MAD2A | Mitotic checkpoint (Spindle Assembly Checkpoint, SAC) | Ensures proper chromosome segregation, disrupts mitosis, causing mitotic arrest or apoptotic cell death | (Bates et al., 2020) | |
| -0.59 | PSME3 | Proteasome activator complex subunit 3 | Proteasome activation, p53 degradation | Degrades tumor suppressor proteins. Its suppression stabilizes p53, enhancing apoptosis and cell cycle arrest | (Guo et al., 2021) | |
| -1.21 | UBE2S | Ubiquitin-conjugating enzyme E2 S | Ubiquitination, mitotic exit | Ubiquitinates mitotic inhibitors (APC/C complex co-activator), Downregulation leads to mitotic arrest, promoting senescence |
(Garnett et al., 2009) | |
| -0.63 | PCNA | Proliferating cell nuclear antigen | DNA replication and repair | Sliding clamp for DNA polymerases, Loss of PCNA function causes replication stress and apoptosis |
(Strzalka & Ziemienowicz, 2011) | |
| -1.69 | UBE2E1 | Ubiquitin-conjugating enzyme E2 E1;Ubiquitin-conjugating enzyme E2 E3;Ubiquitin-conjugating enzyme E2 E2 | Ubiquitin-conjugating enzyme | Supports proteostasis, DNA repair, Suppression disrupts protein quality control, leading to cell death | (Maffeo & Cilloni, 2024) | |
| N: UB 4:6 (3200:300 μM) |
2.30 | A2M | Alpha-2-macroglobulin | Protease inhibition, complement cascade | Regulates proteolysis, potentially restricts tumor invasion. | (Lagrange et al., 2022) |
| 0.67 | CDC27 | Cell division cycle protein 27 homolog | Mitotic Checkpoint (Anaphase-Promoting Complex, APC/C) | Regulates ubiquitination of mitotic regulators | (Sivakumar & Gorbsky, 2015) | |
| 2.45 | AFP | Alpha-fetoprotein | Oncofetal protein, MAPK signaling | Supports tumor proliferation, angiogenesis; marker in hepatic and hematological cancers. | (Samban et al., 2024) | |
| 2.56 | AHSG | Alpha-2-HS-glycoprotein | TGF-β inhibition | Inhibits calcification and regulates inflammation in tumors | (Odiase et al., 2024) | |
| 2.32 | ALB | Albumin | Plasma transport | High levels may reflect cancer cachexia or liver activity during tumor burden. | (Huang et al., 2024) | |
| 6.55 | ALG6 | Dolichyl pyrophosphate Man9GlcNAc2 alpha-1,3-glucosyltransferase | N-glycosylation | Promotes ER glycoprotein processing; linked to tumor cell survival | (Zhou et al., 2020) | |
| 2.64 | IGLL5 | Immunoglobulin lambda-like polypeptide 5 | B-cell development | Overexpressed in some B-cell lymphomas; immune receptor surrogate | (Hosoi et al., 2024) | |
| 2.36 | LCAT | Phosphatidylcholine-sterol acyltransferase | HDL metabolism | Alters cholesterol availability in tumors | (D’Arca et al., 2023) | |
| 2.46 | NNMT | Nicotinamide N-methyltransferase | Nicotinamide methylation | Reprograms NAD+ metabolism, supports proliferation | (Sun et al., 2024) | |
| 2.38 | SERPINA7 | Thyroxine-binding globulin | Thyroid hormone transport | Affects hormone signaling relevant to cancer cell growth | (Guo et al., 2019) | |
| 2.27 | SERPINF1 | Pigment epithelium-derived factor | Anti-angiogenic | Inhibits neovascularisation; tumor-suppressive in some contexts | (Mathew et al., 2024) | |
| 3.41 | TF | Serotransferrin | Iron transport | Modulates iron availability and oxidative stress in tumor cells | (Chen et al., 2019) | |
| 1.78 | F10 | Coagulation factor X | Coagulation cascade | Activation of prothrombin to thrombin; can affect tumor vascularization | (Alexander & Gilmour, 2022) | |
| 0.71 | FGB | Fibrinogen beta chain | Extracellular matrix (ECM) interaction | Participates in clot formation and tissue remodeling | (Wu et al., 2024) | |
| 0.65 | ITGB1 | Integrin beta-1 | Cell adhesion, survival signaling | Binds ECM; activates FAK, PI3K pathways | (Su et al., 2024) | |
| 0.77 | RANGAP1 | Ran GTPase-activating protein 1 | Nuclear transport and cell cycle regulation | Controls Ran GTPase cycle; vital for nuclear envelope reformation during mitosis, | (Ciciarello et al., 2007) | |
| -0.75 | BUB3 | Mitotic checkpoint protein BUB3 | Spindle Assembly Checkpoint (SAC) | Ensures correct chromosomal segregation, Loss promotes chromosomal instability but can also trigger catastrophic cell death in tumors | (Sarkar et al., 2021) | |
| -1.18 | CCNB1 | G2/mitotic-specific cyclin-B1 | Cell cycle control (G2/M checkpoint) | Complexes with CDK1 to trigger mitosis, Downregulation leads to G2/M arrest and apoptosis | (Li, 2024) | |
| -0.60 | CDCA8 | Borealin | Chromosome passenger complex (CPC) | Regulates mitosis and cytokinesis, Loss disrupts chromosomal stability, causing mitotic catastrophe | (Zhang et al., 2020) | |
| -0.66 | CDK1 | Cyclin-dependent kinase 1 | Master G2/M checkpoint kinase | Phosphorylates downstream mitotic proteins , Inhibition causes G2/M phase arrest, senescence, or apoptosis | (Fatma & Kumar, 2021) | |
| -0.59 | MAP2K4 | Dual specificity mitogen-activated protein kinase kinase 4 | JNK/p38 MAPK stress pathway | Activates pro-apoptotic MAPK cascades , block survival signals, sensitizing cells to apoptosis | (Li et al., 2024; Yue & López, 2020) |
Disclaimer/Publisher’s Note: The statements, opinions and data contained in all publications are solely those of the individual author(s) and contributor(s) and not of MDPI and/or the editor(s). MDPI and/or the editor(s) disclaim responsibility for any injury to people or property resulting from any ideas, methods, instructions or products referred to in the content. |
© 2025 by the authors. Licensee MDPI, Basel, Switzerland. This article is an open access article distributed under the terms and conditions of the Creative Commons Attribution (CC BY) license (http://creativecommons.org/licenses/by/4.0/).
Copyright: This open access article is published under a Creative Commons CC BY 4.0 license, which permit the free download, distribution, and reuse, provided that the author and preprint are cited in any reuse.


