
Submitted:
02 December 2024
Posted:
02 December 2024
You are already at the latest version
Abstract
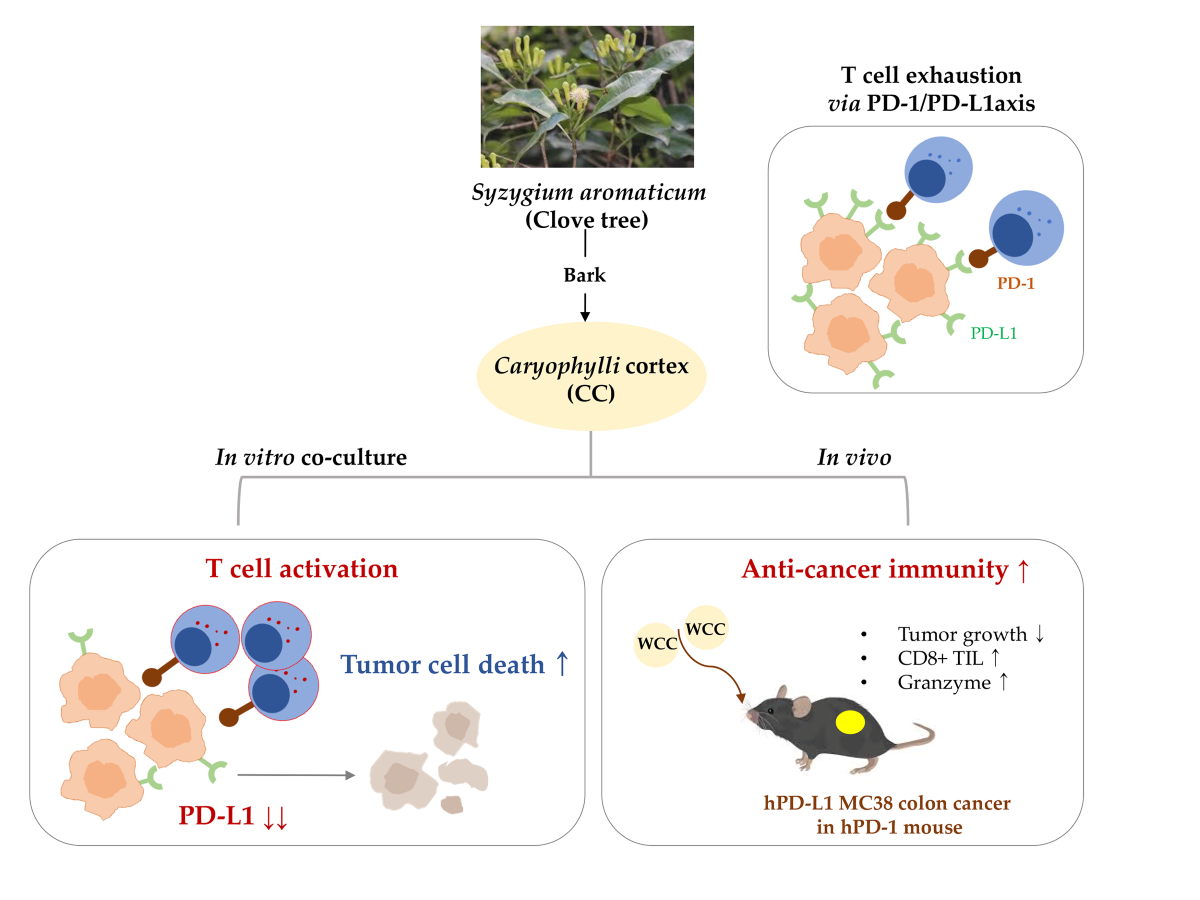
Immune checkpoints are essential for regulating excessive autoimmune responses and maintaining immune homeostasis. However, in the tumor microenvironment, these checkpoints can lead to cytotoxic T cell exhaustion, allowing cancer cells to evade immune surveillance and promote tumor progression. The expression of programmed death-ligand 1 (PD-L1) in cancer cells is associated with poor prognoses, reduced survival rates, and lower responses to therapies. Consequently, downregulating PD-L1 expression has become a key strategy in developing immune checkpoint inhibitors (ICIs). Caryophylli cortex (CC), derived from the bark of the clove tree Syzygium aromaticum, possesses antioxidant and cytotoxic properties against cancer cells, yet its potential as an ICI remains unclear. Therefore, we investigated whether CC extract modulates PD-L1 expression in cancer cells and assessed its ability to activate T cell immunity in both in vitro co-culture and in vivo animal models. The results indicated that CC extract significantly downregulated both constitutive and inducible PD-L1 expression at non-toxic concentrations for cancer cells while enhancing cancer cell mortality and T cell activity in co-culture. Additionally, administering CC extract to hPD-L1/MC-38 tumor-bearing mice resulted in over a 70% reduction in tumor growth and increased CD8+ T cell infiltration in the tumor microenvironment. Principal component analysis identified bergenin, chlorogenic acid, and ellagic acid as active ICIs. These findings suggest that CC extract exerts a potent antitumor effect as an immune checkpoint blocker by inhibiting PD-L1 expression in cancer cells and disrupting the PD-1/PD-L1 interaction.
Keywords:
Caryophylli Cortex
; immune checkpoint
; programed death 1
; programed death ligand 1
; anticancer activity
1. Introduction
The capacity of tumor cells to evade the immune response, a phenomenon referred to as immune escape, and their acquired resistance to anti-cancer therapies, are major challenges to the effective management of cancer [1]. A fundamental mechanism underlying this process is the interaction between Programmed Death Ligand 1 (PD-L1) expressed in cancer cells and the Programmed Death 1 (PD-1) receptor on cytotoxic T lymphocytes (CTLs), which inhibits T cell activity [2,3,4]. The PD-1/PD-L1 axis is one of several immune checkpoint regulators that play critical roles in maintaining self-tolerance and modulating the duration and intensity of immune responses, primarily by inhibiting adaptive T cell responses. Tumor cells exploit this mechanism to suppress anti-tumor responses, leading to CTL exhaustion and heightened resistance to pro-apoptotic signals. Currently, immune checkpoint blockade (ICB) using anti-PD-1 and anti-PD-L1 antibodies is a promising therapeutic strategy for cancer patients [5]. However, approximately 30% of patients relapse, highlighting the need for alternative strategies to regulate the PD-1/PD-L1 axis [6].
PD-L1 is markedly overexpressed in melanoma, lung, ovarian, pancreatic, colorectal, and breast cancers. In breast cancer, elevated PD-L1 levels are associated with unfavorable clinical outcomes and correlated with negative prognostic indicators, such as an increased proliferation index, larger tumor size, the absence of estrogen or progesterone receptors, HER2 positivity, and higher tumor grade [7,8,9,10]. These associations suggest that the inhibition of PD-L1 expression is a promising approach for immune checkpoint-based cancer therapies. Recent studies have demonstrated that compounds such as berberine, luteolin, apigenin, cosmosiin, and luteolin have the potential to reactivate anti-cancer immune responses and improve therapeutic efficacy by modulating either constitutive or inducible PD-L1 expression in cancer cells [11,12,13,14].
The clove tree Syzygium aromaticum is an evergreen tree in family Myrtaceae that is cultivated in tropical regions in India, Indonesia, Malaysia, and Sri Lanka. Its flower buds have been esteemed for centuries for their applications in food preservation, flavoring, perfumery, and traditional medicine [15,16]. Clove flower buds exhibit anti-inflammatory, anti-diabetic, antimicrobial, antiviral, antioxidant, and hepatoprotective activity [17,18]. Ethanol extracts of clove bark, known as Caryophylli cortex (CC), mitigate diabetes-induced renal damage by inhibiting advanced glycation end-product (AGE)-induced glucotoxicity and oxidative stress [19]. Furthermore, methanol extracts of CC are cytotoxic to MCF-7 breast cancer cells [20]. However, the potential of CC as an immune checkpoint inhibitor (ICI) to enhance anti-tumor immune responses remains unexplored. Therefore, this study investigated whether water (WCC) and ethanol (ECC) extracts of CC might enhance anti-cancer efficacy by reducing PD-L1 expression in cancer cells and activating T cell immunity, thereby disrupting PD-L1-mediated immune tolerance in both in vitro and in vivo experimental models.
2. Materials and Methods
2.1. Preparation of WCC and ECC
Lyophilized powder of WCC (Cat. No. KOC-DW-335) and ECC (Cat. No. KOC-70E-261) were obtained from KOC Biotech (Daejeon, Korea) and dissolved in 100% dimethyl sulfoxide (DMSO, #D8418, Sigma Chemical Co., St. Louis, MO, USA) to achieve a final concentration of 100 mg/mL. After filtering through a 0.22-μm disk filter, aliquots were kept at −20°C.
2.2. Cell Lines
The MDA-MB-231 (HTB-26, human breast adenocarcinoma cell line), DLD-1 (CCL-221, human colon adenocarcinoma cell line), HEK-293 (CRL-1573, human embryonic kidney cell line) cells were obtained from the American Type Culture Collection (ATCC, Manassas, VA, USA). Human PD-L1-expressing MC38 cells (hPD-L1/MC38), derived from C57BL/6 murine colon adenocarcinoma cells, were purchased from the Shanghai Model Organisms Center (Shanghai, China). Jurkat T cells expressing the firefly luciferase gene under the control of nuclear factor of activated T cells (NFAT) response elements, with constitutive expression of human PD-1 (NFAT/PD-1/Jurkat T cells), were obtained from BPS Bioscience (San Diego, CA, USA). MDA-MB-231, hPD-L1/MC-38, and HEK-293 cells were cultured in Dulbecco's Modified Eagle Medium with 4.5 g/L glucose (DMEM), while DLD-1 and NFAT/PD-1/Jurkat T cells were cultured in RPMI 1640 medium. Both culture media were supplemented with 10% heat-inactivated fetal bovine serum (FBS) and 100 IU penicillin/100 μg/mL streptomycin (P/S). The cells were cultured at 37°C in a humidified incubator with 5% CO2. DMEM, RPMI, FBS, and P/S were obtained from Thermo Fisher Scientific (Waltham, MA, USA). Hyclone Laboratories Inc. (GE Healthcare Life Sciences, Chicago, IL, USA).
2.3. Chemicals and Antibodies
Crystal violet solution (1% aqueous solution, #V5265), collagenase IV, DNase, and trypsin inhibitor were all obtained from Sigma-Aldrich (St Louis, MO, USA). CellTracker Green 5-chloromethylfluorescein diacetate (CMFDA, #C7025) dye and recombinant human interferon-γ (IFN-γ, #300-02) was obtained from Thermo Fisher Scientific (Waltham, MA, USA). APC-conjugated anti-human CD274 (B7-H1, PD-L1, #393610) antibody was purchased from BioLegend (San Diego, CA, USA). Antibodies against PD-L1 (#15165) and β-actin (#4970) were all obtained from Cell Signaling Technology (Beverly, MA, USA).
2.4. Cell Viability Assay
To determine non-cytotoxic concentrations of WCC and ECC, cell viability was measured using Cell Counting Kit-8 (#CK04, Dojindo Molecular Technologies, Inc., Rockville, MD, USA), according to the manufacturer’s protocol. In brief, cells (5 × 10³/well) were seeded in each well of a 96-well culture plate, allowed to grow overnight, and then treated with increasing doses of WCC, ECC, or vehicle (0.1% DMSO) for 24 h. After removing culture supernatants, the cells were washed twice with phosphate-buffered saline (PBS, Thermo Fisher Scientific). Viable cells were then quantified using the EZ-Cytox Enhanced Cell Viability Assay Kit (Daeil Lab Service Co., Ltd., Seoul, Republic of Korea) and a SpectraMax3 microplate reader (Molecular Devices, LLC, Sunnyvale, CA, USA).
2.5. Analysis of Membrane PD-L1 Expression Using Flow Cytometry and Immunoblotting
MDA-MB231 and hPD-L1/MC38 cells were exposed to specified concentrations of WCC and ECC for 24 h. In the case of DLD-1 cells, WCC and ECC were pre-treated for 12 h and then stimulated with 20 ng/mL IFN-γ for 24 h. For flow cytometry analysis, cells were collected, rinsed with wash buffer (2% FBS in PBS), and incubated with APC-conjugated anti-PD-L1 for 30 minutes at 4°C. Following washing, fluorescence levels were quantitatively assessed using a Gallios flow cytometer with Kaluza software (Beckman Coulter, Inc., Brea, CA, USA). For immunoblotting, cells were harvested, washed with cold PBS, and lysed in RIPA buffer with a protease inhibitor cocktail. After spinning at 13,000 rpm for 15 min at 4°C, the cell lysates were collected, and the protein concentration was determined using the bicinchoninic acid assay (#23227; Thermo Fisher Scientific). An equal amount of proteins (25 μg per lane) were then separated on an SDS-polyacrylamide gel and transferred to an ImmobilonR-P PVDF membrane (Millipore, Bedford, MA, USA). Following incubation with EzBlock Chemi Solution (ATTO Korea, Daejeon, Republic of Korea) for 1 h at 25°C, the membrane was exposed to a specific primary antibody (diluted 1:1,000 in blocking buffer) overnight at 4°C. Subsequently, the membrane was washed with TBS-T solution (0.1% Tween in Tris-buffered saline) and then incubated with an HRP-conjugated secondary antibody (diluted 1:4,000 in blocking buffer) for 1 h at 25°C, followed by another wash with TBS-T solution. The target proteins were visualized using SuperSignal West Femto Maximum Sensitivity Substrate (Thermo Fisher Scientific) and ImageQuant LAS4000 mini (GE Healthcare, Piscataway, NJ, USA). Protein levels were quantified using ImageJ software (National Institute of Health, USA), and the relative intensities of the bands on the immunoblots from two or three experiments were calculated after normalization to the β-actin value.
2.6. Co-Culture Experiments for T Cell-Mediated Tumor Cell Killing Assay
MDA-MB231 cells were seeded at a density of 2 × 10⁵ cells per well in 24-well culture plates and exposed to different concentrations of WCC and ECC for 24 h. Following the removal of the culture medium, the cells underwent three washes with PBS and were subsequently stained with CellTracker CMFDA dye at a concentration of 2.5 μM for 30 min at 37°C. After two additional washes with PBS, NFAT/PD-1/Jurkat T cells were added to the MDA-MB231 cells labeled with the green dye, and incubated for 24-48 h. Subsequently, the PD-1/Jurkat cells were eliminated, and the remaining MDA-MB231 cells were examined using a fluorescence microscope. To assess cell viability, the cells were stained with a crystal violet solution containing 0.2% crystal violet and 20% methanol for 30 min at 25°C. Following a wash with distilled water, the stained cells were dissolved in a 1% SDS solution and then the absorbance was measured at 590 nm using a SpectraMax3 microplate reader.
2.7. Experimental Mice and Allograft Tumor Model
Mice with humanized PD-1, developed on the C57BL/6J genetic background and genetically modified to express the complete human PD-1 protein (referred to as hPD-1/C57BL/6J), were obtained from the Shanghai Model Organisms Center in China and raised in a controlled environment at the KIOM for research purposes. To establish the humanized PD-1/PD-L1 MC38 tumor allograft model, hPD-L1/MC38 cells (3 × 10⁵ in 200 μL PBS) were injected subcutaneously on the right flank of each hPD-1/C57BL/6J mouse. The tumor's growth was monitored, and its size was measured using digital calipers (Hi-Tech Diamond, Westmont, IL, USA). The experiments conducted followed the guidelines of the Institutional Animal Care and Use Committee (IACUC) at the Korea Institute of Oriental Medicine (KIOM) and were authorized by the KIOM IACUC under approval number KIOM-D-21-091.
2.8. Isolation of Tumor Infiltrating CD8+ T Cells and Co-Culture with hPD-L1/MC38 Cells
To isolate tumor-infiltrating T cells (TILs), tumor masses from hPD-L1/MC-38 tumors in hPD-1 mice were removed, cut into small pieces, and then digested in RPMI media containing collagenase IV (1 mg/mL), DNase (0.1 mg/mL), and trypsin inhibitor (1 mg/mL) for 40 min at 37°C. The digested cells were then filtered through mesh cell strainers (SPL Life Sciences, Pocheon, Korea) of decreasing sizes (100-μm, 70-μm, and 40-μm) to obtain a single-cell suspension. CD8+ TILs were isolated using immunomagnetic separation with a Mouse CD8+ T cell isolation kit (Miltenyi Biotec, Waltham, MA, USA) and then activated with CD3/CD28 magnetic Dynabeads (Life Technologies, Carlsbad, CA, USA) for 24 h at 37°C. Simultaneously, hPD-L1/MC38 cells were treated with different concentrations of WCC and ECC for 24 h. After washing, the activated CD8+ TILs (Effector cells, E) were added to the WCC- or ECC-treated hPD-L1/MC38 cells (Target cells, T) at a ratio of E:T=5:1. The cells were than incubated for 48 h, and the viable hPD-L1/MC38 cells were identified after crystal violet staining. Quantitation was performed using a SpectraMax3 microplate reader as described above.
2.9. NFAT Luciferase Activity Assay
To assess T cell activity in NFAT/PD-1/Jurkat T cells following co-culture with MDA-MB231 cells or HEK-293 cells, NFAT luciferase activity was measured using Luciferase Assay System (#E4550, Promega, Madison, WI, USA) according to the manufacturer’s protocol. In brief, NFAT/PD-1/Jurkat T cells were collected and lysed using luciferase cell culture lysis buffer. After mixing the cell lysates and luciferase assay reagent, the luminescence was immediately measured using a SpectraMax Luminometer (Molecular Devices).
2.10. Enzyme-Linked Immunosorbent Assay (ELISA)
The concentrations of IL-2 and granzyme B, which are released by activated T cells, were quantified using ELISA following the manufacturer's instructions. The BD OptEIATM Human IL-2 ELISA Set (#555190, BD Biosciences, San Diego, CA, USA), human Granzyme B SimpleStep ELISA Kit (ab235635, Abcam, Cambridge, MA, USA), BD OptEIATM Mouse IL-2 ELISA Set (#555148, BD Biosciences), and Granzyme B Mouse ELISA Kit (#88-8022, Thermo Fisher Scientific) were utilized for analyzing the co-culture supernatants or mouse sera.
2.11. Assay for Blocking the Interaction Between PD-1 and PD-L1
To examine the effects of WCC and ECC on the PD-1 and PD-L1 interaction, competitive ELISA was performed using PD-1: PD-L1 Inhibitor Screening Assay Kit (#72005, BPS Bioscience Inc., San Diego, CA, USA) according to the manufacturer’s instruction. In brief, recombinant hPD-L1 (#71104, BPS Bioscience) was immobilized on 96-well plates at a concentration of 1 µg/mL (100 µL per well) and incubated overnight at 4°C. The plates were then washed three times with PBS containing 0.05% Tween (PBS-T), blocked for 1 h at 25°C with PBS-T containing 2% (w/v) bovine serum albumin (BSA), and washed again three times. Various concentrations of WCC and ECC were added to the wells, followed by incubation for 1 h at 25°C. Subsequently, biotinylated hPD-1 (#71109, BPS Bioscience) was added to the wells and incubated for 2 h at 25°C. The wells were washed three times with PBS-T and then 100 µL HRP-conjugated streptavidin was applied to each well. Following a 1-hour incubation, the plates underwent three washes with PBS-T. The relative chemiluminescence was quantified using an ECL solution and a SpectraMax L Luminometer. For the positive control, an anti-PD-1 neutralizing antibody (α-PD-1, #71120, BPS Bioscience) was used.
2.12. In Vivo Anti-Tumor Activity of WCC in Humanized PD-1/PD-L1 Mouse Model
To create tumor masses, hPD-L1/MC38 cells (3 × 10⁵ cells suspended in 200 μL of PBS) were injected under the skin on the right side of each hPD-1/C57BL/6J mouse. The growth of the tumors was monitored and measured twice a week using a digital caliper. Once the tumor volume reached 100-150 mm3 on day 12, the mice were randomly assigned to one of four groups (n = 5 per group): a Normal group (no tumor + PBS), a Control group (tumor + PBS), and WCC groups receiving either a low or high dose of WCC (tumor + 100 or 300 mg/kg WCC). The mice were orally administered either the PBS or WCC daily for 15 days. Tumor volume and body weight were recorded on days 1, 4, 8, 11, 14, and 16. Tumor volume was calculated using the formula: Tumor volume = (a2 × b) × 0.52, where a and b represent the shortest and the longest diameters of the tumors, respectively. After the tumors were removed and weighed, the tumor suppression rate (TSR) was determined using the formula: TSR (%) = [(Vc – Vt)/Vc] × 100, where Vc represents the tumor volume of the control group and Vt represents the tumor volume of the WCC treatment group.
2.13. Immunohistochemistry
Tumors were fixed in a 10% formalin solution, dehydrated, and embedded in paraffin. The paraffin block was then sliced into consecutive 10-μm sections, which were placed on a microscope slide. To conduct immunostaining, the sections were deparaffinized, rehydrated, subjected to epitope retrieval, and had peroxidase activity blocked. Subsequently, the sections were treated with antibodies targeting CD8 (#98941) and granzyme B (#46901) overnight, and then visualized using a DAKO EnVision Kit (DAKO, Jena, Germany). Following counterstaining with Mayer’s hematoxylin, the images were examined using an Olympus BX53 microscope and an XC10 digital camera (Tokyo, Japan).
2.14. Statistical Analysis
Data analysis was performed using GraphPad Prism 9.5.1 (GraphPad Software, San Diego, CA, USA). Results are shown as means ± standard error of the mean (SEM) from multiple trials. Variations between groups were assessed using one-way analysis of variance (ANOVA) with Dunnett’s multiple comparison test. Statistical significance was determined at p < 0.05 (*p < 0.05, **p < 0.01, and ***p < 0.001). All experiments, except for those conducted in vivo, were repeated at least three times.
3. Results
3.1. WCC and ECC Decrease PD-L1 Expression in Cancer Cells
To explore the effects of WCC and ECC on PD-L1 expression in cancer cells, we used MDA-MB231 cells, which are known for their high constitutive PD-L1 expression [21]. First, to exclude the cytotoxic effects of WCC and ECC, we treated MDA-MB231 cells with these extracts for 24 h and assessed cell viability. The half-maximal inhibitory concentrations (IC50) of WCC and ECC were 123.8 and 90.08 μg/mL, respectively (Figure 1A). Accordingly, non-toxic concentrations of 25 and 50 μg/mL were chosen for subsequent experiments. After treating MDA-MB231 cells with vehicle (0.1% DMSO), WCC, or ECC for 24 h, flow cytometry was used to verify PD-L1 expression on the cell membrane. As shown in Figure 1B, the fluorescence intensity of PD-L1 decreased in a dose-dependent manner with WCC and ECC treatment. Furthermore, the expression of PD-L1 protein in MDA-MB231 cells decreased significantly in whole-cell lysates after treatment with WCC and ECC (Figure 1C). As PD-L1 in cancer cells can be upregulated by pro-inflammatory cytokines such as IFN-γ [12,22], we next examined whether WCC and ECC regulate inducible PD-L1 expression in IFN-γ-stimulated DLD-1 cells. After IFN-γ stimulation, flow cytometry showed a notable rise in PD-L1 expression in DLD-1 cells, and inducible PD-L1 expression decreased significantly with WCC and ECC treatment (Figure 1D). We also found that PD-L1 protein levels upregulated by IFN-γ were almost completely suppressed by WCC and ECC (Figure 1E). These results indicate that WCC and ECC effectively reduce constitutive or inducible PD-L1 expression in cancer cells.
3.2. Interaction Between PD-L1 and PD-1 Impairs T Cell Function
In co-culture experiments, the interaction between PD-L1 in cancer cells and PD-1 in T cells leads to T cell apoptosis and inactivation, resulting in tolerance of the cancer cells [23]. To investigate the effect of PD-L1 expression on T cell function in co-culture experiments, we used MDA-MB231 cells with high PD-L1 expression and PD-L1-deficient HEK293 cells. As shown in Figure 2A, after 24 and 48 h of co-culture with PD-1-expressing T cells, the viability of MDA-MB231 cells decreased by 25% and 42%, respectively, compared to the control. HEK-293 cells showed minimal changes in cell viability. Concurrently, NFAT activity in Jurkat cells was assessed to validate T cell functionality after co-culture. There was a 38% decrease after a 24 h of co-culture with MDA-MB231 and a 91% decrease after 48 h. Following co-culture with HEK-293 cells, there was minimal reduction in NFAT activity (Figure 2B). These findings suggest that reducing PD-L1 expression in cancer cells through WCC and ECC treatment may enhance the effectiveness of anti-cancer treatments by inhibiting the PD-1/PD-L1 immune checkpoint and maintaining T cell function. Next, we explored the effects of WCC and ECC on T cell proliferation and activity. The results showed a slight increase in cell viability at low WCC concentrations, with no cytotoxic effects observed within the experimental range (Figure 2C). NFAT activity increased by 2.3- and 1.8-fold with 25 μg/mL WCC and ECC, respectively (Figure 2D). Based on these findings, to investigate the specific effects of WCC and ECC on PD-L1 regulation in cancer cells without directly affecting T cells, cancer cells were pre-treated with WCC and ECC, which was washed out, and then the cancer cells were co-cultured with T cells.
3.3. WCC and ECC Improve T Cell-Mediated Killing of MDA-MB231 Cells and Enhance the Immune Response
PD-L1 expression in cancer cells enables them to evade the immune system. As WCC and ECC reduce PD-L1 expression in cancer cells, we examined how this decrease in PD-L1 expression affects T cell-mediated cancer cell killing and the anti-tumor immune response in co-cultures. After treating MDA-MB231 cells with WCC and ECC for 24 h, the cells were washed, and then Jurkat cells were added to the MDA-MB231 cells at a ratio of 1:5 and co-cultured for up to 48 h (Figure 3A). In the absence of Jurkat cells, WCC and ECC had minimal impact on the viability of MDA-MB231 cells. However, when co-cultured with Jurkat cells with WCC- and ECC-treated MDA-MB-231 cells, green fluorescence-labeled MDA-MB231 cells decreased, in a manner correlated with reduced PD-L1 expression (Figure 3B). Viable cells were quantified using crystal violet staining, which showed that WCC and ECC significantly improved the ability of Jurkat cells to kill MDA-MB231 cells (Figure 3C, Supplementary Figure S1). Furthermore, NFAT activity in Jurkat cells, which was reduced by MDA-MB231 cells, increased significantly with WCC and ECC in a concentration-dependent manner. Specifically, treatment with 50 μg/mL WCC and ECC increased NFAT activity by 2.2- and 1.92-fold, respectively, compared to the untreated control, and restored NFAT activity to 75–85% of the level in Jurkat cells that had not been exposed to MDA-MB231 cells (Figure 3D). ELISA assays using medium from MDA-MB231 and Jurkat cell co-cultures revealed that WCC and ECC significantly increased IL-2 levels, suggesting positive effects on T cell activity (Figure 3E). Next, Jurkat cells were counted after co-culture with MDA-MB231 cells. When co-cultured with WCC- and ECC-treated MDA-MB231 cells, Jurkat cell death was suppressed, leading to an increase in cell numbers due to reduced PD-L1 expression (Figure 3F). Collectively, our findings indicate that WCC and ECC suppress PD-L1 expression in cancer cells, thereby reducing PD-L1/PD-1 immune checkpoint-mediated immune suppression, which in turn enhances T cell-mediated cytotoxicity against cancer.
3.4. WCC and ECC Enhance the Ex Vivo Anti-Cancer Activity of Tumor Infiltrating CD8+ T Cells Against MC-38 Cells
Before testing the effects of WCC and ECC in a humanized PD-1/hPD-L1 MC-38 cancer mouse model, we confirmed their efficacy in ex vivo experiments. The viability of hPD-L1/MC-38 cells was assessed after treatment with WCC and ECC, yielding IC50 values of 187.3 and 146.2 μg/mL, respectively (Figure 4A). In immunoblotting analysis, WCC and ECC reduced PD-L1 expression in hPD-L1/MC-38 cells by nearly 90%, as expected (Figure 4B). To generate cancer-specific cytotoxic CD8+ T cells, hPD-L1/MC38 cancer cells were inoculated into hPD-1 mice and then tumor-infiltrating CD8+ T cells (CD8+ TIL) were isolated from the tumor mass (Figure 4C). In co-culture, these CD8+ TILs had approximately 23% cytotoxicity against control hPD-L1/MC38 cells, but showed significantly improved cytotoxicity of 50–70% against WCC- and ECC-treated hPD-L1/MC38 cells (Figure 4D, Supplementary Figure S2). When co-cultured with WCC- and ECC-treated hPD-L1/MC38 cells, the levels of IL-2 and GrB, which are T cell activation indicators, increased significantly in the medium (Figure 4F). A competitive PD-1/PD-L1 ELISA was conducted to verify whether WCC and ECC could inhibit the interaction between PD-1 and PD-L1. WCC and ECC efficiently inhibited the interaction between PD-1 and PD-L1 in a dose-dependent manner, mirroring the effect of the anti-PD-1 antibody used as a positive control. The inhibitory effect of WCC was slightly stronger than that of ECC, with both producing over 90% inhibition at 100 μg/mL (Figure 4G). This finding suggests that administering WCC and ECC to mice with hPD-L1/MC-38 tumors can block the PD-1/PD-L1 immune checkpoint, leading to strong anti-cancer immune responses.
3.5. WCC and ECC Suppress hPD-L1/MC-38 Tumor Growth in Humanized PD-1 Mice
To investigate the impact of WCC on in vivo tumorigenesis, we established a colorectal cancer allograft model with hPD-L1/MC-38 cells in hPD-1/C57BL/6J mice. Tumor-bearing mice were randomly divided into three groups and given either control saline or 100 or 300 mg/kg WCC orally daily for 15 days (Figure 5A). Normal mice without tumors were also given saline. During the experiment, the administration of WCC did not result in weight loss, and no abnormal behavior or movements were observed (Figure 5B). By contrast, tumor growth in mice administered WCC was consistently suppressed from day 8 until the end of the experiment, compared to control mice administered saline (Figure 5C, Supplementary Figure S3A). At the end of the experiment, a significant reduction in hPD-L1/MC-38 tumor growth was seen with WCC administration, resulting in tumor suppression rates of 73.03% and 68.48% at doses of 100 and 300 mg/kg, respectively (Figure 5D). The tumor-suppressive effects of WCC were further demonstrated by comparing tumor weight (Figure 5E) and observing tumors ex vivo (Supplementary Figure S3B). To investigate tumor suppression mechanisms and T cell activity in anti-cancer responses after WCC administration, mouse serum was collected and the IL-2 and GrB levels were determined. The IL-2 and GrB levels in mice given WCC were approximately three and two times higher, respectively, than those in saline-treated control mice (Figure 6A and 6B). In histochemical analysis, there was a notable increase in the infiltration of CD8+ T cells into hPD-L1/MC-38 tumors in mice treated with WCC. The presence of GrB was also significantly higher in the tumor tissues of these mice (Figure 6C–E, Supplementary Figure S4). Overall, our results suggest that WCC exhibits potent anti-cancer effects by lowering the PD-L1 level of tumors, which in turn suppressed the PD-1/PD-L1 interaction and boosts the effectiveness of anti-cancer CD8+ T cells.
3.6. Chlorogenic Acid Reduces PD-L1 Expression and Enhances T Cell-Mediated Anti-Tumor Activity
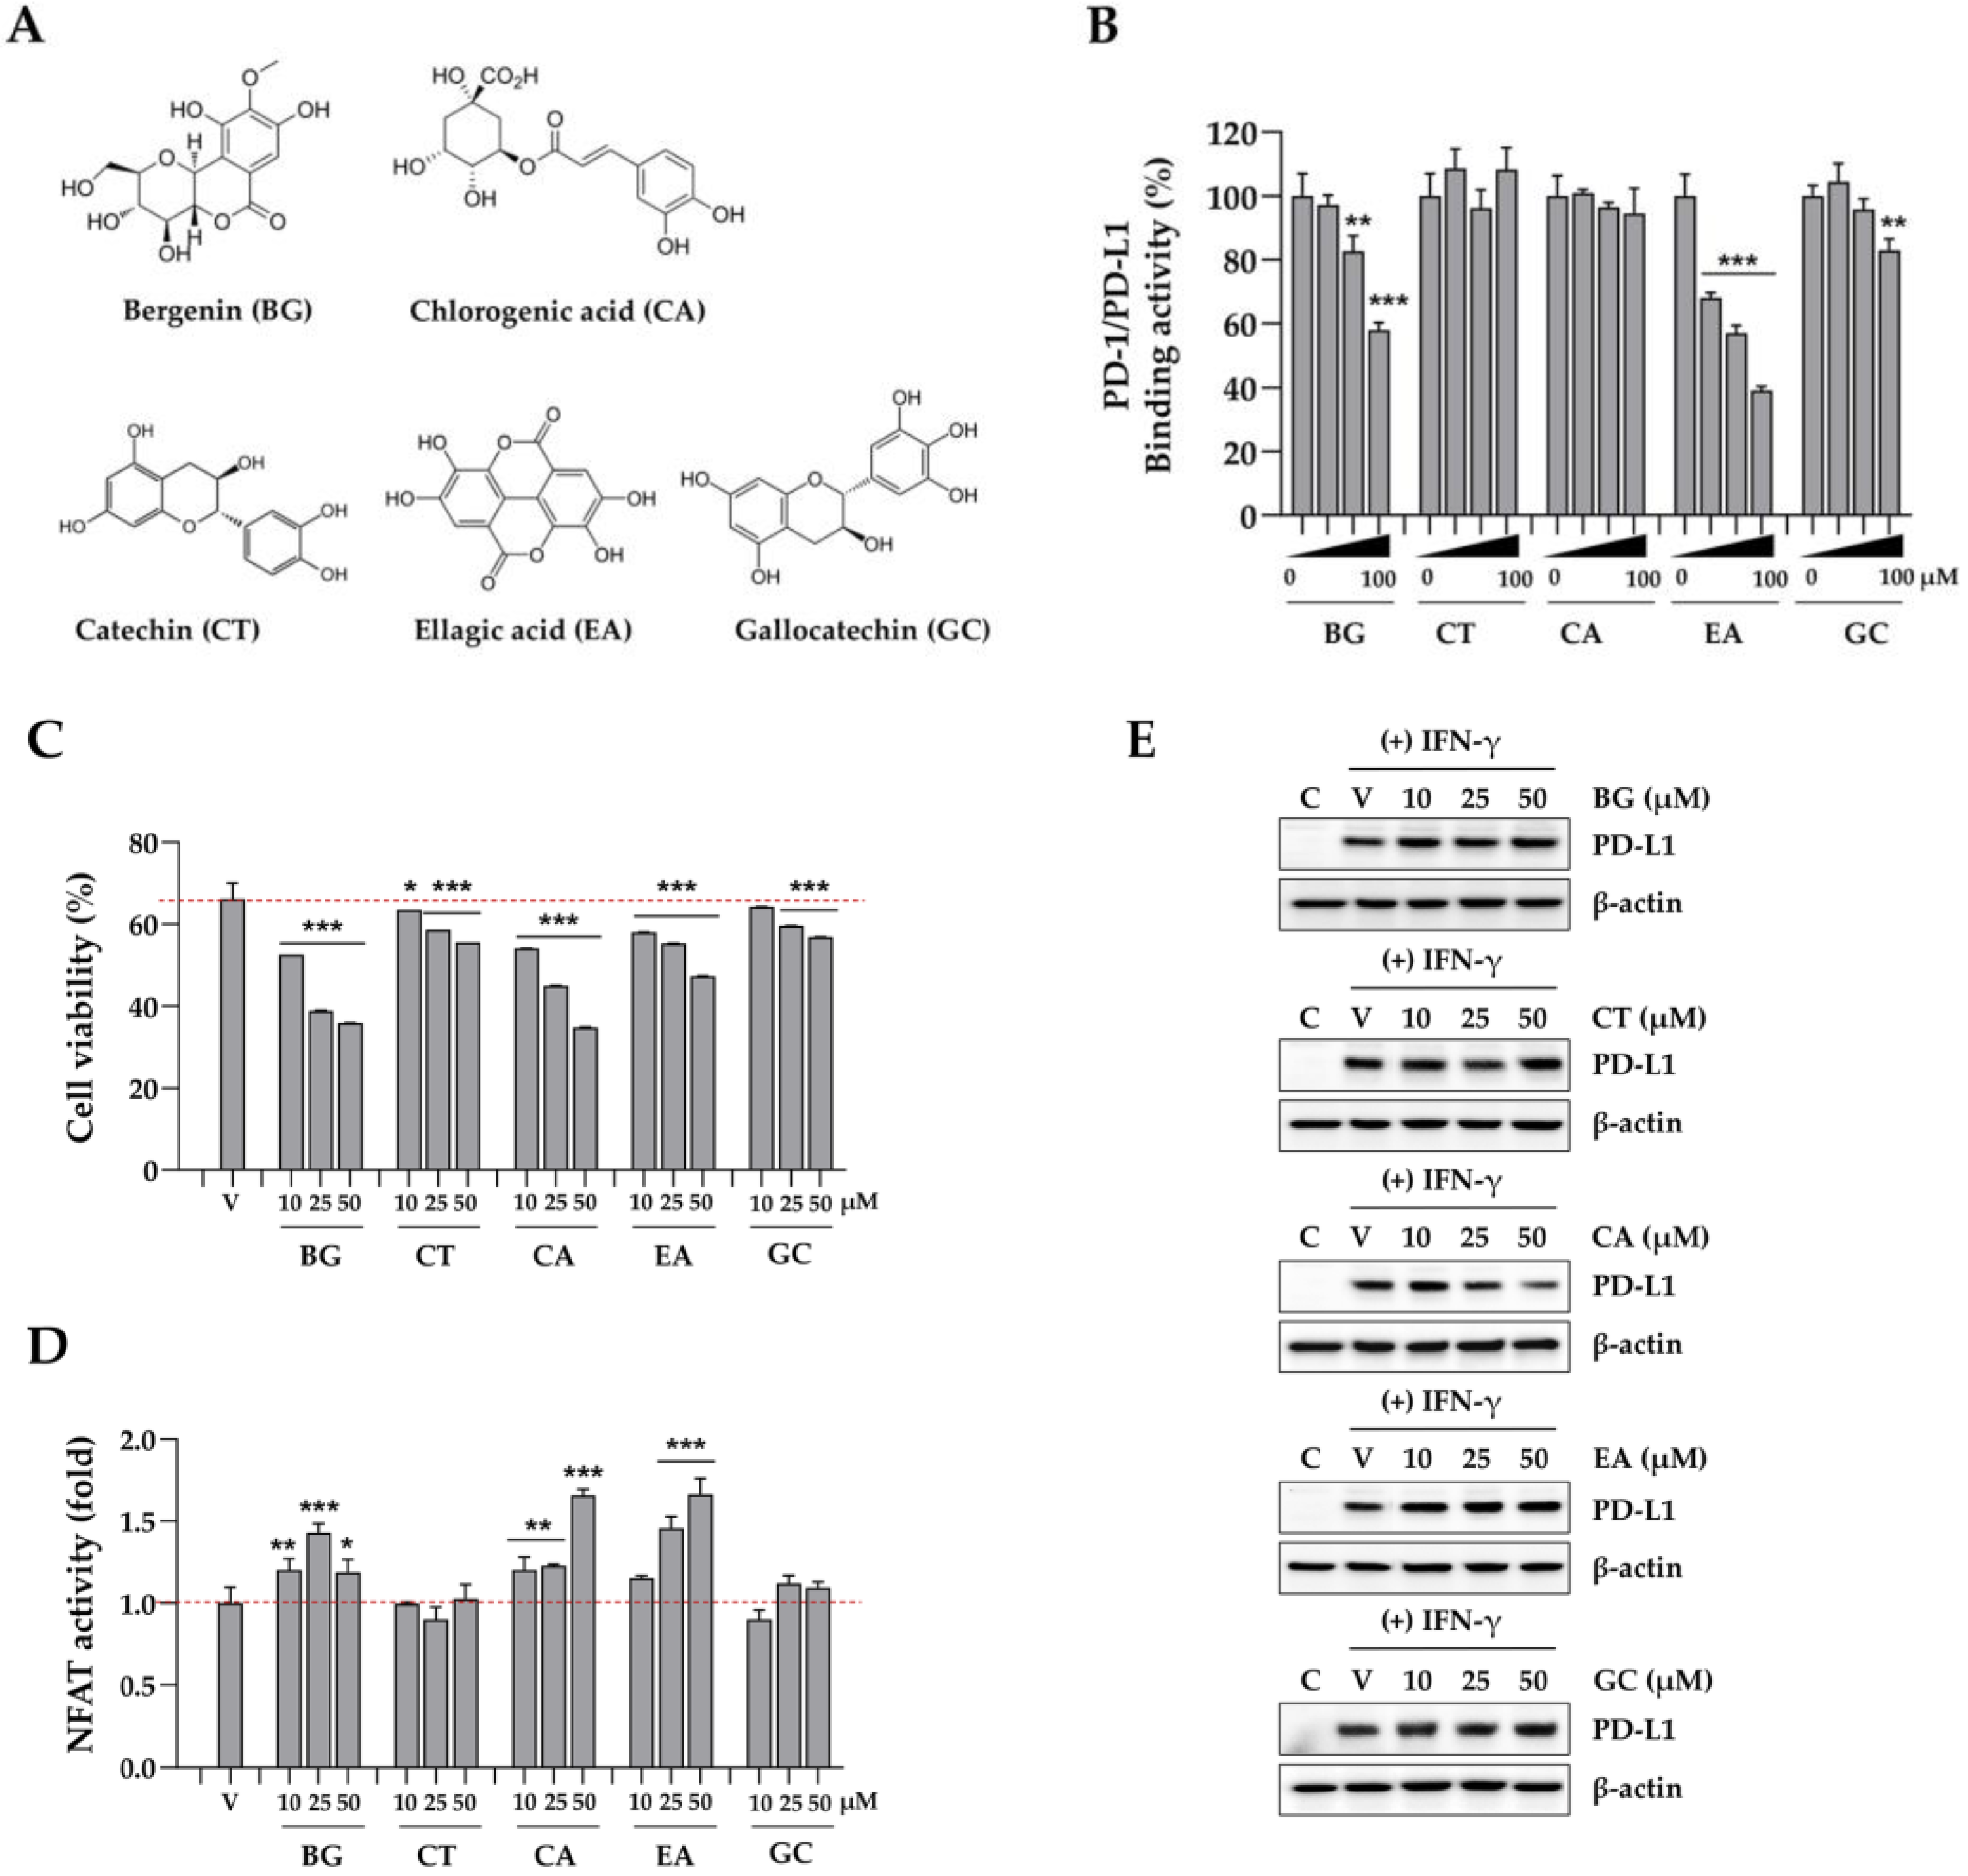
To identify the active constituents acting as PD-1/PD-L1 ICIs in CC extract, five components were analyzed: bergenin (BG), catechin (CA), chlorogenic acid (CA), ellagic acid (EA), and gallocatechin (GC) (Figure 7A). In a competitive ELISA examining PD-1/PD-L1 binding, BG and EA efficiently blocked the interaction between PD-1 and PD-L1 in a dose-dependent manner, whereas CT, CA, and GC did not (Figure 7B). After testing their cytotoxicity toward MDA-MB231 cells, no cytotoxicity was found for BG, CT, CA, or GC up to 100 μM. However, EA decreased cell viability by approximately 15% at 100 μM (Supplementary Figure S5A). Based on this result, MDA-MB231 cells and Jurkat cells were co-cultured at a maximum EA concentration of 50 μM. After co-culture with Jurkat cells, the surviving MDA-MB-231 cells were stained with crystal violet and quantified. Viability decreased in a concentration-dependent manner with BG, CA, and EA, whereas CT and GC had minimal effects at 50 µM (Figure 7C, Supplementary Figure S5B). In addition, NFAT activity in Jurkat cells co-cultured with BG-, CA-, and EA-treated MDA-MB-231 cells exceeded that in vehicle-treated cells (Figure 7D). To evaluate PD-L1 expression, DLD-1 cells were pretreated for 24 h and stimulated with IFN-γ. CA significantly reduced PD-L1 expression in a concentration-dependent manner, whereas the other treatments had no effect (Figure 7E). These results indicate that BG and EA enhance anti-cancer activity by inhibiting PD-1 binding to PD-L1, whereas CA regulates PD-L1 expression as an ICI.
4. Discussion
ICIs play a pivotal role in the management of malignant tumors, augmenting therapeutic strategies and enhancing cancer patient survival rates [24]. The PD-1/PD-L1 signaling pathway is an important target in the therapeutic management of various malignancies, as PD-L1 is expressed across a diverse range of tumor types and in immune cells present within the tumor microenvironment. Blockade of the PD-1/PD-L1 interaction facilitates the targeting of cancer cells by cytotoxic T lymphocytes. The inhibition of this interaction can result in significant antitumor responses [1,2,23]. The regulation of PD-L1 expression has emerged as a critical factor in ICI therapy, as its levels are correlated with patient responsiveness, making it an effective predictive biomarker [4,8]. Elevated PD-L1 expression frequently signifies a more immunosuppressive microenvironment, which may increase susceptibility to immune checkpoint blockade. Current research is focused on elucidating the regulatory pathways governing PD-L1 expression, which are influenced by oncogenic signaling, inflammatory cytokines, genetic alterations, and epigenetic modifications. Furthermore, strategies aimed at modulating PD-L1 expression, as well as combination therapies that target PD-L1 and other immune checkpoints, are under investigation to enhance the efficacy of ICIs and expand patient eligibility.
To assess the efficacy of an ICI, it is crucial to distinguish its therapeutic effects from cytotoxic effects exerted on cancer cells. For example, berberine has been shown to exhibit anti-cancer properties via mechanisms such as the inhibition of cell proliferation, induction of cell cycle arrest, and promotion of either apoptosis or autophagy across various cancer types [23,24]. Notably, at concentrations that do not elicit cytotoxic effects in cancer cells, berberine enhances the sensitivity of these cells to co-cultured T cells by downregulating PD-L1 expression on their surface [14]. Furthermore, berberine showed antitumor effects in Lewis tumor xenograft models by augmenting the immune response of tumor-infiltrating cells [27].
Previously, we demonstrated that extracts of Salvia plebeia, Oenothera biennis, and Korean red ginseng inhibit the binding of PD-1 to PD-L1, thereby showing significant anticancer effects in humanized PD-1/PD-L1 knock-in mouse models of colorectal cancer [28,29,30]. Furthermore, we validated the synergistic anticancer effects of combination therapy with established colorectal cancer treatments, such as oxaliplatin and pembrolizumab, combined with herbal extracts, such as unripe Rubus coreanus and Sanguisorba radix [31,32]. Our recent study showed that cosmosiin, a natural flavone glycoside, enhances T cell antitumor activity and induces apoptosis in cancer cells by inhibiting inducible PD-L1 expression, indicating its potential as an ICI [12].
In this study, we investigated the potential of CC extract as an ICI to enhance anticancer immunity and induce apoptosis in cancer cells. We showed that both WCC and ECC significantly reduced the expression of both constitutive and inducible PD-L1 at non-toxic concentrations (Figure 1). When administered to T cells, these extracts effectively enhanced immune activity by increasing NFAT activity. In co-culture experiments involving PD-L1-expressing cancer cells and PD-1-expressing Jurkat T cells, approximately 50% of the Jurkat T cells were eliminated due to interactions between PD-1 and PD-L1. However, pretreating cancer cells with WCC and ECC to inhibit PD-L1 expression resulted in increased T cell activity and survival rates, while also promoting cancer cell death (Figure 3). Before evaluating their efficacy in a humanized PD-1/PD-L1 MC-38 mouse model of colon cancer, we assessed these extracts in ex vivo co-culture with hPD-L1/MC-38 cells and tumor-infiltrating CD8+ TILs. As expected, both WCC and ECC nearly completely downregulated PD-L1 levels in hPD-L1/MC-38 cells. Co-culture with CD8+ TILs resulted in a two- to threefold reduction in the viability of hPD-L1/MC-38 cells, while significantly enhancing T cell activity and cytotoxicity (Figure 4). These findings strongly suggest that CC extract can decrease PD-L1 expression in multiple cancer types, augmenting anticancer immune responses. In a mouse model of colon cancer with human PD-1 and PD-L1, WCC administration reduced tumor growth by approximately 70% and elevated intra-tumor CD8+ T cells, IL-2, and GrB (Figure 5 and 6). Our analysis of CC extract components revealed that both BG and EA elicit anticancer immune responses by inhibiting the interaction between PD-1 and PD-L1 (Figure 7). These findings are consistent with those of Kim et al., who identified EA as a potent constituent of black raspberries, demonstrating its effectiveness in immune checkpoint blockade via the inhibition of the PD-1/PD-L1 interaction [33]. Notably, although EA decreased PD-L1 expression in the UM-UL3 and T24 cell lines [34], it did not affect the reduction of IFN-γ-induced PD-L1 expression in our study. By contrast, CA has been shown to inhibit IFN-γ-induced PD-L1 expression via the p-STAT1-IRF1 signaling pathway, thereby enhancing T cell activity and exhibiting a significant antitumor effect, as well as a synergistic effect when administered with anti-PD-1 antibodies [35]. In this study, we also observed that CA effectively reduced PD-L1 expression and increased both cancer cell apoptosis and T cell activity in co-cultures with cancer cells. Therefore, these components function as PD-1/PD-L1 ICIs via multiple mechanisms, enhancing the overall anticancer immune efficacy of CC extract.
5. Conclusions
This study presents the first evidence that CC extract functions as an ICI by downregulating the expression of PD-L1 in cancer cells. CC also exhibited substantial anticancer efficacy in a humanized mouse model of colon cancer. Future research should validate the synergistic anticancer effects of CC extract when administered in combination with existing colon cancer therapies. We intend to thoroughly investigate the anticancer mechanisms within the tumor microenvironment, which will involve a detailed analysis of intra-tumor cell populations using single-cell next-generation sequencing techniques.
Supplementary Materials
The following supporting information can be downloaded at the website of this paper posted on Preprints.org, Figure S1: Effects of WCC and ECC on cancer cells in the co-culture condition with T cells; Figure S2: Effects of WCC and ECC on anti-cancer activity of CD8+TIL cell in an ex vivo co-culture condition; Figure S3: Inhibitory effects of WCC administration on hPD-L1/MC-38 tumor growth in humanized PD-1 mice; Figure S4: Effects of WCC administration on the tumor infiltrated T cell activity; Figure S5: Effects of compounds in CC extract on anti-cancer activity under co-culture conditions with T cells.
Author Contributions
Conceptualization, A.K. and H.-S.C.; methodology, A.K., E.-J.L. and H.-S.C.; histological analysis, A.K. and J.H.H.; writing—original draft preparation, A.K.; writing—review and editing, A.K. and H.-S.C.; funding acquisition, H.-S.C. All authors have read and agreed to the published version of the manuscript.
Funding
This work was also supported by the grant KSN2411013 and KSN1823231 awarded to the Korea Institute of Oriental Medicine (KIOM) and provided by National Research Foundation of Korea grants funded by the Korean Government (NRF-2022R1A2C2092834).
Institutional Review Board Statement
The experiments conducted followed the guidelines of the Institutional Animal Care and Use Committee (IACUC) at the Korea Institute of Oriental Medicine (KIOM) and were authorized by the KIOM IACUC under approval number KIOM-D-21-091 (date of approval, October 27, 2021).
Informed Consent Statement
Not applicable.
Data Availability Statement
The data used to support the findings of this study are included within this article.
Conflicts of Interest
The authors declare no conflicts of interest.
References
- Beatty, G.L.; Gladney, W.L. Immune escape mechanisms as a guide for cancer immunotherapy. Clin Cancer Res 2015, 21, 687–692. [Google Scholar] [CrossRef] [PubMed]
- Jiang, X.; Wang, J.; Deng, X.; Xiong, F.; Ge, J.; Xiang, B.; Wu, X.; Ma, J.; Zhou, M.; Li, X. , et al. Role of the tumor microenvironment in PD-L1/PD-1-mediated tumor immune escape. Mol Cancer 2019, 18, 10. [Google Scholar] [CrossRef]
- He, X.; Xu, C. Immune checkpoint signaling and cancer immunotherapy. Cell Res 2020, 30, 660–669. [Google Scholar] [CrossRef] [PubMed]
- Tang, Q.; Chen, Y.; Li, X.; Long, S.; Shi, Y.; Yu, Y.; Wu, W.; Han, L.; Wang, S. The role of PD-1/PD-L1 and application of immune-checkpoint inhibitors in human cancers. Front Immunol 2022, 13, 964442. [Google Scholar] [CrossRef]
- Sharma, P.; Goswami, S.; Raychaudhuri, D.; Siddiqui, B.A.; Singh, P.; Nagarajan, A.; Liu, J.; Subudhi, S.K.; Poon, C.; Gant, K.L. , et al. Immune checkpoint therapy-current perspectives and future directions. Cell 2023, 186, 1652–1669. [Google Scholar] [CrossRef]
- Morad, G.; Helmink, B.A.; Sharma, P.; Wargo, J.A. Hallmarks of response, resistance, and toxicity to immune checkpoint blockade. Cell 2021, 184, 5309–5337. [Google Scholar] [CrossRef]
- Yamaguchi, H.; Hsu, J.M.; Yang, W.H.; Hung, M.C. Mechanisms regulating PD-L1 expression in cancers and associated opportunities for novel small-molecule therapeutics. Nat Rev Clin Oncol 2022, 19, 287–305. [Google Scholar] [CrossRef]
- Stovgaard, E.S.; Dyhl-Polk, A.; Roslind, A.; Balslev, E.; Nielsen, D. PD-L1 expression in breast cancer: expression in subtypes and prognostic significance: a systematic review. Breast Cancer Res Treat 2019, 174, 571–584. [Google Scholar] [CrossRef]
- Matikas, A.; Zerdes, I.; Lovrot, J.; Richard, F.; Sotiriou, C.; Bergh, J.; Valachis, A.; Foukakis, T. Prognostic Implications of PD-L1 Expression in Breast Cancer: Systematic Review and Meta-analysis of Immunohistochemistry and Pooled Analysis of Transcriptomic Data. Clin Cancer Res 2019, 25, 5717–5726. [Google Scholar] [CrossRef]
- Ding, P.; Ma, Z.; Fan, Y.; Feng, Y.; Shao, C.; Pan, M.; Zhang, Y.; Huang, D.; Han, J.; Hu, Y. , et al. Emerging role of ubiquitination/deubiquitination modification of PD-1/PD-L1 in cancer immunotherapy. Genes Dis 2023, 10, 848–863. [Google Scholar] [CrossRef] [PubMed]
- Coombs, M.R.P.; Harrison, M.E.; Hoskin, D.W. Apigenin inhibits the inducible expression of programmed death ligand 1 by human and mouse mammary carcinoma cells. Cancer Lett 2016, 380, 424–433. [Google Scholar] [CrossRef] [PubMed]
- Han, J.H.; Lee, E.J.; Park, W.; Choi, J.G.; Ha, K.T.; Chung, H.S. Cosmosiin Induces Apoptosis in Colorectal Cancer by Inhibiting PD-L1 Expression and Inducing ROS. Antioxidants (Basel) 2023, 12. [Google Scholar] [CrossRef] [PubMed]
- Jiang, Z.B.; Wang, W.J.; Xu, C.; Xie, Y.J.; Wang, X.R.; Zhang, Y.Z.; Huang, J.M.; Huang, M.; Xie, C.; Liu, P. , et al. Luteolin and its derivative apigenin suppress the inducible PD-L1 expression to improve anti-tumor immunity in KRAS-mutant lung cancer. Cancer Lett 2021, 515, 36–48. [Google Scholar] [CrossRef] [PubMed]
- Liu, Y.; Liu, X.; Zhang, N.; Yin, M.; Dong, J.; Zeng, Q.; Mao, G.; Song, D.; Liu, L.; Deng, H. Berberine diminishes cancer cell PD-L1 expression and facilitates antitumor immunity via inhibiting the deubiquitination activity of CSN5. Acta Pharm Sin B 2020, 10, 2299–2312. [Google Scholar] [CrossRef]
- Batiha, G.E.; Alkazmi, L.M.; Wasef, L.G.; Beshbishy, A.M.; Nadwa, E.H.; Rashwan, E.K. Syzygium aromaticum L. (Myrtaceae): Traditional Uses, Bioactive Chemical Constituents, Pharmacological and Toxicological Activities. Biomolecules 2020, 10. [CrossRef]
- Pandey, V.K.; Srivastava, S. ; Ashish; Dash, K. K.; Singh, R.; Dar, A.H.; Singh, T.; Farooqui, A.; Shaikh, A.M.; Kovacs, B. Bioactive properties of clove (Syzygium aromaticum) essential oil nanoemulsion: A comprehensive review. Heliyon 2024, 10, e22437. [Google Scholar] [CrossRef]
- Taher, Y.A.; Samud, A.M.; El-Taher, F.E.; ben-Hussin, G.; Elmezogi, J.S.; Al-Mehdawi, B.F.; Salem, H.A. Experimental evaluation of anti-inflammatory, antinociceptive and antipyretic activities of clove oil in mice. Libyan J Med 2015, 10, 28685. [Google Scholar] [CrossRef] [PubMed]
- Afrendi, E.; Prastya, M.E.; Astuti, R.I.; Wahyuni, W.T.; Batubara, I. Bioactivity of the Ethanol Extract of Clove (Syzygium aromaticum) as Antitoxin. Int J Food Sci 2023, 3245210. [Google Scholar] [CrossRef] [PubMed]
- Song, C.M.; Shin, S.H. ; Jung, H,A.; Lee, J.K.; Cao, L.H.; Kang, D.G.; Lee, H.S. Study on the mechanism of vasscular relaxation induced by cortex Caryphylli. J Physiol & Pathol Korean Med 2006, 20(5), 1166-1173.
- Aisha, A.F.A.; Abu-Salah, K.M.; Alkokayan, S.A.; Siddiqui, M.J.; Ismail, Z.; Majid, A. Syzygium aromaticum extracts as good source of betulinic acid and potential anti-breast cancer. Rev Bras Farmacogn 2012, 22(2), 335–343. [Google Scholar] [CrossRef]
- Lotfinejad, P.; Kazemi, T.; Safaei, S.; Amini, M.; Roshani Asl, E.; Baghbani, E.; Sandoghchian Shotorbani, S.; Jadidi Niaragh, F.; Derakhshani, A.; Abdoli Shadbad, M. , et al. PD-L1 silencing inhibits triple-negative breast cancer development and upregulates T-cell-induced pro-inflammatory cytokines. Biomed Pharmacother 2021, 138, 111436. [Google Scholar] [CrossRef]
- Mimura, K.; Teh, J.L.; Okayama, H.; Shiraishi, K.; Kua, L.F.; Koh, V.; Smoot, D.T.; Ashktorab, H.; Oike, T.; Suzuki, Y. , et al. PD-L1 expression is mainly regulated by interferon gamma associated with JAK-STAT pathway in gastric cancer. Cancer Sci 2018, 109, 43–53. [Google Scholar] [CrossRef]
- Black, M.; Barsoum, I.B.; Truesdell, P.; Cotechini, T.; Macdonald-Goodfellow, S.K.; Petroff, M.; Siemens, D.R.; Koti, M.; Craig, A.W.; Graham, C.H. Activation of the PD-1/PD-L1 immune checkpoint confers tumor cell chemoresistance associated with increased metastasis. Oncotarget 2016, 7, 10557–10567. [Google Scholar] [CrossRef] [PubMed]
- Bagchi, S.; Yuan, R.; Engleman, E.G. Immune Checkpoint Inhibitors for the Treatment of Cancer: Clinical Impact and Mechanisms of Response and Resistance. Annu Rev Pathol 2021, 16, 223–249. [Google Scholar] [CrossRef]
- Zhu, Y.; Xie, N.; Chai, Y.; Nie, Y.; Liu, K.; Liu, Y.; Yang, Y.; Su, J.; Zhang, C. Apoptosis Induction, a Sharp Edge of Berberine to Exert Anti-Cancer Effects, Focus on Breast, Lung, and Liver Cancer. Front Pharmacol 2022, 13, 803717. [Google Scholar] [CrossRef] [PubMed]
- Goel, A. Current understanding and future prospects on Berberine for anticancer therapy. Chem Biol Drug Des 2023, 102, 177–200. [Google Scholar] [CrossRef] [PubMed]
- Xu, L. Identification of Autophagy-Related Targets of Berberine against Non-Small Cell Lung Cancer and Their Correlation with Immune Cell Infiltration By Combining Network Pharmacology, Molecular Docking, and Experimental Verification. Crit Rev Immunol 2023, 43, 27–47. [Google Scholar] [CrossRef] [PubMed]
- Choi, J.G.; Kim, Y.S.; Kim, J.H.; Kim, T.I.; Li, W.; Oh, T.W.; Jeon, C.H.; Kim, S.J.; Chung, H.S. Anticancer Effect of Salvia plebeia and Its Active Compound by Improving T-Cell Activity via Blockade of PD-1/PD-L1 Interaction in Humanized PD-1 Mouse Model. Front Immunol 2020, 11, 598556. [Google Scholar] [CrossRef] [PubMed]
- Lee, E.J.; Kim, Y.S.; Kim, J.H.; Woo, K.W.; Park, Y.H.; Ha, J.H.; Li, W.; Kim, T.I.; An, B.K.; Cho, H.W. , et al. Uncovering the colorectal cancer immunotherapeutic potential: Evening primrose (Oenothera biennis) root extract and its active compound oenothein B targeting the PD-1/PD-L1 blockade. Phytomedicine 2024, 125, 155370. [Google Scholar] [CrossRef]
- Lee, E.J.; Yang, J.H.; Yang, H.J.; Cho, C.K.; Choi, J.G.; Chung, H.S. Antitumor Effect of Korean Red Ginseng through Blockade of PD-1/PD-L1 Interaction in a Humanized PD-L1 Knock-In MC38 Cancer Mouse Model. Int J Mol Sci 2023, 24. [Google Scholar] [CrossRef]
- Lee, E.J.; Yang, J.H.; Choi, J.G.; Chung, H.S. Augmented Antitumor Effect of Unripe Rubus coreanus Miquel Combined with Oxaliplatin in a Humanized PD-1/PD-L1 Knock-In Colorectal Cancer Mouse Model. Cells 2022, 11. [Google Scholar] [CrossRef] [PubMed]
- Lee, E.J.; Kim, J.H.; Kim, T.I.; Kim, Y.J.; Pak, M.E.; Jeon, C.H.; Park, Y.J.; Li, W.; Kim, Y.S.; Choi, J.G. , et al. Sanguisorbae Radix Suppresses Colorectal Tumor Growth Through PD-1/PD-L1 Blockade and Synergistic Effect With Pembrolizumab in a Humanized PD-L1-Expressing Colorectal Cancer Mouse Model. Front Immunol 2021, 12, 737076. [Google Scholar] [CrossRef]
- Kim, J.H.; Kim, Y.S.; Kim, T.I.; Li, W.; Mun, J.G.; Jeon, H.D.; Kee, J.Y.; Choi, J.G.; Chung, H.S. Unripe Black Raspberry (Rubus coreanus Miquel) Extract and Its Constitute, Ellagic Acid Induces T Cell Activation and Antitumor Immunity by Blocking PD-1/PD-L1 Interaction. Foods 2020, 9. [Google Scholar] [CrossRef]
- Ceci, C.; Tentori, L.; Atzori, M.G.; Lacal, P.M.; Bonanno, E.; Scimeca, M.; Cicconi, R.; Mattei, M.; de Martino, M.G.; Vespasiani, G. , et al. Ellagic Acid Inhibits Bladder Cancer Invasiveness and In Vivo Tumor Growth. Nutrients 2016, 8. [Google Scholar] [CrossRef]
- Li, R.; Zhan, Y.; Ding, X.; Cui, J.; Han, Y.; Zhang, J.; Zhang, J.; Li, W.; Wang, L.; Jiang, J. Cancer Differentiation Inducer Chlorogenic Acid Suppresses PD-L1 Expression and Boosts Antitumor Immunity of PD-1 Antibody. Int J Biol Sci 2024, 20, 61–77. [Google Scholar] [CrossRef] [PubMed]
Figure 1.
Effects of WCC and ECC on the PD-L1 expression in cancer cells. (A) MDA-MB231 cells were treated with the increasing concentrations of WCC and ECC. After 24 h, relative cell viability compared with vehicle-treated control cells was calculated and presented as the means ± SEM (n = 3). (B) MDA-MB231 cells were treated with 25 and 50 μg/mL of WCC and ECC for 24 h, and then the levels of membrane PD-L1 were detected by flow cytometry. Relative fluorescence intensity compared to vehicle-treated control cells was shown as the means ± SEM (n = 3). (C) After treatment with 25 and 50 μg/mL of WCC and ECC for 24 h, PD-L1 expression in MDA-MB231 cells was analyzed by immunoblotting. Relative band intensities after normalization to β-actin expression were presented as the means ± SEM (n = 3). (D) DLD-1 cells were pretreated with 25 and 50 μg/mL of WCC and ECC for 6 h, and then stimulated with 20 ng/mL IFN-γ for 24 h. Membrane PD-L1 was detected by flow cytometry and relative intensity compared to IFN-γ/vehicle-treated cells was shown as the means ± SEM (n = 6). (E) DLD-1 cells pretreated with WCC and ECC were stimulated with IFN-γ for 40 h. Whole cell lysates were analyzed for the PD-L1 expression by immunoblotting. ###p< 0.001 vs. isotype control, *p< 0.05, **p< 0.01, ***p< 0.001 vs. vehicle-treated cells.
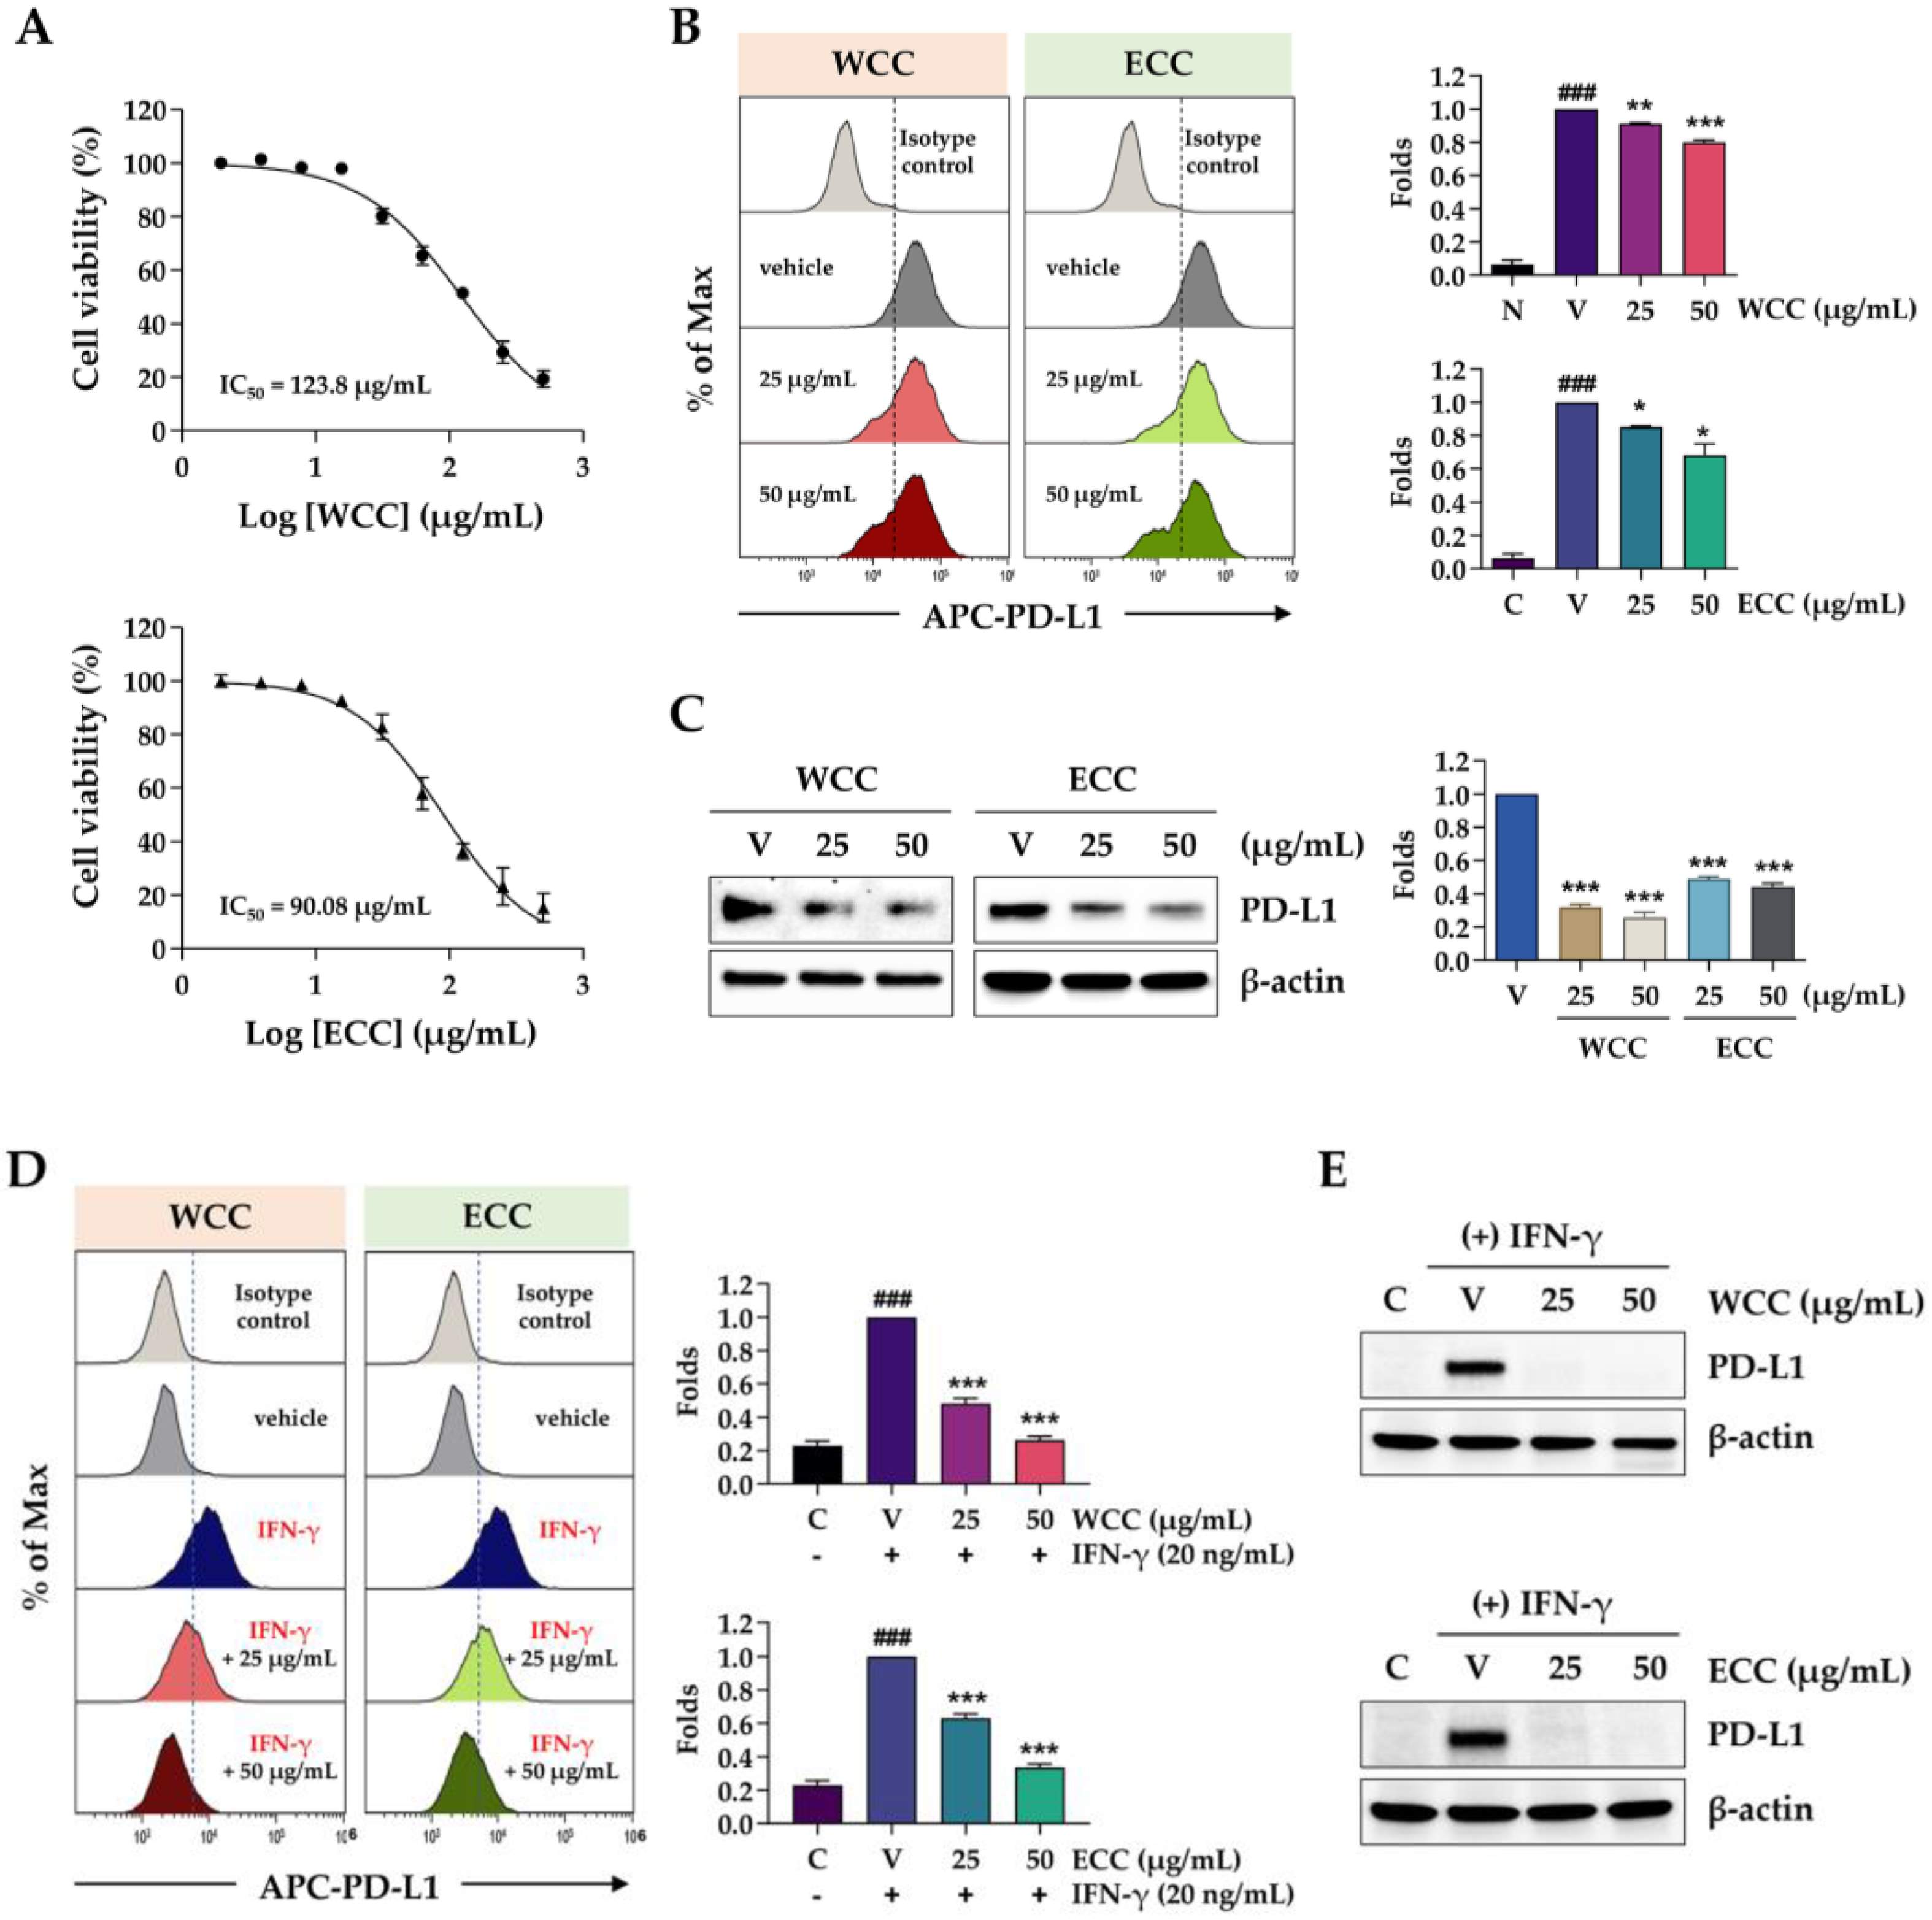
Figure 2.
Effects of PD-1/PD-L1 interaction on the cell viability of cancer cells and the NFAT activity of T cells. (A) MDA-MB231 and HEK-293 cells were seeded on culture plates, incubated overnight, and then co-cultured with NFAT/PD-1/Jurkat T (Jurkat) cells at a ratio of 1:10. After 24 and 48 h, Jurkat cells were removed, and the remaining MDA-MB231 and HEK-293 cells were stained with crystal violet solution. Viable cells were observed under a microscope and quantified. ***p< 0.001 vs. w/o Jurkat cells. (B) After co-culturing with MDA-MB231 and HEK-293 cells for 24 h, NFAT activity in Jurkat cells was assessed. ***p< 0.001 vs. w/o MDA-MB231 cells. (C) Jurkat cells were treated with the indicated concentrations of WCC and ECC for 24 h, and then the cell viability was measured using a CCK assay. (D) After treating Jurkat cells with WCC and ECC for 24 h, NFAT activity was determined. Data in each experiment are presented as the means ± SEM (n = 3). *p< 0.05, **p< 0.01, ***p< 0.001 vs. vehicle-treated cells.
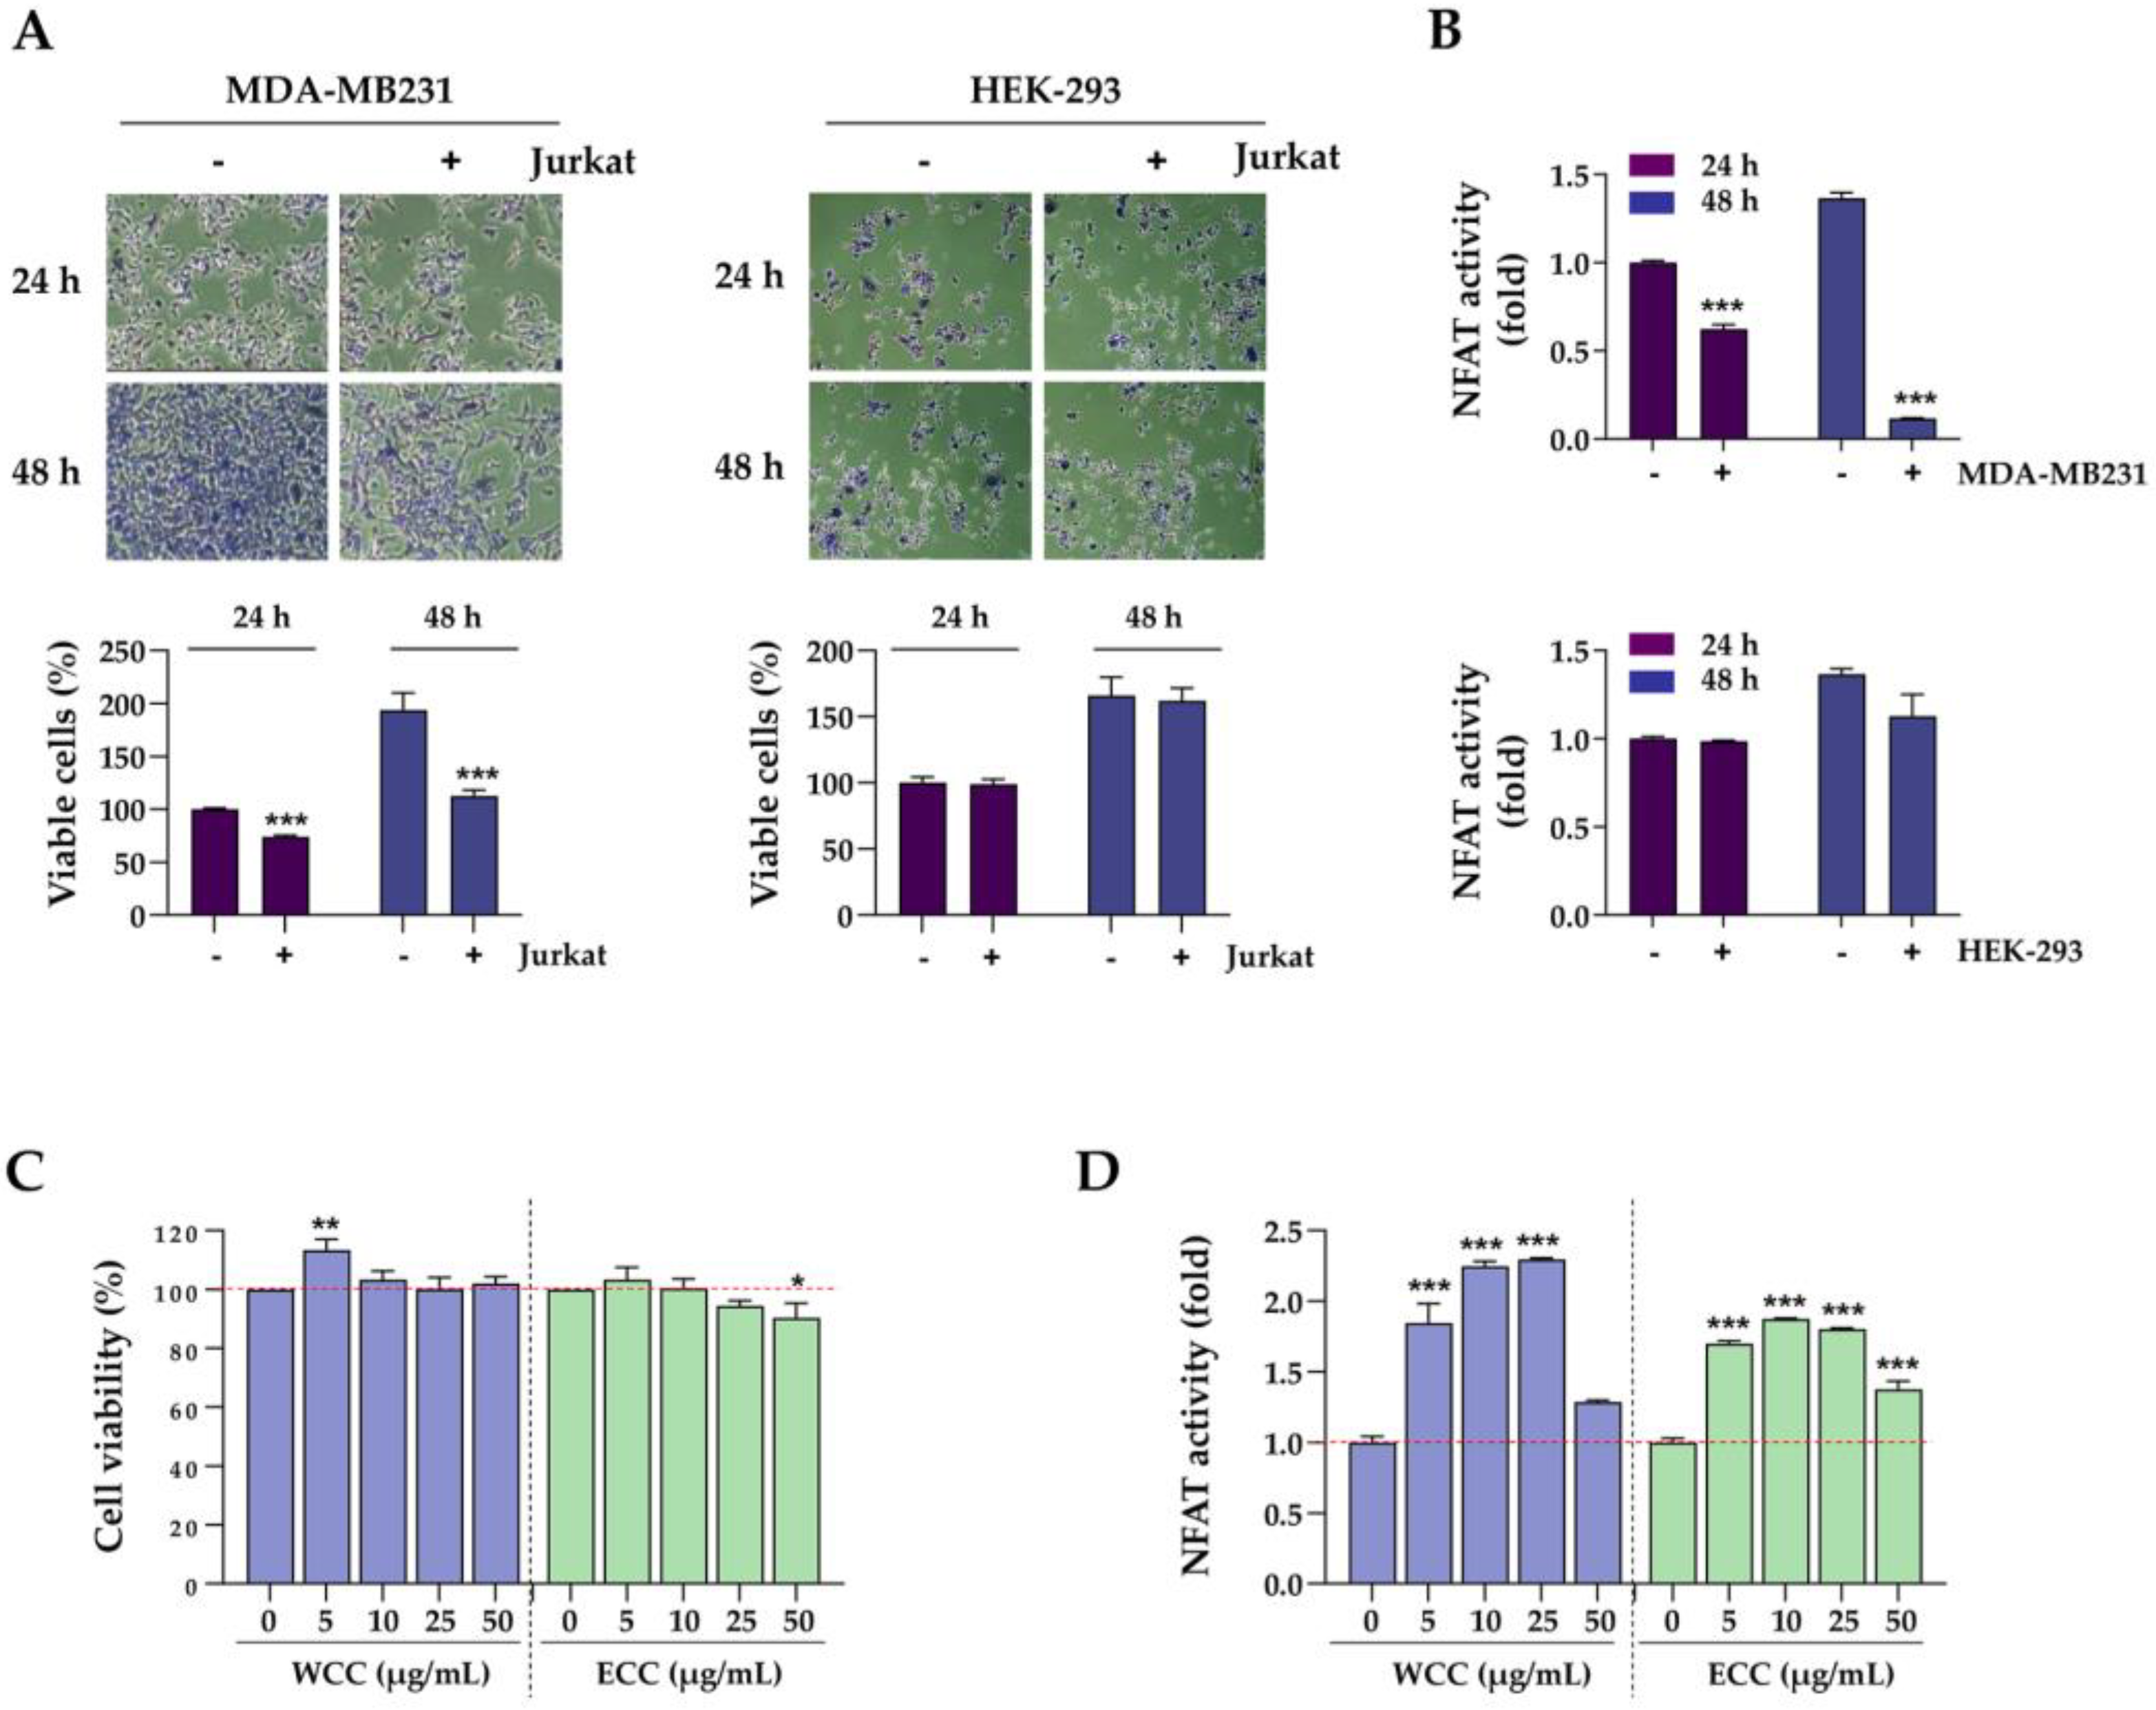
Figure 3.
Effects of WCC and ECC on the cancer cells and T cells in the co-culture condition. (A) Experimental scheme of cancer cells and T cell co-culture. (B) MDA-MB231 cells labeled with green dye were treated with WCC and ECC for 24 h, then co-cultured with or without Jurkat cells for another 24 h. Subsequently, the Jurkat cells were removed, and the remaining cancer cells were examined under a fluorescence microscope. (C) After co-culture, the remaining cancer cells were stained with crystal violet solution and quantified. (D) After co-culture, the NFAT activity of Jurkat cells were measured. (E) IL-2 levels in culture supernatants were determined using IL-2 ELISA. (F) After co-culture, Jurkat cells were harvested, and the number of viable cells was counted. Data are presented as the means ± SEM (n = 3). ###p< 0.001 vs. control cells, *p< 0.05, **p< 0.01, ***p< 0.001 vs. vehicle-treated cells.
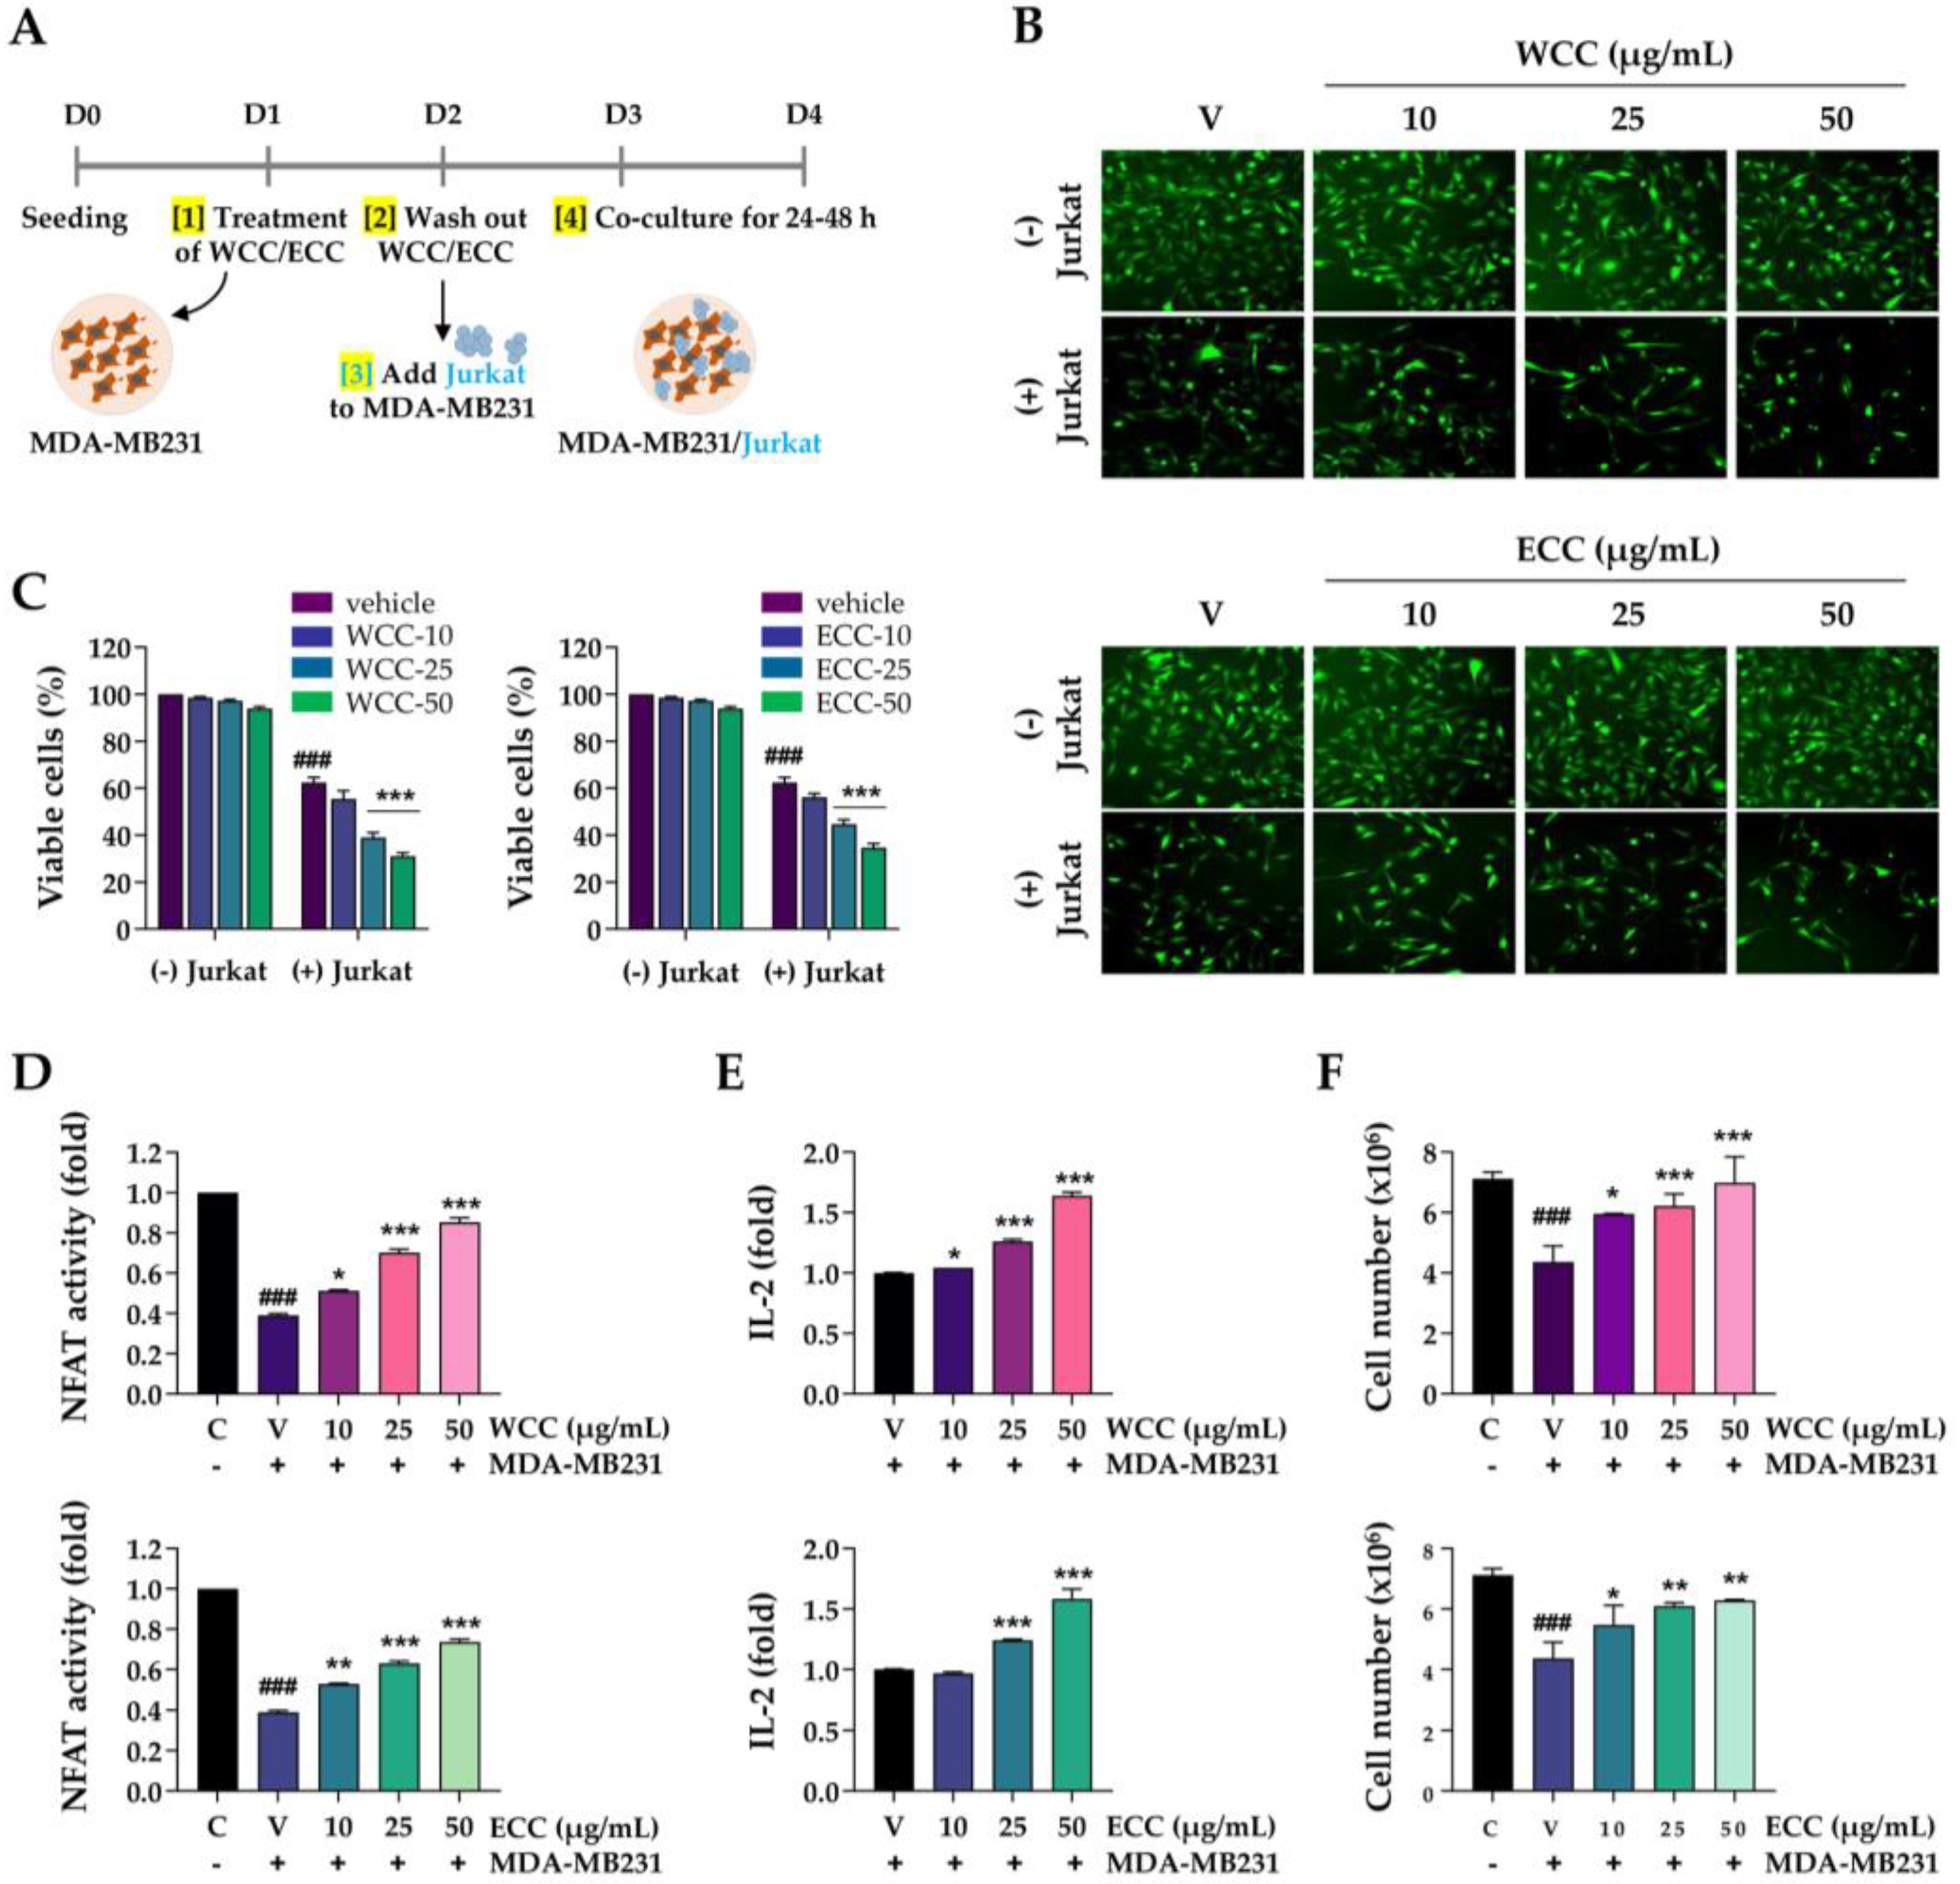
Figure 4.
Effects of WCC and ECC on anti-cancer activity of tumor-specific CD8+ T cells in a co-culture setting. (A) After treating hPD-L1/MC-38 cells with WCC and ECC for 24 h, cell viability was examined by CCK assay. (B) The levels of PD-L1 protein in hPD-L1/MC-38 cells treated with WCC and ECC were assessed using western blotting. Relative values were calculated after normalizing to β-actin. (C) Experimental design of co-culture with hPD-L1/MC38 cells and CD8+ TIL cells. (D) After co-culturing with CD8+ TILs, the viability of the remaining cancer cells was assessed. (E-F) After co-culture, IL-2 (E) and granzyme B (GrB) (F) levels in culture supernatants were measured using ELISA. (G) PD-1/PD-L1 binding activity in the presence or absence of WCC and ECC was determined by competitive ELISA. Anti-PD-1 antibody was used as a positive control. Data are presented as the means ± SEM (n = 3). ###p< 0.001 vs. control cells, **p< 0.01, ***p< 0.001 vs. vehicle-treated cells.
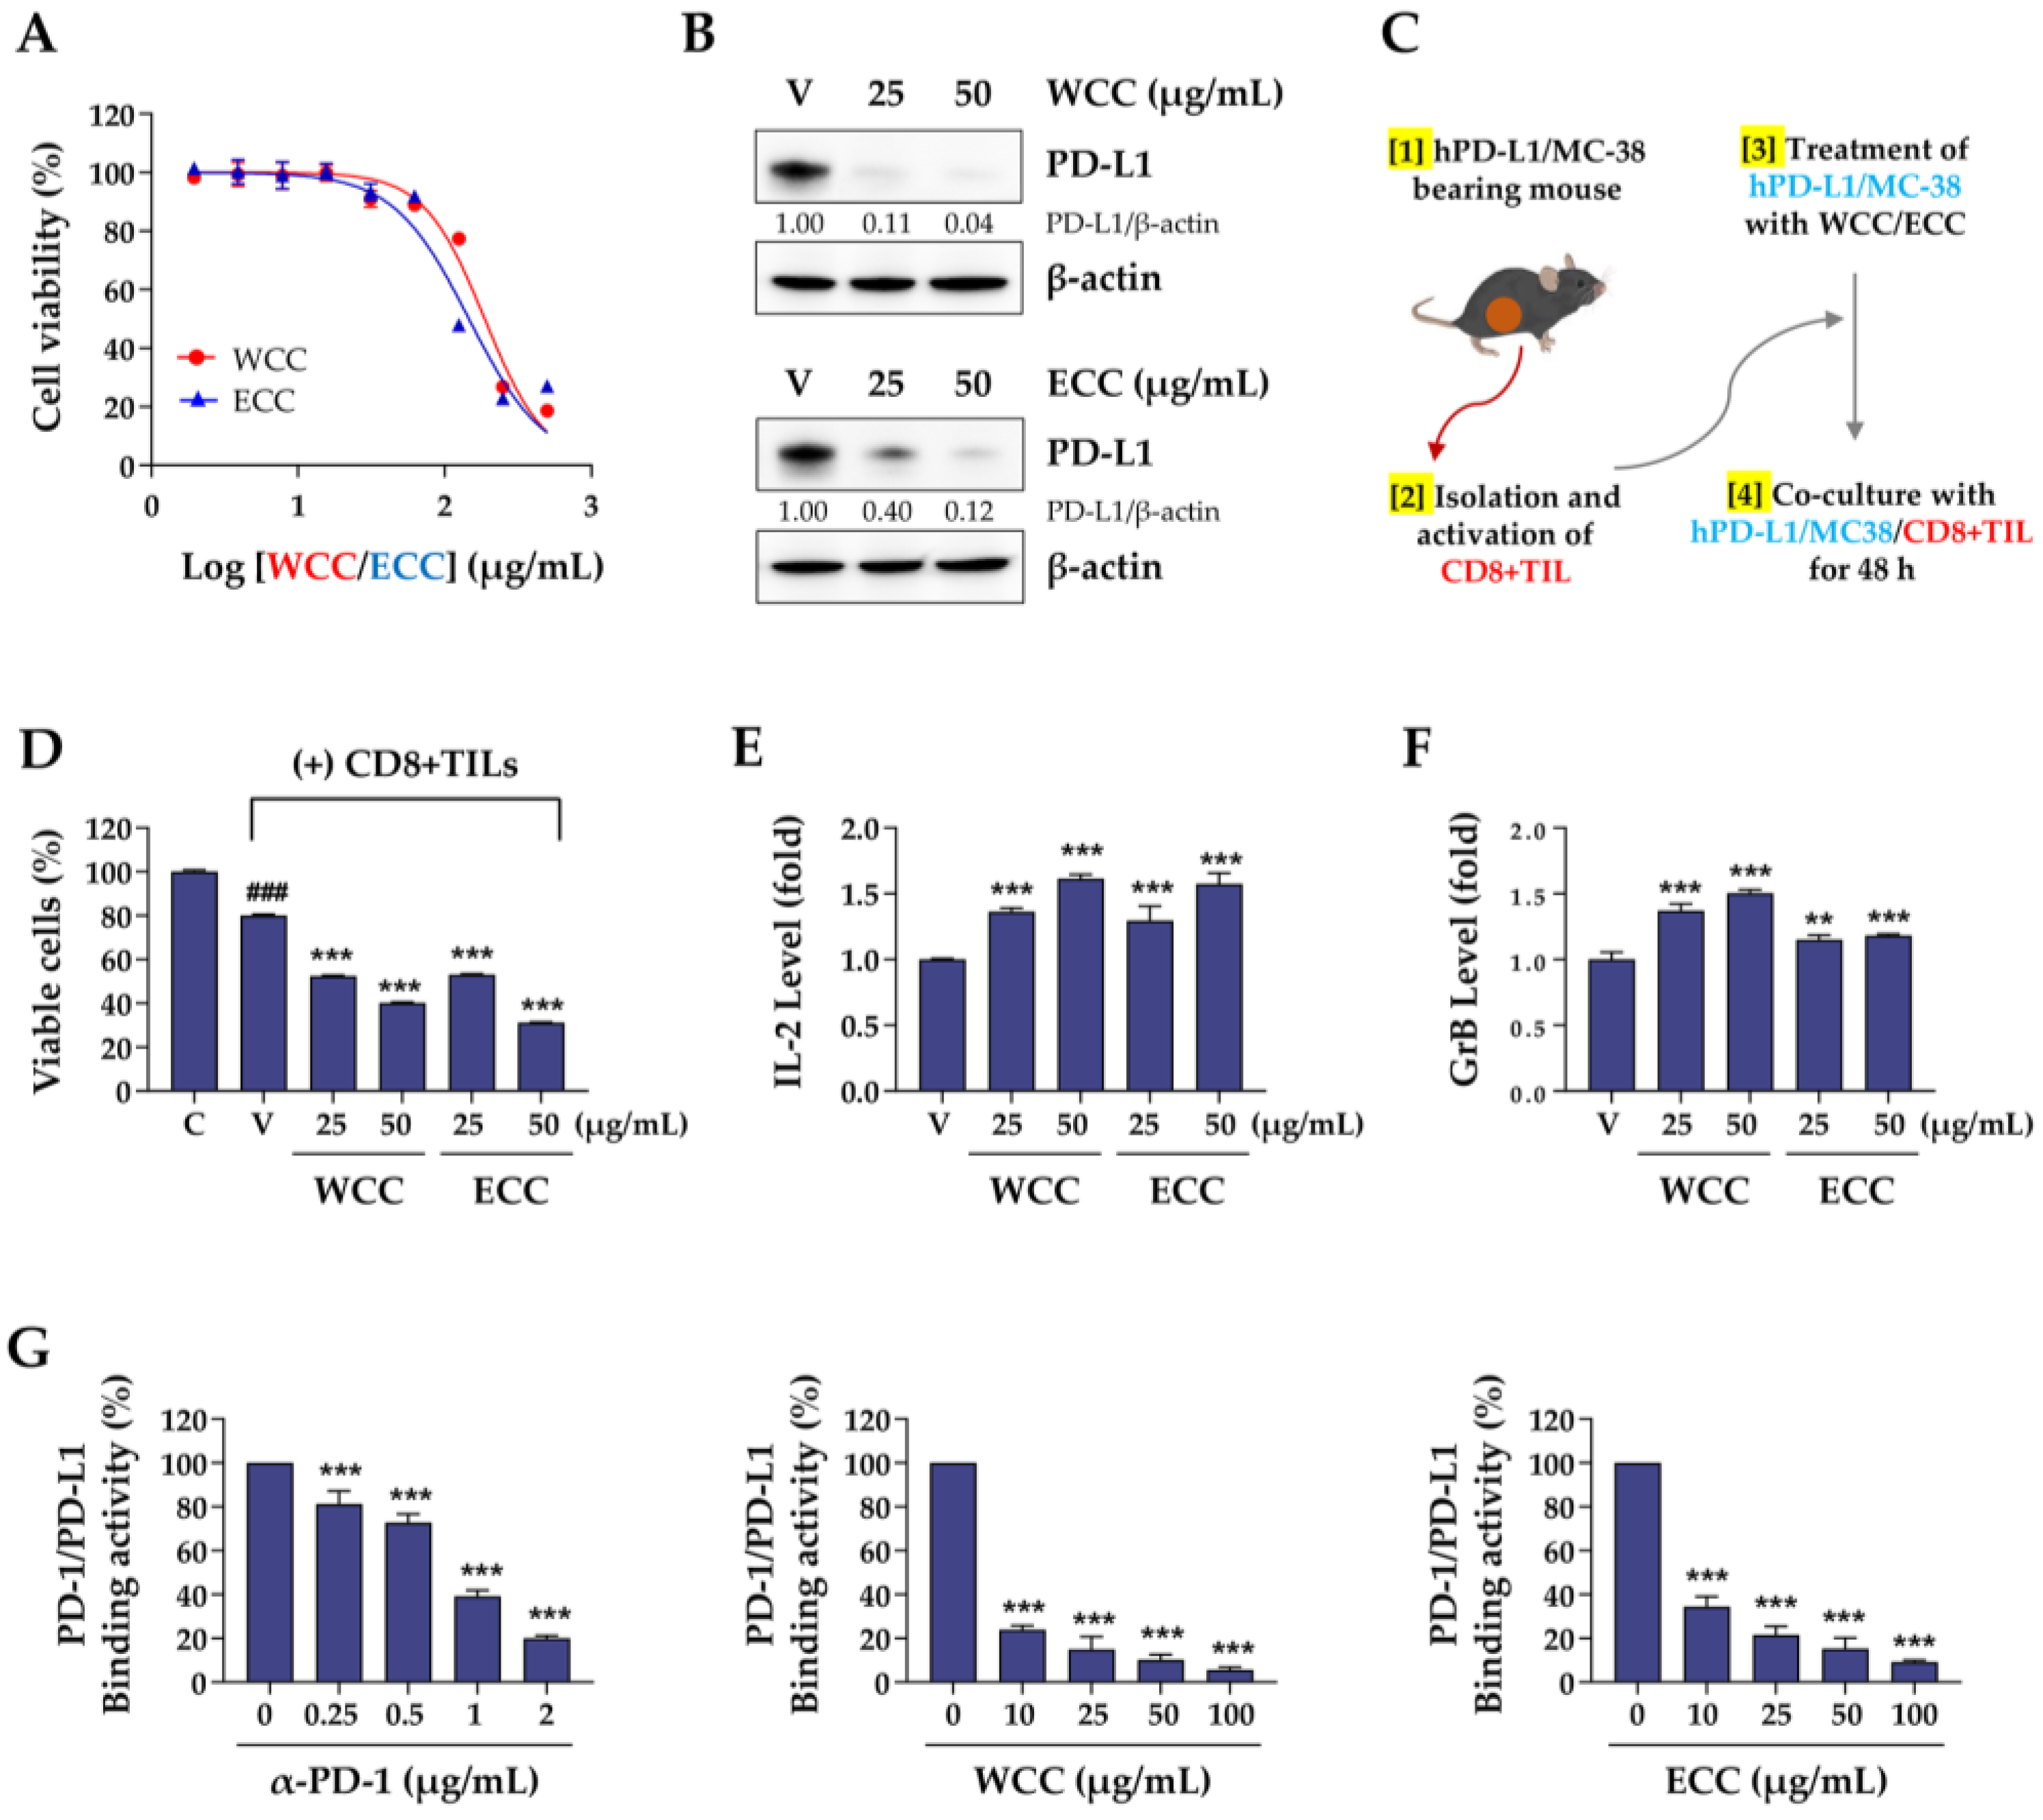
Figure 5.
Effects of oral administration of WCC on the growth of hPD-L1/MC-38 tumors in humanized PD-1 mice. (A) Experimental scheme for tumor injection, administration of WCC, and sacrifice. (B) Body weight changes compared to day 1 (D1) in normal and tumor-bearing mice were measured on days 4, 8, 11, 14, and 16 after WCC administration. (C) The size of hPD-L1/MC-38 tumor mass was measured on days 4, 8, 11, 14, and 16 following the administration of either WCC or vehicle. (D) Tumor suppression rate by WCC administration was compared to control mice given a vehicle. (E) On day 16, mice were euthanized, and their tumors were removed and weighed. Data are presented as the means ± SEM (n = 5). *p< 0.05, **p< 0.01, ***p< 0.001 vs. vehicle-treatment.
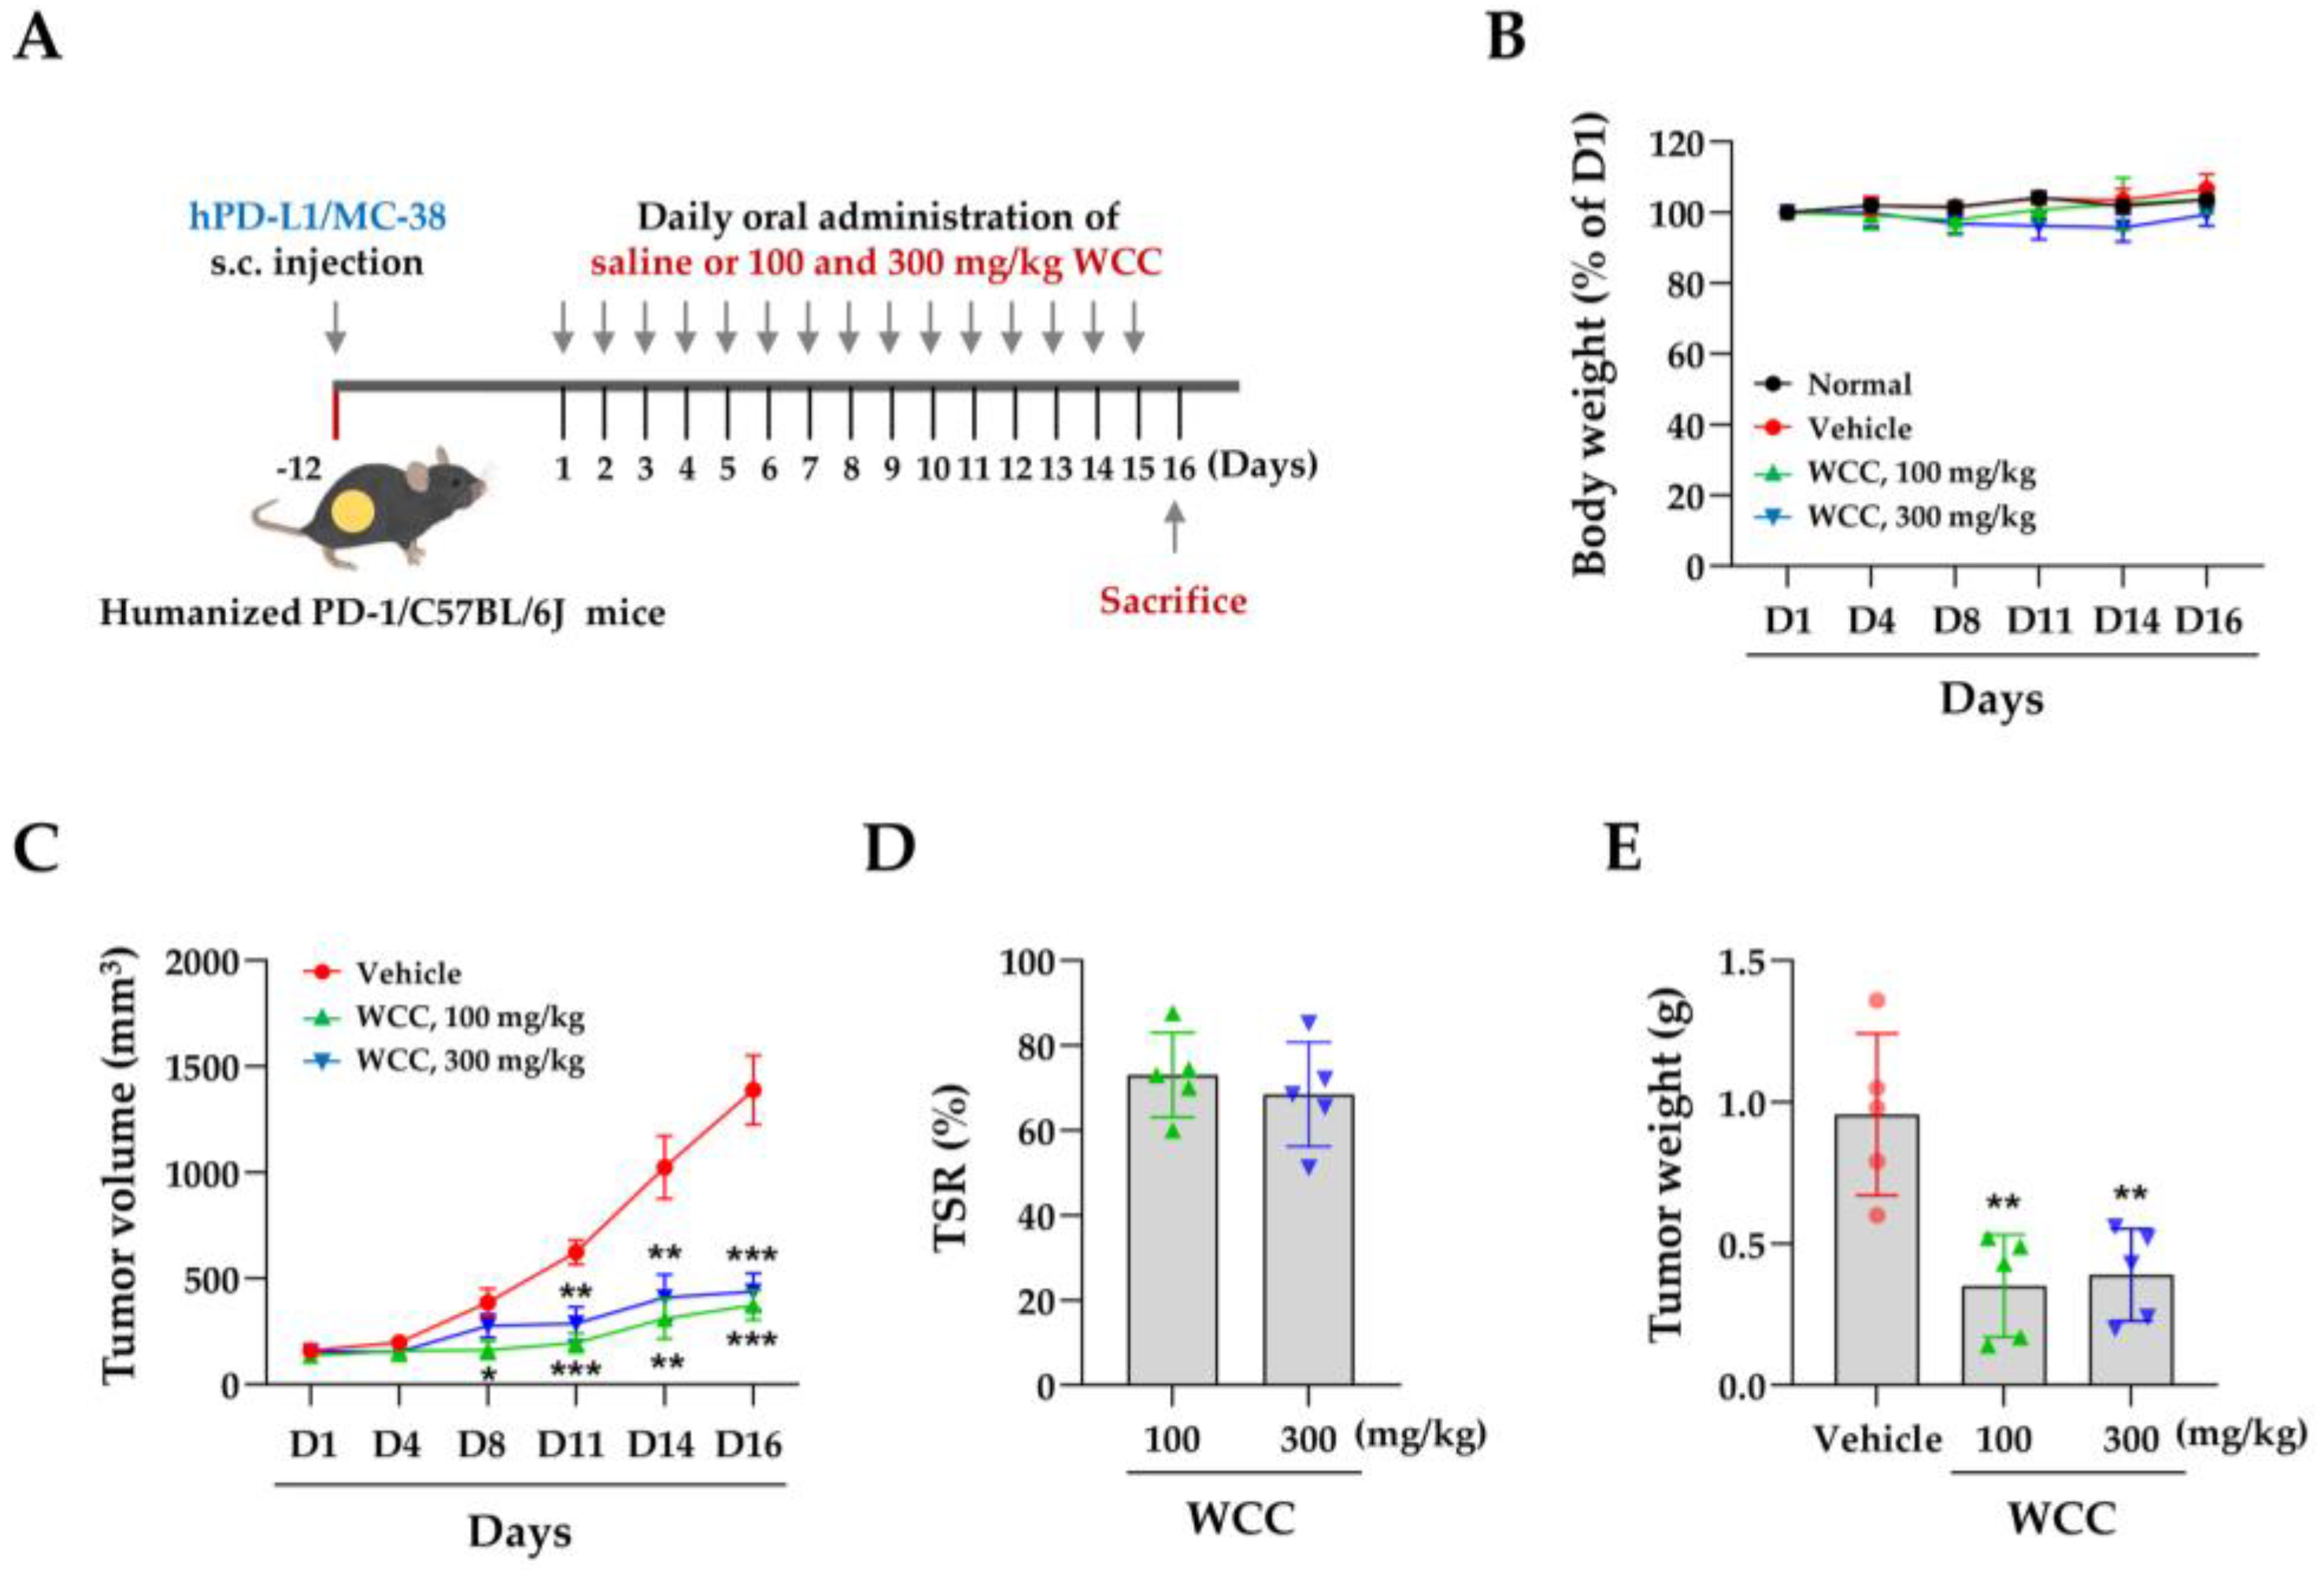
Figure 6.
Effects of oral administration of WCC on the T cell activity in humanized PD-1 mice. (A-B) On day 16, serum from mice in each group was isolated, and the levels of IL-2 (A) and granzyme B (GrB) (B) were determined using ELISA. (C) Representative images of CD8- and GrB-positive areas within tumors from mice administered with WCC or vehicle. (D-E) The relative areas positive for CD8 and granzyme B (GrB) within the tumors of the WCC-treated group were compared to those of the vehicle-treated group. Data are expressed as the means ± SEM (n = 5). **p< 0.01, ***p< 0.001 vs. vehicle-treatment.
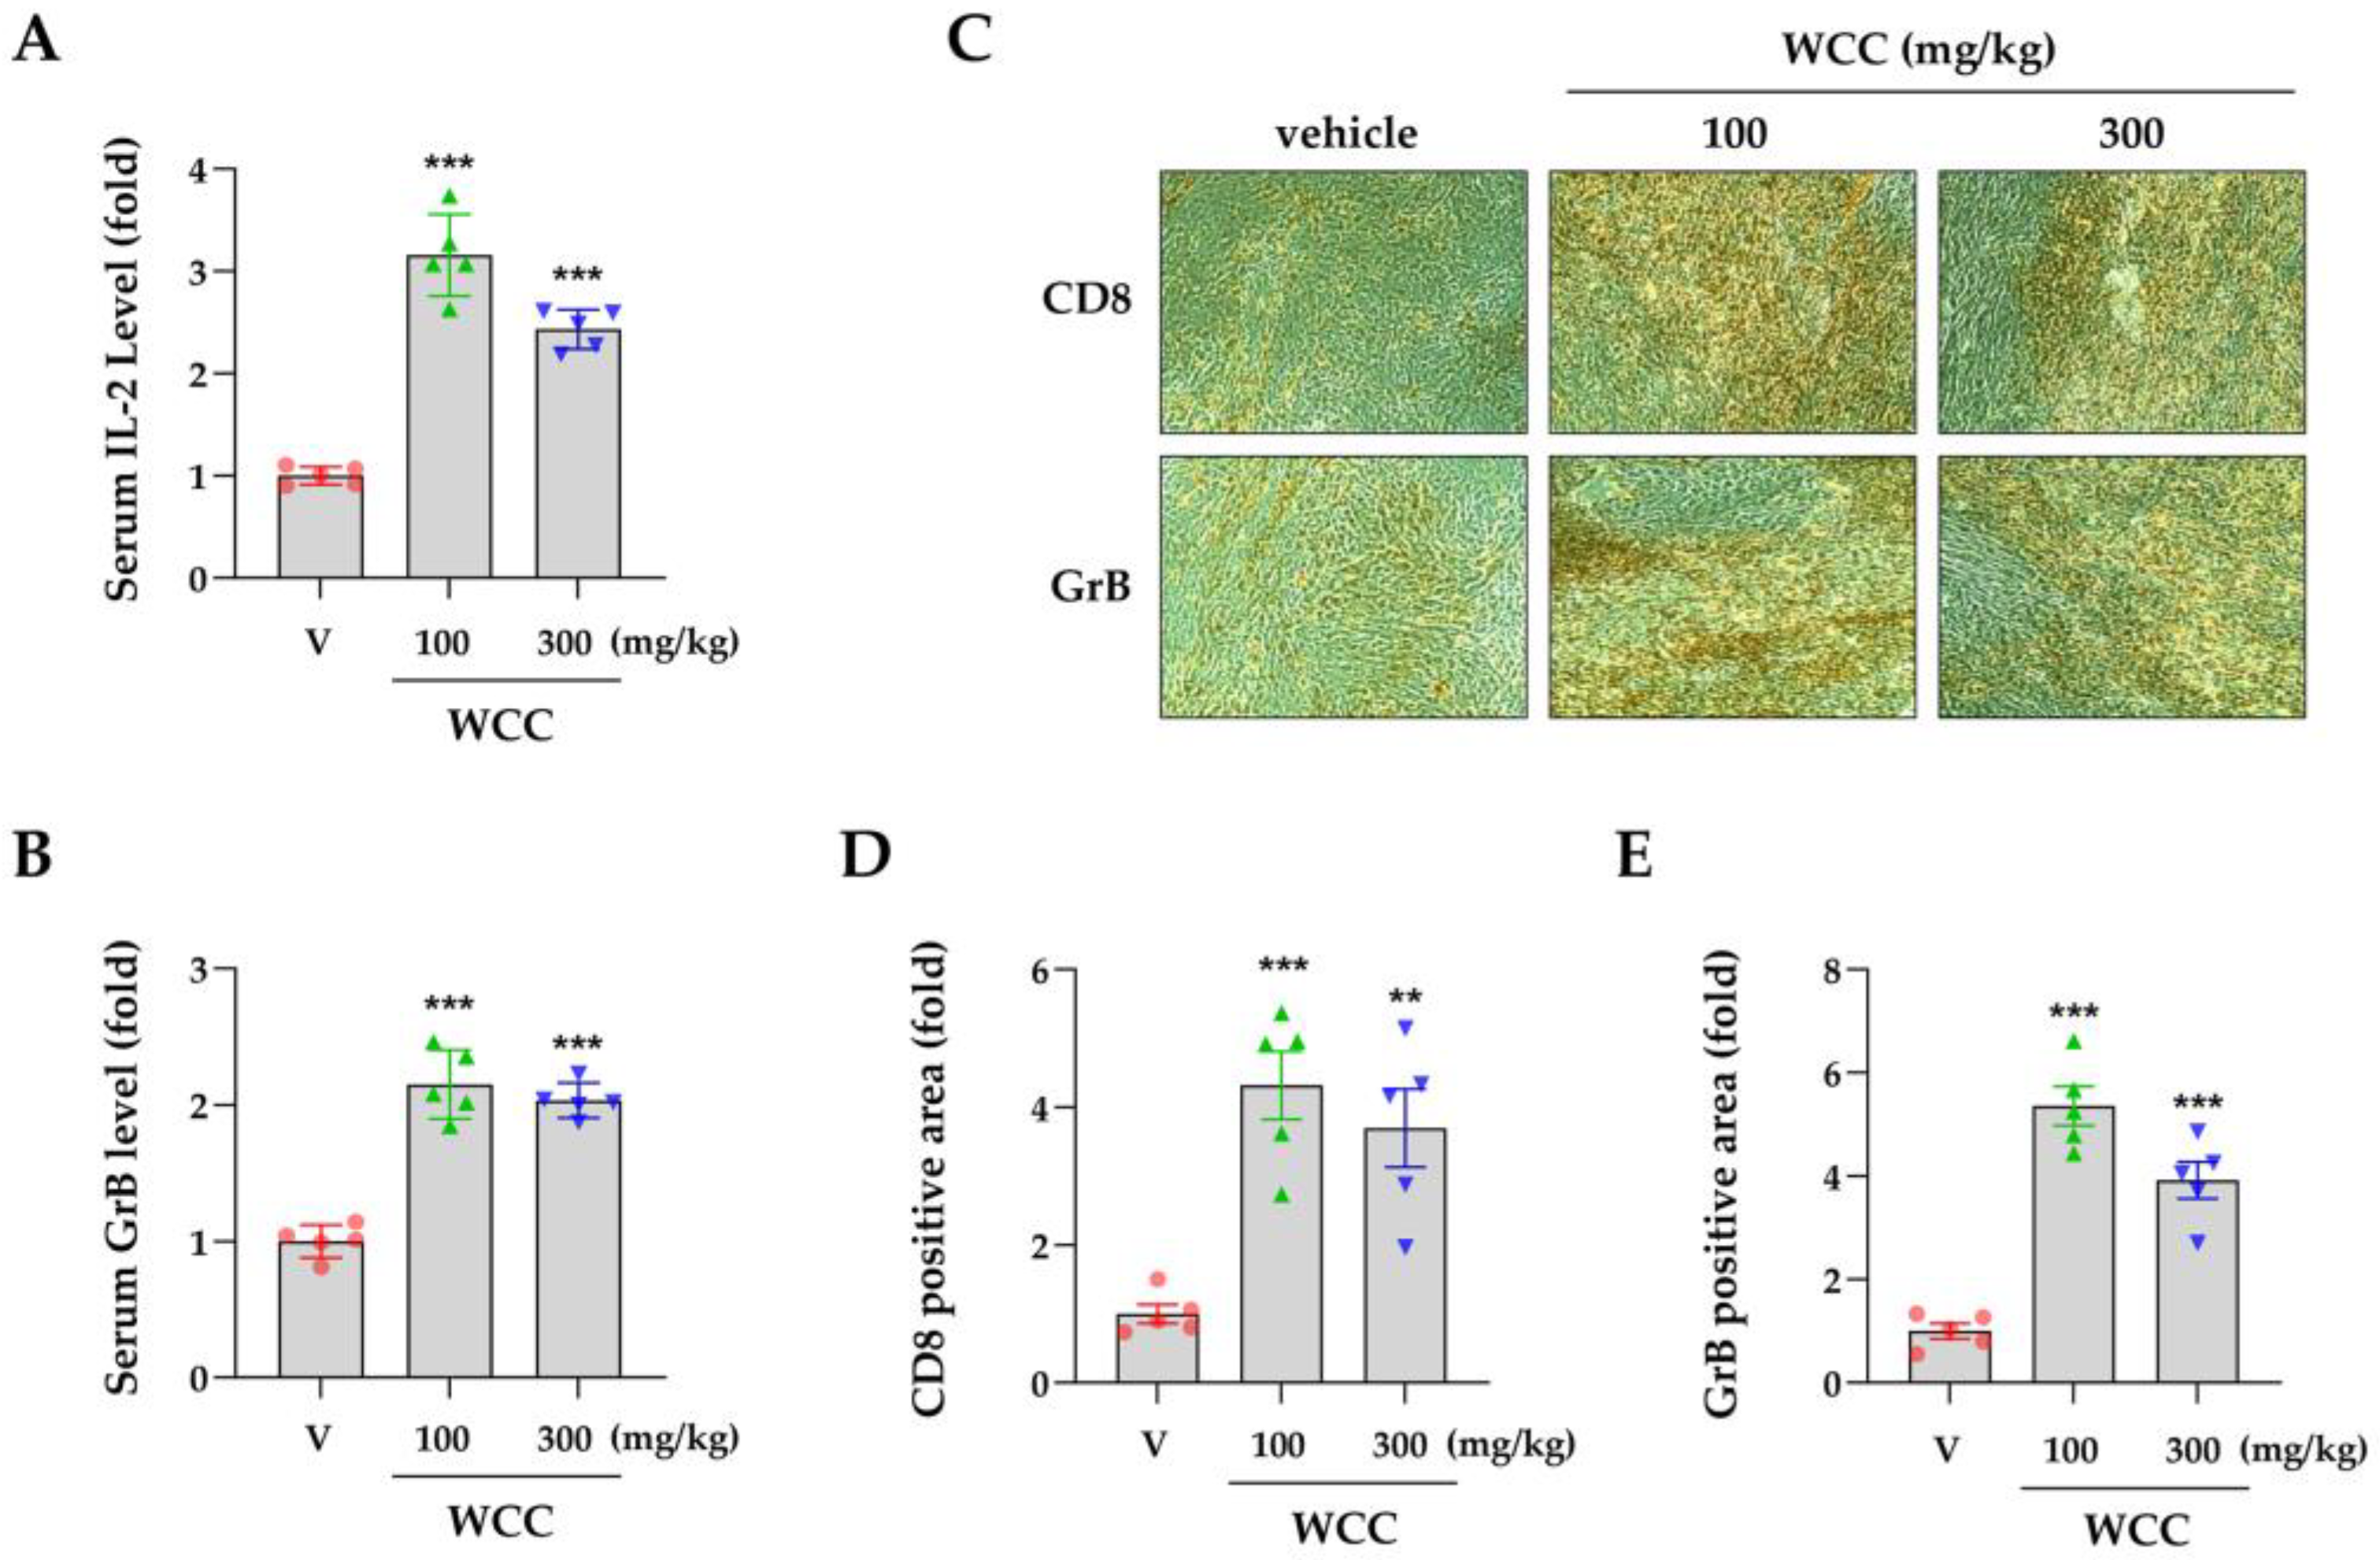
Figure 7.
Effects of compounds in Caryophylli Cortex extract on the PD-1/PD-L1 axis. (A) The chemical structure of bergenin (BG), catechin (CT), chlorogenic acid (CA), ellagic acid (EA), and gallocatechin (GC). (B) The binding activity of PD-1/PD-L1 in the presence of BG, CT, CA, EA, and GC was evaluated using a competitive ELISA. (C) MDA-MB231 cells were pre-treated with each compound for 24 h, and then co-cultured with Jurkat cells. After 24 h, Jurkat cells were removed, and the remaining MDA-MB231 cells were quantified. (D) Following co-culture, the NFAT activity of Jurkat cells was measured. (E) The levels of IFN-γ-inducible PD-L1 protein in DLD-1 cells were analyzed via western blotting. *p< 0.05, **p< 0.01, ***p< 0.001 vs. vehicle-treated cells.
Disclaimer/Publisher’s Note: The statements, opinions and data contained in all publications are solely those of the individual author(s) and contributor(s) and not of MDPI and/or the editor(s). MDPI and/or the editor(s) disclaim responsibility for any injury to people or property resulting from any ideas, methods, instructions or products referred to in the content. |
© 2024 by the authors. Licensee MDPI, Basel, Switzerland. This article is an open access article distributed under the terms and conditions of the Creative Commons Attribution (CC BY) license (http://creativecommons.org/licenses/by/4.0/).
Copyright: This open access article is published under a Creative Commons CC BY 4.0 license, which permit the free download, distribution, and reuse, provided that the author and preprint are cited in any reuse.


