
Submitted:
18 December 2025
Posted:
22 December 2025
You are already at the latest version
Abstract
Two-phase ejectors are a promising alternative for improving the performance of direct expansion vapor compression refrigeration systems, especially in transcritical applica-tions. Extensive literature has been produced on modeling, simulations and experiments related to two-phase ejectors. In particular, 0D models have proven to offer a trade-off be-tween simplicity and precision. In these models, there remains significant uncertainty re-garding the estimation of the two-phase speed of sound and the choking conditions at the primary nozzle throat. These choking conditions have a considerable impact on the throat geometry. This study proposes a novel approach that relies solely on conservation equa-tions (mass and energy) to determine the thermodynamic conditions at the throat for de-sign purposes. The results of the proposed approach and 13 other approaches reported in the literature were compared with published experiments data regarding the throat diam-eter and pressure. The proposed approach showed robust when validated against three experimental cases, predicting the throat diameter and pressure of a primary convergent–divergent nozzle with deviations of -8 % and +15 %, while the other approaches exhibited larger deviations of -12 % to +574% and -73 % to +21 %, respectively. Moreover, the pro-posed approach reliably generates a convergent-divergent nozzle configuration across a wide range of operating conditions, including variations in primary and secondary pres-sures as well as variations in primary nozzle efficiency using R1234yf and CO2 as work-ing fluids.
Keywords:
two-phase ejectors
; convergent-divergent nozzle
; choked flow
; speed of sound
1. Introduction
1.1. Two-Phase Ejector
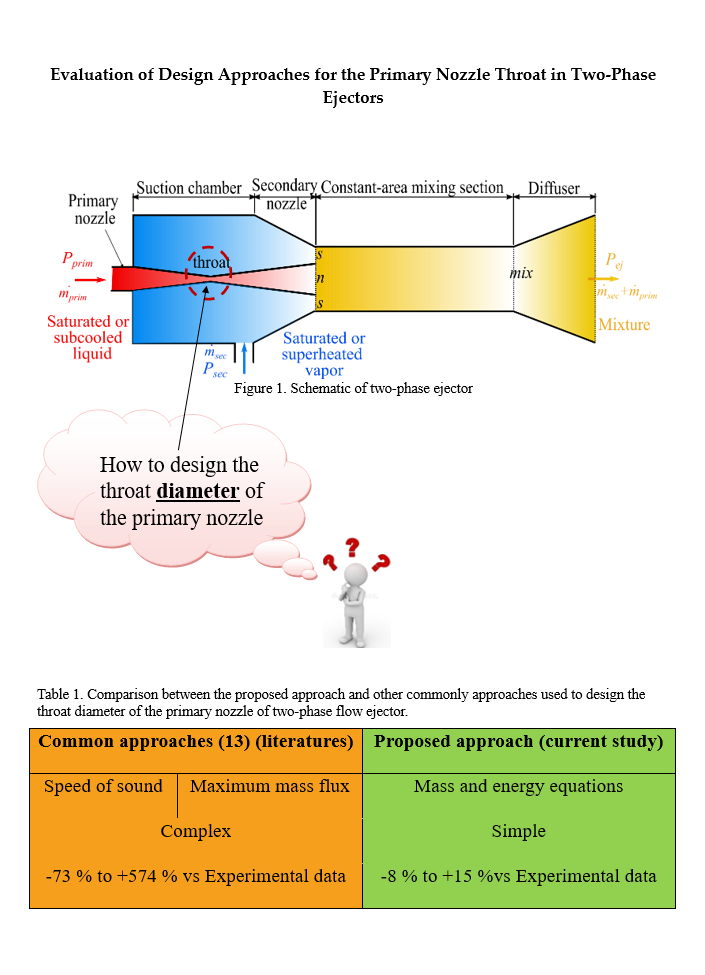
Ejector systems play a crucial role in various industries, including aerospace, chemical processing, and HVAC, where they are employed for fluid pumping, mixing, and compression applications [1]. This component is used as an economical and reliable tool to convert the pressure potential of the primary flow into the kinetic energy of the secondary flow through an entrainment and mixing mechanism described below. A schematic of the ejector's basic parts is shown in Figure 1. It comprises a primary nozzle, suction chamber including a secondary nozzle, mixing section, and diffuser. It is integrated into the refrigeration cycle, as illustrated in Figure 2, which depicts a typical use of the two-phase ejector as an expansion device. The saturated or subcooled liquid (state 3) exits the condenser and flows into the ejector primary nozzle where it expands and creates a low-pressure zone that entrains the saturated or superheated vapor from the evaporator outlet (state 7). The resulting liquid-vapor mixture exits the ejector into the separator (state 4). From the separator, the saturated vapor part is drawn into the compressor, where it is pressurized from (state 1) to (state 2). Meanwhile, the saturated liquid (state 6) passes through an expansion valve, experiencing a slight pressure reduction before entering the evaporator to absorb heat.
The ejector operates by expanding the primary flow to supersonic speeds, creating suction that entrains the secondary fluid [2]. This is achieved with a converging–diverging nozzle, where large pressure drops may trigger flash evaporation, often delayed by non-equilibrium effects [3]. The resulting high-speed jet entrains the secondary stream, and shock waves restore equilibrium in the mixing section [4]. The performance of ejector systems strongly depends on the throat diameter. A larger diameter would not allow the flow to keep accelerating into the supersonic regime, whereas a smaller throat diameter would limit the mass flow rate, thereby decreasing the performance of the cycle.
Multiple types of models were developed in the literature to predict the performance of two-phase ejectors, ranging from 0D to CFD simulations, leading to a rich literature on the topic [5,6]. 0D models consist of multiple control volumes, each describing a part of the ejector as represented in Figure 1. Keenan et al. [7] mainly classified 0D models into two categories depending on the retained mixing model for the primary and secondary flows: Constant Pressure Models (CPMs) and Constant Area Models (CAMs). In CPMs, mixing is assumed to occur at constant pressure within an additional control volume linking the nozzles to the with the constat-area mixing section. In CAMs, the nozzles outlets are located with the inlet of the constant-area mixing section directly.
1.2. Two-Phase Choked Flow
Two-phase choked flow occurs when a liquid-vapor mixture flows through a restricted passage, such as a nozzle or a valve, at a limited mass flow rate and at the local speed of sound. Critical parameters are generally determined either from calculations of the speed of sound or the maximum mass flux.
The study of sound propagation in fluids dates back to Sir Isaac Newton, who related the speed of sound to the pressure and density under isothermal process. Laplace later corrected this by accounting for adiabatic effects [8]. Wood (1930) [9] extended the concept to air-water mixture, assuming homogeneous flow. Wallis (1969) [10] proposed a steam-water correlation under homogeneous equilibrium conditions. Henry and Fauske (1971) [11] introduced the metastable effect and developed a widely validated model that determined the critical mass flux for different fluids. Nguyen et al. (1980) [12] modeled steam/air-water mixture by treating the liquid-gas interface as an elastic boundary. Attou and Seynhaeve (1999) [13] considered thermodynamic flashing effects, while Nakagawa et al. (2009) [14] analyzed expansion waves for equilibrium and frozen flows. Lund and Flåtten (2010) [15] studied CO2 under equilibrium homogeneous assumptions. Khalil et al. (2011) [16] analyzed R134a ejectors, designing nozzle throats by maximizing mass flux. Niknam et al. (2017) [17] proposed an improved formulation for mixtures such as steam/air–water and methane–propane under isobaric–isothermal conditions. Other studies investigated the slip conditions between steam and water, such as those by Zivi (1964) [18] and Smith (1969) [19], as well as by Sher et al. (2008) [20]. The last three studies were combined with Wood's correlation [9] to have a new calculation of the speed of sound of two-phase flow in the primary nozzle of ejector utilized in refrigeration systems.
Figure 3 illustrates the speed of sound calculated using the approaches mentioned above, excluding Khalil et al. [16] and Henry and Fauske [11]. The calculations were performed with varying vapor quality (x) from 0 to 1 at a pressure of 10 bar using R1234yf as working fluid. The figure shows that the speed of sound followed a similar trend with a minimum occurring at low vapor quality, excluding Attou and Seynhaeve [13] and Niknam et al. [17] showing an increase in the speed of sound with increasing vapor quality. The correlations of Newton-Laplace, Wood [9], Wood [9]+ Sher et al. [20], Wallis [10], and Lund and Flåtten [15] provided similar results and were close to those of Nakagawa et al. [14]. All tested correlations accurately determined the speed of sound of a single-phase substance with the exception of those proposed by Lund and Flåtten [15] , Nakagawa et al. [14] Attou and Seynhaeve [13] and Niknam et al. [17]. For example, at a pressure of 10 bar, the speed of sound in the saturated liquid phase of R1234yf is 388.41 m/s, while in the saturated vapor phase it is 126.8 m/s [21]. However, the predicted liquid phase values were 362.2 m/s by Lund and Flåtten [15], infinite by Nakagawa et al. [14], 11.6 m/s by Attou and Seynhaeve [13] and zero by Niknam et al. [17]. For vapor phase, Nakagawa et al. [14] and Niknam et al. [17] predicted 132.9 m/s.
It is essential to compare available correlations to assess their advantages, limitations, and suitability under different conditions. Since they define the critical throat parameters, these methods directly affect mass flux predictions, and thus the entrainment ratio, the ejector back pressure and the sizing the throat diameter. Kong and Qi [22] analyzed the influence of six correlations of the two-phase speed of sound on the ejector performance using a 0D ejector model. They simulated experimental back pressure data with a R134a and steam as working fluids. Their results showed that different speed of sound correlations led to different predictions of the ejector back pressure reported in the referenced experimental studies. For R134a, the maximum deviation among the models was only 0.91 %, whereas for steam the deviations were more pronounced, reaching 8.57 %. However, they did not examine how the speed of sound models affects nozzle geometry, since their model used the geometry as an input. More recently, Alhabeeb et al. [23] investigated eight different speed of sound models and quantified their effect on the geometry of the primary nozzle throat under a wide range of operating conditions using R1234yf. They found significant discrepancies, up to 85 % in throat diameter between the investigated models. However, they did not validate the investigated correlations against the experimental data. Thus, the aim of this study is to introduce a new design approach that relies solely on mass and energy conservation to determine the thermodynamic conditions of expanded liquid at the throat of the a convergent-divergent nozzle, without the need to calculate the speed of sound or the critical mass flux for ejector sizing. Importantly, this approach is validated against experimental data from the literature and systematically compared with thirteen existing correlations, demonstrating its robustness in the design of two-phase ejectors.
2. Ejector Modeling
A mathematical 0D model was formulated based on the models by [24] and [25], and later adapted in several subsequent studies with slight variations in the input parameters and assumptions [26]. The following assumptions are adopted:
- The kinetic energy at the ejector inlets and outlet is negligible.
The primary and secondary flows expand to the same pressure ( = ), which is lower than the secondary inlet pressure.
- The mixing process occurs at a constant area, with pressure rise due to the momentum transfer (< ).
- Velocities and properties are uniform over the selected cross sections, except during the mixing process and for certain speed of sound correlations at the primary nozzle throat.
- The flow is homogeneous, adiabatic and irreversible, with nozzles and diffuser losses represented by isentropic efficiencies.
2.1. Governing Equations
The ejector flow is governed by conservation of energy, mass, and momentum:
Energy conservation,
Mass conservation,
Momentum conservation,
Here, is the density (kg/m3), is the flow area (m2), is the velocity (m/s), is the specific enthalpy (kJ/kg), and is the pressure (Pa)
2.2. Primary Nozzle
The pressure at the exit of the primary nozzle () is determined iteratively with <. Using the definition of the primary nozzle isentropic efficiency ().
The enthalpy at the exit of the nozzle () is calculated as follows:
Here is the enthalpy of the isentropic expansion at the nozzle exit. The exit velocity is then obtained from the energy equation.
The density of the fluid at the primary nozzle exit () can be written as:
Here, is the void fraction (-), is vapor quality (-), and denote gas and saturated liquid phases.
Using the mass conservation equation, the normalized primary nozzle exit area per unit total ejector mass flow rate is expressed as:
Here is the entrainment ratio or the ratio of secondary flow rate () to the primary flow rate ().
2.3. Secondary Nozzle
Similarly, the secondary nozzle is modeled using the following relations:
2.4. Mixing Section
An initial value of the constant area outlet pressure (<) is assumed, from which the outlet velocity is calculated using the momentum equation.
By applying energy equation between the ejector’s inlet and mixing outlet
The conservation of mass at the constant cross section area is verified as:
2.5. Diffuser
Applying the energy equation through the ejector
By using the definition of diffuser isentropic efficiency ()
Here, is the enthalpy at the end of the isentropic compression in the diffuser.
The entropy at the diffuser outlet after isentropic compression is assumed equal to that at the mixing outlet.
The ejector outlet pressure () can be found by:
Also, the quality of the mixture at the ejector outlet () can be found:
In the separator, the vapor and liquid fractions represent the primary and secondary mass flow rates, respectively, so the refrigerant quality at the ejector outlet is verified by:
2.6. Primary Nozzle Throat
2.6.1. Common Methods
To determine the primary nozzle throat conditions of a two-phase ejector, empirical correlations of the speed of sound () or maximum mass flux () are commonly used. The pressure at the throat is determined iteratively when or is maximum, (see the flowchart shown in Figure 5).
2.6.2. Proposed Approach
The throat thermodynamic conditions, such as enthalpy, can be calculated depending on inlet/exit conditions of the nozzle as well as the nozzle efficiency. The procedure begins by assuming a value for the throat pressure (). Based on this assumed pressure, the enthalpy at the throat can be calculated in two ways shown in Figure 4:
1. Taking a control volume between the inlet and the throat:
Here is the enthalpy at the throat pressure after the isentropic expansion from the nozzle inlet to the throat at the throat pressure and the inlet entropy.
2. Taking a control volume between the throat and the exit:
(41)
Here is the enthalpy of the isentropic expansion at the exit of the primary nozzle.
The throat pressure ) is determined iteratively when (see the flowchart shown in Figure 5).
2.7. Ejector Geometries
The 0D two-phase ejector model serves as a design tool to calculate key diameters, including the throat (), primary nozzle exit (), and constant-area mixing section () as follows:
2.8. Performance Characteristics of EERC
Cooling capacity (), compressor power (), , entrainment
ratio (), and ejector compression ratio () are the main performance characteristic of the EERC. The cooling capacity is calculated as:
The compressor power is given as:
where is the compressor isentropic efficiency.
The coefficient of performance () of the EERS is defined as:
The entrainment ratio and the ejector compression ratio can be calculated as:
3. Results and Discussion
3.1. Validation of Two-Phase Ejector the 0D Model
3.1.1. Experimental Data from Ersoy and Sag [27]
The ejector model was validated against experimental data from Ersoy and Sag [27], who tested a refrigeration cycle operating in both conventional and ejector-expander modes with a separator at the two-phase ejector outlet. For one case study, R134a was used with a primary pressure of 14.13 bar (subcooling 1.86 K), secondary pressure of 3.72 bar (superheating 14.07 K), a compressor efficiency of 0.60, and a cooling capacity of 4.2 kW. The cooling capacity was used to calculate the secondary mass flow rate, while the primary mass flow was obtained by iterating the entrainment ratio. Assumed isentropic efficiencies were 0.90 for both nozzles and 0.80 for the diffuser, with a fixed secondary pressure drop of 0.33 bar. These assumptions yielded good agreement with experimental data, with a mean absolute error percentage (MAEP) of approximately 8 % as shown in Figure 6, excluding throat diameter calculations.
is ±2.9 %, The uncertainties of the entrainment ratio and geometries were not reported in [27].
After validation, the model was applied to estimate the experimental throat diameter of the primary nozzle reported by Ersoy and Sag [27], using both the proposed approach and the commonly used correlations extracting identical correlations to Wood [9], such as Wallis [10], Lund and Flåtten [15] and Wood [9] + Sher et al. [20]. Figure 6 shows that the proposed approach provides the closest agreement with the experimental value, with a deviation of -8 %. In contrast, the investigated correlations show larger deviations ranging from -12 to +186 %. The Newton-Laplace, Attou and Seynhaeve [13], Henry and Fauske [11] and Khalil et al. [16] approaches consistently underestimate the experimental value by approximately -12 %. Nakagawa et al. [14] slightly overestimate the diameter with a deviation of +14 %, while Wood [9] gives a +15 % overestimation. More significant underestimates are found for Wood [9]+Zivi [18] and Wood [9]+Smith [19] with deviations of -32 % and -42 %, respectively. In contrast, Nguyen et al. [12] strongly overestimates the value with a deviation of 67 %, while the most extreme case is Niknam et al. [17], which shows an exceptionally high deviation of +186 %, indicating a substantial overestimation of the experimental throat diameter.
The deviations in the predicted diameter arise mainly from differences in the physical assumptions used in the approaches. The correlations are based on varying assumptions about two-phase flow behavior, which leads to significant discrepancies in the predicted density, velocity, and consequently, the mass flux. Furthermore, many correlations were originally developed for specific fluids or operating conditions, so applying them outside their intended range introduces additional discrepancies. These combined effects explain the wide spread in the predictions of the throat diameter obtained from the various models.
3.1.2. Experimental Data from Ameur et al. [28]
Another validation was conducted using experimental data from Ameur et al. [28]. Their study employed a different test bench configuration that included an ejector, condenser, tank, subcooler, pump, heater, and evaporator. Accordingly, the 0D model was modified to reflect this special configuration. In particular, the entrainment ratio was iterated based on the calculated secondary mass flow rate rather than on the mass fraction exiting the ejector, since the ejector downstream component is a condenser rather than a separator.
For the validation, one operating case reported by the authors was selected as input data: R134a as refrigerant, a primary pressure of 14.9 bar (subcooling 10 K), a secondary pressure of 3.65 bar (superheating 10 K), and a primary mass flow rate of 169.7 kg/h. Although the evaporator heat source was reported as 5 kW, intermittent operation was observed; therefore, an effective cooling capacity of 3.8 kW was assumed. Isentropic efficiencies of 0.70 were applied for all ejector components, with a condenser subcooling of 5 K. These values, refined through iterative calculations, yielded good agreement between the modified 0D and the experimental data, with a mean absolute error percentage (MAEP) of approximately 6.6 % as shown in Figure 7, excluding throat diameter calculations.
Following the same procedure, the primary nozzle throat diameter of reported by Ameur et al. [28] was estimated using both the proposed approach and the commonly used correlations. Figure 7 shows that the closest agreement with the experimental value was obtained using the Wood [9]+Smith [19] correlation, with deviations of +6 %. The proposed approach followed, with a deviation of +15 %, while Khalil et al. [16] and Newton-Laplace each yielded +16 %. Larger deviations were observed for Wood [9]+ Zivi [18] with a deviation of +24 %, and Henry and Fauske [11] with a deviation of +34 %. Finally, the remaining correlations yielded extreme deviations ranging from +119 % to +574 %.
3.2. Anticipating Experimental Throat Pressure
The proposed approach and conventional methods were used to predict the experimental throat pressure reported by Nakagawa et al. [29]. Their study investigated two-phase supersonic CO2 flow in rectangular converging-diverging nozzles for ejector refrigeration cycles. The goal was to analyze decompression boiling phenomena and pressure behavior in relation to nozzle divergence angles. The subcooled CO2 liquid can flash to a two-phase mixture at or downstream of the throat due to the rapid pressure drop.
Table 1 Deviation of the estimated (est.) primary nozzle throat pressure from the experimental value reported by Nakagawa et al. [29]. lists the approaches used to predict the experimental throat pressure of 64.8 bar reported by Nakagawa et al. [29], which indicated in the merged cells. The third and last columns show the predicted values and their corresponding percentage deviations, from the experimental value. The operating conditions of one case reported by the authors were adopted as follows: CO2 as working fluid, an inlet pressure of 71 bar and the inlet temperature of 26.4 °C. The nozzle efficiency was assumed to lie within the common range of 0.8 to 0.95, and the predicted average throat pressure was considered.
- * The uncertainty was not reported in [29].
3.3. Primary Nozzle Design
Figure 8 shows the results of the primary nozzle design in terms of its area ratio, defined as the ratio of the nozzle exit area to the throat area (). The investigations were carried out under varying operating conditions using two working fluids: R1234yf and CO2. For R1234yf, three sets of parametric studies were performed, as detailed in Table 2.
4. Conclusions
Determining critical flow parameters in two-phase ejectors usually depends on the speed of sound calculations, which are challenging for two-phase flow. To overcome this limitation, an approach based solely on the conversation of mass and energy is proposed. Its results were compared with thirteen commonly used approaches that rely on empirical correlations for the speed of sound or the maximum mass flux. While the accuracy of such approaches depends on the operating conditions, working fluid, and input data, the present study reduces the uncertainty in model selection for designing purposes by providing a comprehensive comparative analysis and introducing a robust approach based on conservation equations.
The proposed approach shows the closest agreement with the experimental data when predicting the primary nozzle throat diameter of two-phase ejector, with a deviation of -8 % whereas the commonly used methods exhibit larger deviations ranging from -12 to +186 %. In another validation case, a different correlation achieved the best agreement with a deviation of +6 %, while the proposed approach followed closely with a deviation of +15%. A third validation focused on predicting the pressure at the throat of a supersonic convergent-divergent nozzle, where the proposed approach demonstrated excellent agreement, yielding a minimal deviation of +7 %, compared to deviations ranging from -73 to +21 % for the other approaches. In addition, the proposed approach along with only a few other correlations, consistently produce a convergent-divergent nozzle under different operating conditions.
Author Contributions
Conceptualization, B.A.; methodology, formal analysis, validation, writing—original draft preparation, B.M., Y.B. and R.R.; review and supervision. All authors have read and agreed to the published version of the manuscript.
Funding
This research received no external funding.
Acknowledgments
The corresponding author is grateful to the University of Kerbala and Campus France for their generous scholarship funding.
Conflicts of Interest
The authors declare no conflicts of interest. The funders had no role in the design of the study; in the collection, analyses, or interpretation of data; in the writing of the manuscript; or in the decision to publish the results.:
Abbreviations
The following abbreviations are used in this manuscript:
| Symbols | |
| A′ | Area per unit mass flow rate (m2/kg/s) |
| A | Area (m2) |
| c | Speed of sound (m/s) |
| d | Diameter (m) |
| G | Mass flux (kg/s m2) |
| h | Specific enthalpy (J/kg) |
| P | Pressure (Pa) |
| s | Entropy (J/kg K) |
| T | Temperature (K) |
| u | Velocity (m/s) |
| x | Vapor quality (−) |
| Mass flow rate (kg/s) | |
| Cooling capacity (kW) | |
| Compressor power (kW) | |
| Greek letters | |
| α | Void fraction (−) |
| Δ | Percentage change (%) |
| η | Efficiency (−) |
| ω | Entrainment ratio (−) |
| Density (kg/m3) | |
| Subscripts | |
| comp | Compressor |
| cond | Condenser |
| ej | Ejector exit |
| evap | Evaporator |
| g | Gas phase |
| is | Isentropic |
| l | Liquid phase |
| ejcr | Ejector compression ratio |
| mix | Mixing section |
| n | Primary nozzle exit |
| prim | Primary flow |
| s | Secondary nozzle exit |
| sec | Secondary flow |
| su | Subcooled |
| t | Primary nozzle throat |
References
- Besagni, G.; Mereu, R.; Inzoli, F. Ejector refrigeration: A comprehensive review. Renew. Sustain. Energy Rev. 2016, vol. 53, 373–407. [Google Scholar] [CrossRef]
- Eames, W.; Aphornratana, S.; Haider, H. A theoretical and experimental study of a small-scale steam jet refrigerator. Int. J. Refrig. 1995, vol. 18(no. 6), 378–386. [Google Scholar] [CrossRef]
- Ringstad, K. E.; Allouche, Y.; Gullo, P.; Ervik, Å.; Banasiak, K.; Hafner, A. A detailed review on CO 2 two-phase ejector flow modeling. Therm. Sci. Eng. Prog. 2020, vol. 20, 100647. [Google Scholar] [CrossRef]
- Little, B.; Garimella, S. Shadowgraph visualization of condensing R134a flow through ejectors. Int. J. Refrig. 2016, vol. 68, 118–129. [Google Scholar] [CrossRef]
- Song, Y.; Ma, Y.; Wang, H.; Yin, X.; Cao, F. Review on the simulation models of the two-phase-ejector used in the transcritical carbon dioxide systems. Int. J. Refrig. 2020, vol. 119, 434–447. [Google Scholar] [CrossRef]
- Sarkar, J. Ejector enhanced vapor compression refrigeration and heat pump systems—A review. Renew. Sustain. Energy Rev. 2012, vol. 16(no. 9), 6647–6659. [Google Scholar] [CrossRef]
- Keenan, J. H.; Neumann, E. P.; Lustwerk, F. An Investigation of Ejector Design by Analysis and Experiment. J. Appl. Mech. 1950, vol. 17(no. 3), 299–309. [Google Scholar] [CrossRef]
- Jackets, Thermaxx. THE NEWTON-LAPLACE EQUATION & SPEED OF SOUND. Available online: https://blog.thermaxxjackets.com/the-newton-laplace-equation-speed-of-sound.
- B. Wood, A Textbook of Sound; G. Bell and Sons Ltd.: London, 1930. [Google Scholar]
- Wallis, G. B. One-dimensional two-phase flow; McGraw-Hill: New York, 1969. [Google Scholar]
- Henry, R. E.; Fauske, H. K. The Two-Phase Critical Flow of One-Component Mixtures in Nozzles, Orifices, and Short Tubes. J. Heat Transf. 1971, vol. 93(no. 2), 179–187. [Google Scholar] [CrossRef]
- Nguyen, D. L.; Winter, E. R. F.; Greiner, M. Sonic velocity in two-phase systems. Int. J. Multiph. Flow 1980, vol. 7(no. 3), 311–320. [Google Scholar] [CrossRef]
- Attou; Seynhaeve, J. M. Steady-state critical two-phase flashing flow with possible multiple choking phenomenon. J. Loss Prev. Process Ind. 1999, vol. 12(no. 5), 335–345. [Google Scholar] [CrossRef]
- Nakagawa, M.; Harada, A.; Berana, M. S. Analysis of Expansion Waves Appearing in the Outlets of Two-Phase Flow Nozzles. HVACR Res. 2009, vol. 15(no. 6), 1065–1079. [Google Scholar] [CrossRef]
- Lund, H.; Flåtten, T. Equilibrium conditions and sound velocities in two-phase flows. SIAM Annual Meeting, Pittsburgh, PA, USA, Jul. 2010. [Google Scholar]
- Khalil, M. Fatouh; Elgendy, E. Ejector design and theoretical study of R134a ejector refrigeration cycle. Int. J. Refrig. 2011, vol. 34(no. 7), 1684–1698. [Google Scholar] [CrossRef]
- Niknam, P. H.; Fiaschi, D.; Mortaheb, H. R.; Mokhtarani, B. An improved formulation for speed of sound in two-phase systems and development of 1D model for supersonic nozzle. Fluid Phase Equilibria 2017, vol. 446, 18–27. [Google Scholar] [CrossRef]
- Zivi, S. M. Estimation of Steady-State Steam Void-Fraction by Means of the Principle of Minimum Entropy Production. J. Heat Transf. 1964, vol. 86(no. 2), 247–251. [Google Scholar] [CrossRef]
- Smith, S. L. Void Fractions in Two-Phase Flow: A Correlation Based upon an Equal Velocity Head Model. Proc. Inst. Mech. Eng. 1969, vol. 184(no. 1), 647–664. [Google Scholar] [CrossRef]
- Sher, E.; Bar-Kohany, T.; Rashkovan, A. Flash-boiling atomization. Prog. Energy Combust. Sci. 2008, vol. 34(no. 4), 417–439. [Google Scholar] [CrossRef]
- Lemmon, E. W.; Bell, I. H.; Huber, M. L.; McLinden, M. O. NIST Standard Reference Database 23: Reference Fluid Thermodynamic and Transport Properties-REFPROP, Version 10.0 . In National Institute of Standards and Technology; 2018. [Google Scholar]
- Kong, N.; Qi, Z. Influence of speed of sound in two-phase region on 1-D ejector performance modelling. Appl. Therm. Eng. 2018, vol. 139, 352–355. [Google Scholar] [CrossRef]
- Alhabeeb, B.; Michel, B.; Brahami, Y.; Revellin, R. Investigating the impact of sonic velocity correlations on ejector geometry used in a refrigeration system. presented at the 37th Int. Conf., Rhodes, Greece, 2024; pp. 4383–4394. [Google Scholar]
- Kornhauser, Alan. The use of an ejector as a refrigerant expander. Int. Refrig. Air Cond. Conf. 1990, 10–19. [Google Scholar]
- Li, D.; Groll, E. A. Transcritical CO2 refrigeration cycle with ejector-expansion device. Int. J. Refrig. 2005, vol. 28(no. 5), 766–773. [Google Scholar] [CrossRef]
- You, C.; Michel, B.; Revellin, R. Transcritical carbon dioxide heat pump cycle: Validation and comparison of one-dimensional models of ejector with independent data sets. Appl. Therm. Eng. 2022, vol. 213, 118668. [Google Scholar] [CrossRef]
- Ersoy, H. K.; Sag, N. Bilir. Preliminary experimental results on the R134a refrigeration system using a two-phase ejector as an expander. Int. J. Refrig. 2014, vol. 43, 97–110. [Google Scholar] [CrossRef]
- Ameur, K.; Aidoun, Z.; Falsafioon, M. Experimental Performance of a Two-Phase Ejector: Nozzle Geometry and Subcooling Effects. Inventions 2020, vol. 5(no. 2), 23. [Google Scholar] [CrossRef]
- Nakagawa, M.; Berana, M. S.; Kishine, A. Supersonic two-phase flow of CO2 through converging–diverging nozzles for the ejector refrigeration cycle. Int. J. Refrig. 2009, vol. 32(no. 6), 1195–1202. [Google Scholar] [CrossRef]
Figure 1.
Diagram of a constant-area mixing section ejector model.
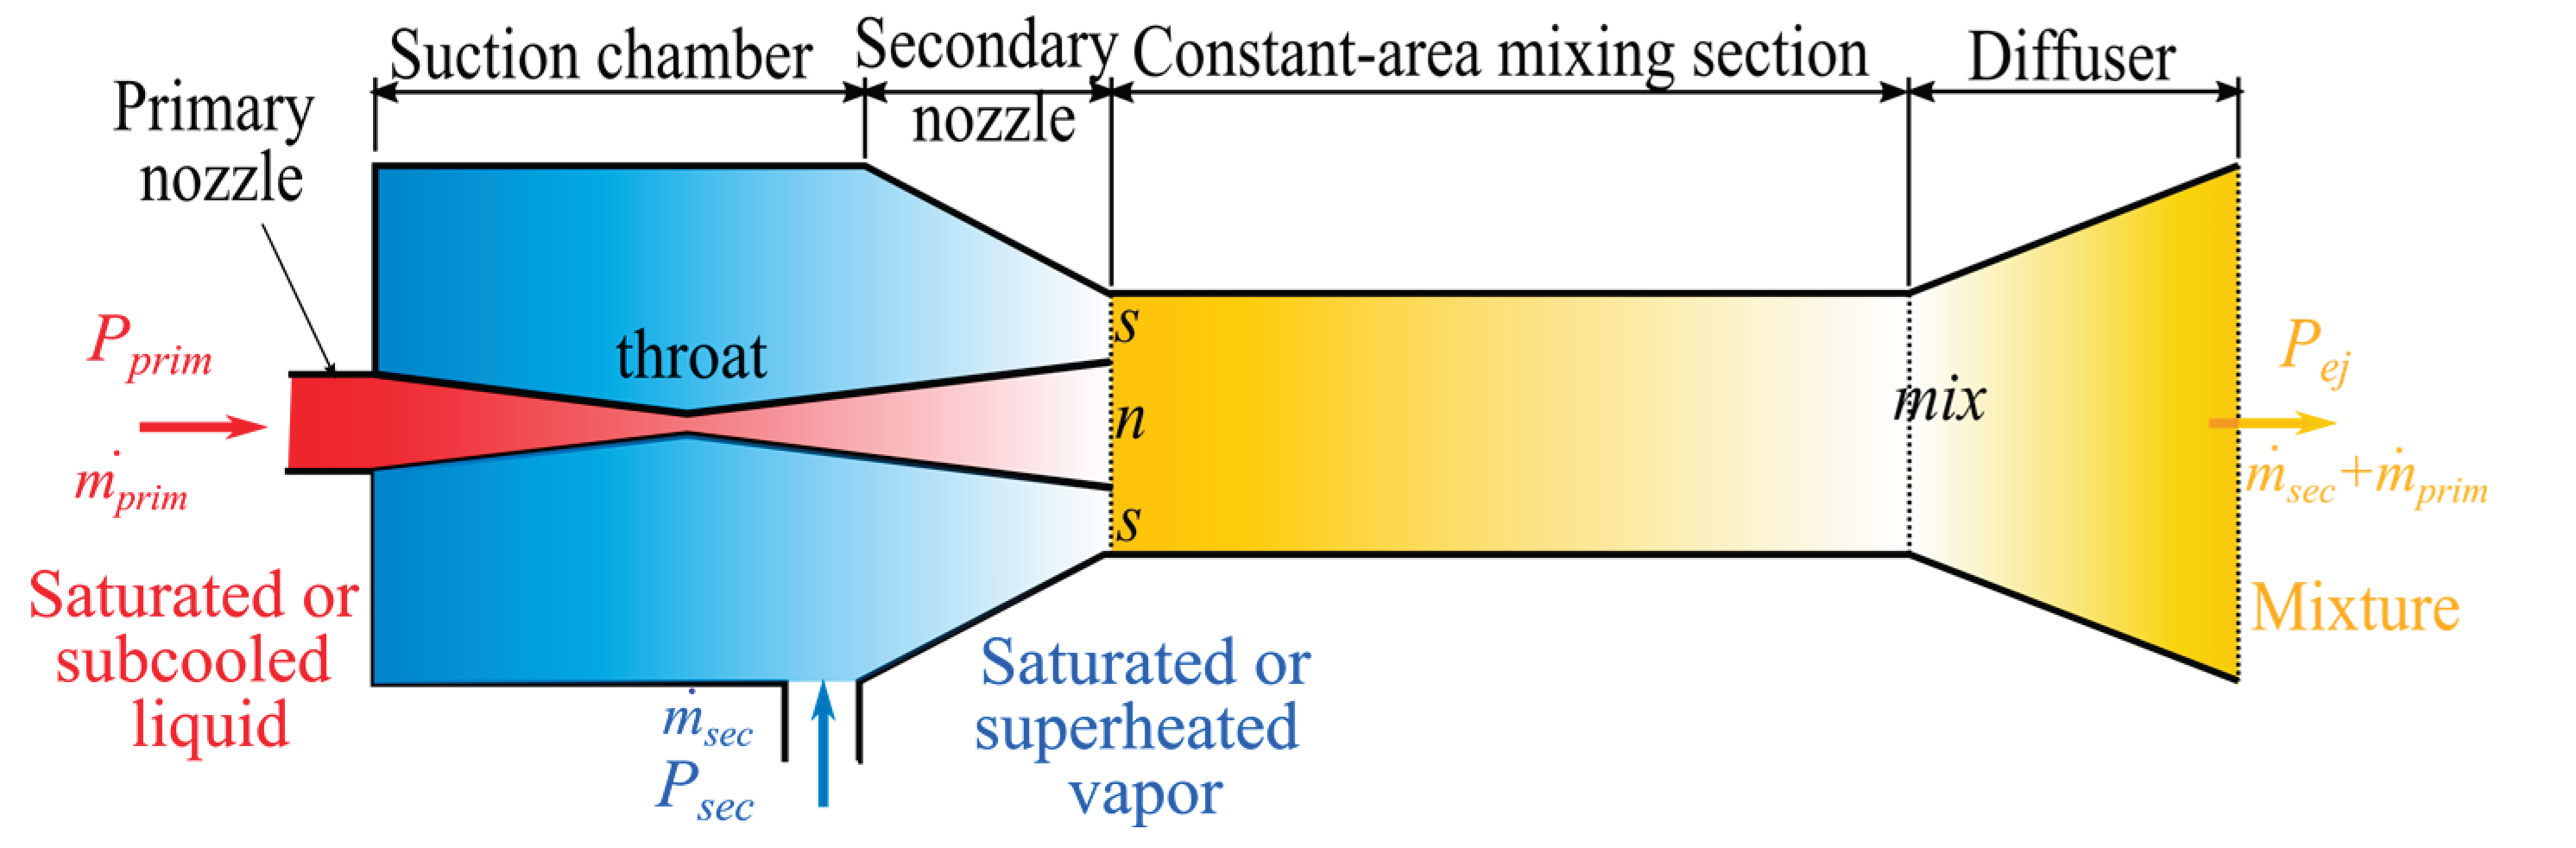
Figure 2.
(a) Schematic of ejector-expansion refrigeration cycle (EERC); (b) P − h diagram.
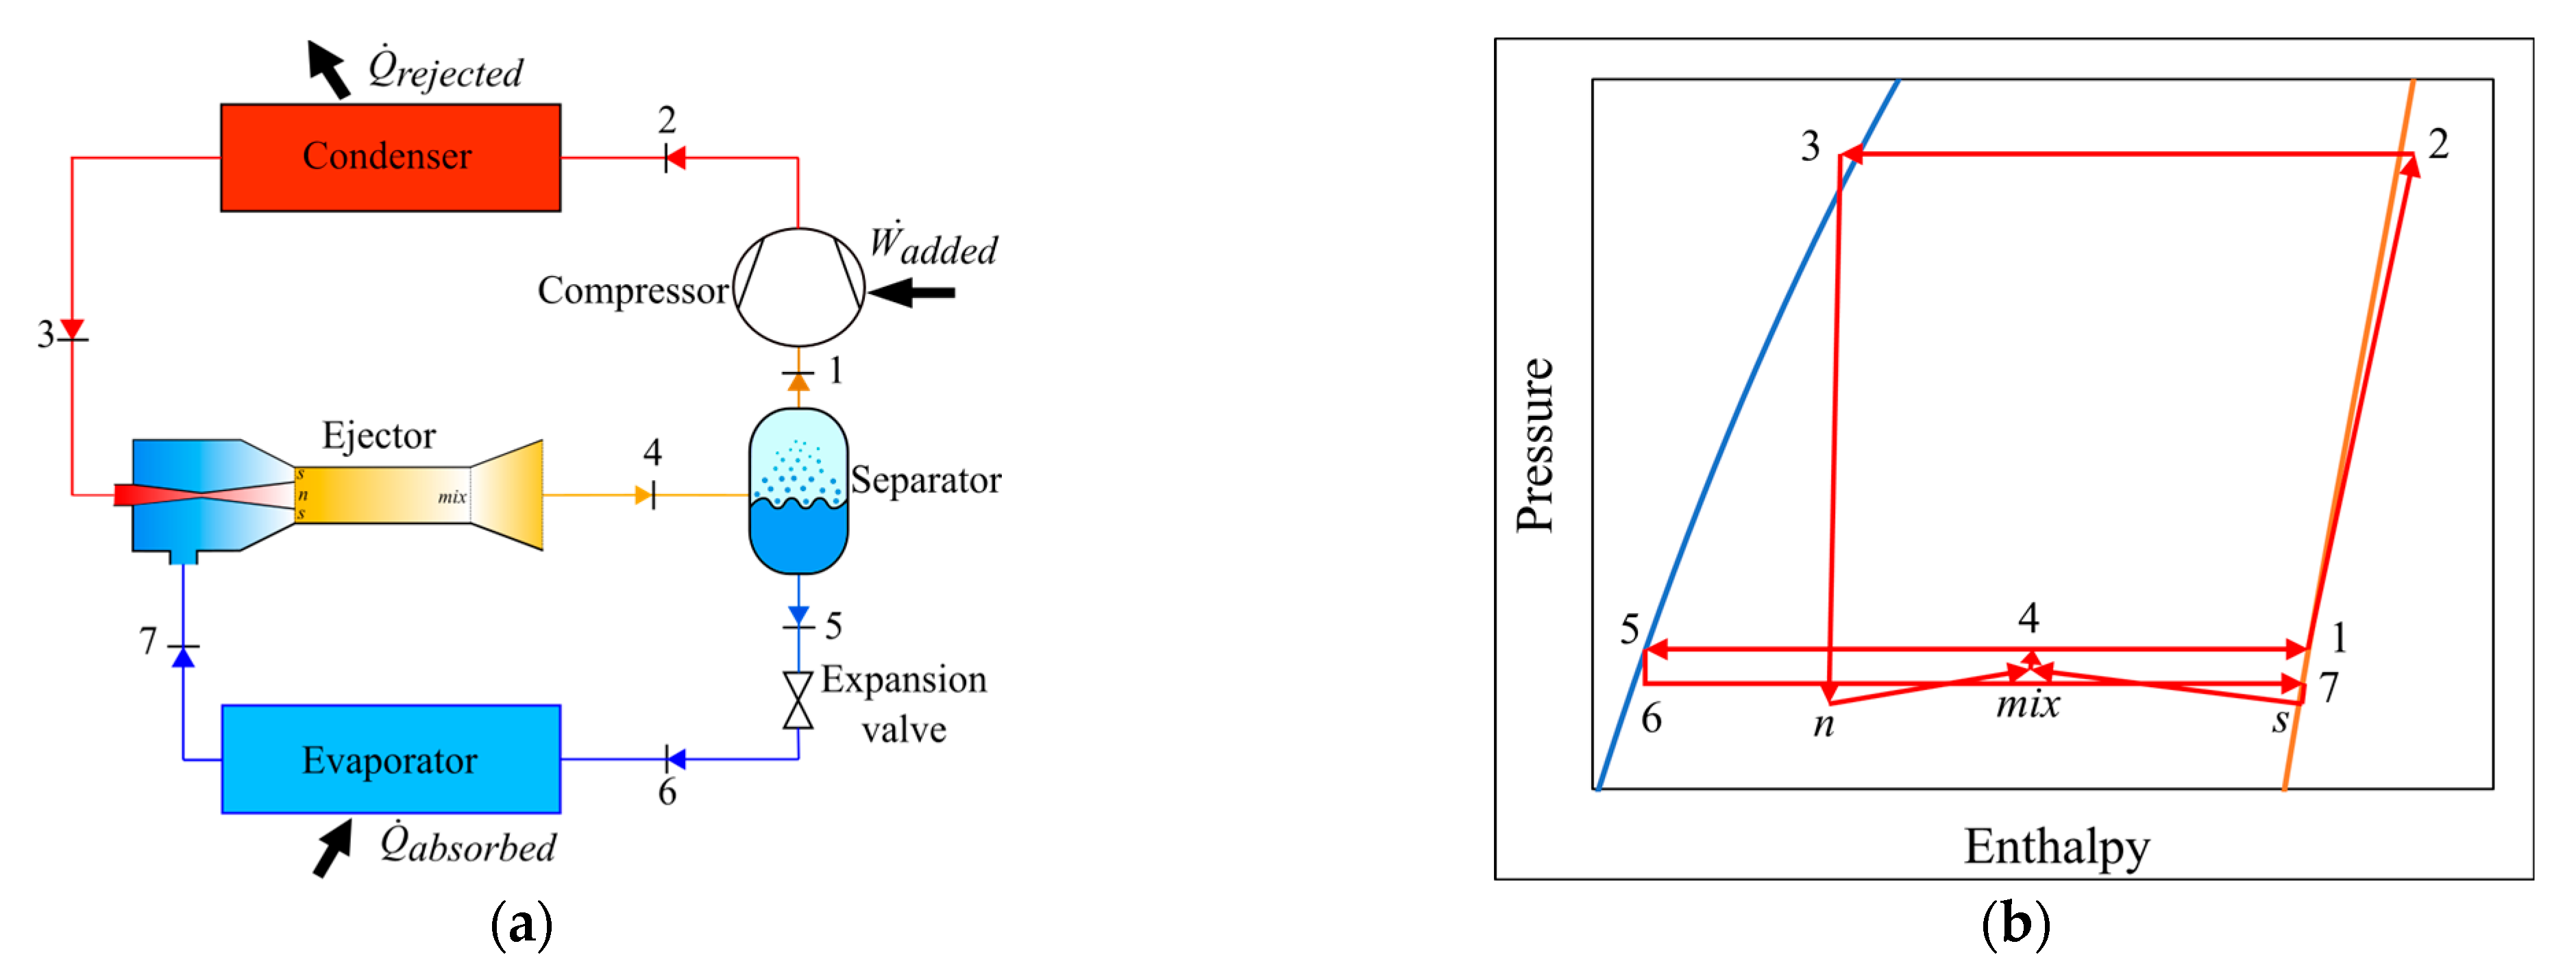
Figure 3.
Speed of sound during two-phase flow as a function of vapor quality.
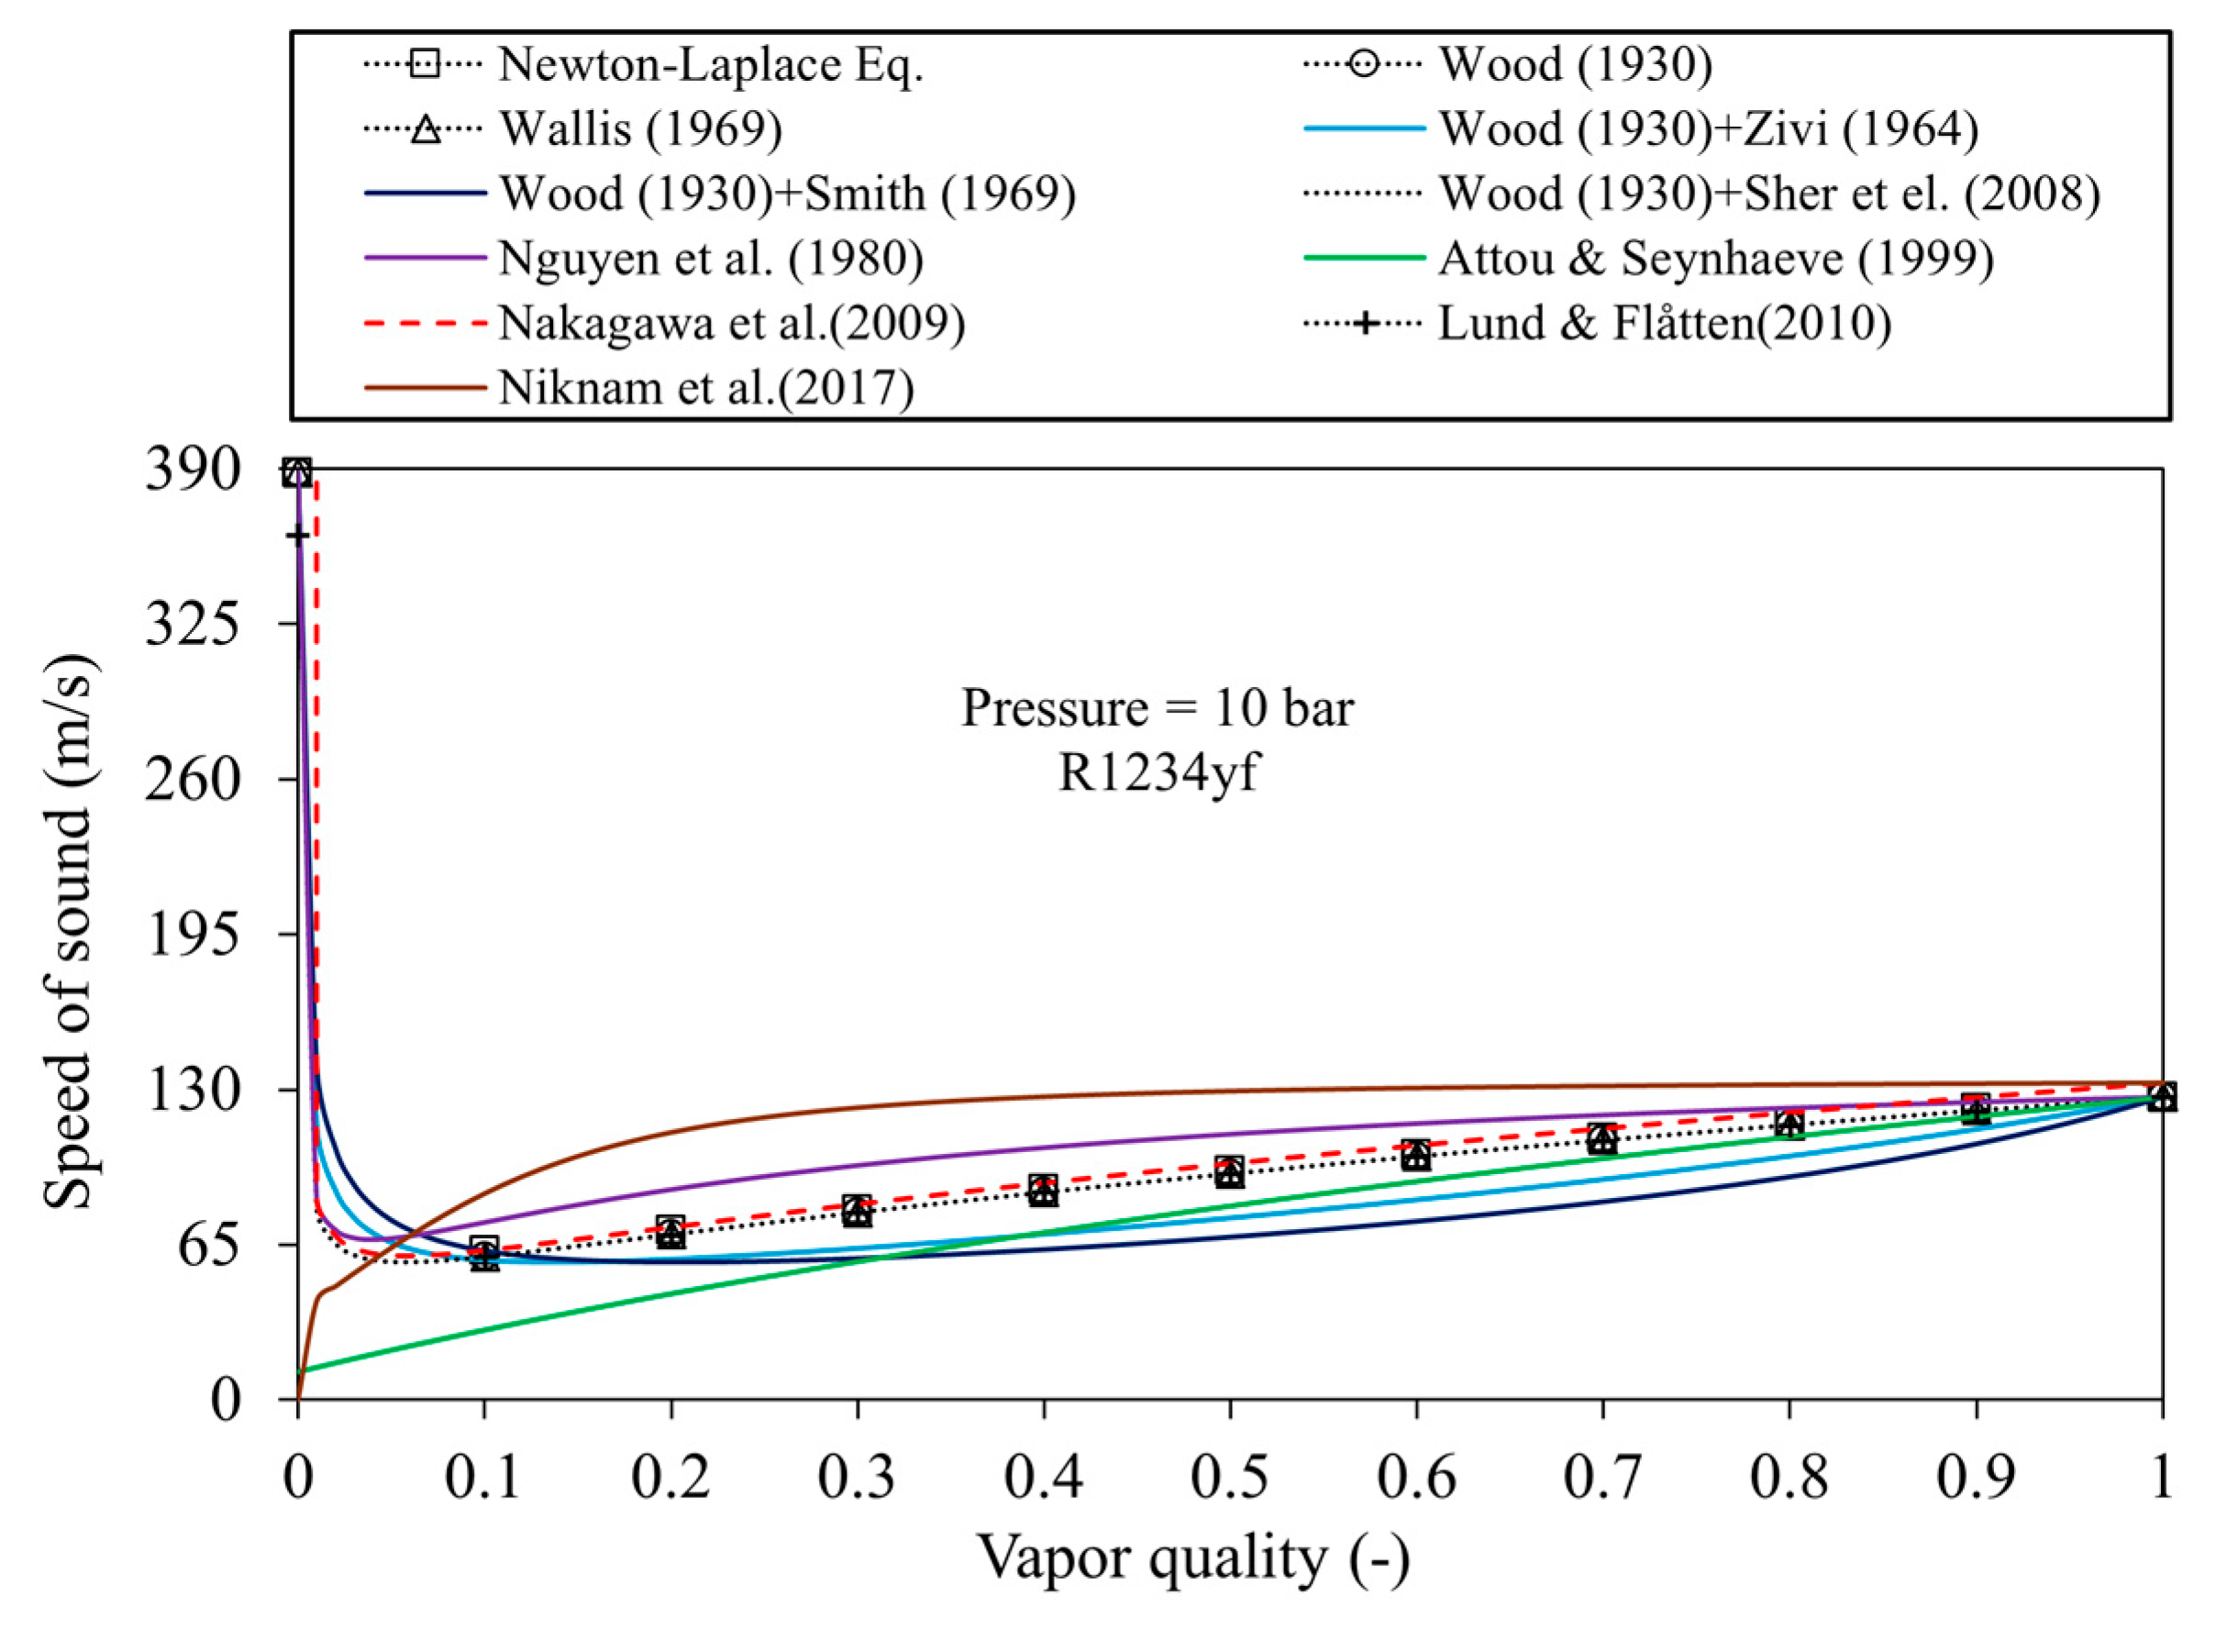
Figure 4.
Primary nozzle: (Left) control volume between inlet and throat, (Right) control volume between throat and exit.
Figure 4.
Primary nozzle: (Left) control volume between inlet and throat, (Right) control volume between throat and exit.
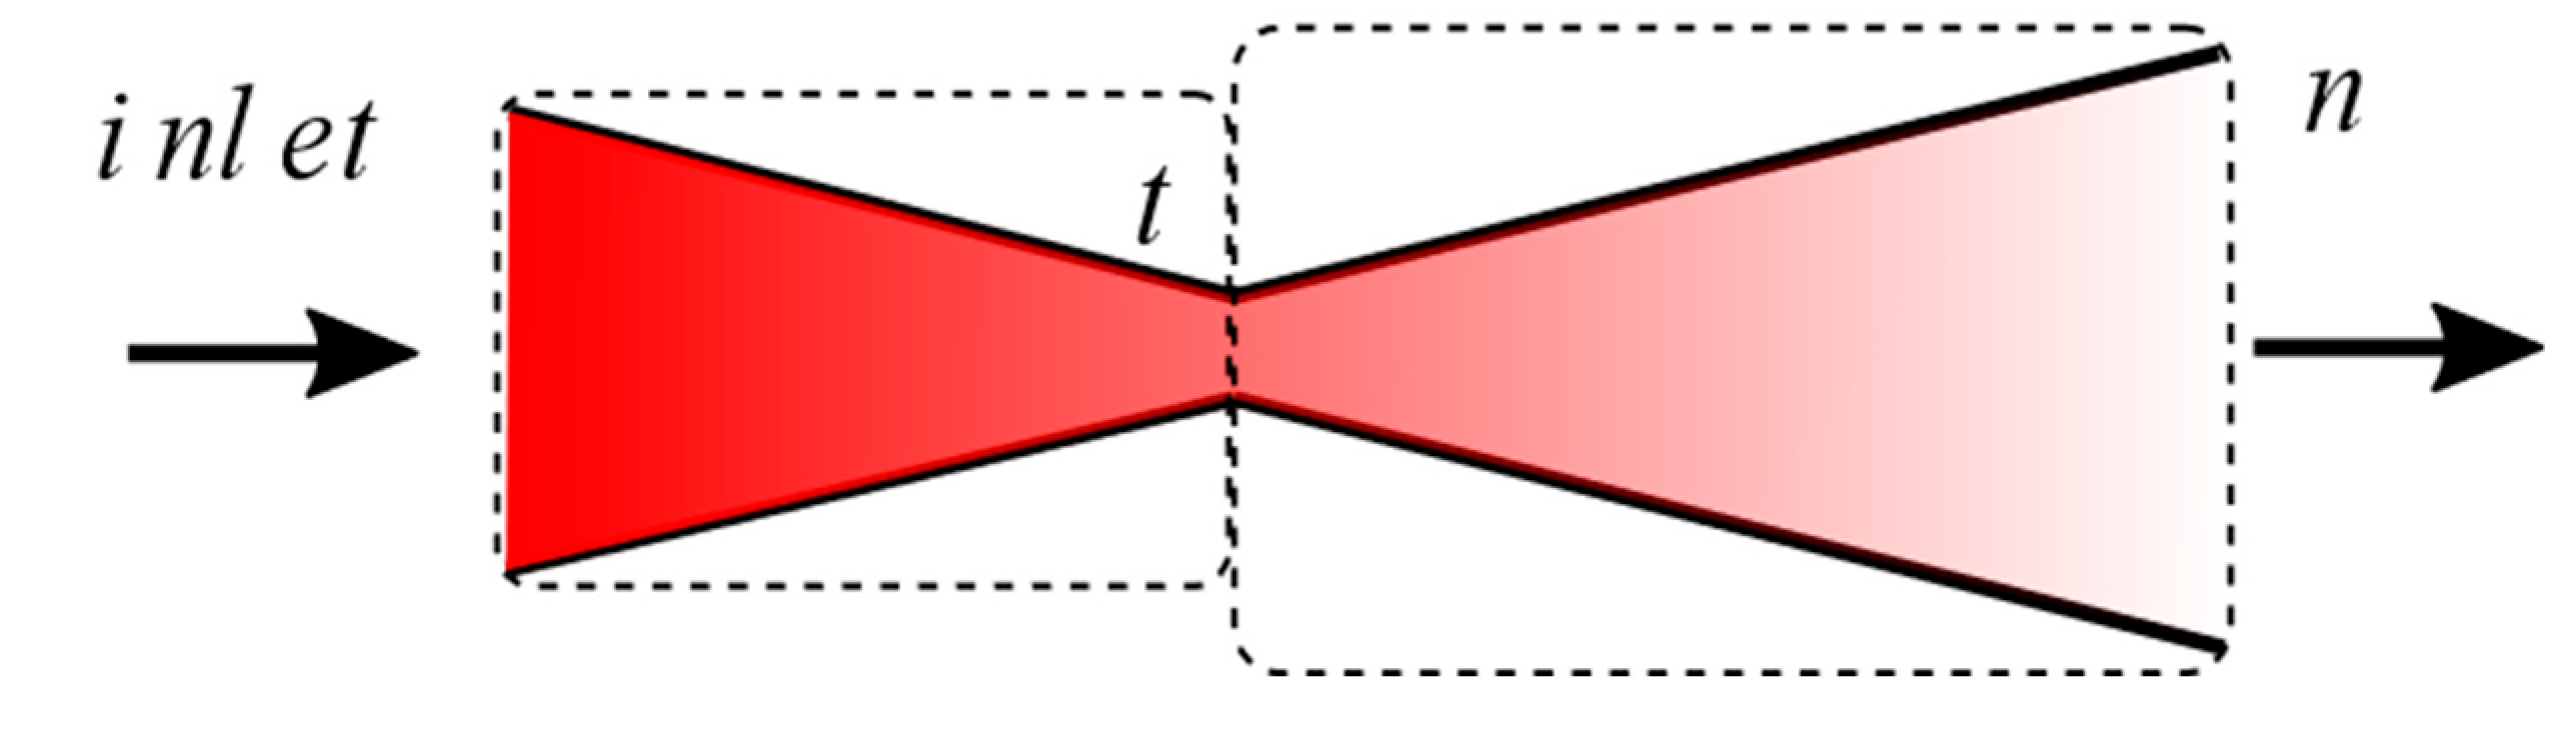
Figure 5.
Simulation flowchart of the 0D modeling of the two-phase ejector.
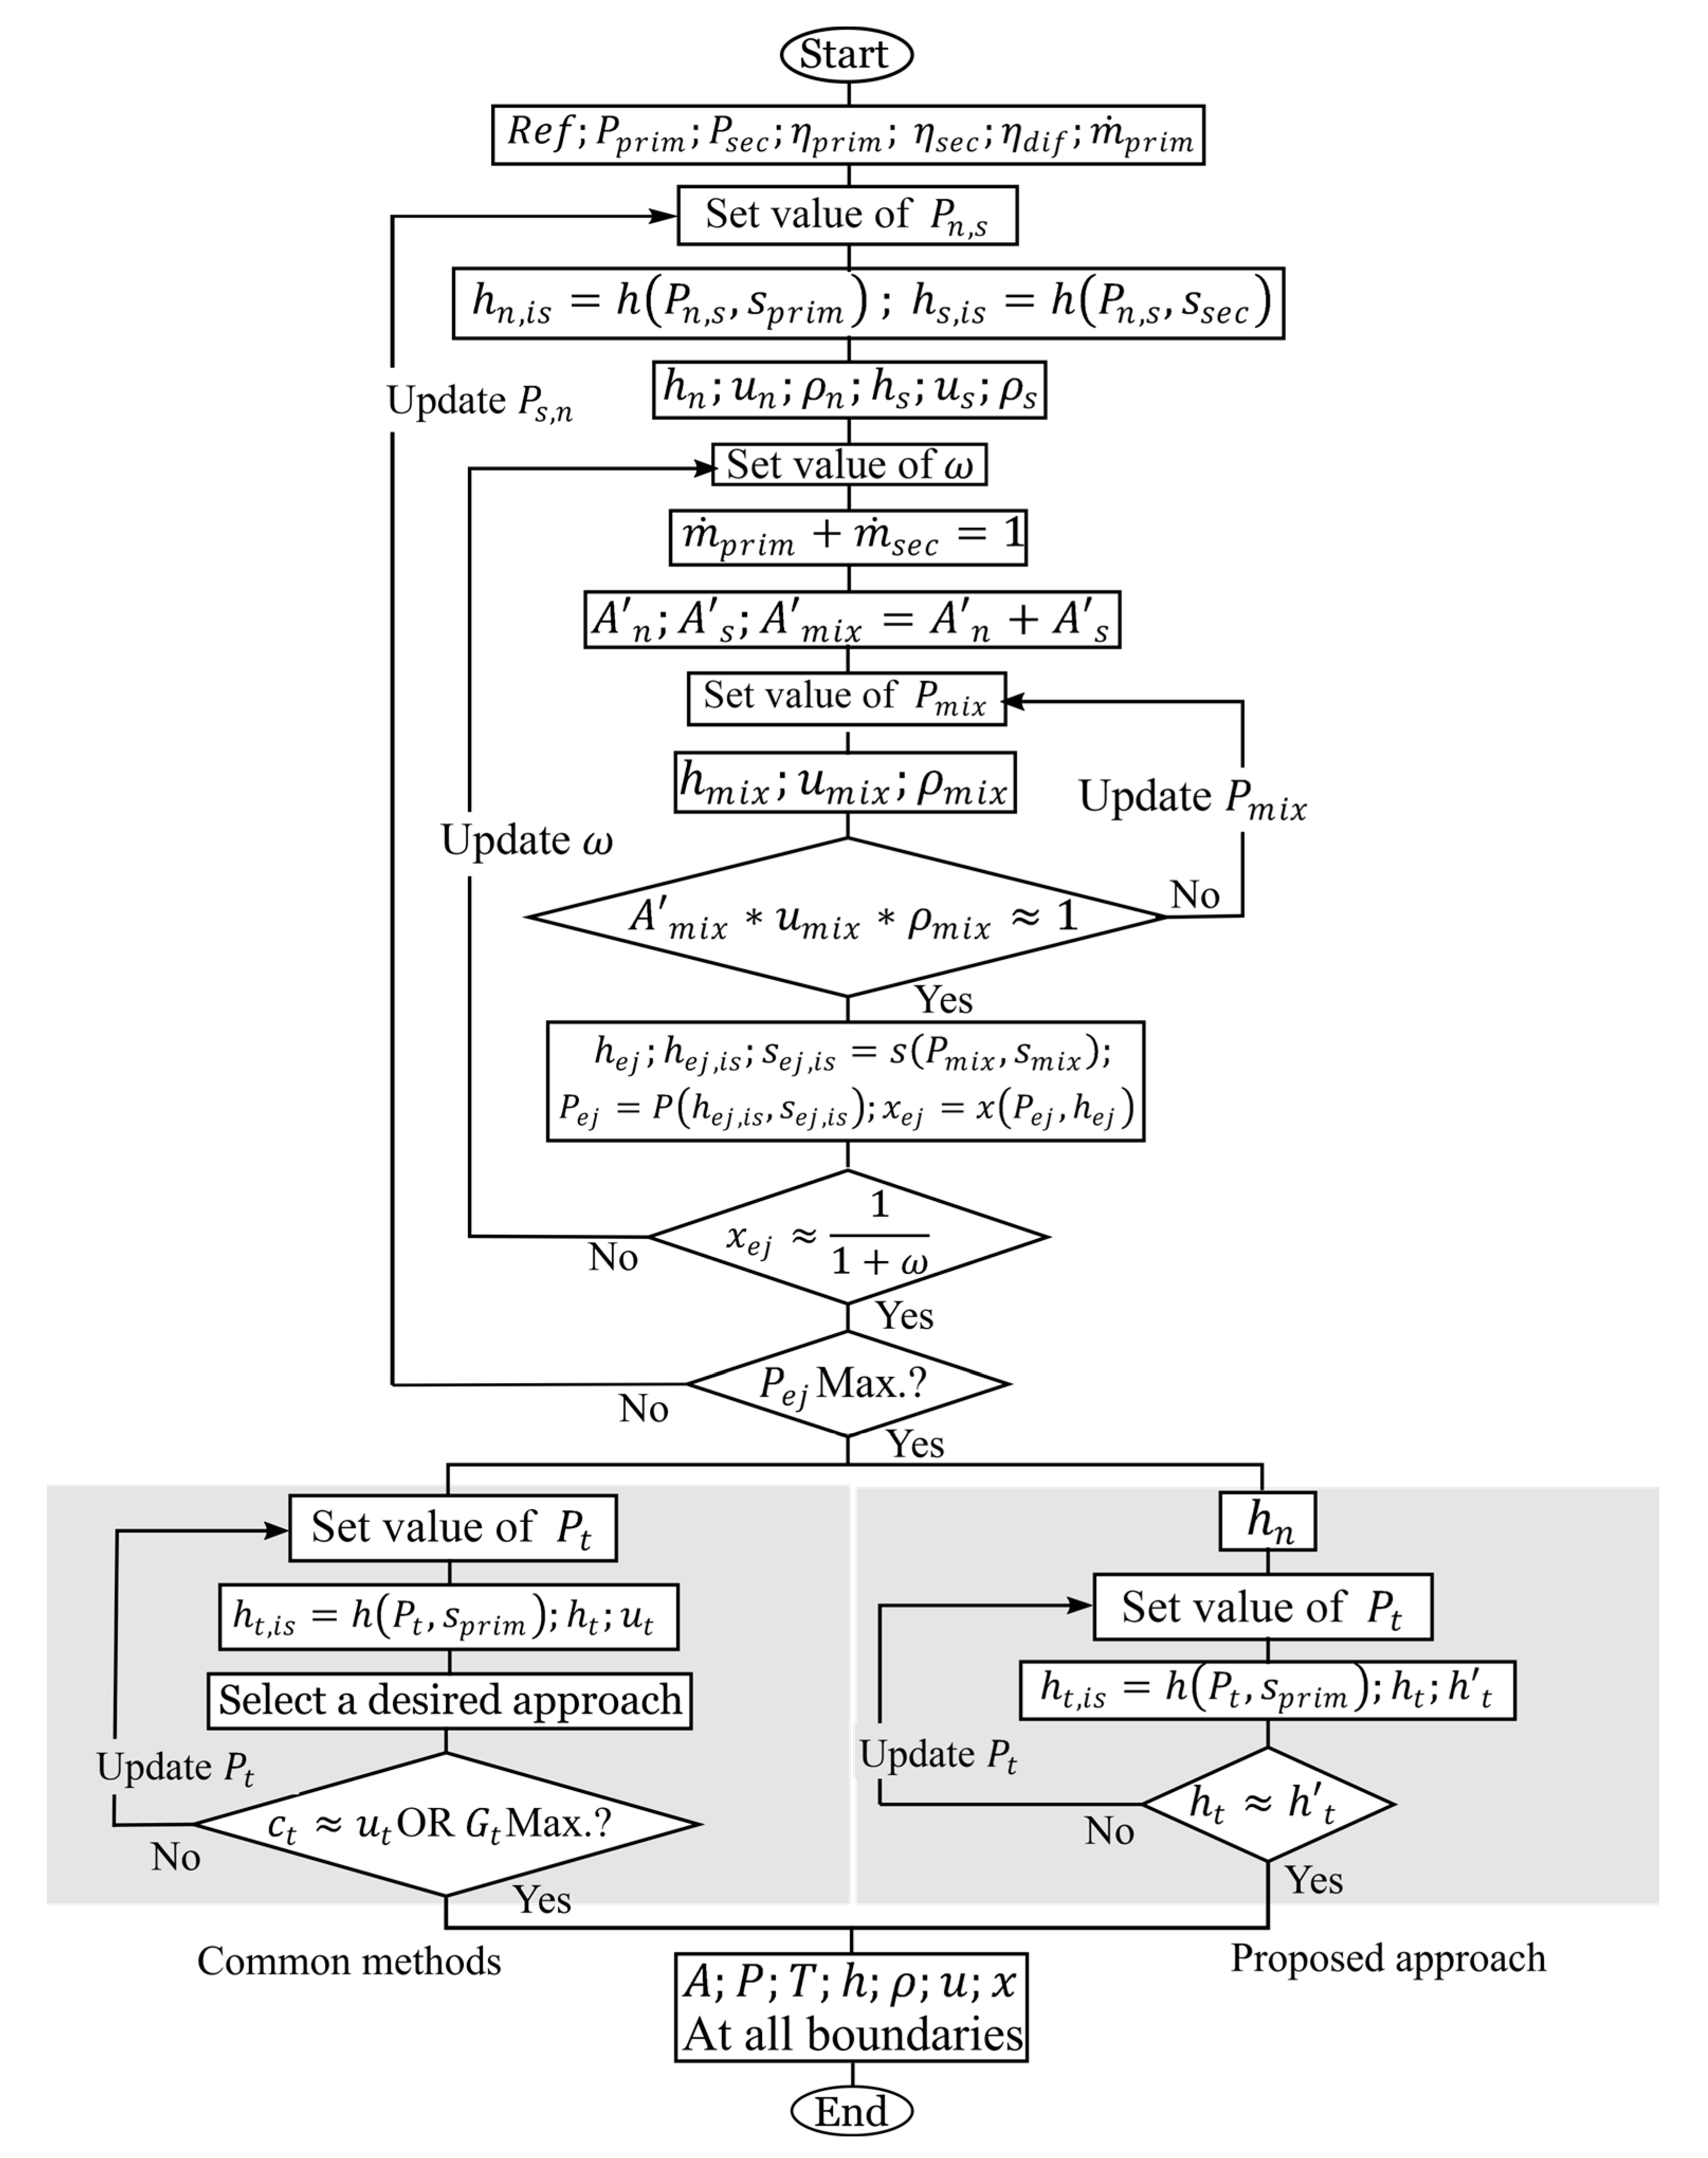
Figure 6.
Validation of the two-phase ejector 0D model using experimental data from Ersoy and Sag [27]. The accuracy of the pressure lift ratio is ±0.35 %, compressor power ±1 %, and temperature ±0.5 °C. The uncertainty of the
Figure 6.
Validation of the two-phase ejector 0D model using experimental data from Ersoy and Sag [27]. The accuracy of the pressure lift ratio is ±0.35 %, compressor power ±1 %, and temperature ±0.5 °C. The uncertainty of the
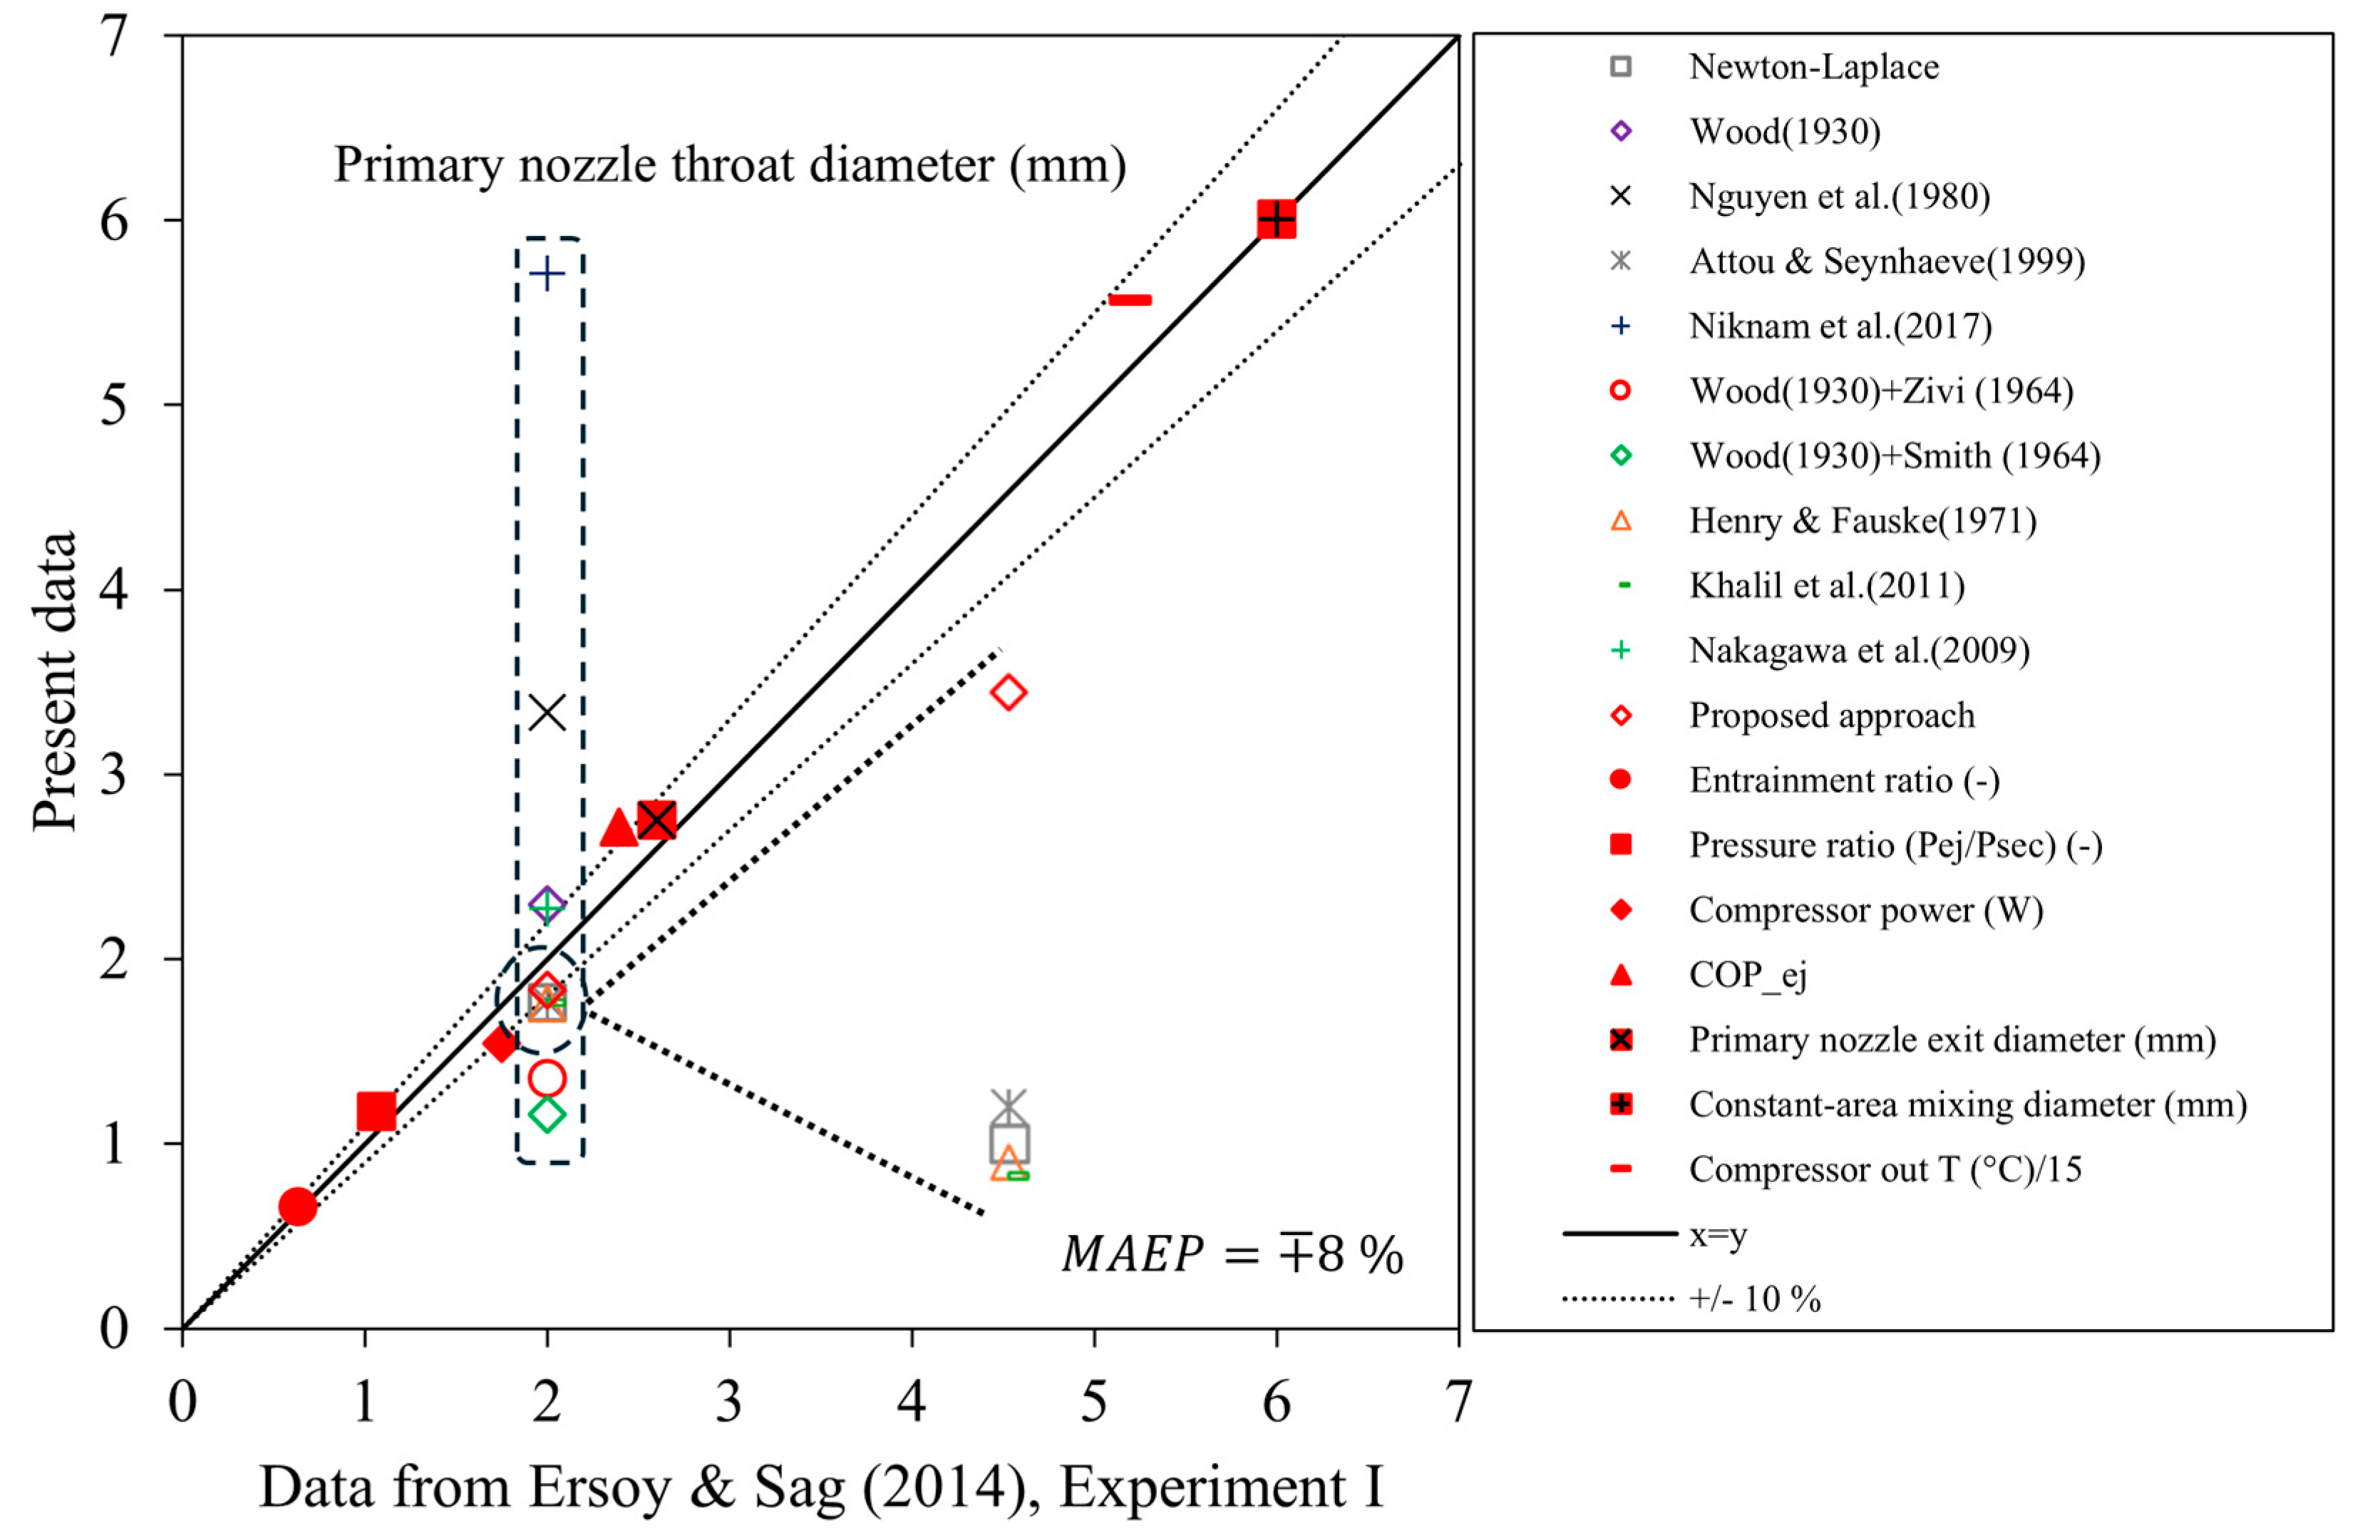
Figure 7.
Validation of the two-phase ejector 0D model with experimental data from Ameur et al. [28]. The uncertainty of the entrainment ratio is ±0.8 %, pressure lift ratio is ±0.11 % and the uncertainty of geometrical parameters were not reported in [28].
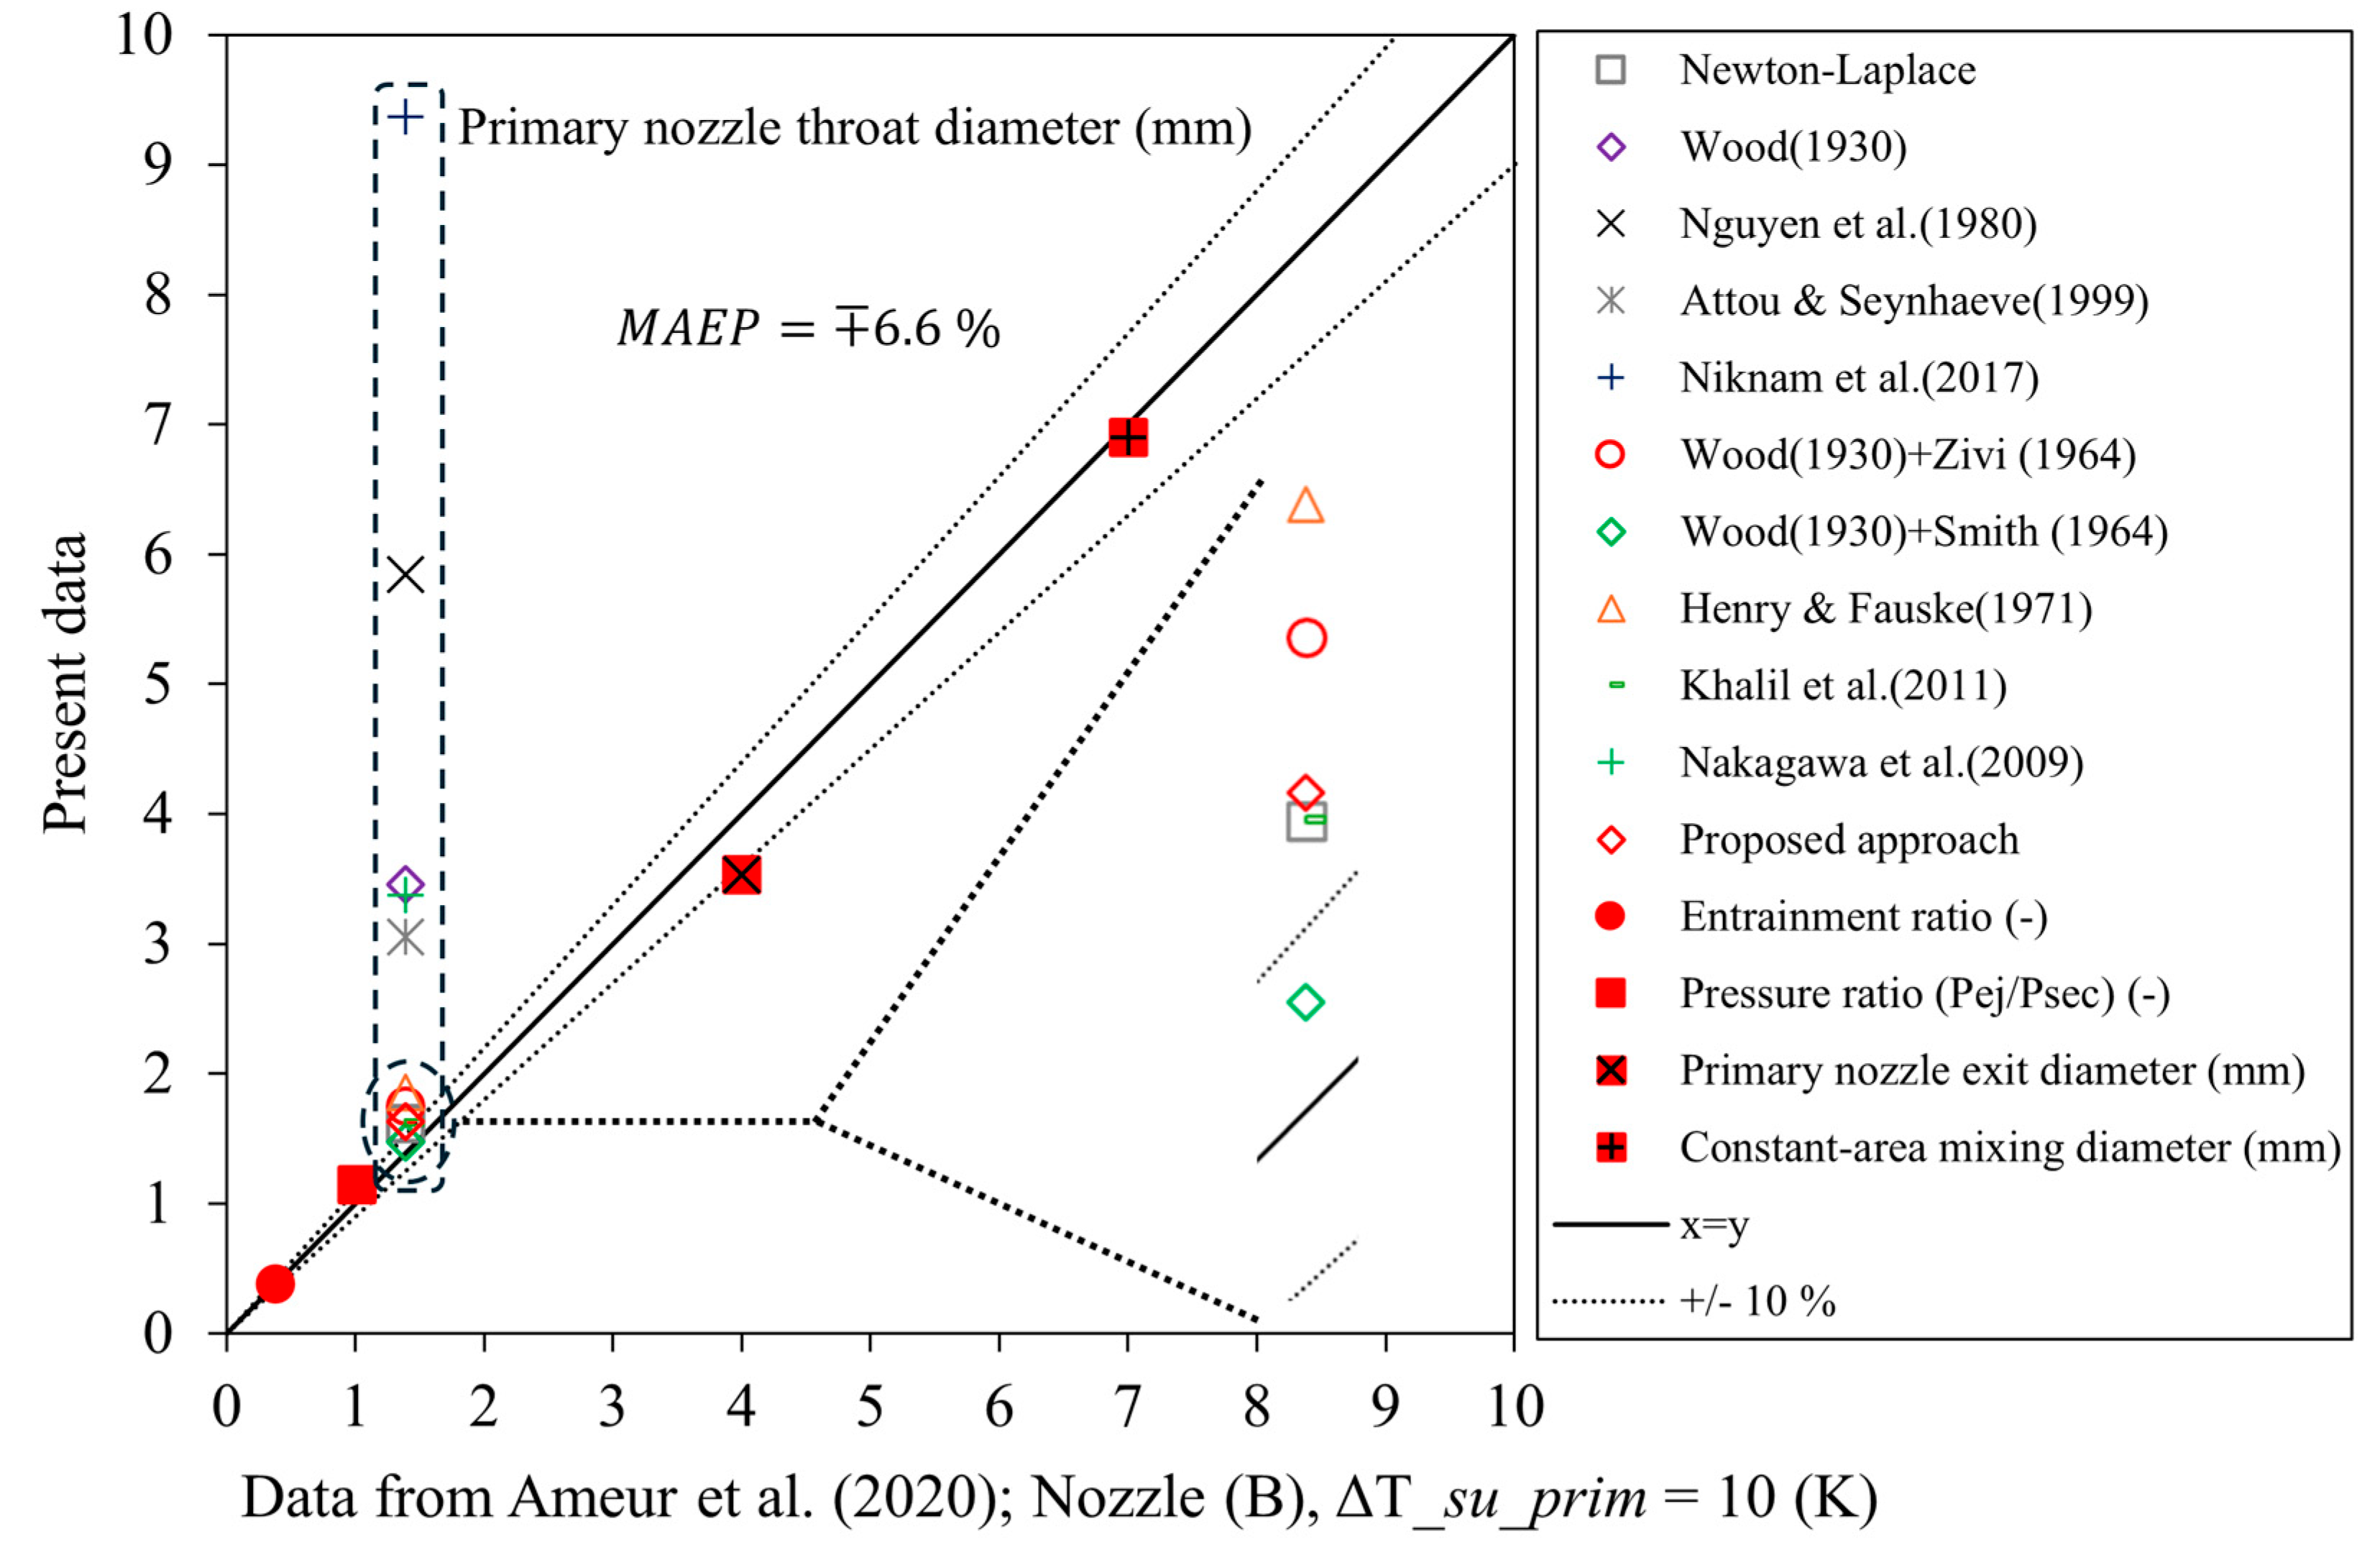
Figure 8.
Primary nozzle area ratio as a function of primary and secondary pressure and the primary nozzle efficiency, (a) R1234yf as refrigerant; (b) CO2 as refrigerant.
Figure 8.
Primary nozzle area ratio as a function of primary and secondary pressure and the primary nozzle efficiency, (a) R1234yf as refrigerant; (b) CO2 as refrigerant.
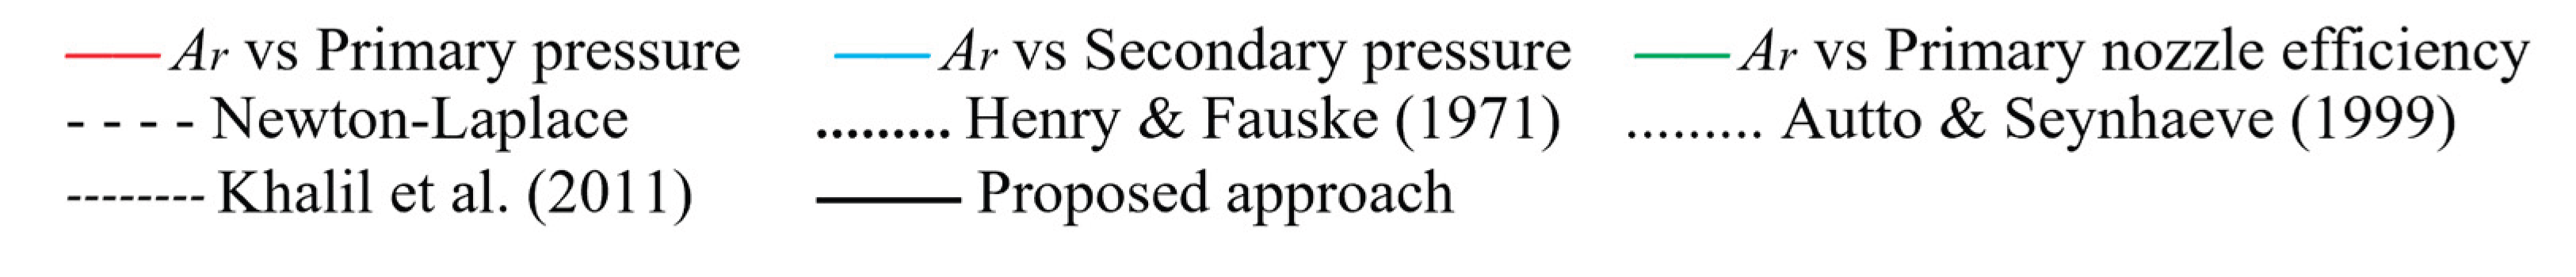
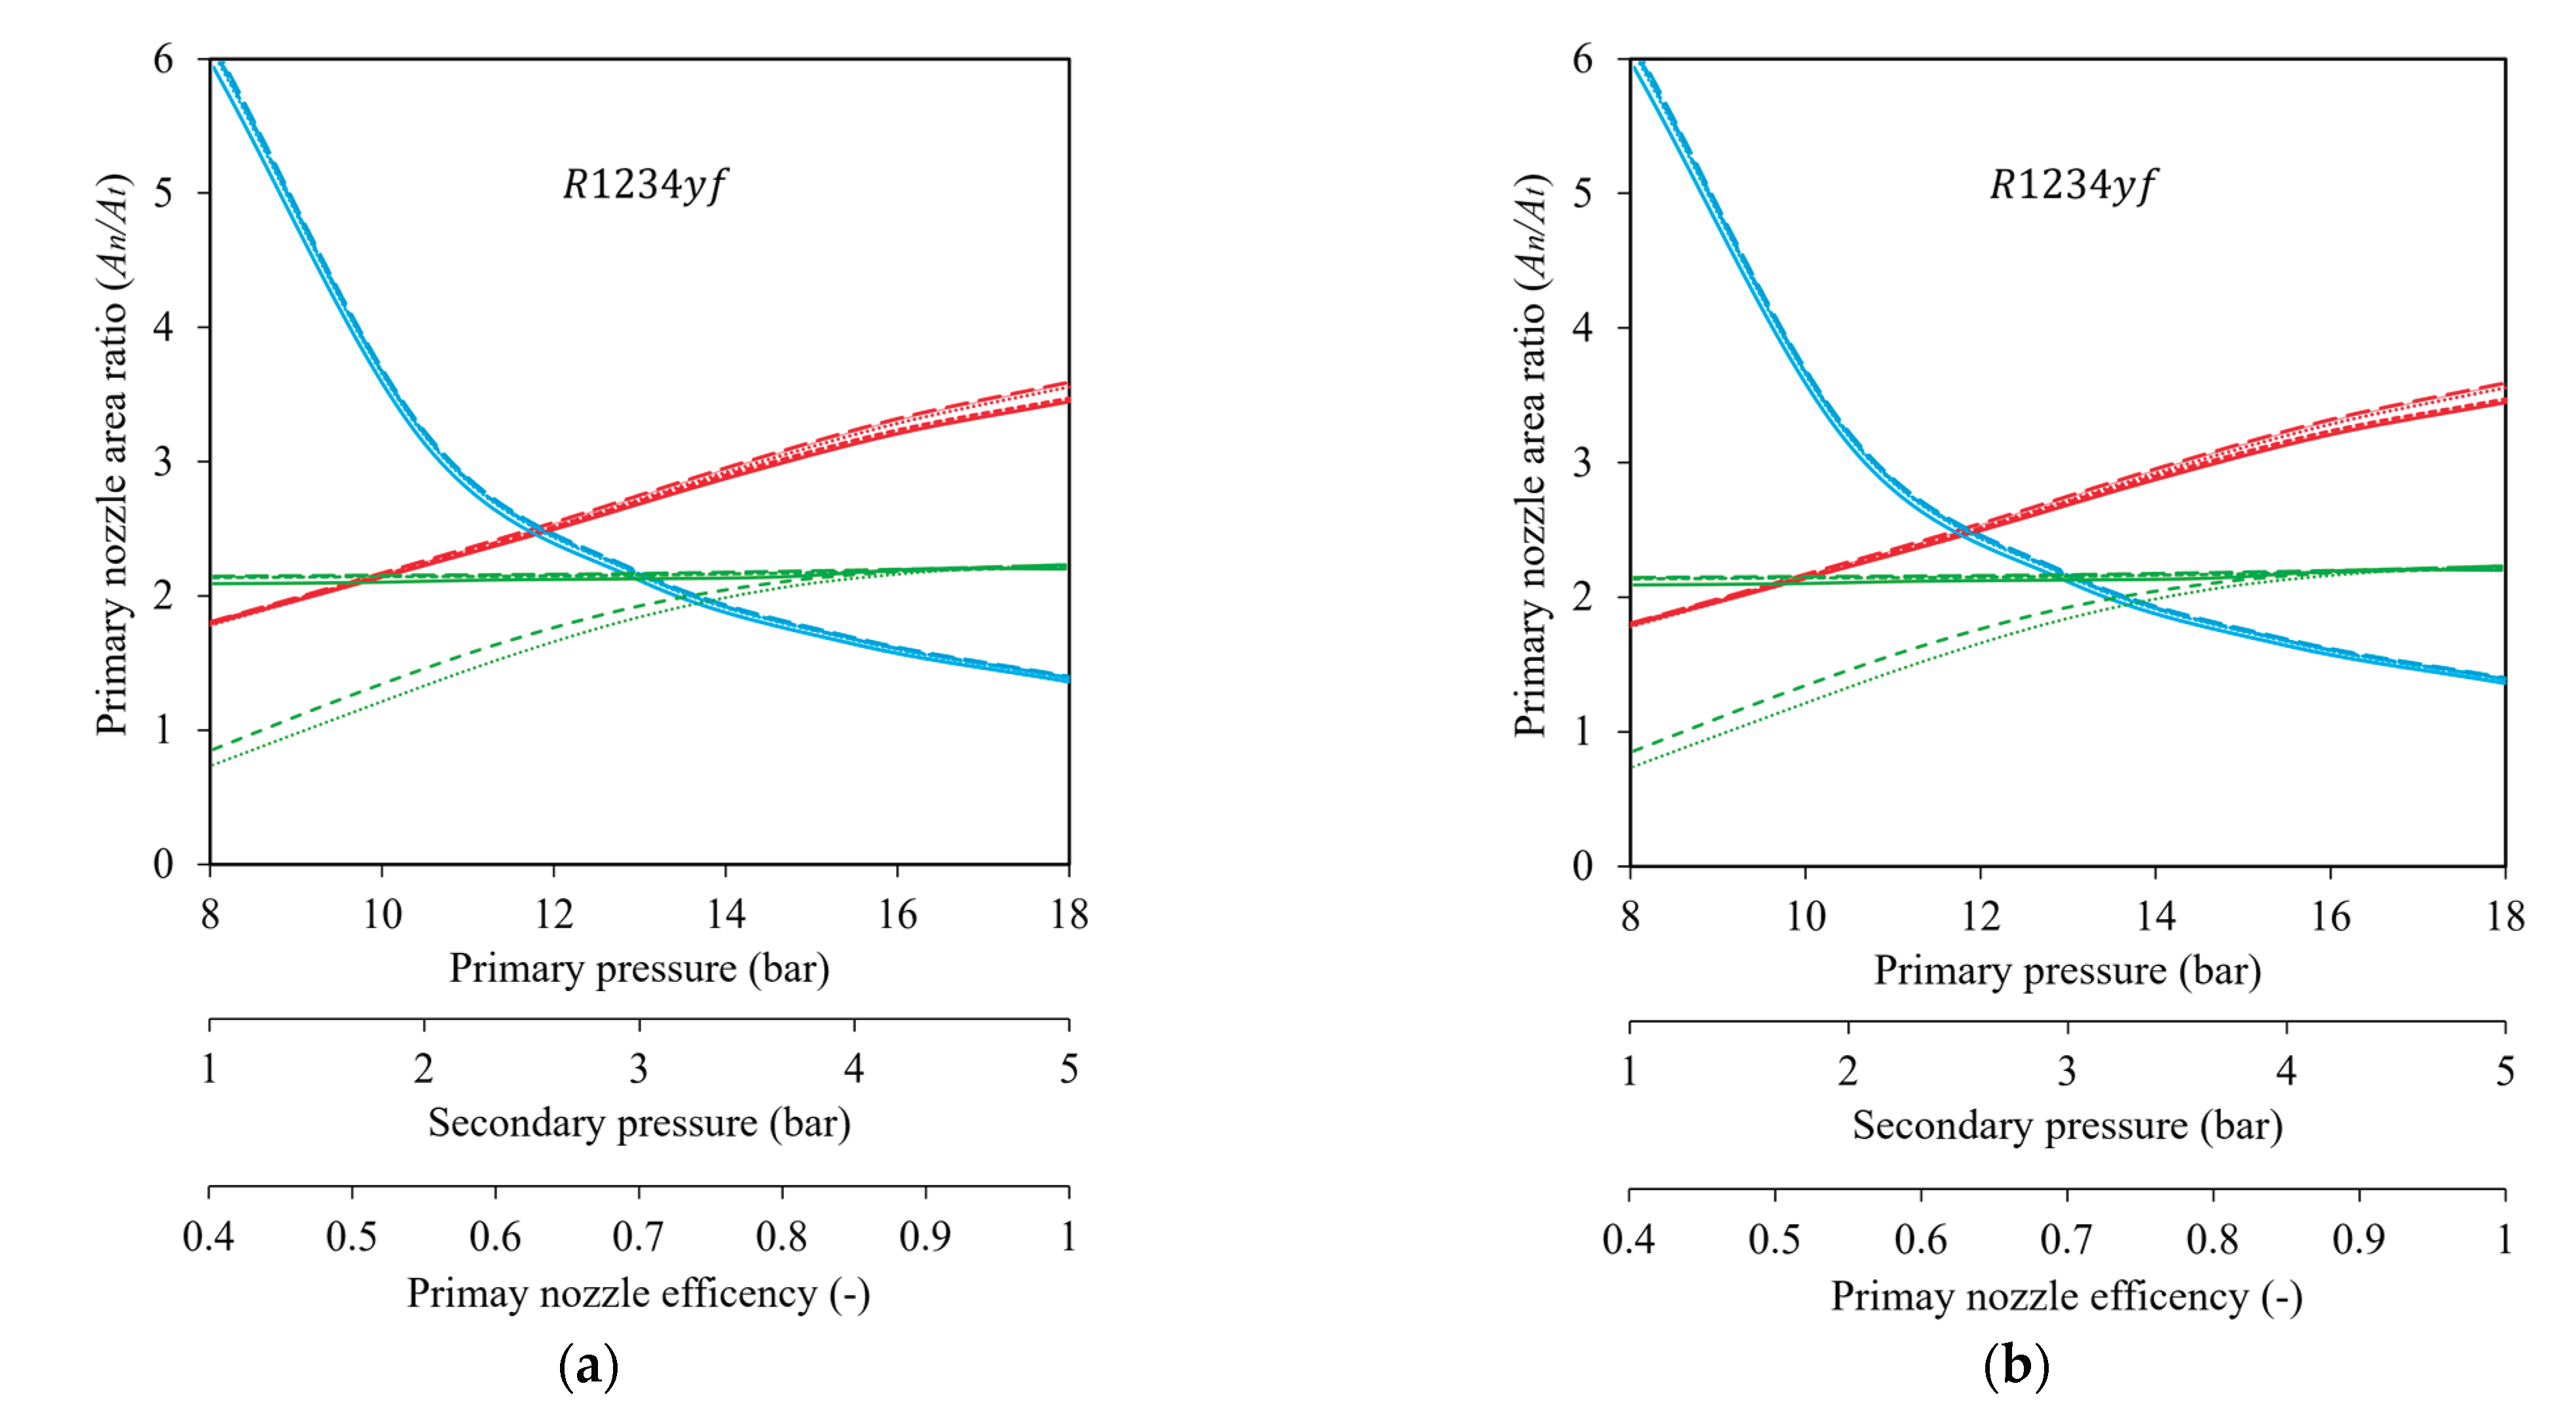

Table 1.
Deviation of the estimated (est.) primary nozzle throat pressure from the experimental value reported by Nakagawa et al. [29].
Table 1.
Deviation of the estimated (est.) primary nozzle throat pressure from the experimental value reported by Nakagawa et al. [29].
| Approach | (bar) | ∆ (%) | |
|---|---|---|---|
| Nakagawa et al. (2009) [29] | est. | ||
| Newton-Laplace Wood (1930) [9] Wood (1930) [9]+ Zivi (1964) [18] Wood (1930) [9]+Smith (1969) [19] Henry and Fauske (1971) [11] Nguyen et al. (1980) [12] Attou and Seynhaeve (1999) [13] Nakagawa et al. [14] Khalil et al. (2011) [16] Niknam et al. (2017) [17] Proposed approach |
64.8* | 51.1 28.3 32.0 33.4 57.4 18.5 49.2 33.2 51.4 17.7 69.1 |
+21 -56 -51 -48 -11 -71 -24 -49 -21 -73 +7 |
The comparative analysis reveals significant disparities among the models, with deviations ranging from -73 % to +7 %. The proposed approach demonstrates the closest agreement with the experimental data, yielding a minimal deviation of +7 %. The non-equilibrium critical mass flux model by Henry and Fauske [11] follows, with a deviation of -11 %. The classical Newton-Laplace equation overpredicts the pressure by +21 %. The model of Niknam et al. [17] shows the largest under prediction at -73 % followed by Nguyen et al. [12] at -71 %. The remaining correlations yielded deviations ranging from -21 % to -56 %.
Table 2.
Parametric study conditions for nozzle design.
| Working fluid | Case | Varied parameter | Range | Fixed conditions |
|---|---|---|---|---|
| R1234yf | 1 2 |
Primary pressure Secondary pressure |
8–18 bar 1–5 bar |
= 3 bar, = 0.9 = 10 bar, = 0.9 |
| 3 | Nozzle efficiency | 0.4–1 | = 10 bar, = 3 bar | |
| CO2 | 1 2 |
Primary pressure Secondary pressure |
52–60 bar 7–15 bar |
= 9 bar, = 0.9 = 60 bar, = 0.9 |
| 3 | Nozzle efficiency | 0.4–1 | = 60 bar, = 9 bar |
Disclaimer/Publisher’s Note: The statements, opinions and data contained in all publications are solely those of the individual author(s) and contributor(s) and not of MDPI and/or the editor(s). MDPI and/or the editor(s) disclaim responsibility for any injury to people or property resulting from any ideas, methods, instructions or products referred to in the content. |
© 2025 by the authors. Licensee MDPI, Basel, Switzerland. This article is an open access article distributed under the terms and conditions of the Creative Commons Attribution (CC BY) license (http://creativecommons.org/licenses/by/4.0/).
Copyright: This open access article is published under a Creative Commons CC BY 4.0 license, which permit the free download, distribution, and reuse, provided that the author and preprint are cited in any reuse.


