
Submitted:
17 December 2025
Posted:
19 December 2025
You are already at the latest version
Abstract
Background/Objectives: This study assessed the clinical effects of preoperative neoadjuvant bevacizumab (neoBev) on newly diagnosed glioblastoma (GB) and investigated imaging-based predictors of outcome. Methods: We retrospectively reviewed 33 patients who received neoBev (10 mg/kg) between 2015 and 2024. Surgery was performed 21–30 days after treatment. Controls comprised 33 patients treated with standard chemoradiotherapy (radiation plus temozolomide) selected through propensity score matching. We assessed changes in performance status, extent of resection (EOR), and volumetric alterations on gadolinium-enhanced T1-weighted imaging (T1Gd) and fluid-attenuated inversion recovery (FLAIR). Median progression-free survival (mPFS) and median overall survival (mOS) were compared. Imaging responders were defined using receiver operating characteristic-derived thresholds. Results: All patients had GB (31 with isocitrate dehydrogenase (IDH)1 wild-type, 2 with IDH-mutant). Median Karnofsky Performance Status improved significantly after treatment in the NeoBev group (from 71 to 83), but remained unchanged in Controls. After matching, mPFS and mOS were 10.2 and 17.9 months with neoBev, and 13.3 and 18.2 months in Controls, respectively. Within the neoBev cohort, T1Gd responders (>37% reduction) achieved longer mPFS and mOS than non-responders. EOR-stratified analysis showed that outcomes favored standard therapy in cases with gross total resection, while subtotal resection cases demonstrated comparable or slightly better OS with neoBev. Conclusions: Preoperative neoBev improved functional status and identified an imaging-defined subgroup with favorable prognosis, although survival was not superior to that with standard therapy. NeoBev may benefit selected patients with limited resectability of newly diagnosed GB.

Keywords:
angiogenesis
; expanding perifocal edema
; glioblastoma
; neoadjuvant bevacizumab
; overall survival
1. Introduction
Vascular endothelial growth factor (VEGF) promotes endothelial proliferation and increases vascular permeability. As a monoclonal antibody against VEGF, bevacizumab (Bev) can reduce both tumor volume and perifocal edema in glioblastoma (GB). This may lead to reduced contrast enhancement and decreased hyperintensity volume on fluid-attenuated inversion recovery (FLAIR) imaging [1]. These effects are consistent with prior clinical imaging studies in glioblastoma, which showed that pharmacologic VEGF receptor blockade rapidly normalized tumor vasculature and alleviated edema [2]. These effects might lessen the surgical burden by decreasing vascularity and improving cerebral edema. Indeed, neoBev therapy has been shown to reduce tumor size and enhance therapeutic response in several cancers [3,4,5,6].
Based on a prior prospective Phase II study, we observed significant reductions in tumor vascularity and brain swelling without severe adverse events [1]. Given the volume reduction rates achieved with preoperative neoBev, a larger decrease in volume seen on T1-weighted imaging with gadolinium enhancement (T1Gd) compared to FLAIR was associated with a tendency toward longer median overall survival (mOS) after neoBev. These results suggest that the volume reduction of FLAIR abnormalities may be a pseudo-response. That volume reduction on T1Gd offers a more reliable indicator of neoBev response, which could be linked to mOS [1]. The effect of neoBev on FLAIR image changes has not been definitively identified as a reliable marker.
Development of surgical techniques with a supporting system and therapeutic stratification based on molecular diagnosis has been shown to improve clinical outcomes for GB [7,8]. Preoperative neoBev could help decrease the difficulty and morbidity of tumor resection, particularly in specific situations, including bulky hypervascular tumors with a complex network of feeding arteries with edema extending into eloquent areas. However, the initial response to one-shot Bev did not always reflect improvement in OS.
The initial exploratory evaluation of neoBev in resectable GB was conducted as a single-arm study, primarily to establish the feasibility, safety, and short-term radiographic effects before surgery. In contrast, the present investigation was designed as a retrospective comparative analysis to determine whether the clinical applicability of neoBev could be extended beyond feasibility alone. To contextualize the potential benefits, we compared neoBev with conventional standard therapy (comprising radiation therapy [RT] with concomitant temozolomide [TMZ]) using propensity score matching (PSM) to approximate a balanced comparison in selected clinical scenarios.
In addition, the additive benefit of neoBev was considered to alter the tumor microenvironment, including oxygenation and stemness, before and after Bev therapy in newly diagnosed GB using paired samples [9,10,11]. As reported previously, immune regulatory cells and checkpoint molecules were also compared during Bev therapy [10,12]. In neoBev (i.e., during the effectiveness of Bev), tumor oxygenation, a decrease in stem cell population, and an immunosupportive tumor microenvironment (TME) were observed, compared with naïve and refractory states to Bev [9,10,12]. We hypothesized that altering the TME with Bev could enhance the efficacy of postoperative adjuvant RT and TMZ therapy, thereby prolonging progression-free survival (PFS) and OS.
This study aimed to evaluate the clinical outcomes of neoBev compared to the standard protocol, which includes surgery and postoperative concurrent RT and TMZ, in patients with newly diagnosed GB. However, whether neoBev offers clinical benefits beyond facilitating surgery (particularly in comparison with modern chemoradiation) remains unknown. No previous research has directly assessed the effects of NeoBev on survival in patients with newly diagnosed resectable GB.
2. Materials and Methods
2.1. Patient Registration
This was a multi-institutional retrospective cohort study. We included 33 consecutive patients who received neoBev at The Jikei University School of Medicine, Keio University Hospital, and Kagawa University Hospital between January 2015 and August 2024. Eligibility criteria were: i) newly diagnosed GB; ii) intention to proceed with maximal safe resection after neoBev; and iii) availability of pre- and post-neoBev MRI suitable for volumetric assessment T1-Gd and FLAIR). Patients with prior cranial RT or TMZ, insufficient imaging, or inadequate clinical follow-up were excluded. When molecular data were available, diagnoses were harmonized with the 2021 World Health Organization classification [13]. Cases without molecular testing were classified according to the integrated histopathological criteria in effect at the time of treatment.
As a control cohort, we used institutional databases to identify 136 consecutive patients with newly diagnosed GB who underwent standard therapy without neoBev at The Jikei University School of Medicine during the same period. Baseline clinical and radiological variables were abstracted uniformly across cohorts. PSM was prespecified to mitigate baseline imbalances and is detailed in the Statistical Analysis section.
Minimum follow-up at the time of analysis was 15 months. Survival endpoints and censoring rules are described below.
All patients (or their legal representatives) provided written informed consent for treatment and the use of de-identified data. The study protocol was approved by the institutional review boards of all participating centers and conducted in accordance with the principles of the Declaration of Helsinki (2013 revision [14].
2.2. Treatment
Preoperative neoBev was administered intravenously at a dose of 10 mg/kg on day 0, as previously described [1]. Maximal safe resection was then scheduled between days 21 and 30 after neoBev, provided no clinical or wound-healing concerns were present. After resection, patients received RT with concurrent and adjuvant TMZ according to the standard published protocol [15] (i.e., a Stupp-type regimen), as per institutional practice.
Extent of resection (EOR) was assessed using T1Gd performed within 72 h after surgery. EOR was classified as: gross total resection (GTR), no measurable residual enhancement; subtotal resection (STR), defined as EOR ≥90%, or partial resection (PR), defined as EOR <90%. Perioperative management (including steroid tapering and venous thromboembolism prophylaxis) followed institutional standards, with particular focus on wound healing and hemorrhagic complications due to prior anti-VEGF exposure.
2.3. Assessments
PFS and OS were assessed in both the NeoBev and Control groups according to Response Assessment in Neuro-Oncology (RANO) criteria. Both median PFS (mPFS) and mOS were calculated from the date of diagnosis (or surgery) to radiographic or clinical progression, or death, whichever occurred first.
Karnofsky Performance Status (KPS) was recorded preoperatively, after neoBev administration, and postoperatively (early recovery or discharge). Changes in KPS (ΔKPS) were analyzed within and between groups to evaluate functional improvement.
Baseline variables—including age, sex, preoperative KPS, tumor location (eloquent vs. non-eloquent), and EOR—were compared between the NeoBev and Control groups. Intergroup imbalances were adjusted using PSM as described in the Statistical Analyses section, and associations with mPFS and mOS were then examined.
Serial brain MRI examinations were obtained at prespecified time points (baseline, post-neoBev, and 72 h postoperatively), as previously described [1]. MRI sequences included T1Gd and FLAIR. In the NeoBev group, volumetric changes in the contrast-enhancing tumor and peritumoral edema were quantified using semi-automated segmentation.
Cutoff values for volumetric change were established using receiver operating characteristic (ROC) analysis. Because of the stepwise nature of ROC curves in this limited sample, optimal thresholds were defined by the shortest Euclidean distance to the upper-left corner of the ROC space (closest-to-(0,1) method), prioritizing a balanced trade-off between sensitivity and specificity. Patients were then classified as good or poor responders according to these thresholds, and mPFS/mOS were compared between responder subgroups. In sensitivity analyses, cutoffs based on the Youden index yielded directionally consistent results.
2.4. Statistical Analyses
Continuous variables are summarized as medians with interquartile ranges, and categorical variables as counts and percentages. Group comparisons were performed using the Mann–Whitney U test for continuous variables and the χ2 test or Fisher’s exact test for categorical variables, as appropriate. Because KPS is an ordinal scale, within-group changes were evaluated using the Wilcoxon signed-rank test.
PFS and OS were estimated using the Kaplan–Meier method, and intergroup differences were assessed with the log-rank test. Median survival times and corresponding 95% confidence intervals (CIs) were reported.
To mitigate baseline imbalances between the NeoBev and Control groups, PSM was performed using a logistic regression model incorporating preoperative KPS and EOR. Nearest-neighbor matching (1:1) with a caliper width of 0.2 was applied, and covariate balance was evaluated using standardized mean differences before and after matching. A caliper width of 0.2 was selected in accordance with standard recommendations to reduce residual bias.
Cutoff values for MRI-based volumetric changes (T1Gd and FLAIR) were determined using ROC curve analysis, with optimal thresholds identified by the closest-to-(0,1) method (upper-left proximity).
In the matched cohort, effect sizes for survival outcomes were further quantified using Cox proportional-hazards models. Hazard ratios (HRs) with 95%CIs were estimated for the NeoBev group versus the Control group. Because matching produces paired observations, robust standard errors were used. All p-values were two-sided, and statistical significance was accepted for values of p<0.05.
All analyses were conducted using R software (version 4.4.1; R Foundation for Statistical Computing, Vienna, Austria) and Stata 14 (StataCorp, College Station, TX, USA).
3. Results
3.1. Baseline Comparison Before and After PSM
Before matching, baseline characteristics were similar between the NeoBev (n = 33) and Control groups (n = 136), except for the extent of resection (EOR), which was significantly higher in the NeoBev group (p < 0.01). No significant differences were observed in age, sex, or preoperative KPS (Table 1). After 1:1 PSM, 33 patients were selected per group, and all prespecified covariates were well balanced (standardized mean differences < 0.10 and p > 0.10 for all; Table 2).
3.2. Cutoff Value Determination for Validation of Neuroradiological Response by NeoBev
We used the therapeutic benchmarks [15] (mPFS 6.9 months, mOS 14.6 months with standard concurrent RT and TMZ) as reference indicators in ROC analyses.
A 37% reduction in T1Gd tumor volume was identified as the optimal cutoff for both PFS and OS. In comparison, a 55% reduction in FLAIR hyperintensity volume was set as the cutoff for peritumoral edema (Figure 1).
3.3. Functional Improvement After NeoBev Administration
The functional impact of neoBev was assessed by comparing ΔKPS before and after surgery between the two groups. As shown in Table 4, the NeoBev group displayed significantly greater improvement in postoperative KPS (+19.2%) than the Control group (+4.1%; p=0.02). This supports a potential role of neoBev in improving preoperative condition and perioperative functional status, even though survival outcomes did not differ significantly between groups (Figure 2).
3.4. Survival Analysis Before and After PSM
Before PSM, mPFS was 7.4 months in the NeoBev group and 8.4 months in the Control group (p=0.30), while mOS was 13.4 months in the NeoBev group and 13.1 months in the Control group (p=0.81). No significant differences were observed between the two cohorts (Figure 3A,B).
After 1:1 PSM, 33 patients were included in each group. Median mPFS was 7.4 months in the NeoBev group and 8.6 months in the matched Control group (p=0.35). In comparison, mOS was 13.4 months in the NeoBev group and 13.8 months in the matched Control group (p=0.87). Once again, no significant differences in survival were observed (Figure 3C,D). In the matched cohort, Cox proportional hazards analysis showed no significant difference in OS between the NeoBev and Control groups (HR 0.95, 95%CI 0.63–1.44; p=0.81). Similarly, PFS did not differ significantly between groups (HR 1.24, 95%CI 0.83–1.85; p=0.30), consistent with Kaplan–Meier analysis.
3.5. Association Between Imaging Changes and Survival
Patients in the NeoBev group were divided based on the 55% cutoff for FLAIR edema reduction. The mPFS was 8.5 months for those with <55% reduction and 6.5 months for those with ≥55% (p=0.91). Corresponding average OS values were 13.4 months and 14.1 months, respectively (p=0.49). No significant differences in survival were observed between these groups (Figure 4A,B; Table 3 and Table 4). In contrast, dividing patients by the 37% cutoff for T1Gd tumor volume reduction showed a significant association with survival. Patients with ≥37% reduction exhibited longer mPFS (9.7 months vs. 6.2 months, p=0.01) and mOS (17.3 months vs. 9.7 months, p<0.01) compared with those below the cutoff (Figure 4C,D; Table 3 and Table 4).
3.6. Impact of EOR on Survival
Based on EOR stratification, the mPFS and mOS of patients in the NeoBev and Control groups were compared. In the GTR group, mPFS was 10.0 months in the NeoBev group and 16.6 months in the Control group (p=0.03) (Figure 5A). In the STR group, mPFS was 8.6 months in the NeoBev group and 7.7 months in the Control group (p=0.36) (Figure 5B). In the PR group, mPFS was 13.6 months for the NeoBev group and 12.1 months for the Control group (p=0.32) (Figure 5C). Regarding mOS, in the GTR group, mOS was 18.0 months in the NeoBev group and 23.2 months in the Control group (p=0.36) (Figure 5D). In the STR group, mOS was 18.8 months in the NeoBev group and 13.2 months in the Control group (p=0.72) (Figure 5E). In the PR group, mOS was 15.6 months in the NeoBev group and 16.4 months in the Control group (p=0.63) (Figure 5F).
4. Discussion
As previously described [1], neoBev may reduce the size and extent of both perifocal edema and the tumor before surgery, helping to avoid the difficulties and morbidity associated with surgical procedures, particularly for tumors located in eloquent areas.
Most previous investigations of neoBev have focused on unresectable GB, and no studies have directly compared neoBev with the current standard chemoradiation regimen. Because those earlier cohorts differed substantially in clinical background and surgical feasibility, simple comparisons with standard therapy are inherently problematic. Moreover, for patients with resectable GB in whom GTR can be safely achieved, the incremental benefit of neoBev is expected to be limited, making the demonstration of a survival advantage from neoBev inherently challenging in newly diagnosed, surgically accessible disease.
These earlier investigations were conducted as feasibility-focused single-arm studies, inherently affected by selection biases related to tumor eloquence, patient age, and preoperative KPS. Building on these preliminary results, the current study used a retrospective comparative design, supported by PSM, to better determine whether neoBev offers additional clinical benefit beyond standard chemoradiation.
Given the existing literature [9,10,11,12,16], we hypothesized that altering the TME from hypoxia to normoxia after neoBev might enhance postoperative standard therapy, including RT and TMZ, combined with immunotherapy. We therefore aimed to validate clinical outcomes via comparative analyses of neoBev versus standard therapy for PFS and OS, stratified by clinical factors, using PSM.
4.1. Relationship to Prior Randomized Evidence and Clinical Positioning
Large, randomized trials of Bev in newly diagnosed GB generally show prolongation of PFS without a consistent improvement in OS under standard chemoradiation. This pattern is exemplified by the RTOG 0825 randomized phase III trial, which demonstrated that although Bev prolonged PFS, no improvement in OS was achieved compared with standard chemoradiation alone [17]. Our findings broadly align with this pattern: in the unselected population, neoBev did not improve survival compared with standard therapy, while imaging-defined responders on T1Gd displayed markedly longer PFS and OS. These data support a selection strategy in which preoperative Bev is considered for patients unlikely to achieve extensive resection due to eloquence, significant edema, or hypervascularity, rather than as a universal preoperative treatment. Consistent with these observations, our propensity score-matched analysis demonstrated no survival advantage of neoBev over standard therapy. The HRs for OS (HR 0.95, 95%CI 0.63–1.44) and PFS (HR 1.24, 95%CI 0.83–1.85) indicated no clinically meaningful difference between groups, reinforcing that neoBev does not exert a broad survival-prolonging effect in resectable GB. Instead, the potential benefits appear confined to selected patients in whom neoBev improves surgical operability or produces a measurable radiological response on T1Gd imaging.
4.2. Surgical Implications and EOR
Nonetheless, preoperative neoBev might increase the likelihood of supratotal resection or FLAIRectomy of GB, potentially leading to better local control of these tumors [18,19]. In contrast, Bev might induce invasion and dissemination in remote areas. Bev has been shown to reduce peritumoral edema and vascular permeability in newly diagnosed GB, potentially improving surgical operability in selected cases [20].
Confirming the ability to induce microscopic infiltration after neoBev through histological analysis is quite challenging, particularly for supratotal resection or FLAIRectomy of GB near eloquent areas. EOR-stratified analysis offers a nuanced interpretation. When GTR was achievable, standard therapy generally resulted in PFS outcomes that were equal to or better, suggesting that neoBev may not add any benefit once near-complete resection is possible. Conversely, in cases where GTR is prevented by tumor location (particularly near eloquent regions, due to mass effects, or vascularity) neoBev might still be helpful by improving surgical operability and preoperative performance, enabling safer resections or supporting supratotal/FLAIR-guided strategies in non-eloquent areas. OS in the NeoBev group tended to be longer with STR or PR than in the Control (standard therapy) group, indicating that neoBev might help sustain postoperative KPS rather than preoperative KPS, thus facilitating adherence to the Stupp regimen. To prevent even transient postoperative neurological deficits, STR was chosen over GTR, especially for patients with tumors near eloquent areas.
These hypotheses warrant prospective testing with surgical endpoints such as operative time, blood loss, brain relaxation, and resection margins. Although differences in these findings in the present investigation did not reach the level of statistical significance, the directionality suggests that neoBev may help maintain functional status sufficiently to complete chemoradiation, particularly in patients who cannot undergo GTR.
4.3. Safety, Timing, and Perioperative Considerations
The current protocol schedules surgery 21–30 days after Bev, weighing the potential risks of wound-healing delay and bleeding against the desired anti-edema and anti-angiogenic effects. Although this study was not adequately powered to assess safety endpoints, our experience suggests that a specific washout period and careful attention to perioperative hemostasis and wound care are essential when using neoBev. Future research should gather standardized data on wound healing and hemorrhagic complications to better understand the risks. Concerns about impaired wound healing after preoperative VEGF inhibition have been reported in multiple series, underscoring the need for careful surgical timing [21]. Additional meta-analytic data indicate that Bev increases the risk of wound-healing complications and thromboembolic events, reinforcing the importance of an adequate washout period before surgery [22].
4.4. Imaging Biomarker Rigor and Cutoffs
A key strength of this study was the use of predefined imaging time points and semi-automated volumetry. To reduce bias in small samples with stepwise ROC curves, we set cutoffs using the closest-to-(0,1) criterion. The T1Gd threshold of approximately 37% reduction reliably identified patients with favorable survival, while FLAIR reduction was less discriminative. This pattern aligns with the RANO criteria, which describe “pseudo-response” as a rapid decrease in contrast enhancement without corresponding tumor control [23]. Such changes indicate early vascular normalization (reduced permeability and edema) rather than true cytoreduction, a concept initially proposed by Jain [24]. Sorensen et al. further demonstrated that the extent and duration of this normalization process vary significantly among patients, as measured by the vascular normalization index [25]. These mechanisms collectively explain why FLAIR hyperintensity may primarily reflect edema, whereas reductions in T1Gd-enhancing volume offered a more reliable biomarker of a biologically meaningful response to Bev in our cohort. These cutoffs should undergo external validation and be tested alongside advanced MRI metrics (perfusion/diffusion) and radiomic signatures to enhance their generalizability.
Considering digital spatial profiling, responses to neuroradiological images, and prolongation of OS, the level of VEGF expression and its decline after neoBev therapy (Tanaka T, unpublished data) might be associated with these outcomes. These findings are consistent with the well-established concept of “vascular normalization,” in which anti-VEGF therapy transiently restores a more organized and efficient microvasculature, thereby improving oxygenation and drug delivery while reducing edema [24]. These observations are in line with updated concepts of vascular normalization, which describe transient restoration of an efficient microvasculature during VEGF inhibition [26]. The intensity and duration of VEGF-targeted therapies, such as Bev, do not appear to confer prolonged survival compared with directly cytotoxic therapies, such as RT and TMZ. Changes in the TME during Bev therapy could be a key factor in maintaining “tumor dormancy”, but the exact mechanisms of rapid deterioration during Bev treatment remain unknown.
In addition, we have previously described the differential effectiveness of Bev in a patient with concurrent angiogenic diseases, including GB, meningioma, and dural arteriovenous fistula, demonstrating that the GB was the best responder to neoBev among these diseases [27]. In the future, comparative analyses of spatial preoperative VEGF levels and therapeutic response to Bev on neuroimages might allow appropriate stratification of clinical benefits after neoBev therapy.
Beyond breast cancer, preoperative neoBev has also been studied in the treatment of several solid tumors, including rectal [28], hepatic [29], and renal cancers [30]. Those studies consistently showed transient tumor reduction and improved local resectability, but without lasting survival benefits. Collectively, they support the idea that VEGF blockade mainly acts as a perioperative modifier (helping with edema control and resectability, rather than prolonging OS) similar to what we observed in GB.
4.5. Methodological Strengths
This multi-institutional analysis used consistent MRI acquisition windows, objective volumetric measures, and PSM to minimize baseline differences, followed by responder analyses based on ROC-derived thresholds. The agreement between OS and PFS signals among T1Gd responders suggests internal consistency.
In real-world neurosurgical practice, a subset of patients presents with profound edema or vessel-rich tumors in which immediate surgery carries substantial neurological risk. In such scenarios, neoBev may provide a clinically meaningful bridge to safer resection.
NeoBev may thus function primarily as a “floor-raising” intervention, mitigating extreme outcomes in patients with poor resectability, rather than a “ceiling-extending” therapy that improves outcomes in patients already able to achieve GTR.
4.6. Limitations
This study was retrospective with a modest sample size, which limits the accuracy and increases the likelihood of residual confounding despite PSM.
Molecular profiles (e.g., methylguanine methyltransferase methylation, telomerase reverse transcriptase, and epidermal growth factor receptor alterations) were incomplete in some cases, possibly affecting prognosis and treatment response to TMZ.
Single-dose neoBev and institutional practice patterns introduced treatment variability. The cutoff thresholds were data-driven and require validation in independent cohorts.
4.7. Future Directions
We need to explore more predictable prognostic biomarkers rather than transient therapeutic responses.
Prospective, biomarker-informed trials are essential to validate the 37% cutoff for T1Gd and to evaluate a selection algorithm that combines preoperative clinical factors (such as eloquence, edema burden, and vascularity), molecular markers, and results of quantitative imaging. Randomized or adaptive designs that stratify by planned EOR and involvement of eloquent areas could determine whether neoBev enables safer, more extensive resections or improves functional recovery without impairing wound healing. Incorporating standardized surgical metrics and patient-reported outcomes will be vital to fully evaluate the clinical benefits of a neoadjuvant approach.
Since we obtained surgical samples from patients with preoperative neoBev for resectable GB, we believe that we have priority in assessing potential biological processes in these tumors through exploratory analyses using in situ investigation and recent advanced technologies for neuroimaging and molecular analyses, including oxygenation-focused neuroimages such as (18)F-Fluoromisonidazole-Positron Emission Tomography (FMISO-PET) [31] and multi-omics analyses.
5. Conclusions
Preoperative neoBev did not extend PFS or OS compared to standard chemoradiotherapy. However, patients achieving a ≥37% reduction in T1Gd volume showed significantly improved survival. These findings indicate that neoBev may provide meaningful benefits for carefully selected patients, particularly those with extensive edema, lower preoperative KPS, or tumors involving eloquent regions, where immediate surgery poses neurological risks and operative complications.
Author Contributions
TT, YY, and HS conceptualized, designed, and performed the study and wrote the main manuscript. RT, YM prepared the manuscript. JT and YY performed statistical analyses and prepared figures. AT and KT assisted with data acquisition. YH, YA, YY, and KM assisted with the discussion and review of the manuscript. All authors reviewed the manuscript and approved the final version.
Funding
This study was supported by the Ministry of Education, Culture, Sports, Science and Technology and the Japan Society for Promotion of Science (KAKENHI) (grant No: 21K09161 and 25K12326).
Institutional Review Board Statement
The study was approved by the Clinical Research Ethics Committee of Jikei University Faculty of Medicine Hospital (decision date: 2017-04-12 and approval no. 28-322(8565); decision date: 2019-10-21; and approval no. JKI-18-052), in accordance with the Declaration of Helsinki. Trial Registration Number: UMIN000025579, jRCT1031180233 https://jrct.niph.go.jp/latest-detail/jRCT1031180233. Registration Date: Jan. 16, 2017.
Informed Consent Statement
This study was conducted as a retrospective analysis. In accordance with institutional ethical guidelines, the requirement for written informed consent was waived. Instead, an opt-out approach was adopted, and information regarding the study was disclosed to patients via public notices in the outpatient clinic. The study protocol was approved by the institutional review board of the Jikei University of Medicine, and all procedures were performed in accordance with the ethical standards of the institutional and/or national research committee and with the 1964 Declaration of Helsinki and its later amendments or comparable ethical standards.
Data Availability Statement
The original contributions presented in this study are included in the article/supplementary material. Further inquiries can be directed to the corresponding author.
Conflicts of Interest
The authors declare no conflicts of interest.
Abbreviations
The following abbreviations are used in this manuscript:
| VEGF | Vascular endothelial growth factor |
| Bev | Bevacizumab |
| GB | Glioblastoma |
| FLAIR | Fluid-attenuated inversion recovery |
| neoBev | Neoadjuvant bevacizumab |
| T1-Gd | T1-weighted imaging with gadolinium enhancement |
| mOS | Median overall survival |
| RT | Radiation therapy |
| TMZ | Temozolomide |
| PFS | Progression-free survival |
| MRI | Magnetic resonance imaging |
| EOR | Extent of resection |
| GTR | Gross total resection |
References
- Tanaka, T.; Tamura, R.; Takei, J.; Morimoto, Y.; Teshigawara, A.; Yamamoto, Y.; Imai, R.; Kuranari, Y.; Tohmoto, K.; Hasegawa, Y.; et al. An exploratory prospective phase II study of preoperative neoadjuvant bevacizumab and temozolomide for newly diagnosed glioblastoma. J. Neurooncol. 2024, 166, 557–567. [Google Scholar] [CrossRef]
- Batchelor, T.T.; Sorensen, A.G.; di Tomaso, E.; Zhang, W.T.; Duda, D.G.; Cohen, K.S.; Kozak, K.R.; Cahill, D.P.; Chen, P.J.; Zhu, M.; et al. AZD2171, a pan-VEGF receptor tyrosine kinase inhibitor, normalizes tumor vasculature and alleviates edema in glioblastoma patients. Cancer Cell. 2007, 11, 83–95. [Google Scholar] [CrossRef]
- Daniele, G.; Lorusso, D.; Scambia, G.; Cecere, S.C.; Nicoletto, M.O.; Breda, E.; Colombo, N.; Artioli, G.; Cannella, L.; Lo Re, G.; et al. Feasibility and outcome of interval debulking surgery (IDS) after carboplatin-paclitaxel-bevacizumab (CPB): A subgroup analysis of the MITO-16A-MaNGO OV2A phase 4 trial. Gynecol. Oncol. 2017, 144, 256–259. [Google Scholar] [CrossRef]
- Dede, K.; Mersich, T.; Besznyák, I.; Zaránd, A.; Salamon, F.; Baranyai, Z.S.; Landherr, L.; Jakab, F.; Bursics, A. Bevacizumab treatment before resection of colorectal liver metastases: safety, recovery of liver function, pathologic assessment. Pathol. Oncol. Res. 2013, 19, 501–508. [Google Scholar] [CrossRef]
- Petrillo, M.; Paris, I.; Vizzielli, G.; Amadio, G.; Cosentino, F.; Salutari, V.; Scambia, G.; Fagotti, A. Neoadjuvant Chemotherapy Followed by Maintenance Therapy With or Without Bevacizumab in Unresectable High-Grade Serous Ovarian Cancer: A Case-Control Study. Ann. Surg. Oncol. 2015, 22 Suppl 3, S952–958. [Google Scholar] [CrossRef]
- von Minckwitz, G.; Eidtmann, H.; Rezai, M.; Fasching, P.A.; Tesch, H.; Eggemann, H.; Schrader, I.; Kittel, K.; Hanusch, C.; Kreienberg, R.; et al. Neoadjuvant chemotherapy and bevacizumab for HER2-negative breast cancer. N. Engl. J. Med. 2012, 366, 299–309. [Google Scholar] [CrossRef]
- Sanai, N.; Polley, M.Y.; McDermott, M.W.; Parsa, A.T.; Berger, M.S. An extent of resection threshold for newly diagnosed glioblastomas. J. Neurosurg. 2011, 115, 3–8. [Google Scholar] [CrossRef]
- Molinaro, A.M.; Hervey-Jumper, S.; Morshed, R.A.; Young, J.; Han, S.J.; Chunduru, P.; Zhang, Y.; Phillips, J.J.; Shai, A.; Lafontaine, M.; et al. Association of Maximal Extent of Resection of Contrast-Enhanced and Non-Contrast-Enhanced Tumor With Survival Within Molecular Subgroups of Patients With Newly Diagnosed Glioblastoma. JAMA Oncol. 2020, 6, 495–503. [Google Scholar] [CrossRef] [PubMed]
- Yamamoto, Y.; Tamura, R.; Tanaka, T.; Ohara, K.; Tokuda, Y.; Miyake, K.; Takei, J.; Akasaki, Y.; Yoshida, K.; Murayama, Y.; et al. “Paradoxical” findings of tumor vascularity and oxygenation in recurrent glioblastomas refractory to bevacizumab. Oncotarget 2017, 8, 103890–103899. [Google Scholar] [CrossRef] [PubMed]
- Tamura, R.; Tanaka, T.; Morimoto, Y.; Kuranari, Y.; Yamamoto, Y.; Takei, J.; Murayama, Y.; Yoshida, K.; Sasaki, H. Alterations of the tumor microenvironment in glioblastoma following radiation and temozolomide with or without bevacizumab. Ann Transl Med. 2020, 8, 297. [Google Scholar] [CrossRef] [PubMed]
- Takei, J.; Fukasawa, N.; Tanaka, T.; Yamamoto, Y.; Tamura, R.; Sasaki, H.; Akasaki, Y.; Kamata, Y.; Murahashi, M.; Shimoda, M.; et al. Impact of Neoadjuvant Bevacizumab on Neuroradiographic Response and Histological Findings Related to Tumor Stemness and the Hypoxic Tumor Microenvironment in Glioblastoma: Paired Comparison Between Newly Diagnosed and Recurrent Glioblastomas. Front. Oncol. 2022, 12, 898614. [Google Scholar] [CrossRef] [PubMed]
- Tamura, R.; Tanaka, T.; Ohara, K.; Miyake, K.; Morimoto, Y.; Yamamoto, Y.; Kanai, R.; Akasaki, Y.; Murayama, Y.; Tamiya, T.; et al. Persistent restoration to the immunosupportive tumor microenvironment in glioblastoma by bevacizumab. Cancer Sci. 2019, 110, 499–508. [Google Scholar] [CrossRef]
- World Health Organization Classification of Tumours Editorial Board. Central Nervous System Tumors, 5th ed; International Agency for Research on Cancer: Lyon, France, 2021. [Google Scholar]
- World Medical Association Declaration of Helsinki: ethical principles for medical research involving human subjects. JAMA 2013, 310, 2191–2194. [CrossRef]
- Stupp, R.; Mason, W.P.; van den Bent, M.J.; Weller, M.; Fisher, B.; Taphoorn, M.J.; Belanger, K.; Brandes, A.A.; Marosi, C.; Bogdahn, U.; et al. Radiotherapy plus concomitant and adjuvant temozolomide for glioblastoma. N. Engl. J. Med. 2005, 352, 987–996. [Google Scholar] [CrossRef]
- Tamura, R.; Tanaka, T.; Miyake, K.; Tabei, Y.; Ohara, K.; Sampetrean, O.; Kono, M.; Mizutani, K.; Yamamoto, Y.; Murayama, Y.; et al. Histopathological investigation of glioblastomas resected under bevacizumab treatment. Oncotarget 2016, 7, 52423–52435. [Google Scholar] [CrossRef]
- Gilbert, M.R.; Dignam, J.J.; Armstrong, T.S.; Wefel, J.S.; Blumenthal, D.T.; Vogelbaum, M.A.; Colman, H.; Chakravarti, A.; Pugh, S.; Won, M.; et al. A randomized trial of bevacizumab for newly diagnosed glioblastoma. N. Engl. J. Med. 2014, 370, 699–708. [Google Scholar] [CrossRef]
- Tamura, R.; Tanaka, T.; Miyake, K.; Yoshida, K.; Sasaki, H. Bevacizumab for malignant gliomas: current indications, mechanisms of action and resistance, and markers of response. Brain Tumor Pathol. 2017, 34, 62–77. [Google Scholar] [CrossRef]
- Haddad, A.F.; Young, J.S.; Morshed, R.A.; Berger, M.S. FLAIRectomy: Resecting beyond the Contrast Margin for Glioblastoma. Brain Sci. 2022, 12. [Google Scholar] [CrossRef]
- Lai, A.; Tran, A.; Nghiemphu, P.L.; Pope, W.B.; Solis, O.E.; Selch, M.; Filka, E.; Yong, W.H.; Mischel, P.S.; Liau, L.M.; et al. Phase II study of bevacizumab plus temozolomide during and after radiation therapy for patients with newly diagnosed glioblastoma multiforme. J. Clin. Oncol. 2011, 29, 142–148. [Google Scholar] [CrossRef] [PubMed]
- Scappaticci, F.A.; Fehrenbacher, L.; Cartwright, T.; Hainsworth, J.D.; Heim, W.; Berlin, J.; Kabbinavar, F.; Novotny, W.; Sarkar, S.; Hurwitz, H. Surgical wound healing complications in metastatic colorectal cancer patients treated with bevacizumab. J. Surg. Oncol. 2005, 91, 173–180. [Google Scholar] [CrossRef] [PubMed]
- Nalluri, S.R.; Chu, D.; Keresztes, R.; Zhu, X.; Wu, S. Risk of venous thromboembolism with the angiogenesis inhibitor bevacizumab in cancer patients: a meta-analysis. JAMA 2008, 300, 2277–2285. [Google Scholar] [CrossRef]
- Wen, P.Y.; Macdonald, D.R.; Reardon, D.A.; Cloughesy, T.F.; Sorensen, A.G.; Galanis, E.; Degroot, J.; Wick, W.; Gilbert, M.R.; Lassman, A.B.; et al. Updated response assessment criteria for high-grade gliomas: response assessment in neuro-oncology working group. J. Clin. Oncol. 2010, 28, 1963–1972. [Google Scholar] [CrossRef] [PubMed]
- Jain, R.K. Normalization of tumor vasculature: an emerging concept in antiangiogenic therapy. Science 2005, 307, 58–62. [Google Scholar] [CrossRef]
- Sorensen, A.G.; Batchelor, T.T.; Zhang, W.T.; Chen, P.J.; Yeo, P.; Wang, M.; Jennings, D.; Wen, P.Y.; Lahdenranta, J.; Ancukiewicz, M.; et al. A “vascular normalization index” as potential mechanistic biomarker to predict survival after a single dose of cediranib in recurrent glioblastoma patients. Cancer Res. 2009, 69, 5296–5300. [Google Scholar] [CrossRef]
- Goel, S.; Wong, A.H.; Jain, R.K. Vascular normalization as a therapeutic strategy for malignant and nonmalignant disease. Cold Spring Harb. Perspect. Med. 2012, 2, a006486. [Google Scholar] [CrossRef]
- Takigawa, K.; Hata, N.; Michiwaki, Y.; Hiwatashi, A.; Yonezawa, H.; Kuga, D.; Hatae, R.; Sangatsuda, Y.; Fujioka, Y.; Funakoshi, Y.; et al. Volumetric study reveals the relationship between outcome and early radiographic response during bevacizumab-containing chemoradiotherapy for unresectable glioblastoma. J. Neurooncol. 2021, 154, 187–196. [Google Scholar] [CrossRef] [PubMed]
- Willett, C.G.; Duda, D.G.; di Tomaso, E.; Boucher, Y.; Ancukiewicz, M.; Sahani, D.V.; Lahdenranta, J.; Chung, D.C.; Fischman, A.J.; Lauwers, G.Y.; et al. Efficacy, safety, and biomarkers of neoadjuvant bevacizumab, radiation therapy, and fluorouracil in rectal cancer: a multidisciplinary phase II study. J. Clin. Oncol. 2009, 27, 3020–3026. [Google Scholar] [CrossRef] [PubMed]
- Kudo, M. Adjuvant Atezolizumab-Bevacizumab after Resection or Ablation for Hepatocellular Carcinoma. Liver Cancer 2023, 12, 189–197. [Google Scholar] [CrossRef]
- Jonasch, E.; Wood, C.G.; Matin, S.F.; Tu, S.M.; Pagliaro, L.C.; Corn, P.G.; Aparicio, A.; Tamboli, P.; Millikan, R.E.; Wang, X.; et al. Phase II presurgical feasibility study of bevacizumab in untreated patients with metastatic renal cell carcinoma. J. Clin. Oncol. 2009, 27, 4076–4081. [Google Scholar] [CrossRef]
- Suzuki, T.; Takei, J.; Fukasawa, N.; Suzuki, K.; Ogawa, D.; Yamamoto, Y.; Akasaki, Y.; Murayama, Y.; Shimoda, M.; Miyake, K.; et al. (18)F-Fluoromisonidazole-Positron Emission Tomography and Immunohistochemistry Verified Tumor Oxygenation, Stemness, and Immunosupportive Microenvironment After Preoperative Neoadjuvant Bevacizumab for Newly Diagnosed Glioblastoma. World Neurosurg. 2023, 175, e1364–e1374. [Google Scholar] [CrossRef]
Figure 1.
Receiver operating characteristic (ROC) curve analysis for determining cutoff values of volumetric response to neoBev. (A) ROC curve for progression-free survival (PFS) using percent reduction in T1Gd-enhancing tumor volume. A 37% reduction was identified as the optimal cutoff. (B) ROC curve for PFS using percent reduction in FLAIR hyperintensity volume, yielding a 55% cutoff. (C) ROC curve for overall survival (OS) using T1Gd-enhancing tumor volume reduction, confirming the same optimal cutoff of 37%. (D) ROC curve for OS using FLAIR hyperintensity volume reduction, with a corresponding cutoff of 55%. The optimal thresholds were determined using the closest-to-(0,1) method to prioritize balanced sensitivity and specificity.
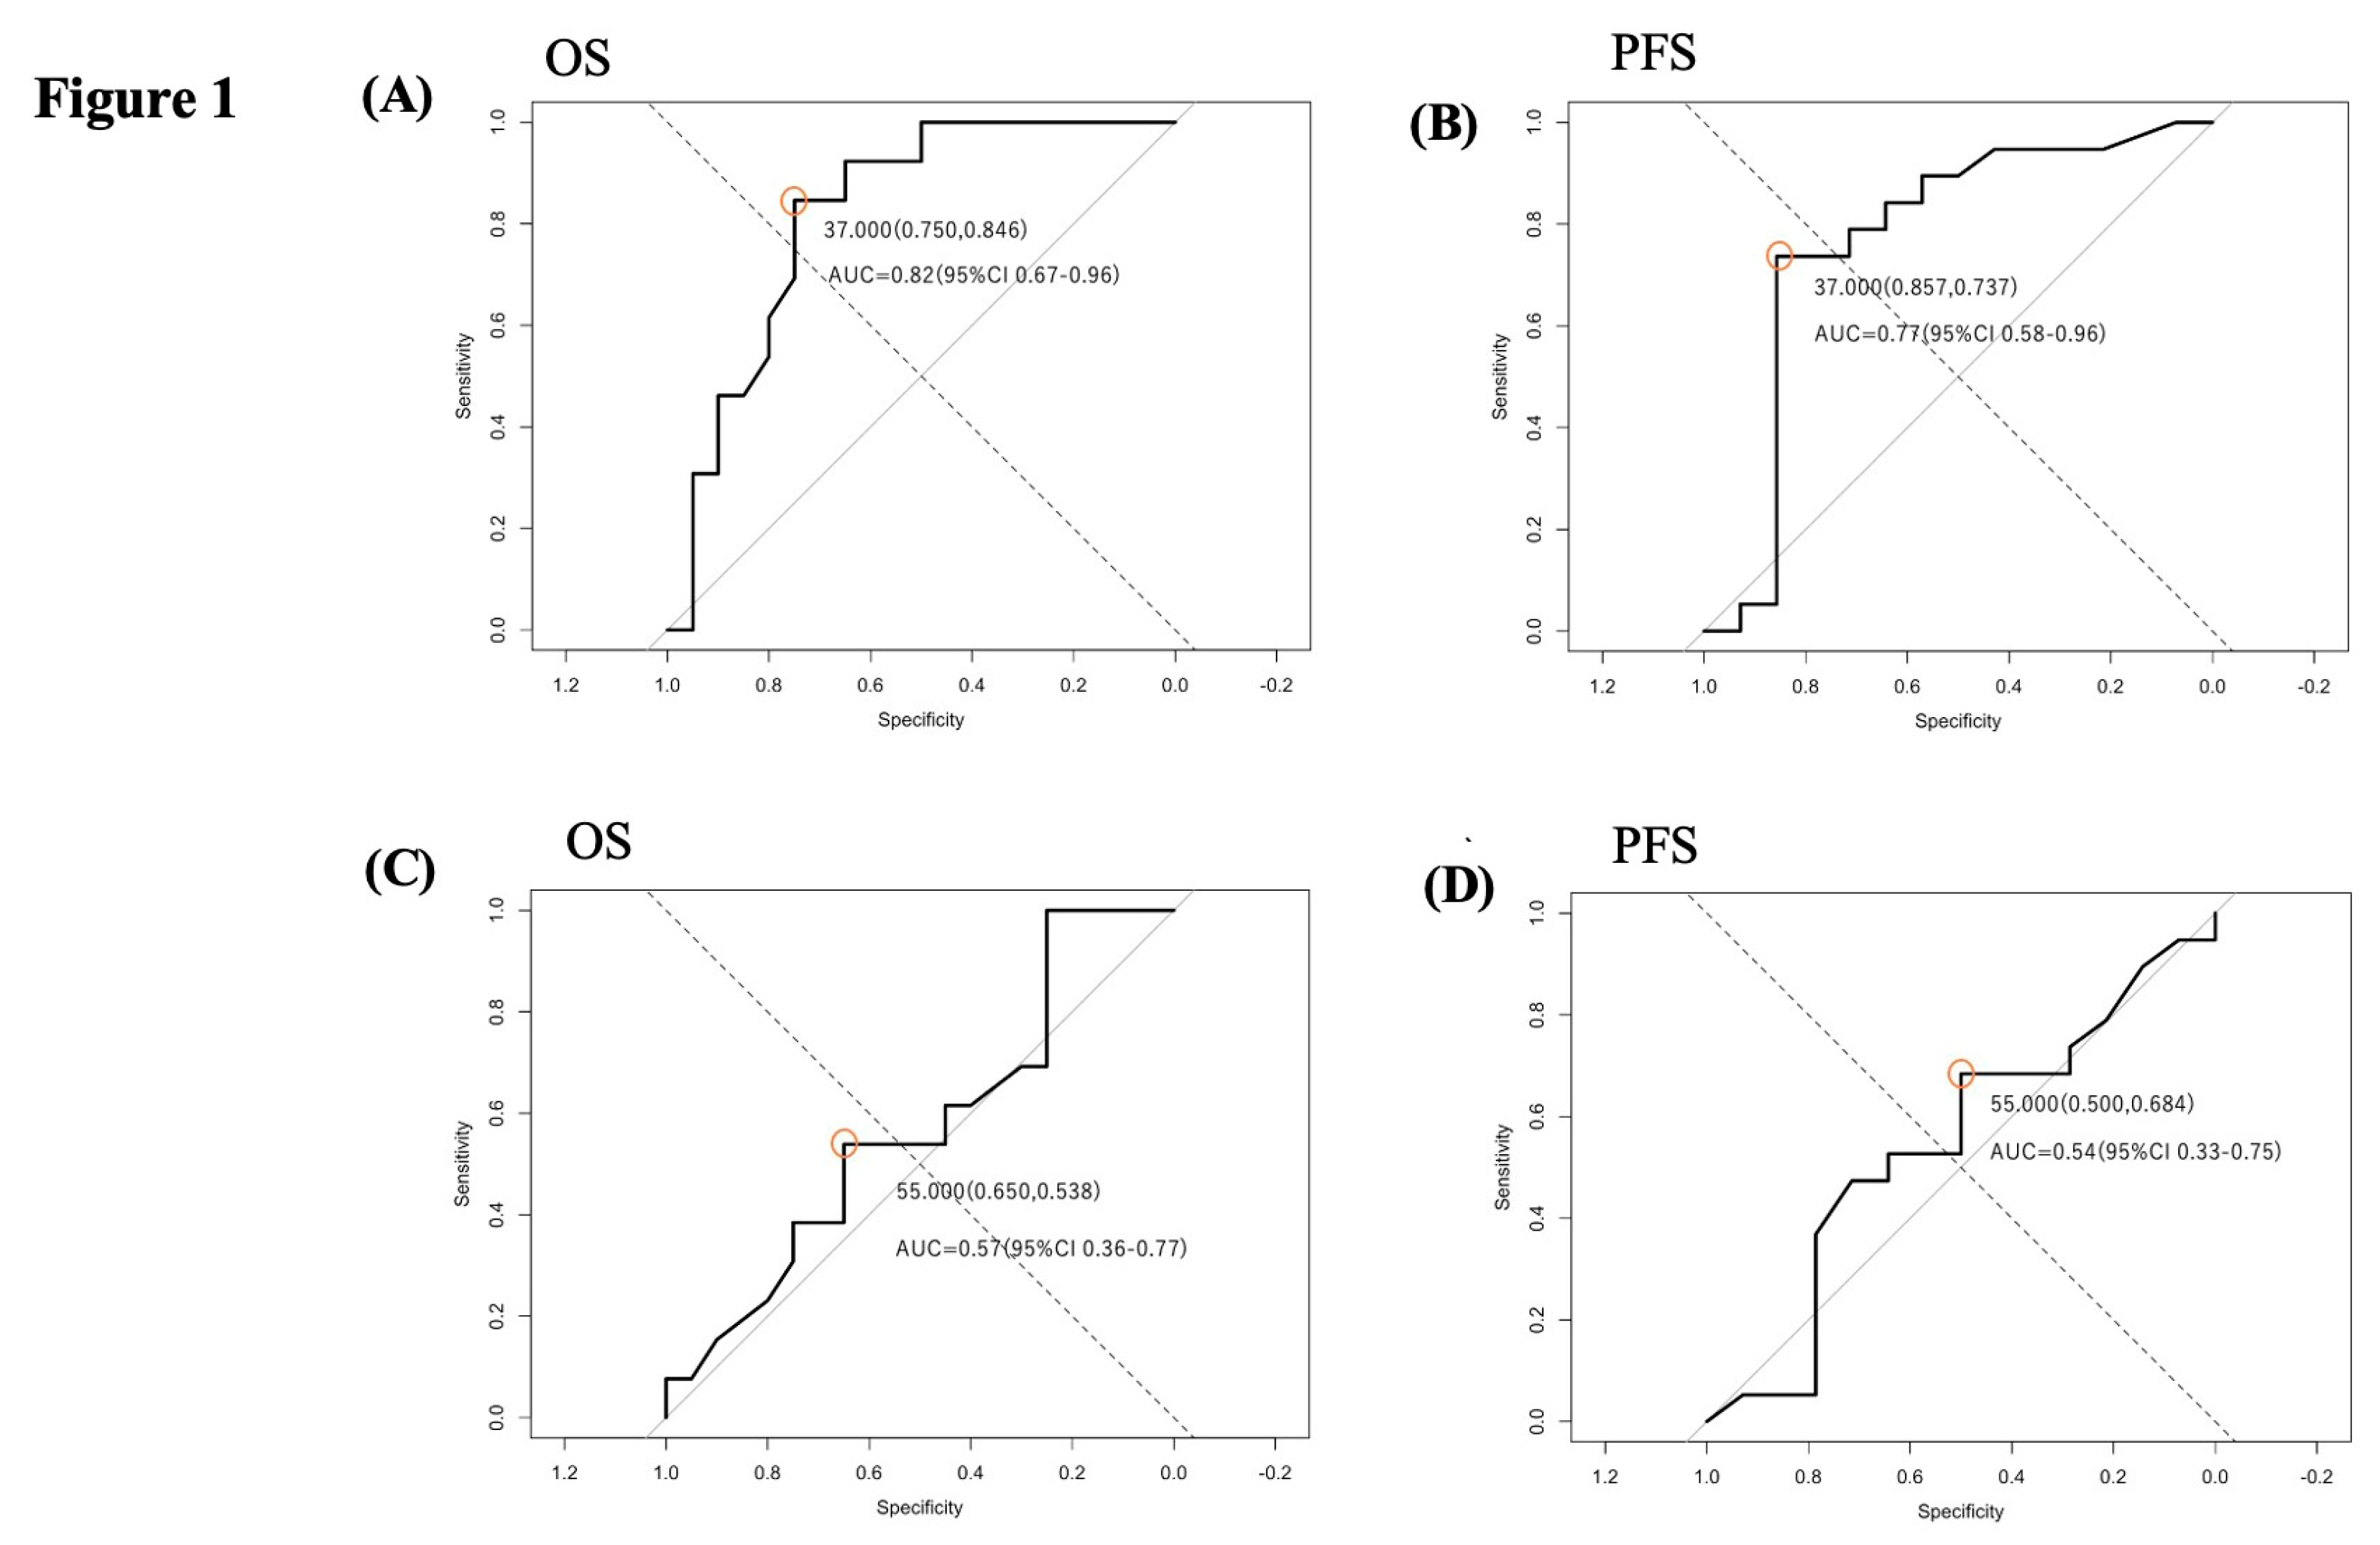
Figure 2.
Postoperative improvement of KPS in the neoBev and control groups. Boxplot showing postoperative changes in Karnofsky Performance Status (KPS) in patients receiving preoperative bevacizumab (neoBev) compared with the control group. The neoBev group demonstrated a significantly greater improvement in postoperative KPS than the control group (p = 0.02). Boxes represent the interquartile range (IQR), horizontal lines indicate the median, and whiskers denote 1.5 × IQR. Outliers are plotted as individual points. * = P < 0.05.
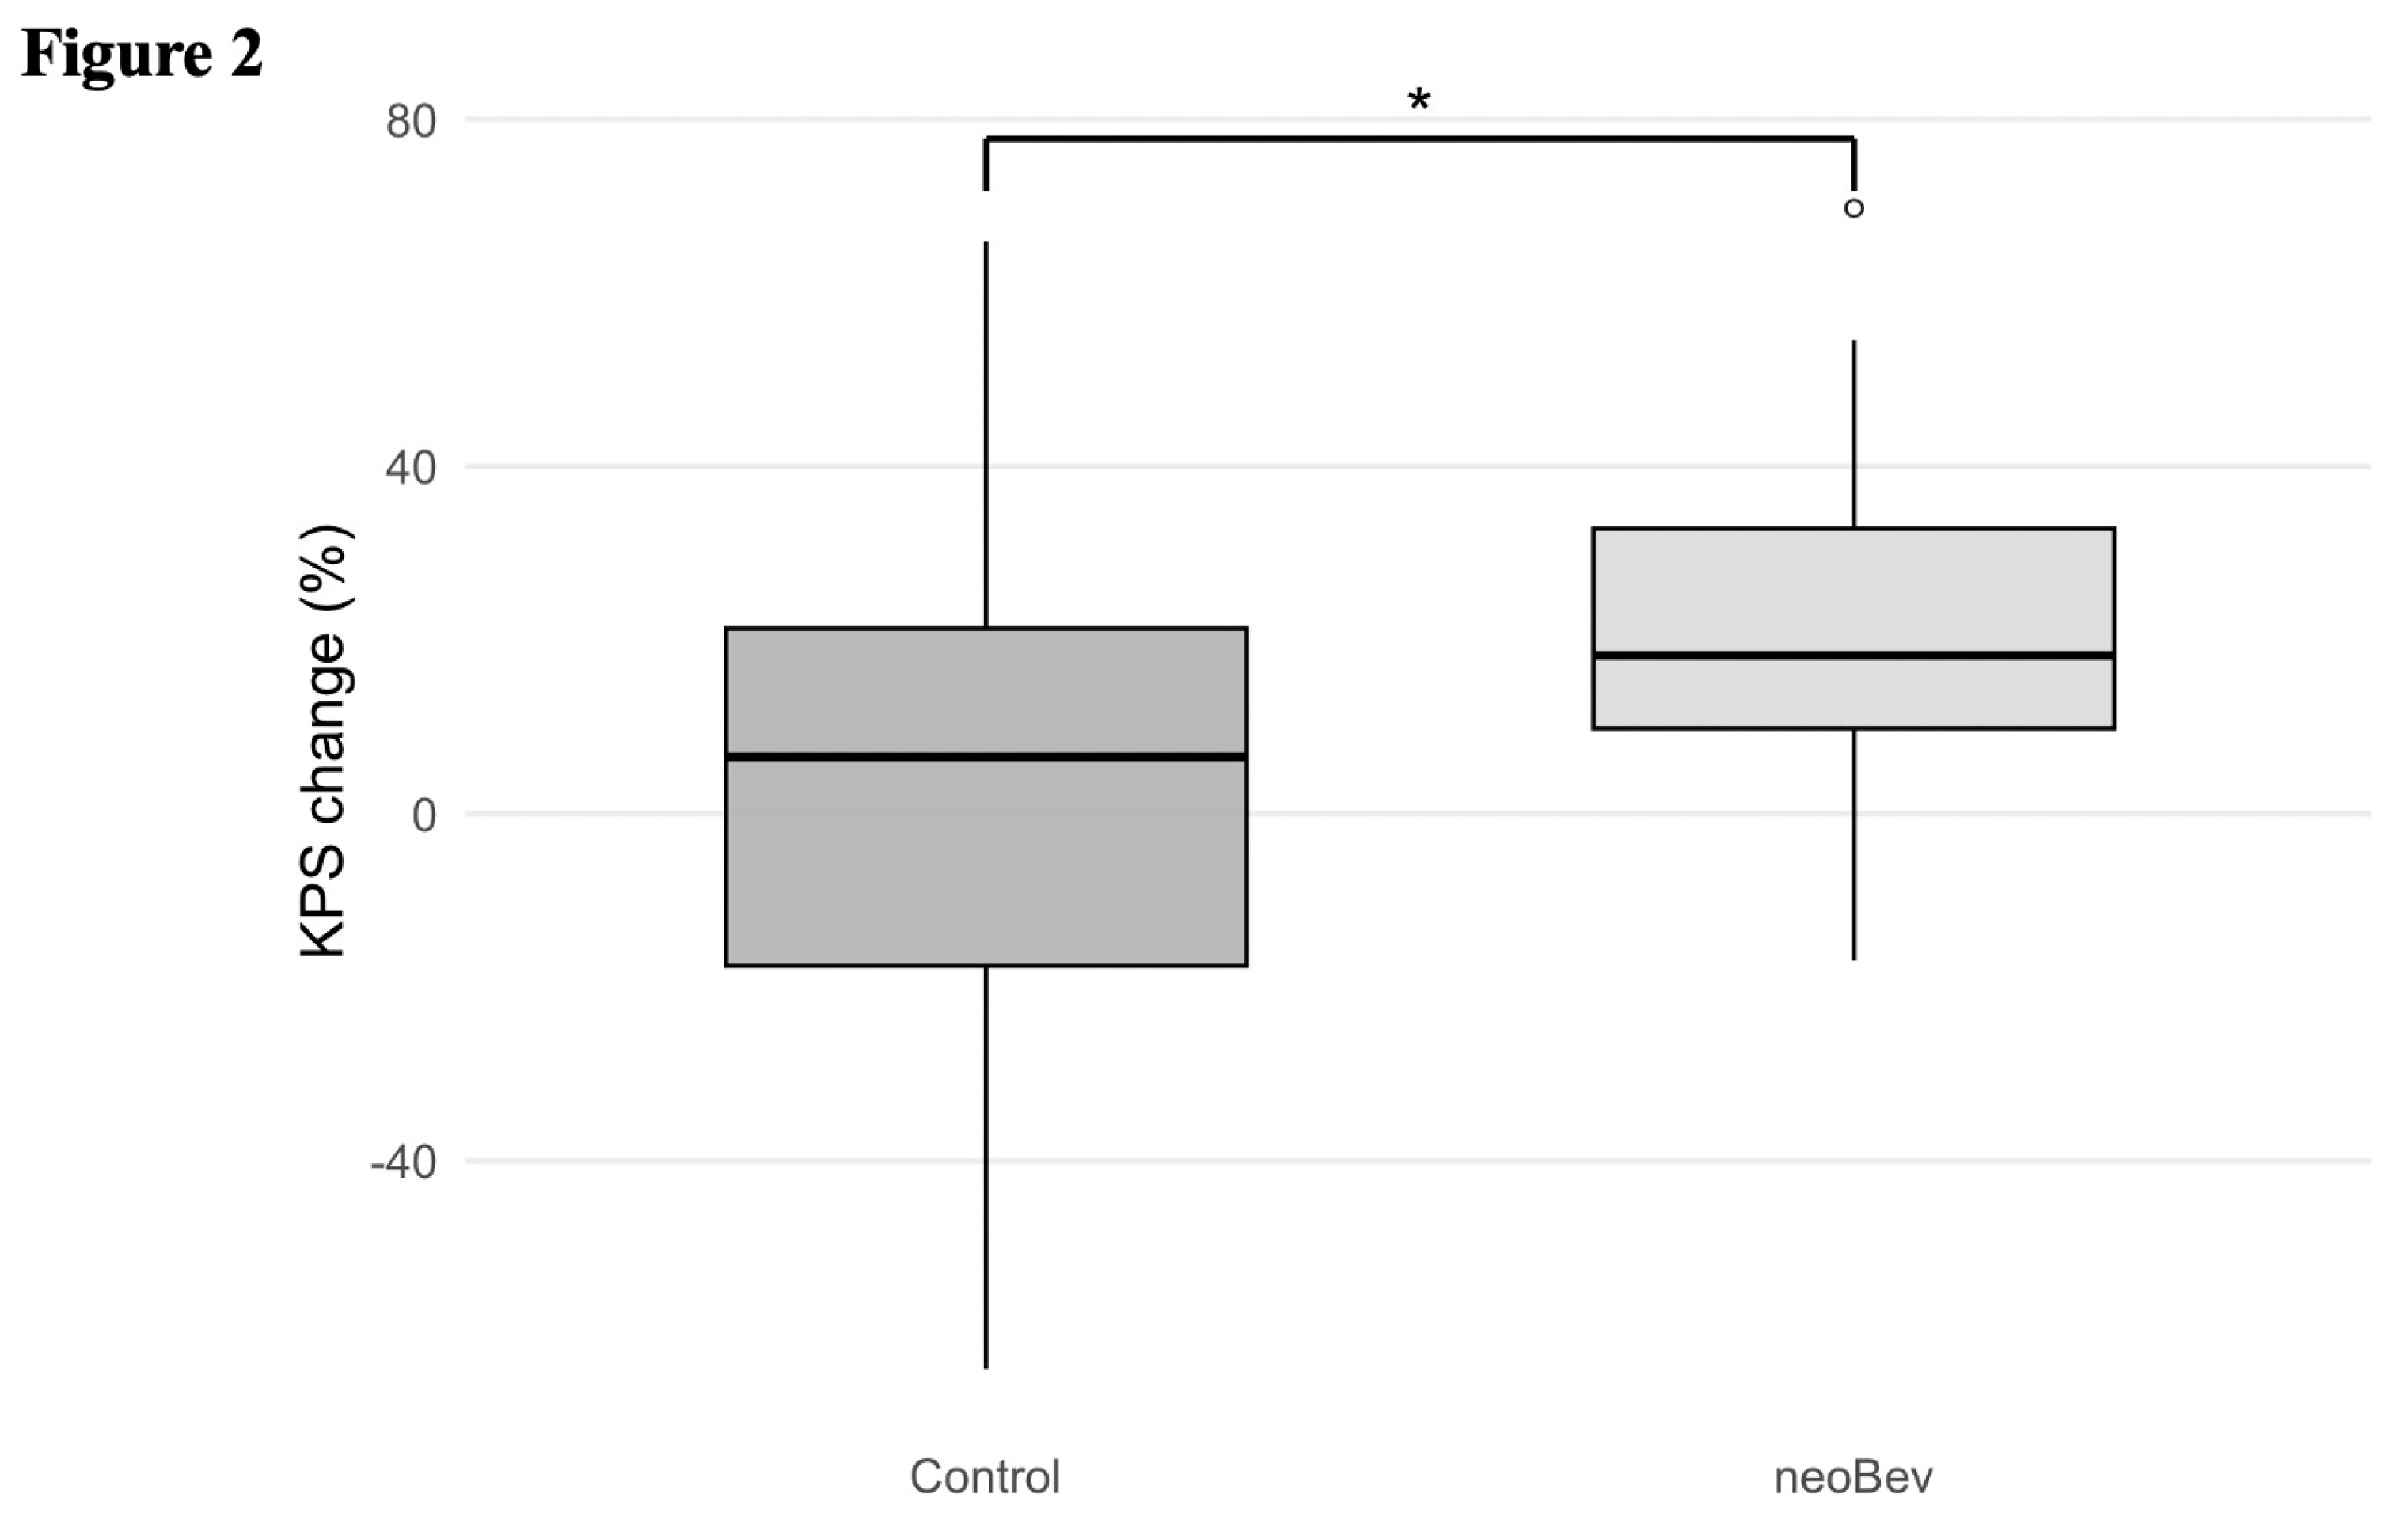
Figure 3.
Kaplan–Meier analyses before and after PSM. PFS and OS stratified by neoBev and standard therapy before (A, B) and after (C, D) PSM. Black line = neoBev (–); red line = neoBev (+). “(+)” indicates neoBev administration. “(–)” indicates no neoBev.
Figure 3.
Kaplan–Meier analyses before and after PSM. PFS and OS stratified by neoBev and standard therapy before (A, B) and after (C, D) PSM. Black line = neoBev (–); red line = neoBev (+). “(+)” indicates neoBev administration. “(–)” indicates no neoBev.
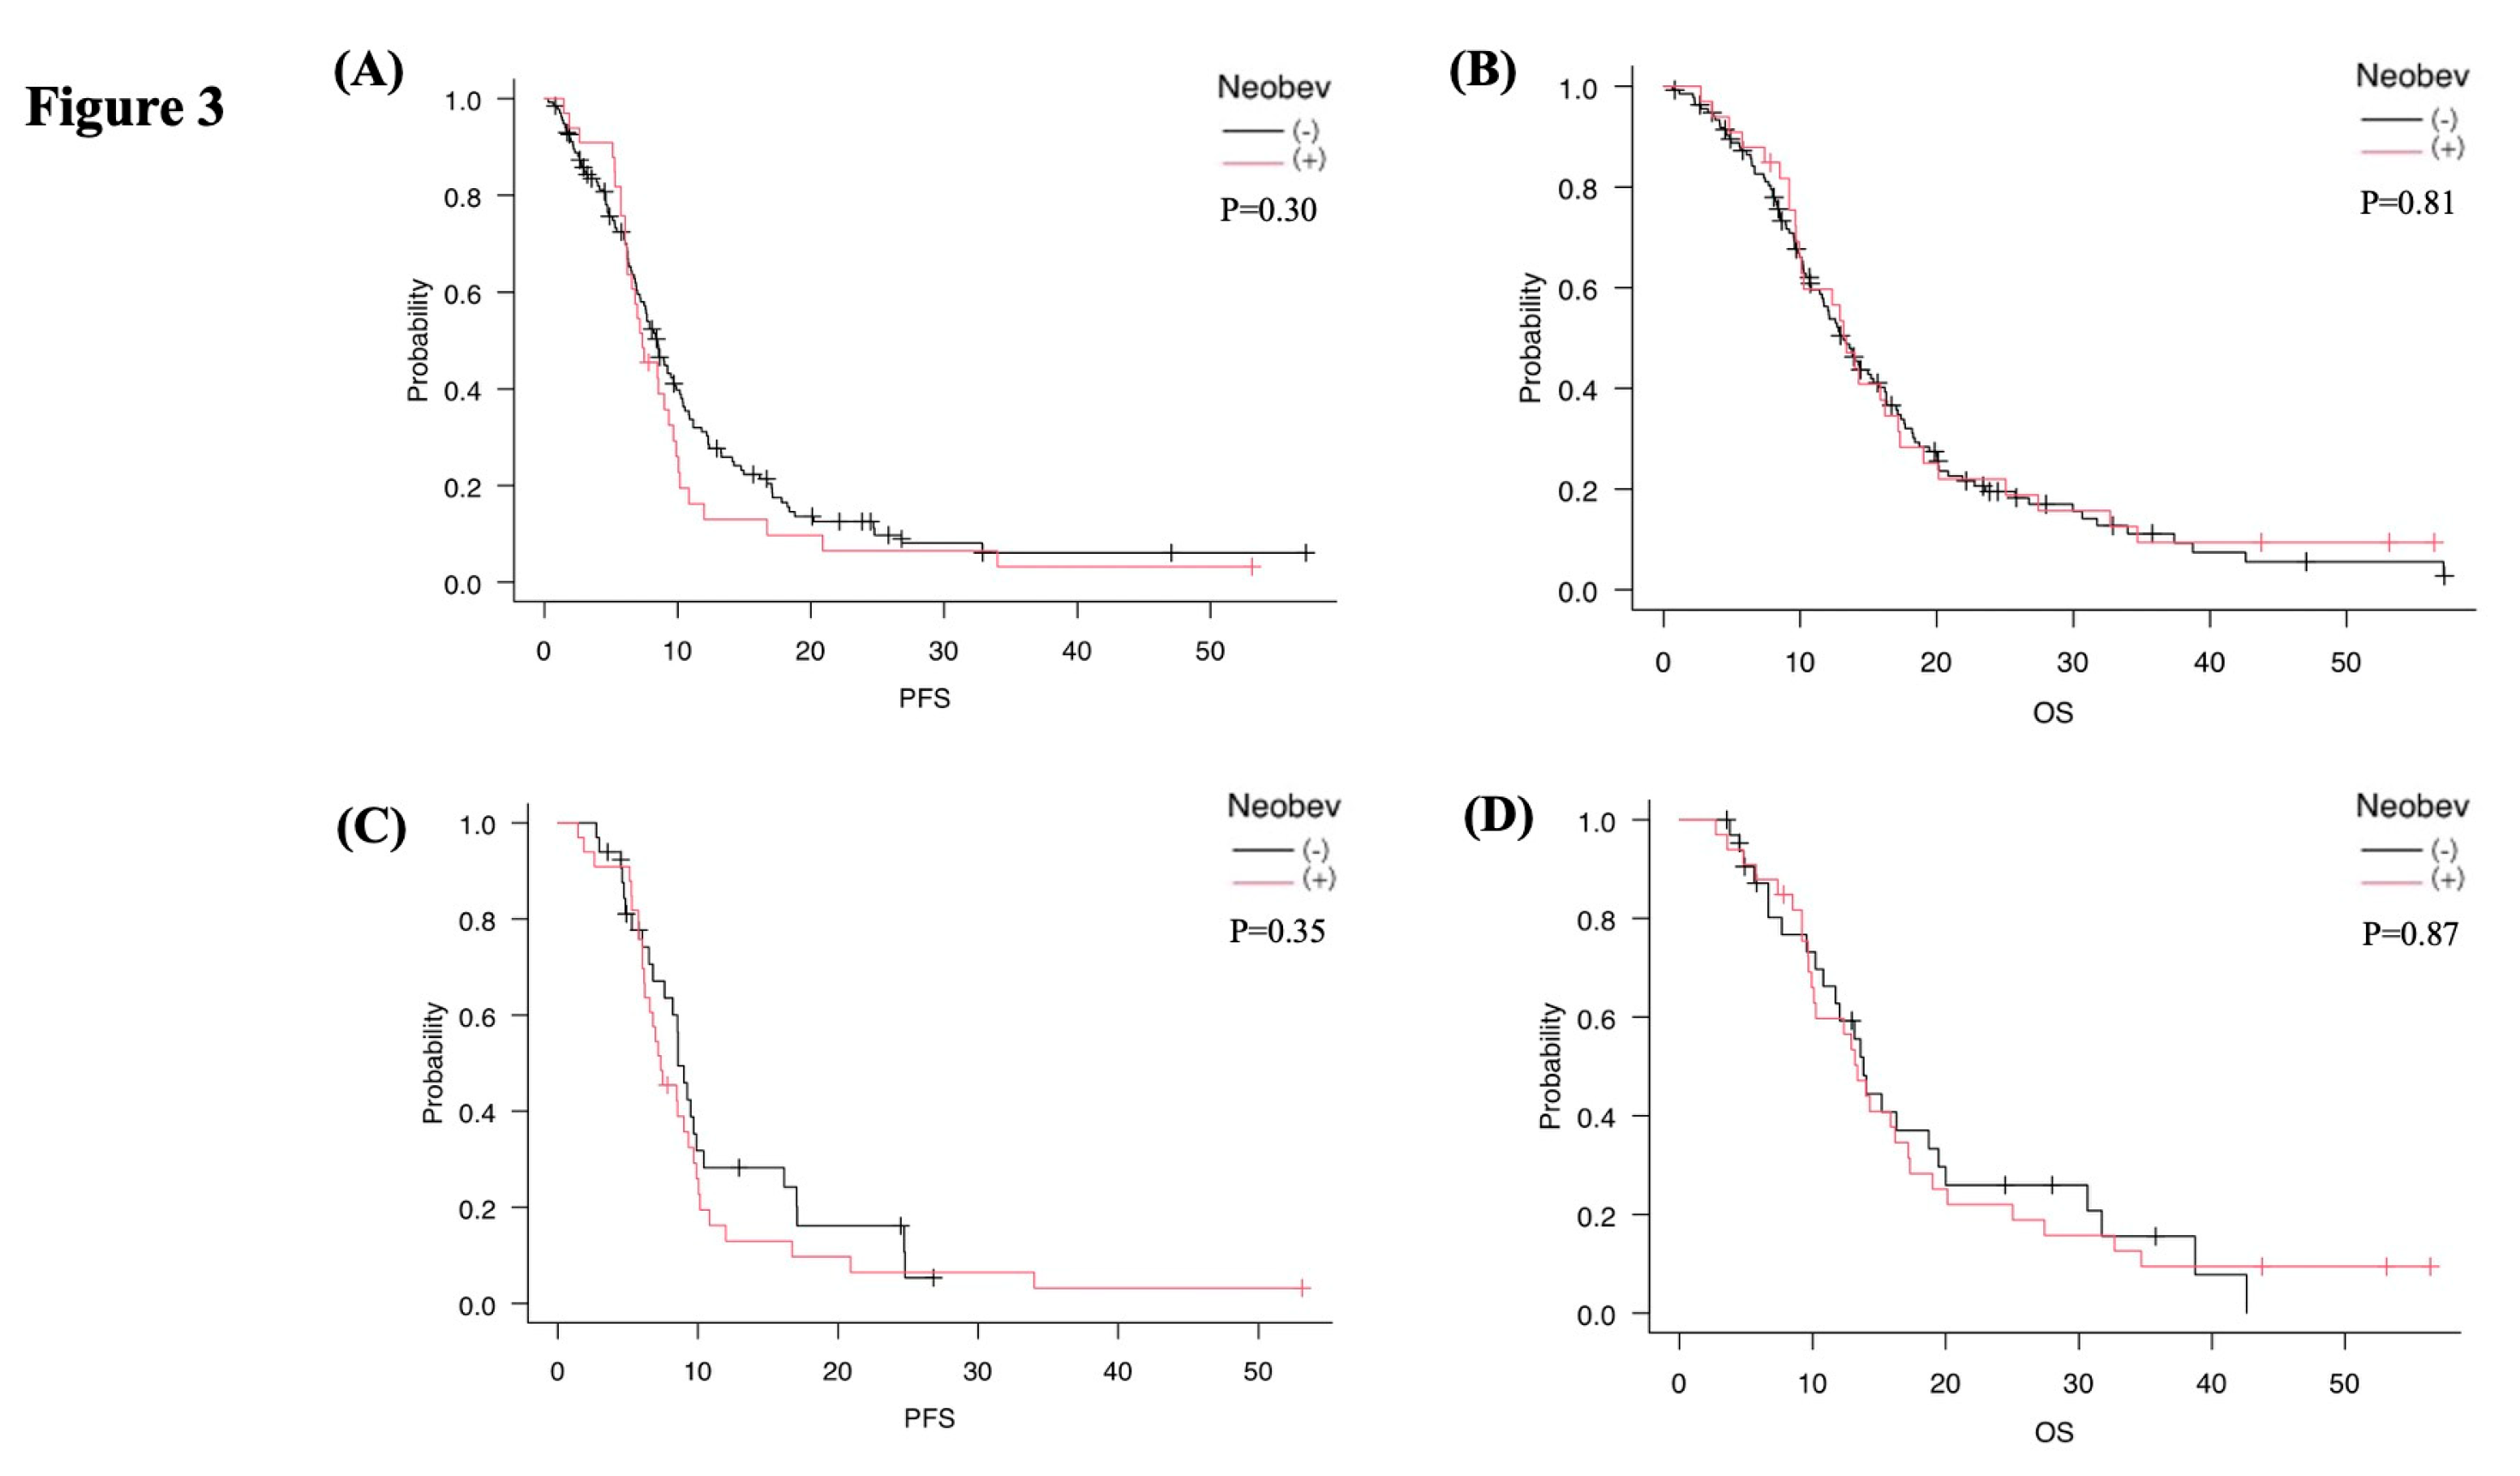
Figure 4.
Kaplan–Meier analyses stratified by neuroradiographic response after neoBev. PFS (A, C) and OS (B, D) stratified by average neuroradiographic response rates on T1Gd (A, B) and FLAIR (C, D) after neoBev. T1Gd good responders and poor responders are defined as neuroradiographic response rates on T1Gd ≥37% and <37%, respectively. Similarly, FLAIR GR and PR are defined as neuroradiographic response rates on T1Gd ≥55% and <55%, respectively. A) Median PFS for T1Gd GR and PR. B) Median OS for T1Gd GR and PR. C) Median PFS for FLAIR GR and PR. D) Median OS for FLAIR GR and PR. * = P<0.05.
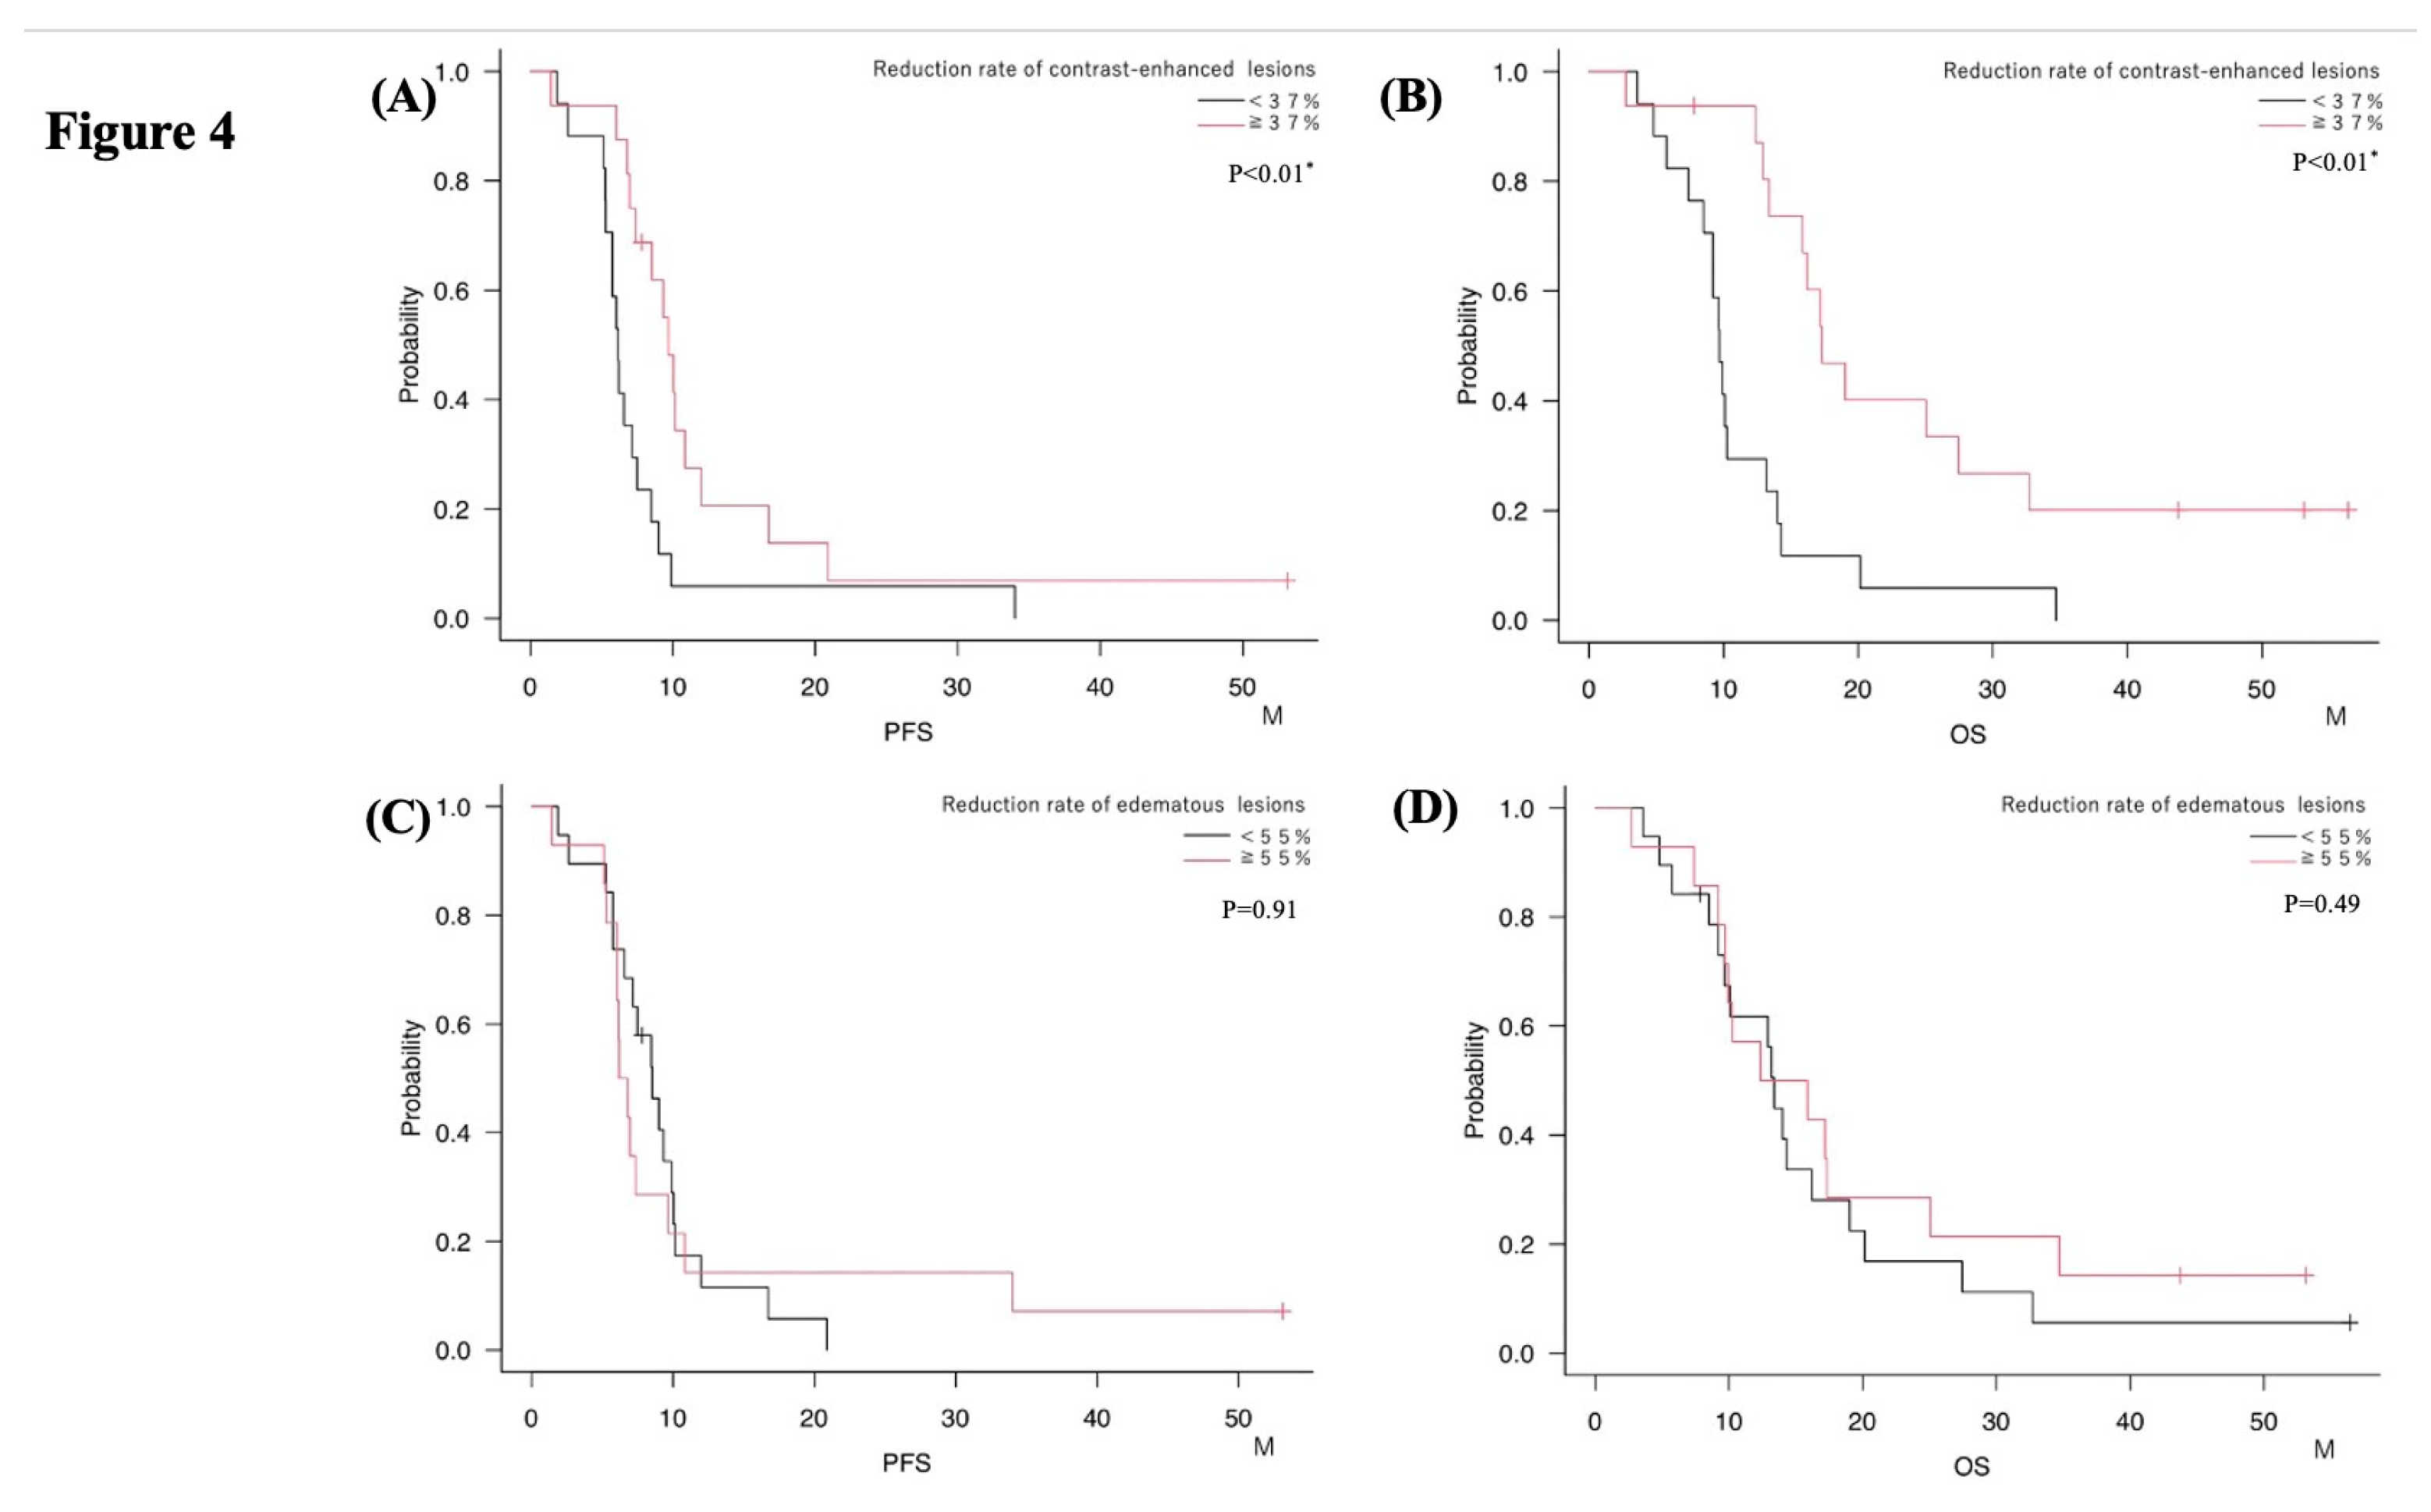
Figure 5.
Impact of resection rate on survival. Based on EOR stratification, the mPFS and mOS of patients in the NeoBev and Control groups were compared. In the GTR group, mPFS was 10.0 months in the NeoBev group and 16.6 months in the Control group (p=0.03). In the STR group, mPFS was 8.6 months in the NeoBev group and 7.7 months in the Control group (p=0.36). In the PR group, mPFS was 13.6 months in the NeoBev group and 12.1 months in the Control group (p=0.32). In the GTR group, mOS was 18.0 months in the NeoBev group and 23.2 months in the Control group (p=0.36). In the STR group, mOS was 18.8 months in the NeoBev group and 13.2 months in the Control group (p=0.72). In the PR group, mOS was 15.6 months in the NeoBev group and 16.4 months in the Control group (p=0.63). * = P<0.05.
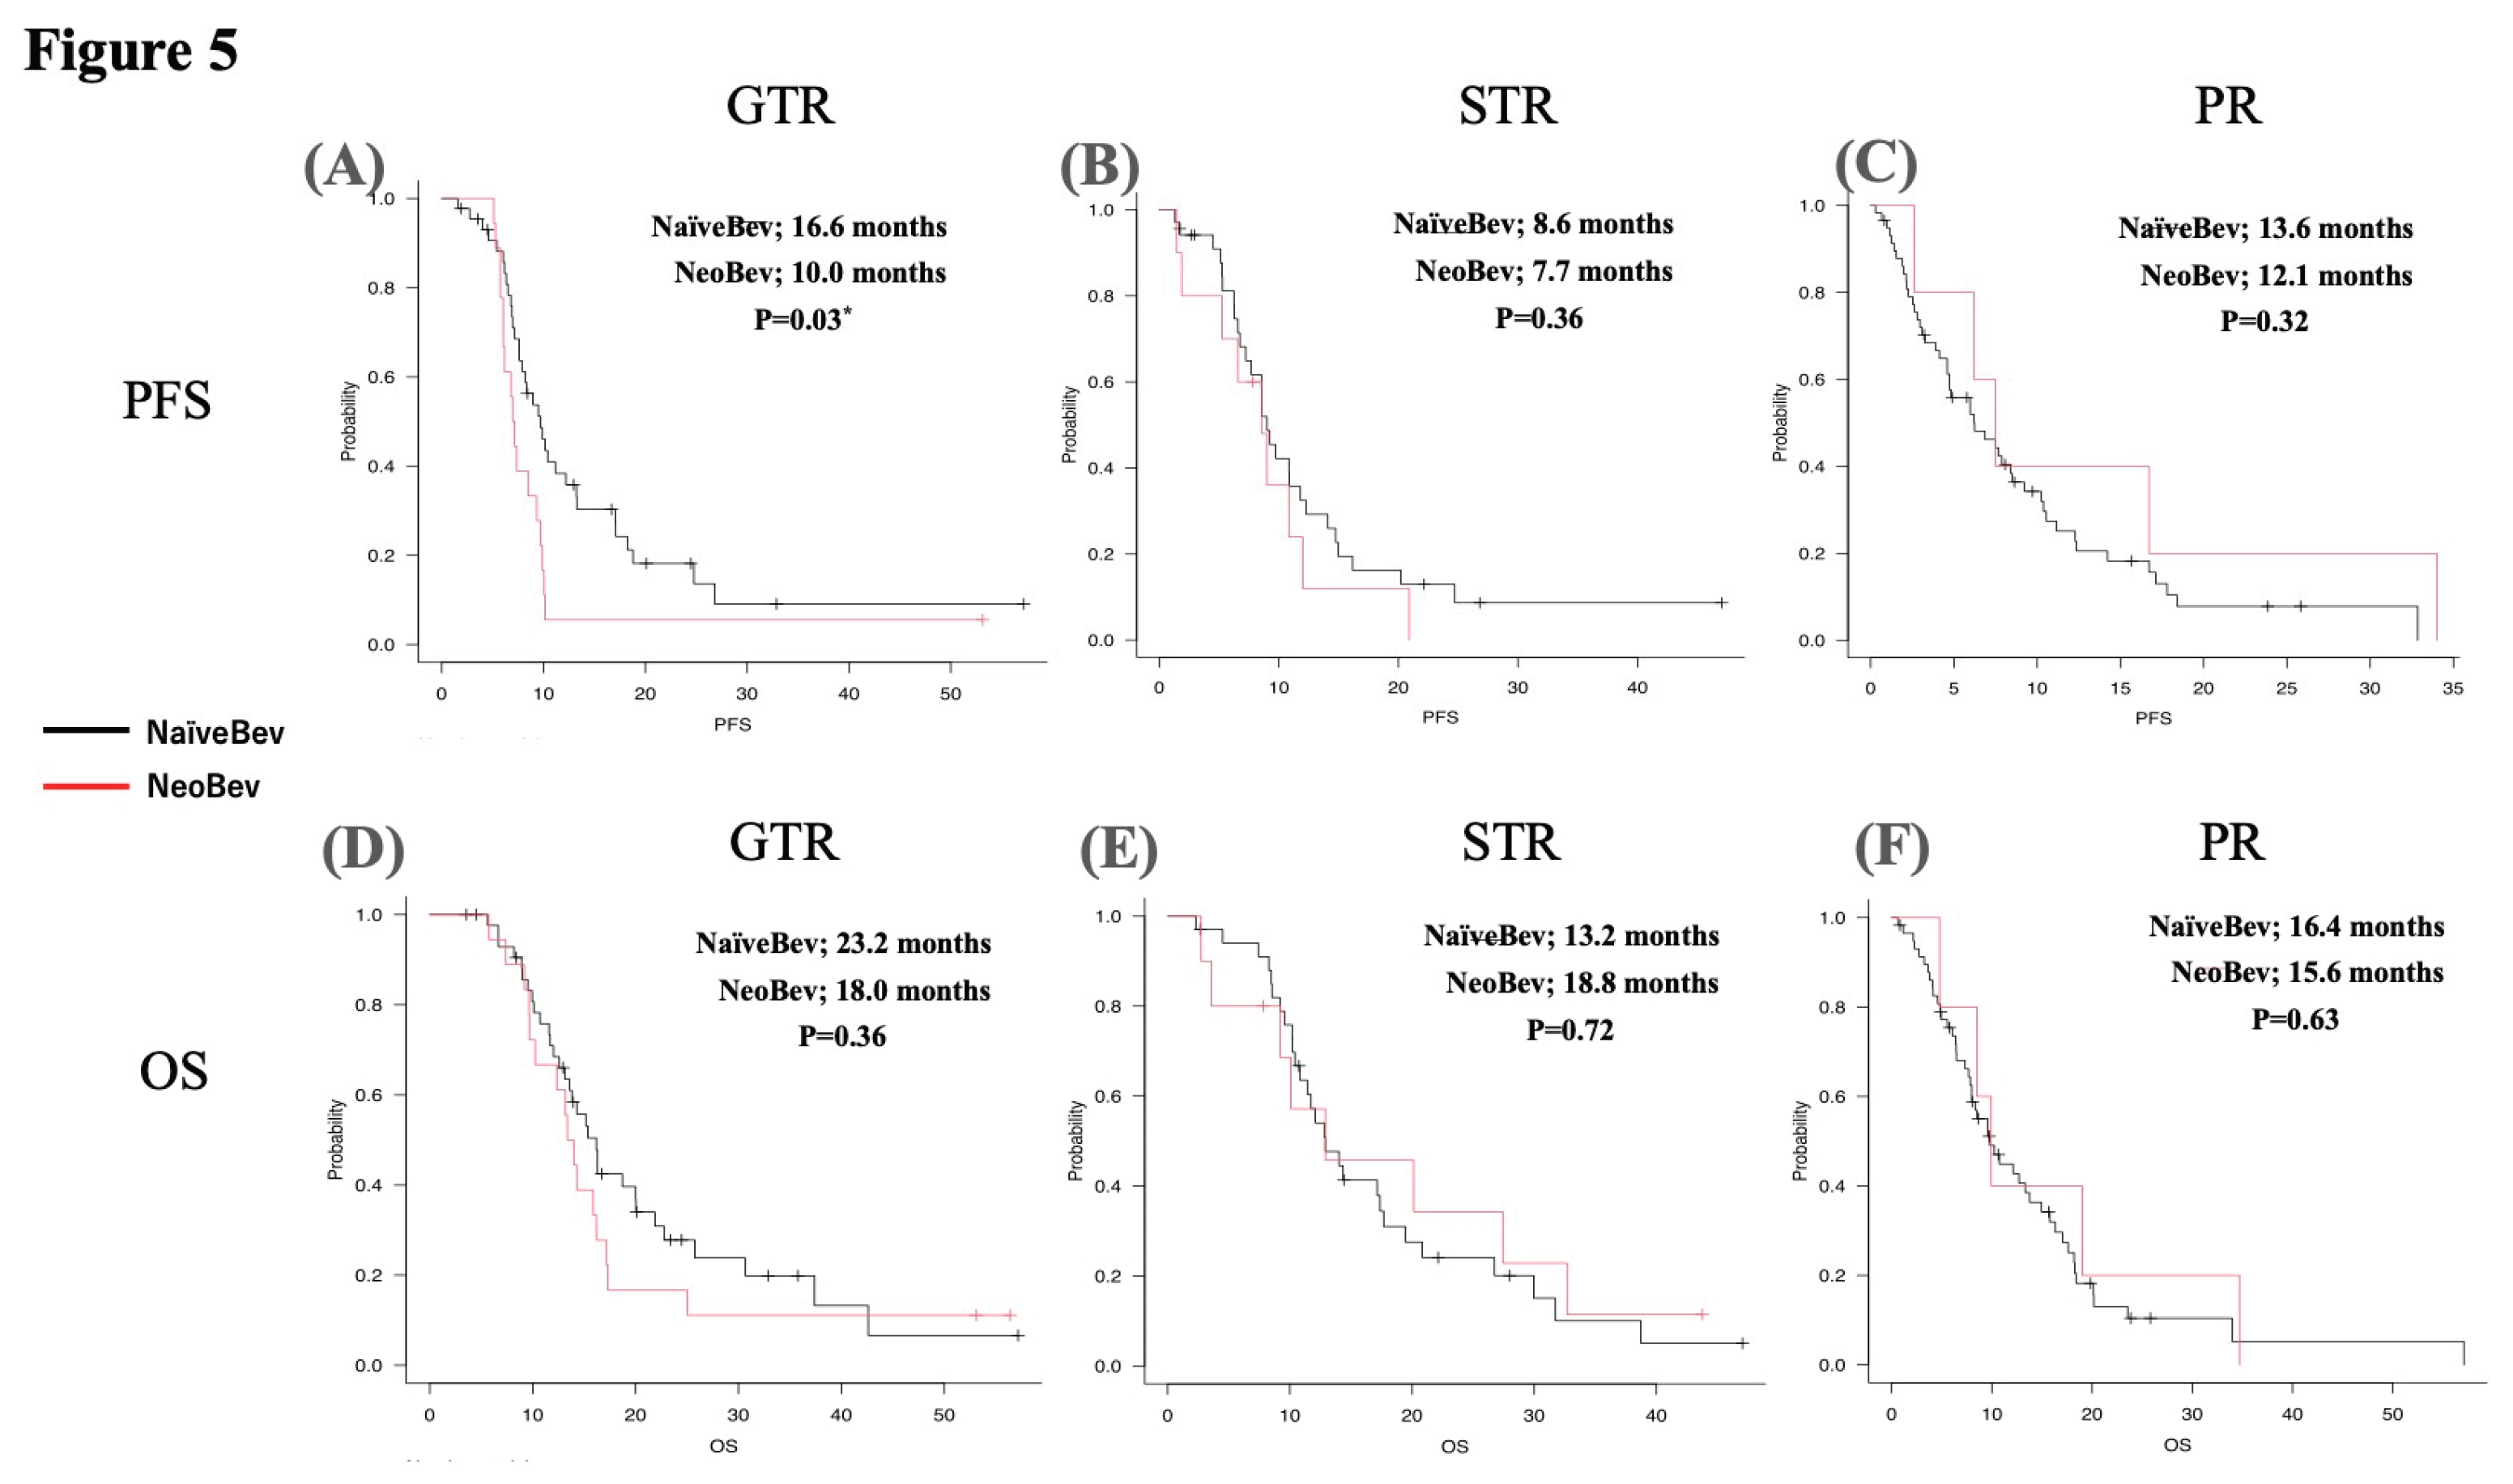

Table 1.
Baseline characteristics of the NeoBev and Control groups.
| Control | Neobev | p Value | ||
|---|---|---|---|---|
| Age | age<60 | 38 | 10 | 0.83 |
| age ≧60 | 98 | 23 | ||
| age<75 | 93 | 23 | 1.00 | |
| age≧75 | 43 | 10 | ||
| EOR | PR | 58 | 5 | <0.01* |
| STR | 34 | 10 | ||
| GTR | 44 | 18 | ||
| KPS | KPS ≦ 60 | 50 | 13 | 0.84 |
| KPS ≧ 70 | 86 | 20 | ||
| Location (left, right) | Left | 65 | 18 | 0.78 |
| Right | 62 | 14 | ||
| Both | 9 | 1 | ||
| Location (tent) | Supratentorial | 132 | 33 | 1.00 |
| Infratenttorial | 4 | 0 | ||
| Sex | Female | 62 | 10 | 0.12 |
| Male | 74 | 23 | ||
| IDH | Wildtype | 108 | 31 | 1.00 |
| Mutation (+) | 8 | 2 | ||
| NOS | 20 | 0 | ||
| MGMT | Metilation (+) | 26 | 3 | 0.71 |
| Unmetilation | 27 | 5 | ||
| NOS | 83 | 25 |
Bev = bevacizumab, EOR = extent of resection, GTR = gross-total resection, KPS = Karnofsky Performance Scale, NOS = not otherwise specified, PR = partial resection, STR = sub-total resection, * = P < 0.05.
Table 2.
Clinical characteristics of the NeoBev and Control groups (initial state and after propensity score matching).
Table 2.
Clinical characteristics of the NeoBev and Control groups (initial state and after propensity score matching).
| Initial State | Post Propensity Score Matching | ||||||
|---|---|---|---|---|---|---|---|
| Control | Neobev | p Value | control | Neobev | p Value | ||
| Age | age<60 | 38 | 10 | 0.83 | 9 | 10 | 1.00 |
| age≧60 | 98 | 23 | 24 | 23 | |||
| age<75 | 93 | 23 | 1.00 | 21 | 23 | 0.79 | |
| age≧75 | 43 | 10 | 12 | 10 | |||
| EOR | PR | 58 | 5 | <0.01* | 5 | 5 | 1.00 |
| STR | 34 | 10 | 10 | 10 | |||
| GTR | 44 | 18 | 18 | 18 | |||
| KPS | KPS≦60 | 50 | 13 | 0.84 | 13 | 13 | 1.00 |
| KPS≧70 | 86 | 20 | 20 | 20 | |||
| Sex | Female | 62 | 10 | 0.12 | 11 | 10 | 1.00 |
| Male | 74 | 23 | 22 | 23 | |||
EOR = extent of resection, GTR = gross-total resection, KPS = Karnofsky Performance Scale, PR = partial resection, STR = sub-total resection, * = P<0.05, Matching method: nearest-neighbor 1:1, caliper = 0.2.
Table 3.
Relationship between volume reduction rate and median PFS in contrast-enhancing and edematous lesions based on cutoff value.
Table 3.
Relationship between volume reduction rate and median PFS in contrast-enhancing and edematous lesions based on cutoff value.
| Target | Decrease Rate | Number of Samples | Median PFS | 95% CI (M) | p Value |
|---|---|---|---|---|---|
| Edematous lesion | Decrease rate<55% | 19 | 8.5 | 5.7-10.1 | 0.91 |
| Decrease rate≥55% | 14 | 6.5 | 5.3-9.7 | ||
| Contrast-enhanced lesion | Decrease rate<37% | 17 | 6.2 | 5.3-7.5 | <0.01* |
| Decrease rate≥37% | 16 | 9.7 | 6.9-12.0 |
CI = Confidence Interval, M = month, PFS = progression free survival, * = P<0.01.
Table 4.
Relationship between volume reduction rate and median OS in contrast-enhancing and edematous lesions based on cutoff values.
Table 4.
Relationship between volume reduction rate and median OS in contrast-enhancing and edematous lesions based on cutoff values.
| Target | Decrease Rate | Number of Samples | Median OS | 95% CI (M) | p Value |
|---|---|---|---|---|---|
| Edematous lesion | Decrease rate<55% | 19 | 13.4 | 9.2-16.2 | 0.49 |
| Decrease rate≥55% | 14 | 14.1 | 9.2-25.0 | ||
| Contrast-enhanced lesion | Decrease rate<37% | 17 | 9.7 | 7.4-13.2 | <0.01* |
| Decrease rate≥37% | 16 | 17.3 | 13.4-27.4 |
CI = Confidence Interval, M = month, OS = overall survival, * = P<0.05.
Disclaimer/Publisher’s Note: The statements, opinions and data contained in all publications are solely those of the individual author(s) and contributor(s) and not of MDPI and/or the editor(s). MDPI and/or the editor(s) disclaim responsibility for any injury to people or property resulting from any ideas, methods, instructions or products referred to in the content. |
© 2025 by the authors. Licensee MDPI, Basel, Switzerland. This article is an open access article distributed under the terms and conditions of the Creative Commons Attribution (CC BY) license (http://creativecommons.org/licenses/by/4.0/).
Copyright: This open access article is published under a Creative Commons CC BY 4.0 license, which permit the free download, distribution, and reuse, provided that the author and preprint are cited in any reuse.


