
Submitted:
17 December 2025
Posted:
18 December 2025
You are already at the latest version
Abstract
Ultra-processed food (UPF) consumption has generated a great deal of concern among nutrition scientists and consumers due to its potential relationship with increased risk of adverse health impacts. Evidence from intervention studies comparing UPF-rich and less-processed diets on cardiometabolic health outcomes is limited. Clinical trials that have been published to date focus on comparing more- and less-processed diets, as defined by the Nova system, and their impact on weight-related outcomes. Only one trial compares equally healthful more- and less-processed diets. The Dietary Guidelines for Americans with Ultra-Processed foods (DGA-UP) study will be the first trial to examine whether there is a differential effect to following recommendations from the 2020-2025 Dietary Guidelines for Americans (2020 DGA) including more- or less-processed foods as defined by the Nova classification system on cardiometabolic disease risk factors. A randomized controlled crossover dietary intervention study, DGA-UP will be conducted with 4 week provision of all meals to generally healthy male and female adults at eucaloric levels. The trial will consist of 2 dietary arms: 1) a less-processed 2020 DGA diet and 2) a ultra-processed 2020 DGA diet. The primary outcome is change in blood pressure on each diet from baseline to week 4. Both interventions will have excellent diet quality and contain similar amounts of macronutrients and micronutrients as well as the same types of food. DGA-UP will help to fill a significant research gap regarding potential impact of UPFs on cardiometabolic health markers independent of food type, diet quality, and micronutrient content. ClinicalTrials.gov registration: NCT07252037.
Keywords:
processed food
; diet quality
; cardiometabolic health
; ultra-processed
; dietary guidance
Introduction
There is a great deal of concern in the nutrition science literature and among consumers about potential adverse cardiometabolic health impacts from eating ultra-processed foods (UPF) [1,2]. The current body of research on UPFs is largely comprised of observational studies, which indicate associations between increased intake of UPFs and a range of adverse health outcomes including elevated blood pressure [3,4], excess weight gain [5,6], cardiovascular disease risk/incidence [7,8,9], inflammatory markers [10,11], and mortality [12]. Evidence from intervention studies is limited. To address some of the gaps in the literature, a Research Roadmap for UPFs was developed by experts from academia, government, and industry in 2023 [13]. This Roadmap used the Nova system to identify more- and less-processed foods, as Nova is the most widely used classification system in nutrition literature, though several methods of characterizing foods by “extent” of processing have been published [14,15]. Nova classifies all foods into one of four groups: 1) unprocessed or minimally processed foods; 2) processed culinary ingredients; 3) processed foods; 4) UPFs (Table 1) [16,17,18].
One of the research needs identified by the Roadmap was whether UPF intake influences risk for obesity or cardiometabolic disease, independent of diet quality. The Roadmap further stated that “randomized controlled trials matching dietary patterns for overall quality and food group intake are needed” [13]. Even in 2025, evidence from intervention studies comparing diets comprised primarily of UPFs with those comprised of mostly unprocessed foods on cardiometabolic health outcomes remains scarce [19,20,21,22].
Two randomized controlled trials (RCTs) that compared an “unprocessed” food diet and an “ultra-processed” food diet, per Nova, reported that a diet with most of its energy (kcals) coming from UPFs led to greater energy intake and weight gain [19,20]. A third RCT compared two diets, one comprised of mostly UPFs and the other comprised of mostly less-processed foods per Nova, both adhering to the United Kingdom’s (UK) dietary guidance [23], on weight change and cardiometabolic health markers [21]. Both diets led to weight loss and improved health indicators, but the weight change was greater with the less-processed diet [21]. A fourth intervention study assessed the impact of excess and adequate calories from unprocessed foods and UPFs in men but focused on reproductive health indicators as a primary outcome [22].
Both the observational studies and RCTs on UPFs published to date have important limitations. A major limitation of the observational research on UPFs is the ability of these studies to accurately categorize foods according to Nova, because the granularity of data (e.g., brand names, product names, and ingredient lists for individual food and beverage products) required to implement this categorization system is not available in major datasets used to investigate interactions between foods from Nova groups and health outcomes [5,24,25,26,27,28,29,30,31]. With the RCTs on UPFs, two did not control for diet quality, food type, or micronutrient content of the intervention diets [19,20], and one did not explicitly control for food type or micronutrient content [21]. All three studies focused on weight as a primary outcome rather than cardiometabolic health markers. Additional research is required, therefore, to understand whether foods categorized as “ultra-processed” on the Nova classification scale contribute to adverse cardiometabolic health outcomes when diet quality, nutrient content, energy intake, and food type are all held constant. That is, further studies are needed to address the knowledge gap identified by the Research Roadmap.
While Nova is widely used to identify UPF products, some of the foods and beverages that are considered UPF in the Nova system are nutrient-dense, despite their level of processing [32,33]. Dicken et al., for instance, developed an intervention diet aligning with the UK’s Eatwell Guide that included 90.7% of energy from UPFs while meeting recommendations for macronutrient intake and servings of fruits, vegetables, dairy, and starchy foods [21]. Some of the foods included in Dicken et al.’s healthy UPF menu include fruit and oat bars, plant-based milk, flavored yogurt, rice cakes, granola bars, and multigrain breakfast cereals [21]. Any extruded breakfast cereal is classified as a UPF according to Nova [34]. Breakfast cereals are also the top contributor to whole grain intake among Americans ages 2 years and older as well as a top contributor to calcium, vitamin D, potassium, and fiber intake among Americans 1 year and older [35]. Breakfast cereals, alongside other processed and packaged foods like canned fish, whole grain and enriched breads, and nut butters, have historically made important contributions to the nutrient-density of American dietary patterns [36].
Nova states that “ultra-processed foods are operationally distinguishable from processed foods by the presence of food substances of no culinary use” and lists additives such as flavors and colors as two examples of these food substances [34]. Hundreds, if not thousands, of nutrient-dense foods have flavors and colors added, including items such as whole wheat banana bread, which may have natural or artificial vanilla and/or banana flavors added, and yellow cheddar cheese colored with annatto. Other foods with flavors and colors include premade salsa, canned corn, tinned fish, pizza sauces, trail mix, canned lentils, hummus, canned peaches, dried bananas, instant oatmeal, tofu, and hot wheat cereal, to provide some examples. Studies comparing Nova to nutrient profiling methods have found that UPFs fall into a wide range of nutrient densities [31,37,38,39,40,41,42]. Diets containing mostly UPFs (>90% total energy) can meet most recommendations from the 2020-2025 Dietary Guidelines for Americans (2020 DGA) [43], including micronutrient content. Yet, this type of nutrient-dense UPF diet has not been evaluated for its impact on health in a clinical trial.
This manuscript introduces a protocol for the Dietary Guidelines for Americans with Ultra-Processed foods (DGA-UP) study, an RCT aimed at addressing gaps in UPF intake and cardiometabolic health through a feeding study with UPF- and unprocessed- foods intervention diets matched for diet quality, nutrient content, energy density, and food type. The primary objective of DGA-UP is to evaluate the impact of diets composed primarily of ultra-processed or less processed foods that meet dietary guidelines recommendations on chronic disease risk factors. More specifically, when DGA-compliant diets comprised of mostly ultra-processed and less-processed foods (per Nova) are fed to generally healthy adults, determine whether there is an impact on blood pressure, fasting glucose and insulin concentrations, or blood lipids (total cholesterol, HDL-C, LDL-C, triglycerides). The hypothesis for this study is that changes in blood pressure (primary outcome), fasting glucose and insulin concentrations, and changes in cholesterol levels (total, HDL-C, LDL-C) across the 4-week duration of each dietary intervention (ultra-processed DGA and less processed DGA) will not significantly differ.
Experimental Methods
- Study Design
DGA-UP is a randomized controlled crossover dietary intervention study performed with four-week provision of all meals to generally healthy and normotensive, sedentary male and female adults at eucaloric levels. This study, registered at ClinicalTrials.gov [NCT07252037], will be conducted at the U.S. Department of Agriculture- Agricultural Research Service (USDA-ARS) Grand Forks Human Nutrition Research Center (GFHNRC) from January 2026 through October 2029. The study protocol was approved by the University of North Dakota Institutional Review Board (IRB0006680). All study procedures will be conducted to align with the Declaration of Helsinki for human studies. Participants will provide written informed consent and have the chance to discuss any questions or concerns with study staff prior to starting the study and will be compensated for their participation.
The trial will consist of 2 dietary arms, both of which will include diets based on the Healthy U.S. Style Dietary Pattern (HUSDP) from the 2020 DGA:
1) an eucaloric less-processed HUSDP (LP- HUSDP; 4 weeks); and
2) an eucaloric ultra-processed HUSDP diet (UP- HUSDP; 4 weeks).
Dietary Intervention
Menus for this study were developed using methods adapted from Hess et al. [44]. The GFHNRC has a 2020 DGA base menu (5-day HEI-2015 score = 92.35) used in feeding studies to represent a “healthy diet.” This menu was used as the model for UP- HUSDP and LP- HUSDP with adjustments made to different ingredients and foods to accommodate processing levels. Both UP-HUSDP and LP-HUSDP are 5-day menus. Initial determination of processing level (per Nova classification system) and DGA “fitness” of each food were determined by consensus of three reviewers for each aspect (e.g., three experienced Nova classifiers and three experts on DGA dietary patterns/food groups). As the menu was adjusted for ingredient availability, formulation changes by food manufacturers, and taste, subsequent determinations of Nova classifications were made via consensus of GFHNRC research staff.
Participants will receive three meals and one snack per day and will be able to eat the provided food at a cadence of their choice. The LP- HUSDP includes 100% kcal from foods from Nova categories 1 to 3, while the UP- HUSDP diet includes an average of 88% kcal from Nova category 4/UPFs (across all 5 days). Both intervention menus have excellent diet quality as measured by Healthy Eating Index-2020 (HEI-2020) scores. LP-HUSDP has an HEI-2020 score of 98, and the UP-HUSDP has an HEI-2020 score of 97. The 1-point difference in HEI scores is not a “meaningful” one, according to research from USDA’s Center for Nutrition Policy and Promotion as well as the 2025 DGAC Report [35,45]. Radar plots of the HEI scores of both diets can be found in Figure 2.
Both diets contain amounts of macronutrients within the Acceptable Macronutrient Distribution Ranges [46], and amounts of micronutrients within Dietary Reference Intakes [47]. Sodium amounts exceed the Chronic Disease Risk Reduction recommendation of 2300 mg per day [48] in the two intervention diets. However, the sodium amounts in the two diets are nearly equivalent. The LP-HUSDP contains 2542 mg of sodium on average, and the UP-HUSDP contains 2541 mg of sodium, on average. Total sugar and saturated fat amounts are below 10% of total energy in both diets, which is within recommendations from the 2020 DGA [47]. The UP-HUSDP has 33 g added sugar (7% total sugar), and the LP-HUSDP has 30 g added sugars (6% of total energy). The UP-HUSDP contains 18 g saturated fatty acids (7.9% of total energy), while the LP-HUSDP has 17 g saturated fatty acids (7.5% of total energy).
The participant menu can be viewed in Supplemental Table 1, and the nutrient profile of the intervention diets are in Table 3. Intervention menus were finalized after testing by the GFHNRC Dietary Core for food preparation feasibility, storage stability, and taste. All foods and caloric beverages will be prepared by our metabolic kitchen staff using commercially available foods and provided as a 5-day rotating menu. The table in Supplemental Table 2 shows the servings from each food group in the HUSDP from the 2020 DGA, which was used as the model for developing the intervention diets in this study [47]. Pictures of both study menus can be found in Supplemental Figure 3.
Participants and screening
Participants (n = 79) will be recruited from the Grand Forks, ND (USA) community. Adults eligible to participate will include apparently healthy males and females ≤65 years of age with blood pressure in the normal to Stage I hypertensive range [49] and body mass indices (BMI) between 18.5 and 34.9 kg/m2. Participants must be able to understand and sign the consent form, have their own transportation to study visits, and be willing to eat study food and comply with study demands. Participants may not be taking statins, medication to lower blood pressure, weight loss medication, or anti-inflammatory or anti-diabetes medications. Participants will be excluded if they are pregnant or planning to become pregnant, lactating, have a diagnosed eating disorder, smoke, have cancer, or report regular exercise.
Prior to study participation, all initially eligible participants will be invited to an informational meeting where the protocols will be explained and written informed consent obtained. Informational meetings will be followed by a screening exam, detailed below, to determine if prospective participants are eligible.
Recruitment
Participants will be recruited by the study staff members using targeted recruitment efforts to meet the demographic goals for participants in this study. Potential participants will be recruited through advertising in the Grand Forks metropolitan area via brochures, online advertisements, newsletters, flyers, expos and trade shows, in addition to the GFHNRC website. The GFHNRC has a decades-long history of successful human research, including feeding trials of 4 to 12 weeks [50,51,52,53,54]. Participants will be recruited until 79 have completed all study requirements. Anticipating a 20 percent potential dropout rate, approximately 95 participants will need to be enrolled for 79 participants to complete the study.
Randomization
After study enrollment, participants will randomized into treatment groups stratified by age and sex groups. Randomization will be performed by the trial statistician. Participants will be informed that this study measures the effects of “ultra-processed” and “less-processed” diets on cardiometabolic health but will be blinded to their individual order of diet interventions throughout trial data collection. Researchers will not be blinded to the intervention assignments.
Experimental Protocol
- Screening (S) Exam
The screening exam includes: 1) anthropometric measurements, 2) resting blood pressure, and a 3) health history questionnaire. After the informational meeting has been conducted and informed consent provided, height, weight, and resting blood pressure will be obtained to ensure eligibility. Anthropometric measurements will be done in bare or socked feet and light clothing. Blood pressure will be taken by trained study staff using the automated ADC ADView 2 Modular Diagnostic Station (American Diagnostic Corporation, Hauppauge, NY). Participants will rest for 5 minutes in a comfortable sitting position (legs uncrossed, back and measurement arm supported). Three measurements will be taken with 2-minute intervals, and the average of these multiple readings will then be calculated and recorded. Individuals meeting anthropomorphic and blood pressure inclusion criteria will be selected to participate in the study. After completing the screening and informed consent, participants will be scheduled for a baseline study visit.
- 2.
- Baseline (BL) Study Visit
Baseline diet will be assessed using a series of 3 food diaries completed with the ASA24 Automated Self-Administered Dietary Assessment Tool (ASA24) [55]. Reflection spectroscopy (RS; Veggie Meter; Longevity Link Corp., Salt Lake City, UT, USA) will be conducted to measure skin carotenoids [56,57], and participants will complete the Subjective Happiness Scale (SHS) questionnaire [58]. A food preparation time questionnaire based on survey questions provided as part of National Health and Nutrition Examination Survey (NHANES) 2007-2010 and using cut-points established by Wolfson et al. will be given at this visit as well [59]. Dual energy x-ray absorptiometry (DXA) scans will be conducted to determine body composition. Calibration to external standards will be performed prior to each individual scan. Absence of pregnancy will be confirmed in all pre-menopausal women prior the scan. Participants will complete the International Physical Activity Questionnaire [60], which will be used to calculate their energy requirements in conjunction with the Dietary Reference Intakes for Energy from the National Academies for Science Engineering and Medicine [61].
- 3.
- Phase 1
Participants will be randomized into one of the 2 dietary interventions (UP- HUSDP or LP- HUSDP) for the first four weeks (Figure 1). Each dietary group will be provided all meals (food and drink, except water) for 4 weeks. Participants will pick up their food Monday-Friday at a time that is convenient for them to promote study adherence. Participants in both groups will receive diets with adequate energy to maintain their baseline weight (as determined by Estimated Energy Requirements from the National Academies for Science Engineering and Medicine [61]) and instructed to consume all food and beverages provided. Participants will visit the GFHNRC facility once a week throughout the four-week period to have their blood pressure measured, to be weighed, and to address any potential questions or issues with study compliance. Energy will be adjusted to maintain starting weight. A change in body weight of >2 kg that is sustained for 2 consecutive weeks will be used as the criteria for determining when an adjustment in energy level is necessary. At the beginning and end of each Phase, participants will also complete a fasted blood draw as part of the GFHNRC facility visit as well as the SHS (see Table 4 for analytes and Supplemental Document 4 for explanation and method of analysis for blood samples). Participants will complete a daily dietary compliance questionnaire (Supplemental Document 5) throughout the intervention period, asking if they ate everything provided or anything not provided.
Adherence to the intervention diets will also be assessed with an objective method. In addition to the daily dietary compliance questionnaire, RS measurements [56,57] will be performed weekly at facility visits. Participants will be told that RS measures adherence to the diets. Changes in skin carotenoids can be detected with an increase in carotenoid-containing fruit and vegetable intake of only 0.8 cup-equivalents [62]. This objective measure of compliance also instills a measure of accountability to participants. Each week, participants will also be weighed, another measure of compliance.
- 4.
- Washout
Participants will go through a minimum 3-week washout period between diets, a longer period than the 5 day washout used by a previous intervention study (the Dietary Approaches to Stop Hypertension trial, or “DASH”) also with blood pressure as a primary outcome measure [63]. Participants will also complete (3) 24h food diaries during the second week of the washout period.
- 5.
- Phase 2
Participants will then consume the second dietary intervention for 4 weeks (Figure 1). Besides the change in dietary intervention, Phase 2 will mirror the procedures included in Phase 1.
Statistical Analysis and Data Management Plan
- Power analysis
Three endpoints were used to calculate power for this study- fasting glucose, fasting triglycerides, and systolic blood pressure, and the highest participant number from the three measures was selected for the study implementation. Data informing fasting glucose and fasting triglyceride calculations for power calculations come from the Krishnan et al.’s study conducted at the USDA-ARS Western Human Nutrition Research Center, an intervention trial on DGA-adherent diets among women with overweight or obesity [64]. Data informing systolic blood pressure calculations comes from Zhang et al.’s study assessing blood pressure among Americans with data from NHANES [65].
Fasting Glucose: The power for this endpoint was calculated via a mean difference in fasting glucose of 1.2 mg/dL at week 4 for the diets with a 100(1-2)% confidence interval contained inside an equivalence region with lower bounds and upper bounds of -5 mg/dL and 5 mg/dL [66], respectively, with a standard deviation of 10.9 mg/dL, a correlation of 0.5 within subjects, a significance level of = 0.05, and a power of 0.9 yields a total sample size of 79 subjects. This assumes no carryover or period effects as well as no interactions between subjects, diets, and periods.
Fasting Triglycerides: The power for this endpoint was calculated via a mean difference in fasting glucose of 11.1 mg/dL at week 4 for the diets with a 100(1-2)% confidence interval contained inside an equivalence region with lower bounds and upper bounds of -42 mg/dL and 42 mg/dL, respectively, with a standard deviation of 78.8 mg/dL, a correlation of 0.5 within subjects, a significance level of = 0.05, and a power of 0.9 yields a total sample size of 78 subjects. This assumes no carryover or period effects as well as no interactions between subjects, diets, and periods.
Systolic Blood Pressure: The power for this study was calculated via a mean difference in systolic blood pressure of 1 mm Hg at week 4 for the diets with a 100(1-2)% confidence interval contained inside an equivalence region with lower bounds and upper bounds of -5 mm Hg and 5 mm Hg,[66] respectively, with a standard deviation of 10 mm Hg, a correlation of 0.5 within subjects, a significance level of = 0.05, and a power of 0.9 yields a total sample size of 56 subjects. This assumes no carryover or period effects as well as no interactions between subjects, diets, and periods.
A mean difference of 1 mm Hg is anticipated at week 4 based on NHANES data that indicates most American adults consume 2,745 mg/d of potassium [65]. Because the intervention diets provided in this study contain an additional 1,000 mg/d potassium above typical intake, a 1 mm Hg difference in blood pressure corresponding with this increase in potassium intake after 4 weeks on each intervention diet is expected [65].
- b.
- Data analysis
The data from this study will be analyzed using a mixed model with all relevant biomarkers as outcomes and fixed effects of diet (UP- HUSDP or LP- HUSDP), week (1, 2, 3, 4; 8, 9, 10, 11), diet x sequence (UP- HUSDP/LP- HUSDP, LP-HUSDP/UP-HUSDP), and phase (1, 2), and a random effect of subject not nested within treatment. The mixed model is used as it can account for missing data and perform intent-to-treat analyses [67]. If the diet x sequence interaction is significant, a carryover effect is assumed, and a contrast will be written to compare the diets at the first time point. A contrast will be written to compare the diets at the fourth week, and, if the 100(1-2)% confidence interval for the difference is contained completely within the equivalence bounds of -5 to 5 (systolic blood pressure), the null hypotheses of inferiority and superiority two one-sided tests are rejected.
Age, percentage body fat, baseline UPF intake, baseline diet quality as determined from ASA24 analysis, and hypertension stage (normal or Stage I) will be evaluated as potential covariates of systolic blood pressure as will RS measurements.
- c.
- Data monitoring and management
Data entry will be conducted separately by two study staff members to ensure data quality. Due to low risk of adverse events from participation in this study, a data monitoring committee will not be established. For data retention, the GFHNRC current practices will be followed. That is, any hard copy data records will be stored for a minimum of three years from the time the study is completed. Electronic data records will be maintained for a period of at least five years after the study has been completed. Any paper records generated from this study will be accessible only by research personnel and will be kept locked and secure storage. Computer files will be accessible only by research personnel and protected by passwords and encryption. Data transfer conducted electronically will be through secure email and encrypted external storage. All active servers are managed and backed up daily by the USDA Information Technology. Data is available to study personnel throughout the duration of the study on the GFHNRC’s Center Automated Research System, a secure database established specifically to house data from human studies conducted at the GFHNRC. Any shared data will be de-identified.
Discussion
Overall, DGA-UP will help clarify the utility of Nova and the UPF label to define healthful dietary patterns, a gap in the literature identified by the 2023 Research Roadmap [13]. One of the few differences between the two interventions (UP-HUSDP and LP-HUSDP) is the number and nature of additives in the foods and beverages provided in the menus. The foods and beverages in UP-HUSDP have 76 ingredients and additives (Supplemental Document 6) from calcium disodium EDTA to dextrose to sucralose not present in the LP-HUSDP. While the menus look identical in most respects, the food formulations indicate clear distinctions. Pilot testing of the menu indicates that the menus taste similar as well. The similarities in appearance and taste between the two diets will allow participants to be blinded as to the current arm of the trial they are in, an important strength of this trial.
UP-HUSDP and LP-HUSDP were developed from the same base menu with differences between the two menus arising only from the Nova classification of the ingredients used to make the meals. For instance, the whole grain bread on the LP-HUSDP is homemade wheat bread, while the wheat bread on the UP-HUSDP is mass-produced. As another example, some meals in DGA-UP include 100% fruit juice since the 2020 DGA recognizes 100% fruit juice as an item that can provide a serving of fruit [47]. Both the LP-HUSDP and the UP-HUSDP include 100% fruit juices. However, the 100% fruit juice in the UP-HUSDP includes “cosmetic additives” (natural flavors, citric acid) that make it a UPF while the 100% fruit juice in the LP-HUSDP lists 100% fruit juice as its sole ingredient, a Nova Group 1 food. The menus are matched in food type and preparation, so the food textures are identical in nearly all meals, a factor that can affect eating rate and satiety [68,69]. Importantly, the energy density of the two menus is matched as well (1.0 kcal/g after rounding). UPFs do not necessarily have higher energy density than “less-processed” foods as defined by the Nova classification system [20]. Furthermore, the menus on DGA-UP will not be provided ad libitum, and participants will be actively monitored to confirm that they do not gain or lose weight throughout the intervention, ensuring that changes in cardiometabolic health markers are not due to weight fluctuations.
Other strengths of this trial include the use of DXA to measure body composition and the intervention duration. DXA is an established method for evaluating adiposity [70] that has been used by only one of the other RCTs comparing more- and less-processed menus [19]. The four-week duration of the trial was selected based on past research that indicates that four weeks is a sufficient intervention duration to obtain differences in blood pressure and is a commonly used intervention duration for this primary endpoint [71,72,73,74,75,76]. Four weeks is also a sufficient timeframe to detect changes in fasting glucose and insulin [77,78,79,80] and changes in the lipoprotein panel measures [81,82,83,84,85,86,87,88,89].
While a dietary intervention among a free-living population will be an important strength of this trial, the “free-living” situation also limits participant monitoring. This study may provide a more realistic assessment of how eating or not eating a UPF-rich diet affects health markers when integrated into regular life, but conducting the study outside of an inpatient setting prohibits strict monitoring of food and beverage consumption and eating intake patterns such as eating rate and eating frequency. Participants will receive instructions about menu additions to avoid throughout the interventions, however, despite these instructions, participants may add UPF items to the less processed menu such as diet sodas or seltzer waters or add salt or fat to the provided meals with butter, sugar, or sodium-containing seasonings. The research staff will monitor study compliance with daily questionnaires and weekly face-to-face meetings. Participants will be reminded often that truthfulness is valued over “perfection.”
The most challenging limitation of this study is the frequent formulation changes of foods and beverages by manufacturers. Some products selected for the UP-HUSDP may become “processed” (Group 3) foods during the duration of the trial if certain ingredients or additives are removed or replaced and some products on the LP-HUSDP may become “ultra-processed” if certain ingredients or additives are added. Additionally, manufacturers sometimes discontinue products as well. Since beginning to track UPFs in 2022, we have identified changes to approximately 5% of products in our UPF database, inclusive of both discontinuations and formulation changes. Any of these changes to items on the LP-HUSDP or UP-HUSDP will disrupt the study menu and require revisions to one or both menus for future participants. To mitigate the impact of formulation changes, the ingredient contents of both menus will be reviewed on a regular basis and changes made as needed to ensure the UP-HUSDP contains mostly energy from Nova Group 4 foods and the LP-HUSDP contains only foods that fit into Nova Groups 1, 2, and 3.
Overall, the DGA-UP trial will advance research on food classification by processing, providing insight into whether additives and ingredients not commonly used in home cooking affect cardiometabolic health outcomes when fed as part of a healthy dietary pattern to generally healthy adults.
Dissemination
Results of this study will be disseminated through a series of peer-reviewed publications as well as presentations to the research community, health care professionals, policymakers, and the public. Following the acceptance of study data for initial publication in a peer-reviewed journal, de-identified participant data will be stored and made available to other researchers via an online data repository (Open Science Framework).
Contributions
JMH designed research, JMH and CJP wrote first draft, and all authors reviewed, edited, and approved the final manuscript
Financial Support
Supported by USDA Agricultural Research Service project grant # 3062-10700-003-00D.
Declaration of Interests
JMH, CJP, AJS, SC, and DGP declare that they have no known competing financial interests or personal relationships that could have appeared to influence the work reported in this paper.
JS has received research support from Taiyo and Barilla, serves on scientific advisory boards for Simply Good Foods, Sustainable Nutrition, Olipop, Kenvue, and the Institute for the Advancement of Food and Nutrition Science (IAFNS). JS also owns Slavin Sisters Farm LLC, a 119-acre mixed-use family farm in Walworth, WI.
Acknowledgements
We thank Mary Jo Peltier and Deb Sauve for their work in developing the study menus. And we thank evaluators who reviewed all menu items for Nova classifications and ability to be included in the Dietary Guidelines for Americans. Finally, we thank all the participants who will be involved in this study.
List of Abbreviations
- 2020-2025 Dietary Guidelines for Americans (2020 DGA)
- 2025-2030 Dietary Guidelines Advisory Committee (DGAC)
- ASA24 Automated Self-Administered Dietary Assessment Tool (ASA24)
- Baseline (BL)
- Body mass index (BMI)
- Complete Blood Count (CBC)
- Dietary Approaches to Stop Hypertension (DASH)
- Dietary Guidelines for Americans with Ultra-Processed foods (DGA-UP)
- Dual energy x-ray absorptiometry (DXA)
- Food and Nutrient Database for Dietary Studies (FNDDS)
- Grand Forks Human Nutrition Research Center (GFHNRC)
- Healthy U.S. Style Dietary Pattern (HUSDP)
- Healthy Eating Index-2020 (HEI-2020)
- High-density lipoprotein cholesterol (HDL-C)
- High sensitivity C-reactive protein (hs-CRP)
- Less-processed HUSDP (LP- HUSDP)
- Low-density lipoprotein cholesterol (LDL-C)
- National Health and Nutrition Examination Survey (NHANES)
- Randomized controlled trial (RCT)
- Reflection spectroscopy (RS)
- Screening (S)
- Subjective happiness scale (SHS)
- Ultra-processed HUSDP (UP-HUSDP)
- Ultra-processed food (UPF)
- United Kingdom (UK)
- U.S. Department of Agriculture- Agricultural Research Service (USDA-ARS)
References
- Crimarco A, Landry MJ, Gardner CD. Ultra-processed Foods, Weight Gain, and Co-morbidity Risk. Curr Obes Rep. 2022;11(3):80-92. [CrossRef]
- International Food Information Council. Perceptions on Processed: Consumer Sentiment and Purchasing Habits. 2022.
- Barbosa SS, Sousa LCM, de Oliveira Silva DF, Pimentel JB, Evangelista KCMdS, Lyra CdO, et al. A Systematic Review on Processed/Ultra-Processed Foods and Arterial Hypertension in Adults and Older People. Nutrients. 2022;14(6):1215. [CrossRef]
- Scaranni PdOdS, Cardoso LdO, Chor D, Melo ECP, Matos SMA, Giatti L, et al. Ultra-processed foods, changes in blood pressure and incidence of hypertension: the Brazilian Longitudinal Study of Adult Health (ELSA-Brasil). Public Health Nutrition. 2021;24(11):3352-60.
- Juul F, Martinez-Steele E, Parekh N, Monteiro CA, Chang VW. Ultra-processed food consumption and excess weight among US adults. Br J Nutr. 2018;120(1):90-100. [CrossRef]
- Canhada SL, Luft VC, Giatti L, Duncan BB, Chor D, Maria de Jesus M, et al. Ultra-processed foods, incident overweight and obesity, and longitudinal changes in weight and waist circumference: the Brazilian Longitudinal Study of Adult Health (ELSA-Brasil). Public health nutrition. 2020;23(6):1076-86.
- Rauber F, Laura da Costa Louzada M, Chang K, Huybrechts I, Gunter MJ, Monteiro CA, et al. Implications of food ultra-processing on cardiovascular risk considering plant origin foods: an analysis of the UK Biobank cohort. The Lancet Regional Health – Europe. 2024;43. [CrossRef]
- Chen X, Chu J, Hu W, Sun N, He Q, Liu S, et al. Associations of ultra-processed food consumption with cardiovascular disease and all-cause mortality: UK Biobank. European Journal of Public Health. 2022;32(5):779-85.
- Cordova R, Viallon V, Fontvieille E, Peruchet-Noray L, Jansana A, Wagner K-H, et al. Consumption of ultra-processed foods and risk of multimorbidity of cancer and cardiometabolic diseases: a multinational cohort study. The Lancet Regional Health – Europe. 2023;35.
- da Silva A, Felício MB, Caldas APS, Miranda Hermsdorff HH, Bersch-Ferreira ÂC, Torreglosa CR, et al. Pro-inflammatory diet is associated with a high number of cardiovascular events and ultra-processed foods consumption in patients in secondary care. Public Health Nutrition. 2021;24(11):3331-40.
- Lopes AEdSC, Araújo LF, Levy RB, Barreto SM, Giatti L. Association between consumption of ultra-processed foods and serum C-reactive protein levels: cross-sectional results from the ELSA-Brasil study. Sao Paulo Medical Journal. 2019;137:169-76.
- Taneri PE, Wehrli F, Roa-Díaz ZM, Itodo OA, Salvador D, Raeisi-Dehkordi H, et al. Association Between Ultra-Processed Food Intake and All-Cause Mortality: A Systematic Review and Meta-Analysis. American Journal of Epidemiology. 2022;191(7):1323-35. [CrossRef]
- O'Connor LE, Higgins KA, Smiljanec K, Bergia R, Brown AW, Baer D, et al. Perspective: A Research Roadmap about ultra-processed foods and human health for the US food system: Proceedings from an interdisciplinary, multi-stakeholder workshop. Adv Nutr. 2023.
- Lichtenstein AH, Appel LJ, Vadiveloo M, Hu FB, Kris-Etherton PM, Rebholz CM, et al. 2021 dietary guidance to improve cardiovascular health: a scientific statement from the American Heart Association. Circulation. 2021;144(23):e472-e87.
- Dicken SJ, Batterham RL. The Role of Diet Quality in Mediating the Association between Ultra-Processed Food Intake, Obesity and Health-Related Outcomes: A Review of Prospective Cohort Studies. Nutrients. 2022;14(1):23.
- Monteiro CA, Cannon G, Moubarac JC, Levy RB, Louzada MLC, Jaime PC. The UN Decade of Nutrition, the NOVA food classification and the trouble with ultra-processing. Public Health Nutr. 2018;21(1):5-17.
- Monteiro C, Cannon G, Levy R, Moubarac J-C, Jaime P, Martins APB, et al. Food Classification-Public Health. NOVA. The star shines bright. World Nutrition. 2016;7(1-3):28-38.
- Monteiro CA, Cannon G, Lawrence M, Costa Louzada ML, Pereira Machado P. Ultra-processed foods, diet quality, and health using the NOVA classification system. Rome: FAO; 2019.
- Hall KD, Ayuketah A, Brychta R, Cai H, Cassimatis T, Chen KY, et al. Ultra-Processed Diets Cause Excess Calorie Intake and Weight Gain: An Inpatient Randomized Controlled Trial of Ad Libitum Food Intake. Cell Metab. 2019;30(1):67-77.e3.
- Hamano S, Sawada M, Aihara M, Sakurai Y, Sekine R, Usami S, et al. Ultra-processed foods cause weight gain and increased energy intake associated with reduced chewing frequency: a randomized, open-label, crossover study. Diabetes, Obesity and Metabolism. 2024.
- Dicken SJ, Jassil FC, Brown A, Kalis M, Stanley C, Ranson C, et al. Ultraprocessed or minimally processed diets following healthy dietary guidelines on weight and cardiometabolic health: a randomized, crossover trial. Nature Medicine. 2025.
- Preston JM, Iversen J, Hufnagel A, Hjort L, Taylor J, Sanchez C, et al. Effect of ultra-processed food consumption on male reproductive and metabolic health. Cell Metabolism. 2025. [CrossRef]
- Public Health England. A Quick Guide to the Government's Healthy Eating Recommendations. Wellington House: Public Health England; 2018.
- Steele EM, Baraldi LG, Louzada MLdC, Moubarac J-C, Mozaffarian D, Monteiro CA. Ultra-processed foods and added sugars in the US diet: evidence from a nationally representative cross-sectional study. BMJ Open. 2016;6(3):e009892.
- Marrón-Ponce JA, Flores M, Cediel G, Monteiro CA, Batis C. Associations between Consumption of Ultra-Processed Foods and Intake of Nutrients Related to Chronic Non-Communicable Diseases in Mexico. Journal of the Academy of Nutrition and Dietetics. 2019;119(11):1852-65.
- Martínez Steele E, Popkin BM, Swinburn B, Monteiro CA. The share of ultra-processed foods and the overall nutritional quality of diets in the US: evidence from a nationally representative cross-sectional study. Population Health Metrics. 2017;15(1):6.
- Cordova R, Kliemann N, Huybrechts I, Rauber F, Vamos EP, Levy RB, et al. Consumption of ultra-processed foods associated with weight gain and obesity in adults: A multi-national cohort study. Clinical Nutrition. 2021;40(9):5079-88. [CrossRef]
- Cediel G, Reyes M, da Costa Louzada ML, Martinez Steele E, Monteiro CA, Corvalán C, et al. Ultra-processed foods and added sugars in the Chilean diet (2010). Public Health Nutr. 2018;21(1):125-33.
- Moubarac J-C, Batal M, Louzada ML, Martinez Steele E, Monteiro CA. Consumption of ultra-processed foods predicts diet quality in Canada. Appetite. 2017;108:512-20.
- Costa Louzada MLd, Martins APB, Canella DS, Baraldi LG, Levy RB, Claro RM, et al. Ultra-processed foods and the nutritional dietary profile in Brazil. Rev Saude Publica. 2015;49:38-.
- Vlassopoulos A, Katidi A, Noutsos S, Kapsokefalou M. Precision Food Composition Data as a Tool to Decipher the Riddle of Ultra-Processed Foods and Nutritional Quality. Foods. 2024;13(8):1259.
- Braesco V, Souchon I, Sauvant P, Haurogné T, Maillot M, Féart C, et al. Ultra-processed foods: how functional is the NOVA system? European Journal of Clinical Nutrition. 2022. [CrossRef]
- Drewnowski A, Gupta S, Darmon N. An Overlap Between “Ultraprocessed” Foods and the Preexisting Nutrient Rich Foods Index? Nutrition Today. 2020;55(2):75-81.
- Martinez-Steele E, Khandpur N, Batis C, Bes-Rastrollo M, Bonaccio M, Cediel G, et al. Best practices for applying the Nova food classification system. Nature Food. 2023;4(6):445-8.
- 2025 Dietary Guidelines Advisory Committee. Scientific Report of the 2025 Dietary Guidelines Advisory Committee: Advisory Report to the Secretary of Health and Human Services and Secretary of Agriculture. 2024.
- Weaver CM, Dwyer J, Fulgoni VL, King JC, Leveille GA, MacDonald RS, et al. Processed foods: contributions to nutrition123. The American Journal of Clinical Nutrition. 2014;99(6):1525-42.
- Dicken SJ, Batterham RL, Brown A. Nutrients or processing? An analysis of food and drink items from the UK National Diet and Nutrition Survey based on nutrient content, the NOVA classification and front of package traffic light labelling. British Journal of Nutrition. 2024;131(9):1619-32.
- Drewnowski A. Perspective: identifying ultra-processed plant-based milk alternatives in the USDA branded food products database. Advances in Nutrition. 2021;12(6):2068-75.
- de las Heras-Delgado S, Shyam S, Cunillera È, Dragusan N, Salas-Salvadó J, Babio N. Are plant-based alternatives healthier? A two-dimensional evaluation from nutritional and processing standpoints. Food Research International. 2023;169:112857.
- Mendoza-Velázquez A, Lara-Arévalo J, Siqueira KB, Guzmán-Rodríguez M, Drewnowski A. Affordable Nutrient Density in Brazil: Nutrient Profiling in Relation to Food Cost and NOVA Category Assignments. Nutrients. 2022;14(20):4256.
- Pellegrino F, Tan M, Richonnet C, Reinert R, Bucher Della Torre S, Chatelan A. What Is the Nutritional Quality of Pre-Packed Foods Marketed to Children in Food Stores? A Survey in Switzerland. Nutrients. 2024;16(11).
- Phulkerd S, Dickie S, Thongcharoenchupong N, Thapsuwan S, Machado P, Woods J, et al. Choosing an effective food classification system for promoting healthy diets in Thailand: a comparative evaluation of three nutrient profiling-based food classification systems (government, WHO, and Healthier Choice Logo) and a food-processing-based food classification system (NOVA). Front Nutr. 2023;10:1149813.
- Hess JM, Comeau ME, Casperson S, Slavin JL, Johnson GH, Messina M, et al. Dietary guidelines meet NOVA: developing a menu for a healthy dietary pattern using ultra-processed foods. The Journal of Nutrition. 2023;153(8):2472-81. [CrossRef]
- Hess JM CM, Casperson S, Slavin JL, Johnson GH, Messina M, Raatz S, Scheett AS, Bodensteiner A. Dietary guidelines meet NOVA: developing a menu for a healthy dietary pattern using ultra-processed foods. Journal of Nutrition. 2023;(in press).
- Kirkpatrick SI, Reedy J, Krebs-Smith SM, Pannucci TE, Subar AF, Wilson MM, et al. Applications of the Healthy Eating Index for Surveillance, Epidemiology, and Intervention Research: Considerations and Caveats. J Acad Nutr Diet. 2018;118(9):1603-21.
- Medicine Io. Dietary Reference Intakes: The Essential Guide to Nutrient Requirements. Otten JJ, Hellwig JP, Meyers LD, editors. Washington, DC: The National Academies Press; 2006. 1344 p.
- USDA/HHS. Dietary Guidelines for Americans, 2020-2025. 2020.
- NASEM. Dietary Reference Intakes for Sodium and Potassium Washington, DC; 2019.
- Whelton PK, Carey RM, Aronow WS, Casey DE, Collins KJ, Himmelfarb CD, et al. 2017 ACC/AHA/AAPA/ABC/ACPM/AGS/APhA/ASH/ASPC/NMA/PCNA Guideline for the Prevention, Detection, Evaluation, and Management of High Blood Pressure in Adults: A Report of the American College of Cardiology/American Heart Association Task Force on Clinical Practice Guidelines. Hypertension. 2018;71(6):e13-e115.
- Casperson SL, Jahns L, Duke SE, Nelson AM, Appleton KM, Larson KJ, et al. Incorporating the Dietary Guidelines for Americans Vegetable Recommendations into the Diet Alters Dietary Intake Patterns of Other Foods and Improves Diet Quality in Adults with Overweight and Obesity. J Acad Nutr Diet. 2022;122(7):1345-54.e1. [CrossRef]
- De Leon A, Jahns L, Roemmich JN, Duke SE, Casperson SL. Consumption of Dietary Guidelines for Americans Types and Amounts of Vegetables Increases Mean Subjective Happiness Scale Scores: A Randomized Controlled Trial. Journal of the Academy of Nutrition and Dietetics. 2022;122(7):1355-62.
- Casperson SL, Jahns L, Temple JL, Appleton KM, Duke SE, Roemmich JN. Consumption of a Variety of Vegetables to Meet Dietary Guidelines for Americans' Recommendations Does Not Induce Sensitization of Vegetable Reinforcement Among Adults with Overweight and Obesity: A Randomized Controlled Trial. J Nutr. 2021;151(6):1665-72.
- De Leon A, Roemmich JN, Casperson SL. Identification of Barriers to Adherence to a Weight Loss Diet in Women Using the Nominal Group Technique. Nutrients. 2020;12(12).
- Flack KD, Ufholz K, Casperson S, Jahns L, Johnson L, Roemmich JN. Decreasing the Consumption of Foods with Sugar Increases Their Reinforcing Value: A Potential Barrier for Dietary Behavior Change. J Acad Nutr Diet. 2019;119(7):1099-108. [CrossRef]
- NCI; N. Automated Self-Administered 24-Hour (ASA24®) Dietary Assessment Tool 2023 [.
- Jahns L, Johnson LK, Mayne ST, Cartmel B, Picklo MJ, Sr., Ermakov IV, et al. Skin and plasma carotenoid response to a provided intervention diet high in vegetables and fruit: uptake and depletion kinetics. The American journal of clinical nutrition. 2014;100(3):930-7. [CrossRef]
- Jilcott Pitts SB, Jahns L, Wu Q, Moran NE, Bell RA, Truesdale KP, et al. A non-invasive assessment of skin carotenoid status through reflection spectroscopy is a feasible, reliable and potentially valid measure of fruit and vegetable consumption in a diverse community sample. Public Health Nutrition. 2018;21(9):1664-70.
- Lyubomirsky S, Lepper HS. A measure of subjective happiness: Preliminary reliability and construct validation. Social indicators research. 1999;46(2):137-55.
- Wolfson JA, Martinez-Steele E, Tucker AC, Leung CW. Greater frequency of cooking dinner at home and more time spent cooking are inversely associated with ultra-processed food consumption among US adults. Journal of the Academy of Nutrition and Dietetics. 2024. [CrossRef]
- Bassett DR, Jr. International physical activity questionnaire: 12-country reliability and validity. Med Sci Sports Exerc. 2003;35(8):1396.
- National Academies of Sciences E, Medicine. Dietary Reference Intakes for Energy. Washington, DC: The National Academies Press; 2023. 542 p.
- Jahns L, Johnson LK, Mayne ST, Cartmel B, Picklo MJ, Sr, Ermakov IV, et al. Skin and plasma carotenoid response to a provided intervention diet high in vegetables and fruit: uptake and depletion kinetics. The American Journal of Clinical Nutrition. 2014;100(3):930-7.
- Juraschek SP, Miller ER, Weaver CM, Appel LJ. Effects of Sodium Reduction and the DASH Diet in Relation to Baseline Blood Pressure. Journal of the American College of Cardiology. 2017;70(23):2841-8.
- Krishnan S, Adams SH, Allen LH, Laugero KD, Newman JW, Stephensen CB, et al. A randomized controlled-feeding trial based on the Dietary Guidelines for Americans on cardiometabolic health indexes. The American Journal of Clinical Nutrition. 2018;108(2):266-78.
- Zhang Z, Cogswell ME, Gillespie C, Fang J, Loustalot F, Dai S, et al. Association between Usual Sodium and Potassium Intake and Blood Pressure and Hypertension among U.S. Adults: NHANES 2005–2010. PLOS ONE. 2013;8(10):e75289. [CrossRef]
- American Heart Association. Understanding Blood Pressure Readings 2023 [Available from: https://www.heart.org/en/health-topics/high-blood-pressure/understanding-blood-pressure-readings.
- Carpenter JR KM. Missing data in randomized controlled trials – a practical guide. London UK: London School of Hygiene & Tropical Medicine; 2007.
- Lasschuijt MP, Heuven LAJ, Gonzalez-Estanol K, Siebelink E, Chen Y, Forde CG. The Effect of Energy Density and Eating Rate on Ad Libitum Energy Intake in Healthy Adults—A Randomized Controlled Study. The Journal of Nutrition. 2025;155(8):2602-10.
- Teo PS, Lim AJ, Goh AT, Janani R, Michelle Choy JY, McCrickerd K, et al. Texture-based differences in eating rate influence energy intake for minimally processed and ultra-processed meals. The American Journal of Clinical Nutrition. 2022;116(1):244-54.
- Shepherd JA, Ng BK, Sommer MJ, Heymsfield SB. Body composition by DXA. Bone. 2017;104:101-5. [CrossRef]
- Appel LJ, Moore TJ, Obarzanek E, Vollmer WM, Svetkey LP, Sacks FM, et al. A Clinical Trial of the Effects of Dietary Patterns on Blood Pressure. New England Journal of Medicine. 1997;336(16):1117-24. [CrossRef]
- He FJ, Li J, MacGregor GA. Effect of longer term modest salt reduction on blood pressure: Cochrane systematic review and meta-analysis of randomised trials. BMJ : British Medical Journal. 2013;346:f1325.
- Sacks FM, Svetkey LP, Vollmer WM, Appel LJ, Bray GA, Harsha D, et al. Effects on Blood Pressure of Reduced Dietary Sodium and the Dietary Approaches to Stop Hypertension (DASH) Diet. New England Journal of Medicine. 2001;344(1):3-10.
- Machin DR, Park W, Alkatan M, Mouton M, Tanaka H. Hypotensive effects of solitary addition of conventional nonfat dairy products to the routine diet: a randomized controlled trial. The American Journal of Clinical Nutrition. 2014;100(1):80-7.
- Drouin-Chartier J-P, Gigleux I, Tremblay AJ, Poirier L, Lamarche B, Couture P. Impact of dairy consumption on essential hypertension: a clinical study. Nutrition Journal. 2014;13(1):83.
- Chiu S, Bergeron N, Williams PT, Bray GA, Sutherland B, Krauss RM. Comparison of the DASH (Dietary Approaches to Stop Hypertension) diet and a higher-fat DASH diet on blood pressure and lipids and lipoproteins: a randomized controlled trial1–3. The American Journal of Clinical Nutrition. 2016;103(2):341-7.
- Turner KM, Keogh JB, Clifton PM. Red meat, dairy, and insulin sensitivity: a randomized crossover intervention study2. The American Journal of Clinical Nutrition. 2015;101(6):1173-9.
- Norén E, Forssell H. Very low calorie diet without aspartame in obese subjects: improved metabolic control after 4 weeks treatment. Nutrition Journal. 2014;13(1):77.
- Hoppe C, Mølgaard C, Vaag A, Barkholt V, Michaelsen KF. High intakes of milk, but not meat, increase s-insulin and insulin resistance in 8-year-old boys. European Journal of Clinical Nutrition. 2005;59(3):393-8.
- Mateo-Gallego R, Perez-Calahorra S, Cenarro A, Bea AM, Andres E, Horno J, et al. Effect of lean red meat from lamb v. lean white meat from chicken on the serum lipid profile: a randomised, cross-over study in women. British Journal of Nutrition. 2012;107(10):1403-7.
- Müller H, Lindman AS, Brantsaeter AL, Pedersen JI. The serum LDL/HDL cholesterol ratio is influenced more favorably by exchanging saturated with unsaturated fat than by reducing saturated fat in the diet of women. J Nutr. 2003;133(1):78-83.
- Faghihnia N, Tsimikas S, Miller ER, Witztum JL, Krauss RM. Changes in lipoprotein(a), oxidized phospholipids, and LDL subclasses with a low-fat high-carbohydrate diet. Journal of Lipid Research. 2010;51(11):3324-30.
- Krauss RM, Blanche PJ, Rawlings RS, Fernstrom HS, Williams PT. Separate effects of reduced carbohydrate intake and weight loss on atherogenic dyslipidemia2. The American Journal of Clinical Nutrition. 2006;83(5):1025-31. [CrossRef]
- Pelkman CL, Fishell VK, Maddox DH, Pearson TA, Mauger DT, Kris-Etherton PM. Effects of moderate-fat (from monounsaturated fat) and low-fat weight-loss diets on the serum lipid profile in overweight and obese men and women. Am J Clin Nutr. 2004;79(2):204-12.
- Jenkins DJA, Kendall CWC, Marchie A, Parker TL, Connelly PW, Qian W, et al. Dose Response of Almonds on Coronary Heart Disease Risk Factors: Blood Lipids, Oxidized Low-Density Lipoproteins, Lipoprotein(a), Homocysteine, and Pulmonary Nitric Oxide. Circulation. 2002;106(11):1327-32.
- Lee Y, Berryman CE, West SG, Chen CYO, Blumberg JB, Lapsley KG, et al. Effects of Dark Chocolate and Almonds on Cardiovascular Risk Factors in Overweight and Obese Individuals: A Randomized Controlled-Feeding Trial. Journal of the American Heart Association. 2017;6(12):e005162.
- Rajaram S, Burke K, Connell B, Myint T, Sabaté J. A monounsaturated fatty acid-rich pecan-enriched diet favorably alters the serum lipid profile of healthy men and women. J Nutr. 2001;131(9):2275-9. [CrossRef]
- Enkhmaa B, Petersen KS, Kris-Etherton PM, Berglund L. Diet and Lp(a): Does Dietary Change Modify Residual Cardiovascular Risk Conferred by Lp(a)? Nutrients. 2020;12(7).
- Kris-Etherton PM, Dietschy J. Design criteria for studies examining individual fatty acid effects on cardiovascular disease risk factors: human and animal studies. Am J Clin Nutr. 1997;65(5 Suppl):1590s-6s.
Figure 1.
Study Schematic for Dietary Intervention Study Comparing Impact of Unprocessed and Ultra-processed DGA Diets on Cardiometabolic Health Outcomes.
Figure 1.
Study Schematic for Dietary Intervention Study Comparing Impact of Unprocessed and Ultra-processed DGA Diets on Cardiometabolic Health Outcomes.
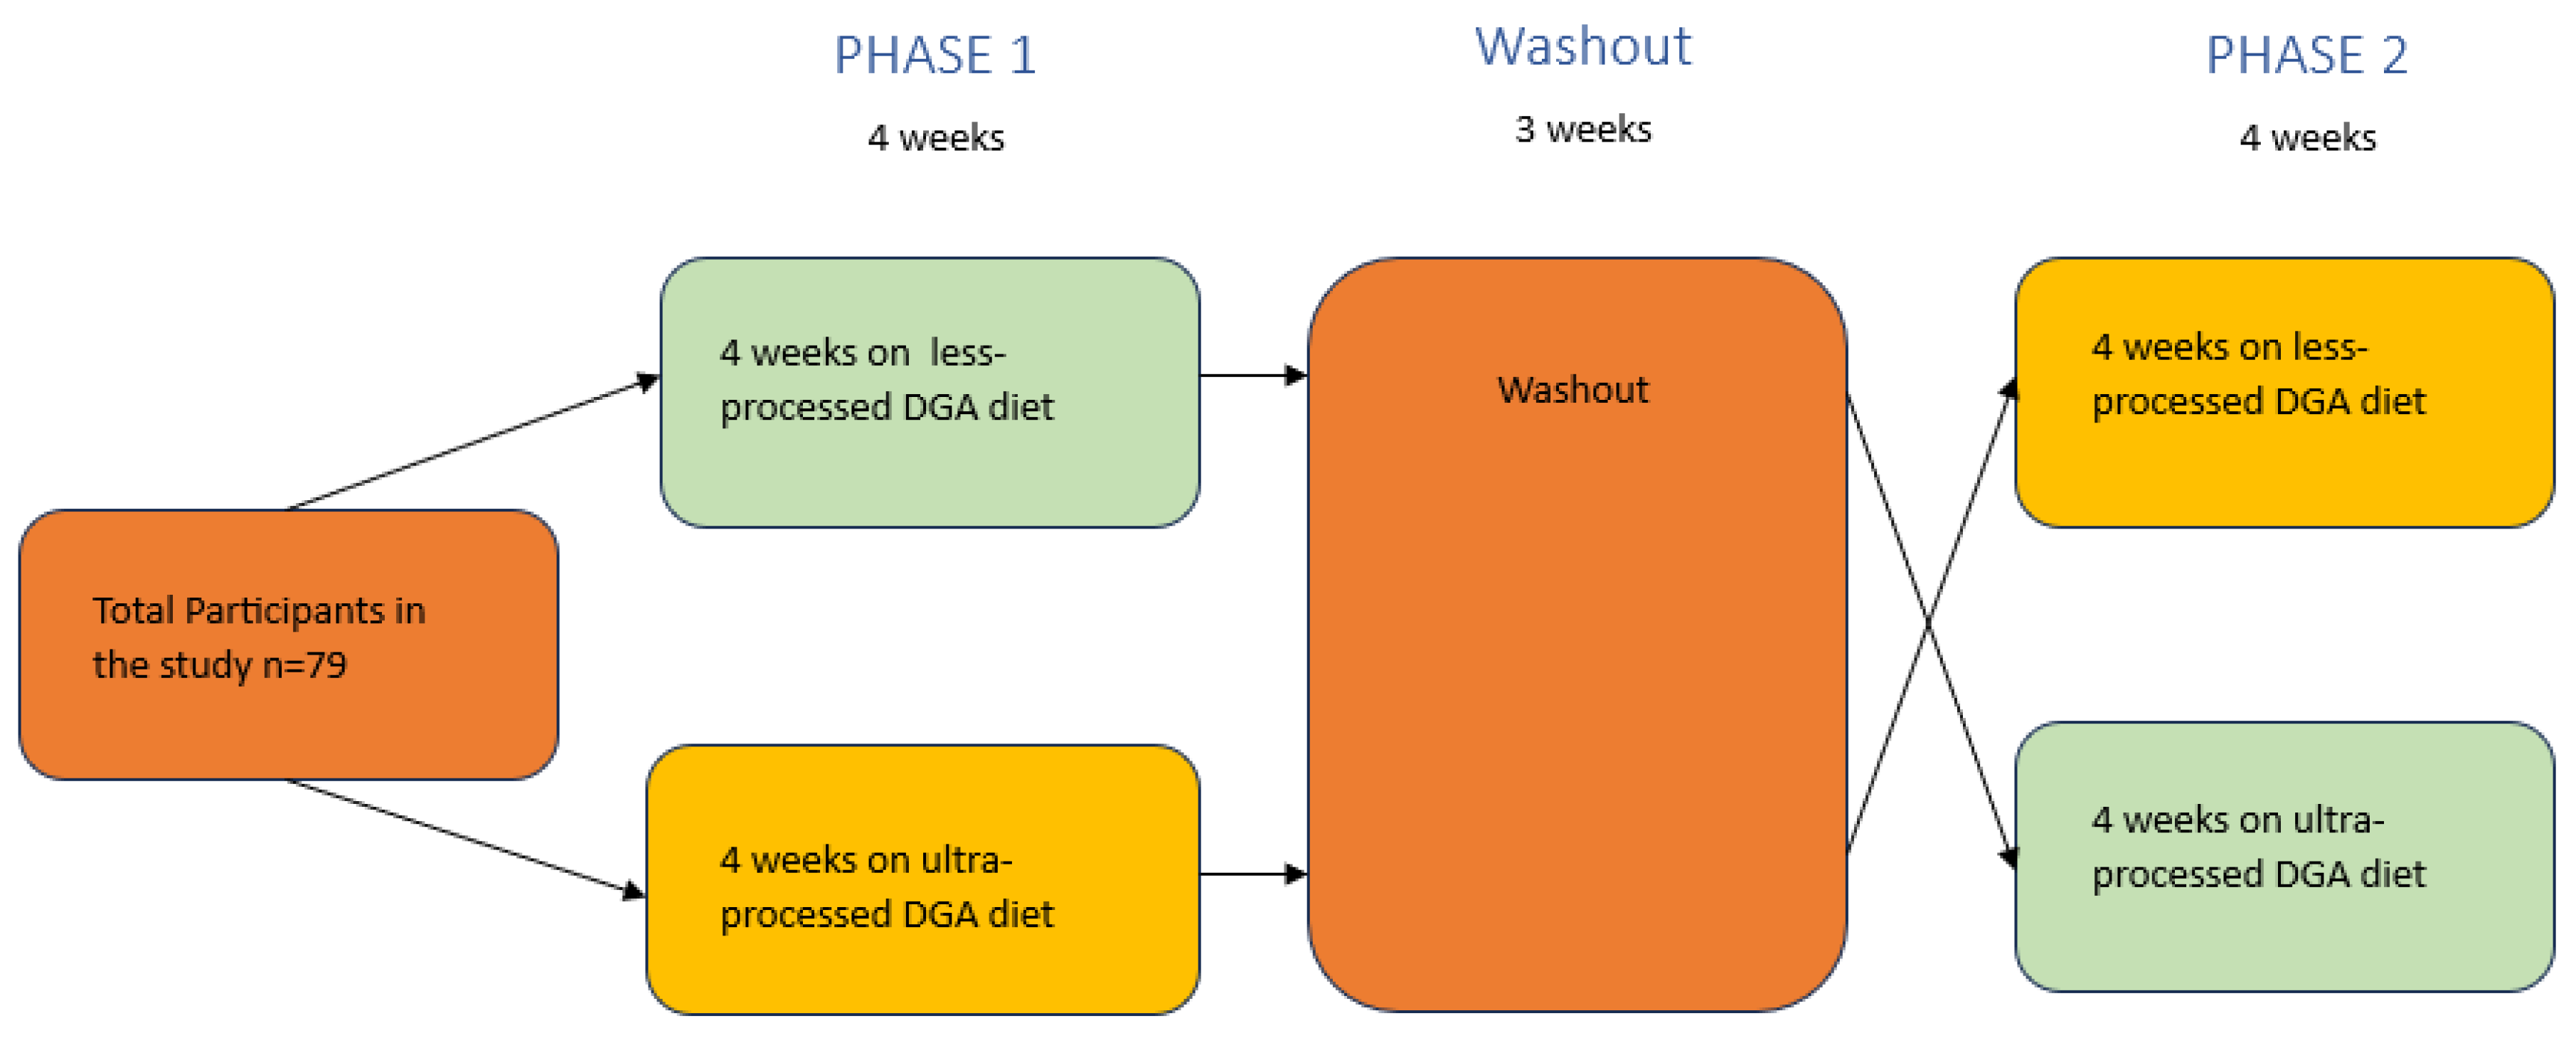
Figure 2.
Radar plots depicting diet quality score of more- and less-processed menus included in the Dietary Guidelines for Americans- Ultra-Processed (DGA-UP) trial according to the Healthy Eating Index-2020 score.
Figure 2.
Radar plots depicting diet quality score of more- and less-processed menus included in the Dietary Guidelines for Americans- Ultra-Processed (DGA-UP) trial according to the Healthy Eating Index-2020 score.
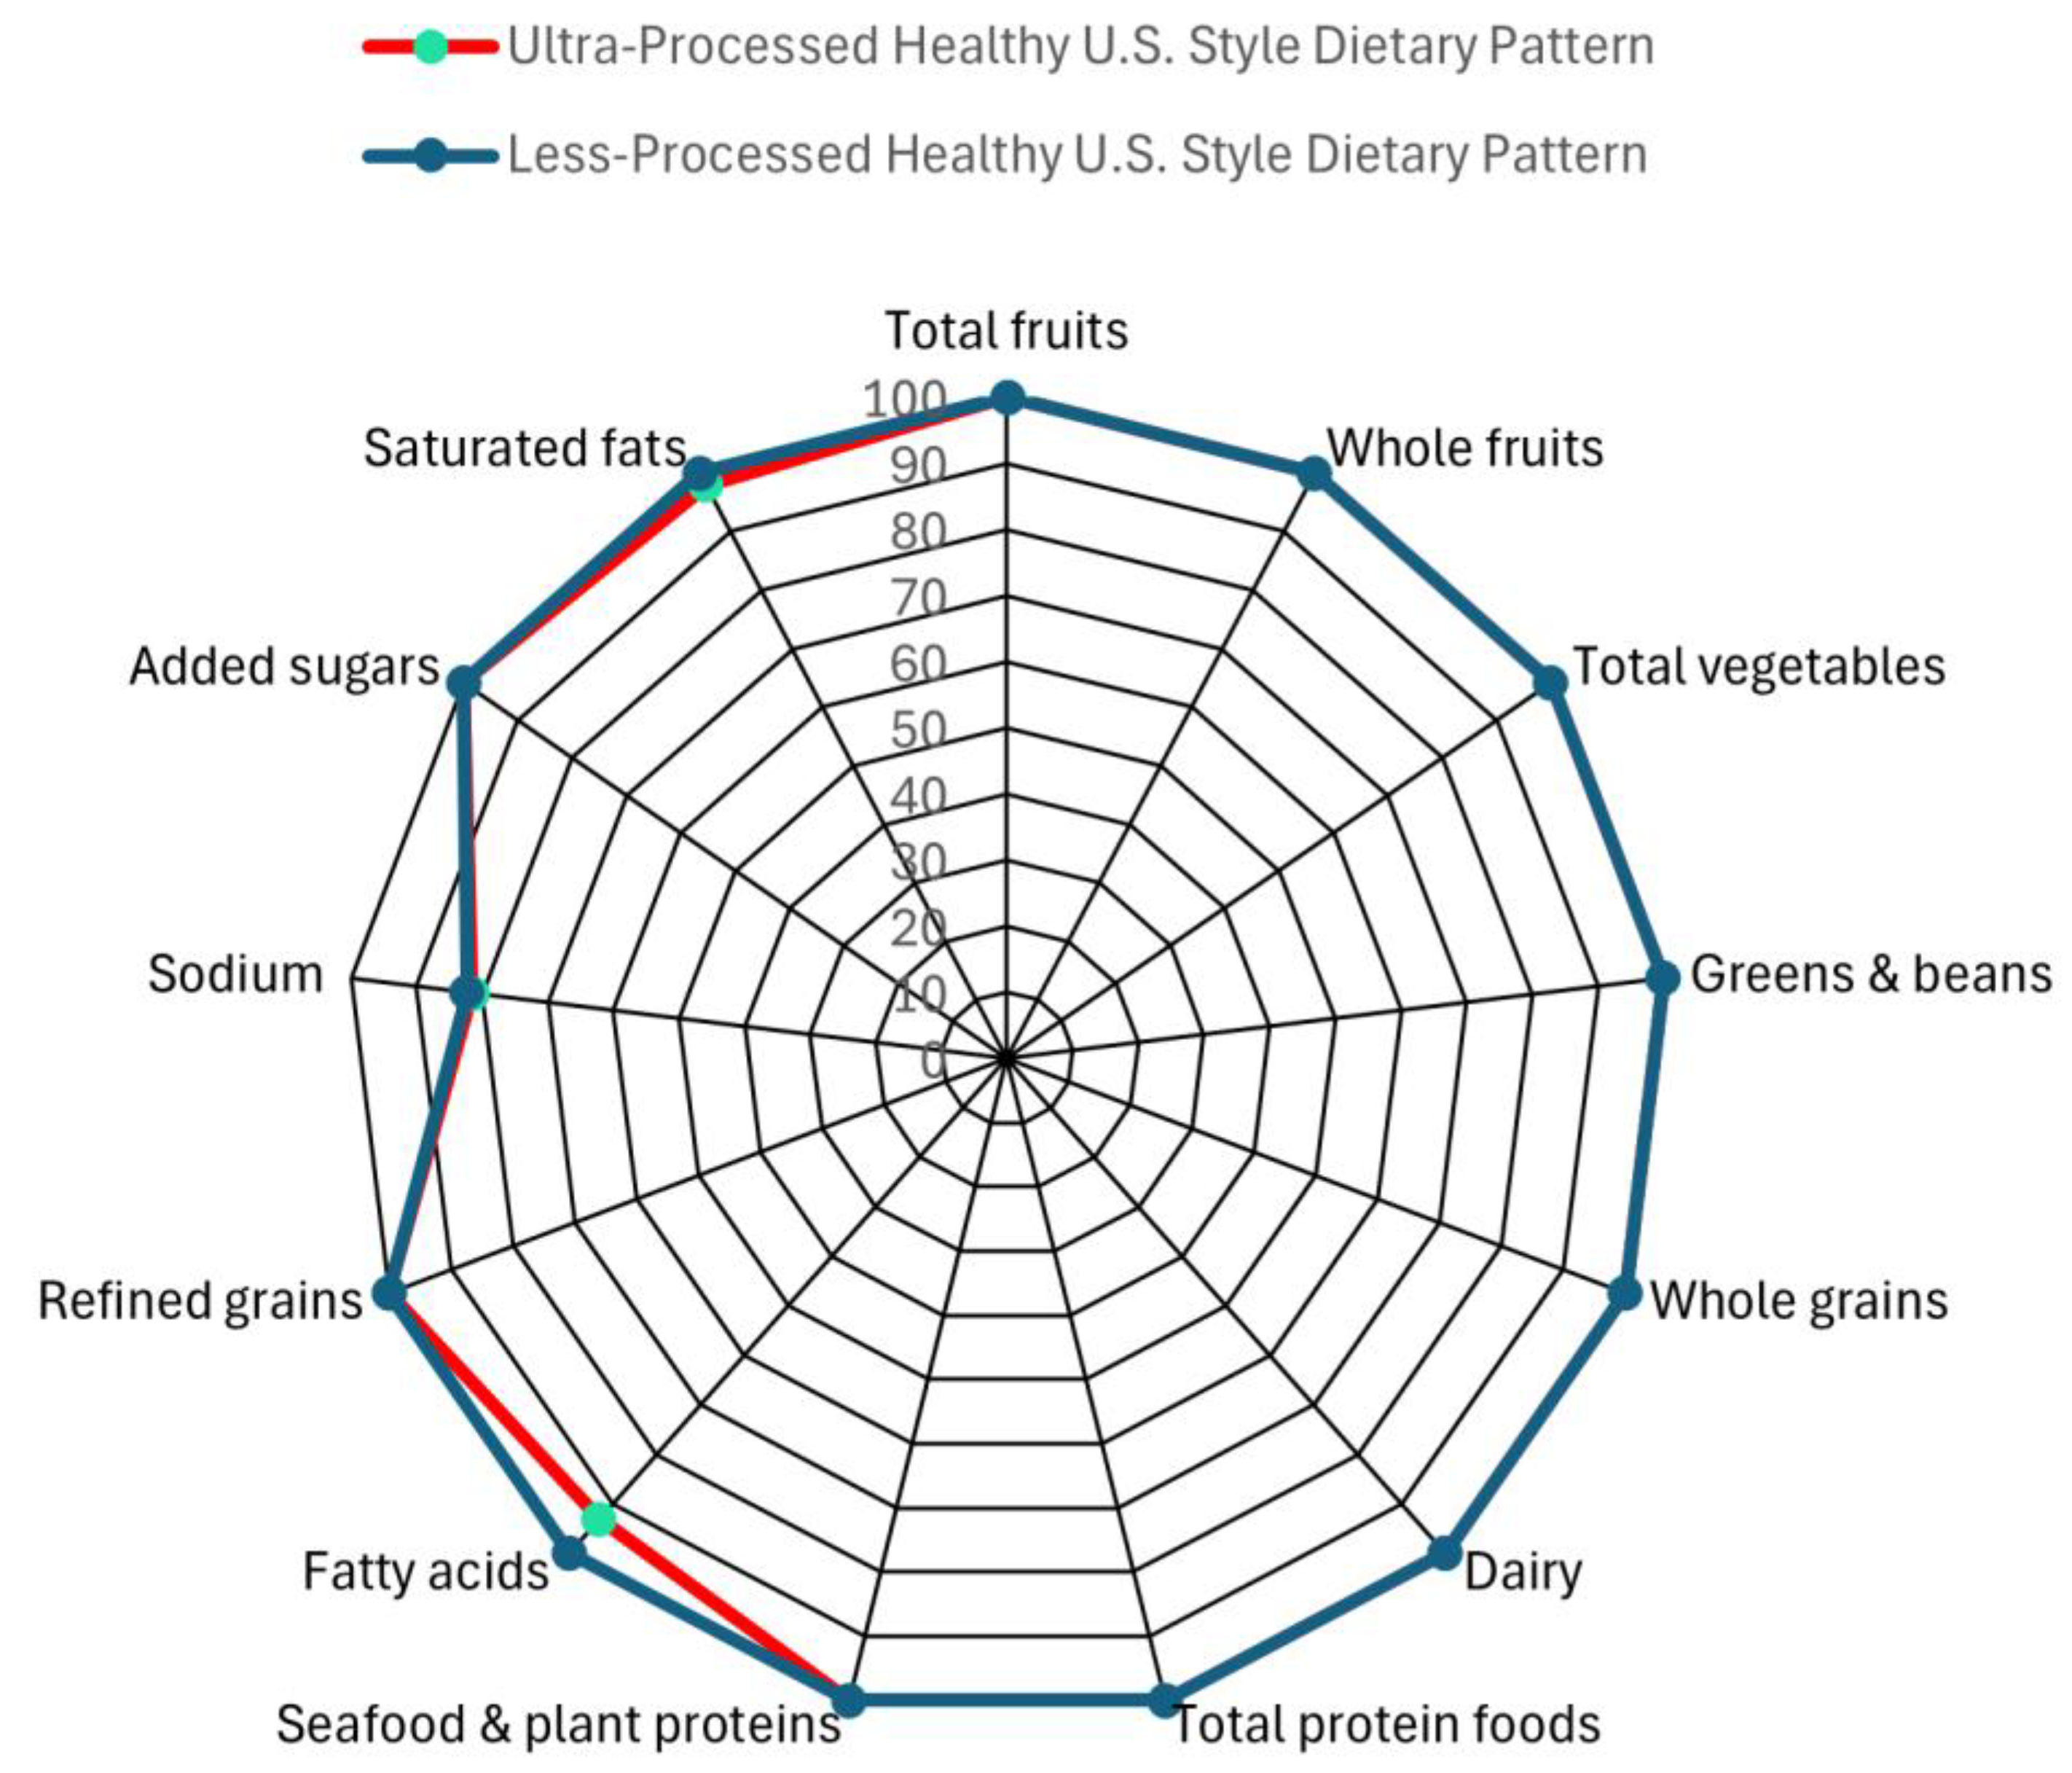

Table 1.
Nova Scores and Descriptions of Different Categories of Food Processing from Monteiro et al.[17].
Table 1.
Nova Scores and Descriptions of Different Categories of Food Processing from Monteiro et al.[17].
| Nova score | Description |
|---|---|
|
Edible parts of plants, animals, fungi, algae, and water after separation from nature. |
|
Obtained directly from group 1 foods or from nature and processing via pressing, refining, grinding, milling, and spray drying. |
|
Products made by adding sugar, oil, salt, or other group 2 substances to group 1 foods. |
|
Industrially formulated foods usually made of 5+ ingredients, especially those that are not commonly found in home culinary preparations. |
Table 2.
Timeline of Procedures included in the Dietary Guidelines for Americans with Ultra-Processed foods (DGA-UP) Study.
Table 2.
Timeline of Procedures included in the Dietary Guidelines for Americans with Ultra-Processed foods (DGA-UP) Study.
| Procedure | ||||||||||||||
|---|---|---|---|---|---|---|---|---|---|---|---|---|---|---|
| Pre-Intervention | Phase 1 | Washout (3 week minimum) |
Phase 2 | |||||||||||
| Timeline (weeks) | S | BL | 1 | 2 | 3 | 4 | 5 | 6 | 7 | 8 | 9 | 10 | 11 | 12 |
| Weight | x | x | x | x | x | x | x | x | x | x | ||||
| Height | x | |||||||||||||
| Health History Questionnaire | x | x | ||||||||||||
| Dual energy x-ray absorptiometry (DXA) | x | |||||||||||||
| International Physical Activity Questionnaire | x | |||||||||||||
| Blood pressure | x | x | x | x | x | x | x | x | x | x | ||||
| Fasting blood draw | x | x | x | x | x | |||||||||
| ASA24 food diary (3 per timepoint) | x | x | x | |||||||||||
| Dietary Compliance Questionnaire (daily) | x | x | x | x | x | x | x | x | ||||||
| Skin Carotenoid Scan | x | x | x | x | x | x | x | x | x | |||||
| Preparation Time Questionnaire | x | |||||||||||||
| Subjective Happiness Scale | x | x | x | x | x | |||||||||
Table 3.
Average nutrient profiles of 5-day intervention menus that follow the 2020-2025 Dietary Guidelines for Americans with mostly Ultra-Processed or Less-Processed Food.
Table 3.
Average nutrient profiles of 5-day intervention menus that follow the 2020-2025 Dietary Guidelines for Americans with mostly Ultra-Processed or Less-Processed Food.
| Nutrients | Less-Processed Healthy U.S.-Style Dietary Pattern | Ultra-Processed Healthy U.S.-Style Dietary Pattern |
|---|---|---|
| MACRONUTRIENTS | ||
| Calories (kcal) | 2018 | 2007 |
| Energy density (kcal/g) | 1.005 | 0.999 |
| Protein (g) | 103 | 102 |
| Carbohydrate (g) | 262 | 261 |
| Added sugars (g) | 30 | 33 |
| Added sugar (teaspoon equivalents) | 7 | 8 |
| Fiber, total dietary (g) | 28 | 28 |
| Total lipid, fat (g) | 68 | 68 |
| Saturated fatty acids (g) | 17 | 18 |
| Monounsaturated fatty acids (g) | 26 | 25 |
| Polyunsaturated fatty acids (g) | 19 | 19 |
| Omega-3 fatty acids (g)1 | 1.5 | 1.4 |
| Omega-6 fatty acids (g)2 | 11 | 11 |
| EPA (g) | 0.2 | 0.1 |
| DHA (g) | 0.3 | 0.3 |
| Cholesterol (mg) | 331 | 335 |
| MINERALS | ||
| Calcium (mg) | 1242 | 1245 |
| Iron (mg) | 16 | 18 |
| Magnesium (mg) | 415 | 388 |
| Phosphorus (mg) | 1903 | 1877 |
| Potassium (mg) | 3922 | 3843 |
| Sodium (mg) | 2542 | 2541 |
| Zinc (mg) | 14 | 13 |
| Copper (mg) | 1.5 | 1.4 |
| Selenium (mg) | 114 | 126 |
| VITAMINS | ||
| Vitamin A, RAE (mcg) | 1043 | 1172 |
| Vitamin E, AT (mg) | 11 | 11 |
| Vitamin D (mcg) | 10 | 10 |
| Thiamin (mg) | 1.5 | 1.6 |
| Riboflavin (mg) | 2.7 | 2.7 |
| Niacin (% eq, mg) | 43 | 42 |
| Vitamin B6 (mg) | 2.1 | 2.2 |
| Vitamin B12 (mcg) | 7.1 | 7.6 |
| Choline (mg) | 461 | 465 |
| Vitamin K (mcg) | 136 | 132 |
| Folate, DFE (mcg) | 382 | 408 |
| 1Omega-3 fatty acids include the sum of amounts of alpha-linolenic acid (ALA), docosahexanoic acid (DHA), and eicosapentanoic acid (EPA). 2Omega-6 fatty acids include the sum of amounts of linoleic acid (LA), gamma-linolenic acid (GLA), and arachidonic acid (AA) | ||
Table 4.
Analytes measured at fasted blood draws within the Dietary Guidelines for Americans with Ultra-Processed foods (DGA-UP) Study.
Table 4.
Analytes measured at fasted blood draws within the Dietary Guidelines for Americans with Ultra-Processed foods (DGA-UP) Study.
| Analytes measured at fasted blood draws | |
|---|---|
| High sensitivity C-reactive protein (hs-CRP) | Insulin |
| Glucose | Carotenoids |
| Cholesterol (total, HDL-C, LDL-C) and Triglycerides | Complete Blood Count (CBC) |
Disclaimer/Publisher’s Note: The statements, opinions and data contained in all publications are solely those of the individual author(s) and contributor(s) and not of MDPI and/or the editor(s). MDPI and/or the editor(s) disclaim responsibility for any injury to people or property resulting from any ideas, methods, instructions or products referred to in the content. |
© 2025 by the authors. Licensee MDPI, Basel, Switzerland. This article is an open access article distributed under the terms and conditions of the Creative Commons Attribution (CC BY) license (http://creativecommons.org/licenses/by/4.0/).
Copyright: This open access article is published under a Creative Commons CC BY 4.0 license, which permit the free download, distribution, and reuse, provided that the author and preprint are cited in any reuse.


