1. Introduction
Chernozems are recognized as the most fertile and agriculturally valuable soils, which globally extend over ~230 million hectares in the mid-latitude grasslands [
1]. According to the international soil classification system, Chernozems are grouped with other highly fertile soils (Phaeozems, Luvisols, Ultisol, Kastanozems) as Mollisoils, which have historically been extensively cultivated for crop production, playing an important role in ensuring food security [
2]. Since the 1960s, the majority of Chernozems have been affected by accelerated erosion and physical or chemical degradation due to the use of increasingly powerful machinery and potent chemicals by farmers [
3]. As a result, tilled Chernozems – like other Mollisoils – have lost about half of their initial organic carbon (C) stocks to date [
4]. This has significantly reduced the sustainability of crop production, highlighting the urgent need to adapt modern farming systems to long-term С accrual in the Chernozem region.
The efficiency of farming systems to long-term C sequestration and storage in soils can be characterized by the C distribution in fast-cycling particulate organic matter (POM) and slow-cycling mineral-associated organic matter (MAOM) pools [
5,
6]. The different cycling rates of these pools are caused by their distinct interaction strength with the mineral surfaces and Fe- / Al-(hydr)oxides, which physically and chemically protects C against microbial decomposition [
7]. Specifically, molecular organic fragments of MAOM (< 53 μm) with varying degrees of amphiphilicity can strongly associate with the silt and clay minerals of variable chemical reactivity, unlike larger organic fragments of POM (53–2000 μm) [
8,
9]. The formation of MAOM requires favorable soil conditions for the microbial transformation of organic matter into simpler forms, especially microbial necromass residues and plant-derived water-soluble monomers [
6](Angst et al., 2023). Such conditions include a balanced input of nitrogen-rich plant residues, as well as sufficient access to oxygen, water, and heat for soil decomposers. Therefore, adopting agriculture to increase the stabilized MAOM pool should be based on management practices that favor microbial functioning to continuously enrich the soil with low-molecular-weight organic compounds, i.e., microbial-available C pool.
Among conservation agriculture practices, no-tillage has been extensively studied for its potential to enhance C stocks by minimizing soil disturbance and promoting residue retention [
10,
11,
12]. Despite ongoing debates about its effectiveness, no-tillage is widely recognized as a reliable tool for reducing soil degradation from water / wind erosion and for optimizing water usage [
13]. Furthermore, this conservation agriculture practice fosters favorable topsoil microclimatic and nutritional conditions for microorganisms, leading to a steady increase in their population and diversity [
14,
15], and microbial-available C pool size [
16]. These, in turn, create the potential to increase topsoil MAOM and thus reduce the existing C saturation deficit in agricultural soils. However, many studies have shown that the effectiveness of no-tillage in MAOM gain varies significantly depending on the soil texture, climate, cropping system, and nutrient management practices [
17,
18,
19,
20]. At the same time, such studies in the Chernozem region remain limited [
21,
22], especially in a commercial farming setting with high spatial heterogeneity of environmental conditions [
23]. The latter limits farmers’ ability to develop and implement targeted management strategies for long-term С storage at the farm-scale.
At the same time, soil compaction is a common problem in no-till farming, especially in heavy-textured soils such as Chernozems [
24]. In combination with the periodic excess soil moisture, this can cause significant damage to root developing and microbial functioning due to insufficient oxygen. As Chernozems often occur in undulating areas [
25], the appearance of such biologically unfavorable conditions is highly relevant for low-lying areas. Therefore, the C sequestration capacity of Chernozems under no-till management is expected to show contrasting trends under different water regimes. To test this hypothesis, we evaluated spatial variability of soil organic C content and its different pools (i.e., MAOM, POM, and microbial-available C) in tilled and no-tilled Chernozems of the automorphic plain and the lowland, which are characterized by contrasting water regimes within Russian farmland.
2. Materials and Methods
2.1. Study Area
The study was conducted at two sites in southern European Russia: Rostov (47.5° N, 38.9° E) and Krasnodar (45.0° N, 37.9° E). Both sites are located in the steppe zone, which has a temperate continental climate. The mean annual temperatures in Rostov and Krasnodar are 10.9 °C and 13.1 °C, respectively, and the mean annual precipitation is 577 mm and 757 mm, respectively (data from the closest WMO weather stations, “34720 Taganrog” and “37001 Anapa,” from 1991 to 2020).
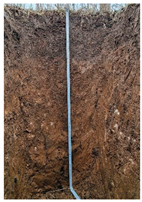
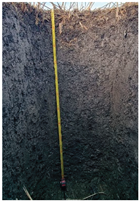
The sites have contrasting soil water regimes due to their distinct landscape positions. Specifically, the Rostov site is located in automorphic position at an elevation of 68 ± 5 m a.s.l. and has a non-waterlogged soil regime. The Krasnodar site is located in a lowland at an elevation of 11 ± 3 m a.s.l. and has a periodic flooded waterlogged soil regime. As a result, different soil subtypes were formed at these sites: Calcic Chernozem in Rostov and Stagnic Chernozem in Krasnodar. Both soils formed from loess parent materials and have a silt loam texture. However, Calcic Chernozem versus Stagnic Chernozem has a higher carbonate content (5.7–15.7% vs 0.1–1.0%) and pH value (8.3–8.7 vs 7.3–8.1) (
Table A1).
Crop cultivation at the Rostov site dates back about a century (online archive from the 1920s), while at the Krasnodar site it began in the late 1960s when a drainage canal network was constructed (according to local residents). Currently, Rostov’s crop rotation included winter wheat and sunflower, and Krasnodar’s one included winter wheat and maize. Historically, both sites have practiced conventional tillage (CT), which involves moldboard plowing to a depth of 22–25 cm. Since the 2010s, some farms changed soil treatment from CT to no-tillage (NT).
In 2023, we selected three adjacent fields at each site: one with CT, and two with NT for 8–14 years (
Table 1). All of the chosen fields were owned by commercial farms. Only mineral fertilizers were used, with application rates varying from year to year depending on the crop grown and the farm’s budget. Generally, the annual rates for nitrogen vary between 0 and 100 kg N ha
–1, for phosphorus between 0 and 70 kg P ha
–1, and for sulfur between 0 and 14 kg S ha
–1, as determined through communication with growers.
2.2. Soil Sampling Design
Both sites employed the conditioned Latin hypercube sampling (cLHS) design [
26], which accounted for variations in both spectral characteristics (surface reflectance in several bands as well as crop productivity via the normalized difference vegetation index – NDVI) and terrain parameters (i.e., elevation and its derivatives). We have used cloud-free Sentinel-2 (Level-2A) images acquired within June and September of 2023 (median composite) for retrieving surface reflectance in blue, green, red, red-edge, NIR, SWIR ranges of electromagnetic spectrum as well as for NDVI. We have further used the Shuttle Radar Topography Mission (SRTM) digital elevation model with 30 m resolution to calculate terrain parameters [
27]. Along with elevation with EGM96 vertical datum, we have additionally used slopes in degrees, aspect in degrees, total curvature, flow directions, upslope contributing area, and topographic wetness index (TWI) [
28]. Terrain derivatives were calculated in QGIS Desktop software (version 3.38) and the R environment (version 4.4.1) [
29]. Spatial data were prepared as multiband raster file at 30 m spatial resolution by resampling Sentinel-2 data to SRTM resolution.
Within each field of every site, 30 locations for sampling have been selected using thirteen raster layers in the R package
clhs [
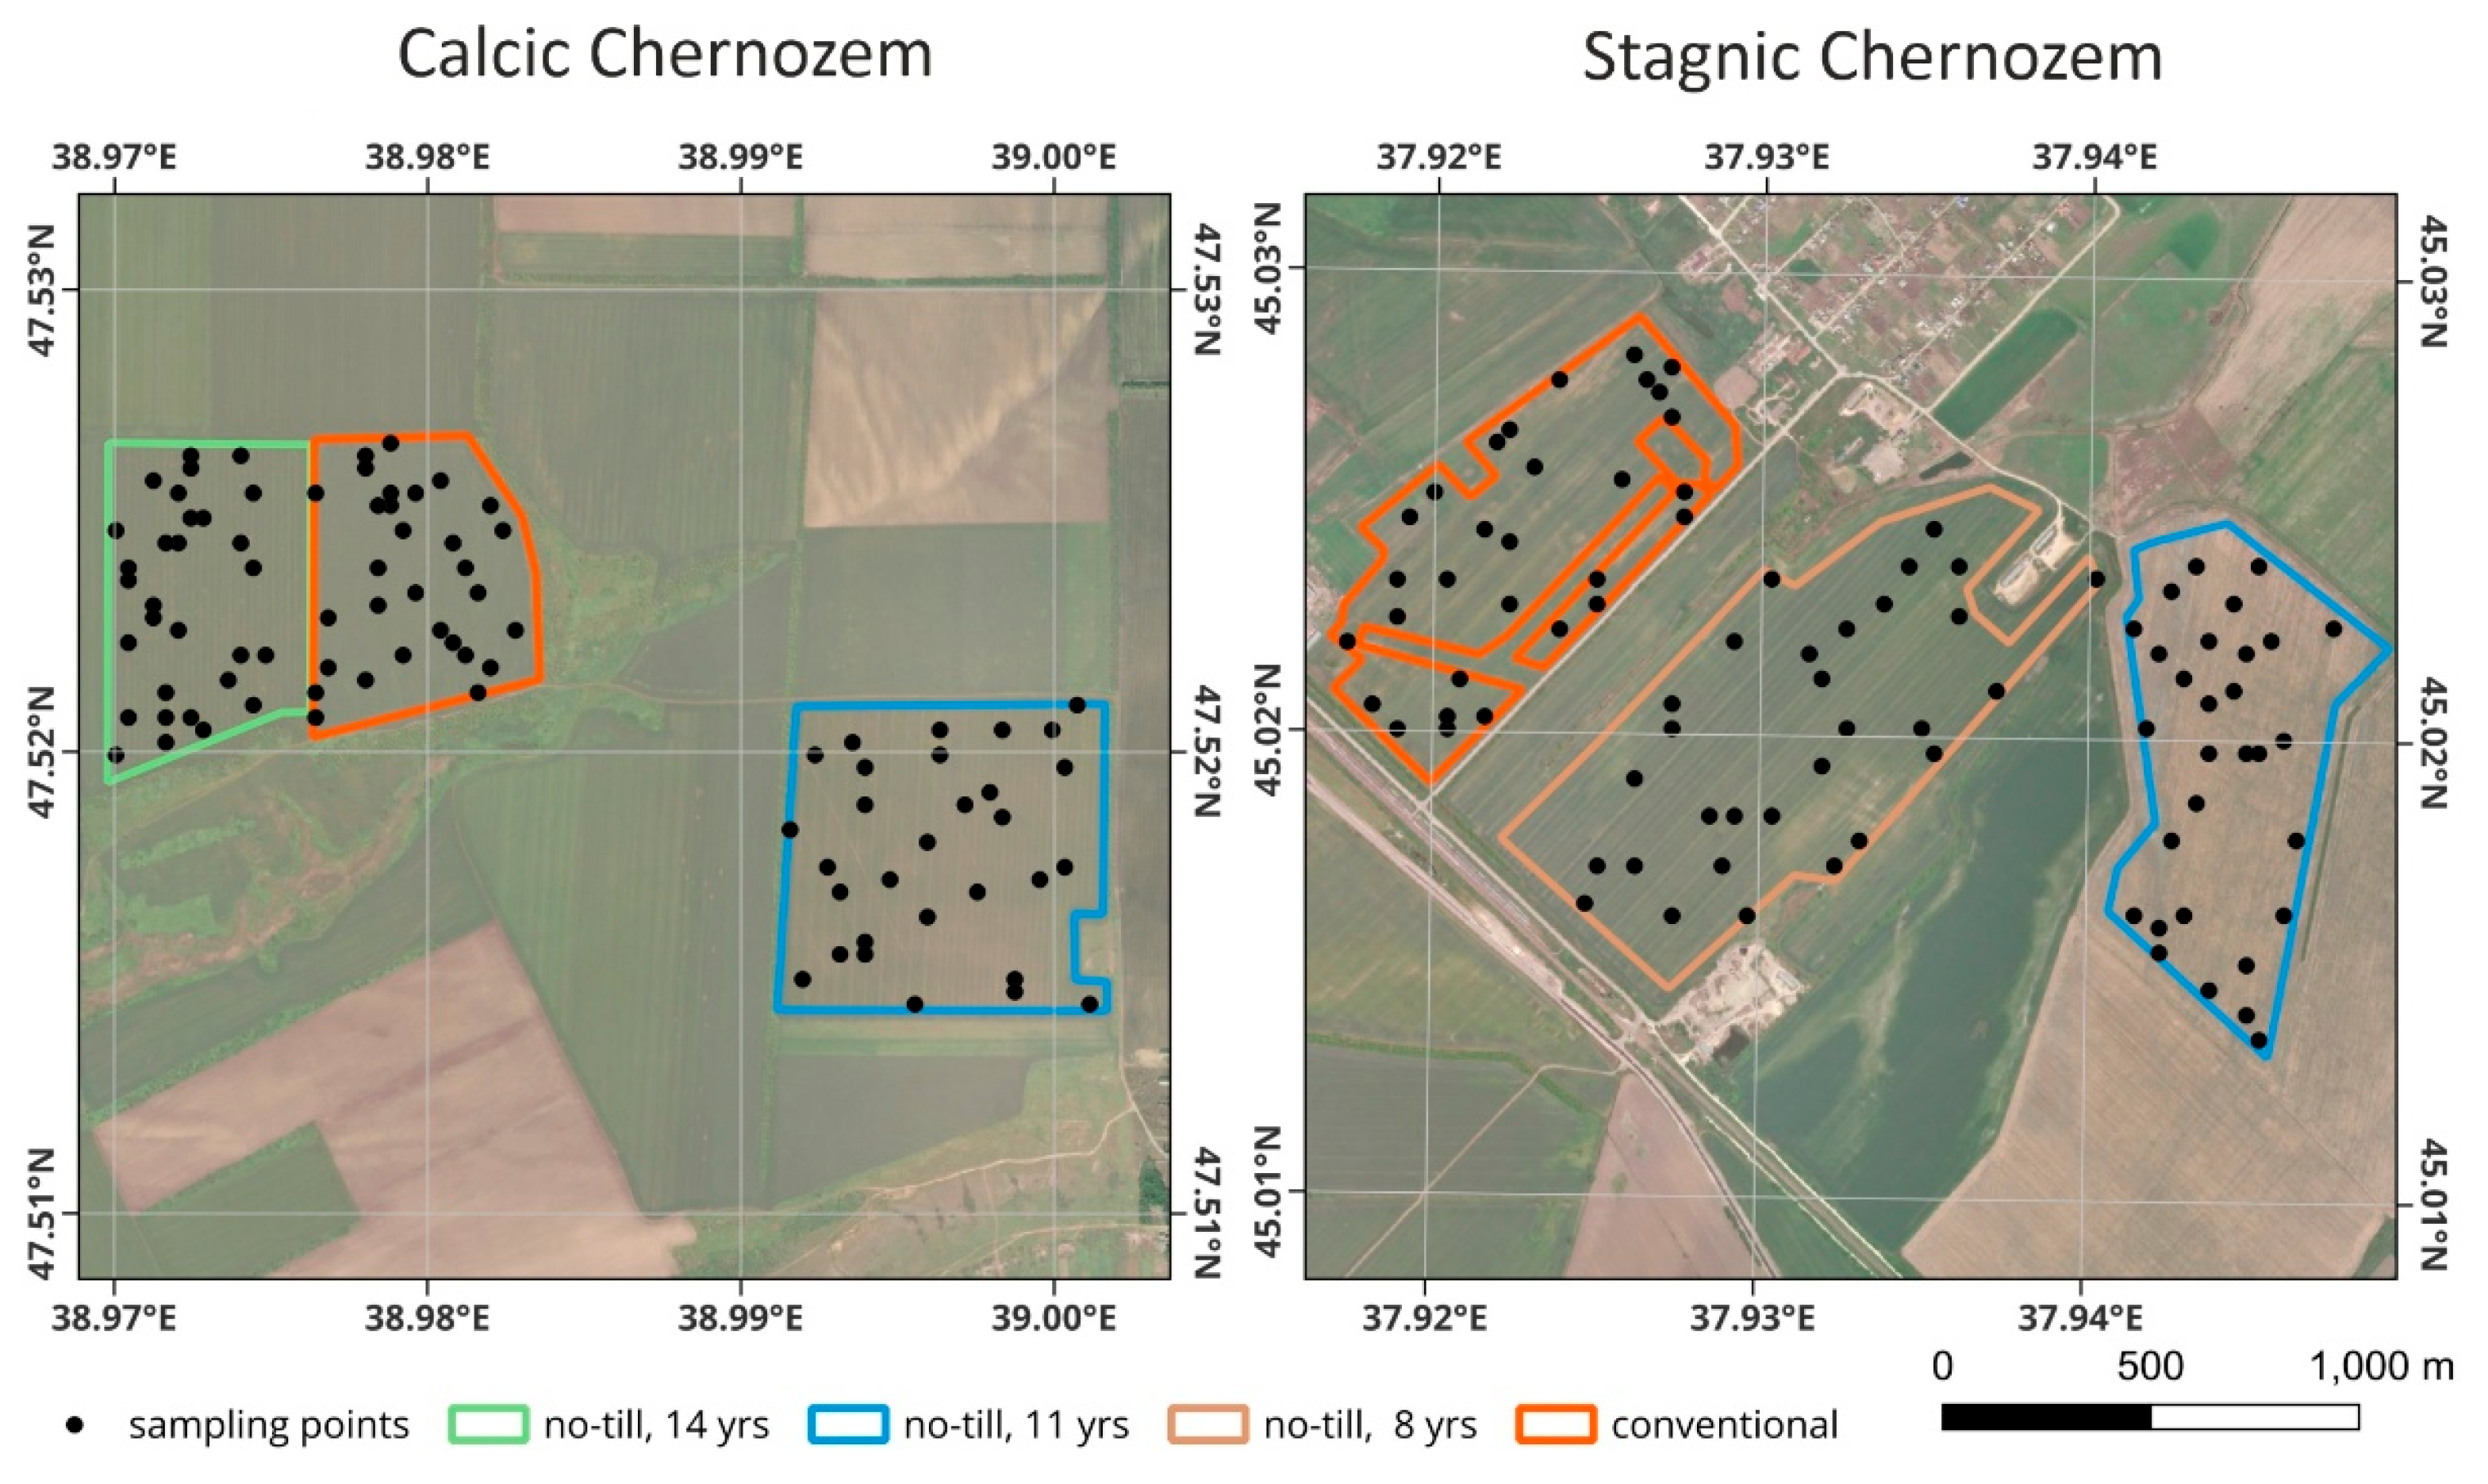
30]. The location of the sampling points across the studied fields is shown in
Figure 1. At each sampling point, a soil sample was taken from the topsoil (0-10 cm) and subsoil (10-30 cm) layers in November 2023. In addition, 2 soil samples with an undisturbed structure were taken from each laeyrs (0–5 cm and 5–10 cm for the topsoil; 10–15 and 25–30 cm for the subsoil) using a metal cylinder (volume of 100 cm
3) for subsequent assessment of bulk density. The soil samples were placed in individual plastic bags and delivered to the laboratory.
2.3. Determination of Soil Organic Carbon Stocks
Soil samples were air dried at the room temperature and sieved through a 2-mm mesh to remove any plant debris and roots. Total carbon (TC) content in a finely ground soil sample (~ 20 mg) was analyzed using a dry combustion technique with an ECS 8024 NC Soil Special analyzer (Italy). Inorganic carbon (IC) content was measured using the manometric method, which is based on the change in air pressure within a closed vial after adding 10% HCl to the soil sample (2 g). The soil organic C content (SOC) was determined by the difference between the corresponding TC and IС.
SOC stocks (kg C m
–2) were calculated using the following equation:
where BD stands for the bulk density of the soil layer (g cm
–3), h stands for layer thickness (cm), SOC stands for the organic carbon content in the soil layer (%). To calculate BD, soil samples of a known volume were dried at 105 °C for 8 hours and then weighed. The average mass of each sample pair (0–5/5–10 cm and 10–15/25–30 cm) was calculated to determine the average BD of the topsoil (0–10 cm) and subsoil (10–30 cm) layers.
2.4. Particle-Size Fractionation of Soil Organic Carbon
The SOC of topsoil layer (0–10 cm) was separated into POM and MAOM using a particle size-based technique that combined sonication, wet sieving, and centrifugation. Air-dried and 2-mm sieved soil subsamples (5 g) were dispersed in 50 mL of distilled water with a sonication energy input of 60 J ml−1 (calorimetric calibration). Next, the soil suspension was passed through a 53 µm sieve and washed thoroughly with distilled water. Material retained on the sieve was designated as the POM fraction and dried to constant weight at 60 °C. The <53 μm suspension was centrifuged at 4000 g for 30 min (ULAB UC-1536E, Russia) to sediment MAOM-containing particles. The supernatant was discarded, and the pellet was dried to constant weight at 60 °C. The SOC content in the POM and MAOM fractions was determined as for the total soil sample, as described in the previous section.
2.5. Analysis of Soil Microbial-Available Carbon Pool
The microbial-available C pool in the topsoil (0–10 cm) was defined as the the amount of SOC that mineralized to CO
2 during six months of soil incubation under optimal hydrothermal conditions (22 °C and 65% water-holding capacity). Prior to analysis, 10-gram soil subsamples were placed in 100-mL glass vials and standardized by oven-drying at 65 °C for 24 hours. This procedure rehydrates microbial cells and incorporates their C into the active SOC pool [
31,
32]. Then, the soil was rewetted with distilled water to 65% of its water-holding capacity. Immediately following, the vials with soil hermetically sealed with silicone stoppers and incubated at 22 °C. The first measurement of the CO
2 release rate was performed 3-4 hours after closing the vials, followed by daily measurements during the 1st week of incubation, three times a week starting from the 2nd week, twice a week starting from the 2nd month, once a week starting from the 3rd month and up to six months taking into account CO
2 flux dynamics. After each measurement, the vials were air-exchanged for 15-20 minutes. Constant soil moisture was maintained by periodically weighing the vials with soil and adding distilled water in case of weight loss. The CO
2 concentration in the gas phase of the vial was determined by gas chromatography (Crystallux-4000M, Russia). Finally, the total CO
2 fluxes released during the six-month incubation period (microbial-available C pool) for each soil sample were calculated. Additionally, the proportion (%) of the microbial-available C pool from the total SOC was calculated.
2.6. Statistical Data Analysis and Field-Scale Mapping
A one-way ANOVA was used to evaluate differences in soil properties among the three fields within each geographic site. If there were significant differences, we used Dunnett’s test to compare the means of the two NT fields with the CT field. The spatial variability of the MAOM was quantified by the coefficient of variation (CV, %), which is the ratio of the standard deviation to the mean. Relationships between chemical and physical soil properties were examined with Pearson’s correlation analysis. The analyses were performed in R (version 4.5.1) using the following packages:
car for ANOVA [
33],
DescTools for Dunnett’s test [
34], and
ggplot2 for data visualization [
35].
We have mapped within-field spatial distribution of SOC stock in topsoil layer (0–10 cm) and its active C pool by using predictive digital soil mapping (pDSM). We have used a non-linear ensemble tree-based model GBM (gradient boosting machines) [
36] to statistically describe dependencies between target variable and a set of covariates, including spectral and terrain properties. To the initial set of covariates used in cLHS, we have added Landsat-8/9 based spectral indices NDVI and MNDWI (modified Normalised Difference Water Index) [
37] as well land surface temperature (LST) calculated as in [
38]. Fields were also rasterized and added as a covariate to a set of predictors. Among terrain parameters, we have left elevation, slope, aspect, and TWI for prediction. Uncertainties of GBM models were assessed through a nine-fold cross-validation RMSE. Optimal tuning parameters were established through an iterative looping procedure with different combinations (n=882). Processing of remote sensed data has been done in Google Earth Engine and in R environment [
29]. Modelling has been performed using a
caret package [
40]. We have further assessed feature relative influence of the main covariates using
gbm package in R.
3. Results
3.1. Soil Bulk Density and Organic Carbon Stocks
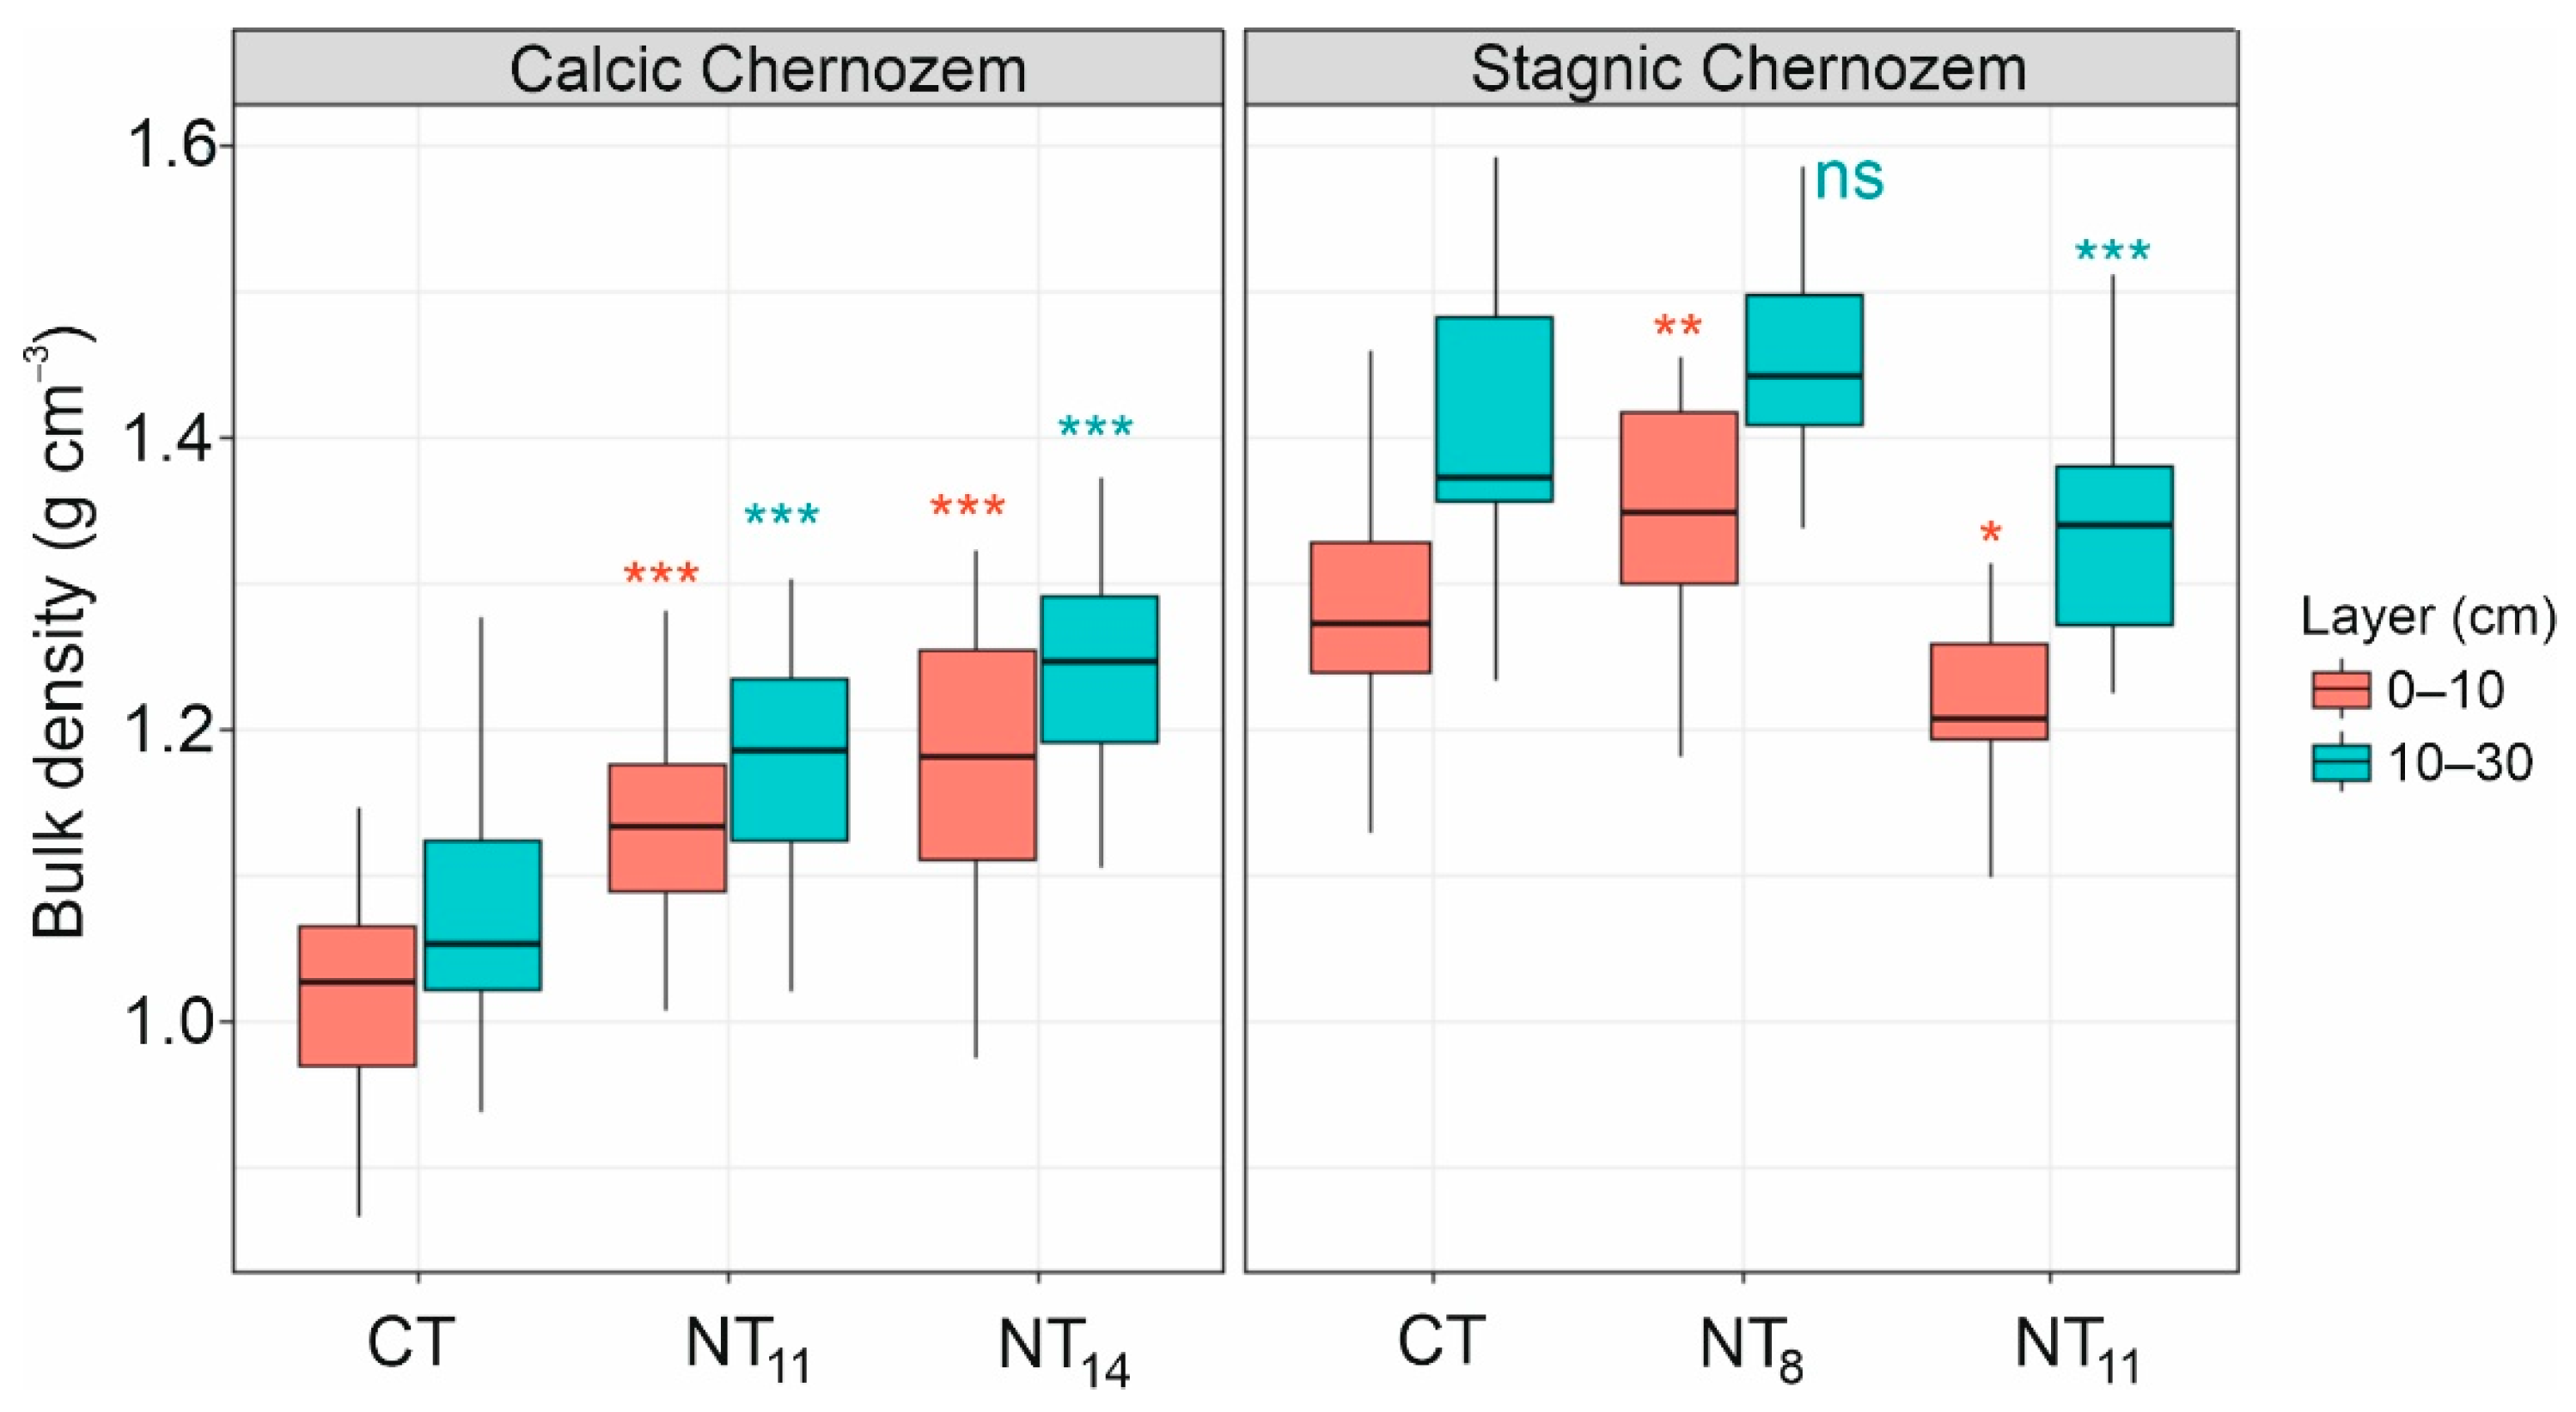
The bulk density (BD) of Calcic Chernozem increased gradually from CT to NT
11 and NT
14 (
Figure 2). However, for Stagnic Chernozem, no clear trend was found regarding different tillage systems. Notably, Stagnic Chernozem versus Calcic Chernozem had higher BD values, averaging 15% and 21% in the 0–10 cm and 10–30 cm layers, respectively. As expected, this parameter increased with soil depth by approximately 5–10% for both soils.
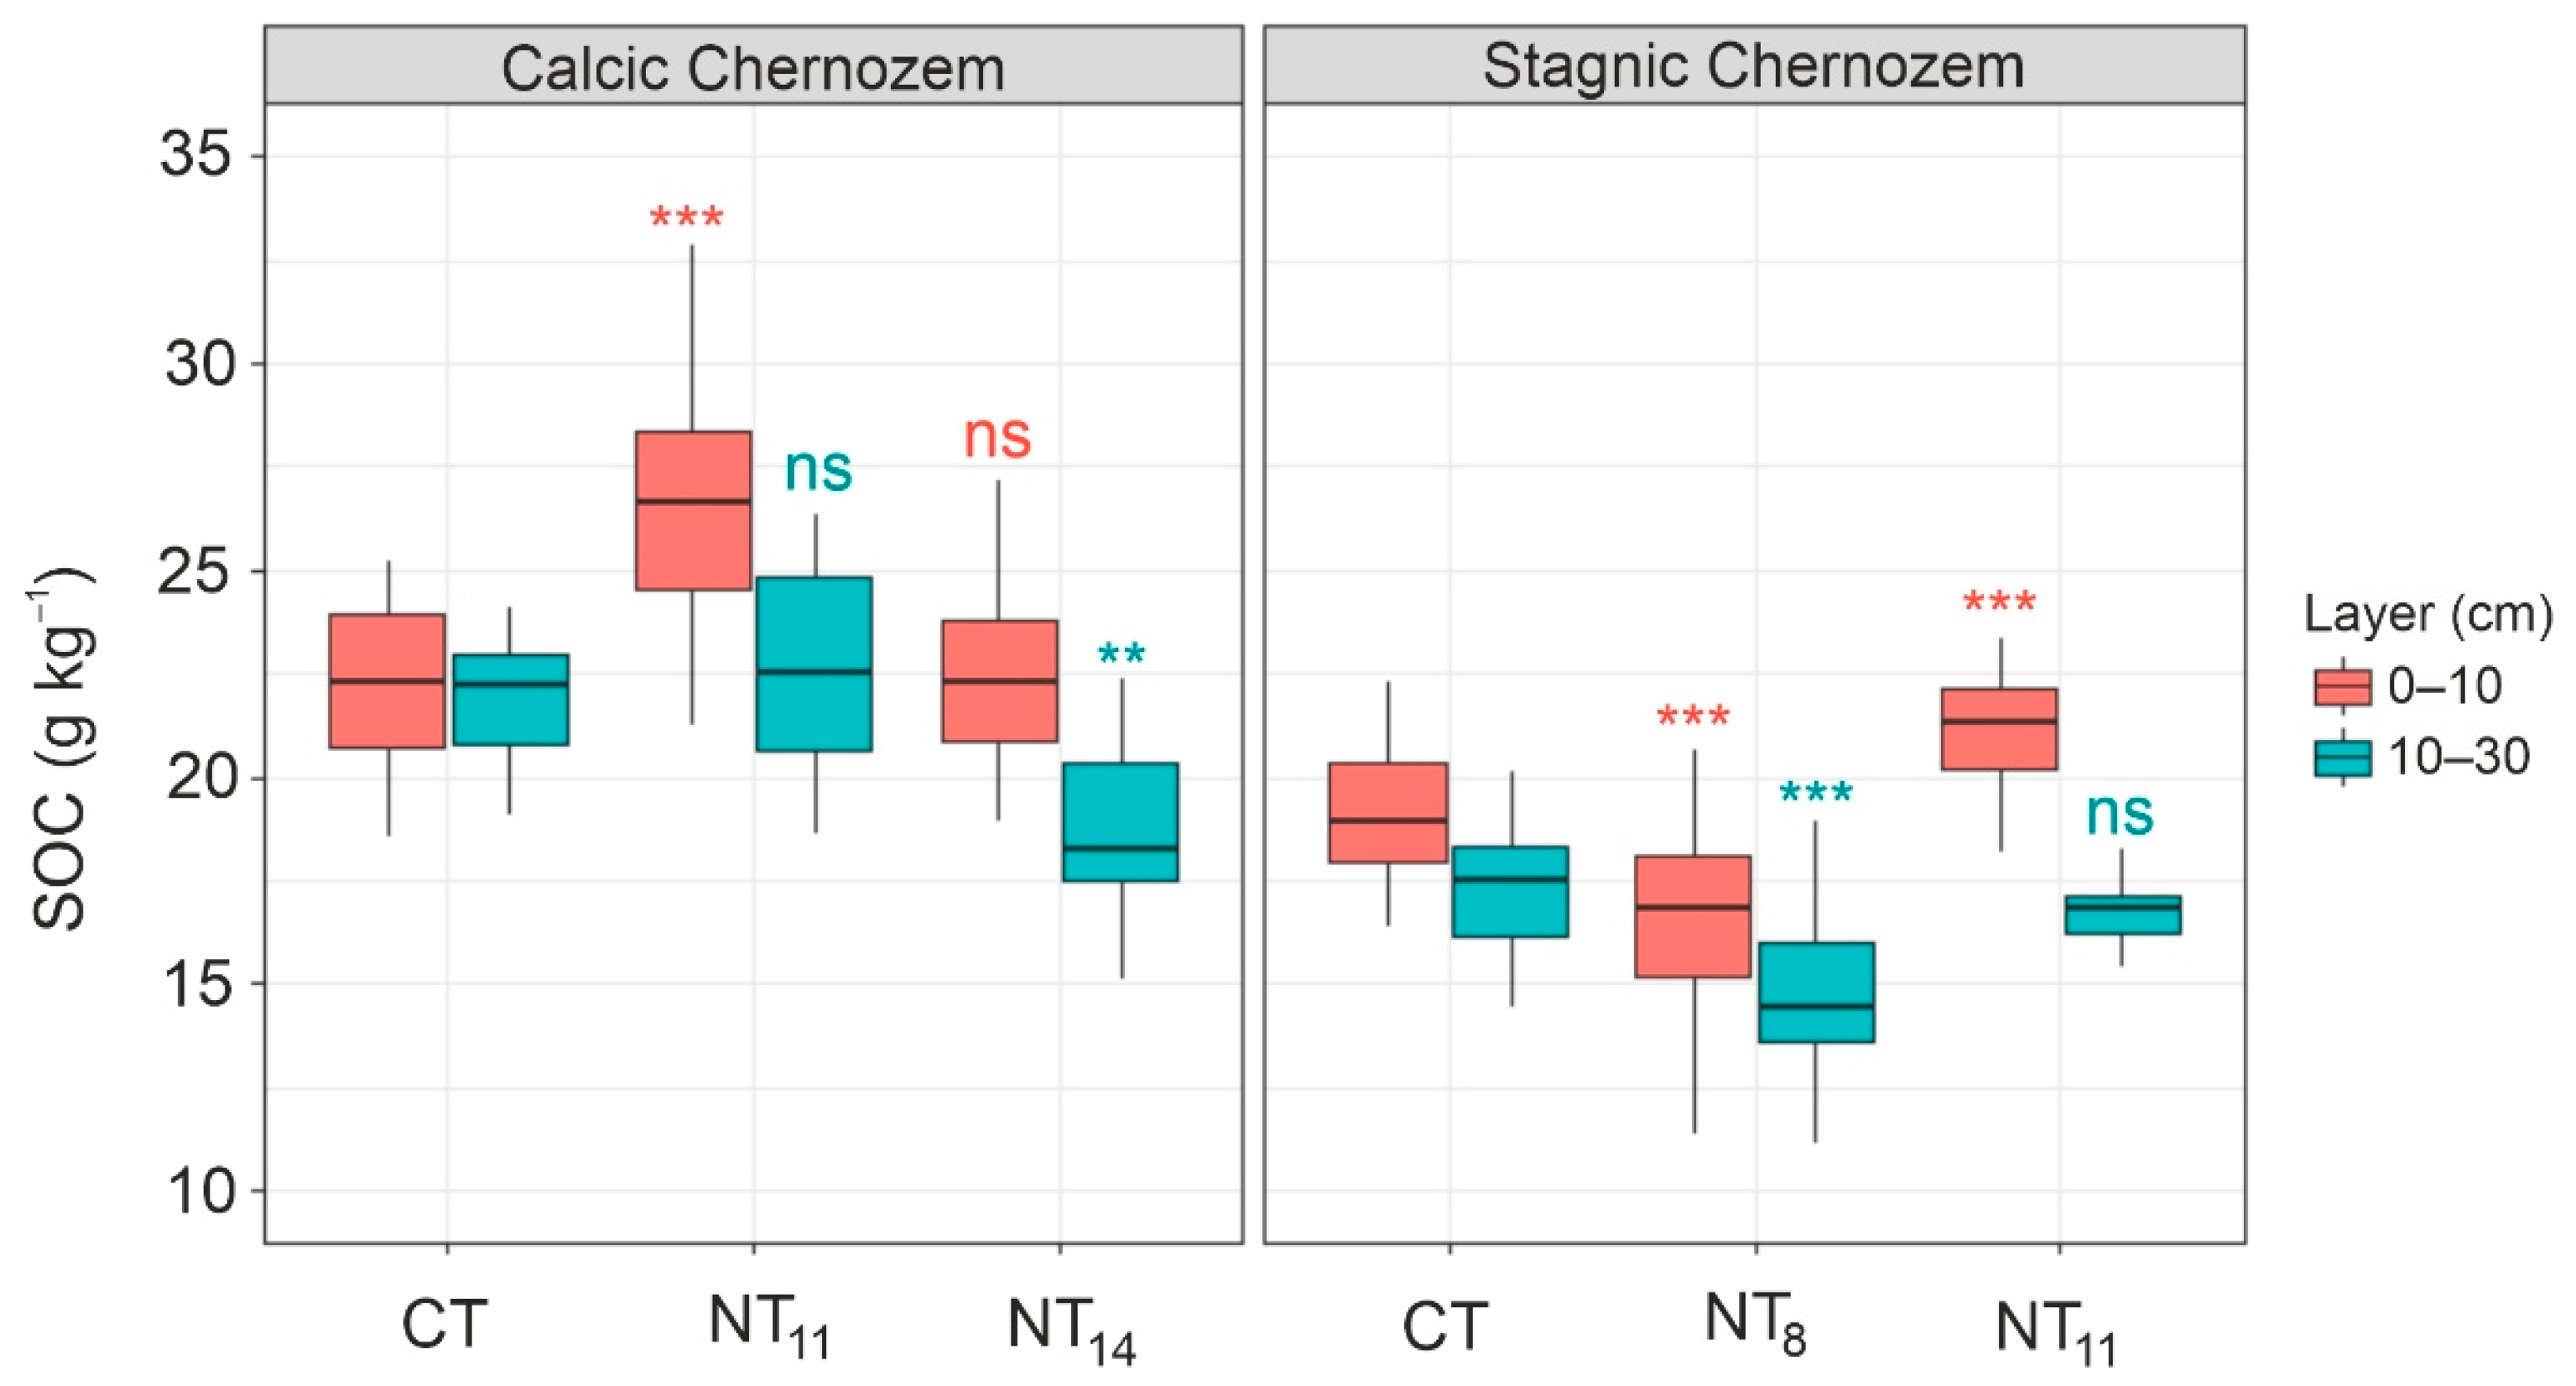
No clear trend emerged in the change in SOC content between the CT and NT systems for either Chernozem subtype (
Figure 3). At the same time, instances of increased SOC (by 12–16%) under NT compared to CT were exclusively observed in the topsoil layer of both Chernozem subtypes, namely for NT
11 fields. For the subsoil layer, this parameter either remained unchanged or decreased by 8–13% from the CT.
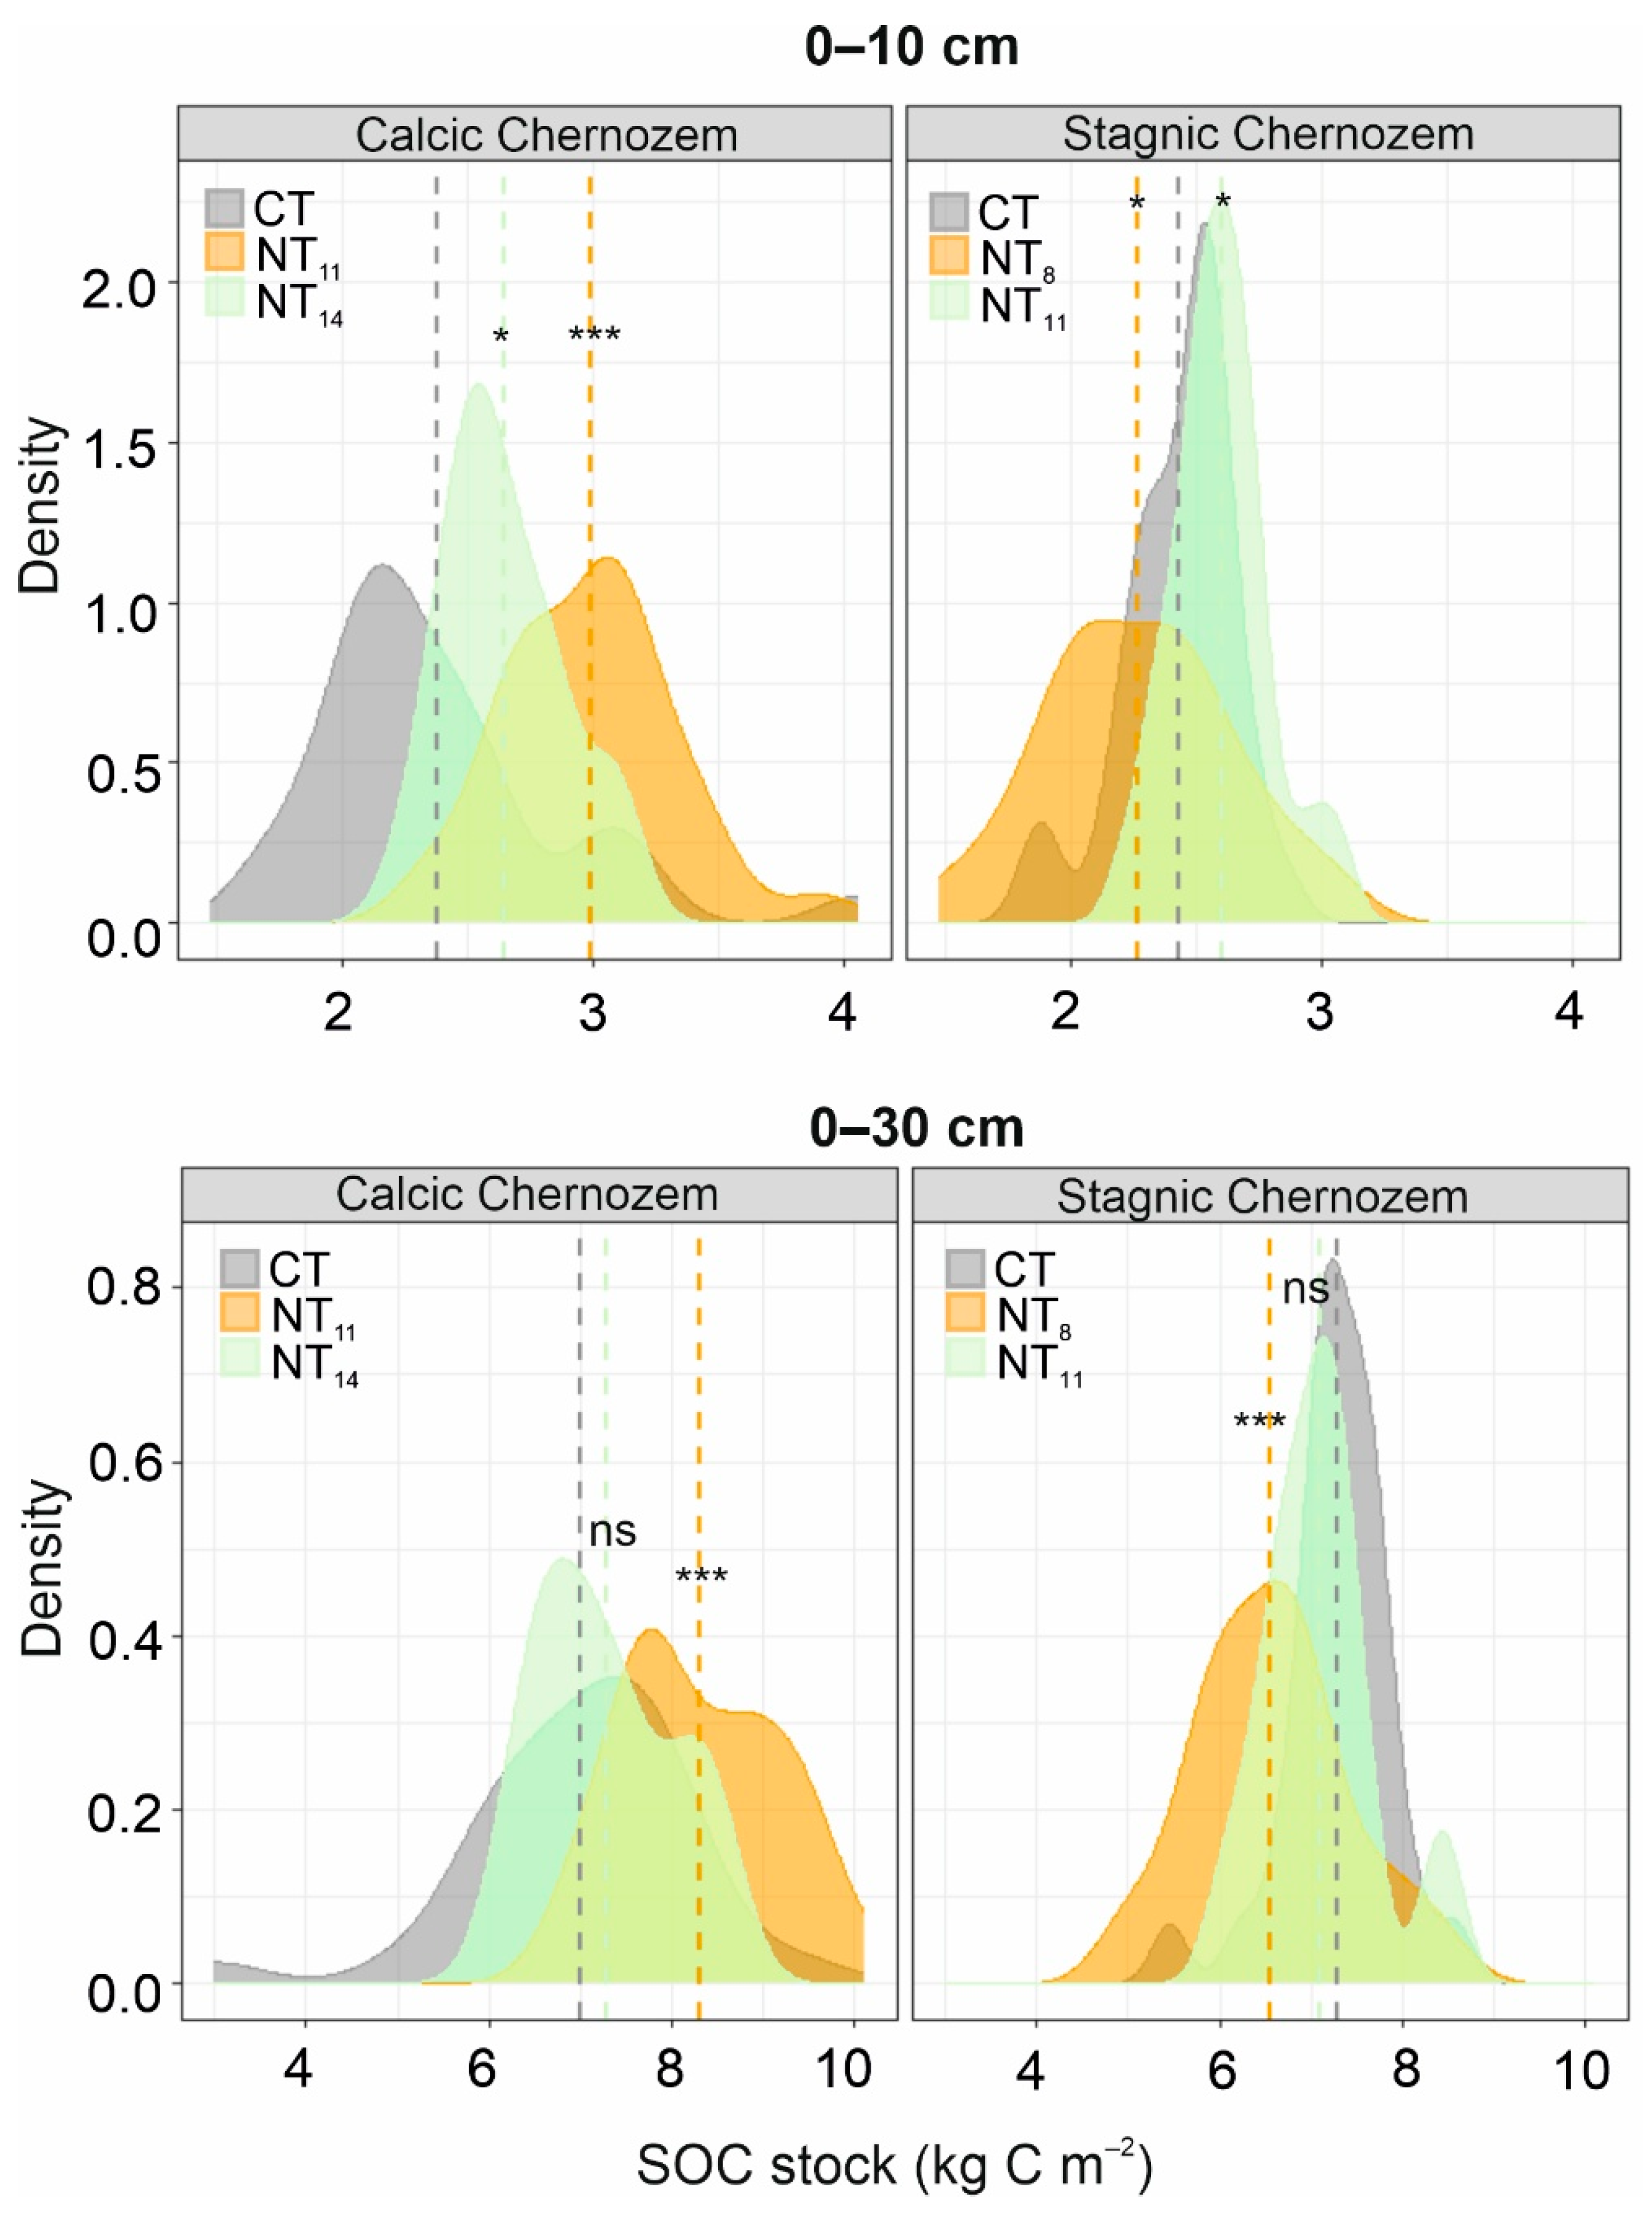
The SOC stock in Calcic Chernozem was consistently higher under NT than under CT for depths up to 10 cm (
Figure 4). For depths up to 30 cm, the increased SOC stock was only retained in the NT
11 field. For Stagnic Chernozem, this parameter was higher / lower under NT than under CT for depths up to 10 cm, and the same / lower for depths up to 30 cm.
In general, the SOC stock variability reflected the combined changes in the SOC concentration and soil physical properties (i.e., BD). Therefore, to understand the true effect of different management practices on soil C storage, we should consider SOC content of an equal soil mass (e.g., per kilogram) instead of an equal soil depth (up to 30 centimeters). In this context, topsoil SOC content (0–10) showed potential for positive changes in soil C sequestration under NT compared to CT. Consequently, we further considered only this soil layer when assessing the qualitative characteristics of SOC under different tillage management.
3.2. Particle-Size and Microbial-Available Pools of Soil Organic Carbon
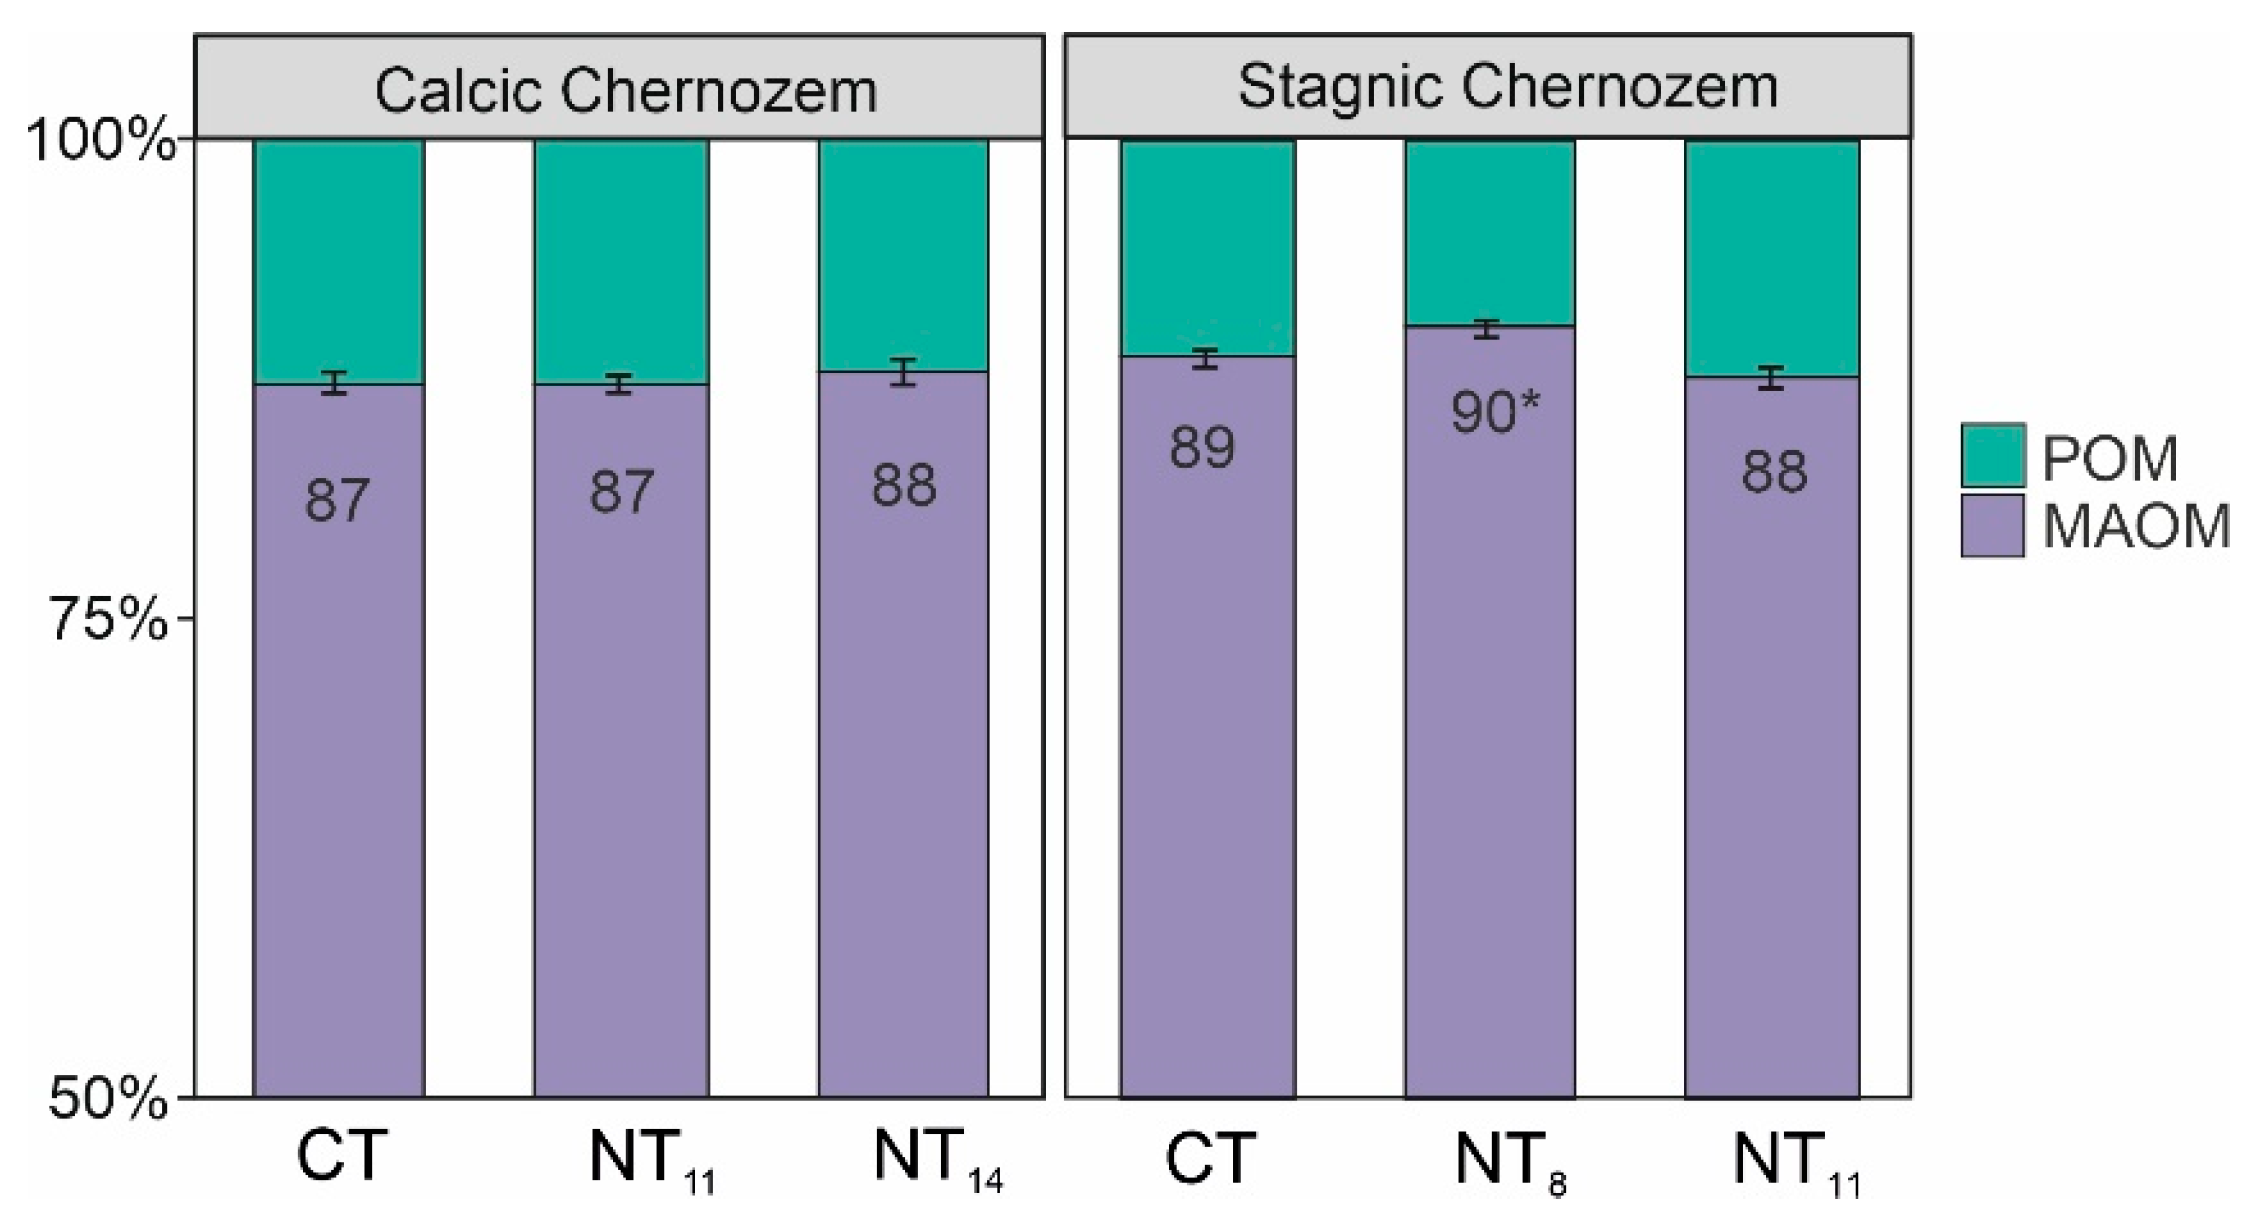
The majority of the SOC (87–90%) in both Chernozem subtypes was present as the MAOM pool (
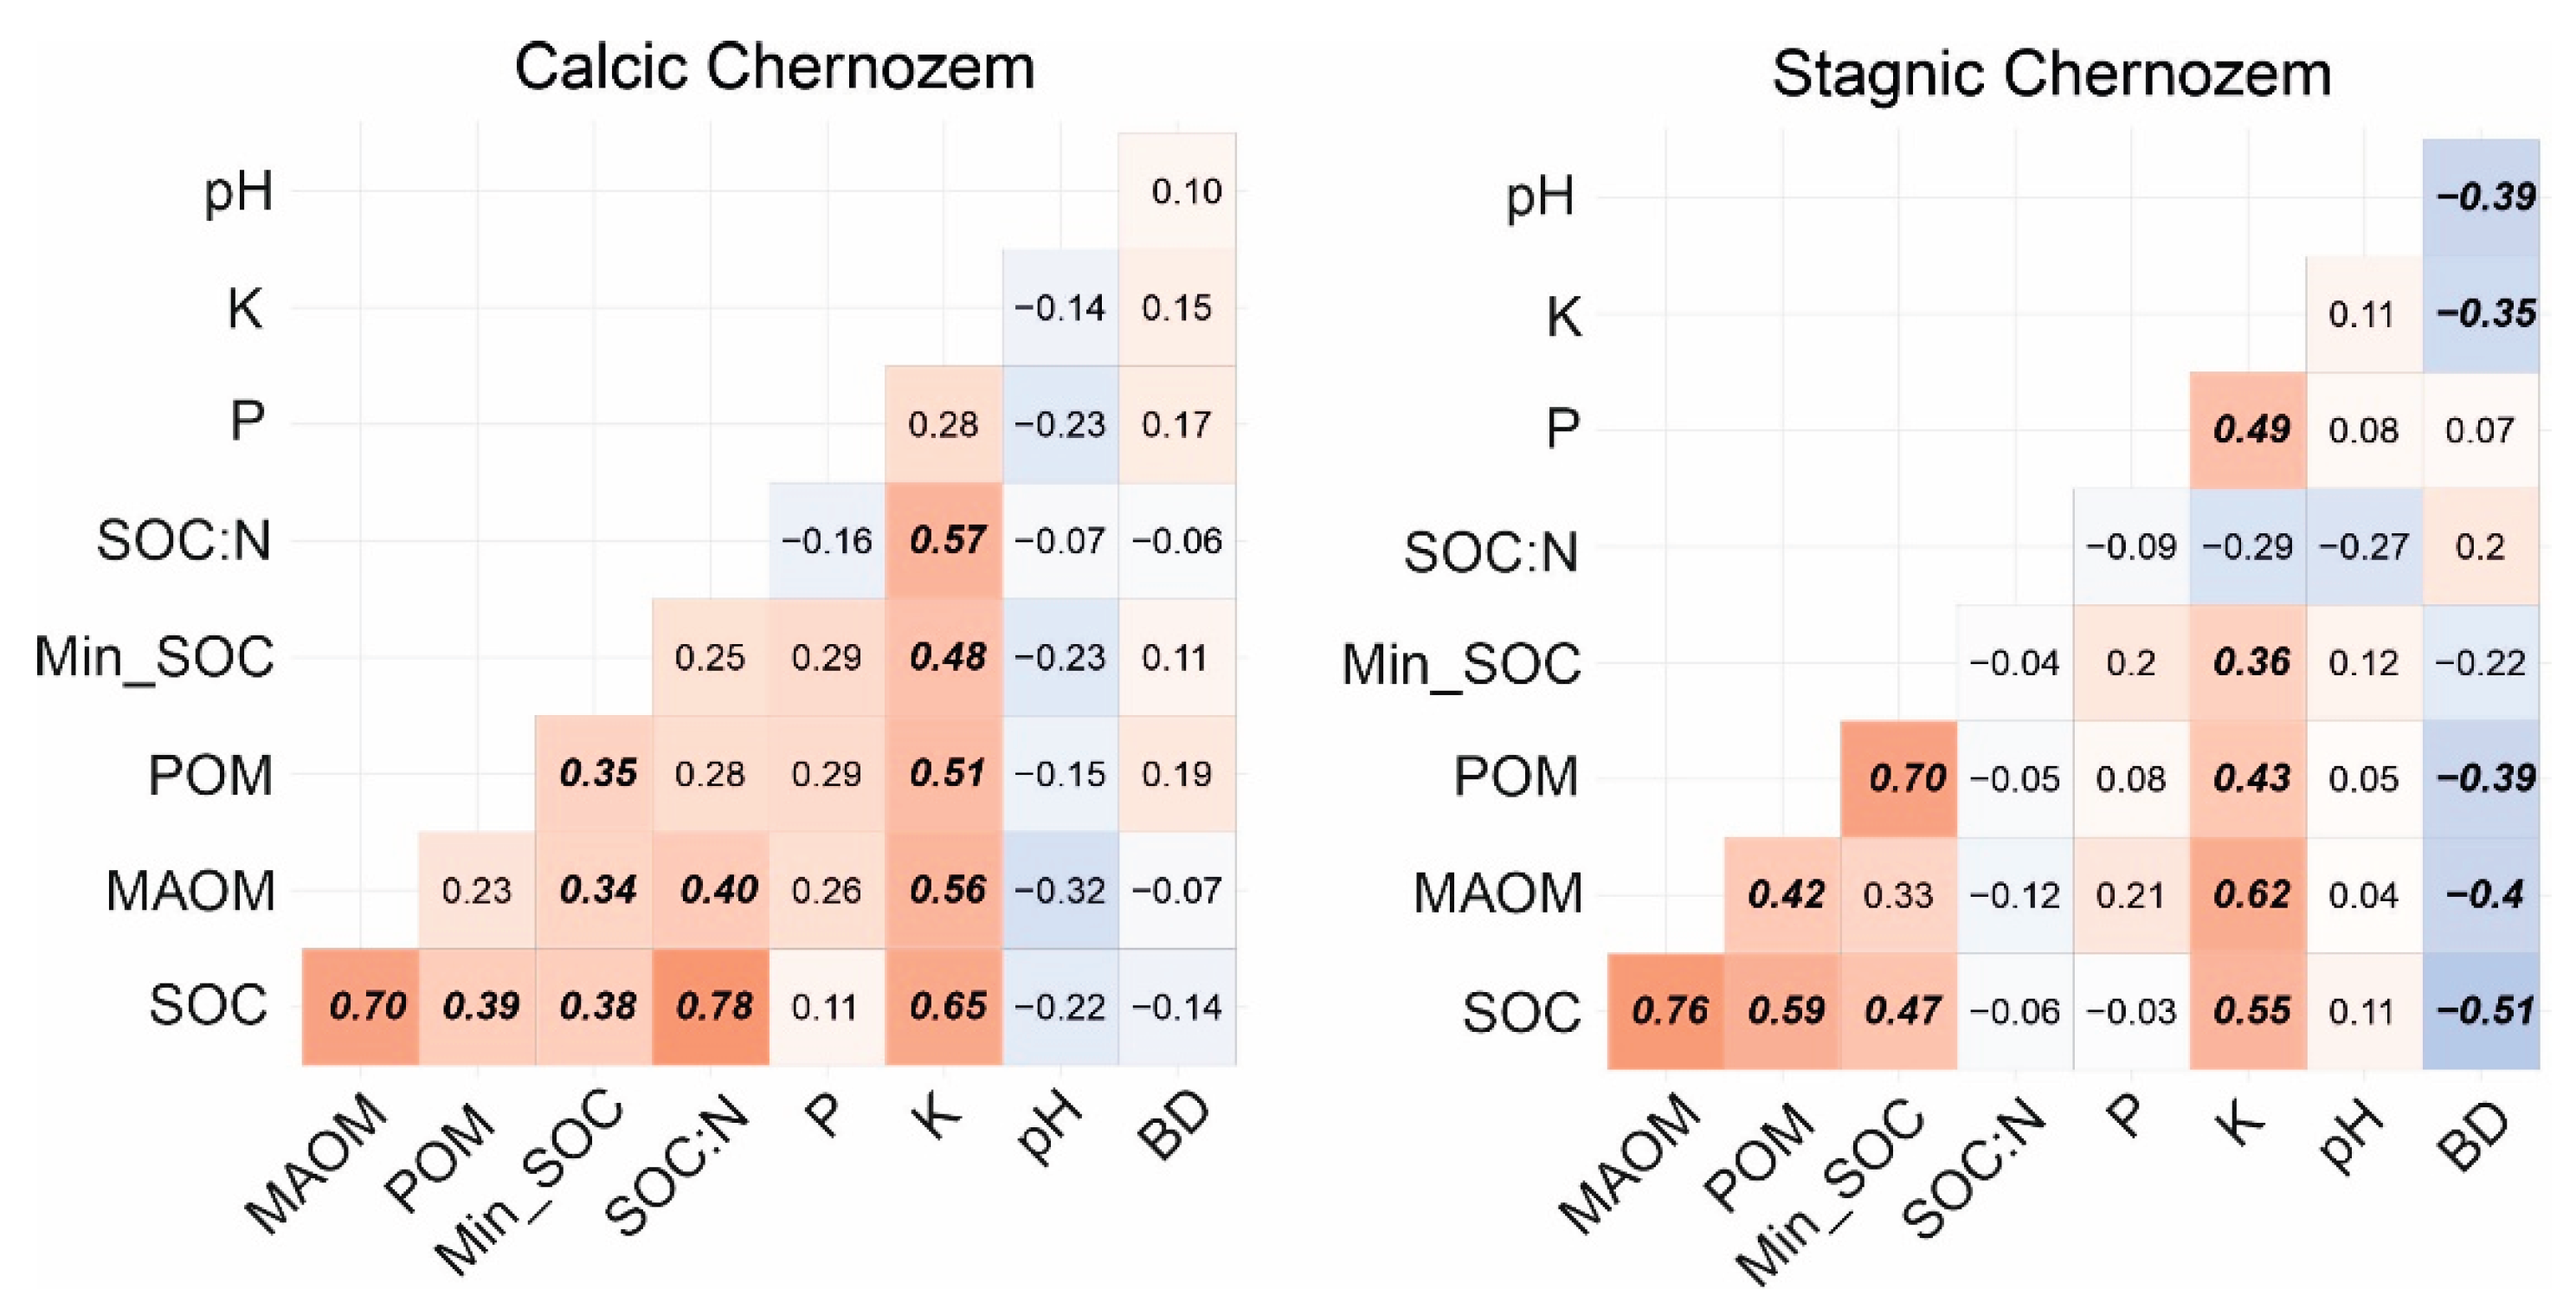
Figure 5). Notably, this parameter demonstrated negligible variability, both within individual fields (CV 3–4%) and between tillage systems (СV ~1%). This suggests that the long-term and intensive agricultural use of Chernozems has resulted in depleted POM and uniform MAOM pool that is likely insensitive to short-term changes in tillage systems (8–14 years) without essential increasing soil C inputs. Meanwhile, total SOC variability across studied fields were more closely correlated with MAOM (r = 0.70–0.76) than with POM (r = 0.39–0.59). (
Figure A1).
The microbial-available C pool (released C-CO
2 for 180 days) increased from CT to NT for Calcic Chernozem, but it showed an inverse trend for Stagnic Chernozem (
Figure 6A). Concurrently, the contribution of this pool to the total SOC was lower for Calcic Chernozem (3–4%) than for Stagnic Chernozem (7–9%) (
Figure 6B).
For the Calcic Chernozem, the microbial-available C pool was moderately correlated with total SOC (
r = 0.38), as well as with the labile POM and stable MAOM pools (
r = 0.34–0.35) (
Figure A1). At the same for the Stagnic Chernozem, it showed a strong correlation with POM (
r = 0.70) and a moderate correlation with total SOC or MAOM (
r = 0.33–0.47).
Thus, in contrast to the stable MAOM pool, the microbial-available C pool was sensitive to the conversion from CT to NT systems, exhibiting a topography-dependent pattern of change. Specifically, for Calcic Chernozem formed in an automorphic landscape, NT improves SOC cycling, thereby increasing total soil nutrient availability. Concurrently, NT deteriorates microbial-mediated SOC cycling in periodic waterlogged Stagnic Chernozem formed in the lowland, most likely due to a decrease in soil aeration without mechanical loosening.
3.3. Predictive Modeling and Mapping of Topsoil Organic Carbon
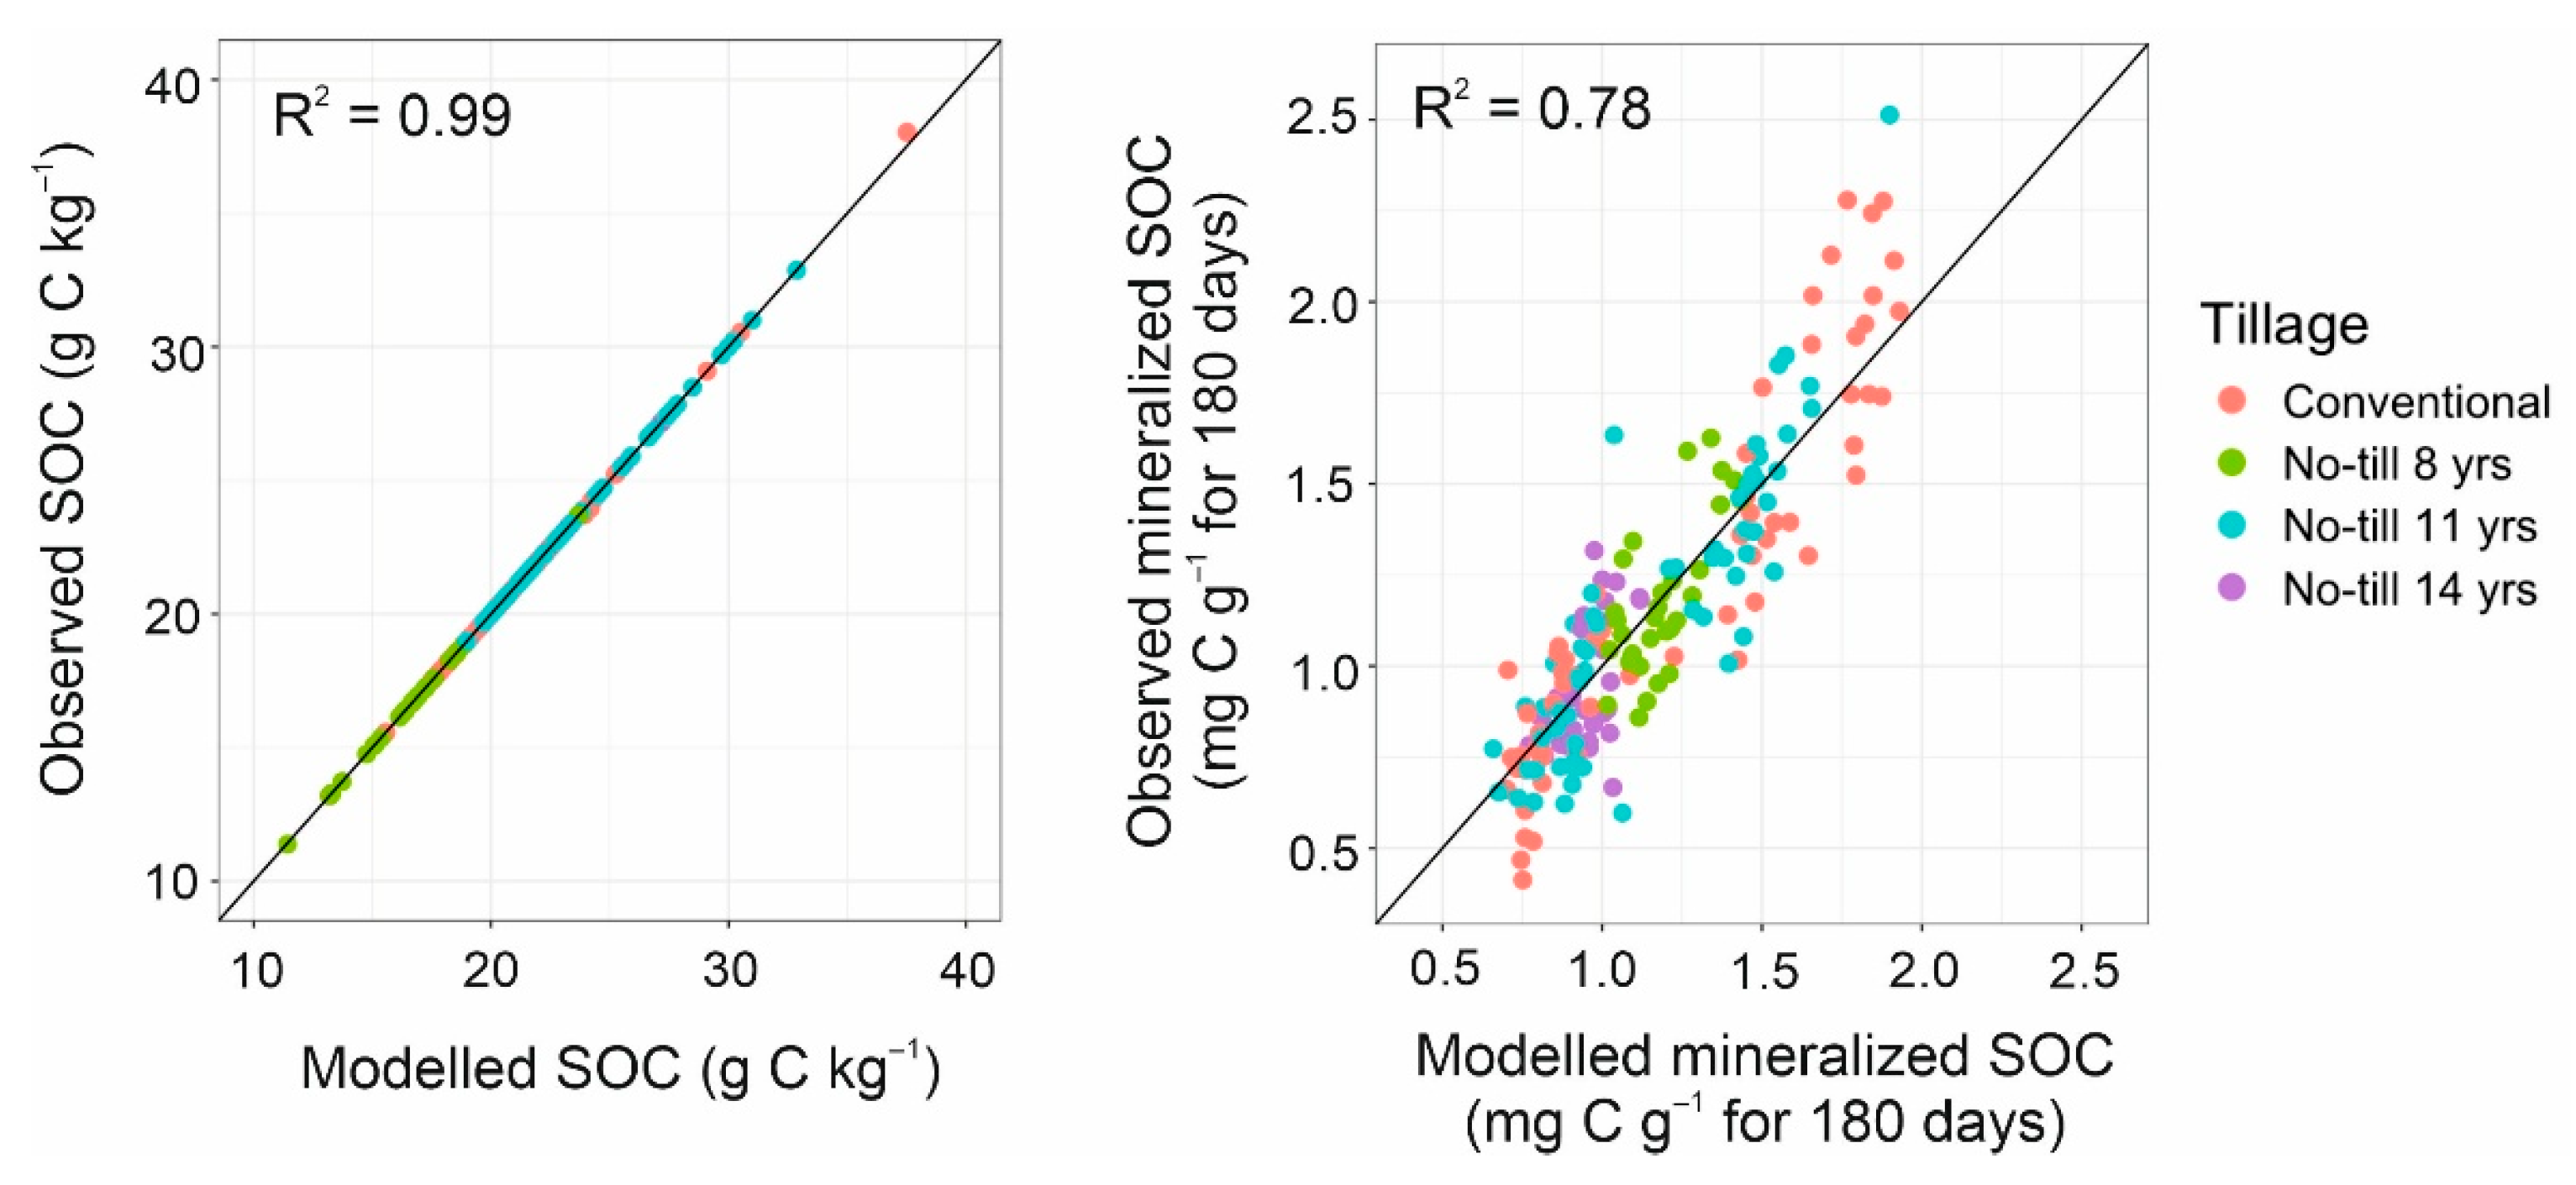
We selected the SOC content in the topsoil (0–10 cm) and its active pool (mineralized SOC over six months) as the target variables for pDSM because they were the most sensitive to changes in tillage management. Non-linear statistical models with a set of predictors (sub-section 2.6) were able to explain 99 and 78% of variance for above mentioned target variables (
Figure 7). Cross-validation RMSE (RMSE
cv) for these models were 2.29 g C kg
-1 and 0.29 mg C g
-1 of soil, respectively. For SOC content there was a perfect model fitting, whereas for the active C pool was a slight underestimation especially for highest values (1.8 – 2.5 mg C g
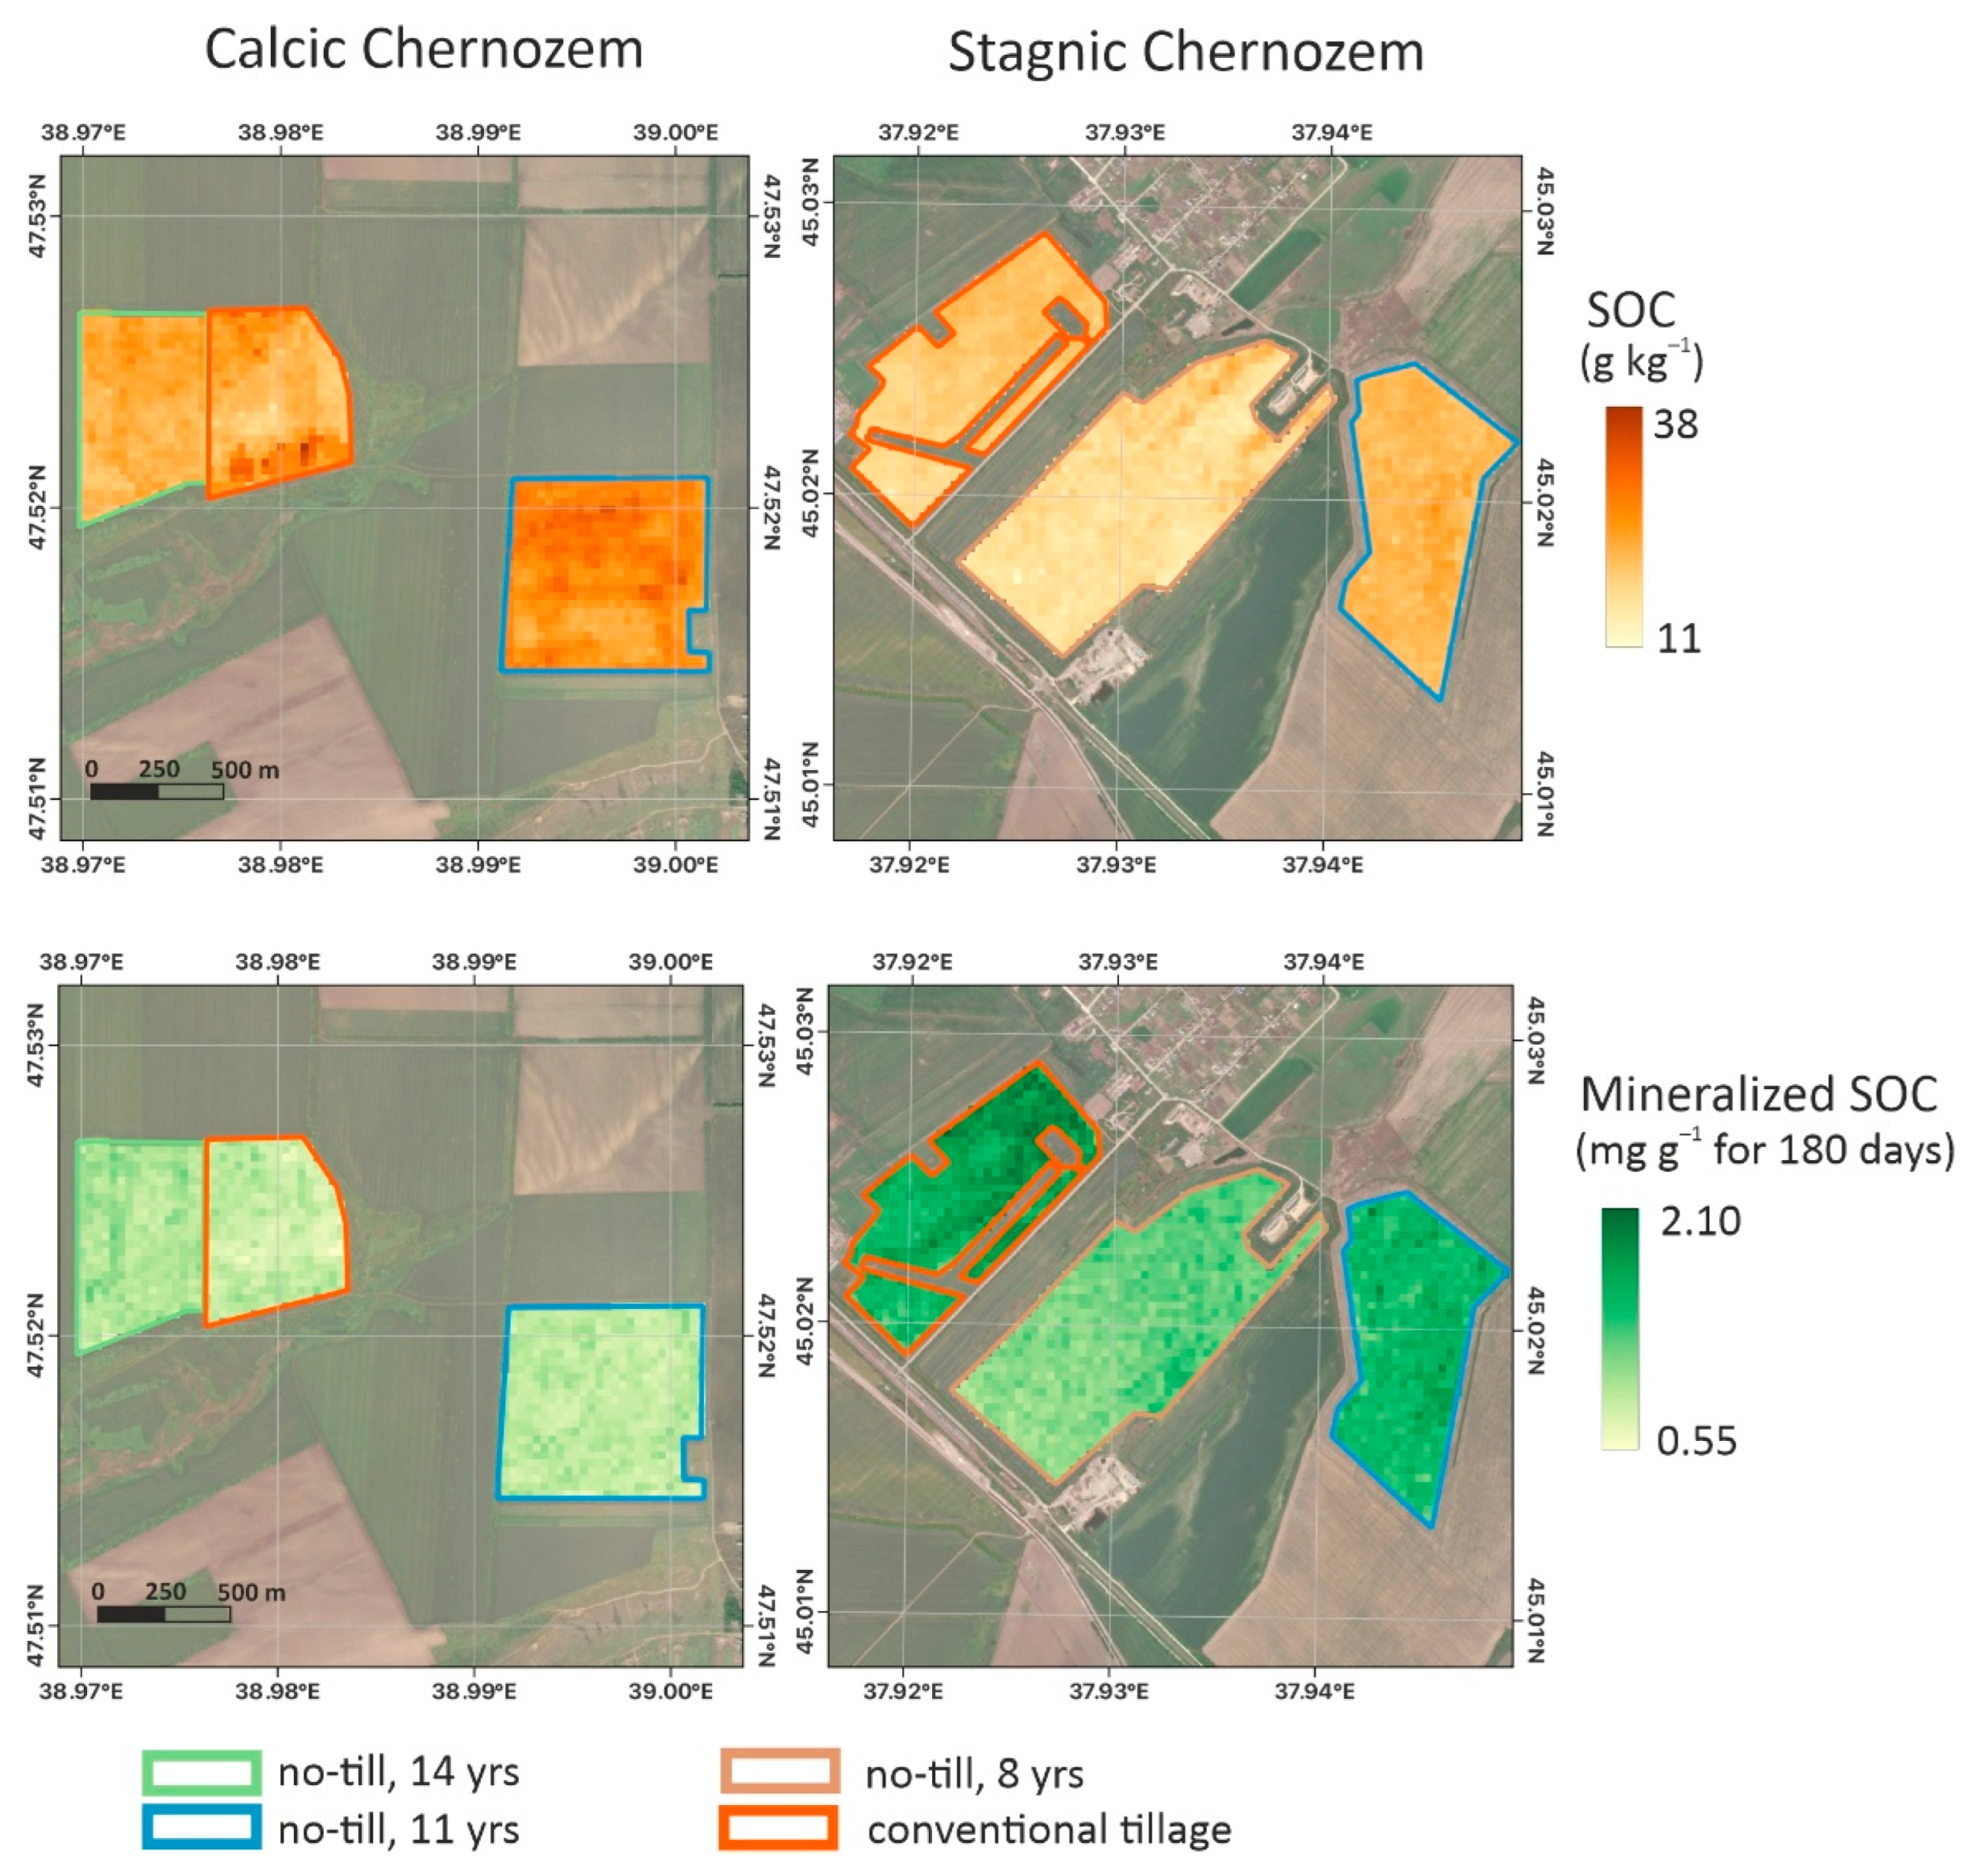
-1 of soil). Spatial variability of SOC content has mainly been driven by elevation (relative influence (RI) 28.3%), surface reflectance in near-infrared range (RI 15.1%) and land surface temperature (LST) (RI 7.3%) (
Figure 8). Impact of tillage has only been visible for no-till field over 11 yrs (RI 6.3%). Main drivers for the SOC content – topography, thermal regime, and the vegetation response: elevation parameter (m asl) has distinguished both sites (higher amount of SOC in more elevated Rostov fields) – positive relationship; within-field variation (but mainly for the Rostov fields) has further been explained by the vegetation impact: more vegetation in the pixels – more SOC (statistically determined by increasing near-infrared surface reflectance); thermal regime has influenced the average SOC distribution (21 – 22.5 g kg
-1) – a complex non-linear relationship. Both elevation and vegetation response have impacted the active C pool (RI of 18.6 and 8.7%), but this variable was rather driven by the moisture regime – through MNDWI spectral index (RI of 25.9%) - positive relationship (wetter – higher). In this case, elevation has shown a negative relationship – lower values for Rostov fields (
Figure 8). Vegetation impact was observed, but to a lesser extent that for the SOC content.
4. Discussion
4.1. SOC Content: Effects of Tillage System and Water Regime
Across the studied commercial fields, no-tillage showed potential for SOC accrual only in the topsoil (0–10 cm), while it remained unchanged or decreased in the subsoil (10–30 cm) compared to conventional tillage (
Figure 3). Clearly, these trends are not factor-fixed because the baseline level of SOC prior to the no-till application is unknown. Nevertheless, our findings c ollaborate with a literature review evidencing that no-tillage promotes SOC gain in the near-surface soil layers (up to 10–20 cm deep) and SOC depletion in subsoil layers compared to conventional tillage [
10,
11]. Such profile stratification of SOC can be explained by the elimination of the mechanical incorporation of post-harvest plant residues into the soil depth. Additionally, it can be attributed to the specific pattern of root distribution within the soil profile under different tillage practices. Specifically, no-till farming increases root biomass at the 0–20 cm depth but reduces it at the 20–30 cm depth compared to plowing, which can be referred to the effect of soil compaction [
41]. The limitation of increasing SOC in the entire soil profile under no-till system raises some skepticism about its potential to mitigate climate change [
10,
12]. Consequently, enhancing the climate-regulating potential of this conservation agriculture practice requires combining it with other management approaches that redistribute SOC throughout the soil profile. For example, incorporating perennial cover grasses into the crop rotations increases the C supply to subsoil horizons through rhizodeposits and mortmass itself [
42]. Another option is to select crop varieties with deeper and thicker root systems that contain high levels of chemical recalcitrant compounds, such as suberin [
43].
In terms of different water regimes, the SOC content in the better-drained soil of the automorphic landscape (Calcic Chernozem) was ~30% higher than that in the periodic waterlogged soil of the lowland (Stagnic Chernozem) (
Figure 3). The GBM model showed that the main drivers of SOC spatial variability were elevation (28.3% relative influence), vegetation distribution (15.1%), and thermal regime (7.3%). This finding partially supports our hypothesis that topography-mediated water regimes play a crucial role in soil C sequestration. This preliminary is due to the effects of the soil physical structure, which defines the porous network and thus the flow and bioavailability of gases (e.g., O
2, CO
2 and N
2O), water, and nutrients [
44]. These factors, in turn, are essential to all chains of C sequestration processes, from forming crop production and organic matter input to its microbial decomposition and C stabilization in the soil. For this reason, perhaps, applying no-till in lowlands further aggravates soil physical conditions and reduces the potential for SOC accrual. This is evidenced by the significant reduction in the microbial-available C pool in no-tilled Stagnic Chernozem compared to tilled one (
Figure 6A). Consequently, the efficiently implementing this conservation agriculture in periodic waterlogged lowlands requires substantial investment to sustainably maintain sufficient soil nutrient levels. For instance, in the humid Lowland Terai region of India (3515 mm of annual rainfall), a combination of no-tillage with crop residue returns (3 t ha
–1 of wheat / rice straw) and biofertilizer inoculation (
Azospirillum spp.,
Azotobacter spp, and phosphate solubilizing bacteria) for 16 years significantly increased the microbial-available C pool and SOC stocks relative to conventional tillage, as well as no-tillage with only mineral fertilization [
45]. It is important to note that all of the studied Chernozems were depleted of available phosphorus (1.6-6.8 mg P kg
–1) and primarily require appropriate treatments to increase its level (
Table A2).
4.2. SOC Quality: РОM to MAOM Ratio and Microbial-Available C Pools
The stable MAOM pool accounted for 87–90% of the total SOC regardless of the soil moisture regimes (
Figure 5). Generally, this parameter exhibited negligible spatial variability, including in relation to different tillage systems. Such uniform MAOM pool can indicate profound depletion of the general SOC stock, primarily due to inadequate soil C inputs through plant residues, as evidenced by a small POM pool. An important functional role of POM in forming organo-mineral associations has been demonstrated by Witzgall et al. [
46] by tracking the decomposition of isotopically labeled litter in soils. The authors showed that POM surfaces are not only constituting hotspots for microbial activity, but also the nucleus of aggregate formation and MAOM buildup. This once more highlights the critical role of soil structure in the long-term SOC accrual and the necessity of developing sustainable approaches to enhance this parameter in agricultural soils.
At the same time, we found that no-till system affected the microbial-available C pool, which can be considered as a prerequisite for soil aggregation and MAOM formation. Previous studies have evidenced that no-till practice significantly increases the abundance of simple carbohydrates, amino sugars, lignin phenols, long-chain aliphatic (≥ C20) and cyclic lipids in the topsoil compared to conventional tillage [
16,
47,
48]. Variety and abundance of water-soluble organic molecules increase the soil capacity to stabilize C through direct sorption to minerals [
49] and improved macro-aggregation and aggregate stability [
50,
51]. In our case, increasing microbial-available C pool under no-tillage relative to conventional tillage was found only in the automorphic landscape with Calcic Chernozem soil (
Figure 6A). At the same time, an inverse trend was revealed at the lowland site with Stagnic Chernozem, seemingly due to deteriorating soil physical properties, as discussed in the previous section. Consequently, the microbial-available C pool can serve as an informative indicator of the early dynamics of SOC stabilization and accrual, thus helping farmers choose the most beneficial management strategy for site-specific sustainable agriculture.
4.3. Study Limitations and Further Prospects
The main challenge in predicting SOC dynamics in farmlands is the high spatial and temporal variability of management practices, including crop rotations, tillage systems, fertilizer application rates and methods, seeding frequency and depth, crop protection systems, machinery used, etc. Furthermore, due to the occasional change in farmland ownership, it is impossible to completely restore this information over time. Therefore, the observed patterns of SOC variability across cultivated Chernozems cannot be attributed to a fixed-factor effect, such as tillage systems. This gap underscores the necessity of systematically and uniformly monitoring all applied agricultural treatments in relation to each spatial (e.g., field) together with continuous tracking of SOC dynamics, as discussed previously by Olson et al. [
52].
Nowadays, the mandatory monitoring system for Russian farmers is being actively developed and includes an annual report on crop-specific harvests, the used agrochemicals (fertilizers and pesticides), machinery, and tillage system. Starting in 2025, these data began to be integrated with the cadastral inventory map system, which provides their spatial linking at the field scale. In this context, our study can serve as a baseline for the further monitoring of SOC stocks and stability across farmlands. Moreover, accurate farm-scale maps of SOC with its constituent pools (i.e., POM and microbial-available C) are highly helpful for farmers’ decision-making in developing effective management strategies for long-term SOC accrual and enhanced total soil quality.
5. Conclusions
The study’s findings suggest that topography-mediated soil water regimes play a significant role in the spatial distribution of topsoil SOC and its microbial-available pool across farmlands in the Chernozems region. Additionally, this abiotic factor affects the effectiveness of no-tillage relative to conventional tillage by altering the microbial-available C pool, which is partly consistent with our hypothesis. We discussed how changes in the soil’s physical structure could be responsible for this by regulating the biogeochemical C cycling in periodic waterlogged agroecosystems. We also highlight the problems of the depleted POM pool under existing long-term farm management, which significantly constrain the prospects for SOC accrual and stabilization of the Chernozem region. Thus, our study enhances our understanding of the spatial distribution of SOC content and quality under real commercial conditions. It can also be used as a baseline for developing a sustainable agriculture strategy in the Chernozem region.
Author Contributions
Conceptualization, S.S., and K.I.; methodology, S.S., K.I., Y.D. and V.S.; formal analysis, S.S., K.I., Y.D., and A.G.; investigation, A.P., A.G., G.F., A.R., E.M., and D.S; data curation, S.S., I.K., and V.S.; writing—original draft preparation, S.S., Y.D., and I.A.; writing—review and editing, S.S., K.I., Y.D., and V.S.; visualization, S.S., and Y.D.; supervision, S.S., K.I. and V.S.; project administration, S.S., and K.I.; funding acquisition, S.S., and K.I. All authors have read and agreed to the published version of the manuscript.
Funding
Analysis of soil organic carbon fractions and paper preparation were funded by the Russian Science Foundation under grant No. 24-76-10079 (
https://rscf.ru/en/project/24-76-10079/). Soil sampling, physical and chemical analyses, and soil prediction modeling and mapping were supported by the state assignment of the Ministry of Science and Higher Education of the Russian Federation No. 125061107005-4.
Data Availability Statement
Detailed data can be obtained by contacting the corresponding author.
Acknowledgments
We are grateful to the farmers in the Rostov and Krasnodar regions who gave us the opportunity to conduct our study in their fields.
Conflicts of Interest
The authors declare no conflicts of interest.
Appendix A
Table A1.
Soil chemical and physical properties along a 1-meter profile of Calcic and Stagnic Chernozems under no-tillage over 11 yrs.
Table A1.
Soil chemical and physical properties along a 1-meter profile of Calcic and Stagnic Chernozems under no-tillage over 11 yrs.
 |
Layer
(cm)
|
pH |
CaCO3
(%)
|
SOC
(%)
|
Clay
(%)
|
Silt
(%)
|
Sand
(%)
|
BD
(g cm–3)
|
| Calcic Chernozem (Rostov site) |
| 0–5 |
8.3 |
5.7 |
3.21 |
19 |
75 |
6 |
1.04 |
| 5–10 |
8.4 |
5.6 |
2.77 |
20 |
76 |
4 |
1.05 |
| 10–20 |
8.5 |
7.4 |
2.56 |
20 |
77 |
3 |
1.23 |
| 20–30 |
8.6 |
9.6 |
2.61 |
18 |
79 |
3 |
1.27 |
| 30–50 |
8.6 |
11.1 |
2.55 |
17 |
79 |
3 |
1.24 |
| 50–70 |
8.7 |
15.0 |
2.26 |
16 |
80 |
3 |
1.40 |
| 70–100 |
8.7 |
15.7 |
2.05 |
17 |
80 |
3 |
1.48 |
 |
Stagnic Chernozem (Krasnodar site) |
| 0–5 |
7.3 |
0.05 |
2.40 |
18 |
73 |
9 |
1.20 |
| 5–10 |
7.1 |
0.05 |
1.95 |
19 |
73 |
8 |
1.23 |
| 10–20 |
7.1 |
0.06 |
1.84 |
19 |
74 |
8 |
1.36 |
| 20–30 |
7.3 |
0.05 |
1.76 |
19 |
74 |
7 |
1.34 |
| 30–50 |
7.4 |
0.06 |
1.66 |
18 |
74 |
8 |
1.34 |
| 50–70 |
7.5 |
0.07 |
1.20 |
18 |
73 |
9 |
1.51 |
| 70–100 |
8.1 |
0.98 |
0.89 |
17 |
73 |
10 |
1.55 |
Table A2.
Chemical and physical properties in the Chernozems’ topsoil (0–10 cm) under conventional tillage (CT) and no-tillage (NT). Mean with standard error for n = 30.
Table A2.
Chemical and physical properties in the Chernozems’ topsoil (0–10 cm) under conventional tillage (CT) and no-tillage (NT). Mean with standard error for n = 30.
| Soil |
Tillage†
|
pH |
SOC:N |
P (mg kg–1) |
K (mg kg–1) |
Calcic
Chernozem |
CT |
7.98 ± 0.17 |
11.0 ± 0.3 |
1.58 ± 0.56 |
293 ± 20 |
| NT11
|
8.02 ± 0.02 |
14.1 ± 0.4 |
1.22 ± 0.22 |
448 ± 20 |
| NT14
|
7.99 ± 0.02 |
11.8 ± 0.1 |
1.56 ± 0.09 |
326 ± 11 |
Stagnic
Chernozem |
CT |
7.05 ± 0.10 |
12.1 ± 0.1 |
6.75 ± 0.70 |
309 ± 18 |
| NT8
|
7.11 ± 0.12 |
12.3 ± 0.2 |
4.67 ± 0.52 |
266 ± 38 |
| NT11
|
7.39 ± 0.10 |
11.8 ± 0.1 |
2.88 ± 0.41 |
285 ± 14 |
Figure A1.
Pearson’ correlation coefficient among soil organic carbon (SOC), its pools (MAOM, mineral-associated organic matter; POM, particulate organic matter; Min_SOC, mineralized pool for 180 days), nutrient content and bulk density (BD) in the topsoil (0–10 cm) under conventional tillage and no-tillage. Significant coefficients are shown in bold italics at P-value ≤0.001 (n = 90).
References
- IUSS Working Group WRB. World Reference Base for Soil Resources 2014: International soil classification system for naming soils and creating legends for soil maps; Schad, P., Huysteen, C., Micheli, E., Eds.; Food and Agriculture Organization: Rome, Italy, 2015. [Google Scholar]
- Liu, X.; Lee Burras, C.; Kravchenko, Y.S.; Duran, A.; Huffman, T.; Morras, H.; Studdert, G.; Zhang, X.; Cruse, R.M.; Yuan, X. Overview of Mollisols in the world: distribution, land use and management. Can. J. Soil. Sci. 2012, 92, 383–402. [Google Scholar] [CrossRef]
- Boincean, B.; Dent, D. Farming the Black Earth: Sustainable and climate-smart management of Chernozem soils; Springer International Publishing: Cham, Switzerland, 2019. [Google Scholar]
- Xu, X.; Pei, J.; Xu, Y.; Wang, J. Soil organic carbon depletion in global Mollisols regions and restoration by management practices: a review. J Soils Sediments 2020, 20, 1173–1181. [Google Scholar] [CrossRef]
- Just, C.; Armbruster, M.; Barkusky, D.; Baumecker, M.; Diepolder, M.; Döring, T.F.; Heigl, L; Honermeier, B.; Jate, M.; Merbach, I.; Rusch, C.; Schubert, D.; Schulz, F.; Schweitzer, K.; Seidel, S.; Sommer, M.; Spiegel, H.; Thumm, U.; Urbatzka, P.; Zimmer, J.; Kögel-Knabner, I.; Wiesmeier, M. Soil organic carbon sequestration in agricultural long-term field experiments as derived from particulate and mineral-associated organic matter. Geoderma 2023, 434, 116472. [Google Scholar] [CrossRef]
- Angst, G.; Mueller, K.E.; Castellano, M.J.; Vogel, C.; Wiesmeier, M.; Mueller, C.W. Unlocking complex soil systems as carbon sinks: multi-pool management as the key. Nat Commun 2023, 14, 2967. [Google Scholar] [CrossRef]
- Lützow, M.v.; Kögel-Knabner, I.; Ekschmitt, K.; Matzner, E.; Guggenberger, G.; Marschner, B.; Flessa, H. Stabilization of organic matter in temperate soils: mechanisms and their relevance under different soil conditions – a review. Eur. J. Soil Sci. 2006, 57, 426–445. [Google Scholar] [CrossRef]
- Sollins, P.; Swanston, C.; Kramer, M. Stabilization and destabilization of soil organic matter—a new focus. Biogeochemistry 2007, 85, 1–7. [Google Scholar] [CrossRef]
- Lavallee, J.M.; Soong, J.L.; Cotrufo, M.F. Conceptualizing soil organic matter into particulate and mineral-associated forms to address global change in the 21st century. Glob Chang Biol 2020, 26, 261–273. [Google Scholar] [CrossRef] [PubMed]
- Powlson, D.S.; Stirling, C.M.; Jat, M.L.; Gerard, B.G.; Palm, C.A.; Sanchez, P.A.; Cassman, K.G. Limited potential of no-till agriculture for climate change mitigation. Nature Clim Change 2014, 4, 678–683. [Google Scholar] [CrossRef]
- Du, Z.; Angers, D.A.; Ren, T.; Zhang, Q.; Li, G. The Effect of no-till on organic C storage in Chinese soils should not be overemphasized: a meta-analysis. Agric. Ecosyst. Environ. 2017, 236, 1–11. [Google Scholar] [CrossRef]
- Ogle, S.M.; Alsaker, C.; Baldock, J.; Bernoux, M.; Breidt, F.J.; McConkey, B.; Regina, K.; Vazquez-Amabile, G.G. Climate and soil characteristics determine where no-till management can store carbon in soils and mitigate greenhouse gas emissions. Sci Rep 2019, 9, 11665. [Google Scholar] [CrossRef]
- Lal, R.; Reicosky, D.C.; Hanson, J.D. Evolution of the plow over 10,000 years and the rationale for no-till farming. Soil Till Res. 2007, 93, 1–12. [Google Scholar] [CrossRef]
- Li, Y.; Chang, S.X.; Tian, L.; Zhang, Q. Conservation agriculture practices increase soil microbial biomass carbon and nitrogen in agricultural soils: a global meta-analysis. Soil Biol. Biochem. 2018, 121, 50–58. [Google Scholar] [CrossRef]
- Li, Y.; Song, D.; Liang, S.; Dang, P.; Qin, X.; Liao, Y.; Siddique, K.H.M. Effect of no-tillage on soil bacterial and fungal community diversity: a meta-analysis. Soil Till Res. 2020, 204, 104721. [Google Scholar] [CrossRef]
- Ma, L.; Wang, X.; Fang, Y.; Vancov, T.; Jin, X.; Gao, Q.; Dong, W.; Du, Z. No-tillage farming for two decades increases plant- and microbial-biomolecules in the topsoil rather than soil profile in temperate agroecosystem. Soil Till Res. 2024, 241, 106108. [Google Scholar] [CrossRef]
- Briedis, C.; De Moraes Sá, J.C.; Lal, R.; Tivet, F.; Franchini, J.C.; De Oliveira Ferreira, A.; Da Cruz Hartman, D.; Schimiguel, R.; Bressan, P.T.; Inagaki, T.M.; et al. How does no-till deliver carbon stabilization and saturation in highly weathered soils? CATENA 2018, 163, 13–23. [Google Scholar] [CrossRef]
- Blanco-Moure, N.; Gracia, R.; Bielsa, A.C.; López, M.V. Long-term no-tillage effects on particulate and mineral-associated soil organic matter under rainfed Mediterranean conditions. Soil Use Manag. 2013, 29, 250–259. [Google Scholar] [CrossRef]
- Conceição, P.C.; Dieckow, J.; Bayer, C. Combined role of no-tillage and cropping systems in soil carbon stocks and stabilization. Soil Till Res. 2013, 129, 40–47. [Google Scholar] [CrossRef]
- Fabrizzi, K.P.; Morón, A.; García, F.O. Soil carbon and nitrogen organic fractions in degraded vs. non-degraded Mollisols in Argentina. Soil Science Soc of Amer J 2003, 67, 1831–1841. [Google Scholar] [CrossRef]
- Malhi, S.S.; Nyborg, M.; Goddard, T.; Puurveen, D. Long-term tillage, straw management, and nitrogen fertilization effects on organic matter and mineralizable carbon and nitrogen in a Black Chernozem soil. Commun Soil Sci Plant Anal 2012, 43(20), 2679–2690. [Google Scholar] [CrossRef]
- Iheshiulo, E.M.-A. Soil organic matter and aggregate stability dynamics under major no-till crop rotations on the Canadian prairies. Geoderma 2024, 442, 116777. [Google Scholar] [CrossRef]
- Leuthold, S.J.; Lavallee, J.M.; Basso, B.; Brinton, W.F.; Cotrufo, M.F. Shifts in controls and abundance of particulate and mineral-associated organic matter fractions among subfield yield stability zones. Soil 2024, 10(1), 307–319. [Google Scholar] [CrossRef]
- Nunes, M.R.; Denardin, J.E.; Pauletto, E.A.; Faganello, A.; Pinto, L.F.S. Mitigation of clayey soil com-paction man-aged under no-tillage. Soil Till Res. 148, 119–126. [CrossRef]
- Khitrov, N.; Smirnova, M.; Lozbenev, N.; Levchenko, E.; Gribov, V.; Kozlov, D.; Rukhovich, D.; Kalinina, N.; Koroleva, P. Soil cover patterns in the forest-steppe and steppe zones of the east european plain. Soil Sci. Annu. 2019, 70, 198–210. [Google Scholar] [CrossRef]
- Minasny, B.; McBratney, A.B. A Conditioned Latin Hypercube method for sampling in the presence of ancillary information. Comput. Geosci. 2006, 32, 1378–1388. [Google Scholar] [CrossRef]
- Farr, T.G.; Rosen, P.A.; Caro, E.; Crippen, R.; Duren, R.; Hensley, S.; Kobrick, M.; Paller, M.; Rodriguez, E.; Roth, L.; et al. The Shuttle Radar Topography Mission. Rev. Geophys. 2007, 45, 2005RG000183. [Google Scholar] [CrossRef]
- Beven, K.J.; Kirkby, M.J. A Physically based, variable contributing area model of basin hydrology. Hydrological Sciences Bulletin 1979, 24, 43–69. [Google Scholar] [CrossRef]
- R: A Language and Environment for Statistical Computing. R Foundation for Statistical Computing. 2024. Available online: https://cran.r-project.org/ (accessed on 10 August 2025).
- Roudier, P.; Beaudette, D.E.; Hewitt, A.E. A conditioned Latin hypercube sampling algorithm incorporating operational constraints. In Digital Soil Assessments and Beyond. Proceedings of the 5th Global Workshop on Digital Soil Mapping, Sydney, Australia, 10-13 April 2012. [Google Scholar]
- Blagodatskiy, S.A.; Blagodatskaya, Y.V.; Gorbenko, A.Yu.; Panikov, N.S. A rehydration method of determining the biomass of microorganisms in soil. Soviet Soil Science 1987, 19, 119–126. [Google Scholar]
- Semenov, V.M.; Kravchenko, I.K.; Ivannikova, L.A.; Kuznetsova, T.V.; Semenova, N.A.; Gispert, M.; Pardini, J. Experimental determination of the active organic matter content in some soils of natural and agricultural ecosystems. Eurasian Soil Sc. 2006, 39, 251–260. [Google Scholar] [CrossRef]
- Fox, J.; Weisberg, S. An R Companion to Applied Regression, third ed.; AGE Publications Inc: Thousand Oaks CA, 2019. [Google Scholar]
- Signorell, A. DescTools: Tools for Descriptive Statistics. R package version 0.99.60.24, 2025. Available online: https://github.com/andrisignorell/desctools (accessed on 15 September 2025).
- Wickham, H. Ggplot2: Elegant Graphics for Data Analysis., 2nd ed.; Springer International Publishing.: Cham, 2016. [Google Scholar]
- Friedman, J.H. Greedy function approximation: a gradient boosting machine. Ann. Statist. 2001, 29, 1189–1232. [Google Scholar] [CrossRef]
- Xu, H. Modification of normalised difference water index (NDWI) to enhance open water features in remotely sensed imagery. Int. J. Remote Sens. 2006, 27, 3025–3033. [Google Scholar] [CrossRef]
- Ermida, S.L.; Soares, P.; Mantas, V.; Göttsche, F.-M.; Trigo, I.F. Google Earth Engine open-source code for land surface temperature estimation from the Landsat series. Remote Sens. 2020, 12, 1471. [Google Scholar] [CrossRef]
- Gorelick, N.; Hancher, M.; Dixon, M.; Ilyushchenko, S.; Thau, D.; Moore, R. Google Earth Engine: planetary-scale geospatial analysis for everyone. Remote Sens. Environ. 2017, 202, 18–27. [Google Scholar] [CrossRef]
- Kuhn, M. Building predictive models in R using the Caret package. J. Stat. Soft. 2008, 28, 1–26. [Google Scholar] [CrossRef]
- Ruis, S.J.; Blanco-Canqui, H. How does no-till affect soil-profile distribution of roots? Can. J. Soil. Sci. 2024, 104, 350–361. [Google Scholar] [CrossRef]
- Pausch, J.; Kuzyakov, Y. Carbon input by roots into the soil: quantification of rhizodeposition from root to ecosystem scale. Glob Chang Biol 2018, 24, 1–12. [Google Scholar] [CrossRef] [PubMed]
- Lorenz, K.; Lal, R. The depth distribution of soil organic carbon in relation to land use and management and the potential of carbon sequestration in subsoil horizons. Adv. Agron. 2005, 88, 35–66. [Google Scholar] [CrossRef]
- Hartmann, M.; Six, J. Soil structure and microbiome functions in agroecosystems. Nat Rev Earth Environ 2023, 4, 4–18. [Google Scholar] [CrossRef]
- Padbhushan, R.; Sinha, A.K.; Kumar, U.; Bhattacharya, P.M.; Poddar, P.; Kumar, A.; Singh, Y.K.; Kumar, R.; Jha, A.K.; Parmar, B.; et al. Soil carbon sequestration and yield sustainability in the lowland Terai Region of India. J Soil Sci Plant Nutr 2025, 25, 6820–6839. [Google Scholar] [CrossRef]
- Witzgall, K.; Vidal, A.; Schubert, D.I.; Höschen, C.; Schweizer, S.A.; Buegger, F.; Pouteau, V.; Chenu, C.; Mueller, C.W. Particulate organic matter as a functional soil component for persistent soil organic carbon. Nat Commun 2021, 12, 4115. [Google Scholar] [CrossRef]
- Veloso, M.G.; Dick, D.P.; Costa, J.B.D.; Bayer, C. Cropping systems including legume cover crops favour mineral–organic associations enriched with microbial metabolites in no-till soil. Soil Research 2019, 57, 851–858. [Google Scholar] [CrossRef]
- Veloso, M.G.; Angers, D.A.; Chantigny, M.H.; Bayer, C. Mineral–organic associations are enriched in both microbial metabolites and plant residues in a subtropical soil profile under no-tillage and legume cover cropping. Soil Research 2022, 60, 590–600. [Google Scholar] [CrossRef]
- Angst, G.; Mueller, K.E.; Nierop, K.G.J.; Simpson, M.J. Plant- or microbial-derived? A review on the molecular composition of stabilized soil organic matter. Soil Biol. Biochem. 2021, 156, 108189. [Google Scholar] [CrossRef]
- Kan, Z.; Liu, W.; Liu, W.; Lal, R.; Dang, Y.P.; Zhao, X.; Zhang, H. Mechanisms of soil organic carbon stability and its response to no-till: a global synthesis and perspective. Glob Chang Biol 2022, 28, 693–710. [Google Scholar] [CrossRef]
- Sae-Tun, O.; Bodner, G.; Rosinger, C.; Zechmeister-Boltenstern, S.; Mentler, A.; Keiblinger, K. Fungal biomass and microbial necromass facilitate soil carbon sequestration and aggregate stability under different soil tillage intensities. Appl. Soil Ecol. 2022, 179, 104599. [Google Scholar] [CrossRef]
- Olson, K.R.; Al-Kaisi, M.M.; Lal, R.; Lowery, B. Experimental consideration, treatments, and methods in determining soil organic carbon sequestration rates. Soil Sci. Soc. Am. J. 2014, 78, 348–360. [Google Scholar] [CrossRef]
Figure 1.
Location of sampling points across the studied fields at Rostov (left) and Krasnodar (right) sites in southwest Russia.
Figure 1.
Location of sampling points across the studied fields at Rostov (left) and Krasnodar (right) sites in southwest Russia.
Figure 2.
Soil bulk density in 0–10 and 10–30 cm layers under conventional tillage (CT) and no-tillage (NT). *P-value ≤0.05, **0.01, ***0.001, ns – not significant for the difference relative to CT for each soil layer separately (Dunnett’s test, n = 30).
Figure 2.
Soil bulk density in 0–10 and 10–30 cm layers under conventional tillage (CT) and no-tillage (NT). *P-value ≤0.05, **0.01, ***0.001, ns – not significant for the difference relative to CT for each soil layer separately (Dunnett’s test, n = 30).
Figure 3.
Soil organic carbon content (SOC) in 0–10 and 10–30 cm layers under conventional tillage (CT) and no-tillage (NT). **P-value ≤0.01, ***0.001, ns – not significant for the difference relative to CT for each soil layer separately (Dunnett’s test, n = 30).
Figure 3.
Soil organic carbon content (SOC) in 0–10 and 10–30 cm layers under conventional tillage (CT) and no-tillage (NT). **P-value ≤0.01, ***0.001, ns – not significant for the difference relative to CT for each soil layer separately (Dunnett’s test, n = 30).
Figure 4.
Soil organic carbon stocks (SOC) in 0–10 and 0–30 cm layers under conventional tillage (CT) and no-tillage (NT). *P-value ≤0.05, ***0.001, ns – not significant for the difference relative to CT (Dunnett’s test, n = 30).
Figure 4.
Soil organic carbon stocks (SOC) in 0–10 and 0–30 cm layers under conventional tillage (CT) and no-tillage (NT). *P-value ≤0.05, ***0.001, ns – not significant for the difference relative to CT (Dunnett’s test, n = 30).
Figure 5.
Soil carbon distribution between particulate organic matter (POM) and mineral-associated organic matter (MAOM) pools in Chernozems’ topsoil (0–10 cm) under conventional tillage (CT) and no-tillage (NT). Bar plot shows mean value with standard error; *P-value ≤0.05 for the difference relative to CT (Dunnett’s test, n = 30).
Figure 6.
Cumulative soil organic carbon (SOC) mineralization over a six-month incubation period (A) and its percentage from initial soil organic carbon content (B) for Chernozems’ topsoil (0–10 cm) under conventional tillage (CT) and no-tillage (NT). Dot shows mean value with standard error; *P-value ≤0.05, ***0.001, ns – not significant for the difference relative to CT (Dunnett’s test, n = 30).
Figure 7.
Fitted versus observed values of soil organic carbon content (SOC) (left) and its mineralized pool for 180 days (right) for Chernozems’ topsoil (0–10 cm) under conventional tillage and no-tillage across studied farm areas.
Figure 7.
Fitted versus observed values of soil organic carbon content (SOC) (left) and its mineralized pool for 180 days (right) for Chernozems’ topsoil (0–10 cm) under conventional tillage and no-tillage across studied farm areas.
Figure 8.
Spatial distribution of predicted soil organic carbon content (SOC) (on top) and its mineralized pool for 180 days (bottom) for Chernozems’ topsoil (0–10 cm) under conventional tillage and no-tillage across studied farm areas.
Figure 8.
Spatial distribution of predicted soil organic carbon content (SOC) (on top) and its mineralized pool for 180 days (bottom) for Chernozems’ topsoil (0–10 cm) under conventional tillage and no-tillage across studied farm areas.
Table 1.
Characteristics of studied fields with conventional tillage (CT) and no-tillage (NT) over 8–14 years. Notes: FA, field area; Elev., elevation.
Table 1.
Characteristics of studied fields with conventional tillage (CT) and no-tillage (NT) over 8–14 years. Notes: FA, field area; Elev., elevation.
| Site (Soil) |
Tillage†
|
FA (ha) |
Elev (m a.s.l.) |
Slope (°) |
Crops |
| 2022 |
2023 |
Rostov
(Calcic Chernozem) |
CT |
33 |
68 ± 6 |
1.9 ± 0.9 |
Sunflower |
Wheat |
| NT11
|
55 |
67 ± 3 |
1.8 ± 0.9 |
Sunflower |
Wheat |
| NT14
|
35 |
68 ± 5 |
1.7 ± 0.7 |
Sunflower |
Wheat |
Krasnodar
(Stagnic Chernozem) |
CT |
45 |
12 ± 3 |
1.5 ± 0.9 |
Wheat |
Wheat |
| NT8
|
74 |
11 ± 3 |
1.2 ± 0.8 |
Wheat |
Corn |
| NT11
|
49 |
8 ± 2 |
1.4 ± 0.8 |
Corn |
Wheat |
|
Disclaimer/Publisher’s Note: The statements, opinions and data contained in all publications are solely those of the individual author(s) and contributor(s) and not of MDPI and/or the editor(s). MDPI and/or the editor(s) disclaim responsibility for any injury to people or property resulting from any ideas, methods, instructions or products referred to in the content. |
© 2025 by the authors. Licensee MDPI, Basel, Switzerland. This article is an open access article distributed under the terms and conditions of the Creative Commons Attribution (CC BY) license (http://creativecommons.org/licenses/by/4.0/).