Submitted:
16 December 2025
Posted:
18 December 2025
You are already at the latest version
Abstract
Molecular genotyping is a key factor for plant breeding programming and Plant Variety Protection. However, its potential still remains to be elucidated when considering ornamental plants like Petunia × hybrida. In this study, a Petunia breeding clone collection, including sister line groups, was genotyped through double digest Restriction-site Associated DNA sequencing (ddRADseq), and its genetic diversity and structure were studied. In addition to estimate the high genetic similarity observed among sister lines, this approach allowed the unique discrimination of each clone too. Molecular results agreed with genealogy data, assessing genotyping effectiveness. In addition, the minimal number of variants able to correctly genotype the population was investigated. The variant number could be reduced to a hundred with minor adjustments in genotyping results. Moreover, analysis of the chromosomal distribution of variants revealed a predominant accumulation in distal regions. Eventually, genetic analyses were repeated considering only variants located in coding sequences and results were in agreement with what previously observed, disclosing the potential of the expressed regions for genotyping purposes. Our findings encourage the adoption of high-throughput and cost-effective sequencing techniques for plant genotyping, to enhance the technological advancement of breeding programs, in particular for ornamental species.
Keywords:
ornamentals
; plant breeding
; genotyping‐by‐sequencing
; genetic diversity
; SNP core set
1. Introduction
Petunia (Petunia × hybrida hort. ex E. Vilm.; synonym: Petunia × atkinsiana (Sweet) D. Don ex W. H. Baxter) is an annual herb belonging to the Solanaceae family, originated in South America [1] and well known worldwide for its ornamental use. A wholesale value of almost $ 160 million was reported in the US in 2020 for petunia ornamental varieties [2,3]. Commercial lines are derived from interspecific hybrids artificially obtained in the eighteenth century [4,5] between P. axillaris (Lamarck) Britton, Sterns and Poggemburg, and one or more species belonging the clade of P. integrifolia (Hooker) Schinz and Thellung [6,7]. Natural hybrids between the two species were never observed, in part due to different pollination syndromes. In particular, P. axillaris is pollinated by hawk moths, while P. integrifolia by bees [8,9]. Nevertheless, hybrids derived from artificial crosses can produce fertile progenies and commercial lines comprehend both seed-propagated F1 hybrids and cutting-propagated clonal lines [1]. Although varieties are more often diploid, tetraploids have been observed and selected in breeding programs [10,11]. Petunia (2n = 2x = 14) is a facultative allogamous species, in which gametophytic self-incompatibility [12,13] and cytoplasmic male sterility [14,15,16] were extensively studied. It is considered a model plant [17,18], especially for the study of flower development and biochemistry [4], as well as for tissue culture practices [1]. In addition, the application of genetic engineering techniques has led to one of the first and well-known cases of genetically modified petunia, such as the orange-flowered A1-DFR lines [19]. It is also worth noting that the RNA interference mechanism was discovered for the first time in this species [20,21]. Finally, molecular resources developed for petunia comprehend high-density linkage maps with different marker types [22,23,24] and the draft genome assembly of the two of its main species P. axillaris and P. integrifolia [25]. Recently, a chromosome-scale genome assembly and annotation of P. × hybrida was developed by combining short- and long-read sequencing, optical mapping and Hi-C technology [26].
In the last decades, breeding goals for petunia have mainly included aesthetic-sensorial aspects, particularly in relation to flower morphology and phenology [2,27,28]. More recently, breeding has also dealt with new emerging needs, such as ecosystem service provision, adaptability and sustainability [29,30]. The evaluation of these traits through the exclusive use of morphological and phenological measurements is often impossible. Nevertheless, the official protocols for variety registration aimed at assessing distinctness, uniformity and stability (DUS), such as those of the European Community Plant Variety Office (CPVO) and International Union for the Protection of New Varieties of Plants (UPOV) [31,32], are still exclusively based on this type of descriptors. In petunia, 34 and 32 descriptors, including plant growth habit, leaf shape and flower density, are provided respectively by EU and US authorities for DUS tests [33,34]. Since official registration is necessary to achieve Plant Variety Protection (PVP) and to guarantee Plant Breeders' Rights (PBRs) [35], incorporating molecular data into the registered variety profiles, in conjunction with specific phenotypic measurements, could provide significant benefits. For example, a clear enhancement in a sustainability-related trait (e.g., tolerance to low nutrient levels or reduced phytosanitary inputs) assessed through appropriate phenotypic evaluations (e.g., value for cultivation and use (VCU) tests), may not be reflected by visible morphological changes. Hence, traditional DUS tests may be insufficient for a successful evaluation. In this case, DUS tests could be carried out coupling phenotypic measurements and genetic diversity analyses based on variety molecular profiles (value molecular DUS (vmDUS)) [36]. However, the possibility to exploit molecular genotyping for official variety registration is still limited to few specific functional markers, or it is used only to facilitate traditional DUS test procedures [37]. Molecular genotyping can be also useful for directly helping PVP, thus facilitating the identity assessment of plant materials of unknown origin and the identification of commercial frauds [35], as well as for Marker-Assisted Breeding (MAB) and Selection (MAS) [38,39,40].
Double digest Restriction-site Associated DNA sequencing (ddRADseq) is a Reduced Representation Sequencing (RRS) technology exploiting the gDNA digestion with two restriction enzymes, in order to reduce the fraction of the genome to be sequenced [41]. ddRADseq is reported as an approach able to couple reliable genotyping results to relatively low cost and time consumption. Therefore, it can be particularly useful for agricultural species lacking economic convenience in performing deeper and hence more expensive analyses [42,43,44], like the majority of ornamental plants. The technique was successfully exploited in several plant species for different purposes, such as structure evaluation of wild populations [45,46,47], germplasm conservation [48,49,50], Quantitative Trait Locus (QTL) identification [51,52], Genome-Wide Association Study (GWAS) [53], phylogenesis [54], Marker-Assisted Selection (MAS) and Marker-Assisted Breeding (MAB) [38,39,40]. The possibility to further reduce the thousands of variants generated by ddRAD down to an informative core (core set) may additionally simplify future analyses. In particular, SNP core sets may be used for the development of arrays or target-specific PCR (Genotyping By Target Sequencing – GBTS) [55,56,57,58,59]. Besides reducing costs and time of the procedures, this approach can lead to an easier comparison of data from different populations and/or years and allow targeting of specific regions of interest for further functional studies [60,61]. However, the identification of a SNP core set for target-specific assay development can be challenging, especially when dealing with breeding populations characterized by highly related lines with reduced genetic and phenotypic variability.
In this study, a genotyping analysis through a ddRADseq approach was performed in a petunia breeding population of clonal lines. The population included sister line groups, i.e. clones sharing at least one of the two parental lines. The goal was to assess the potential of this genotyping technique in uniquely discriminating each sample and determining the genetic relationships among the accessions considered. The suitability of ddRADseq for variety development through MAB, for variety registration and for protection of already registered varieties was evaluated too. In addition, we determined how much and how the SNP number could be reduced to reach an informative subset of markers (i.e. SNP core set), without altering the clustering of samples. Variants exclusively present in Coding DNA Sequences (CDSs) were selected to assess the possibility of exploiting expressed regions for the genotyping analysis.
2. Materials and Methods
2.1. Plant Materials
Leaf samples from 36 petunia clonal lines were granted by Gruppo Padana S.S. (Paese, TV, Italy), a nursery company specialized in the production, selection and collection of young plants from seeds and cuttings. The analyzed accessions included 36 breeding lines (BLs), including 4 benchmarks (BMs), i.e. already developed varieties exploited to evaluate the distinctness of the former. Genomic DNA (gDNA) was extracted from 100 mg of leaf tissue through DNeasy Plant mini kit (Qiagen, Valencia, CA, USA), following manufacturer instructions. Genomic DNA quality and concentration were assessed using NanoDrop 2000c UV-Vis spectrophotometer (Thermo Fisher Scientific, Waltham, MA, USA) and agarose gel electrophoresis with 1% agarose/ 1× TAE gel and 1× SybrSafe DNA stain (Life Technologies, Carlsbad, CA, USA).
2.2. ddRADseq Library Preparation and Sequencing
Double digestion Restriction-site Associated DNA sequencing (ddRADseq) libraries were produced following the protocol developed by Abed et al. [62], with some modifications. In detail, extracted gDNA was normalized to 20 ng/µl and a total of 200 ng per sample was used. PstI and MspI (Thermo Fisher Scientific) restriction enzymes were used, with 1µl of each per reaction, for DNA digestion at 37°C for 2 h, following the producer protocol. Adapter ligation was done in 50µl of reaction including 30µl of digested DNA, 1µl of T4 DNA ligase, 5µl of 10× T4 ligation buffer (New England BioLabs, Ipswich, MA, USA), 5µl of barcode adapters (0.1µM) and common adapters (10µM). Ligation was carried out with an incubation at room temperature for 2h, followed by 20 min at 65°C. Ligated DNA samples were grouped into two pools, each including 18 samples, and purified through QIAquick PCR and Gel Cleanup Kit (Qiagen) for the elimination of impurities, non-ligated adapters, small fragments and dimers. Size selection from 100 bp to 600 bp was performed with the CleanNGS magnetic beads (CleanNA, Waddinxveen, The Netherlands). Amplification of the obtained libraries was done with Platinum SuperFi PCR Master MIX (Thermo Fisher Scientific), following the enrichment PCR protocol described by Abed et al. [62]. Amplified libraries were subjected to another step of purification with CleanNGS magnetic beads. Subsequently, they were quantified using the TapeStation System (Agilent Technologies, Santa Clara, CA, USA) with High Sensitivity D1000 DNA ScreenTape assays (Agilent Technologies) and diluted to 200 pM for the Ion Torrent sequencing. Libraries were loaded into Ion Chips 550 (Thermo Fisher Scientific) through the Ion Chef (Thermo Fisher Scientific) automated machine. Single-end sequencing was performed in two runs, one per pool, the Ion GeneStudio S5 Plus System (Thermo Fisher Scientific) setting 200 bp of read length and 500 flows per run.
2.3. ddRADseq Data Processing
Raw reads were quality-checked filtering out those with a Phred Quality score lower than 20, and then demultiplexed according to the adopted barcode recognition motif, through the Torrent Suite platform (Thermo Fisher Scientific) following the native implemented pipeline. After these steps, reads were mapped on the reference P. × hybrida v.01 genome assembly retrieved from the NCBI database (GCA_046563445.1) [26]. Mapping was performed exploiting MEM algorithm of Burrows-Wheeler Aligner (BWA) v. 0.7.12 [63], followed by data conversion into BAM files through SAMtools and BCFtools v.1.13 software [64]. For the variant calling the gstacks and populations commands of Stacks v2.61 software [65] were used. gstacks was launched exploiting the ‘marukihigh’ model, with both a SNP discovery (--var-alpha) and a genotype call (--gt-alpha) alpha thresholds of 0.10, while populations was run in order to keep loci present in at least 30% of individuals in a subpopulation (-r 0.30) and 65% of individuals across subpopulations (-R 0.65). Obtained SNPs were filtered through the poppr v2.9.6 package [66] for RStudio software (Posit, Boston, USA), in order to retain only loci present in all samples and with a minimal Minor Allele Frequency (MAF) of 0.1. The resulting SNPs composed the initial dataset for the genetic analyses.
2.4. Genetic Diversity, Structure and Statistic Analyses
All analyses and graphic processing were carried out through RStudio, unless specified otherwise. Genetic Diversity (GD) matrixes were produced through the Nei’s coefficient [67] considering all pairwise comparisons among sample SNP profiles and were made through poppr package’s nei.dist function. A Kinship-based INference for Genome-wide association studies (KING) matrix based on pairwise comparisons was calculated with the KING-robust method exploiting the PLINK2 [68] --make-king function [69]. 0.4 was chosen as a minimal threshold to hypothesize the same clone membership for a pair. The Unweighted Pair Group Method with Arithmetic Mean (UPGMA) dendrograms for sample clustering were created based on Nei’s coefficient with the aboot function from the poppr package, considering 1000 bootstrap replicates. Clustering visualization was carried out through dendrograms created with plot.phylo function from the ape package [70]. Principal Component Analysis (PCA) based on the GD analysis was performed using the gl.pcoa function from the dartR package [71] Structure v.2.2 [72] software was used for Bayesian clustering to infer the sample genetic structure. The following parameters were set: founding groups ranging from 1 to 10, 10 replicate simulations per each K, burn-in of 20,000, final run of 100,000 Markov Chain Monte Carlo (MCMC) steps. The K values characterized by the highest likelihood were selected using Structure Harvester software [73]. Calculated genetic statistics included: observed (Ho), expected (Hs) and overall (Ht) Heterozygosity; inbreeding coefficient within subpopulations (Fis) and within the total population (Fit); subpopulation fixation index (Fst); gene flow (Nm); average number of observed (na) and expected (ne) alleles per locus; Private Alleles (PA) and Polymorphic Loci (PL) percentage, average locus Polymorphic Information Content (AvgPIC) and MAF. Statistics were measured either with hierfstat package [74] basic.stat function, dartR package loc.metrics function, or with a manually developed R script. Analysis of Molecular Variance (AMOVA) between and within subpopulations was done using the ade4 method with the poppr.amova function and the significance of results was validated through a Monte-Carlo test considering 999 permutations.
2.5. SNP Subset Selection for Core Set and Location in CDSs
Further filtering of the initial dataset for the SNP core set identification was done by setting alternative combinations of MAF, AvgPIC and Hs. The filtering continued till the obtained dataset led to a BL clustering consistently different from the one obtained using the entire SNP set. In parallel, Coding DNA Sequences (CDSs) were retrieved from the reference genome annotation and were intersected to the initial SNP dataset using the bedtools intersect command of Bedtools v.2.30.0 software [73], allowing to retain and use variants exclusively present in the coding sequences for clustering analyses. To visually represent them, a map was created using the R package CMplot [74].
3. Results
3.1. Genetic Diversity and Structure Analysis
A ddRADSeq analysis was performed to genotype 36 petunia BLs, comprehending four sister line groups, and 4 benchmarks (BMs). After quality filtering and mapping, more than 80 M reads with an average of 2.2 M reads per sample were obtained. This value corresponded to the 85.7% of the 12.3 Gb sequenced in total. The mean demultiplexed and trimmed read length resulted in 173 bp (Table 1; Supplementary Table S1).
Variant calling resulted in the identification of 42,236 SNPs located in a total of 15,655 loci. SNP filtering allowed the creation of a final dataset of 4,349 variant sites in the 36 analyzed samples.
A GD analysis among samples through the Nei’s coefficient resulted in no pairwise comparison with complete genetic identity, and unique molecular profiles were produced for all the considered BLs. GD among samples ranged from 0.001 (PeHy-BL3-06 vs. PeHy-BL3-08) to 0.51 (PeHy-BL3-09 vs. PeHy-BM03), with an average of 0.23 ± 0.11 (Supplementary Table S2). Considering sister line groups as a whole, the lowest GD value, 0.07, was found comparing PeHy-BL1 and PeHy-BL2 subpopulations, while the highest, 0.29, was observed in the comparison between PeHy-BL2 and PeHy-BL3 (Table 2).
The kinship matrix created with the KING-robust method led to an average value of 0.46 with a SD of 0.52. Three pairwise comparisons exceeded the 0.4 value, used as a threshold for the identifying of monozygotic twins or individuals belonging to the same clone [69,75]: PeHy-BL3-01 vs. PeHy-BL3-07; PeHy-BL3-06 vs. PeHy-BL3-08; PeHy-BL4-03 vs. PeHy-BL4-12 (Supplementary Table S3).
In the UPGMA dendrogram based on the GD analysis, three principal branches were observed: one grouping exclusively PeHy-BL3 lines, a second with PeHy-BL4 lines, and the last comprehending PeHy-BL1, PeHy-BL2 and the four BMs. All bootstrap values at the bases of the branches reached the maximum value (100). Within the last cluster, PeHy-BM3 was highly separated from the rest of the group, while a branch grouped together the other three BMs and two further branches hosted respectively PeHy-BL1 and PeHy-BL2 lines. All the relative nodes were characterized by very high bootstrap values (Figure 1A).
The genetic structure analysis showed the most likely K value, namely the most probable number of common ancestors, to be K=3 (Delta K = 10,407.3), followed by K=2 (Delta K = 3,068.5) (Supplementary Figure S1). In both cases, each BL was predominantly associated with a specific ancestral population, with the exception of PeHy-BL3-04 and PeHy-BL3-02, which resulted admixed. PeHy-BM3 and the PeHy-BL4-07 – PeHy-BL4-11 group were also found to be admixed, but only for one of the two K values (Figure 1B). When assuming K=2, PeHy-BL3 was the only group assigned to one of the two inferred ancestral populations, while all other BLs and the four BMs exhibited a shared ancestry. For K=3, in addition to the separate clustering of the PeHy-BL3 group, a further division was observed between the PeHy-BL4 group and the remaining lines (namely PeHy-BL1, PeHy-BL2, and the four benchmark populations) (Figure 1B). Results were in agreement with what was observed with the UPGMA clustering, and therefore with the genealogy data. The PCA analysis based on GD confirmed the findings observed in the Structure analysis and the UPGMA dendrogram. The first two components alone explained 50.3% of the total variability. PeHy-BL3 and PeHy-BL4 clustered apart, while the two other sister line groups and the benchmarks fell into the same group and were found to be poorly distinguishable (Figure 2).
3.2. Genetic Statistics and AMOVA
The sample pool was studied considering several genetic parameters. Average Ho per BL resulted in 26.0 ± 8.5%, with 1.26 na and 1.15 ne. The highest Ho values considering sister line groups were observed for PeHy-BL4 lines (33.6 ± 6.3%), while the lowest values were scored for PeHy-BL1 lines (19.1 ± 3.4 %) and PeHy-BM4 (16.3%). Average Fis was negative and comprehended between -0.2 and -0.3, underlining an overall moderate heterozygosity excess for BLs in relation to the expected for the respective subpopulations (Table 3; Supplementary Table S2).
Fst ranged from 0.22 to 0.50, suggesting a high genetic fixation for sister line groups (Table 2). As a result of these two factors, a slightly positive inbreeding coefficient for BLs in comparison to the expected considering the entire plant collection was observed (Fit: 0.02), in addition to a limited gene flow (Nm: 0.05). The percentage of PA per sample, relative to the total number of PA in the population ranged from 0.4% for PeHy-BL4-12 to 20.1% for PeHyBM3. The other three BM lines also exhibited percentages of private alleles considerably higher than their BL counterparts, ranging from 7.33% to 19.49% (Supplementary Table S2). The PA percentages considering each BL as a whole ranged from 6.4% for PeHy-BL1 to 34.0% for PeHy-BL3. A minor deviation was noted considering PL percentage of the total population loci: from 63.8% (PeHy-BL1) to 81.9% (PeHy-BL4) (Table 3). The AMOVA carried out comparing molecular variance between and within subpopulations (sister line groups and BMs) demonstrated good reliability, showing a p-value of 0.001. The analysis revealed that a substantially larger proportion of the total observed variability was attributable to differences among subpopulations, rather than among samples within the same subpopulation. Respectively, the estimated variance quotes were 58.2% and 41.8% (Table 4).
3.3. GD analysis Comparison between Total and Core Set SNP profiles
The 4,349 SNPs used for the GD analysis (Figure 3A) were filtered multiple times by acting on MAF, PIC and Hs values, to find the lowest number of variants (core set) able to uniquely identify and correctly cluster all the BLs.
The minimum SNP amount by which a unique molecular profile was conserved for all BLs was 1,051, which was obtained retaining only those variants with a MAF greater than 0.3. The UPGMA clustering and the bootstrap values remained unchanged for the majority of the previously highlighted groups (Figure 3B). Only the hierarchical position of the PeHy-BL1 cluster in relation to the PeHy-BL2 group and to the one including PeHy-BM1, PeHy-BM2 and PeHy-BM4, changed from the initial results (i.e. those obtained considering the whole SNP set) (Figure 3A). By increasing the MAF threshold to 0.45, the number of SNPs drops sharply to 103 with an average PIC of 0.3. Based on these settings, PeHy-BL3-06 and PeHy-BL3-08 presented complete genetic identity and minor clustering changes were observed (Supplementary Table S4, Figure 3C). The main difference found in the UPGMA grouping (compared to that obtained using the complete dataset) was a shift in the hierarchical positions of the PeHy-BM3 and PeHy-BL4 clusters. The bootstrap value at the base of the branch separating PeHy-BM3 from the rest of the accessions remained high (82.5), while the other basal nodes showed values lower than 50 (Figure 3C). Beyond the MAF threshold of 0.45, significant grouping distortions occurred. The same occurred when stringent filters related to PIC and Hs were applied to the original dataset (Figure 3D).
3.4. GD Analysis Comparison Between Total and CDS-Located SNP Profiles
The initial SNP set was intersected with the CDSs annotated in the reference genome in order to retain only those variants that were located within coding sequences. Genotyping and clustering the clones using exclusively these variants allowed to assess possible differences with the previous results derived from the same analyses. 1,975 SNPs were retained, corresponding to 45.4% of the total dataset. Their positions resulted uniformly distributed across the 7 chromosomes. Within each chromosome, distal areas presented higher variant site density in comparison to pericentromeric zones (Figure 4).
Pairwise GD comparisons led to values very similar to those observed considering the initial dataset (Avg: 0.22 ± 0.10) (Supplementary Table S5). The Ho, Hs and Fis values also remained largely unchanged. The UPGMA dendrogram led to a completely identical clustering to that obtained with the original dataset. Bootstrap values were slightly lower in the main nodes, but continued to be significant (> 80) (Supplementary Figure S2). The PCA explained 50.4% of the total genetic variation and subpopulation differentiation matched that obtained in the previous results. In particular, PeHy-BL3 and PeHy-BL4 groups were strongly separated, while PeHy-BL1, PeHy-BL2 and BMs samples resulted undistinguishable (Supplementary Figure S3).
4. Discussion
Molecular genotyping exploiting different types of molecular markers proved to be very useful for breeding plan setting and management, in several ways. It can help retrieving genetic information about populations, such as genetic diversity and heterozygosity, planning crosses, reducing inbreeding depression, exploiting heterosis, and favoring traits of interest’s selection [39,76,77,78,79]. In addition, the production of molecular profiles through genomic marker analysis can support PVP and variety registration, simplify DUS tests, help germplasm management, and aid the identification of GMOs, unknown plant materials and Essentially Derived Varieties (EDVs) [35,37,61,80,81]. In petunia, several genotyping studies have been accomplished taking advantage of different molecular marker typologies, including RAPDs [82], AFLPs [83,84], SSRs [8,85], SRAPs [86], and CAPSs [8,87]. GBS was used for genetic structure studies on petunia natural populations, including the parental species used for the production of the commercial interspecific hybrids, P. axillaris and P. integrifolia [88,89]. SNP genotyping was also successfully carried out on breeding collections for linkage map production and QTL analysis of flower-related traits, such as flowering timing, pollinator syndrome, and double flower development. Informative variants were retrieved from transcriptome data [7,90], targeted-sequencing techniques [2,22,91], and other GBS-based protocols [88,89,92,93]. By contrast, the use of molecular assays for the identification of commercial varieties and breeding lines, their registration, and protection remains an underexplored area in petunia, and in general in the ornamental plant sector.
The present study focused on molecular genotyping through ddRADseq of 36 petunia BLs and BMs. The genotyping analysis proved to be effective and useful for PVP-related purposes, assigning a unique molecular profile to all lines of interest and discriminating each genotype from the others. In addition, it allowed to estimate the GD values within the collection and other genetic parameters that are of interest for breeding plan management. BLs resulted subdivided into four sister line groups. As expected, sister lines with a relatively high homozygosity level were also characterized by a high genetic uniformity. Some lines (i.e. PeHy-BL3-01 vs. PeHy-BL3-07; PeHy-BL3-08 vs. PeHy-BL3-06; PeHy-BL4-03 vs. PeHy-BL4-12) turned out to be distinguished by a very limited polymorphism amount (respective GD: 1.7 × 10⁻²; 1.2 × 10⁻³; 0.29 × 10⁻³) suggesting the possibility that they might represent the same clone. In this case, it is crucial to determine standard thresholds of molecular similarity above which two accessions should be regarded as belonging to the same clonal lineage. The exploiting of a kinship analysis based on the probability calculation that a pair of randomly sampled alleles is identical by descent (IBD) (i.e. due to genetic inheritance rather than by chance [94,95]) may achieve the standardization of genetic similarity values. Up to now, kinship matrixes in plant breeding studies have been exploited to identify the most genetically different genotypes in order to plan crosses [96] or to carry out the correction for relativeness in GWASs [97]. A threshold value commonly used for the identification of homozygous twins in animal genetics (0.4) [69,75] might be used to distinguish different clones. Indeed, all the three very genetically similar BL couples presented kinship coefficients higher than the threshold value. Nevertheless, the production of unique genotyping profiles for all lines demonstrated the approach capacity in discriminating also highly related genotypes. The SNP ability in uniquely genotyping very similar lines in petunia was previously shown by GBS studies for QTL analysis exploiting Recombinant Inbred Lines (RILs) and Near Isogenic Lines (NILs) [2,22,91].
The UPGMA clustering, the PCA and the genetic structure analysis led to consistent results and confirmed the genetic uniformity between sister lines, grouping them in the same branch, area of the plot, or ancestral group, respectively. The link with the genealogical data supported the reliability of the genotyping analysis. On the contrary, variability among sister line groups was significant. This was suggested by the AMOVA (variability between subpopulations > 50%), the fixation index calculation (Fst > 0.25 overall and in every sister line group pairwise comparison) and the genetic structure. However, despite the PCA explaining a percentage of total variability > 50%, groups PeHy-BL1, PeHy-BL2 and BMs resulted undistinguishable and were assigned to the same putative ancestor group. Therefore, although showing the highest presence of PAs, BMs resulted not entirely distinguishable at the genetic level from all the other lines. This implies that, in case a breeding aim is to obtain new varieties that are highly genetically distinguishable from those already present in the market, PeHy-BL1 and PeHy-BL2 lines did not match this goal. This statement highlights the importance in defining also genetic similarity thresholds, applicable at least at the species level, which allow to determine whether experimental materials present distinctness or should be considered as EDVs.
The collection under study showed a relatively low average level of Ho, especially if we consider its origin (breeding population of clones with a consistent structure) and its mode of reproduction (facultative allogamous species). This finding would suggest that the occurrence of crosses between closely related lines within the population may be possible, hence that the population would be at least partially self-compatible [98,99,100]. Nevertheless, inbreeding coefficient within subpopulations was generally low, highlighting a breeding selection effort to increase heterozygosis. The fact that the BL inbreeding coefficient within the entire population (Fit) did not considerably deviate from the equilibrium is the result of the high subpopulation differentiation, counteracted by low inbreeding coefficient within subpopulations. Heterozygosis levels (10-15%) even lower than those found in our study were reported in a genotyping analysis performed through RNAseq on petunia cultivars, mostly reported as F1 hybrids. In the mentioned study, lines were representative of the total variation observable in the market considering the growth habit trait. Authors suggested a quite limited genetic diversity for the total commercial P. × hybrida germplasm pool [7].
The obtainment of a SNP core set to be used in the development of target-specific molecular assays for genotyping plant collections is notably important to facilitate the analysis of breeding populations and the data comparisons between years [55,56,57,58,59]. In our sample group, the reduction of the number of variants by maintaining a unique molecular profile for every BL was only possible by keeping a final set of more than one thousand SNPs. Also, in this case, clustering was not completely respected, thus making the dataset suitable for PVP-related purposes, but not ideal for MAB goals. The high genetic uniformity observed within sister lines may be the reason why a high minimum number of variants was needed to maintain their unique discrimination. Nevertheless, even in the case of breeding planning, there is often no need to distinguish very genetically similar genotypes as sister lines. This is because, in most cases, crosses are programmed between the most differentiated genotypes, in order to achieve a phenotypical variability or to combine multiple traits of interest. Considering this aspect, the variant reduction could be extended up to an SNP number around one hundred. In fact, with this variant set no significant clustering change (e.g. sister line separations) in comparison to the one-thousand SNP dataset was observable, and the hierarchical order of the four sister line groups remained unchanged. In addition, the non-discriminated genotypes only included a couple of sister lines previously hypothesized as belonging to the same clone. This number of variants might then be suitable for developing innovative target-specific genotyping assays. Studies aimed at selecting SNP core sets were done in collections of several species of agronomic interest, including lettuce, corn, barley, cotton, tobacco [61,101,102,103,104]. Core sets capable of discriminating plant accessions are generally characterized by only a few dozen markers. However, in the majority of the studies, only genetic diversity measurements were performed, without carrying out clustering analyses and hence not assessing the core set potential for MAB purposes. Furthermore, the accessions analyzed in the above-mentioned studies were part of germplasm collections, characterized by a genetic diversity far greater than that observed in our breeding population. This explains why a higher number of variants was required in our study. In addition, in the other works PIC is considered a key parameter for defining a core set of markers to discriminate between different accessions (e.g. [61]). However, in our study we were able to identify a suitable SNP dataset by primarily adjusting the MAF thresholds. Our results would suggest that MAF might be more efficient for the discrimination of strongly related lines (i.e. characterized by low genetic diversity), whereas it may be less useful than PIC if the genetic differentiation degree of the entire population is higher.
The selection of SNPs located in coding sequences led to retaining less than half of the initial dataset variants. This result is in agreement with what reported for ddRADseq analyses exploiting the same restriction enzymes for library preparation [105]. Indeed, PstI and MspI are methylation-sensitive and therefore tend to favour the selection of coding sequences with greater probability than methylation-unsensitive enzymes. The fact that CDS-located SNPs were more present in the distal zones of chromosomes can be due to a higher hypermethylation degree, which is typical of pericentromeric regions [106]. Indeed, centromere positions reported for P. × hybrida chromosomes [26] reflect the SNP lacking areas in all chromosomes. Variant density along chromosomes was also in agreement with what already reported for ddRADseq analyses with methylation-sensitive enzymes [50]. Coding sequences are more conserved than the non-coding ones and hence less polymorphic [107]. However, the exclusive use of SNPs located in CDS regions led to results that were entirely comparable to those obtained with the initial dataset (considering the GD, UPGMA clustering, PCA, and Structure analysis) and to the genealogy data (i.e. similar genotyping outputs for sister lines). The use of coding sequences for genotyping analyses may enhance the identification of variants linked to traits of interest and the results obtained in this study might represent a clue for the reliability of this approach. In addition, the high number of variants located in CDSs retrieved (1,975) may suggest ddRAD as a potential technique for the identification of loci to be used for functional gene variant identification.
5. Conclusions
In conclusion, ddRADseq was demonstrated to be effective in uniquely discriminating petunia experimental clonal lines, in assessing their genetic relationship and in providing informative data for breeding purposes. In addition, the selection of a SNP core set was achieved, in order to allow the development of target-specific methods leading to simplified and more comparable genotyping results. Furthermore, the adopted method demonstrated to be exploitable in detecting polymorphisms within coding sequences, which may provide suitable variants for targeted in-depth analyses to assess their putative involvement in the traits of interest’s manifestation. Results encourage the adoption of GBS techniques for PVP to guarantee PBRs, for the registration of novel varieties whether coupled with DUS testing and other phenotype measurements, for MAB approaches and for the development of targeted-specific assays. The production of molecular profiles relative to experimental plant materials can help the achievement of innovative traits for cultivars, especially related to sustainability cultivation and management, which is aimed at reducing the agronomic input needs of plants and therefore enhancing the economic and environmental security. Further studies are needed toward two goal directions: the enhancement of basic molecular knowledge relative to petunia, and the development of useful applications for breeders, as assays able to predict traits of interest’s values. Eventually, GBS analyses need to be extended to understudied species, as it is for the majority of the ornamental plants nowadays commercialised worldwide.
Supplementary Materials
The following supporting information can be downloaded at the website of this paper posted on Preprints.org, Supplementary Figure S1: Definition of the most likely number of putative ancestral populations (K) based on a Structure analysis on molecular profiles of 36 Petunia Breeding clonal Lines (BLs) and BenchMarks (BMs), obtained with 4,349 SNPs from a ddRADseq approach. The blue points indicate the mean LnP(D) ± SD values. Mean LnP(D) ± SD is a function of K, as L′(K) = ΔLnP(D) and mean Delta K is calculated as ∣L′′(K)∣/(SD(L(K)); Supplementary Figure S2: Unweighted Pair Group Method with Arithmetic Mean (UPGMA) dendrogram based on a Genetic Diversity (GD) analysis done with Nei’s coefficient on molecular profiles of 36 Petunia Breeding clonal Lines (BLs) and BenchMarks (BMs), obtained with 1,975 SNPs located in CDSs from a ddRADseq approach. Numbers on branches represent bootstrap values and colors highlight different subpopulations; Supplementary Figure S3: Principal Component Analysis (PCA) centroid based on the Genetic Diversity (GD) analysis done molecular profiles of 36 Petunia Breeding clonal Lines (BLs) and BenchMarks (BMs), obtained with 1,975 SNPs located in Coding Sequences (CDSs) from a ddRADseq approach. Colors and ellipses represent sister line groups. Axes explain the two components with the highest genetic variability and the variability percentage of every component is shown in the line plot; Supplementary Table S1: Sequencing results, after raw read quality filtering and mapping, of ddRADseq libraries relative to 36 Petunia Breeding clonal Lines (BLs). Color scale ranges from deep green for the highest values to red for the lowest. Q20: Phred Quality score. MRL: Mean Read Length; Supplementary Table S2: Triangular Genetic Similarity (GS) matrix based on pairwise comparisons with Nei's Genetic Diversity (GD) coefficient relative to total SNP profiles of 36 Petunia Breeding clonal Lines (BLs) and BanchMarks (BMs), with sister line groups, GD values and color scale ranging from deep green for the highest values to red for the lowest. Observed Heterozigosity (Ho), percentage of Private Alleles (PA) of the total PAs in the population and average observed (na) and effetive (ne) alleles per locus per line are reported; Supplementary Table S3: Kinship-based INference for Genome-wide association studies (KING) matrix based on pairwise comparisons done with the KING-robust method, relative to total SNP profiles of 36 Petunia Breeding clonal Lines (BLs) and BanchMarks (BMs), with sister line groups, GD values and color scale ranging from deep green for the hlowest values to red for the highest; Supplementary Table S4: Genetic parameters of 103 loci relative to ddRADseq SNP profiles of 36 Petunia Breeding clonal Lines (BLs), filtered out sites presentng a Minor Allele Frequency (MAF) minor to 0.45, with: average Polymorphic Information Content per locus (AvgPIC); observed (Ho), expected in subpopulation (Hs) and expected in total population (Ht) Heterozygosity; inbreeding coefficnt (Fis); fixation index (Fst); Supplementary Table S5: Triangular Genetic Similarity (GS) matrix based on pairwise comparisons with Nei's Genetic Diversity (GD) coefficient relative to molecular profiles of 36 Petunia Breeding clonal Lines (BLs) and BanchMarks (BMs), comprising 1,975 SNP located in CDSs, with GD values and color scale ranging from deep green for the highest values to red for the lowest. Observed Heterozigosity (Ho) per BL (Sample) and sister line group (Pop), expected Heterozigosity (Hs) and inbreeding coefficient (Fis) are reported.
Author Contributions
Conceptualization, methodology, formal analysis, A.B.; software, A.B., G.G., and F.S.; writing—original draft preparation, A.B.; writing—review and editing, A.B., F.P., S.F., G.G., A.V.; supervision, F.P. and G.B.; project administration, G.B.; funding acquisition, G.B. All authors have read and agreed to the published version of the manuscript.
Funding
This study was carried out within the research contract signed by the Gruppo Padana S.S. company (Paese, TV, Italy), and Department of Agronomy, Food, Natural resources, Animals and Environment (DAFNAE), University of Padua (Italy), within action IV.5_GREEN, PON 2014–2021.
Data Availability Statement
The datasets generated for this study can be found in GenBank under the BioProject accession number PRJNA1260944.
Acknowledgments
The authors would like to thank Marco Gazzola (Gruppo Padana contact person) for funding and for providing plant material.
Conflicts of Interest
The authors declare no conflicts of interest. The funders had no role in the design of the study; in the collection, analyses, or interpretation of data; in the writing of the manuscript; or in the decision to publish the results.
References
- Aswath, C.; Bose, T.K.; Bhatia, R.; Saha, T.N.; Dutta, K. Commercial Flowers; House, Daya Pub., Ed.; Daya Publishing, 2021; Vol. 4, ISBN 9789354614163. [Google Scholar]
- Chen, Q.X.C.; Warner, R.M. Identification of QTL for Plant Architecture and Flowering Performance Traits in a Multi-Environment Evaluation of a Petunia Axillaris × P. Exserta Recombinant Inbred Line Population. Horticulturae 2022, 8. [Google Scholar] [CrossRef]
- USDA Floriculture Crops 2020 Summary. Washington, DC, USA, 2021.
- Gebhardt, C. The Historical Role of Species from the Solanaceae Plant Family in Genetic Research. Theor Appl Genet 2016, 129, 2281. [Google Scholar] [CrossRef]
- Sink, K.C. Petunia. Springer, Berlin, Heidelberg 1984, 9. [CrossRef]
- Geitmann, A. Petunia. Evolutionary, Developmental and Physiological Genetics. Ann Bot 2011, 107, vi. [Google Scholar] [CrossRef]
- Guo, Y.; Warner, R.M. Dissecting Genetic Diversity and Genomic Background of Petunia Cultivars with Contrasting Growth Habits. Horticulture Research 2020, 7, 1–15. [Google Scholar] [CrossRef] [PubMed]
- Hermann, K.; Klahre, U.; Venail, J.; Brandenburg, A.; Kuhlemeier, C. The Genetics of Reproductive Organ Morphology in Two Petunia Species with Contrasting Pollination Syndromes. Planta 2015, 241, 1241–1254. [Google Scholar] [CrossRef]
- Rodrigues, D.M.; Caballero-Villalobos, L.; Turchetto, C.; Assis Jacques, R.; Kuhlemeier, C.; Freitas, L.B. Do We Truly Understand Pollination Syndromes in Petunia as Much as We Suppose? 2018. [Google Scholar] [CrossRef]
- Regalado, J.J.; Carmona-Martín, E.; Querol, V.; Veléz, C.G.; Encina, C.L.; Pitta-Alvarez, S.I. Production of Compact Petunias through Polyploidization. Plant Cell Tissue Organ Cult 2017, 129, 61–71. [Google Scholar] [CrossRef]
- Dermen, H. Polyploidy in Petunia. Am J Bot 1931, 18, 250. [Google Scholar] [CrossRef]
- Robbins, T.P.; Harbord, R.M.; Sonneveld, T.; Clarke, K. The Molecular Genetics of Self-Incompatibility in Petunia Hybrida. Ann Bot 2000, 85, 105–112. [Google Scholar] [CrossRef]
- Williams, J.S.; Wu, L.; Li, S.; Sun, P.; Kao, T.-H.; Robbins, T.P.; Sims, T.L. Insight into S-RNase-Based Self-Incompatibility in Petunia: Recent Findings and Future Directions. 2015. [Google Scholar] [CrossRef]
- Yue, Y.; Du, J.; Li, Y.; Thomas, H.R.; Frank, M.H.; Wang, L.; Hu, H. Insight into the Petunia Dof Transcription Factor Family Reveals a New Regulator of Male-Sterility. Ind Crops Prod 2021, 161, 113196. [Google Scholar] [CrossRef]
- Nivison, H.T.; Hanson, M.R. Identification of a Mitochondrial Protein Associated with Cytoplasmic Male Sterility in Petunia. Plant Cell 1989, 1, 1121–1130. [Google Scholar] [CrossRef]
- Farinati, S.; Draga, S.; Betto, A.; Palumbo, F.; Vannozzi, A.; Lucchin, M.; Barcaccia, G. Current Insights and Advances into Plant Male Sterility: New Precision Breeding Technology Based on Genome Editing Applications. Front Plant Sci 2023, 14. [Google Scholar] [CrossRef] [PubMed]
- Gerats, T.; Vandenbussche, M. A Model System for Comparative Research: Petunia. Trends Plant Sci 2005, 10, 251–256. [Google Scholar] [CrossRef] [PubMed]
- Melzer, R.; Janssen, B.J.; Dornelas, M.C.; Vandenbussche, M.; Chambrier, P.; Rodrigues Bento, S.; Morel, P. Petunia, Your Next Supermodel? 2016. [Google Scholar] [CrossRef]
- Meyer, P.; Heidmann, I.; Forkmann, G.; Saedler, H. A New Petunia Flower Colour Generated by Transformation of a Mutant with a Maize Gene. Nature 1987, 330:6149 1987(330), 677–678. [Google Scholar] [CrossRef]
- Ali, I.; Husnain, T.; Riazuddin, S. RNA Interference: The Story of Gene Silencing in Plants and Humans. In Elsevier Biotechnology advances; 2008. [Google Scholar]
- Napoli, C.; Lemieux, C.; Jorgensen, R. Introduction of a Chimeric Chalcone Synthase Gene into Petunia Results in Reversible Co-Suppression of Homologous Genes. Trans. Plant Cell 1990, 2, 279–289. [Google Scholar] [CrossRef]
- Cao, Z.; Guo, Y.; Yang, Q.; He, Y.; Fetouh, M.I.; Warner, R.M.; Deng, Z. Genome-Wide Identification of Quantitative Trait Loci for Important Plant and Flower Traits in Petunia Using a High-Density Linkage Map and an Interspecific Recombinant Inbred Population Derived from Petunia Integrifolia and P. Axillaris. Horticulture Research 2019, 1 2019(6), 1–15. [Google Scholar] [CrossRef] [PubMed]
- Wang, G.; Zhang, W.; Ruan, Y.; Dai, B.; Yang, T.; Gou, T.; Liu, C.; Ning, G.; Liu, G.; Yu, Y.; et al. Construction of a High-Density Genetic Map and Mapping of Double Flower Genes in Petunia. Sci Hortic 2024, 329, 112988. [Google Scholar] [CrossRef]
- Bossolini, E.; Klahre, U.; Brandenburg, A.; Reinhardt, D.; Kuhlemeier, C.; Belzile, F. High Resolution Linkage Maps of the Model Organism Petunia Reveal Substantial Synteny Decay with the Related Genome of Tomato. Genome 2011, 54, 327–340. [Google Scholar] [CrossRef]
- Bombarely, A.; Moser, M.; Amrad, A.; Bao, M.; Bapaume, L.; Barry, C.S.; Bliek, M.; Boersma, M.R.; Borghi, L.; Bruggmann, R.; et al. Insight into the Evolution of the Solanaceae from the Parental Genomes of Petunia Hybrida. 2016. [Google Scholar] [CrossRef]
- Saei, A.; Hunter, D.; Hilario, E.; David, C.; Ireland, H.; Esfandiari, A.; King, I.; Grierson, E.; Wang, L.; Boase, M.; et al. Chromosome-Level Genome Assembly and Annotation of Petunia Hybrida. bioRxiv 2024. [Google Scholar] [CrossRef]
- Kashikar, S.G.; Khalatkar, A.S. Breeding for Flower Colour in Petunia Hybrida Hort. Acta Hortic 1981, 35–40. [Google Scholar] [CrossRef]
- Man-Zhu, D.; Se-Ping, B. Advances in Genetics and Breeding of Petunia Hybrida Vilm. Chinese Bulletin of Botany 2004, 21, 385. [Google Scholar]
- Masclaux-Daubresse, C.; Daniel-Vedele, F.; Dechorgnat, J.; Chardon, F.; Gaufichon, L.; Suzuki, A. Nitrogen Uptake, Assimilation and Remobilization in Plants: Challenges for Sustainable and Productive Agriculture. Ann Bot 2010, 105, 1141–1157. [Google Scholar] [CrossRef]
- Lütken, H.; Clarke, J.L.; Müller, R. Genetic Engineering and Sustainable Production of Ornamentals: Current Status and Future Directions. Plant Cell Rep 2012, 31, 1141–1157. [Google Scholar] [CrossRef]
- CPVO CPVO Legislation in Force. Available online: https://cpvo.europa.eu/en/about-us/law-and-practice/legislation-in-force (accessed on 27 October 2024).
- UPOV UPOV Lex. Available online: https://upovlex.upov.int/en/convention (accessed on 27 October 2024).
- CPVO Protocol for Tests on Distinctness, Uniformity and Stability Petunia Juss. and × Petchoa J. M. H. Shaw. Available online: https://cpvo.europa.eu/sites/default/files/documents/petunia_2.pdf (accessed on 9 May 2025).
- UPOV Guidelines for the Conduct of Tests for Distinctness, Uniformity and Stability - Petunia (Petunia Juss.). Available online: https://www.upov.int/en/publications/tg-rom/tg212/tg_212_1_corr.pdf (accessed on 9 May 2025).
- Yu, J.K.; Chung, Y.S. Plant Variety Protection: Current Practices and Insights. Genes (Basel) 2021, 12, 1127. [Google Scholar] [CrossRef] [PubMed]
- Gilliland, T.J.; Annicchiarico, P.; Julier, B.; Ghesquière, M. A Proposal for Enhanced EU Herbage VCU and DUS Testing Procedures. Grass and Forage Science 2020, 75, 227–241. [Google Scholar] [CrossRef]
- CPVO CPVO Guidance on the Use of Biochemical and Molecular Markers in the Examination of Distinctiveness, Uniformity and Stability (DUS). Available online: https://www.upov.int/edocs/tgpdocs/en/tgp_15.pdf (accessed on 4 May 2025).
- Patella, A.; Scariolo, F.; Palumbo, F.; Barcaccia, G. Genetic Structure of Cultivated Varieties of Radicchio (Cichorium Intybus L.): A Comparison between F1 Hybrids and Synthetics. Plants 2019, Vol. 8 8, 213. [Google Scholar] [CrossRef] [PubMed]
- Seki, K.; Komatsu, K.; Hiraga, M.; Tanaka, K.; Uno, Y.; Matsumura, H. Development of PCR-Based Marker for Resistance to Fusarium Wilt Race 2 in Lettuce (Lactuca Sativa L.). Euphytica 2021, 217, 126. [Google Scholar] [CrossRef]
- Zhigunov, A. V.; Ulianich, P.S.; Lebedeva, M. V.; Chang, P.L.; Nuzhdin, S. V.; Potokina, E.K. Development of F1 Hybrid Population and the High-Density Linkage Map for European Aspen (Populus Tremula L.) Using RADseq Technology. BMC Plant Biol 2017, 17, 180. [Google Scholar] [CrossRef]
- Peterson, B.K.; Weber, J.N.; Kay, E.H.; Fisher, H.S.; Hoekstra, H.E. Double Digest RADseq: An Inexpensive Method for De Novo SNP Discovery and Genotyping in Model and Non-Model Species. PLoS One 2012, 7, e37135. [Google Scholar] [CrossRef]
- Chiurugwi, T.; Kemp, S.; Powell, W.; Hickey, L.T. Speed Breeding Orphan Crops. Theoretical and Applied Genetics 2019, 132, 607–616. [Google Scholar] [CrossRef]
- Johnson, M.; Deshpande, S.; Vetriventhan, M.; Upadhyaya, H.D.; Wallace, J.G. Genome-Wide Population Structure Analyses of Three Minor Millets: Kodo Millet, Little Millet, and Proso Millet. Plant Genome 2019, 12. [Google Scholar] [CrossRef]
- Russell, J.; Hackett, C.; Hedley, P.; Liu, H.; Milne, L.; Bayer, M.; Marshall, D.; Jorgensen, L.; Gordon, S.; Brennan, R. The Use of Genotyping by Sequencing in Blackcurrant (Ribes Nigrum): Developing High-Resolution Linkage Maps in Species without Reference Genome Sequences. Molecular Breeding 2014, 33, 835–849. [Google Scholar] [CrossRef]
- Praveen, P.; Gopal, R.; Ramakrishnan, U. The Population Structure of Invasive Lantana Camara Is Shaped by Its Mating System. bioRxiv 2024. [Google Scholar] [CrossRef]
- Zhang, X.J.; Liu, X.F.; Liu, D.T.; Cao, Y.R.; Li, Z.H.; Ma, Y.P.; Ma, H. Genetic Diversity and Structure of Rhododendron Meddianum, a Plant Species with Extremely Small Populations. Plant Divers 2021, 43, 472–479. [Google Scholar] [CrossRef]
- Teixeira, T.M.; Nazareno, A.G. One Step Away From Extinction: A Population Genomic Analysis of A Narrow Endemic, Tropical Plant Species. Front Plant Sci 2021, 12, 730258. [Google Scholar] [CrossRef]
- Ramirez-Ramirez, A.R.; Bidot-Martínez, I.; Mirzaei, K.; Rasoamanalina Rivo, O.L.; Menéndez-Grenot, M.; Clapé-Borges, P.; Espinosa-Lopez, G.; Bertin, P. Comparing the Performances of SSR and SNP Markers for Population Analysis in Theobroma Cacao L., as Alternative Approach to Validate a New DdRADseq Protocol for Cacao Genotyping. PLoS One 2024, 19, e0304753. [Google Scholar] [CrossRef] [PubMed]
- McLean-Rodríguez, F.D.; Costich, D.E.; Camacho-Villa, T.C.; Pè, M.E.; Dell’Acqua, M. Genetic Diversity and Selection Signatures in Maize Landraces Compared across 50 Years of in Situ and Ex Situ Conservation. Heredity 2021 126:6 2021, 126, 913–928. [Google Scholar] [CrossRef]
- Molina, C.; Aguirre, N.C.; Vera, P.A.; Filippi, C.V.; Puebla, A.F.; Poltri, S.N.M.; Paniego, N.B.; Acevedo, A. DdRADseq-Mediated Detection of Genetic Variants in Sugarcane. Plant Mol Biol 2023, 111, 205–219. [Google Scholar] [CrossRef] [PubMed]
- Luo, H.; Guo, J.; Yu, B.; Chen, W.; Zhang, H.; Zhou, X.; Chen, Y.; Huang, L.; Liu, N.; Ren, X.; et al. Construction of DdRADseq-Based High-Density Genetic Map and Identification of Quantitative Trait Loci for Trans-Resveratrol Content in Peanut Seeds. Front Plant Sci 2021, 12, 644402. [Google Scholar] [CrossRef]
- Martina, M.; Acquadro, A.; Gulino, D.; Brusco, F.; Rabaglio, M.; Portis, E.; Lanteri, S. First Genetic Maps Development and QTL Mining in Ranunculus Asiaticus L. through DdRADseq. Front Plant Sci 2022, 13, 1009206. [Google Scholar] [CrossRef]
- Ksouri, N.; Sánchez, G.; Forcada, C.F. i; Contreras-Moreira, B.; Gogorcena, Y. DdRAD-Seq-Derived SNPs Reveal Novel Association Signatures for Fruit-Related Traits in Peach. bioRxiv 2023, 2023.07.31.551252. [Google Scholar] [CrossRef]
- Daemi-Saeidabad, M.; Shojaeiyan, A.; Vivian-Smith, A.; Stenøien, H.K.; Falahati-Anbaran, M. The Taxonomic Significance of DdRADseq Based Microsatellite Markers in the Closely Related Species of Heracleum (Apiaceae). PLoS One 2020, 15, e0232471. [Google Scholar] [CrossRef]
- Kim, H.; Yoon, J.B.; Lee, J. Development of Fluidigm SNP Type Genotyping Assays for Marker-Assisted Breeding of Chili Pepper (Capsicum Annuum L.). Horticultural Science and Technology 2017 35:4 2017, 35, 465–479. [Google Scholar] [CrossRef]
- Scaglione, D.; Pinosio, S.; Marroni, F.; Di Centa, E.; Fornasiero, A.; Magris, G.; Scalabrin, S.; Cattonaro, F.; Taylor, G.; Morgante, M. PART OF A SPECIAL ISSUE ON BIOENERGY CROPS FOR FUTURE CLIMATES Single Primer Enrichment Technology as a Tool for Massive Genotyping: A Benchmark on Black Poplar and Maize. Ann Bot 2019, 124, 543–551. [Google Scholar] [CrossRef]
- Sun, X.; Liu, D.; Zhang, X.; Li, W.; Liu, H.; Hong, W.; Jiang, C.; Guan, N.; Ma, C.; Zeng, H.; et al. SLAF-Seq: An Efficient Method of Large-Scale De Novo SNP Discovery and Genotyping Using High-Throughput Sequencing. PLoS One 2013, 8, 58700. [Google Scholar] [CrossRef]
- Lonardi, S.; Sung, C.-J.; Kulkarni, R.; Hillhouse, A.; Simpson, C.E.; Cason, J.; Burow, M.D. Reduced-Cost Genotyping by Resequencing in Peanut Breeding Programs Using Tecan Allegro Targeted Resequencing V2. 2024. [Google Scholar] [CrossRef]
- Yang, Q.; Zhang, J.; Shi, X.; Chen, L.; Qin, J.; Zhang, M.; Yang, C.; Song, Q.; Yan, L.; Yang, Q.; et al. Development of SNP Marker Panels for Genotyping by Target Sequencing (GBTS) and Its Application in Soybean. 2023, 43, 26–27. [Google Scholar] [CrossRef] [PubMed]
- Broccanello, C.; Chiodi, C.; Funk, A.; Mcgrath, J.M.; Panella, L.; Stevanato, P. Comparison of Three PCR-Based Assays for SNP Genotyping in Plants. Plant Methods 2018. [Google Scholar] [CrossRef] [PubMed]
- Park, J.S.; Kang, M.Y.; Shim, E.J.; Oh, J.H.; Seo, K.I.; Kim, K.S.; Sim, S.C.; Chung, S.M.; Park, Y.; Lee, G.P.; et al. Genome-Wide Core Sets of SNP Markers and Fluidigm Assays for Rapid and Effective Genotypic Identification of Korean Cultivars of Lettuce (Lactuca Sativa L.). Hortic Res 2022, 9, uhac119. [Google Scholar] [CrossRef]
- Abed, A.; Légaré, G.; Pomerleau, S.; St-Cyr, J.; Boyle, B.; Belzile, F.J. Genotyping-by-Sequencing on the Ion Torrent Platform in Barley. Methods in Molecular Biology 2019, 1900, 233–252. [Google Scholar] [CrossRef] [PubMed]
- Li, H. Aligning Sequence Reads, Clone Sequences and Assembly Contigs with BWA-MEM. Genomics 2013, 1303 . [Google Scholar]
- Danecek, P.; Bonfield, J.K.; Liddle, J.; Marshall, J.; Ohan, V.; Pollard, M.O.; Whitwham, A.; Keane, T.; McCarthy, S.A.; Davies, R.M. Twelve Years of SAMtools and BCFtools. Gigascience 2021, 10, 1–4. [Google Scholar] [CrossRef] [PubMed]
- Catchen, J.; Hohenlohe, P.A.; Bassham, S.; Amores, A.; Cresko, W.A. Stacks: An Analysis Tool Set for Population Genomics. Mol Ecol 2013, 22, 3124–3140. [Google Scholar] [CrossRef]
- Kamvar, Z.N.; Tabima, J.F.; Gr̈unwald, N.J. Poppr: An R Package for Genetic Analysis of Populations with Clonal, Partially Clonal, and/or Sexual Reproduction. PeerJ 2014, 2014, 1–14. [Google Scholar] [CrossRef]
- Nei, M. Analysis of Gene Diversity in Subdivided Populations. Proceedings of the National Academy of Sciences 1973, 70, 3321–3323. [Google Scholar] [CrossRef]
- Chang, C.C.; Chow, C.C.; Tellier, L.C.A.M.; Vattikuti, S.; Purcell, S.M.; Lee, J.J. Second-Generation PLINK: Rising to the Challenge of Larger and Richer Datasets. Gigascience 2015, 4, 7. [Google Scholar] [CrossRef]
- Manichaikul, A.; Mychaleckyj, J.C.; Rich, S.S.; Daly, K.; Sale, M.; Chen, W.M. Robust Relationship Inference in Genome-Wide Association Studies. Bioinformatics 2010, 26, 2867–2873. [Google Scholar] [CrossRef]
- Van Der Ploeg, A. Drawing Non-Layered Tidy Trees in Linear Time. Softw Pract Exp 2014, 44, 1467–1484. [Google Scholar] [CrossRef]
- Gruber, B.; Unmack, P.J.; Berry, O.F.; Georges, A. Dartr: An r Package to Facilitate Analysis of SNP Data Generated from Reduced Representation Genome Sequencing. Mol Ecol Resour 2018, 18, 691–699. [Google Scholar] [CrossRef] [PubMed]
- Pritchard, J.; Stephens, M.; Donnelly, P. Inference of Population Structure Using Multilocus Genotype Data. Genetics 2000, 155, 945–959. [Google Scholar] [CrossRef] [PubMed]
- Earl, D.A.; vonHoldt, B.M. STRUCTURE HARVESTER: A Website and Program for Visualizing STRUCTURE Output and Implementing the Evanno Method. Conserv Genet Resour 2012, 4, 359–361. [Google Scholar] [CrossRef]
- Goudet, J. Hierfstat, a Package for r to Compute and Test Hierarchical F-Statistics. Mol Ecol Notes 2005, 5, 184–186. [Google Scholar] [CrossRef]
- Sinnwell, J.P.; Therneau, T.M.; Schaid, D.J. The Kinship2 R Package for Pedigree Data. Hum Hered 2014, 78, 91–93. [Google Scholar] [CrossRef]
- Krishnan, G.S.; Singh, A.K.; Waters, D.L.E.; Henry, R.J. Molecular Markers for Harnessing Heterosis. Molecular Markers in Plants 2012, 119–136. [Google Scholar] [CrossRef]
- Caballero, A.; Villanueva, B.; Druet, T. On the Estimation of Inbreeding Depression Using Different Measures of Inbreeding from Molecular Markers. 2020. [Google Scholar] [CrossRef]
- Nguyen, T.K.; Ha, S.T.T.; Lim, J.H. Analysis of Chrysanthemum Genetic Diversity by Genotyping-by-Sequencing. Hortic Environ Biotechnol 2020, 61, 903–913. [Google Scholar] [CrossRef]
- Karikari, B.; Li, S.; Bhat, J.A.; Cao, Y.; Kong, J.; Yang, J.; Gai, J.; Zhao, T. Genome-Wide Detection of Major and Epistatic Effect QTLs for Seed Protein and Oil Content in Soybean Under Multiple Environments Using High-Density Bin Map. International Journal of Molecular Sciences 2019, 20, 979. [Google Scholar] [CrossRef]
- Yu, Q.; Ling, Y.; Xiong, Y.; Zhao, W.; Xiong, Y.; Dong, Z.; Yang, J.; Zhao, J.; Zhang, X.; Ma, X. RAD-Seq as an Effective Strategy for Heterogenous Variety Identification in Plants—a Case Study in Italian Ryegrass (Lolium Multiflorum). BMC Plant Biol 2022, 22, 231. [Google Scholar] [CrossRef]
- McLean-Rodríguez, F.D.; Costich, D.E.; Camacho-Villa, T.C.; Pè, M.E.; Dell’Acqua, M. Genetic Diversity and Selection Signatures in Maize Landraces Compared across 50 Years of in Situ and Ex Situ Conservation. Heredity 2021, 126, 913–928. [Google Scholar] [CrossRef]
- Peltier, D.; Farcy, E.; Dulieu, H.; Bervillé, A. Origin, Distribution and Mapping of RAPD Markers from Wild Petunia Species in Petunia Hybrida Hort Lines. Theoretical and Applied Genetics 1994, 88, 637–645. [Google Scholar] [CrossRef]
- Galliot, C.; Hoballah, M.E.; Kuhlemeier, C.; Stuurman, J. Genetics of Flower Size and Nectar Volume in Petunia Pollination Syndromes. Planta 2006, 225, 203–212. [Google Scholar] [CrossRef]
- Strommer, J.; Peters, J.; Zethof, J.; De Keukeleire, P.; Gerats, T. AFLP Maps of Petunia Hybrida: Building Maps When Markers Cluster. Theor Appl Genet 2002, 105, 1000–1009. [Google Scholar] [CrossRef] [PubMed]
- Vallejo, V.A.; Tychonievich, J.; Lin, W.K.; Wangchu, L.; Barry, C.S.; Warner, R.M. Identification of QTL for Crop Timing and Quality Traits in an Interspecific Petunia Population. Molecular Breeding 2015, 35, 1–11. [Google Scholar] [CrossRef]
- Liu, C.; He, Y.; Gou, T.; Li, X.; Ning, G.; Bao, M. Identification of Molecular Markers Associated with the Double Flower Trait in Petunia Hybrida. Sci Hortic 2016, 206, 43–50. [Google Scholar] [CrossRef]
- Klahre, U.; Gurba, A.; Hermann, K.; Saxenhofer, M.; Bossolini, E.; Guerin, P.M.; Kuhlemeier, C. Pollinator Choice in Petunia Depends on Two Major Genetic Loci for Floral Scent Production. Current Biology 2011, 21, 730–739. [Google Scholar] [CrossRef]
- Pezzi, P.H.; Guzmán-Rodriguez, S.; Giudicelli, G.C.; Turchetto, C.; Bombarely, A.; Freitas, L.B. A Convoluted Tale of Hybridization between Two Petunia Species from a Transitional Zone in South America. Perspect Plant Ecol Evol Syst 2022, 56, 125688. [Google Scholar] [CrossRef]
- Caballero-Villalobos, L.; Silva-Arias, G.A.; Turchetto, C.; Giudicelli, G.C.; Petzold, E.; Bombarely, A.; Freitas, L.B. Neutral and Adaptive Genomic Variation in Hybrid Zones of Two Ecologically Diverged Petunia Species (Solanaceae). Botanical Journal of the Linnean Society 2021, 196, 100–122. [Google Scholar] [CrossRef]
- Guo, Y.; Wiegert-Rininger, K.E.; Vallejo, V.A.; Barry, C.S.; Warner, R.M. Transcriptome-Enabled Marker Discovery and Mapping of Plastochron-Related Genes in Petunia Spp. BMC Genomics 2015, 16, 1–19. [Google Scholar] [CrossRef]
- Guo, Y.; Lin, W.K.; Chen, Q.; Vallejo, V.A.; Warner, R.M. Genetic Determinants of Crop Timing and Quality Traits in Two Interspecific Petunia Recombinant Inbred Line Populations. Sci Rep 2017, 7. [Google Scholar] [CrossRef]
- Elshire, R.J.; Glaubitz, J.C.; Sun, Q.; Poland, J.A.; Kawamoto, K.; Buckler, E.S.; Mitchell, S.E. A Robust, Simple Genotyping-by-Sequencing (GBS) Approach for High Diversity Species. PLoS One 2011, 6, e19379. [Google Scholar] [CrossRef] [PubMed]
- Berardi, A.E.; Esfeld, K.; Jäggi, L.; Mandel, T.; Cannarozzi, G.M.; Kuhlemeier, C. Complex Evolution of Novel Red Floral Color in Petunia. Plant Cell 2021, 33, 2273–2295. [Google Scholar] [CrossRef]
- Coste, C.F.D.; Bienvenu, François; Ronget, V.; Ramirez-Loza, J.-P.; Cubaynes, S.; Pavard, S.; Bienvenu, F. The Kinship Matrix: Inferring the Kinship Structure of a Population from Its Demography. 2021. [Google Scholar] [CrossRef]
- Thompson, E.A. Identity by Descent: Variation in Meiosis, Across Genomes, and in Populations. Genetics 2013, 194, 301–326. [Google Scholar] [CrossRef] [PubMed]
- Rueda, M.A.R.; Briceño-Pinzón, I.D.; Miguel, L.A.; Martínez, J.L.Q.; Padua, L.N.; de Lima Ribeiro, R.H.; Martins, V.S.; de Souza, L.C.; da Silva Junior, A.L.; de Souza Marçal, T. Multivariate Analysis of Genetic Variability in Advanced Potato Clones Under Tropical Conditions. Agricultural Research 2025, 1–10. [Google Scholar] [CrossRef]
- Woldeyohannes, A.B.; Iohannes, S.D.; Miculan, M.; Caproni, L.; Ahmed, J.S.; de Sousa, K.; Desta, E.A.; Fadda, C.; Pè, M.E.; Dell’acqua, M. Data-Driven, Participatory Characterization of Farmer Varieties Discloses Teff Breeding Potential under Current and Future Climates. Elife 2022, 11. [Google Scholar] [CrossRef]
- COGEM Update on Unauthorised Genetically Modified Garden Petunia Varieties. Available online: https://cogem.net/en/publication/update-on-unauthorised-genetically-modified-garden-petunia-varieties/ (accessed on 19 May 2025).
- Entani, T.; Takayama, S.; Iwano, M.; Shiba, H.; Che, F.S.; Isogai, A. Relationship between Polyploidy and Pollen Self-Incompatibility Phenotype in Petunia Hybrida Vilm. Biosci Biotechnol Biochem 1999, 63, 1882–1888. [Google Scholar] [CrossRef]
- Chen, Y.; Jiang, P.; Wilde, H.D. A Self-Pollinating Mutant of Petunia Hybrida. Sci Hortic 2014, 177, 10–13. [Google Scholar] [CrossRef]
- Wang, Y.; Lv, H.; Xiang, X.; Yang, A.; Feng, Q.; Dai, P.; Li, Y.; Jiang, X.; Liu, G.; Zhang, X. Construction of a SNP Fingerprinting Database and Population Genetic Analysis of Cigar Tobacco Germplasm Resources in China. Front Plant Sci 2021, 12, 618133. [Google Scholar] [CrossRef]
- Varshney, R.K.; Thiel, T.; Sretenovic-Rajicic, T.; Baum, M.; Valkoun, J.; Guo, P.; Grando, S.; Ceccarelli, S.; Graner, A. Identification and Validation of a Core Set of Informative Genic SSR and SNP Markers for Assaying Functional Diversity in Barley. Molecular Breeding 2008, 22, 1–13. [Google Scholar] [CrossRef]
- Kuang, M.; Wei, S.J.; Wang, Y.Q.; Zhou, D.Y.; Ma, L.; Fang, D.; Yang, W.H.; Ma, Z.Y. Development of a Core Set of SNP Markers for the Identification of Upland Cotton Cultivars in China. JIAgr 2016, 15, 954–962. [Google Scholar] [CrossRef]
- Dou, T.; Wang, C.; Ma, Y.; Chen, Z.; Zhang, J.; Guo, G. CoreSNP: An Efficient Pipeline for Core Marker Profile Selection from Genome-Wide SNP Datasets in Crops. BMC Plant Biol 2023, 23, 1–10. [Google Scholar] [CrossRef]
- Pootakham, W.; Sonthirod, C.; Naktang, C.; Jomchai, N.; Sangsrakru, D.; Tangphatsornruang, S. Effects of Methylation-Sensitive Enzymes on the Enrichment of Genic SNPs and the Degree of Genome Complexity Reduction in a Two-Enzyme Genotyping-by-Sequencing (GBS) Approach: A Case Study in Oil Palm (Elaeis Guineensis). Mol Breed 2016, 36. [Google Scholar] [CrossRef] [PubMed]
- Gehring, M.; Henikoff, S. DNA Methylation Dynamics in Plant Genomes. Biochimica et Biophysica Acta (BBA) - Gene Structure and Expression 2007, 1769, 276–286. [Google Scholar] [CrossRef] [PubMed]
- Mammadov, J.; Aggarwal, R.; Buyyarapu, R.; Kumpatla, S. SNP Markers and Their Impact on Plant Breeding. Int J Plant Genomics 2012, 2012, 728398. [Google Scholar] [CrossRef] [PubMed]
Figure 1.
Genetic Distance (GD) and Genetic Structure analysis results based on molecular profiles of 32 petunia clonal Lines (BLs) and 4 BenchMarks (BMs), obtained with 4,349 SNPs from a ddRADseq approach. A. Unweighted Pair Group Method with Arithmetic Mean (UPGMA) dendrogram based on Nei’s GD analysis. Numbers on nodes represent bootstrap values and colours highlight different subpopulations. B. Graphic representation of the Structure analysis considering K = 2 and K = 3 results, where K is the most likely number of ancestral populations (Supplementary Figure S1). Colors indicate different putative ancestors and correspond to those of the most represented respective subpopulation.
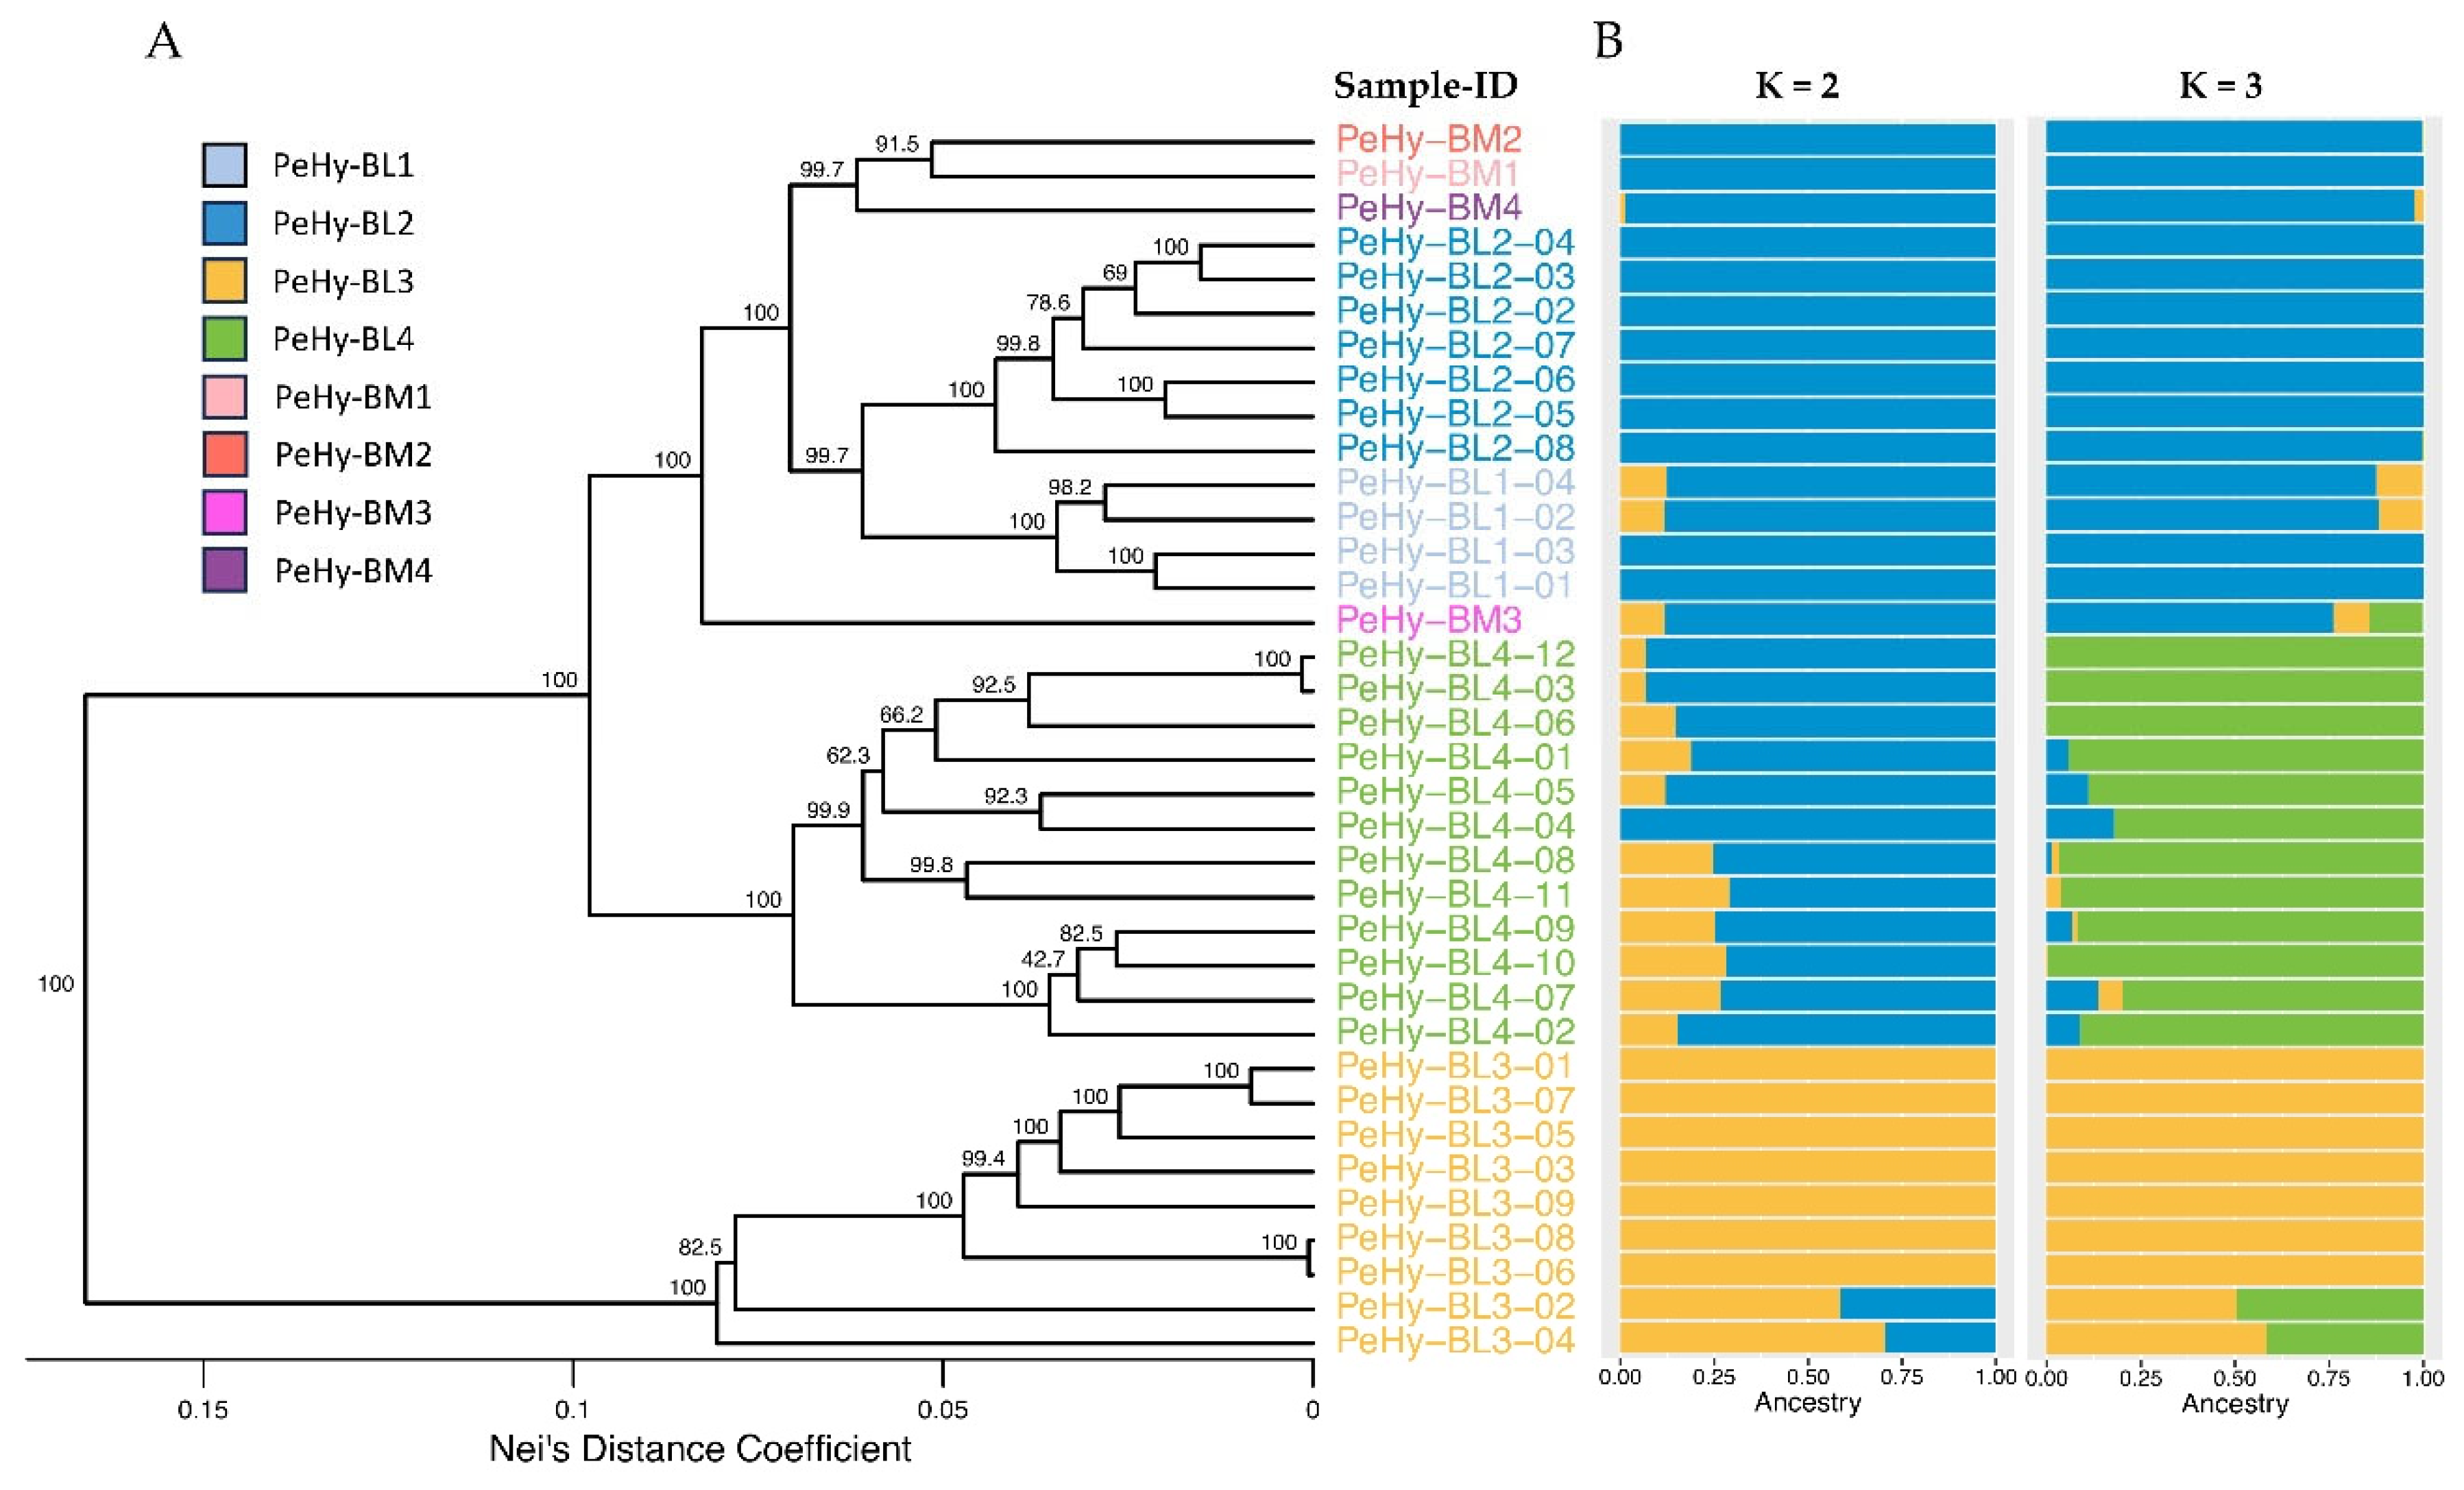
Figure 2.
Principal Component Analysis (PCA) centroids based on the Genetic Diversity (GD) analysis done on molecular profiles of 32 petunia lines (grouped into 4 BLs) and 4 BenchMarks (BMs), obtained with 4,349 SNPs from a ddRADseq approach. Colors and ellipses represent sister line groups. Axes explain the two components with the highest genetic variability and the variability percentage of every component is showed in the line plot.
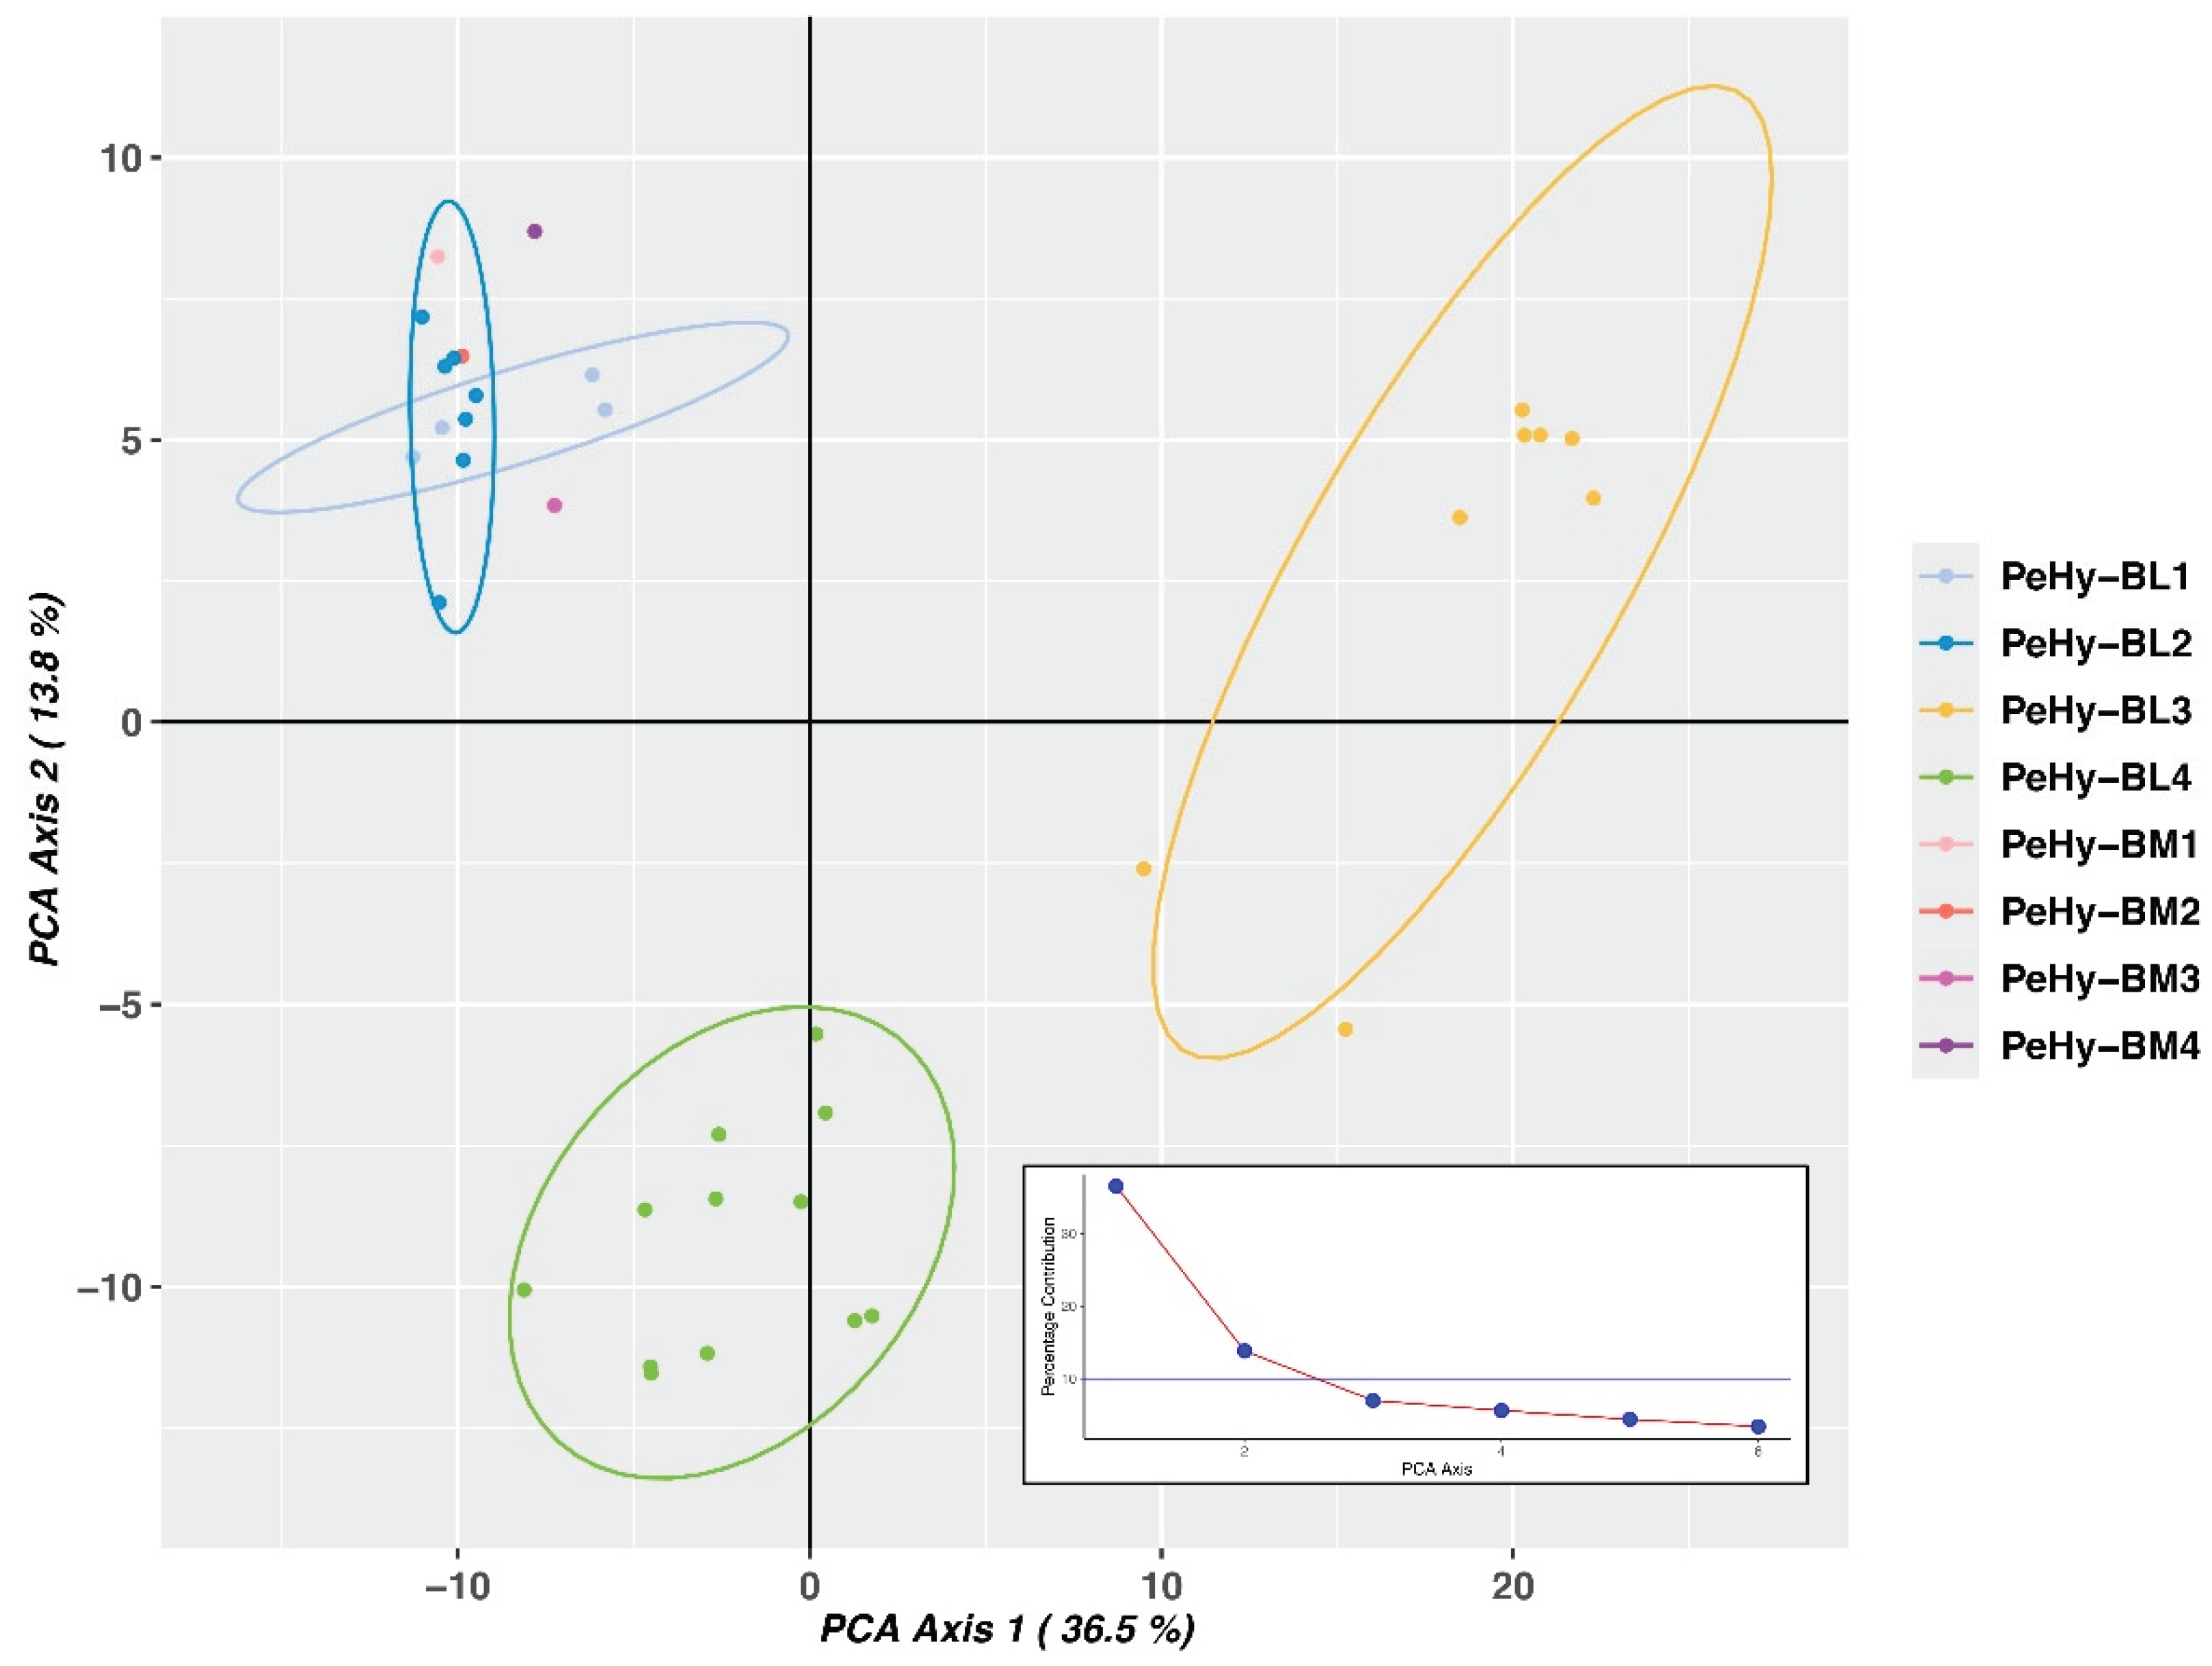
Figure 3.
Unweighted Pair Group Method with Arithmetic Mean (UPGMA) dendrograms based on Genetic Diversity (GD) analysis performed with Nei’s coefficient on ddRADseq SNP profiles of 32 petunia lines (grouped in 4 BL subpopulations) and 4 BenchMarks (BMs), considering different variant filtering. A. MAF > 0.1 (4,349 SNPs). B. MAF >0.3 (1,051 SNPs). C. MAF >0.45 and AvgPIC = 0.3 (103 SNPs). D. MAF >0.3 and AvgPIC = 0.45 (123 SNPs). Numbers on branches represent bootstrap values and colors highlight different clusters, correlated to subpopulations. MAF: minimal Minor Allele Frequency; AvgPIC: average Polymorphic Information Content of the locus.
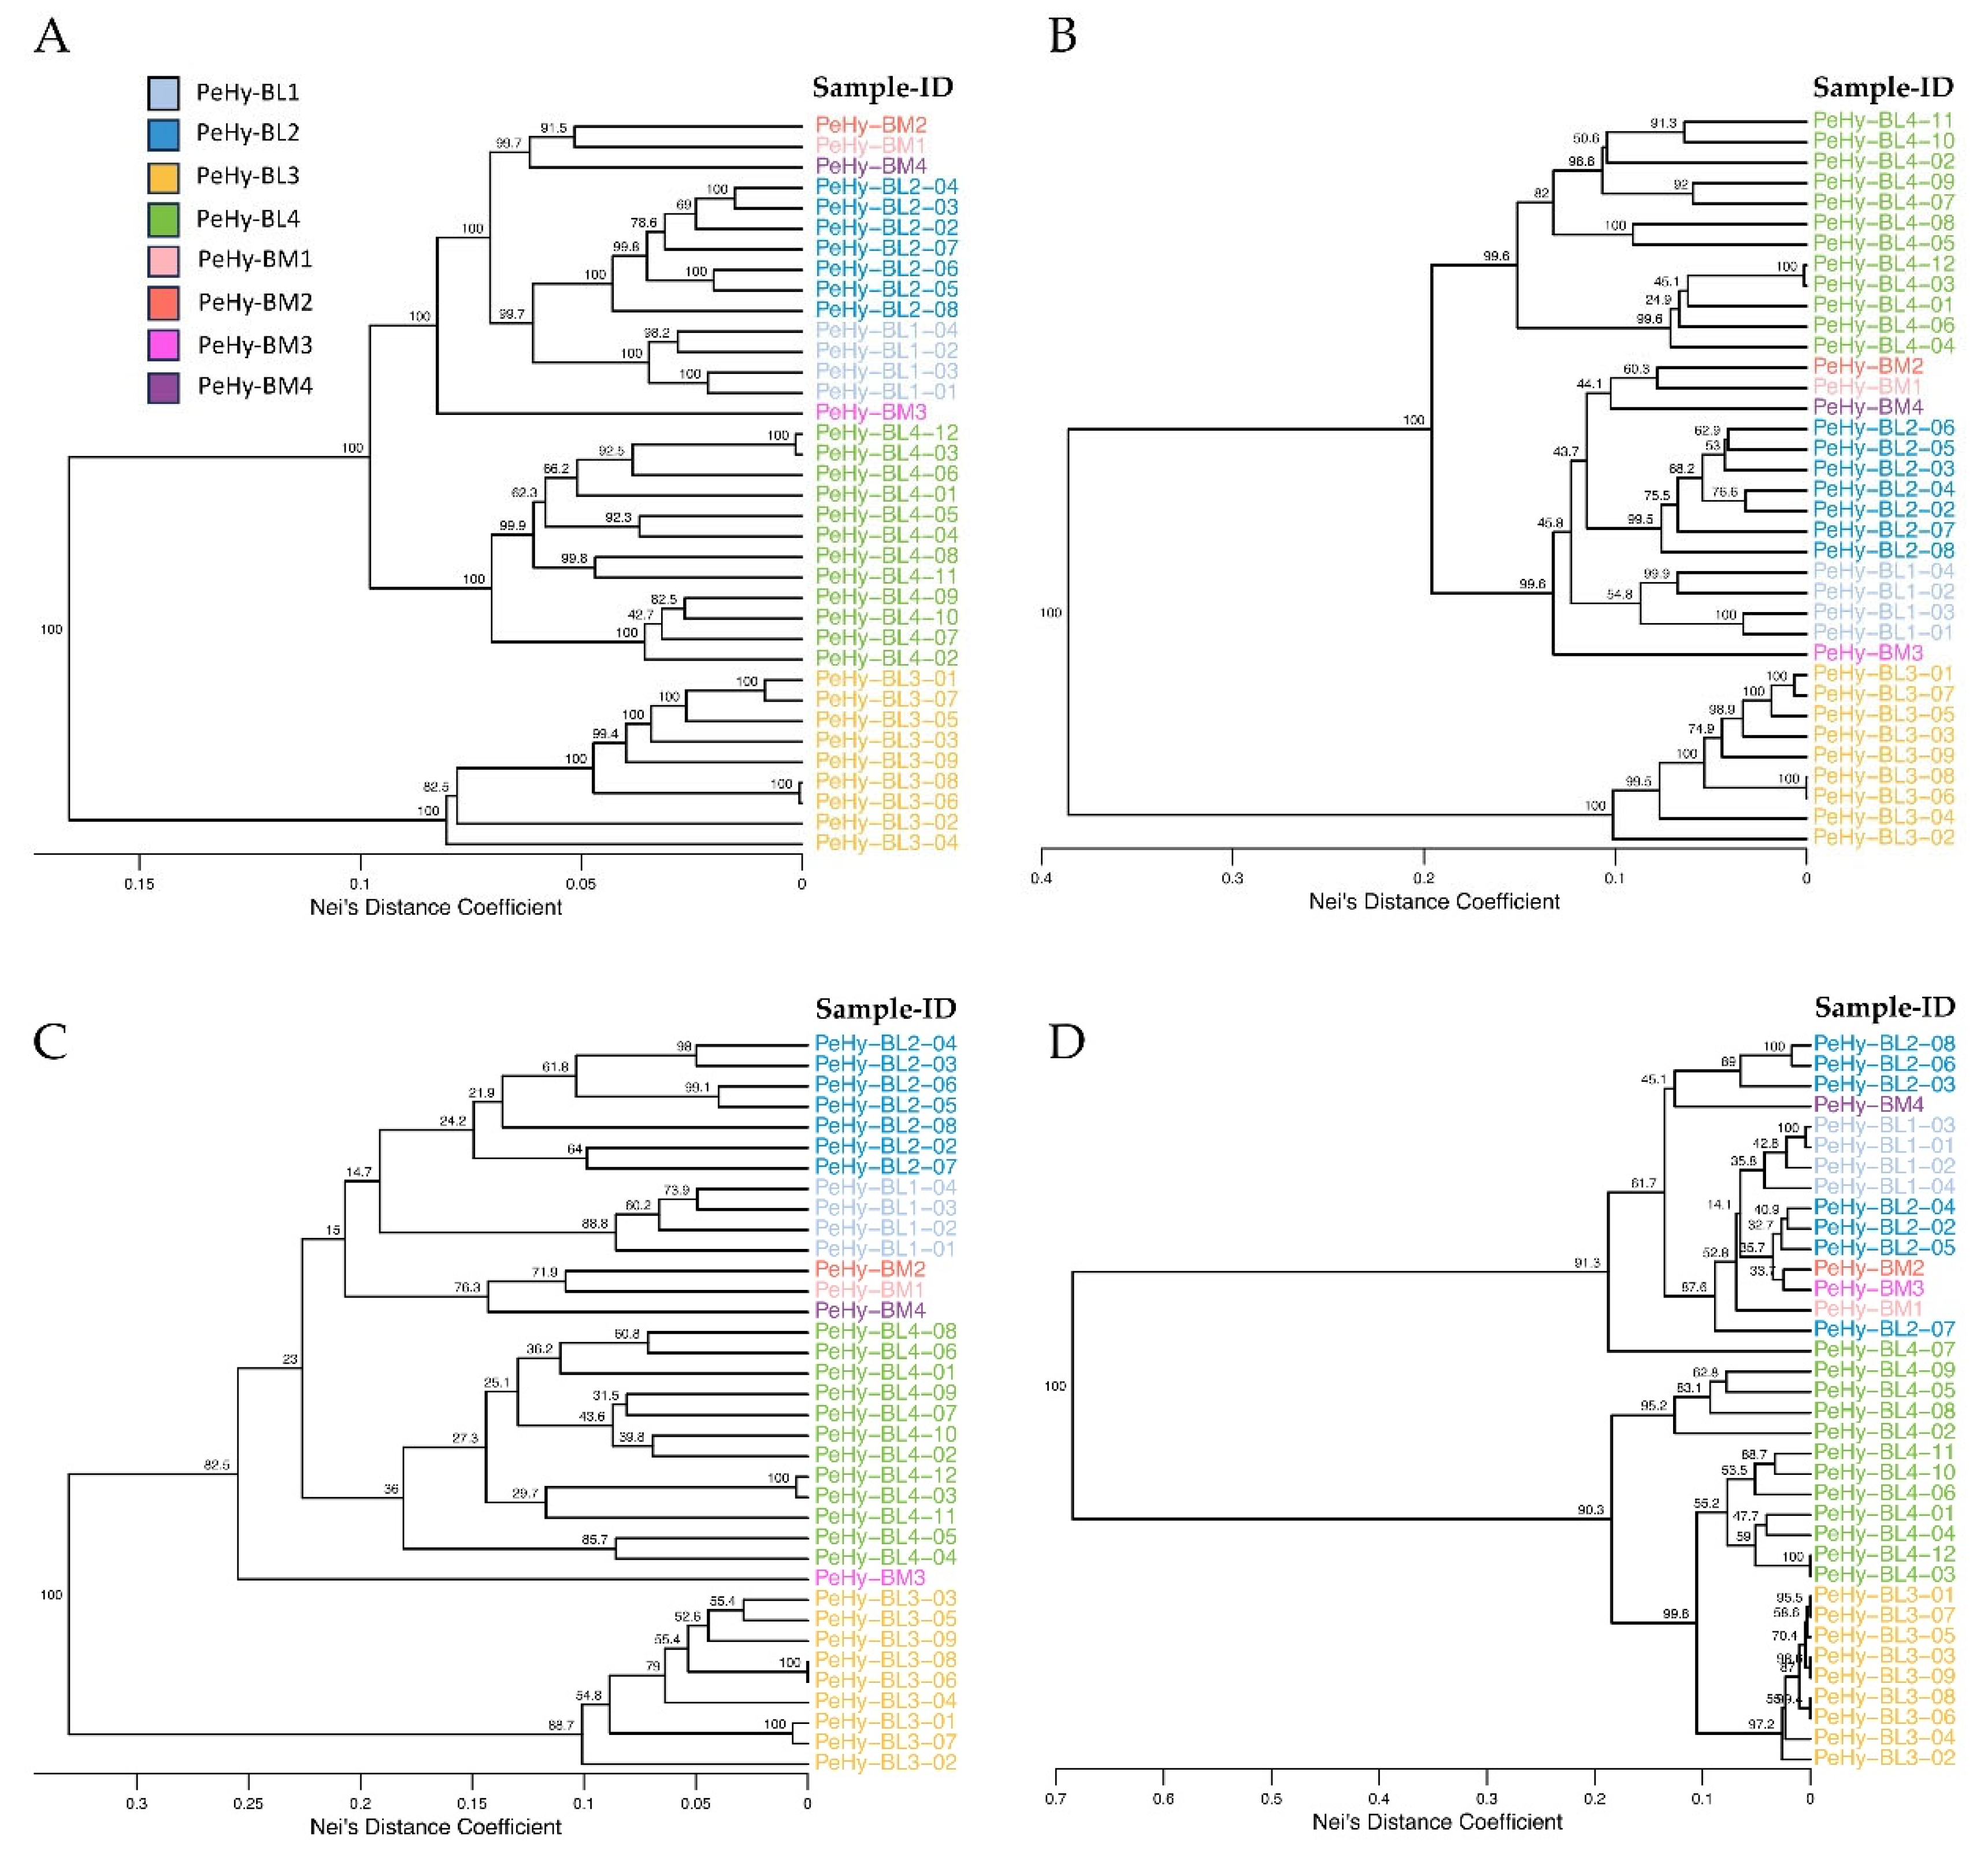
Figure 4.
Physical map of petunia chromosomes comprising 1,975 SNPs located in CDSs from a ddRADseq approach applied to 36 petunia lines. Colors represent the number of SNPs identified within a 1 Mb windows size and black arrows indicate centromere position [26].
Figure 4.
Physical map of petunia chromosomes comprising 1,975 SNPs located in CDSs from a ddRADseq approach applied to 36 petunia lines. Colors represent the number of SNPs identified within a 1 Mb windows size and black arrows indicate centromere position [26].
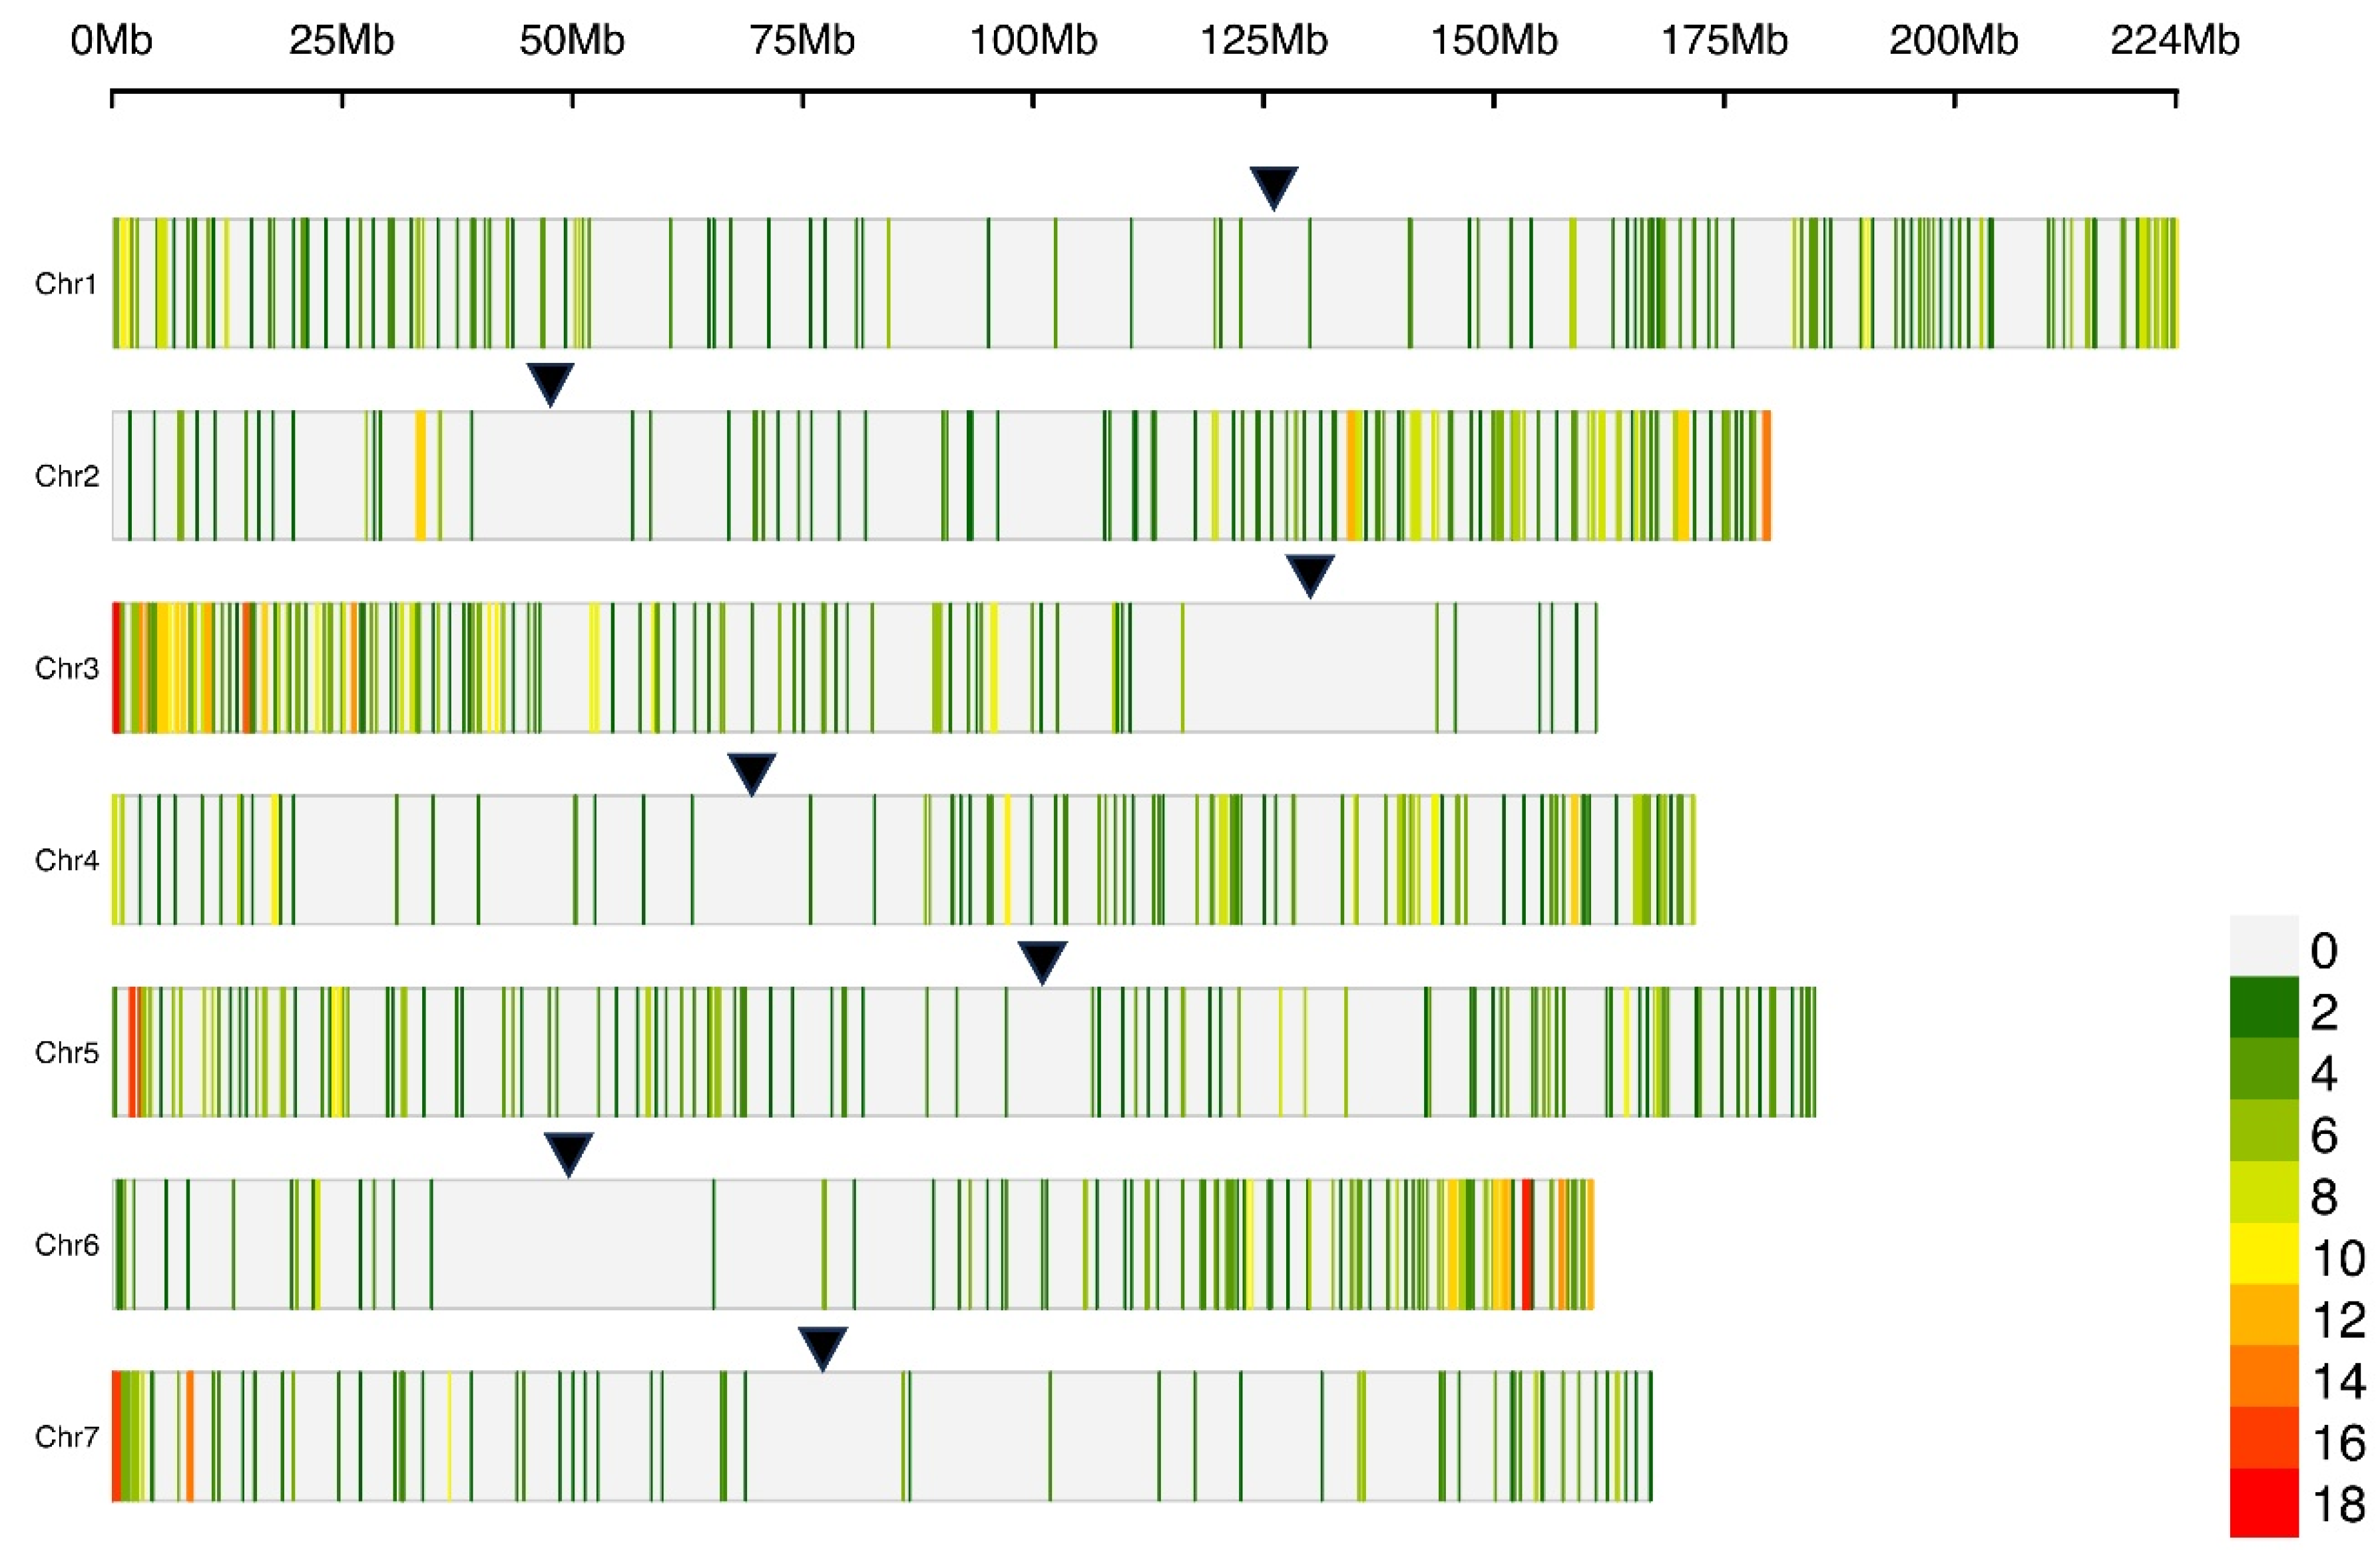

Table 1.
Sequencing results, after raw read quality filtering and mapping, of ddRADseq libraries relative to the 32 petunia clonal lines - divided in four subpopulations (BL1-BL4) - and 4 distinct BenchMarks lines (BM1-BM4). Averages are weighted for the number of lines per subpopulation (N). Mn bases: average number of bases (in millions) sequenced per sample; ≥Q20 Mn Bases: average number of bases (in millions) sequenced per sample with a Phred quality score ≥Q20; Mn Reads: average millions of reads per sample, MRL: Mean Read Length.
| Pop-ID | N | Mn Bases | ≥Q20 Mn Bases | Mn Reads | MRL (bp) |
| PeHy-BL1 | 4 | 486.46 | 416.44 | 3.34 | 160 |
| PeHy-BL2 | 7 | 360.03 | 304.84 | 2.39 | 173 |
| PeHy-BL3 | 9 | 316.36 | 271.88 | 1.99 | 177 |
| PeHy-BL4 | 12 | 267.85 | 230.08 | 1.68 | 178 |
| PeHy-BM1 | 1 | 258.86 | 226.06 | 1.25 | 206 |
| PeHy-BM2 | 1 | 104.60 | 91.09 | 0.50 | 208 |
| PeHy-BM3 | 1 | 469.56 | 399.95 | 3.31 | 141 |
| PeHy-BM4 | 1 | 551.17 | 468.70 | 3.91 | 141 |
| Tot | 36 | 12291.01 | 10528.17 | 80.01 | - |
| Avg | 341.42 | 292.45 | 2.22 | 173 |
Table 2.
Genetic Diversity (GD) with Nei’s coefficient and Fixation index (Fst) matrix based on a pairwise comparison among four sister line groups, comprehending a total of 32 clonal lines.
Table 2.
Genetic Diversity (GD) with Nei’s coefficient and Fixation index (Fst) matrix based on a pairwise comparison among four sister line groups, comprehending a total of 32 clonal lines.
| GD | Cluster | Fst | ||||||
| PeHy-BL2 | ||||||||
| 6.93% | PeHy-BL1 | 0.23 | ||||||
| 10.51% | 9.85% | PeHy-BL4 | 0.23 | 0.22 | ||||
| 19.07% | 26.69% | 28.61% | PeHy-BL3 | 0.50 | 0.45 | 0.34 | ||
| PeHy-BL3 | PeHy-BL4 | PeHy-BL1 | PeHy-BL2 | PeHy-BL2 | PeHy-BL1 | PeHy-BL4 | PeHy-BL3 | |
Table 3.
Genetic statistics calculated from ddRADseq molecular profiles relative to the 4 petunia sister line groups (PeHy-BL1-BL4), with number of individuals (N); average number of observed (na) and expected (ne) alleles per locus; observed (Ho%) and expected (Hs%) Heterozygosity; inbreeding coefficient (Fis); percentage of Polymorphic Loci (PL%) of the total loci in the population; percentage of Private Alleles (PA%) of the total PAs in the population.
| Pop ID | N | na | ne | Ho (%) | Hs (%) | Fis | PL (%) | PA (%) |
| PeHy-BL1 | 4 | 1.36 | 1.27 | 19.05 | 15.02 | -0.27 | 63.75 | 6.38 |
| PeHy-BL2 | 7 | 1.54 | 1.31 | 20.48 | 16.14 | -0.27 | 68.54 | 14.89 |
| PeHy-BL3 | 9 | 1.54 | 1.46 | 26.27 | 22.08 | -0.19 | 73.14 | 33.96 |
| PeHy-BL4 | 12 | 1.66 | 1.55 | 33.57 | 26.17 | -0.28 | 81.88 | 12.75 |
| Avg | 8 | 1.53 | 1.53 | 24.84 | 19.85 | -0.25 | 71.83 | 17.00 |
| StDev | 3 | 0.11 | 0.12 | 5.72 | 4.53 | 0.04 | 6.69 | 10.28 |
Table 4.
Analysis of Molecular Variance (AMOVA) results calculated from ddRADseq molecular profiles relative to 32 petunia clonal Lines (in 4 BLs) and 4 BMs. Degrees of freedom (Df); Sum of Squares (Sum Sq); Mean of Squares (Mean Sq) and Estimated Variance (Est. Var.) are reported.
Table 4.
Analysis of Molecular Variance (AMOVA) results calculated from ddRADseq molecular profiles relative to 32 petunia clonal Lines (in 4 BLs) and 4 BMs. Degrees of freedom (Df); Sum of Squares (Sum Sq); Mean of Squares (Mean Sq) and Estimated Variance (Est. Var.) are reported.
| Df | Sum Sq | Mean Sq | Est. Var. | Est. Var. (%) | |
| Between Subpopulations | 7 | 16100 | 2300 | 490 | 58.19 |
| Within Subpopulations | 28 | 9855 | 352 | 352 | 41.81 |
| Total | 35 | 25955 | 742 | 842 | 100 |
Disclaimer/Publisher’s Note: The statements, opinions and data contained in all publications are solely those of the individual author(s) and contributor(s) and not of MDPI and/or the editor(s). MDPI and/or the editor(s) disclaim responsibility for any injury to people or property resulting from any ideas, methods, instructions or products referred to in the content. |
© 2025 by the authors. Licensee MDPI, Basel, Switzerland. This article is an open access article distributed under the terms and conditions of the Creative Commons Attribution (CC BY) license (http://creativecommons.org/licenses/by/4.0/).
Copyright: This open access article is published under a Creative Commons CC BY 4.0 license, which permit the free download, distribution, and reuse, provided that the author and preprint are cited in any reuse.


