
Submitted:
16 December 2025
Posted:
17 December 2025
You are already at the latest version
Abstract
Environmental contaminants are increasingly recognized as potential drivers of microbial adaptation. This study investigates whether two complex microbial traits, biofilm formation and polycaprolactone (PCL) degradation, are primarily driven by taxonomic affiliation or environmental exposure. A collection of bacterial strains was isolated from distinct environments, including poultry litter (antibiotics) and plastic-contaminated soils. Biofilm formation was quantified while PCL degradation was assessed via clearing-zone assays. Isolates from both taxonomic and metabolic perspective and multivariate analyses to explore the association between trait and environment. Biofilm formation was predominantly observed in multidrug-resistant strains from poultry farming, while PCL degradation was exclusive to strains from plastic-rich environments. Exposure to environmental pollution appears to promote the emergence of microbial traits through ecological selection and plastic responses.
Keywords:
environmental pollution
; biofilm
; plastic degradation
; PLSR
1. Introduction
Microbial communities and their surrounding environments are engaged in a deeply interconnected, bidirectional relationship [1,2,3]. On one hand, microorganisms play an essential role in shaping ecosystem structure and function through nutrient cycling, signaling, and the modulation of host responses [4,5,6,7]. In the plant rhizosphere, plant growth-promoting rhizobacteria (PGPRs)—such as Pseudomonas, Bacillus, and Azospirillum—improve stress tolerance and nutrient acquisition via mechanisms including phytohormone production, nitrogen fixation, and phosphorus solubilization [8,9]. These activities enhance plant productivity and shape the soil microbial community, generating feedback loops that further promote ecosystem resilience [10]. Similarly, in human hosts, the gut microbiota contributes bioactive metabolites like short-chain fatty acids (SCFAs) that are crucial for immune homeostasis, highlighting how microbiomes actively influence host physiology[11]. These examples sustain the idea of an "Ecosystem Microbiome" perspective, that considers microbial function, genome plasticity, and ecosystem-level interactions as a unified framework for understanding ecological dynamics [12].
On the other hand, this equilibrium is increasingly perturbed by anthropogenic pressures [13]. The expansion of urbanization, industrial activities, and intensive agriculture has created environments dominated by emerging contaminants, including antibiotics, microplastics, heavy metals, and pharmaceuticals [14,15]. These stressors influence not only the taxonomic composition of microbial communities but also their evolutionary trajectories. For instance, the persistence of contaminants of emerging concern (CECs) in soils and waterscapes exerts strong selective pressures that favor resistant phenotypes or novel metabolic adaptations[16,17]. Recognizing these risks, recent policy actions—such as the European Commission's directive on emerging pollutants—seek to mitigate their long-term ecological and health implications [18].
Microorganisms, however, do not only suffer the consequences of anthropogenic contaminants. Exposure to CECs has been shown to induce a wide spectrum of microbial responses, from stress tolerance and efflux pump activation to the evolution of novel catabolic pathways enabling biodegradation. For example, Achromobacter piechaudii and Alcaligenes aquatilis can efficiently degrade the non-steroidal anti-inflammatory drug diclofenac [19], while Ideonella sakaiensis utilizes PET hydrolases to depolymerize plastic waste into bioavailable monomers [20]. Similarly, microbial consortia have been shown to transform acetaminophen and steroid hormones, neutralizing their endocrine-disrupting properties [21]. These findings illustrate how microbial communities may not only resist but also functionally respond to contaminant pressure, converting pollutants into substrates or detoxified derivatives.
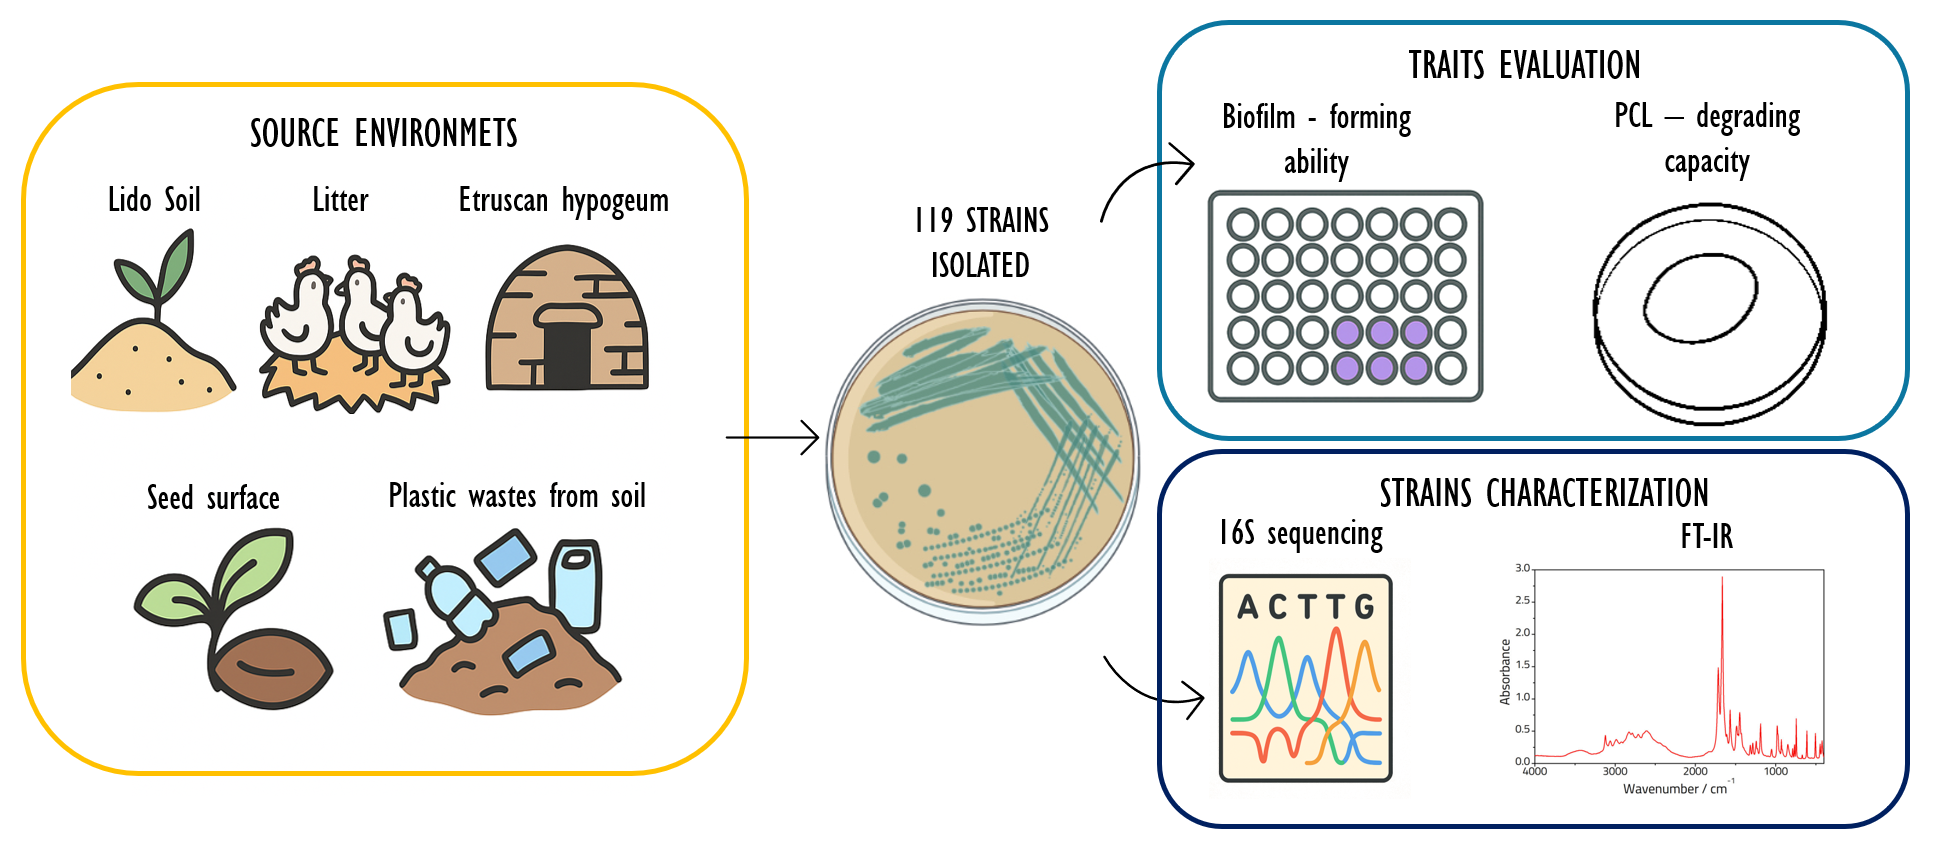
This research explores how anthropogenic environments rich in chemical contaminants act as selective landscapes that drive the emergence and stabilization of microbial phenotypes such as biofilm formation and plastic biodegradation. By integrating phenotypic assays (e.g. crystal violet staining and ), genotypic and metabolic (16S rDNA sequencing and FT-IR) characterization, together with multivariate analyses (PLS, PCoA), we assess whether these traits were taxonomically conserved or environmentally induced. In particular, we test to what extent environmental stressors could induce an adaptive responsethrough mechanisms such as genome plasticity and horizontal gene transfer. This perspective redefines biofilm formation and polymer degradation as dynamic ecological responses. Thus, such traits may not only be selected over time but also induced by specific environmental perturbations.
2. Materials and Methods
2.1. Bacterial Isolation and Cultivation
Environmental samples (Supplementary Table S1) were collected from seven distinct niches: (i) surface soil (0–5 cm depth) from Lido di Spina (Comacchio, FE, Italy), (ii) seeds (Bavicchi S.p.A., Italy), (iii) wall surfaces of the Volumni Hypogeum (Perugia, Italy), (iv) poultry litter, and (v–vii) agricultural soils containing plastic materials (PVC, PLA, Mater-B) that had been buried for one year. The plastics consisted of entire commercial items: a PLA drinking glass, a Mater-B biodegradable shopping bag (Novamont, Italy), and a medical-grade PVC infusion tube, which was cut into about 10 cm segments. Each item type was buried in three technical replicates at 10–15 cm soil depth, to simulate natural environmental exposure conditions. These substrates were selected for their ecological and industrial relevance, as they represent common inputs into soil ecosystems through food packaging, agricultural bioplastics, and healthcare waste.
Seed-associated microbial communities were recovered by immersing seeds in peptone water and agitating at 150 rpm for 30 min. The suspension was centrifuged at 4500 rpm for 10 min, the supernatant discarded, and the pellet retained for analysis. Hypogeal tomb samples were collected using sterile swabs, covering ~20 distinct wall areas to maximize representativeness. Poultry litter was homogenized in sterile phosphate-buffered saline (PBS). For plastics, items were gently brushed to remove adhering soil, submerged in physiological water, and incubated under agitation (150 rpm, 30 min). The resulting suspensions were centrifuged, and pellets were collected. In addition, sterile swabs were used to sample plastic surfaces directly.
All the samples were resuspended in phosphate-buffered saline (PBS), serially diluted, and plated on Brain Heart Infusion (BHI) supplemented with 1,7% Agar (HiMedia Laboratories, Germany) for 24-48 h at 25 °C. Morphologically distinct colonies were sub-cultured and preserved at –80 °C in BHI (HiMedia Laboratories, Germany) broth with 17% glycerol.
2.2. Biofilm Quantification by Crystal Violet Assay
The ability of each bacterial strain to form biofilm was assessed using a standardized crystal violet staining assay in 96-well polystyrene microtiter plates. Each strain was tested in two independent biological replicates; each performed in six technical replicates. Isolates were cultured overnight in BHI (HiMedia Laboratories, Germany) broth at 25 °C. Following incubation, the optical density at 600 nm (OD₆₀₀) was measured, and cell suspensions were adjusted to a standardized OD₆₀₀ of 0.5.
A volume of 150 μL of the standardized bacterial suspension was transferred into each well of the microtiter plate. Plates were incubated at 25 °C for 3 h to allow biofilm priming. After incubation, the planktonic cells were gently removed using a multichannel pipette, and wells were washed three times with sterile phosphate-buffered saline (PBS) to remove non-adherent cells.
Subsequently, 150 μL of fresh BHI supplemented with 1% dextrose was added to each well to support biofilm development. Plates were sealed and incubated for 24 h at 25 °C. Following incubation, wells were washed again three times with PBS as described above.
Biofilm quantification was performed by staining adherent cells with 150 μL of 0.1% (w/v) aqueous crystal violet (CV) solution for 15 minutes at room temperature. Excess stain was removed, and wells were rinsed thoroughly with distilled water to eliminate unbound CV. The amount of retained dye, corresponding to biofilm biomass, was quantified by measuring absorbance at 570 nm using a TECAN Infinite 200 PRO plate reader (Tecan Trading AG, Männedorf, Switzerland).
Densitometric data were recovered from the i-control TECAN interface and transferred to MS Excel. A template was used to automatize the analysis of each plate as described in Corte et al.[22]. The CV values were normalized with the following equation:
2.3. Bacterial DNA Extraction
Total genomic DNA was extracted using a protocol combining chemical and mechanical lysis. Briefly, bacterial pellets from overnight BHI (HiMedia Laboratories, Germany) cultures were centrifuged at 4500 rpm for 3 min, washed in sterile cold water, and resuspended. Cells were lysed using 2.5 mL UREA buffer (8 M urea, 0.5 M NaCl, 20 mM Tris-HCl, 20 mM EDTA) with alternating 5 min incubations at room temperature and 85 °C under mild agitation. Following centrifugation, cell pellets were bead-beaten in the presence of 400 µL Triton-SDS buffer (2% Triton X-100, 1% SDS, 100 mM NaCl, 1 mM EDTA) using a FastPrep homogenizer (6 m/s, 40 s).
Lysates were extracted using 400 µL phenol:chloroform (1:1), centrifuged at 2000 rpm for 4 min, and the aqueous phase recovered. Ethanol precipitation was performed using sodium acetate and 99% ethanol. DNA was treated with RNase A (10 µL of 10 mg/mL) at 37 °C for 30 min and purified through a second precipitation step. Final DNA pellets were washed with 70% ethanol and resuspended in 100 µL molecular-grade water.
2.4. 16S rRNA Amplification and Sanger Sequencing
The 16S rDNA locus was amplified using universal primers 8F (5′- AGAGTTTGATCCTGGCTCAG -3′) and 1492R (5′- GGTTACCTTGTTACGACTT -3′) [23]. PCR amplification was performed in a 25 µL reaction containing 1X Taq buffer, 1.5 mM MgCl₂, 0.2 mM dNTPs, 0.5 µM primers, and 1 U Taq polymerase. Thermal cycling included initial denaturation at 98 °C for 30 sec, 30 amplification cycles (98 ° C for 30 sec., 60° C for 1 min and 72 °C for 45 sec) and a final extension at 72 °C for 5 min. Amplicons were checked on 1% Agarose gel. PCR products were then purified using AMPure XP Beads (Beckman Coulter, Inc. United States) and sequenced using Sanger’s sequencing method EZ-Seq (Macrogen Inc., Seoul, Korea).
2.5. FT-IR Spectroscopy
For FT-IR analysis, selected bacterial strains were cultured in BHI broth supplemented with 1% dextrose (HiMedia Laboratories, Germany) and incubated for 5 h to reach the exponential growth phase. Cells were harvested by centrifugation at 4500 RPM and washed twice with sterile distilled water (HPLC Gradient Grade, J.T. Baker). Pellets were resuspended in 210 μL of pure water.
From each suspension, 35 μL were transferred to an IR-light-transparent silicon microtiter plate (96-well format; Bruker, Germany). Samples were dried at 42 °C to form homogenous films of uniform thickness, minimizing scattering artefacts during spectral acquisition, as described by Roscini et al. [24].
Spectral data were acquired using a TENSOR 27 FT-IR spectrometer equipped with an HTS-XT accessory for rapid automation of the analysis (BRUKER Optics GmbH, Ettlingen, Germany). All measurements were performed in transmission mode. Spectra were recorded in the range between 4000 and 400 cm−1. Spectral resolution was set at 4 cm−1, sampling 256 scans per sample
Data pre-processing and analysis were performed using OPUS software, version 7.0 (Bruker Optics GmbH). Processing steps included quality checks, baseline correction, vector normalization, and the computation of first- and second-order derivatives of spectral data.
Spectral interpretation focused on five diagnostic regions: W1 (3000–2800 cm⁻¹, fatty acids), W2 (1800–1500 cm⁻¹, amide bands), W3 (1500–1200 cm⁻¹, mixed functional groups), W4 (1200–900 cm⁻¹, carbohydrates), and W5 (900–700 cm⁻¹, typing region), following Naumann et al. [25].
2.6. Polycaprolactone (PCL) Plate Clearing Assays
Degradation of polycaprolactone (PCL) was assessed using BHI Agar medium supplemented with an emulsion of PCL. The emulsion was prepared with 1% m/v of PCL in acetone, at 55°C with magnetic stirring. Water, agar (1.7% m/v) and BHI medium (2% m/v) were added to the emulsion, at 50°C with magnetic stirring until the acetone evaporated. The medium was then autoclaved and poured into plates following the protocol of Almeida et al. [26]
2.7. Statistical and Multivariate Data Analysis
Statistical analyses were performed in R (version 4.5.1). Boxplots, violin plots, and Principal Coordinates Analysis (PCoA) were used to evaluate biofilm distribution among niches and genera. Multivariate analysis including PCoA and PLS regression was conducted using the vegan and pls packages to assess relationships between biofilm formation and FT-IR or 16S data. Principal Coordinates Analysis (PCoA) was performed using a Euclidean distance matrix computed from the standardized (z-score scaled) Mean values, representing the average absorbance between biological replicates measured at 570 nm. These values, indicating biofilm-forming capacity, were also used as the response variable in the Partial Least Squares Regression (PLSR) model. Cross-validation for PLS model was performed using a leave-one-out (LOO) approach, and the number of latent variables was selected according to the heuristic √n (approximately 11 components). PLS scores for the first two latent variables were visualized in a two-dimensional space (PLS1 vs PLS2). Variable Importance in Projection (VIP) scores were computed to identify the most informative FT-IR wavenumbers associated with differences in biofilm production. A VIP threshold >1 was considered indicative of relevant features. Phylogenetic trees were reconstructed using the neighbor-joining method on 16S alignments (Muscle algorithm), visualized with ggtree. Bibliometric analysis was conducted using rentrez to evaluate literature associations between genus and biofilm phenotype.
3. Results
3.1. Assessing the Relationship Between Biofilm – Forming Phenotype and the Isolation Environment
The bacterial strains used in this study were isolated from different substrates characterised by specific stressful conditions. The characteristics of each isolation environment were detailed in Table 1.
To assess the ability of isolated microorganisms to form biofilms, the crystal violet assay carried out to detect the presence of the extracellular polymeric substances (EPS) produced by the cells. Absorbance values at 570 nm were plotted for each strain, grouped by their isolation environment (Figure 1)
The distribution of absorbances across the groups showed a non-uniform trend: biofilm forming strains were more frequent among the bacteria isolated from the litter of a poultry livestock, that were also classified as multidrug resistant (MDR) by a previous study [29]. The absorbance values registered in this subset ranged from 0 to over 0.7. In contrast, strains from other environments (saline soil, seeds, hypogeal tomb, plastic - contaminated soil) showed a narrower distribution of absorbance values, generally between 0 and 0.2, with the sole exception of a strain isolated from PLA polymer that exceeded this threshold, representing an exception compared to the general trend.
To support this graphical interpretation, strains were classified into quartiles based on their absorbance values (Table 2).
The analysis showed that in the litter group, 80% of strains fell between the first and second quartiles, while considering the other environments, 80% of the strains were distributed between the third and fourth quartiles. These findings suggested a strong link between environmental pressure—particularly antimicrobial exposure—and the emergence of the biofilm phenotype.
The violin plots show the absorbance at 570 nm (y-axis), used as an indicator of biofilm formation, for 118 bacterial isolates grouped according to the environment in which they were isolated (represented on the x-axis, in different colours). The width of each violin indicates the density of data for each absorbance value reported on the y-axis. The internal distribution highlights the variability within the groups. Isolates from the MDR_c group (multidrug-resistant strains from poultry farms) show significantly higher and more variable biofilm production than other sources.
3.2. Assessing the Relationship Between Biofilm – Forming Phenotype and Taxonomy
The evidence of a heterogeneous distribution of biofilm-forming strains across groups, moved the analysis towards the evaluation of distances among the isolates. With that purpose, a PCoA (Principal Coordinates Analysis) was performed considering the absorbance values at 570 nm (Figure 2).
Although PCoA is commonly employed on multivariate datasets, in this study it was applied to a standardized univariate vector representing biofilm production to visualize patterns of dissimilarity among isolates in a reduced dimensional space. This projection allows for a visual separation of bacterial strains based on biofilm-forming capacity.
Since only one variable was used, all the variability in the dataset is captured by the first coordinate (100% of explained variance), which presented a clear gradient of biofilm - forming ability
Three main phenotypes could be distinguished: highly biofilm – forming strains, located in the extreme positive portion of the axis (values between 3 and 4), moderately biofilm – forming strains (values between 1 and 2), and non biofilm – forming strains, grouped around zero and represented in grey.
Considering both taxonomy and isolation environment, it became evident that strains from distinct genera were represented in all three phenotypic groups, indicating that biofilm-forming capacity is not phylogenetically conserved. In contrast, a marked prevalence of strains from intensive poultry farming was observed in both the highly and moderately biofilm - forming clusters. This could suggest that the variability registered in biofilm formation capacity is not seemingly linked to phylogeny but is more likely the result of environmental selection processes.
3.3. Search for Descriptors Significantly Correlated with Biofilm – Forming Phenotype
Partial Least Squares Regression (PLSR) analysis allows the relationship between a set of independent variables (predictors) and one or more dependent variables (responses) to be modelled. Compared to PCA, that only reflects variance in the predictors, PLS regression uses the predictors to explain the response variable, i.e. biofilm-forming ability. This supervised approach was also used because it could handle two potential limitations in the dataset: the moderate sample size compared to the high-dimensional predictors and the noise due to biological variability among strains in terms of species, niche and stress conditions. A simple linear regression would have suffered of overfitting compared to PLSR that reduced predictors into a smaller set of orthogonal latent variables. Furthermore, PLSR is specifically designed to handle highly correlated predictor variables as in the case of FT-IR spectrum and DNA sequences, overcoming the issue of multicollinearityIn this context, the analysis aimed to verify whether biochemical data obtained from FT-IR spectroscopy or taxonomic information derived from the 16S rRNA region were able to explain and predict the biofilm formation capacity of the bacterial strains isolated. In particular, the focus was on the search of predictive variables able to maximize the separation among the three phenotypes (high, medium, none biofilm-forming), with the aim of constructing a model that could also be used to predict new isolates.
To improve model performance and robustness, predictors (both FT-IR wavenumbers and 16S aligned bases) were standardized using z-score transformation. This autoscaling procedure ensures that all variables contribute equally to the model, preventing bias toward high-intensity spectral features or highly variable sequence positions.However, the score plots generated by the PLSR analysis (Figure 3 a and b) showed a clear lack of significant separation, regardless of the type of descriptors used. Both in the case of FT-IR data, which reflect the overall biochemical composition of the samples, and in the case of information derived from the 16S profile, the points in the graph were largely overlapping. Therefore, neither of the two components considered was able to distinguish the strains in the dataset into the groups indicated by PCoA (Figure 2).
Cross-validation of the PLSR models (computed using a leave-one-out approach) indicated that the predictive capacity of both FTIR and 16S datasets was limited. For the spectral data, the Root Mean Squared Error of Prediction (RMSEP) curve showed that the model performed best with only a small number of latent components (2–3) (Supplementary figure 1a ). Adding further components did not improve prediction accuracy, suggesting the absence of additional informative signal in the FTIR dataset. In contrast, the analysis based on 16S rRNA sequence data yielded a flat RMSEP profile (Supplementary figure 1b), indicating that the number of latent components had minimal effect on predictive error. This pattern suggests that the underperformance of the models is not due to methodological issues, but rather reflects the intrinsic heterogeneity of the strains and the weak association between molecular markers (spectral or taxonomic) and the biofilm phenotype.To confirmsuch an association between predictors and biofilm -forming ability, Variable Importance in Projection (VIP) scores were extracted from PLSR model (Figure 4 a and b). VIPs quantify the contribution of each predictor variable (e.g., wavenumbers or nucleotide positions) to the PLSR components that predict Y (biofilm-forming phenotype). In other words, they highlight which predictor is the most influential in predicting biofilm phenotype. All the VIPs considered were below the accepted significance threshold (reference value = 1), indicating that none of the predictors examined, either biochemical or genetic, showed a sufficiently strong correlation with the biofilm-forming phenotype.
3.4. Distribution of Biofilm – Forming Phenotype Within the Phylogenetic Tree
To further assess whether the biofilm-forming phenotype is conserved or environmentally induced, a phylogenetic analysis was performed using 16S rRNA gene sequences aligned and reconstructed via the neighbour-joining method (Figure 5). At the terminal nodes, annotations included genus, isolation environment, and biofilm production (as absorbance at 570 nm).
As expected, the resulting tree showed a clear separation between Gram-positive and Gram-negative bacteria. However, biofilm formation did not correlate with specific taxonomic lineages. The phenotype was distributed across phylogenetically distant taxa, indicating a lack of phylogenetic conservation. In addition, it seems that the character appeared separately more times in the evolution, suggesting convergent evolution or horizontal gene transfer
Conversely, a higher frequency of biofilm-forming strains was observed among multidrug-resistant (MDR_c) isolates from poultry environments, suggesting a strong influence of environmental selective pressures, such as chronic exposure to antibiotics, on the emergence of adaptive traits like biofilm formation.
To complement this, a genus-level bibliometric survey (Supplementary Table 2) was conducted. For each genus isolated in this study, a PubMed search was performed to quantify co-occurrences with the keyword “biofilm”, excluding common negation patterns (e.g., "non-biofilm forming", "biofilm-negative") to focus on positive associations. This aimed to test whether the biofilm phenotype was a commonly reported genus-specific trait or possibly induced under environmental stress.
The genera most frequently associated with biofilm in literature were Staphylococcus (14,421), Pseudomonas (13,536), and Escherichia (8,750). Also notable were Bacillus, Enterobacter, Klebsiella, and Acinetobacter, each ranging between 2,000 and 3,000 mentions. These trends align with our experimental observations, supporting that in such genera, biofilm formation may represent a more conserved or recurrently selected trait.
In contrast, genera like Proteus (583 associations) and especially Kurthia (only 4 associations) showed a much lower bibliographic frequency. Despite this, strains from these genera in our study produced moderate to high levels of biofilm—particularly when isolated from MDR environments. This suggests that in these cases, the phenotype may not be phylogenetically inherited but rather acquired in response to environmental stress. These findings suggest that if taxonomic affiliation did not reliably predict biofilm phenotype, still the taxonomic position of the bacteria may hint at their potential for biofilm formation. A more deepen analysis is necessary to establish if this observation can be transformed into a probabilistic score linked to each genus to predict the biofilm – forming ability
3.5. Relationship Between Biofilm – Forming Phenotype and the Polycaprolactone Degradation Capacity
Several studies reported a positive association between the presence of biofilm and the degradation of various plastic polymers, to the extent that biofilms are considered facilitators of plastic degradation, as they promote microbial adhesion, enzymatic stabilisation and the creation of a favourable microenvironment.
In order to evaluate this relationship between biofilm – forming phenotype and the polymer degradation capacity, a qualitative test was conducted on a plate containing an emulsion of BHI and polycaprolactone (PCL). The degradative capacity was assigned when zones of clearing were detected around the colony, indicative of enzymatic digestion of the polymer.
Polycaprolactone (PCL) was selected as a model substrate for assessing polymer degradation potential because it is an aliphatic polyester with ester linkages that are hydrolysable by a wide range of microbial enzymes, particularly esterases and lipases [30]. Thus, it could provide a rapid and sensitive screening of degradative potential. Although PCL itself is less prevalent in the environment, its degradation serves as an informative proxy for microbial capacity to attack synthetic polymers with hydrolysable backbones, such as PLA and related polyesters. In this study, PCL was therefore used as an initial model to evaluate whether isolates from plastic-contaminated soils retained general enzymatic potential for polymer degradation
The results show that most of the strains analysed (109 out of 118) did not exhibit degradative activity towards PCL. Only 9 strains showed polycaprolactone-hydrolyzing capacity. All these strains were isolated from environments containing plastics buried in the soil.
Furthermore, comparative analysis between degradation capacity and biofilm formation showed no significant correlation. The resulting p value was 0.2735 (wilcox.test , stats package, version 4.5.1), which agreed with the evidence thatstrains that showed sign of degradation capacity could be classified in the non biofilm – forming group, likewise none of the strains classified as highly or moderately biofilm-forming showed activity against PCL. These data confirm that the two phenotypes represent distinct and independent functional traits.
Figure 6.
Relationship between biofilm production and the ability to degrade polycaprolactone (PCL) in isolated bacterial strains.
Figure 6.
Relationship between biofilm production and the ability to degrade polycaprolactone (PCL) in isolated bacterial strains.
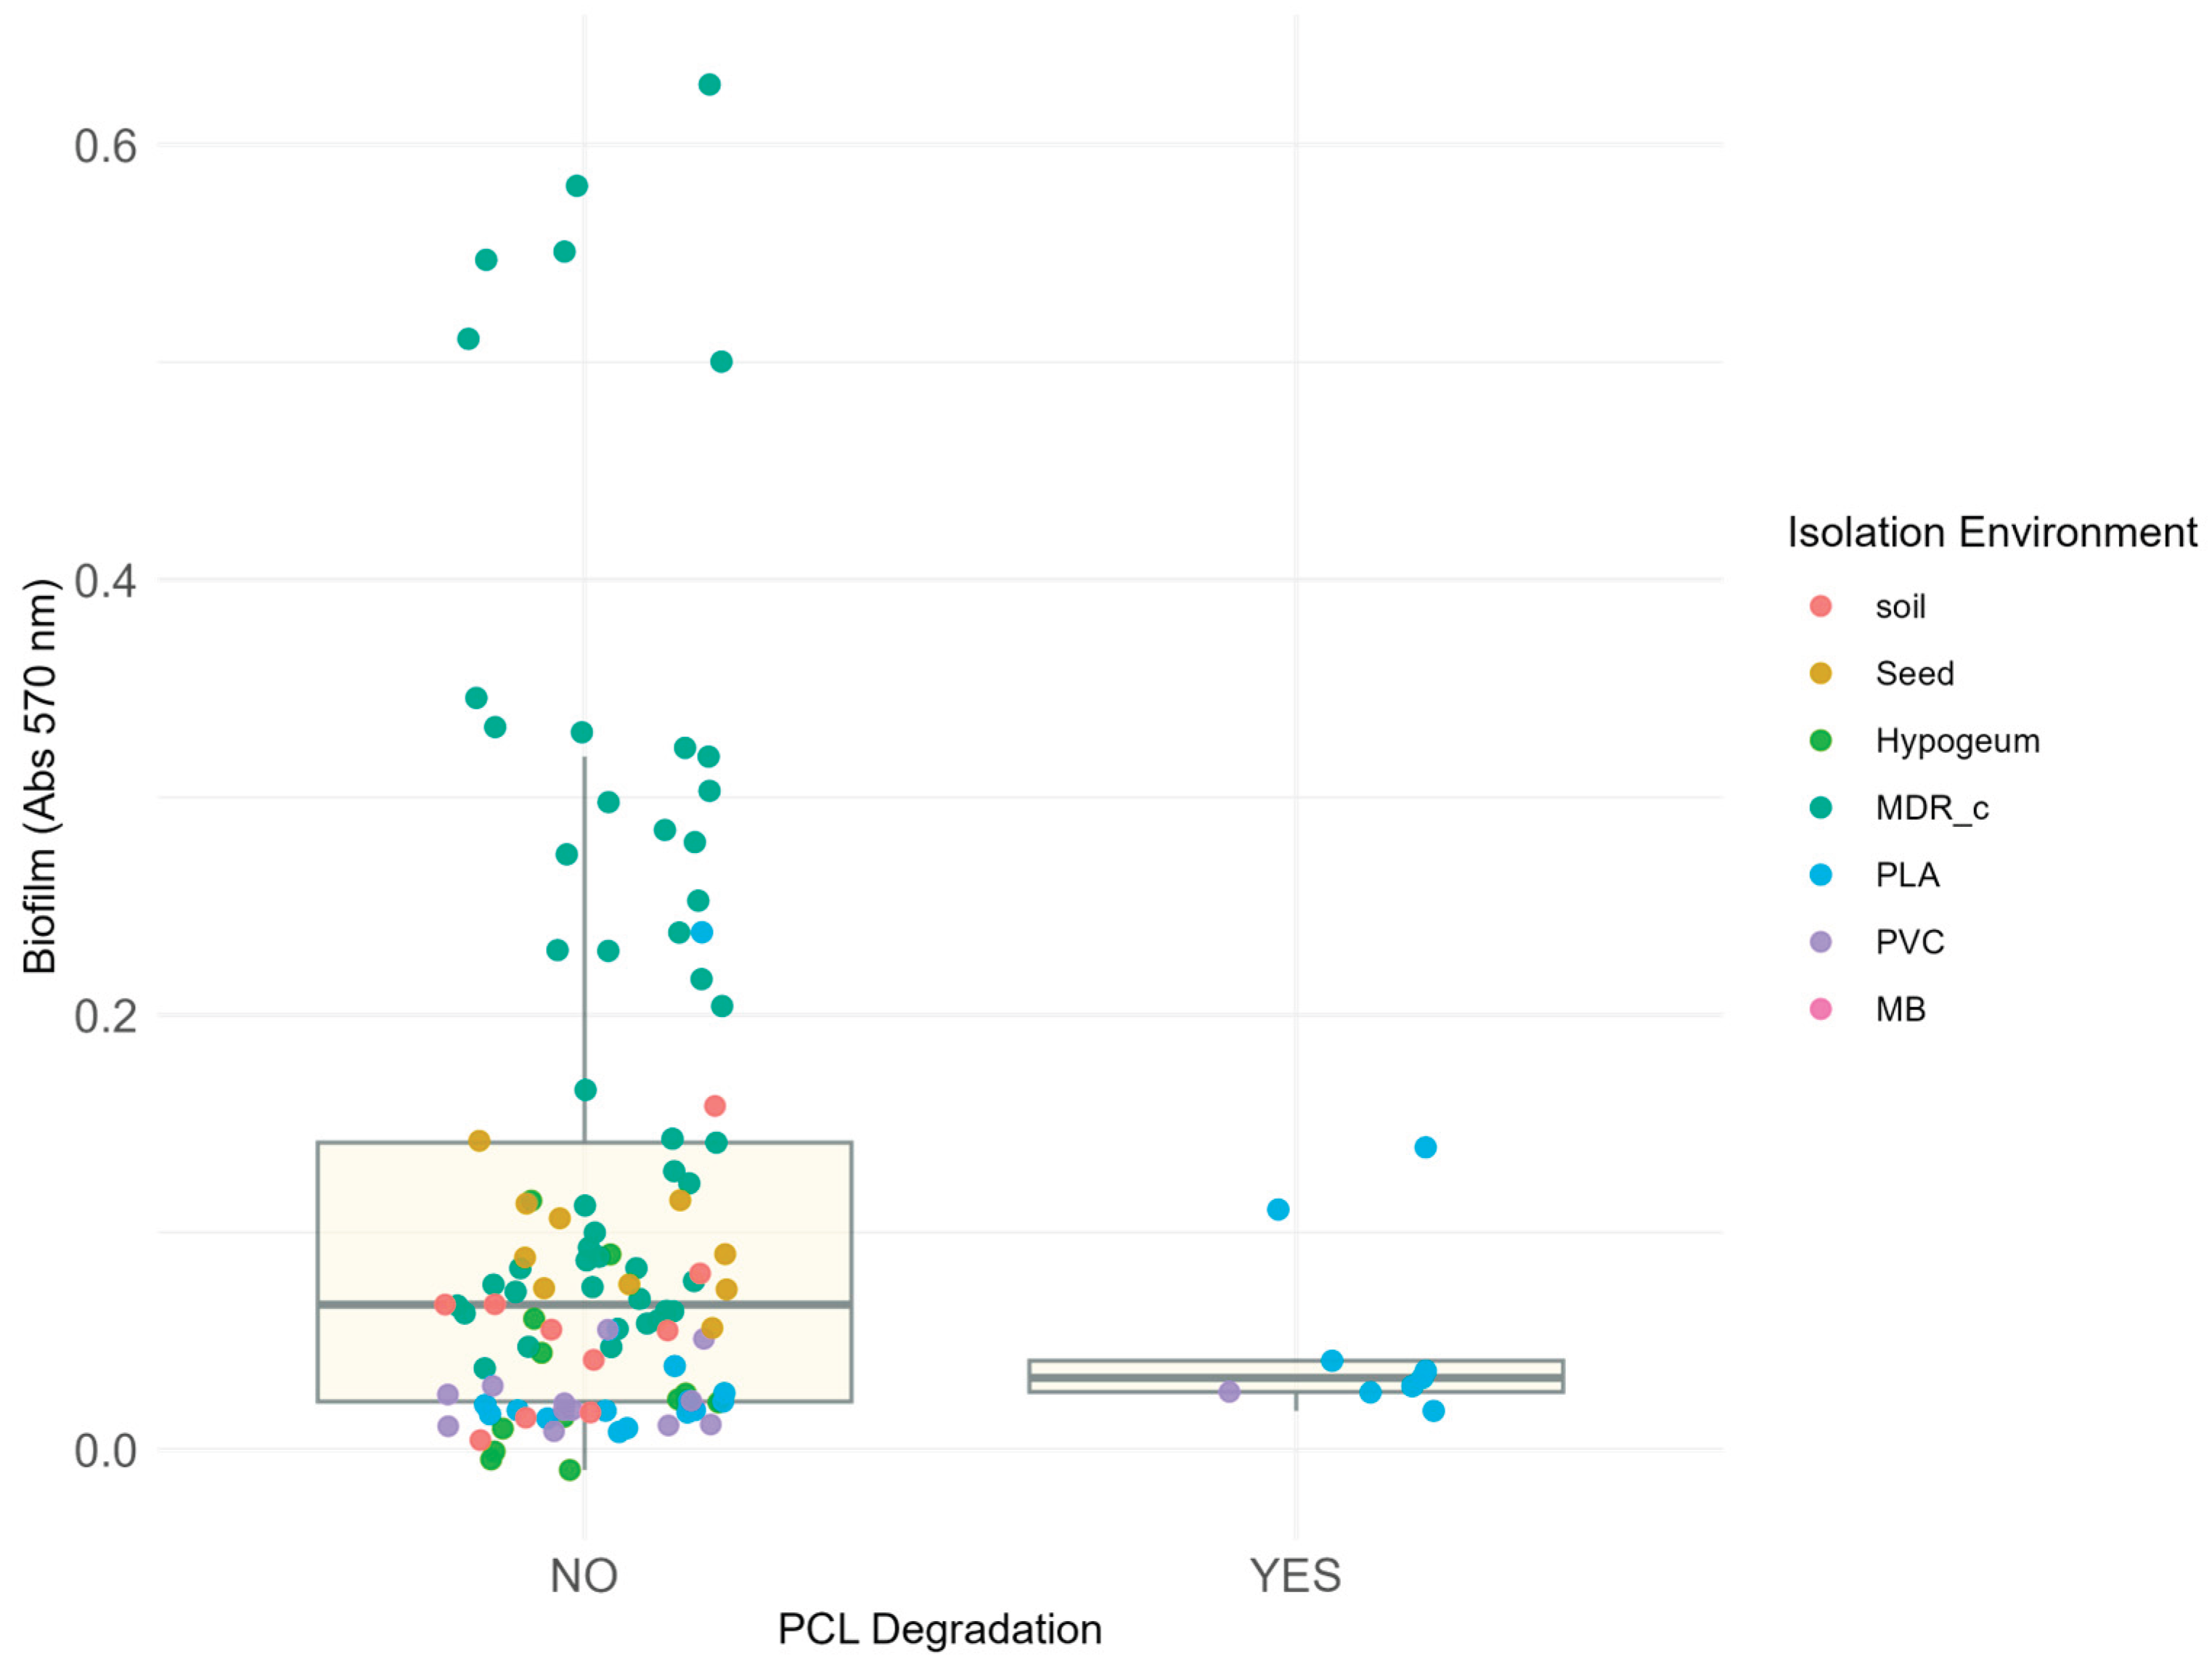
The figure shows the absorbance at 570 nm (y-axis) as a function of the ability to degrade PCL (x-axis), classified into two categories: “NO” for strains in which no degradation halo was observed and “YES” for strains around which a degradation halo formed. Each point corresponds to a bacterial isolate, coloured according to the isolation environment. Only 9 strains showed this ability, all coming exclusively from polymer matrices (PLA - blue and PVC - lilac) previously buried in the soil. It should be noted that the latter are characterised by low absorbance values at 570 nm, indicating a poor correlation between biofilm production and degradative capacity. Conversely, all highly biofilm-producing strains are classified in the area of the graph indicating no degradation (points corresponding to “NO”). The box plots indicate the average absorbance and statistical distribution of the two categories.
3.6. Discussion
This study investigated the emergence of complex microbial phenotypes—specifically, biofilm formation and plastic degradation—under chronic exposure to environmental stressors [31,32]. The experimental design included strains isolated from distinct environments affected also by anthropogenic contamination, such as the presence of antibiotics or plastics.
Strains were tested for their biofilm – forming ability together with the capacity of degrading polycaprolactone, synthetic polyester that has previously been used as a model substrate to assess both PETase and cutinase enzymatic activities [33]. To better characterize the isolates, 16S sequencing and FT- IR analyses were performed [34].
The first evidence was the non-uniform distribution of biofilm – forming phenotype among the environment evaluated with this study: measures carried out on EPS production showed that strains isolated from poultry farming were more prone to synthetize it in higher quantity. This evidence was confirmed by Kaplan and colleagues [35] who reviewed studies that demonstrated how a variety of chemically distinct antibiotics could significantly induce biofilm formation in phylogenetically diverse Gram-negative and Gram-positive bacteria, in vitro. They also clarified that there is no single mechanism of antibiotic-induced biofilm formation, but a global response to cell stress. Similarly, experiments carried out on Enterococcus faecalis, showed that there could be more than 50% increase in biofilm following exposure to numerous classes of antibiotics [36]. The same results were observed in Acinetobacter baumannii during serial exposure to sub-inhibitory antibiotics [37]. Taken together these studies indicate that exposure to sub-inhibitory levels of antibiotics could act as powerful inducers of biofilm formation, which reinforce the trend identified with the strains isolated from poultry farming.
Intriguingly, there are evidence of a bidirectional relationship between antibiotic-induction of biofilm and biofilm- contribution to the spread of multidrug-resistant (MDR) profile. Shree and colleagues [38] suggested that the biofilm plays a crucial role in acquiring antibiotic resistance. In fact, biofilm formation favours a microenvironment with internal cells more protected and thus exposed to lower drug concentrations, a situation know to induce higher adaptation to antibiotics [39]. Our data also presented a similar connection in fact, with a previous study [29] in poultry isolates, there was assessed that strains detected as biofilm – forming were also classified as MDR. Further confirmation of that positive feedback came from other studies [40,41] which observed a significant relationship between biofilm formation capability and multiple drug resistance.
Another finding, confirmed both by PCoA clustering and phylogenetic tree, was that biofilm-forming capacity did not align with taxonomic clusters. From the former analysis, in fact, three subgroups were detected: highly, moderate and non-biofilm forming phenotypes. The strains included in the first two categories belonged to different genera but were mostly isolated from poultry environment. Agreeing with such a result, the phylogenetic tree demonstrated how the ability to produce biofilm was distributed transversally throughout the tree present in both Gram-positive and Gram-negative bacteria and not associated with genetic similarity but rather with belonging to the same environment, i.e. poultry farming, as reported above.
Moreover, PLSR models using both FT-IR-derived biochemical features and 16S-based phylogenetic profiles failed to predict biofilm forming capacity, reinforcing the idea that this phenotype was not genus related.
The bibliometric survey provided complementary evidence: genera frequently associated with biofilm in the literature (e.g., Klebsiella, Escherichia, Staphylococcus) likely possess an intrinsic or recurrently selected biofilm-forming potential. However, the occurrence of robust biofilm production in rarely associated genera such as Kurthia and Proteus, particularly from contaminated environments, suggested a more context-dependent induction, supporting the hypothesis of environmental imprinting.
The adaptive and plastic response to specific environmental stresses could be extended to the ability to degrade polycaprolactone (PCL), a cutin analog, which was registered only in isolates from plastic-contaminated soils. Interestingly, none of the strong biofilm producers exhibited PCL-degrading activity, highlighting the independence of these two phenotypes. Such results could appear in contrast with the concept of plastisphere which is the combination of biofilm and microplastic, a necessary condition for physical and chemical degradation of plastic in marine ecosystem [42,43,44]. A possible explanation could be given considering the intrinsic difference between soil and marine environments; biofilms were found to be dominant in stream ecosystems, characterized by a fast flow of water and continuous export of nutrients and organic matter.
Thus, assessing the biofilm – forming ability of strains isolated from different sources and evaluating their PCL degradation capacity we highlighted the prominent role of environmental stressors in shaping microbial functional traits, as also indicated by Casagrande Pierantoni who studied the attachment and growth response Candida sessile cells when exposed to different temperature [45]. Our suggestion is that such traits could emerge not as conserved taxonomic features, but as adaptive responses to human-induced pressures, such as antibiotic pollution or microplastic accumulation. This scenario suggests that many of these traits are indeed adaptive and that they arise when it is necessary to improve the bacterial fitness. These phenomena are likely very frequent and therefore produce convergent evolution of different lineages toward analogous phenotypes. A more detailed analysis of the phylogenetic characteristics of these traits is necessary to confirm this hypothesis.
From a clinical point of view, the fact that antibiotic-rich environments select for stronger biofilm-forming capacities highlights a potential risk factor for persistence and multidrug resistance in pathogens. Conversely, in environmental settings, the same stress-driven adaptability may be advantageous for human applications, for example in promoting microbial communities capable of degrading complex polymers such as PLA. Our study provides a mechanistic framework that helps contextualize how microbial plasticity contributes both to challenges (e.g., MDR infections) and opportunities (e.g., microbial biotransformation of anthropogenic compounds).
4. Conclusions
Results obtained with this study provide experimental support to the concept that complex microbial traits, such as biofilm formation and plastic degradation, can be induced under chronic exposure to contaminants of emerging concern (CECs). In fact, strains isolated from poultry farming, a known reservoir of antibiotics, displayed a strong biofilm – forming phenotype compared to isolates exposed to different stressors, despite being phylogenetically diverse. Similarly, the ability to catabolize biodegradable aliphatic polyesters (such as PCL and PLA) was detected only in strains isolated from PLA-containing soils. Interestingly, data evidenced that biofilm – forming ability did not correlate with PCL degradation capacity. These results suggested the active role of environmental conditions, particularly anthropogenic stressors like antibiotics or plastics, in shaping microbial phenotypes in a convergent and potentially heritable manner. This work highlighted the plasticity of bacteria in contaminated environments, offering insights into how microorganisms adapt to modern pollutants.
Supplementary Materials
The following supporting information can be downloaded at the website of this paper posted on Preprints.org.
Author Contributions
For research articles with several authors, a short paragraph specifying their individual contributions must be provided. The following statements should be used “Conceptualization, A.C. and G.C.; methodology, A.C and B.S .; software, A.C and D.C.P.; validation, D.C.P and L.C., formal analysis, A.C, D.C.P ; investigation, L.F resources, G.C .; data curation, A.C, D.C.P.; writing—original draft preparation, A.C.; writing—review and editing, L.C and L.F.; visualization, D.C.P and B.S.; supervision,G.C.; project administration, G.C.; funding acquisition, G.C. All authors have read and agreed to the published version of the manuscript.” Please turn to the CRediT taxonomy for the term explanation. Authorship must be limited to those who have contributed substantially to the work reported.
Funding
This work has been funded by the European Union – NextGenerationEU under the Italian Ministry of University and Research (MUR) National Innovation Ecosystem grant ECS00000041 – VITALITY – CUP J97G22000170005. g.
Informed Consent Statement
Not Applicable.
Informed Consent Statement
Not Applicable.
Data Availability Statement
The original contributions presented in this study are included in the article/Supplementary Material.
Conflicts of Interest
The authors declare no conflicts of interest.
Abbreviations
The following abbreviations are used in this manuscript:
| PCL | Polycaprolactone |
| PLSR | Partial Least Squares Regression |
| PCoA | Principal Coordinates Analysis |
References
- Finlay, B.J.; Maberly, S.C.; Cooper, J.I. Microbial diversity and ecosystem function. Oikos 1997, 209–213. [Google Scholar] [CrossRef]
- Nivedita, S.; Behera, S.S.; Behera, P.K.; Parwez, Z.; Giri, S.; Parida, S.R.; Ray, L. Microbial Ecology to Manage Processes in Environmental Biotechnology; Springer: Microbial Niche Nexus Sustaining Environmental Biological Wastewater and Water-Energy-Environment Nexus, 2025; pp. 665–704. [Google Scholar]
- Lin, M.; Schwarz, J.R. Seasonal shifts in population structure of Vibrio vulnificus in an estuarine environment as revealed by partial 16S ribosomal DNA sequencing. FEMS Microbiol. Ecol. 2003, 45, 23–27. [Google Scholar] [CrossRef] [PubMed]
- Ortíz-Castro, R.; Contreras-Cornejo, H.A.; Macías-Rodríguez, L.; López-Bucio, J. The role of microbial signals in plant growth and development. Plant Signal. Behav. 2009, 4, 701–712. [Google Scholar] [CrossRef]
- Jenner, R.G.; Young, R.A. Insights into host responses against pathogens from transcriptional profiling. Nat. Rev. Microbiol. 2005, 3, 281–294. [Google Scholar] [CrossRef]
- Madsen, E.L. Microorganisms and their roles in fundamental biogeochemical cycles. Curr. Opin. Biotechnol. 2011, 22, 456–464. [Google Scholar] [CrossRef] [PubMed]
- Kinane, D.F.; Preshaw, P.M.; Loos, B.G. Working Group 2 of Seventh European Workshop on Periodontology. Host-response: understanding the cellular and molecular mechanisms of host-microbial interactions - Consensus of the Seventh European Workshop on Periodontology. J. Clin. Periodontol. 2011, 38, 44–48. [Google Scholar] [CrossRef]
- Kong, Z.; Liu, H. Modification of Rhizosphere Microbial Communities: A Possible Mechanism of Plant Growth Promoting Rhizobacteria Enhancing Plant Growth and Fitness. Front. Plant Sci. 2022, 13, 920813. [Google Scholar] [CrossRef]
- Goldstein, A.H.; Braverman, K.; Osorio, N. Evidence for mutualism between a plant growing in a phosphate-limited desert environment and a mineral phosphate solubilizing (MPS) rhizobacterium. FEMS Microbiology Ecology 1999, 30(4), 295–300. [Google Scholar] [CrossRef]
- Zhou, H.; Tang, L.; A Fenton, K.; Song, X. Exploring and evaluating microbiome resilience in the gut. FEMS Microbiol. Ecol. 2025, 101. [Google Scholar] [CrossRef]
- Wilmes, P.; Martin-Gallausiaux, C.; Ostaszewski, M.; Aho, V.T.; Novikova, P.V.; Laczny, C.C.; Schneider, J.G. The gut microbiome molecular complex in human health and disease. Cell Host Microbe 2022, 30, 1201–1206. [Google Scholar] [CrossRef]
- Zhu, Y.; Zhu, D.; Rillig, M.C.; Yang, Y.; Chu, H.; Chen, Q.; Penuelas, J.; Cui, H.; Gillings, M. Ecosystem Microbiome Science. mLife 2023, 2, 2–10. [Google Scholar] [CrossRef]
- Bosch, T.C.G.; Wigley, M.; Colomina, B.; Bohannan, B.; Meggers, F.; Amato, K.R.; Azad, M.B.; Blaser, M.J.; Brown, K.; Dominguez-Bello, M.G.; et al. The potential importance of the built-environment microbiome and its impact on human health. Proc. Natl. Acad. Sci. 2024, 121. [Google Scholar] [CrossRef]
- Sauvé, S.; Desrosiers, M. A review of what is an emerging contaminant. Chemistry Central Journal 2014, 8(1), 15. [Google Scholar] [CrossRef]
- Salimi, M.; Esrafili, A.; Gholami, M.; Jafari, A.J.; Kalantary, R.R.; Farzadkia, M.; Kermani, M.; Sobhi, H.R. Contaminants of emerging concern: a review of new approach in AOP technologies. Environ. Monit. Assess. 2017, 189, 414–414. [Google Scholar] [CrossRef]
- Qin, D.; Chen, T.; Adyari, B.; Kiki, C.; Sun, Q.; Yu, C.-P. Responses of microbial community to the selection pressures of low-concentration contaminants of emerging concern in activated sludge. J. Hazard. Mater. 2025, 490, 137880. [Google Scholar] [CrossRef]
- Shah, B.A.; Malhotra, H.; Papade, S.E.; Dhamale, T.; Ingale, O.P.; Kasarlawar, S.T.; Phale, P.S. Microbial degradation of contaminants of emerging concern: metabolic, genetic and omics insights for enhanced bioremediation. Front. Bioeng. Biotechnol. 2024, 12, 1470522. [Google Scholar] [CrossRef] [PubMed]
- Gomes, I.B. The overlooked interaction of emerging contaminants and microbial communities: a threat to ecosystems and public health. J. Appl. Microbiol. 2025, 136. [Google Scholar] [CrossRef] [PubMed]
- Mohamed, M.S.M.; Asair, A.A.; Fetyan, N.A.H.; Elnagdy, S.M. Complete Biodegradation of Diclofenac by New Bacterial Strains: Postulated Pathways and Degrading Enzymes. Microorganisms 2023, 11, 1445. [Google Scholar] [CrossRef] [PubMed]
- Qi, X.; Ma, Y.; Chang, H.; Li, B.; Ding, M.; Yuan, Y. Evaluation of PET Degradation Using Artificial Microbial Consortia. Front. Microbiol. 2021, 12, 778828. [Google Scholar] [CrossRef]
- Akay, C.; Tezel, U. Biotransformation of Acetaminophen by intact cells and crude enzymes of bacteria: A comparative study and modelling. Sci. Total. Environ. 2020, 703, 134990. [Google Scholar] [CrossRef]
- Corte, L.; Pierantoni, D.C.; Tascini, C.; Roscini, L.; Cardinali, G. Biofilm Specific Activity: A Measure to Quantify Microbial Biofilm. Microorganisms 2019, 7, 73. [Google Scholar] [CrossRef]
- Galkiewicz, J.P.; Kellogg, C.A. Cross-Kingdom Amplification Using Bacteria -Specific Primers: Complications for Studies of Coral Microbial Ecology. Appl. Environ. Microbiol. 2008, 74, 7828–7831. [Google Scholar] [CrossRef]
- Roscini, L.; Corte, L.; Antonielli, L.; Rellini, P.; Fatichenti, F.; Cardinali, G. Influence of cell geometry and number of replicas in the reproducibility of whole cell FTIR analysis. Anal. 2010, 135, 2099–2105. [Google Scholar] [CrossRef] [PubMed]
- Helm, D.; Labischinski, H.; Schallehn, G.; Naumann, D. Classification and identification of bacteria by Fourier-transform infrared spectroscopy. Microbiology 1991, 137, 69–79. [Google Scholar] [CrossRef]
- Almeida, E.L.; Rincón, A.F.C.; Jackson, S.A.; Dobson, A.D.W. In silico Screening and Heterologous Expression of a Polyethylene Terephthalate Hydrolase (PETase)-Like Enzyme (SM14est) With Polycaprolactone (PCL)-Degrading Activity, From the Marine Sponge-Derived Strain Streptomyces sp. SM14. Front. Microbiol. 2019, 10, 2187. [Google Scholar] [CrossRef]
- Zampolli, J.; Vezzini, D.; Brocca, S.; Di Gennaro, P. Insights into the biodegradation of polycaprolactone through genomic analysis of two plastic-degrading Rhodococcus bacteria. Front. Microbiol. 2024, 14, 1284956. [Google Scholar] [CrossRef]
- Molitor, R.; Bollinger, A.; Kubicki, S.; Loeschcke, A.; Jaeger, K.-E.; Thies, S. Agar plate-based screening methods for the identification of polyester hydrolysis by Pseudomonas species. Microb. Biotechnol. 2019, 13, 274–284. [Google Scholar] [CrossRef]
- Pierantoni, D.C.; Conti, A.; Ruspi, C.; Donati, L.; Favaro, L.; Corte, L.; Cardinali, G. Effect of olive oil wastewaters polyphenols on chicken faecal and litter microbiota towards safe and effective waste valorisation. Heliyon 2025, 11. [Google Scholar] [CrossRef]
- Al Hosni, A.S.; Pittman, J.K.; Robson, G.D. Microbial degradation of four biodegradable polymers in soil and compost demonstrating polycaprolactone as an ideal compostable plastic. Waste Manag. 2019, 97, 105–114. [Google Scholar] [CrossRef] [PubMed]
- Vetsigian, K. Diverse modes of eco-evolutionary dynamics in communities of antibiotic-producing microorganisms. Nat. Ecol. Evol. 2017, 1. [Google Scholar] [CrossRef]
- Nogales, B.; Lanfranconi, M.P.; Piña-Villalonga, J.M.; Bosch, R. Anthropogenic perturbations in marine microbial communities. FEMS Microbiol. Rev. 2011, 35, 275–298. [Google Scholar] [CrossRef] [PubMed]
- Nyyssölä, A.; Pihlajaniemi, V.; Järvinen, R.; Mikander, S.; Kontkanen, H.; Kruus, K.; Kallio, H.; Buchert, J. Screening of microbes for novel acidic cutinases and cloning and expression of an acidic cutinase from Aspergillus niger CBS 513.88. Enzym. Microb. Technol. 2013, 52, 272–278. [Google Scholar] [CrossRef] [PubMed]
- Roscini, L.; Conti, A.; Pierantoni, D.C.; Robert, V.; Corte, L.; Cardinali, G. Do Metabolomics and Taxonomic Barcode Markers Tell the Same Story about the Evolution of Saccharomyces sensu stricto Complex in Fermentative Environments? Microorganisms 2020, 8, 1242. [Google Scholar] [CrossRef]
- Kaplan, J.B. Antibiotic-Induced Biofilm Formation. Int. J. Artif. Organs 2011, 34, 737–751. [Google Scholar] [CrossRef]
- Bernardi, S.; Anderson, A.; Macchiarelli, G.; Hellwig, E.; Cieplik, F.; Vach, K.; Al-Ahmad, A. Subinhibitory Antibiotic Concentrations Enhance Biofilm Formation of Clinical Enterococcus faecalis Isolates. Antibiotics 2021, 10, 874. [Google Scholar] [CrossRef] [PubMed]
- Penesyan, A.; Nagy, S.S.; Kjelleberg, S.; Gillings, M.R.; Paulsen, I.T. Rapid microevolution of biofilm cells in response to antibiotics. npj Biofilms Microbiomes 2019, 5, 34. [Google Scholar] [CrossRef]
- Shree, P.; Singh, C.K.; Sodhi, K.K.; Surya, J.N.; Singh, D.K. Biofilms: Understanding the structure and contribution towards bacterial resistance in antibiotics. Med. Microecol. 2023, 16. [Google Scholar] [CrossRef]
- Wang, X.; de Koster, A.; Koenders, B.B.; Jonker, M.; Brul, S.; ter Kuile, B.H. De novo acquisition of antibiotic resistance in six species of bacteria. Microbiol. Spectr. 2025, 13, e0178524. [Google Scholar] [CrossRef]
- Gurung, J.; Khyriem, A.B.; Banik, A.; Lyngdoh, W.V.; Choudhury, B.; Bhattacharyya, P. Association of biofilm production with multidrug resistance among clinical isolates of Acinetobacter baumannii and Pseudomonas aeruginosa from intensive care unit. Indian J. Crit. Care Med. 2013, 17, 214–218. [Google Scholar] [CrossRef]
- Karami, P.; Mohajeri, P.; Mashouf, R.Y.; Karami, M.; Yaghoobi, M.H.; Dastan, D.; Alikhani, M.Y. Molecular characterization of clinical and environmental Pseudomonas aeruginosa isolated in a burn center. Saudi J. Biol. Sci. 2019, 26, 1731–1736. [Google Scholar] [CrossRef]
- Fortin, S.G.; Uhlig, K.; Hale, R.C.; Song, B. Microplastic biofilms as potential hotspots for plastic biodegradation and nitrogen cycling: a metagenomic perspective. FEMS Microbiol. Ecol. 2025, 101. [Google Scholar] [CrossRef] [PubMed]
- Chattopadhyay, I. Role of microbiome and biofilm in environmental plastic degradation. Biocatal. Agric. Biotechnol. 2022, 39. [Google Scholar] [CrossRef]
- Debroy, A.; George, N.; Mukherjee, G. Role of biofilms in the degradation of microplastics in aquatic environments. J. Chem. Technol. Biotechnol. 2021, 97, 3271–3282. [Google Scholar] [CrossRef]
- Pierantoni, D.C.; Corte, L.; Casadevall, A.; Robert, V.; Cardinali, G.; Tascini, C. How does temperature trigger biofilm adhesion and growth in Candida albicans and two non-Candida albicans Candida species? Mycoses 2021, 64, 1412–1421. [Google Scholar] [CrossRef]
Figure 1.
Distribution of biofilm production among bacterial isolates from different environments.
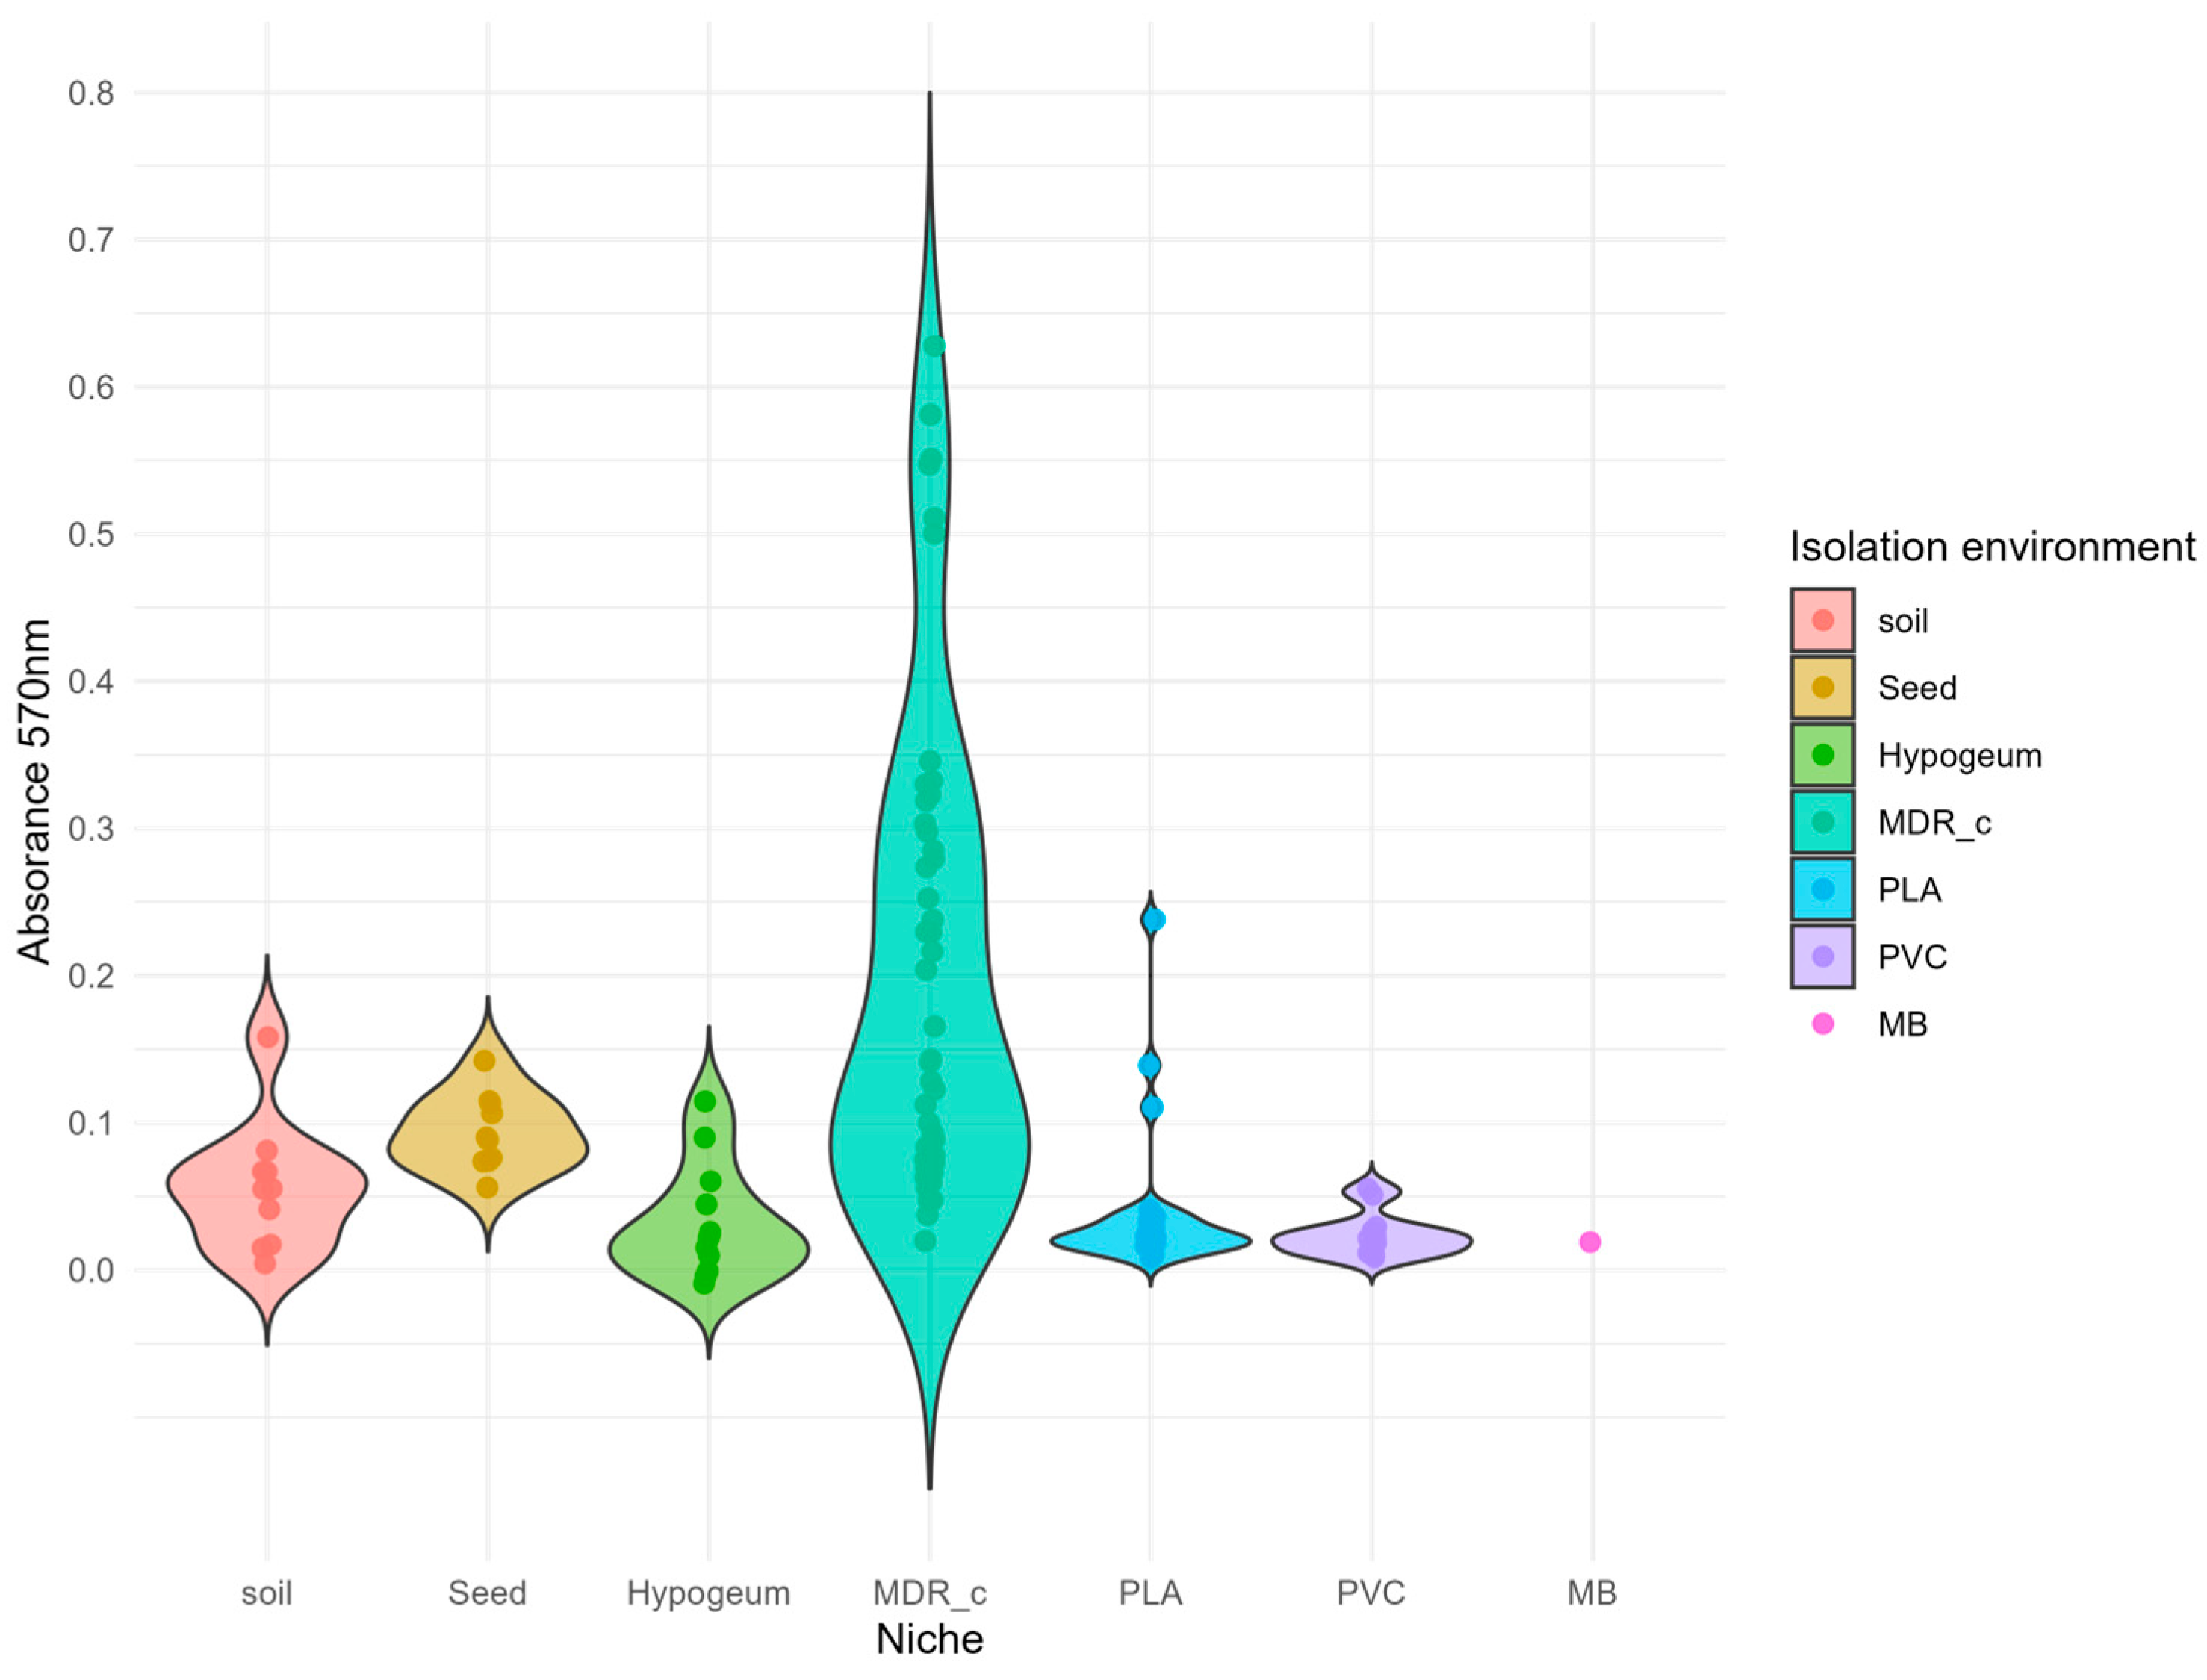
Figure 2.
PCoA analysis based on biofilm production.Principal component analysis (PCoA), conducted on absorbance values at 570 nm, shows the Euclidean distance between 118 bacterial strains in terms of biofilm production. Each point, indicating a single strain, is represented by different shapes based on the isolation environment. The entire variability is explained by the first axis (PCoA 1, 100%), which orders the strains along a gradient that distinguishes between: highly biofilm - forming strains (values between 3 and 4), moderately biofilm - forming strains (between 1 and 2) and non biofilm - forming strains (values close to zero, shown in grey). The strains belonging to the first two categories were also distinguished according to their taxonomic genus (indicated by the colour of the dot). The distribution along this axis shows that biofilm production is not linked to a specific taxonomic affiliation—film-forming strains belong to different genera—but shows a clear association with the isolation niche.
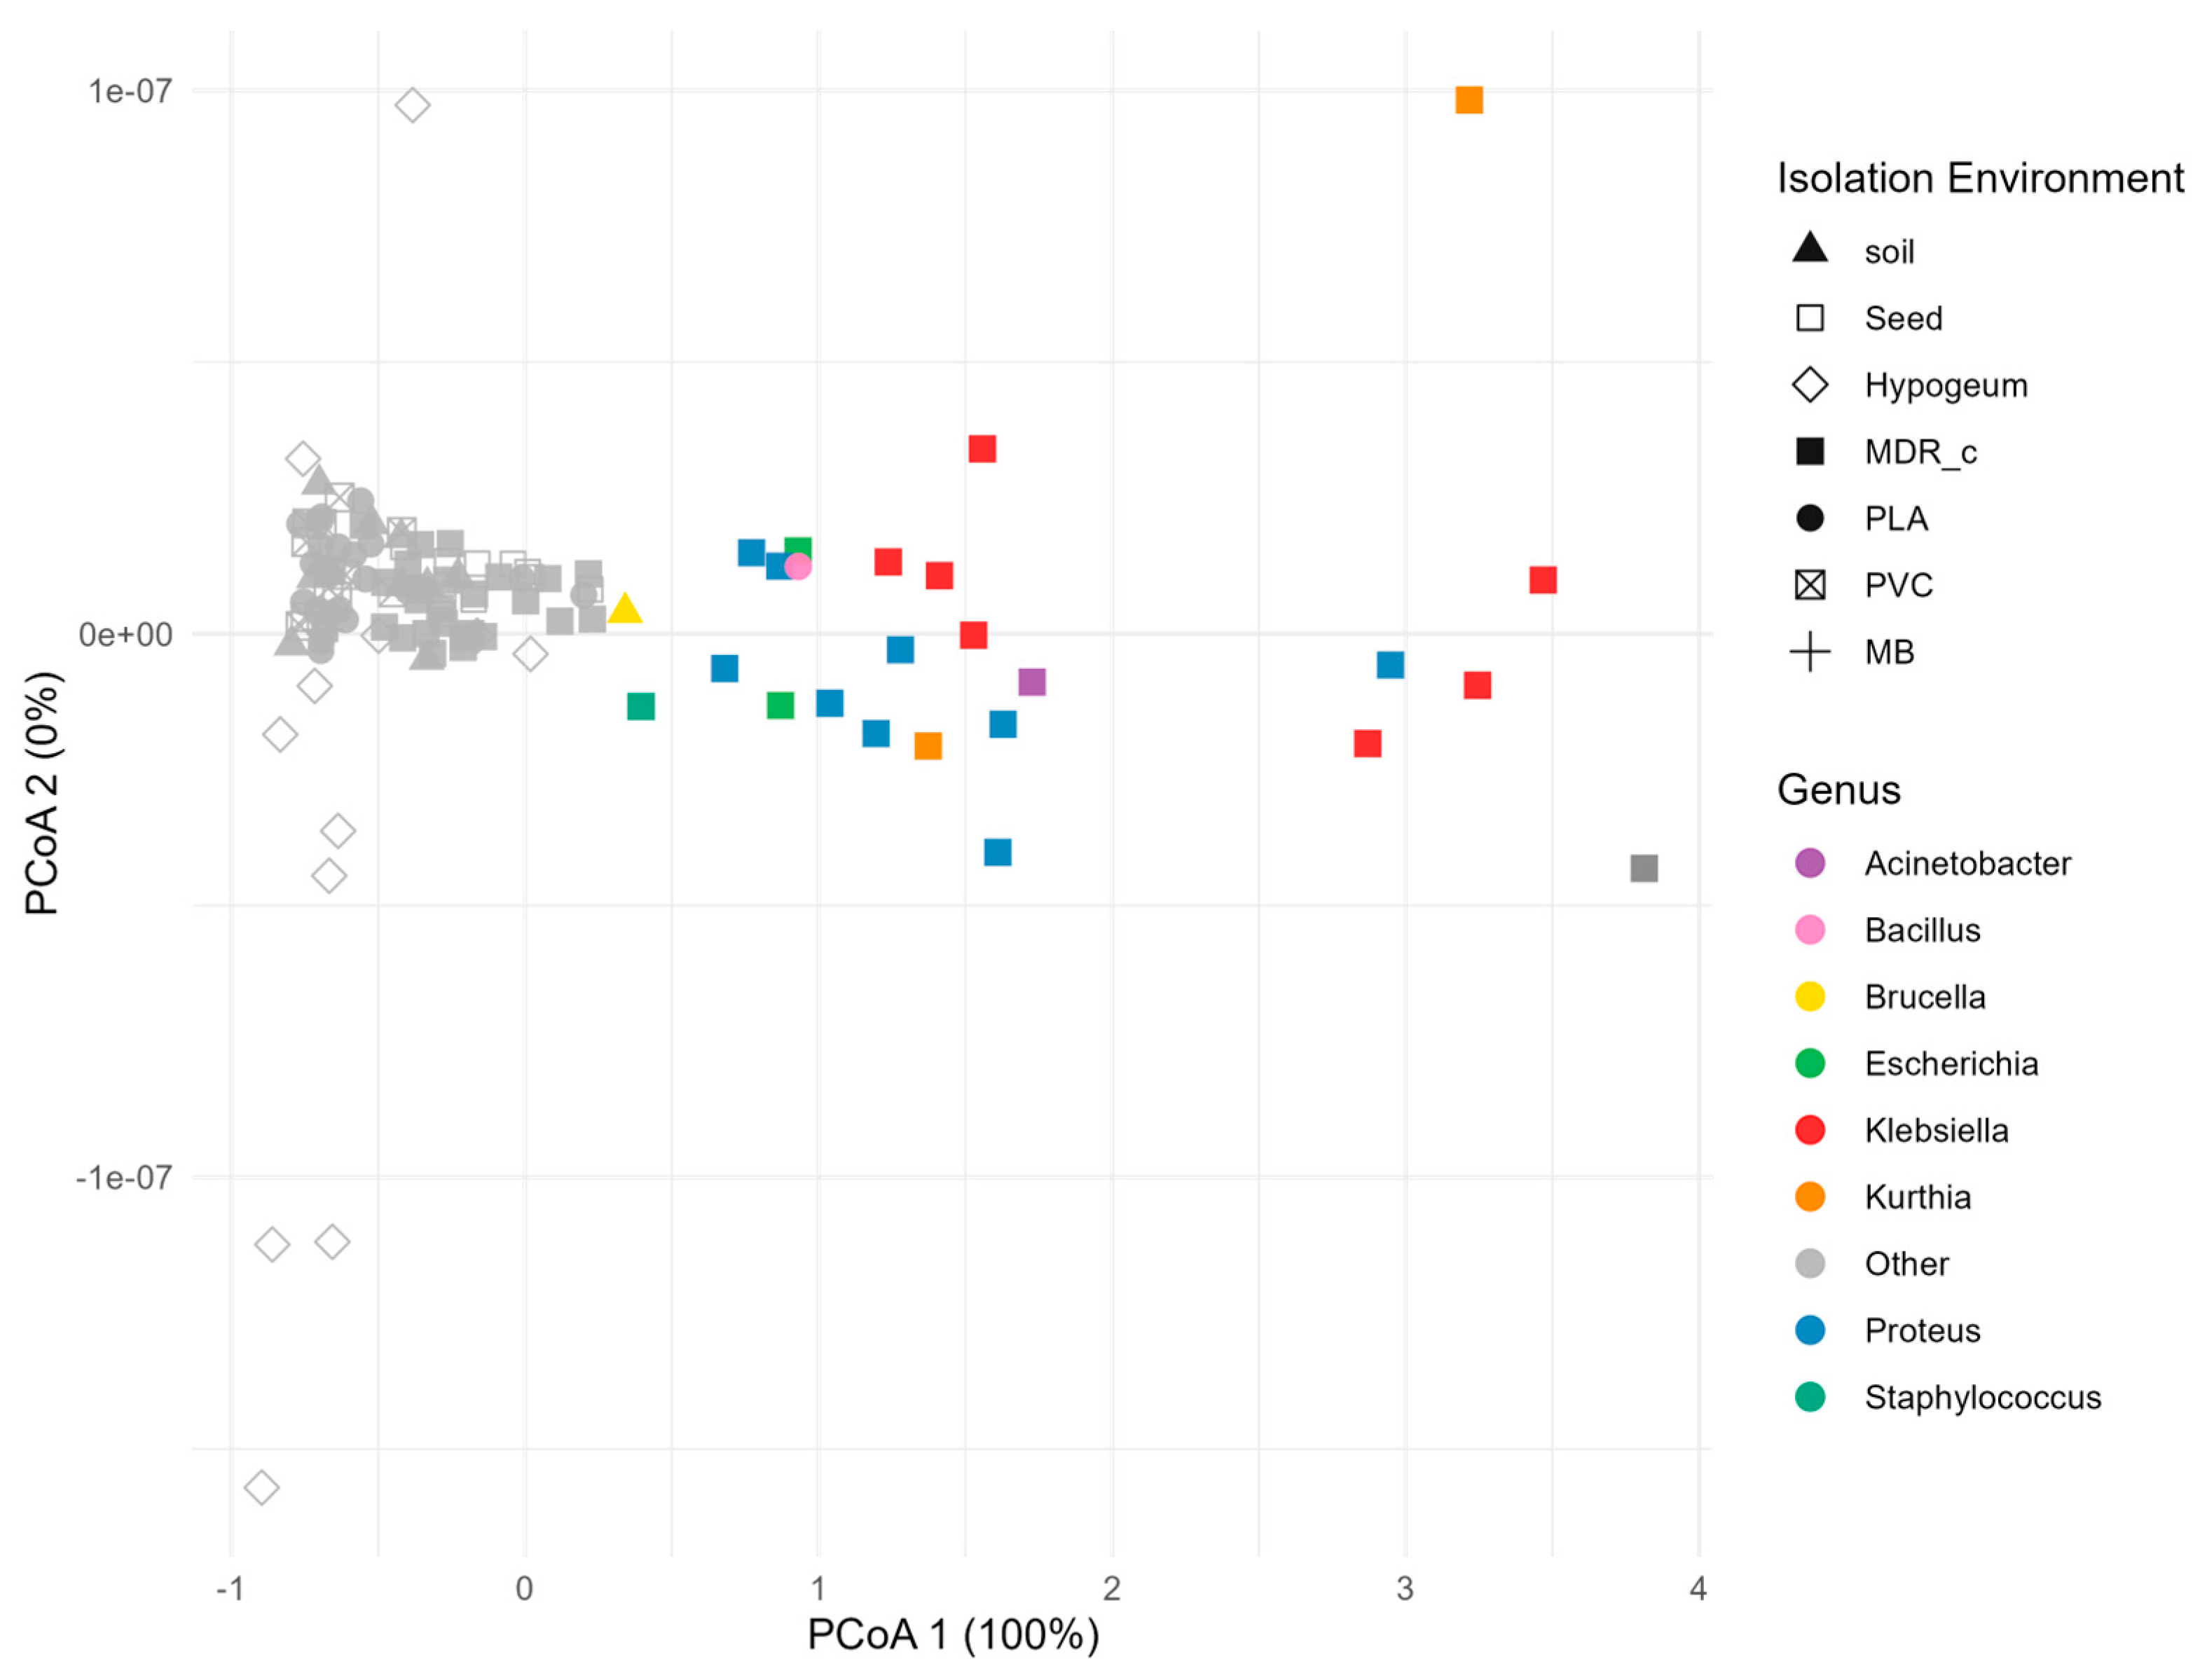
Figure 3.
PLSR analysis to evaluate the predictive capacity of FT-IR and 16S data on biofilm production.The PLSR Score plots a) based on FT-IR data and b) based on 16S sequences show the distribution of samples according to the first two components derived from Partial Least Squares Regression (PLSR). Each point represents a bacterial strain, coloured according to the isolation environment. In both cases, there is no clear separation between the high, medium and low biofilm production groups, suggesting a poor discriminatory ability of the predictors used.
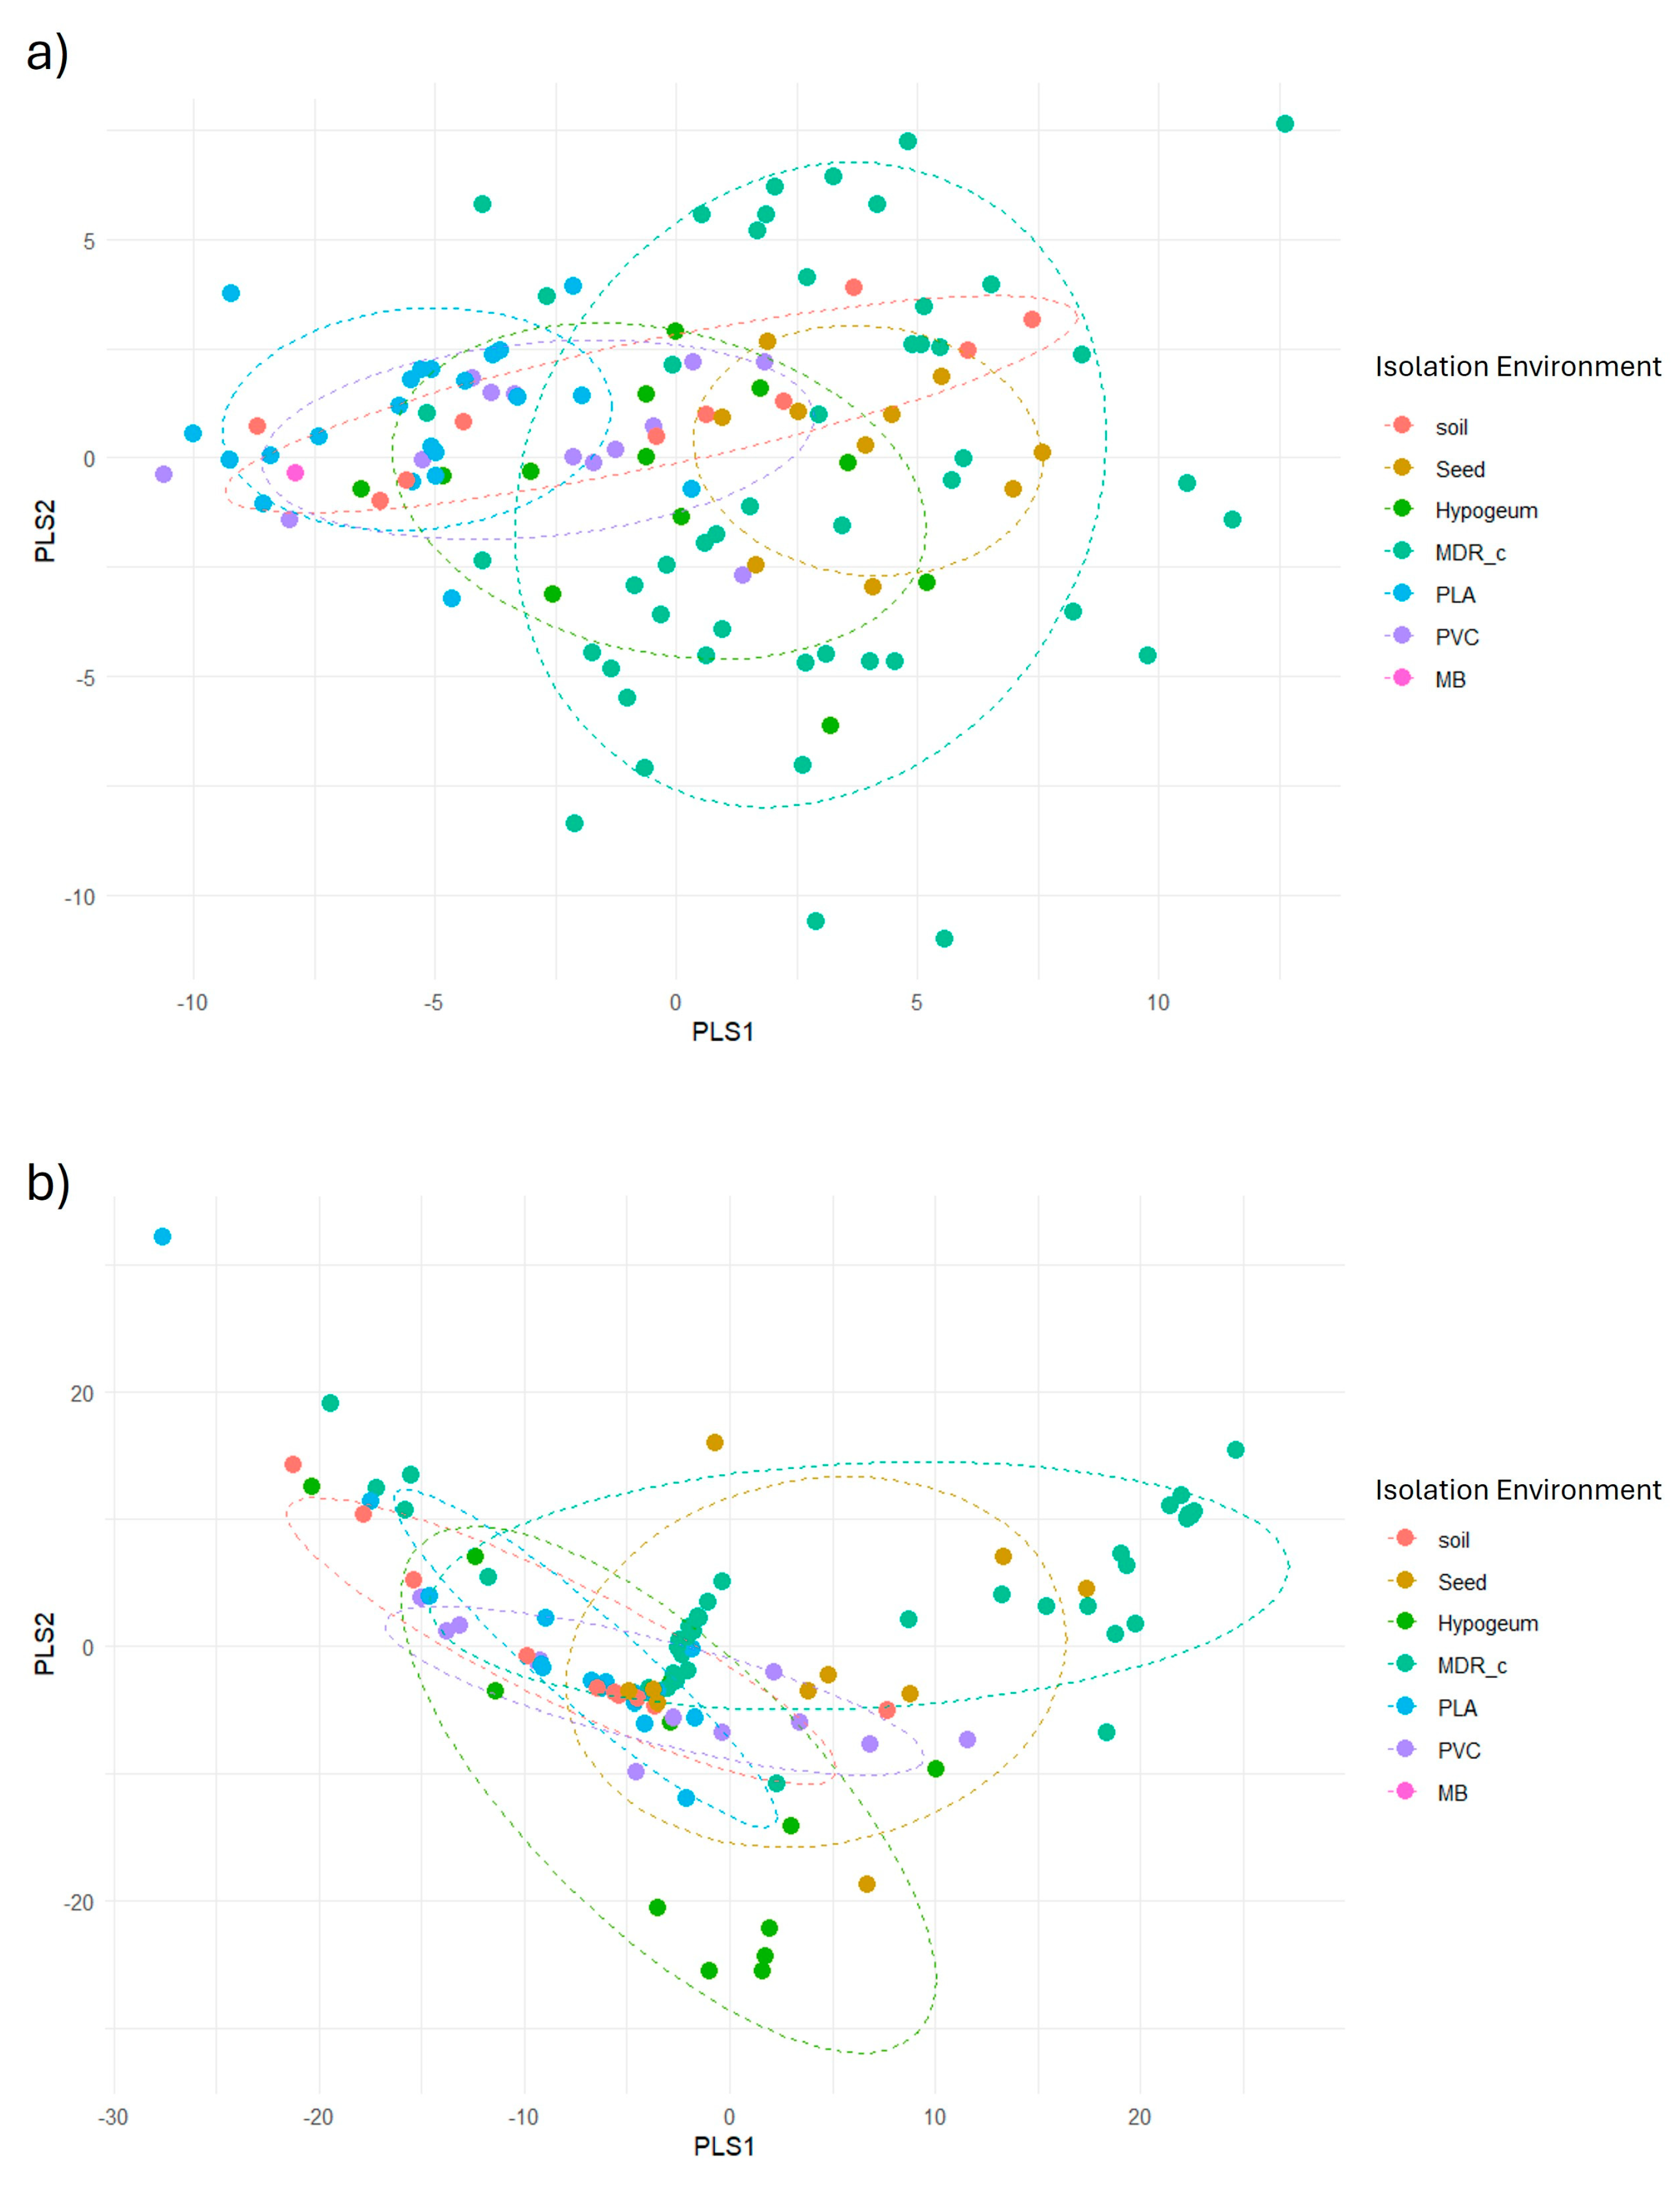
Figure 4.
VIP plot to correlate biofilm-forming phenotype with FT-IR and 16S descriptors. The VIP scores plot a) based on FT-IR data and b) based on 16S sequences. The VIP scores (Variable Importance in Projection) indicate the relative contribution of each descriptor (wave numbers for FT-IR, 16S gene alignment base) to the prediction of the dependent variable. No descriptor in either dataset exceeds the commonly accepted threshold of relevance (VIP > 1, red dotted line), indicating that neither FT-IR signals nor 16S sequences contain regions that are strongly predictive of biofilm-producing capacity.
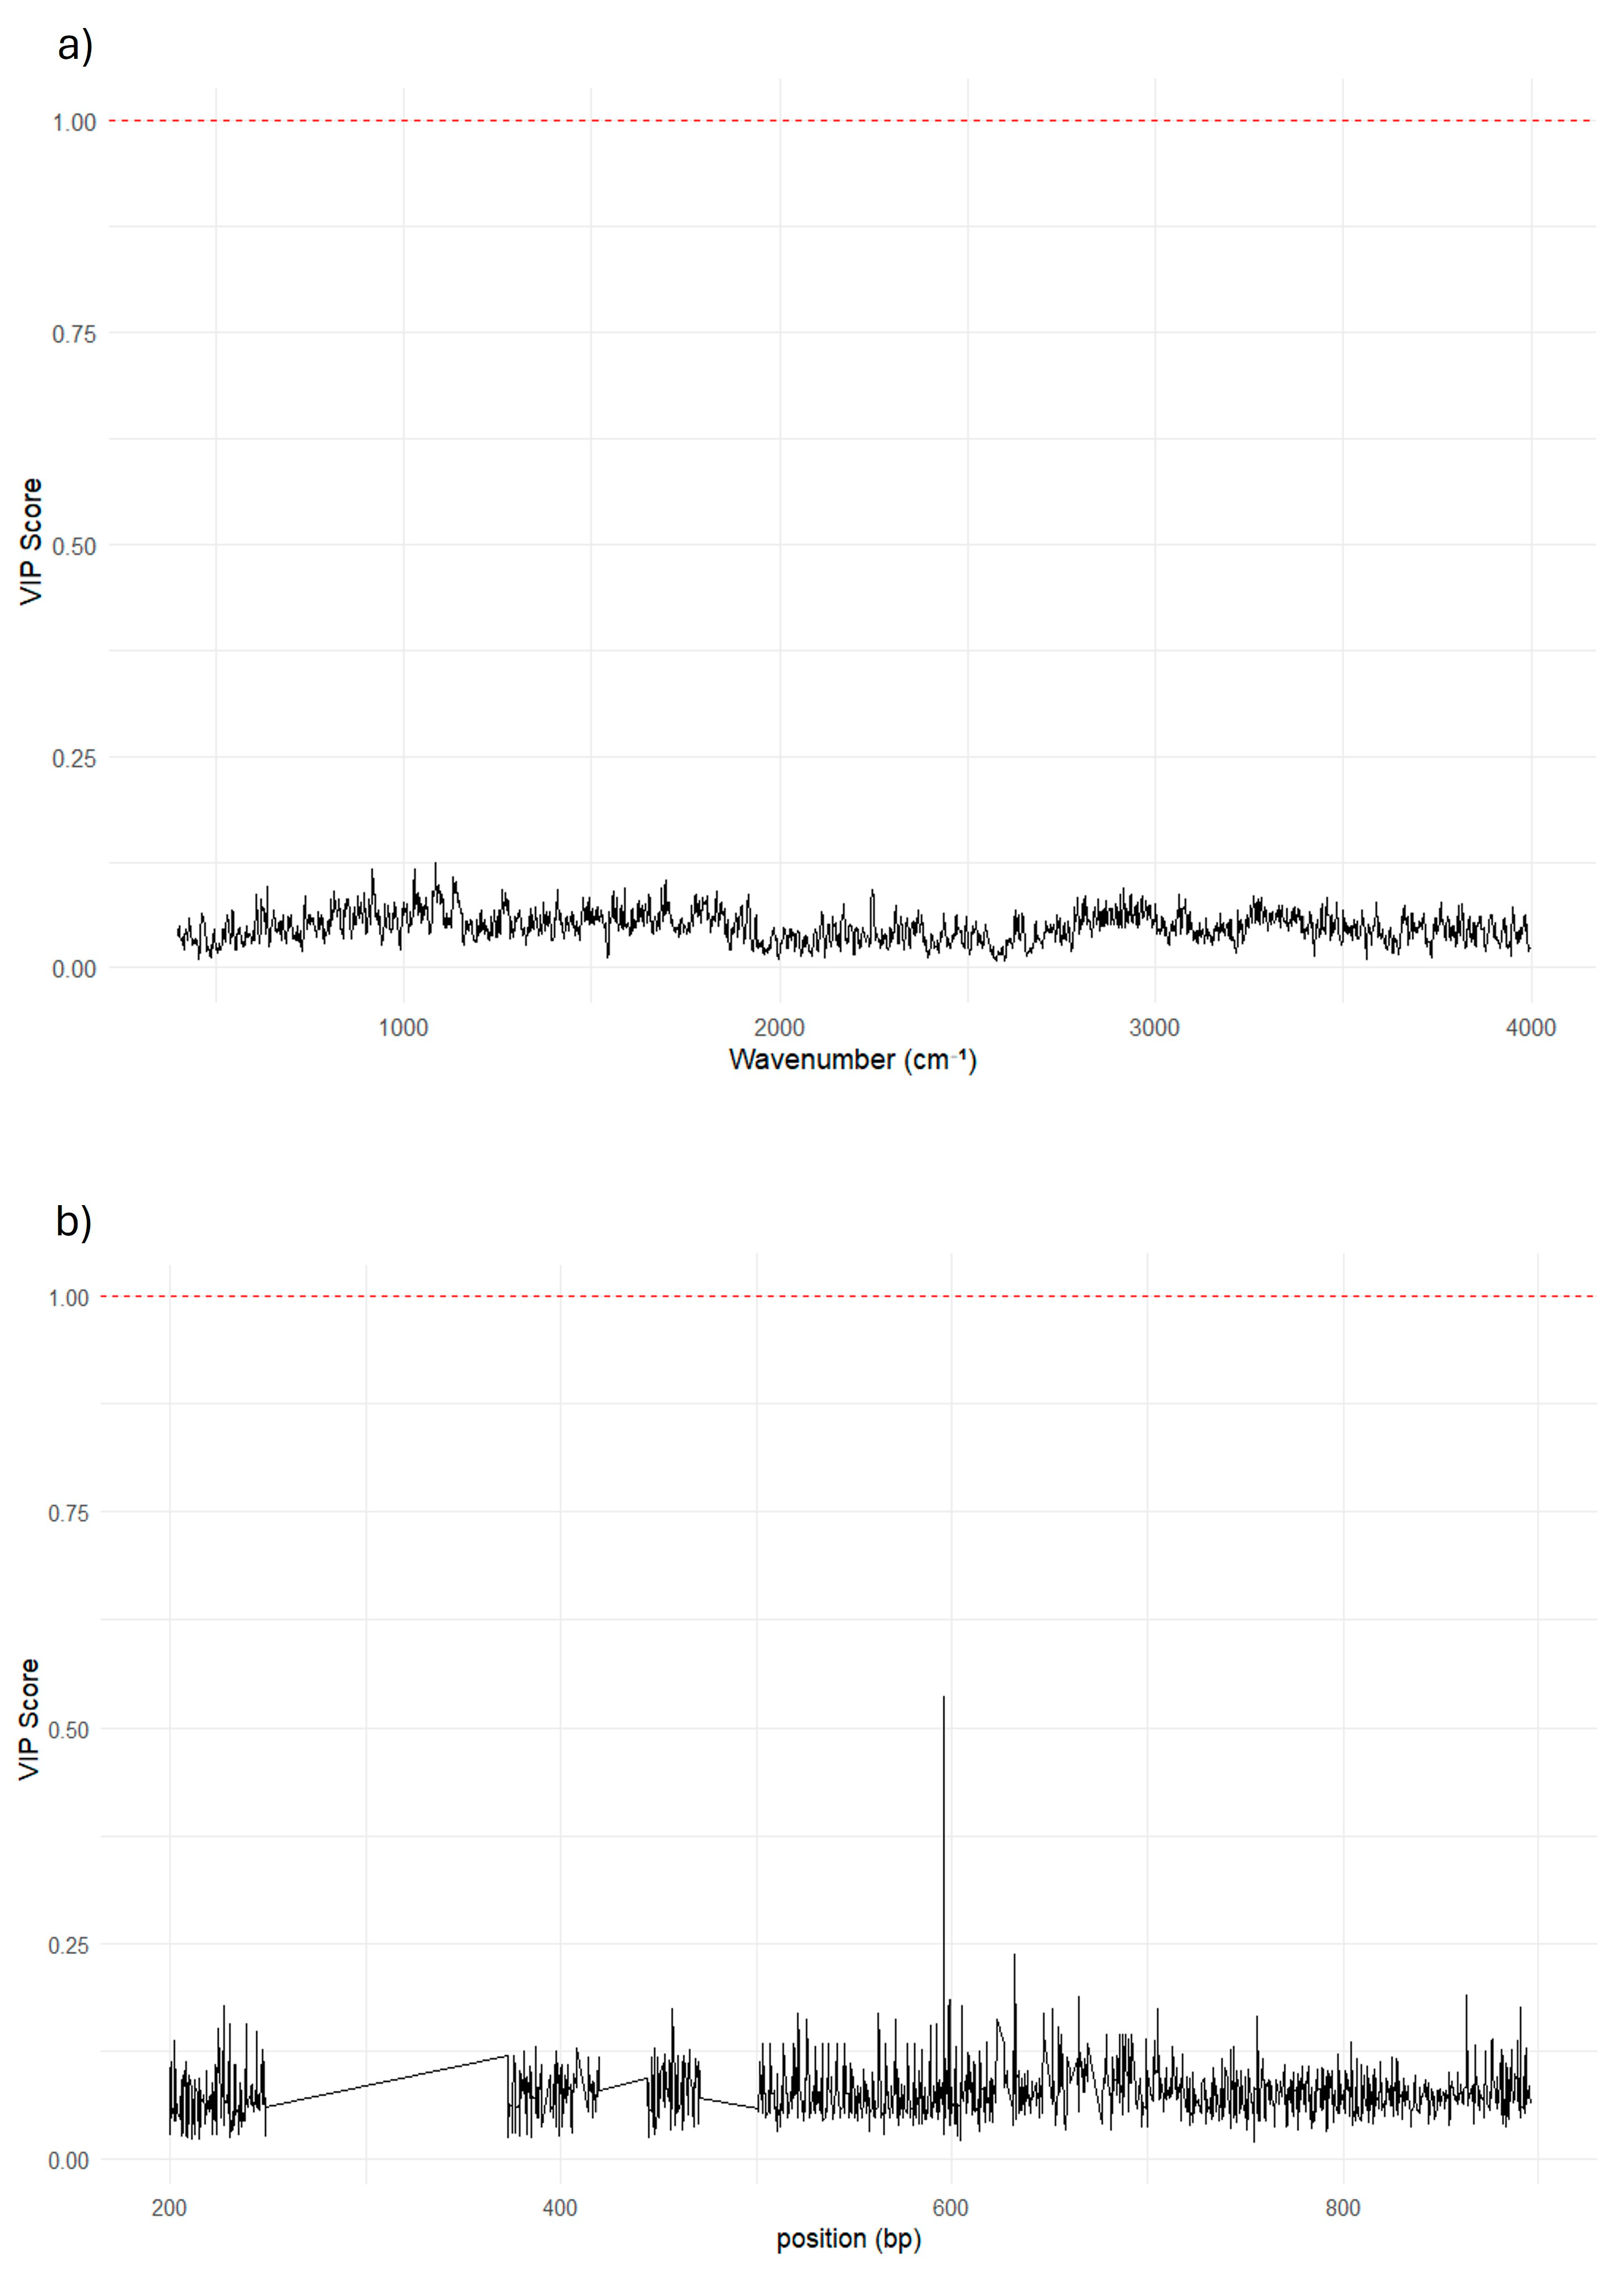
Figure 5.
Phylogenetic tree based on 16S rDNA sequences. The tree was constructed using the neighbour-joining method starting from the alignment of the 16S sequences of the bacterial isolates. The terminal nodes represent the strains analysed, showing the genus to which they belong (labels), the isolation environment (colour of the dot) and the amount of biofilm produced (size of the purple dot, in terms of absorbance at 570 nm). No specific phylogenetic patterns emerge either for the environmental origin of the isolates or for their ability to produce biofilm. The latter phenotype is observed transversally throughout the tree, in strains belonging to distinct genera and in evolutionarily distant branches.
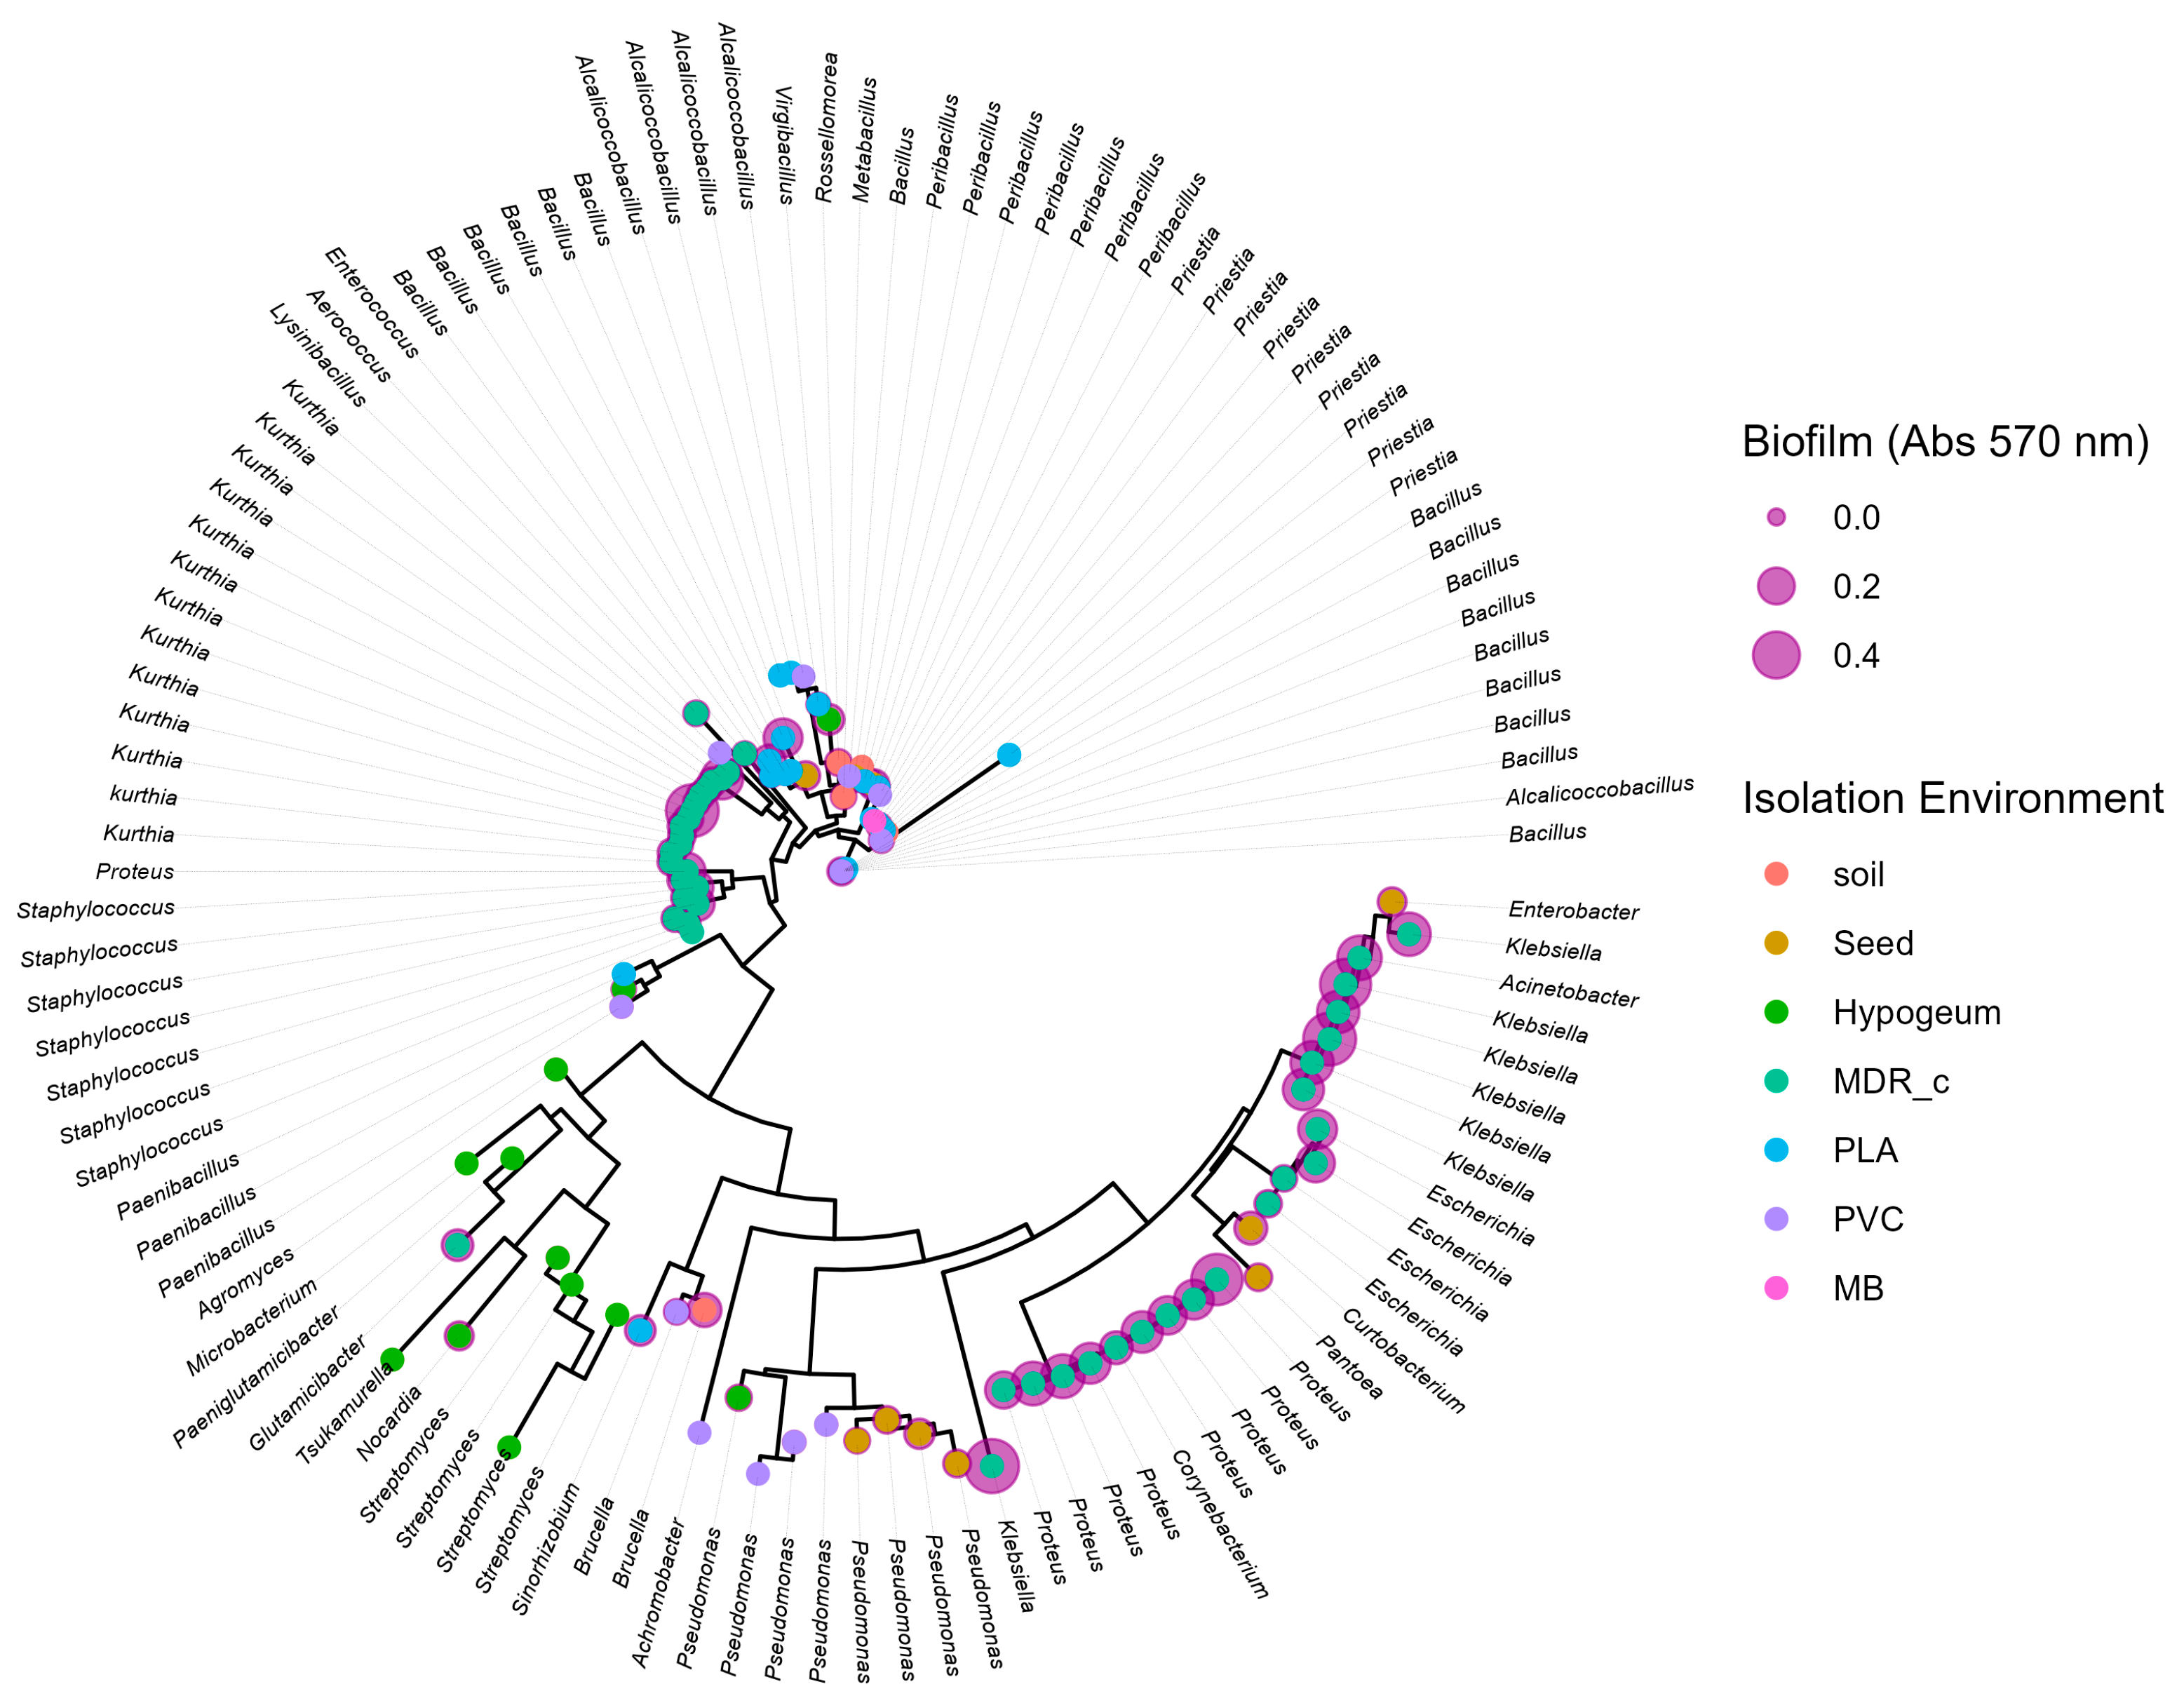

Table 1.
Type of anthropogenic stressors characterizing each isolation evironment.
| Isolation environment | Stressors |
| Lido soil | High salinity |
| Seed surface | Oligotrophy, water-limited stress |
| Hypogean tomb | Oligotrophy, high relative humidity (95–100%) |
| Intensive poultry farming | prophylactic applications of antibiotics |
| Plastic contaminated soil | PLA, PVC and Mater B polymers |
Table 2.
The percentage of strains in each quartile, based on absorbance at 590 nm. Microorganisms were grouped by isolation environment.
Table 2.
The percentage of strains in each quartile, based on absorbance at 590 nm. Microorganisms were grouped by isolation environment.
| Isolation environment | Q1 | Q2 | Q3 | Q4 |
| Lido soil | 0% | 50% | 20% | 30% |
| Seed surface | 10% | 80% | 10% | 0% |
| Hypogeal tomb | 0% | 17% | 33% | 50% |
| Intensive poultry farming | 54% | 26% | 18% | 2% |
| Plastic contaminated soil (MaterB) | 0% | 0% | 0% | 100% |
| Plastic contaminated soil (PLA) | 9% | 5% | 41% | 45% |
| Plastic contaminated soil (PVC) | 0% | 0% | 31% | 69% |
Disclaimer/Publisher’s Note: The statements, opinions and data contained in all publications are solely those of the individual author(s) and contributor(s) and not of MDPI and/or the editor(s). MDPI and/or the editor(s) disclaim responsibility for any injury to people or property resulting from any ideas, methods, instructions or products referred to in the content. |
© 2025 by the authors. Licensee MDPI, Basel, Switzerland. This article is an open access article distributed under the terms and conditions of the Creative Commons Attribution (CC BY) license (http://creativecommons.org/licenses/by/4.0/).
Copyright: This open access article is published under a Creative Commons CC BY 4.0 license, which permit the free download, distribution, and reuse, provided that the author and preprint are cited in any reuse.


