
Submitted:
15 December 2025
Posted:
17 December 2025
You are already at the latest version
Abstract
This research aims to assess and quantify the significance of incorporating the seismic performance of global and local engineering demand parameters (EDPs) within the probabilistic frameworks, when structural pounding of adjacent buildings occurs. For this purpose, the seismic performance of 6-story and 12-story reinforced concrete (RC) RC frames subjected to floor-floor pounding is assessed. The pounding is caused by an adjacent shorter and stiffer structure with the top contact point at the middle of the tall building’s total height. Displacement-based and ductility-based EDPs are evaluated at different performance levels (PLs) and at different separation distances (dg). The seismic performance of the RC frames without considering pounding is also evaluated. Incremental dynamic analyses (IDAs) are performed, and probabilistic seismic demand models (PSDMs) are developed to establish fragility curves of the examined RC frames. The probability of earthquake-induced pounding between adjacent structures is properly involved with the median value of Sa,T1 that corresponds to an acceptable capacity level (acceptable PL) of an EDP. The results of this study indicate that excluding structural pounding consequences from the probabilistic frameworks related to the seismic risk of colliding buildings leads to unsafe seismic assessment or design provisions.
Keywords:
structural pounding
; engineering demand parameter
; damage mitigation
; separation distance
; probability of pounding
; performance levels
; fragility curve
; PSDM
; nonlinear dynamic analyses
; EC8
1. Introduction
An important issue in earthquake engineering that several researchers have focused on is the interaction of buildings in proximity. In these studies, the structural seismic response during pounding impacts was primarily estimated based on the results of nonlinear time histories analyses (deterministic assessment). Several key parameters have been addressed to verify the structural performance, such as the type of structural pounding, buildings height, buildings arrangement, separation gap distance, building’ s material (i.e. reinforced concrete or steel), soil-structure interaction, setbacks, masonry infills, height difference of the colliding structures, the beam-column joint damage effect, mitigation strategies, characteristics of the seismic excitations, among others. Additionally, it has been demonstrated that the seismic performance of buildings that experience collisions depends on both the seismic hazard of the location and the performance criteria established for seismic demands [1].
Advanced concepts in seismic structural engineering incorporate performance-based approaches for the design and the assessment of infrastructure. A key issue in these methods is the definition of an accurate analytical fragility curve that identifies the vulnerability of structures to seismic damage. In recent years, literature also provides results based on fragility analyses that have been performed to probabilistic evaluation of the structural pounding phenomenon [2,3,4,5,6,7,8,9,10,11,12,13,14]. Tubaldi et al. [2] evaluated the seismic pounding risk by developing fragility curves for single-degree-of-freedom (SDOF) and multi-degree-of-freedom (MDOF) systems. The fragility assessment of multistory reinforced concrete or/and steel structures subjected to pounding has also been studied [3,4,5,6,7,8,9,10,11,12,13,14]. Nazri et al [3] developed fragility curves for different performance levels in terms of maximum interstory drift to study the effect of gaps between RC frame structures and the influence of regularity/irregularity on structural behavior under moderate seismic actions. The structural performance of the adjacent buildings was based on the results of the IDA method as a function of the peak ground acceleration (PGA). The local inelastic demands of the critical structural members into the fragility assessment of buildings subjected to pounding were introduced by Flenga and Favvata [4,5,6,7,8,9]. Both floor-to-floor and inter-story (floor-to-column) structural pounding were assessed. Additionally, a fragility-based methodology was proposed to evaluate the minimum separation gap distance required at different limit states [7]. Other key issues related to the probabilistic assessment of the structural pounding effect that have been addressed included the investigation of a) the discrepancies between the methodologies used to develop accurate structural seismic fragility curves [4], b) the efficiency and sufficiency of the intensity measures (IMs) [8], and c) the effect of the magnitude Mw and Rrup [9]. Mohamed and Romão [10] studied the structural pounding effect on the fragility assessment of non-seismically designed RC structures taking into account both floor-to-floor and floor-to-column pounding conditions. Kazemi et al [11] presented fragility curves to evaluate the impact of floor-to-floor structural pounding at different performance levels on the seismic performance of adjacent RC and steel frames. In 2022, Miari and Jankowski [12] studied the effect of soil type on the fragility assessment of colliding buildings. Sinha and Rao [13] investigated displacement-based fragility for floor-to-floor and floor-to-column collision within an eight-story non-ductile RC frame adjacent to a three-story rigid RC frame. In 2024, Kazemi et al [14] investigated the seismic performance of steel structures in collision with RC structures under floor-to-floor pounding conditions. IDAs were performed and fragility curves in terms of IDR were developed based on M-IDA curves as a function of Sa,T1.
The review underlines the importance of conducting additional research on the seismic performance-based assessment and design of colliding buildings. There are several important issues that need further investigation to improve understanding and ensure structural safety.
For instance, assessing the fragility results should also extend beyond verifying the severity of the structural pounding phenomenon that causes damage or even collapse. It is essential to identify solutions that ultimately help to define adequate separation gaps and improve risk mitigation strategies. The most popular approach against structural pounding is the evaluation of a sufficiently large separation distance between the adjacent structures. However, although for new buildings it is possible (but not always applicable) to design sufficient gap distances, in the case of existing structures this option cannot be ensured. Mitigation methods to control damage when an insufficient separation distance exists between adjacent buildings are also limited. The consequences of the structural pounding on the damage level of the structure can only be quantified if the performances of critical global and/or local EDPs are properly involved in the probabilistic methods. However, the sole EDP that is usually adopted to evaluate the separation distances is associated with the displacements that are developed in the contact area of the colliding buildings. The same approach is used by the current seismic design building codes, although several studies have proved that these codes’ provisions are either inadequate or conservative. Therefore, the code requirement cannot always be applied.
So, this study aims to assess and quantify the significance of incorporating the seismic performance of global and local EDPs within the probabilistic performance-based earthquake engineering frameworks, when structural pounding of buildings occurs.
For this purpose, the fragility of two multistory reinforced concrete (RC) frame structures subjected to pounding caused by an adjacent shorter and stiffer structure is studied. Displacement-based and ductility-based EDPs are evaluated at different performance levels and at different separation distances dg. 1456 nonlinear dynamic analyses are performed based on IDA method and linear and bilinear PSDMs are developed to establish the fragility curves of the examined RC frames.
In this study, the probability of earthquake-induced pounding between adjacent structures is properly involved with the median value of Sa,T1 that corresponds to an acceptable capacity level (acceptable PL) of an EDP. These results provide insight into the importance of including critical EDPs for predicting and controlling the severe damage caused by seismic pounding between adjacent multistory reinforced concrete buildings.
2. Design of Multistory RC Buildings
Two multistory RC frame structures have been designed for the purposes of this work; a) a 6-story, and b) a 12-story structure. All the examined frames were designed according to Eurocodes 2 [15] and 8 [16], meeting the Ductility Capacity Medium (DCM) criteria, while the behavior factor q was equal to 3.75. The mass of the structures was taken equal to M=(G+0.3Q)/g (where G gravity loads and Q live loads) and the design base shear force was equal to V=(0.3g/q)M. Reduced values of member moments of inertia (Ief) were considered in the design to account for the cracking; for beams Ief=0.5Ig (where Ig the moment of inertia of the gross section) and for the columns Ief=0.9Ig. Critical for the dimensioning of the columns proved to be in most of the cases the code provision regarding the axial load ratio limitation vd ≤0 .65, and in a few cases (columns of the upper stories) the code requirements for minimum dimensions. Structural geometry and reinforcement of the examined multistory RC structures are shown in Figure 1 (a-b).
3. Structural Modelling Assumptions
In this work, the computer program package Drain-2DX is used. The finite element mesh for the RC frame structures utilizes an one-dimensional element for each structural member, while two types of one-dimensional beam-column elements were used. For the simulation of beams the common lumped plasticity model has been employed. For the columns of the structure a special purpose element of "distributed plasticity" type accounting for the spread of inelastic behavior both over the cross-sections and along the deformable region of the member length is adopted (Figure 1c). Collisions are simulated using contact elements that become active when the corresponding nodes come into contact (Figure 1d). This idealization is consistent with the building model used and appears adequate for studying the effects of pounding on the overall structural response for the pounding cases under examination [1,17].
4. Fragility Curve Based on Linear or Bilinear PSDMS
A probabilistic seismic demand model (PSDM) is a mathematical relationship between the median structural demand and the earthquake intensity measure (IM). To develop a PSDM, nonlinear dynamic analyses such as IDA are first performed to generate the EDP-IM pairs, and then a statistical process synthesizes the PSDM. The PSDM is described as:
In log-log space the PSDM is expressed as
where, ε|ΙΜ is the random error with mean zero and standard deviation . The coefficients α and b are calculated through linear regression analysis.
Nevertheless, it has been proved [7] that the local inelastic demands of a structure are described more sufficiently through bilinear regression models (bilinear PSDMs) as:
where, ,,, and control the intercepts and the slopes of the first and the second segment of the bilinear model. These coefficients α1, α2, b1 and b2 are defined by perfoming a regression analysis with a single error term (ε|ΙΜ). The H1 is a dummy variable that when is set equal to zero (0.0) Eq. (3) describes the first segment of the bilinear model, and when H1 = 1 the same equation depicts the second segment. In a bilinear PSDM two different values of dispersion are estimated one for each segment (β1 for the first segment, and β2 for the second segment) allowing to relax the homoscedasticity assumption. More details can be found in [7,8,9].
Thereafter, fragility curves can be estimated based on the closed-form solution of the PSDM as follows:
Φ(.) denotes the standard normal cumulative function, the median value of the capacity and βEDP|IM the logarithm standard deviation calculated as (Eq. 5)
n is the number of the nonlinear dynamic analyses.
5. Fragility Curve Based on Linear or Bilinear PSDMS
In this study the floor-to-floor structural pounding is addressed. The potential top contact point is located at the middle floor level of each multistory RC frame structure, meaning at the 3rd floor level in the case of the 6-story RC frame, and at the 6th floor level for the 12-story RC frame. The probabilistic assessment of the multistory RC frames due to the structural pounding effect is performed for three different separation gap distances (dg) between the adjacent structures: a) (Eurocode’s requirement), b) , and c) (structures are in contact from the beginning). The case of without the pounding effect is also included.
Three EDPs are evaluated, namely: a) maximum displacement δmax at the top of the contact point, b) ratio of maximum interstory drift to the storey height, hst (IDRmax-%hst) and c) maximum curvature ductility demands (μφ,max) of the most critical external column of the multistory RC frame. Different performance levels for each EDP are considered. In the case of δmax the probability of pounding is estimated taking into account as capacity levels the examined values of separation gap distance dg. The fragility of the multistory RC structures in terms of IDRmax (%hst) is assessed for the two performance levels: (a) Immediate Occupancy (IO) - IDRmax, capacity = 1 (%hst), and b) Collapse Prevention (CP) - IDRmax, capacity = 2.5 (%hst). Lastly, two capacity levels for the local EDP of μφ,max are considered: (a) Yield capacity state of performance (Y) - μφ,max = 1.0, and (b) Ultimate capacity state of performance (U) - (φu = ultimate curvature, and φy = yield curvature – based on cross-section analysis).
A total number of 1456 nonlinear dynamic step by step analyses are performed based on the IDA method. For this purpose, a set of 14 ground motions extracted from the PEER’s database are used, and the spectral acceleration Sa,T1 at the fundamental period T1 of each multistory RC structure (T1,6-story = 0.823s, T1,12-story = 1.295s) is adopted to describe the seismic intensity measure. The characteristics of the selected ground motions (source-to-site distance, magnitude, shear wave velocity, vs,30, etc.) are reported in Flenga and Favvata [7].
6. Results
The probabilistic seismic performance of multistory RC frame structures due to the structural pounding effect is herein evaluated. For this purpose, the PSDMs of δmax|Sa,T1, IDRmax|Sa,T1, and μφ,max|Sa,T1 are initially developed using linear and bilinear regression models, as discussed in Section 4 and shown in Table 1.
Thereafter, the fragility curves of each multistory RC frame structure at different performance levels and different separation distances dg (including the case of without pounding) are defined (see Figure 2, Figure 3 and Figure 4).
In Figure 2 the probability of pounding considering different separation gaps (dg) is assessed based on the maximum displacements (δmax) at the top contact point of the examined RC frames. These results indicate that when the separation distance dg is increased, the probability of pounding decreases for the same value of Sa,T1. Also, while the probability of pounding is 100% when the structures are in contact from the beginning, in the case of free vibration the corresponding probability is zero.
On the other hand, the consequences of the structural pounding on the damage level of the structure can be quantified only if the performances of critical global and/or local EDPs are properly involved in the probabilistic methods. So, in this study, the vulnerability of the structures in terms of IDRmax (global EDP) and μφ,max (local EDP) is assessed and presented in Figure 3 and Figure 4.
Figure 3 and Figure 4 demonstrate that the fragility curves resulting from structural pounding configurations are shifted to lower values of Sa,T1 compared to the corresponding fragilities without pounding (free vibration of the structure). Also, as it was expected, the impact of the pounding on the vulnerability of the structures is increased as the initial gap distance dg between the adjacent structures is decreased. Evaluating the seismic performance of the RC frames at different capacity levels, it can be stated that as the performance level becomes more demanding, the fragility curves shift towards higher values of Sa,T1.
Of course, these observations align with existing knowledge on the seismic performance of structures under pounding conditions using probabilistic procedures.
To further quantify the consequences of the structural pounding, the median values of spectral acceleration at the fundamental period T1 of the structures (Sa,T1) are estimated based on the PSDMs of IDRmax|Sa,T1 and μφ,max|Sa,T1. These values depict the Sa,T1 at which the EDPs of IDRmax and μφ,max reach a specific performance (capacity) level. Hereafter, the median values of Sa,T1 are referred to as Sa,wp when pounding conditions are precluded and as Sa,dg in pounding conditions. So, Figure 5 shows the Sa,wp of the RC frames. It can be observed (Figure 5a) that the Sa,wp at which the 6-story RC frame reaches the capacity of IDRmax at any PL is greater than the corresponding values of Sa,wp of the 12-story RC frame. The 6-story reaches the capacity of IDRmax at the performance level of IO (IDRmax-IO) with a magnitude of Sa,wp about 1.5 times greater than that of the 12-story frame. In the case of IDRmax-CP, this increment is 1.3.
Now, evaluating the performance based on the demands of μφ,max, it can be observed (Figure 5b) that the 12-story RC frame is less vulnerable than the 6-story frame, as the examined column reaches its capacity level (Y or U) at higher values of Sa,wp. Nevertheless, the crucial seismic demand parameter of both structures is the IDRmax, as lower values of Sa,wp are required to reach the PLs compared to μφ,max, even at the CP state. This condition is compatible with the seismic design philosophy. In all cases, the more demanding performance levels of IDRmax or μφ,max lead to increased values of Sa,wp.
Afterwards, in Figure 6, the median values of Sa,dg at which the corresponding EDPs (IDRmax or μφ,max) reach their ultimate capacity level are presented for the examined structural pounding cases. It can be observed that the structures reveal similar performance characteristics compared to the case without pounding when the assessment is based on IDRmax. Indeed, the 6-story RC frame is again less vulnerable in IDRmax than the 12-story RC structure, as it reaches the capacity level of CP at greater values of Sa,dg. The same results hold for the capacity level of IDRmax – IO, and when the assessment is based on either μφ,max -Y or μφ,max - U; the tall building (12-story RC frame) is more vulnerable than the 6-story frame.
The notable information herein is that these results (Figure 6) indicate that to ensure the safe performance of the structural systems under pounding conditions, the local demands of the critical columns should be considered. As shown in Figure 6 the structures reach the PL of μφ,max at a value of Sa,dg that is lower than the Sa,dg required to reach the examined PL of IDRmax. This reduction is more pronounced in the case of the 6-story RC frame and decreases as the building height increases. So, structural pounding significantly alters the seismic performance of structures compared to the case without pounding, making the ductility-based EDP, rather than the displacement-based EDP, the critical demand parameter for the evaluated RC frames.
Having evaluated the Sa,dg, the corresponding probability of pounding PL (referred hereafter as Ppounding) can also be defined through the fragilities of δmax. In this way, the probability of pounding when a specific EDP-PL is achieved is directly expressed. These results are presented in Figure 7, where it can be observed that in most cases, the probability of pounding at the examined Sa,dg-PL is greater than 50%, even when the gap distance provided by EC8 is applied (Figure 7). Meaning that the use of the δmax (Ppounding) as a sole criterion to design and assess the structural pounding phenomenon may yield conservative solutions.
For example, in the case of the 6-story RC frame if we choose as an acceptable/targeting value of Ppounding the 50% when (i) dg = 0.5dg,EC8 and (ii) dg = dg,EC8, then the corresponding acceptable values of Sa,T1 will be 0.26g and 0.54g, respectively (see Figure 6). However, these values are less than the one deduced based on the performance level of either IDRmax or μφ,max at the collapse limit states. As shown in Figure 6a the minimum acceptable Sa,dg among IDRmax-CP and μφ,max – U is 0.61g when (i) dg = 0.5dg,EC8 and 0.68g when (ii) dg = dg,EC8, respectively. The same results were noted for the 12-story RC frame (see Figure 6b).
Finally, to further quantify the pounding impact on the values of Sa,wp the ratio of is examined. These results are presented in Figure 8 as a function of the pre-defined separation gap distances, dg, for both displacement-based and ductility-based performance levels. It can be observed that structures are expected to reach the examined capacity level (PL) at an earthquake intensity level less than the expected one in the case of no pounding, since in all the examined cases of this study. The observed reduction is more intense when the μφ,max - PLs of the columns are assessed.
Also, an increase of stories from 6 to 12 decreases the ratio of . Therefore, the most critical pounding cases are posed on the tall building (12-story RC frame). This observation holds whether the assessment is based on the IDRmax - PLs or the μφ,max - PLs.
5. Conclusions
The main objective of this study is to provide insight into the importance of including critical EDPs to predict and control the severe damage caused by seismic pounding between adjacent multistory reinforced concrete buildings. Displacement-based and ductility-based EDPs are evaluated at different performance levels and at different separation distances dg.
The seismic performance of 6-story and 12-story RC frame structures is assessed based on probabilistic methods. The structures are subjected to floor-floor pounding caused by an adjacent shorter and stiffer structure, with the top contact point located at the middle of the building's total height. Nonlinear dynamic analyses are carried out (IDA method) and PSDMs in terms of δmax|Sa,T1, IDRmax|Sa,T1 , and μφ,max|Sa,T1 are developed. Then fragility curves of the examined RC frames at different performance levels are defined, considering a) (Eurocode’s requirement), b) , c) (structures are in contact from the beginning), and d) free vibration of the structures (case without structural pounding effect). Then, the median value of Sa,T1 that corresponds to an acceptable capacity level (acceptable PL) of an EDP is evaluated, and the probability of earthquake-induced pounding between adjacent structures is properly involved.
The results of this study deduce the following remarks:
- The first observations align with existing knowledge on the seismic performance of structures under pounding conditions using probabilistic procedures. Indeed, fragility curves due to structural pounding configurations are shifted to lower values of Sa,T1 compared to the corresponding fragilities without pounding (free vibration of the structure). Also, as it was expected, the impact of the pounding on the vulnerability of the structures is increased as the initial gap distance dg between the adjacent structures is decreased. Evaluating the seismic performance of RC frames at different capacity levels, it can be stated that as the performance level becomes more demanding, the fragility curves shift towards higher values of Sa,T1.
- Structural pounding significantly alters the seismic performance of structures compared to the case without pounding, making the ductility-based EDP, rather than the displacement-based EDP, the critical demand parameter for the evaluated RC frames.
- The use of the δmax (Ppounding) as a sole criterion to design and assess the structural pounding phenomenon yields conservative solutions.
- The structures reach their capacity level (examined PL) at an earthquake intensity level less than the expected one in the case of no pounding .
- An increase of stories from 6 to 12 decrease the ratio of . Therefore, the most critical pounding cases are posed on the 12-story RC frames.
- The probability of pounding cannot be set to zero even when the gap distance provided by EC8 is applied.
- Excluding structural pounding consequences from the probabilistic frameworks may lead to unsafe performance-based seismic assessment or design provisions regarding the seismic risk of colliding buildings.
Author Contributions
Conceptualization, M.J.F. and E.G.T.; Methodology, M.J.F. and E.G.T.; Formal analysis, M.J.F. and E.G.T.; Writing—original draft, M.J.F. and E.G.T.; Writing—review & editing, M.J.F. and E.G.T. All authors have read and agreed to the published version of the manuscript.
Institutional Review Board Statement
Not applicable.
Informed Consent Statement
Not applicable.
Data Availability Statement
The data presented in this study are available on request from the corresponding author.
Conflicts of Interest
The authors declare no conflict of interest.
References
- Favvata, M.J. Minimum required separation gap for adjacent RC frames with potential inter-story seismic pounding. Eng. Struct. 2017, 152, 643–659. [CrossRef]
- Tubaldi, E.; Freddi, F.; Barbato, M. Probabilistic seismic demand model for pounding risk assessment. Earthq. Eng. Struct. Dyn. 2016, 45, 1743–1758. [CrossRef]
- Nazri, M.; Miari, M.A.; Kassem, M.M.; Tan, C.G.; Farsangi, E.N. Probabilistic evaluation of structural pounding between adjacent buildings subjected to repeated seismic excitations. Arab. J. Sci. Eng. 2018, 44, 4931–4945. [CrossRef]
- Flenga, M.G.; Favvata, M.J. Fragility curves and probabilistic seismic demand models on the seismic assessment of RC frames subjected to structural pounding. Appl. Sci. 2021, 11, 8253. [CrossRef]
- Flegga, M.G.; Favvata, M.J. Global and local performance levels on the probabilistic evaluation of the structural pounding effect between adjacent RC structures. In Proceedings of the 11th International Conference on Structural Dynamics (EURODYN 2020), Athens, Greece, 2020; Volume 2, pp. 3762–3779. [CrossRef]
- Flenga, M.G.; Favvata, M.J. Fragility assessment of the inter-story pounding risk between adjacent reinforced concrete structures based on probabilistic seismic demand models. In Proceedings of the 13th International Conference on Earthquake Resistant Engineering Structures (ERES 2021), Online Conference, 2021; pp. 3–13.
- Flenga, M.G.; Favvata, M.J. Probabilistic seismic assessment of the pounding risk based on the local demands of a multistory RC frame structure. Eng. Struct. 2021, 245, 112789. [CrossRef]
- Flenga, M.G.; Favvata, M.J. Investigating the efficiency and the sufficiency of IMs for the probabilistic seismic assessment of the pounding effect between adjacent RC structures. In Proceedings of the 9th ECCOMAS Thematic Conference on Computational Methods in Structural Dynamics and Earthquake Engineering (COMPDYN 2023), Athens, Greece, 12–14 June 2023.
- Flenga, M.G.; Favvata, M.J. The effect of magnitude Mw and distance Rrup on the fragility assessment of a multistory RC frame due to earthquake-induced structural pounding. Buildings 2023, 13, 1832. [CrossRef]
- Mohamed, H.; Romão, X. Seismic fragility functions for non-seismically designed RC structures considering pounding effects. Buildings 2021, 11, 665. [CrossRef]
- Kazemi, F.; Miari, M.; Jankowski, R. Investigating the effects of structural pounding on the seismic performance of adjacent RC and steel MRFs. Bull. Earthq. Eng. 2021, 19, 317–343. [CrossRef]
- Miari, M.; Jankowski, R. Incremental dynamic analysis and fragility assessment of buildings founded on different soil types experiencing structural pounding during earthquakes. Eng. Struct. 2022, 252, 113118. [CrossRef]
- Sinha, R.; Rao, B.N. Seismic fragility of non-ductile RC frames for pounding risk assessment. Structures 2023, 56, 104865. [CrossRef]
- Kazemi, F.; Asgarkhani, N.; Manguri, A.; Jankowski, R. Seismic probabilistic assessment of steel and reinforced concrete structures including earthquake-induced pounding. Arch. Civ. Mech. Eng. 2024, 24, 178. [CrossRef]
- Eurocode 2: Design of Concrete Structures. Part 1-1: General Rules and Rules for Buildings; EN 1992-1-1; European Committee for Standardization: Brussels, Belgium, 2002.
- Eurocode 8: Design of Structures for Earthquake Resistance. Part 1: General Rules, Seismic Actions and Rules for Buildings; EN 1998-1; European Committee for Standardization: Brussels, Belgium, 2004.
- Karayannis, C.G.; Favvata, M.J. Earthquake-induced interaction between adjacent reinforced concrete structures with non-equal heights. Earthq. Eng. Struct. Dyn. 2005, 34, 1–20. [CrossRef]
- Applied Technology Council (ATC). Seismic Evaluation and Retrofit of Concrete Buildings; Report No. ATC-40; Applied Technology Council: Redwood City, CA, USA, 1996.
- Vamvatsikos, D.; Cornell, C.A. Incremental dynamic analysis. Earthq. Eng. Struct. Dyn. 2002, 31, 491–514. [CrossRef]
- PEER Ground Motion Database. Available online: http://peer.berkeley.edu/peer_ground_motion_database (accessed on 10 February 2017).
Figure 1.
Examined multistory RC frame structures (a, b) subjected to floor-to-floor structural pounding at the middle level of the building’s total heigh H, contact area idealization (c), and contact element response model (d).
Figure 1.
Examined multistory RC frame structures (a, b) subjected to floor-to-floor structural pounding at the middle level of the building’s total heigh H, contact area idealization (c), and contact element response model (d).
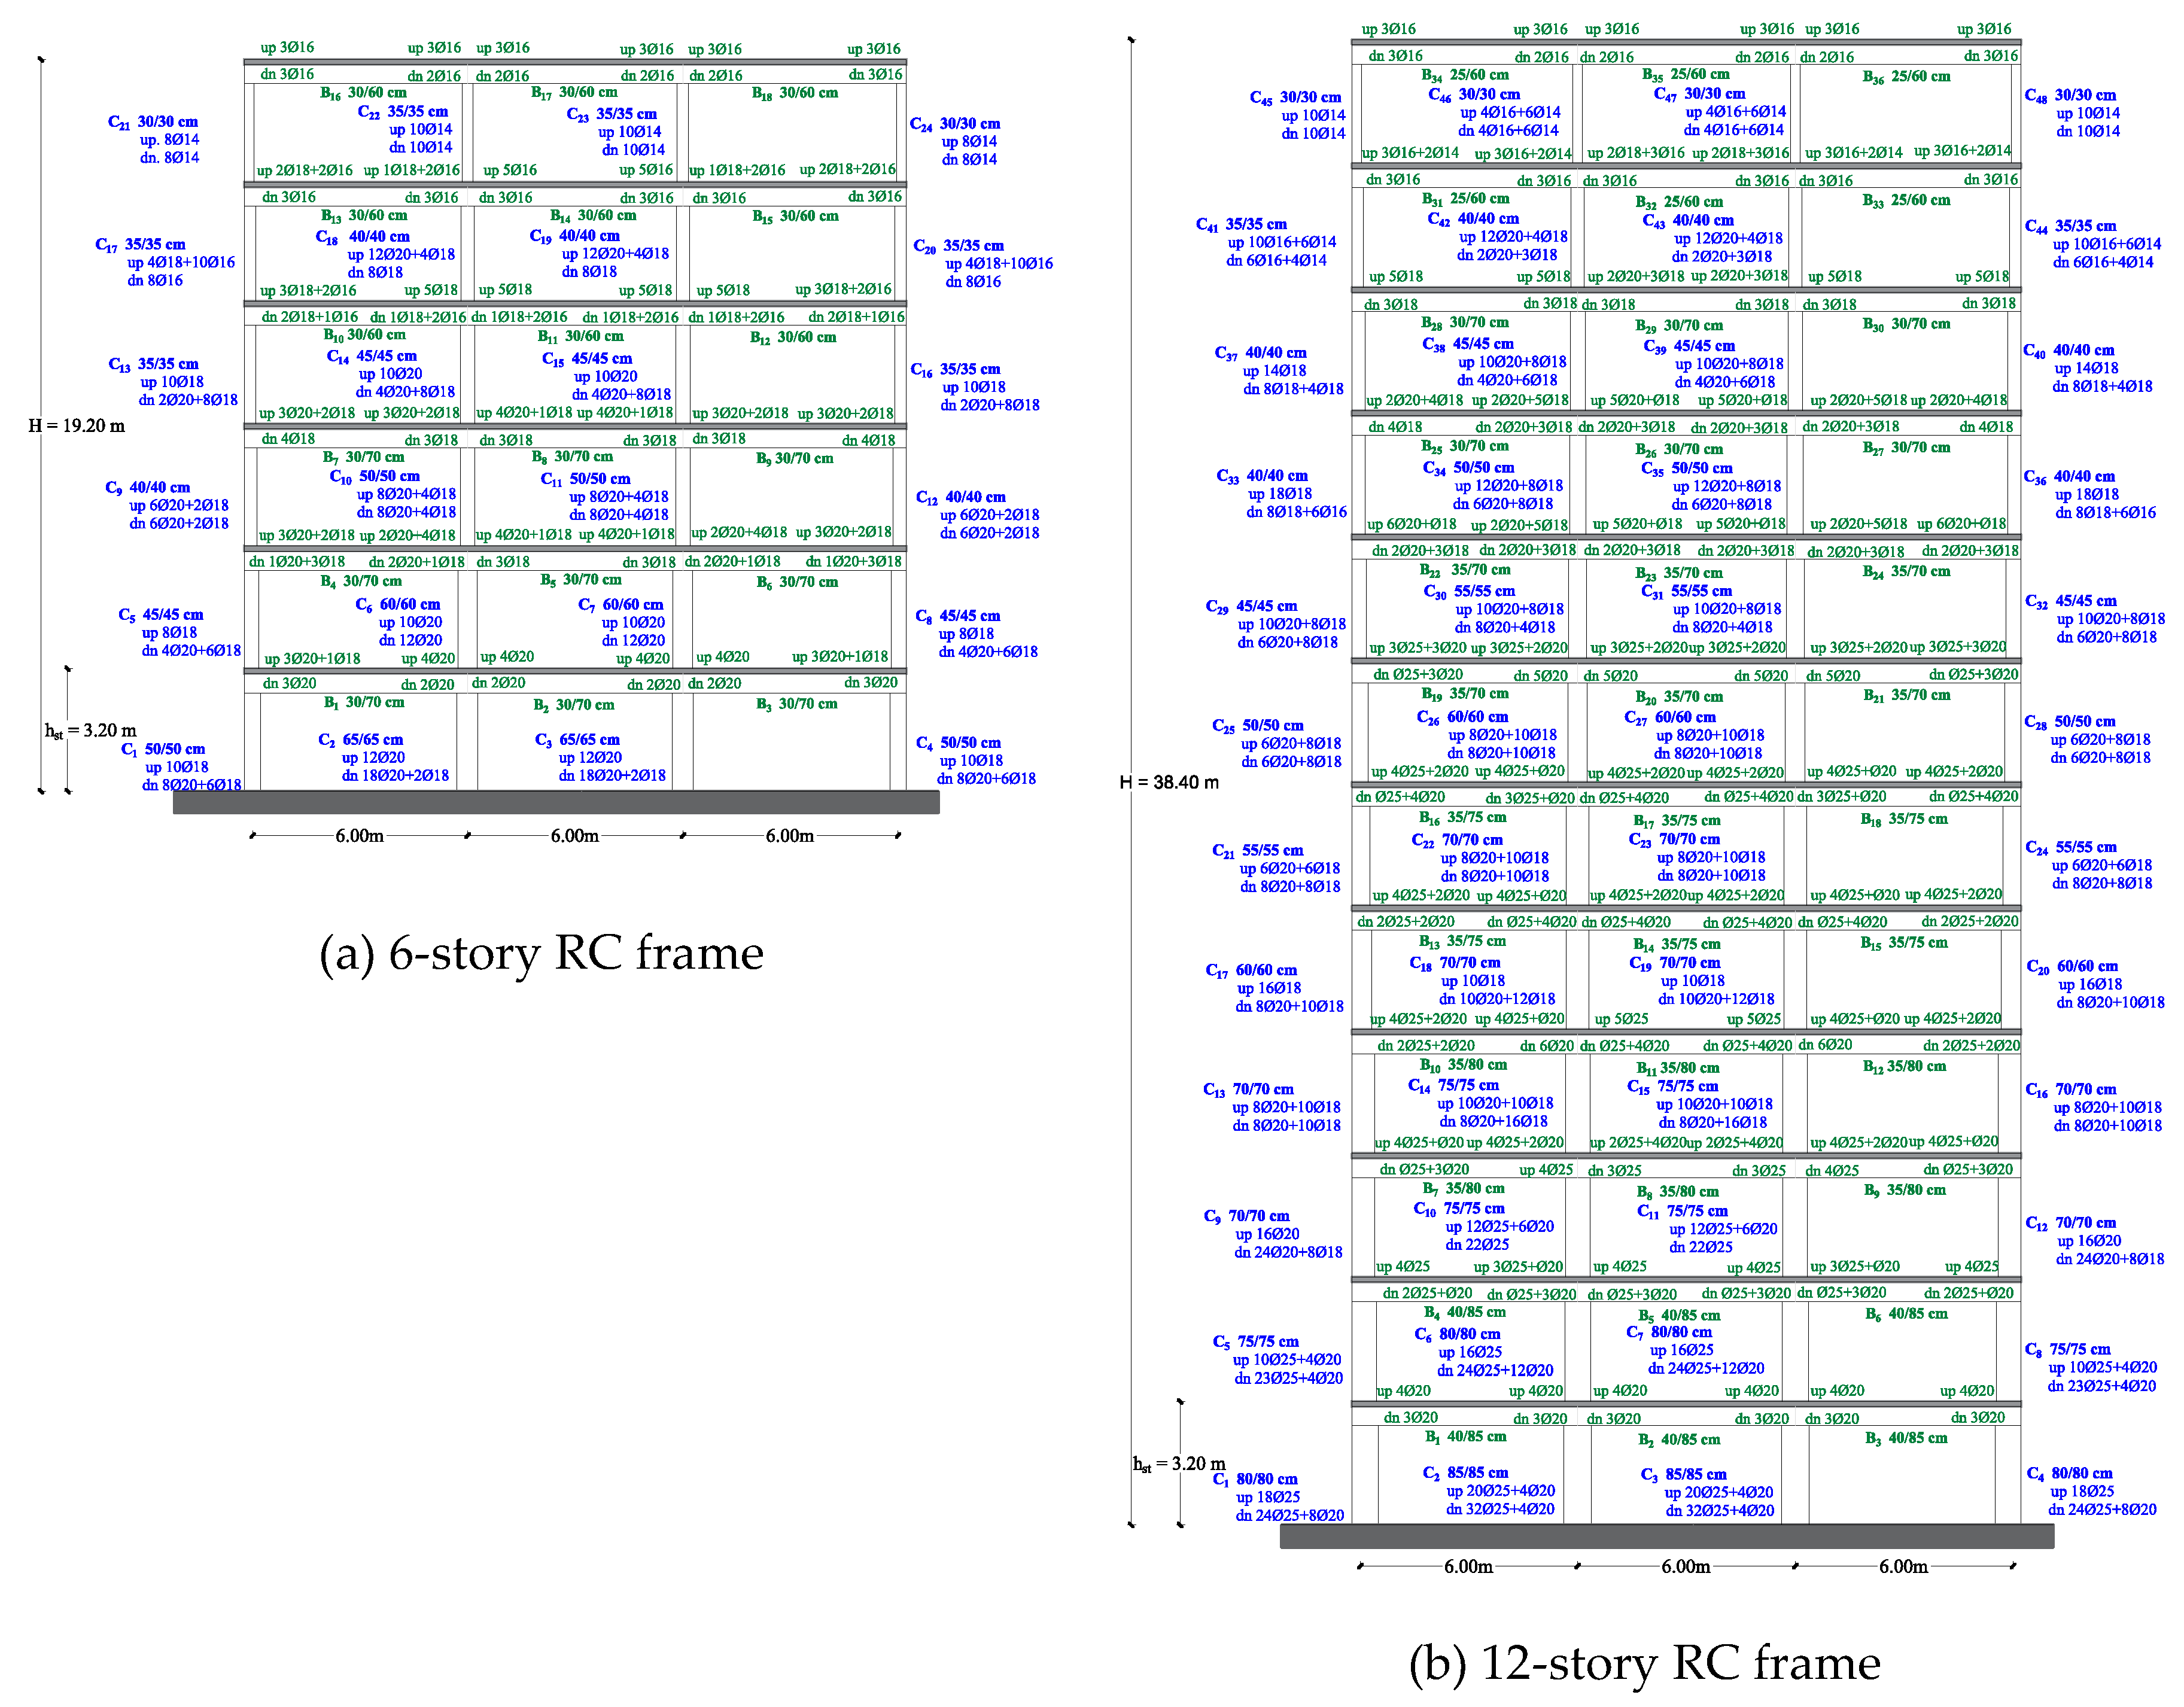
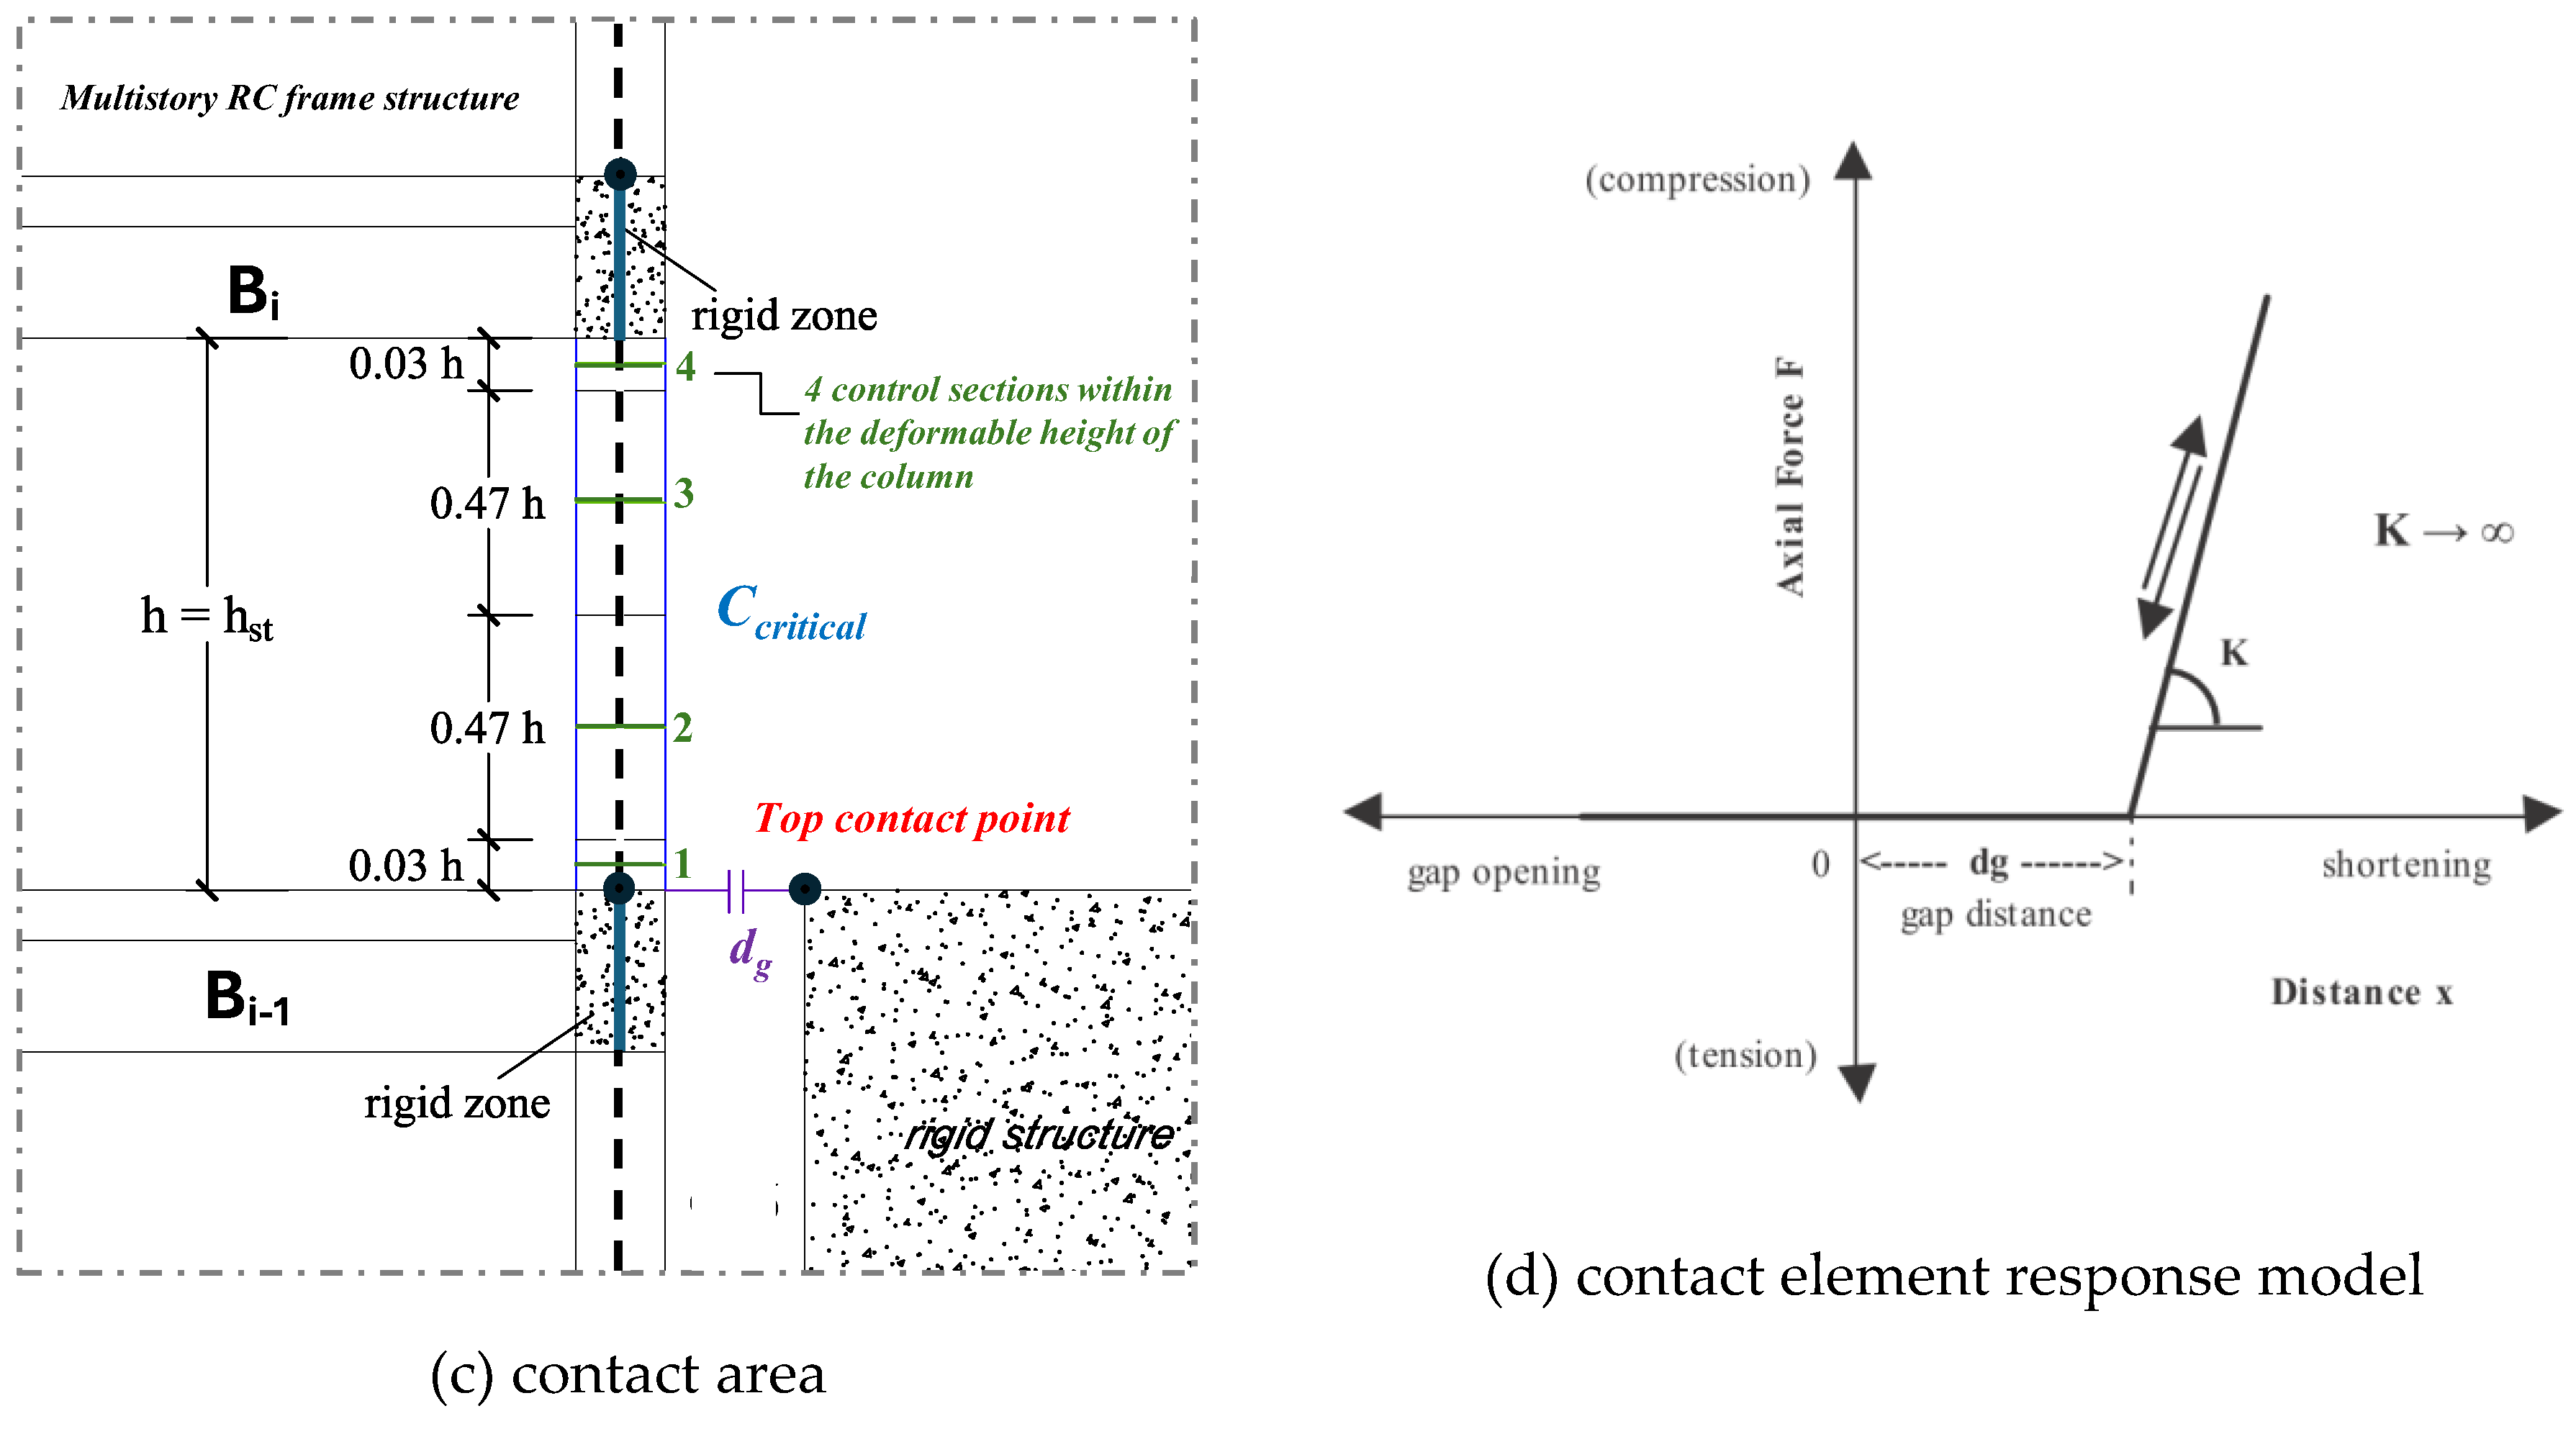
Figure 2.
Probability of pounding at different separation distances dg. (a) 6-story RC frame, and (b) 12-story RC frame.
Figure 2.
Probability of pounding at different separation distances dg. (a) 6-story RC frame, and (b) 12-story RC frame.
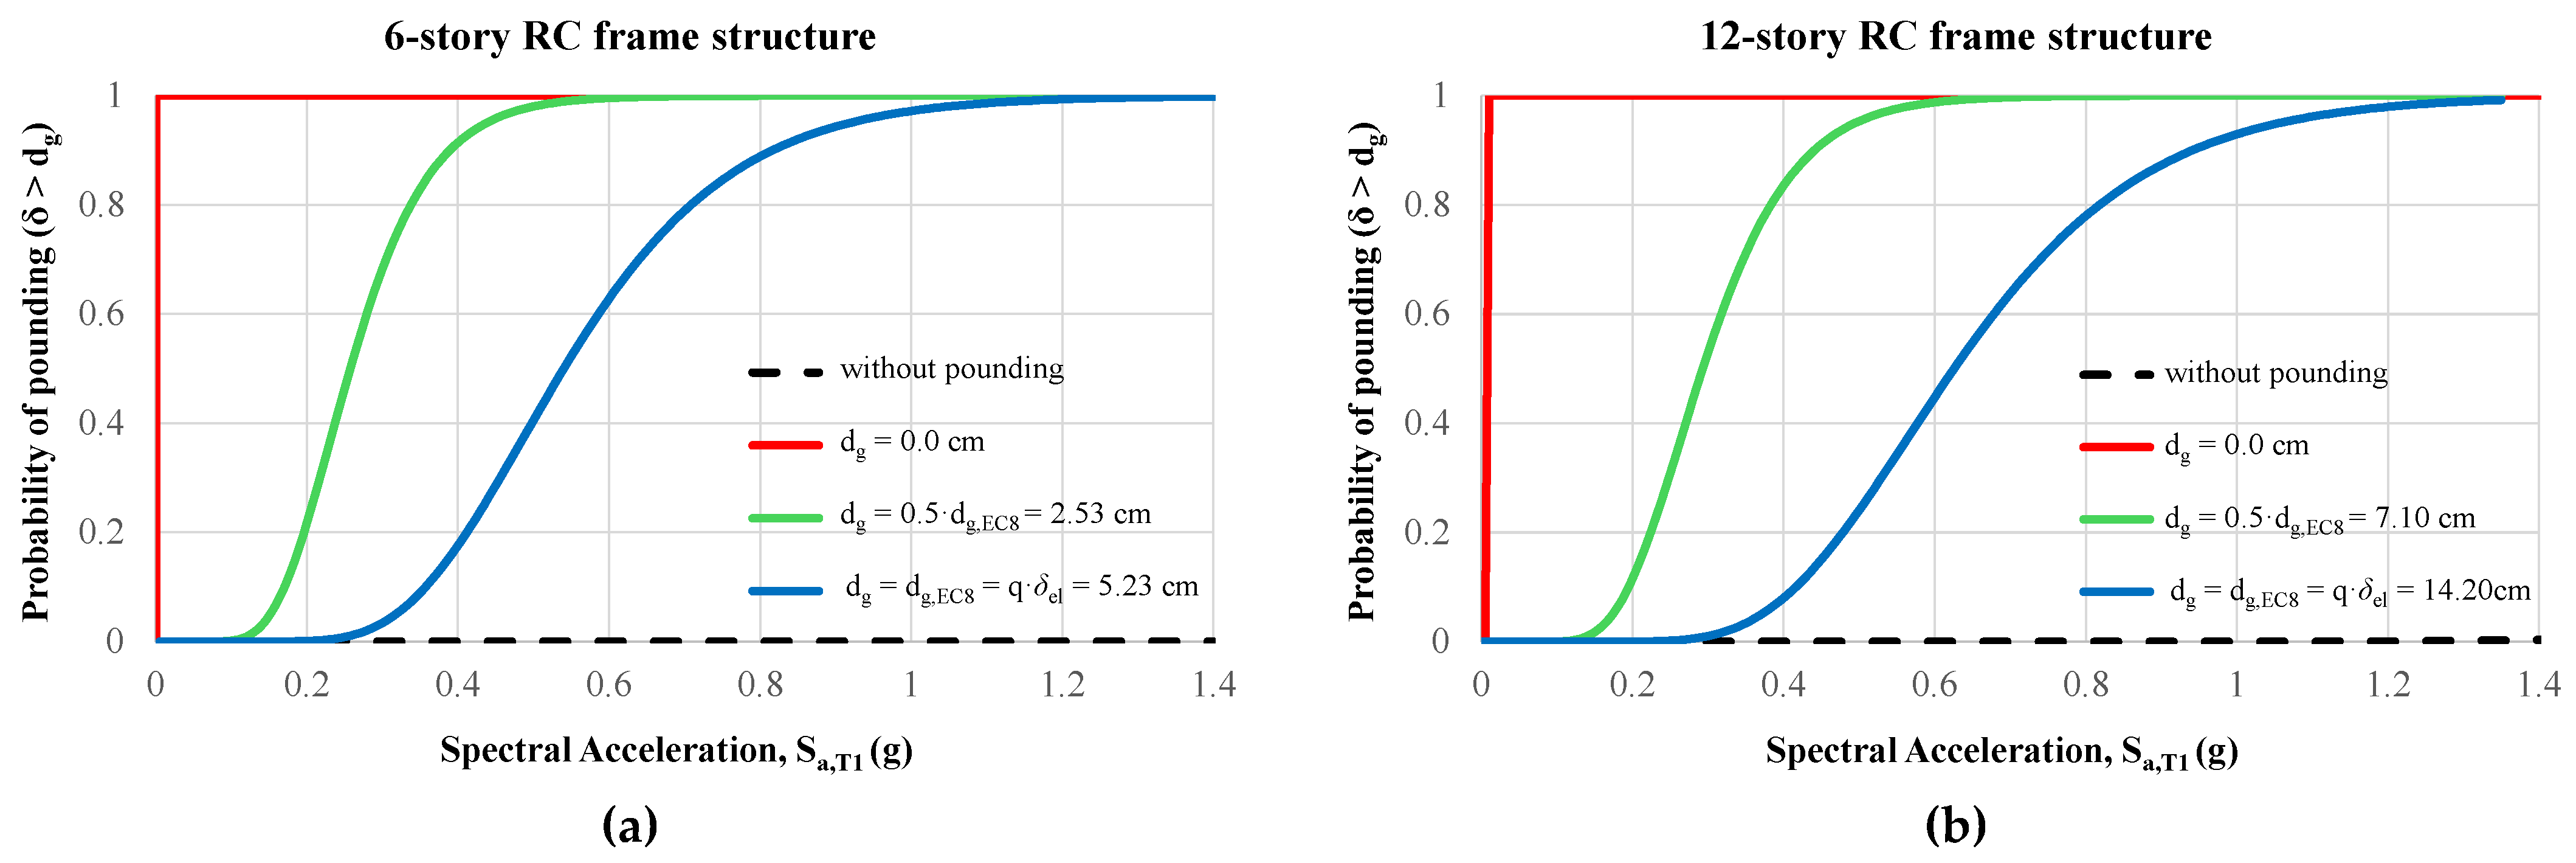
Figure 3.
Fragility curves of IDRmax at different PLs, and at different gap distances (dg) for the multistory RC structures subjected to floor-to-floor pounding; (a) 6-story RC frame, and (b) 12-story RC frame. Examined PLs; (1) IDRmax – IO, and (2) IDRmax - CP. Results for (i) , (ii) , (iii) , and iv) without pounding.
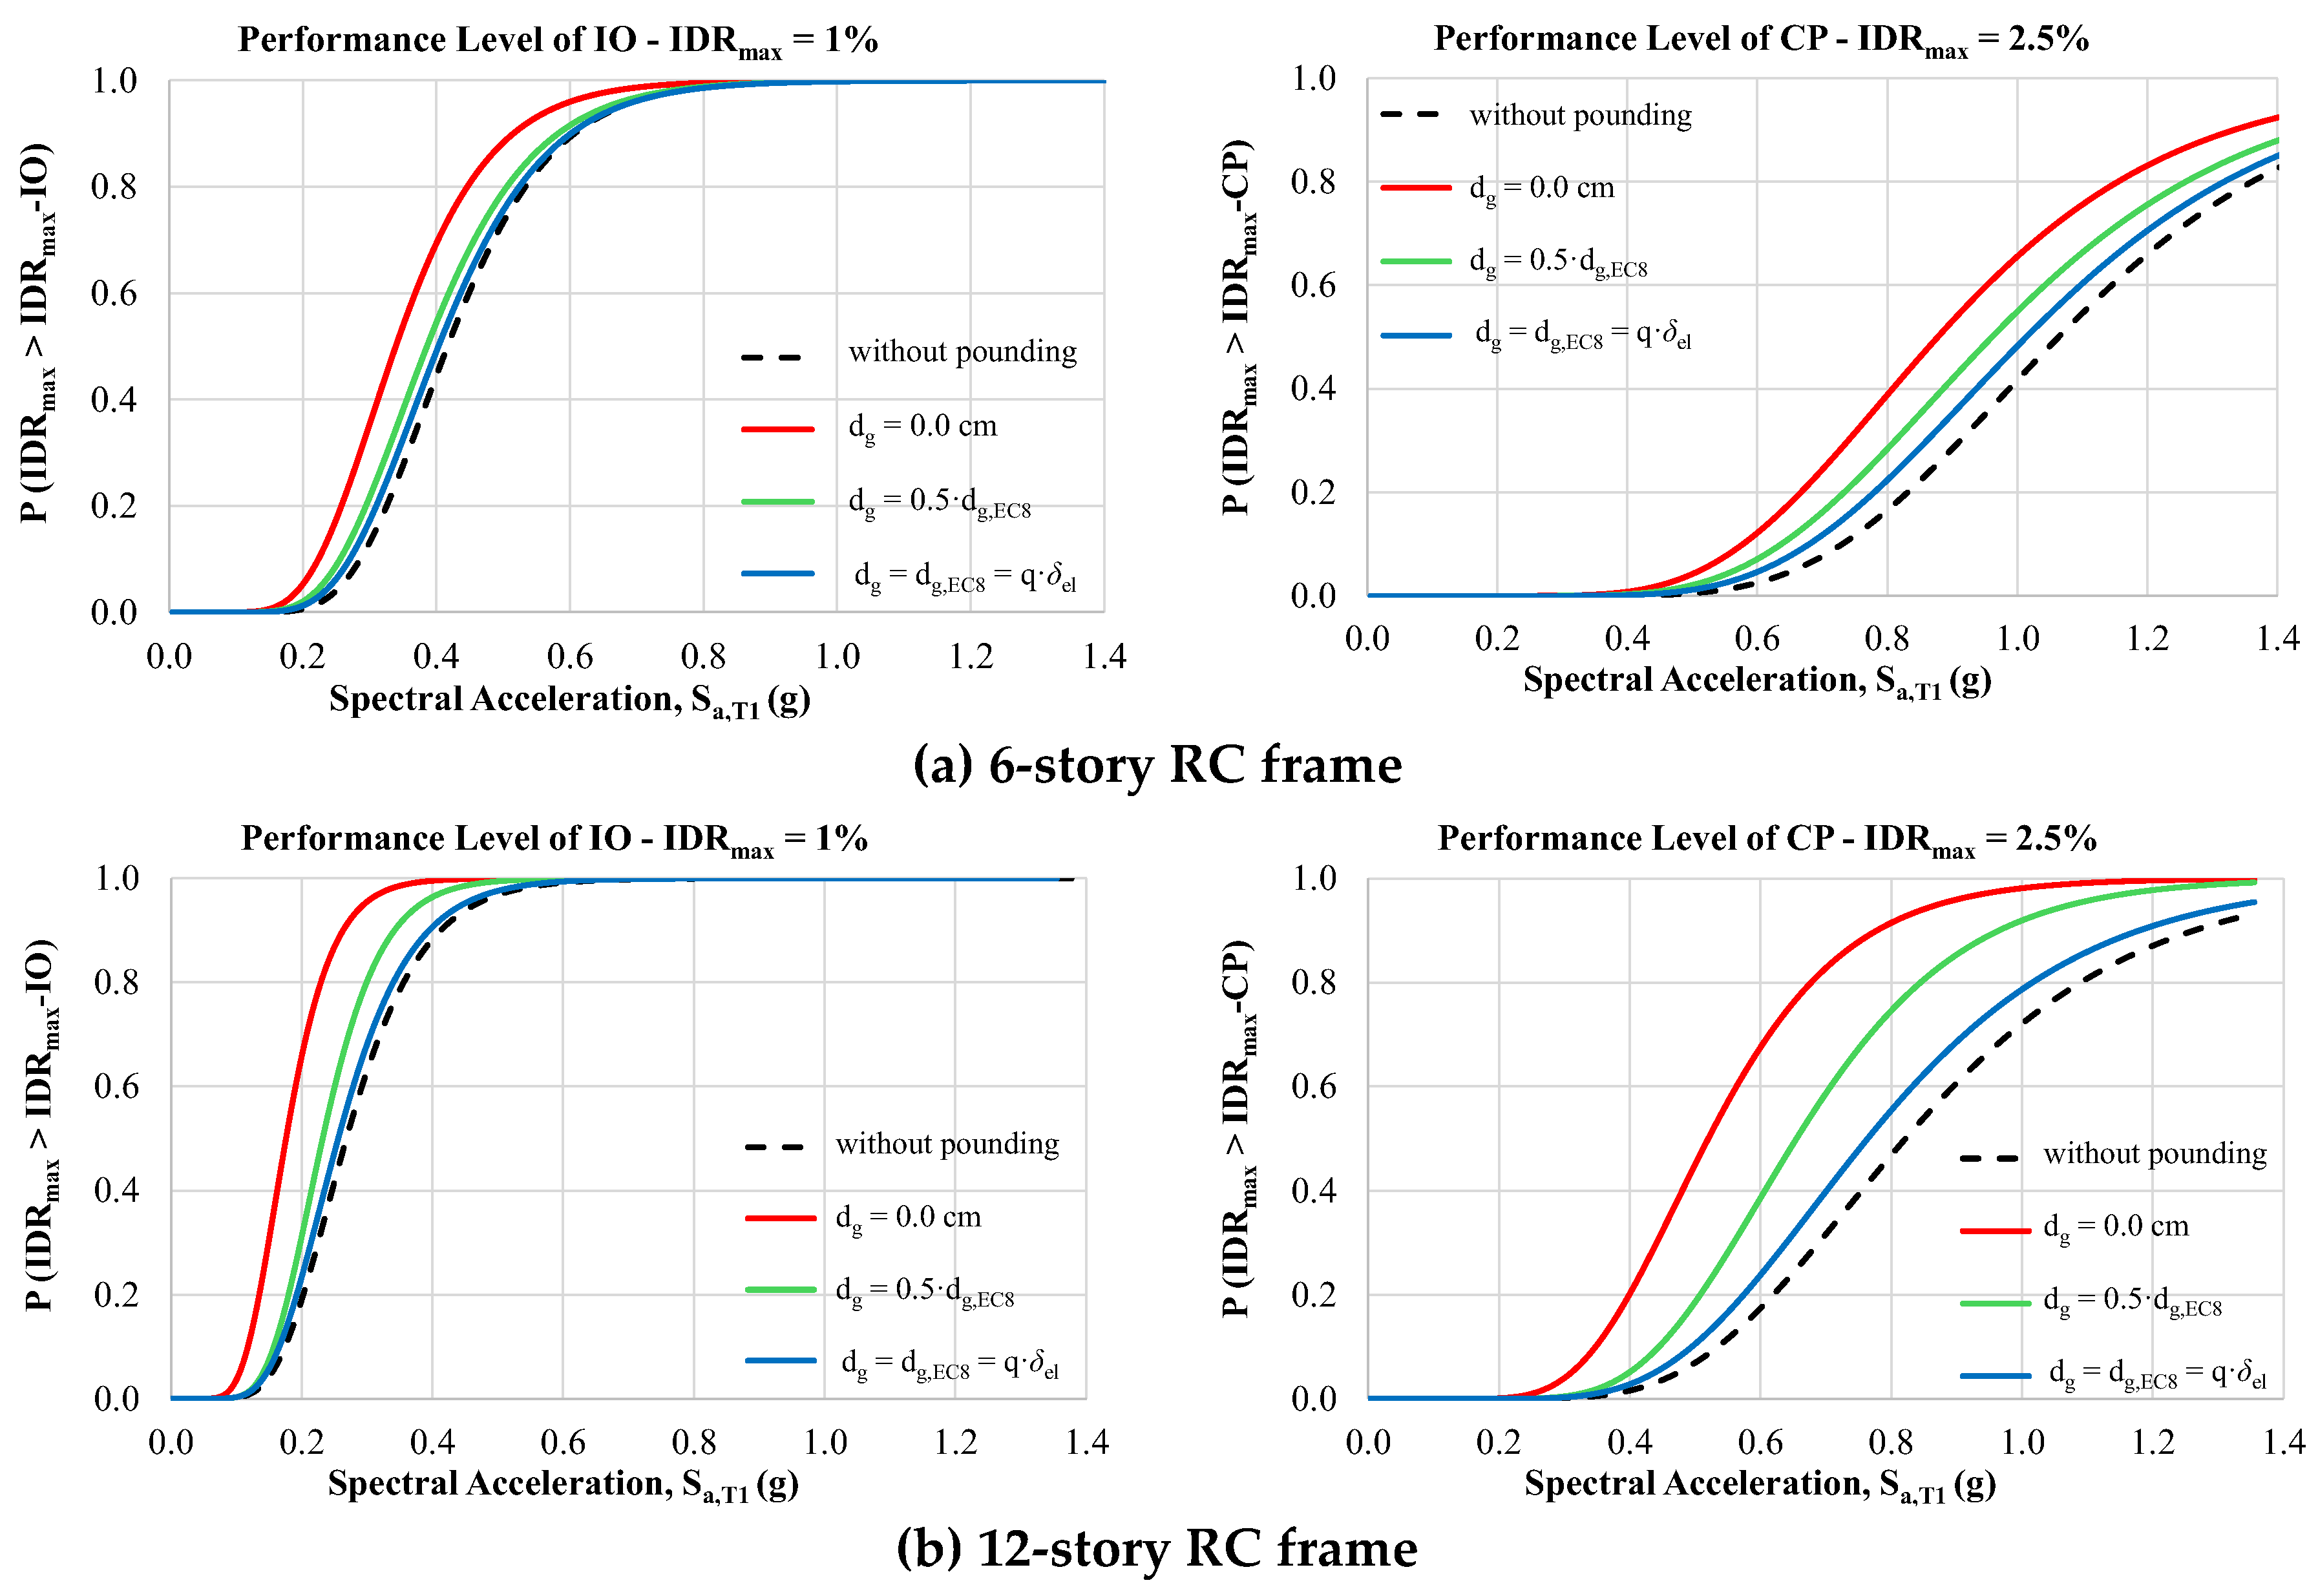
Figure 4.
Fragility curves of μφ,max at PLs, and at different gap distances (dg) for the multistory RC structures subjected to floor-to-floor pounding; (a) 6-story RC frame, and (b) 12-story RC frame. Results for (i)
Figure 4.
Fragility curves of μφ,max at PLs, and at different gap distances (dg) for the multistory RC structures subjected to floor-to-floor pounding; (a) 6-story RC frame, and (b) 12-story RC frame. Results for (i)
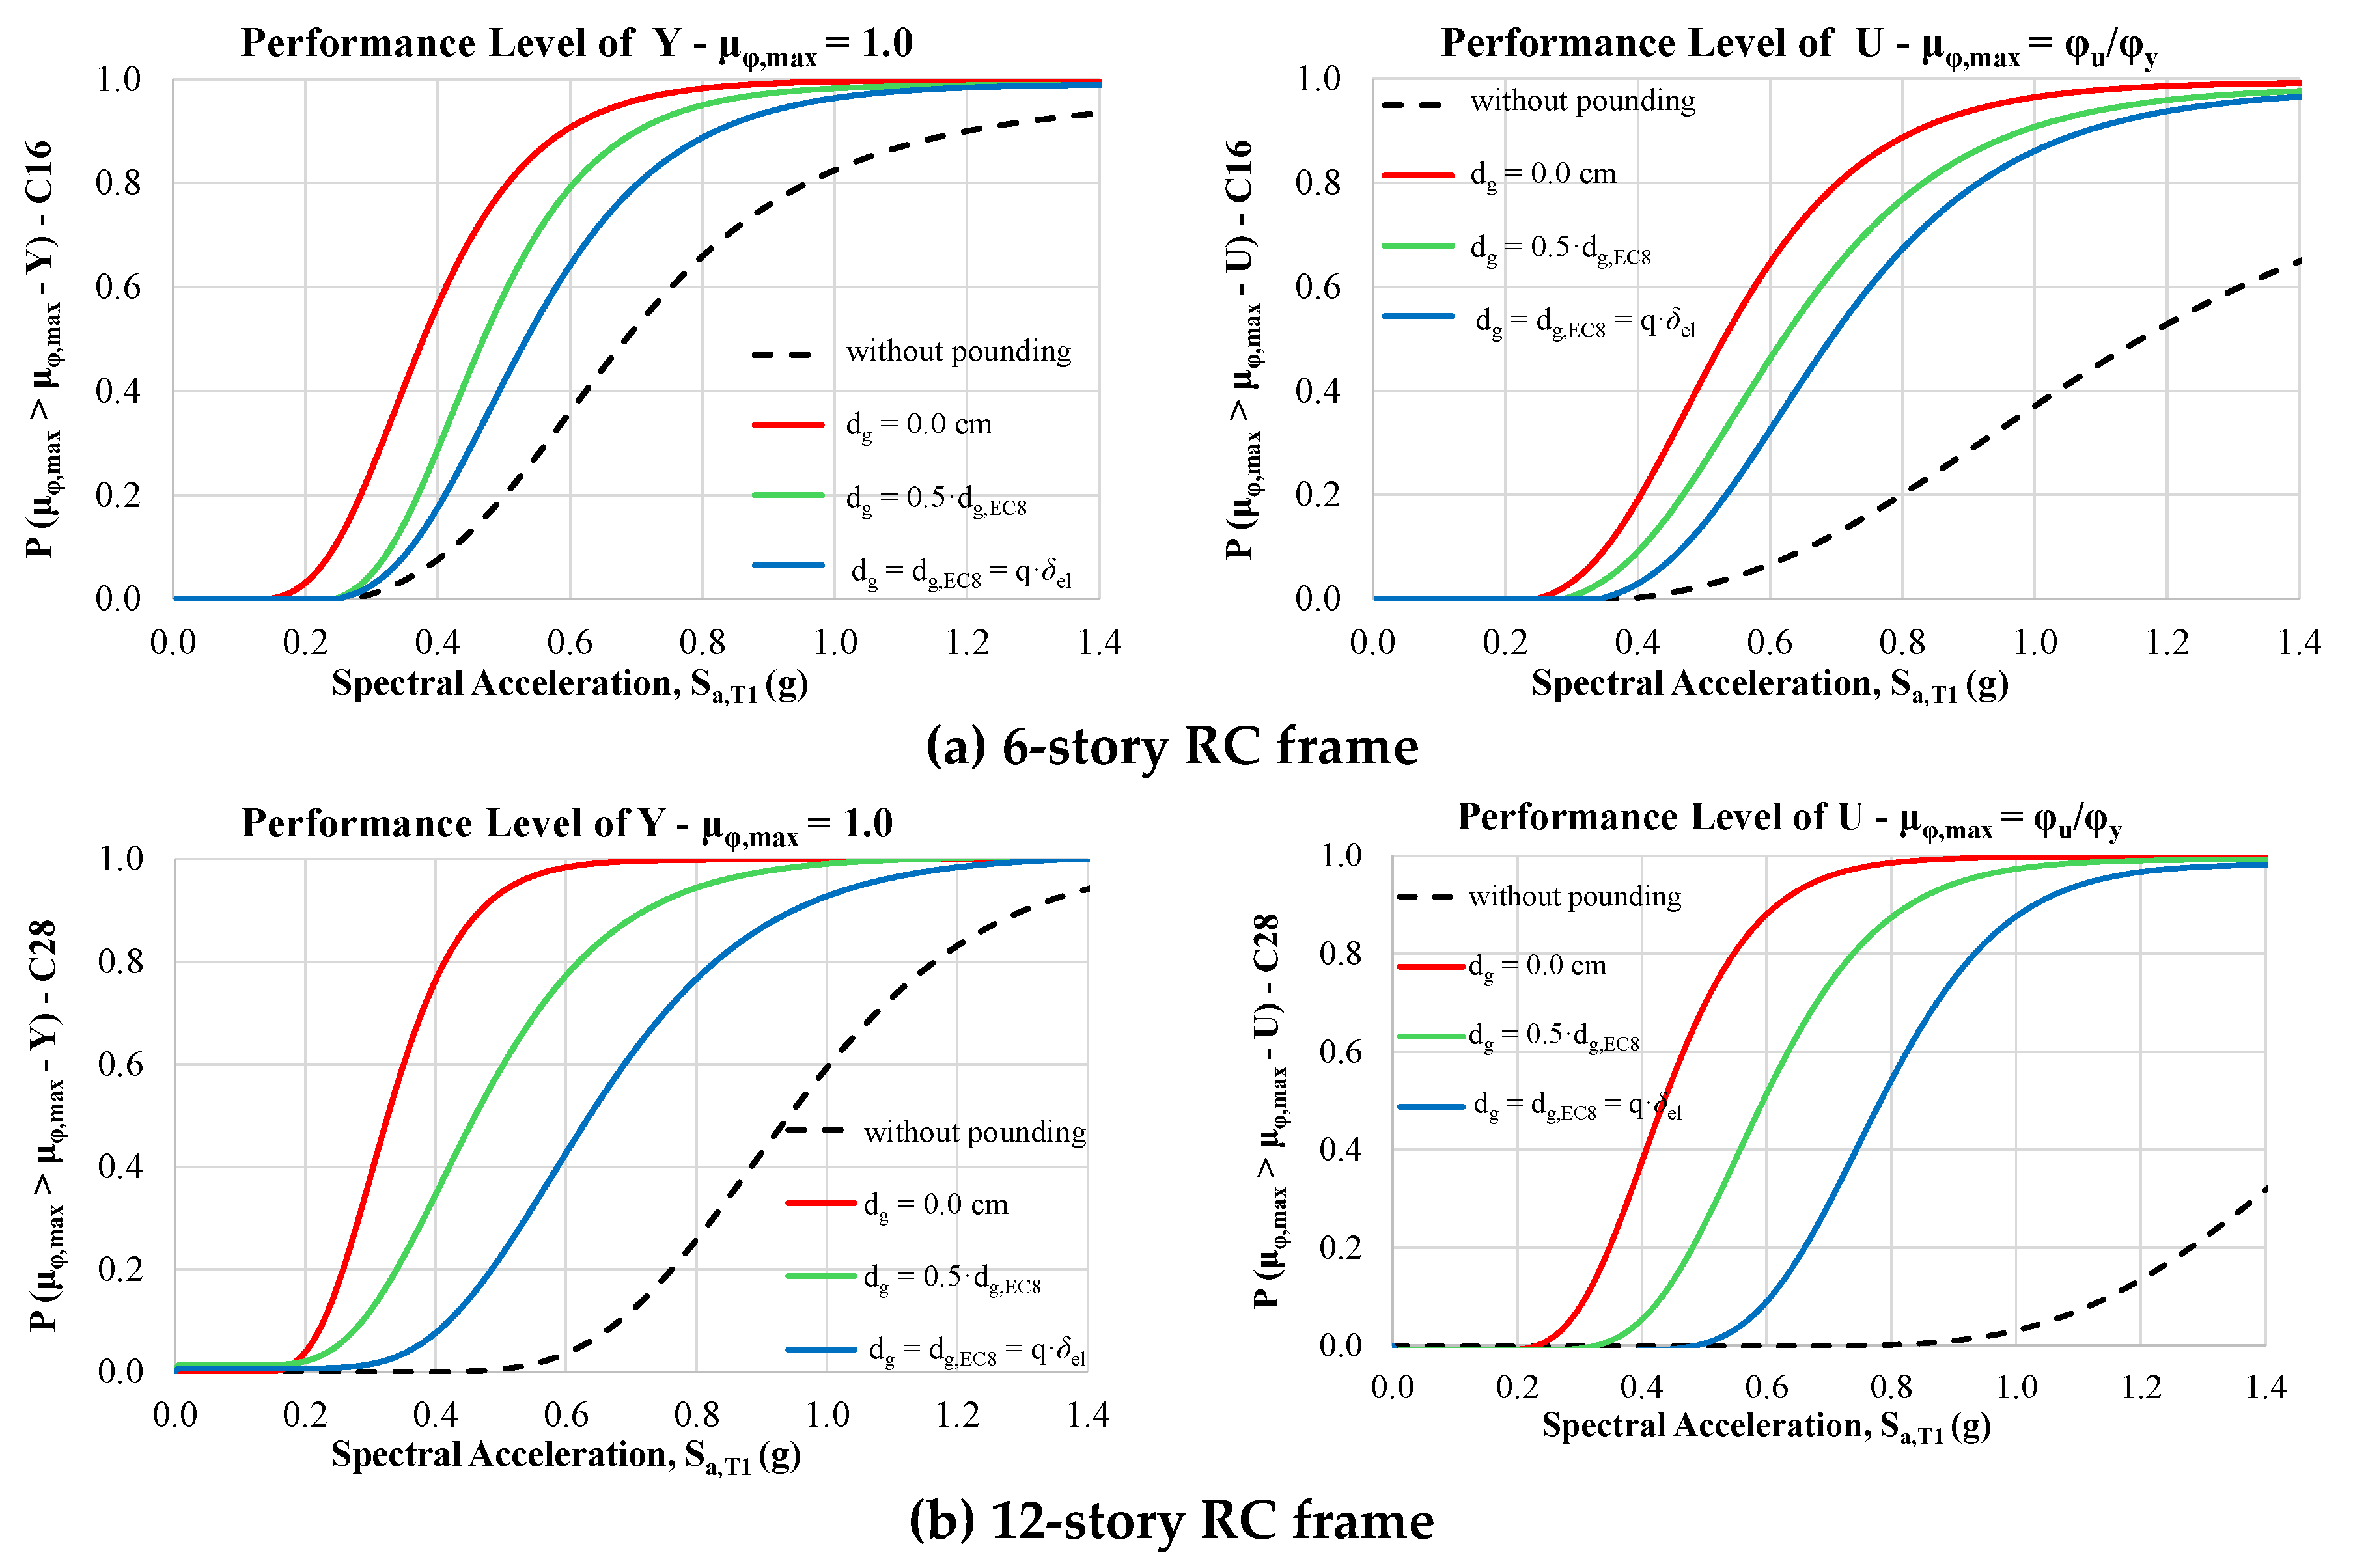
Figure 5.
Median values of Sa,wp for which IDRmax (a), and μφ,max (b) reach their capacity level at the examined PLs of each RC frame. Examined cases without structural pounding conditions.
Figure 5.
Median values of Sa,wp for which IDRmax (a), and μφ,max (b) reach their capacity level at the examined PLs of each RC frame. Examined cases without structural pounding conditions.
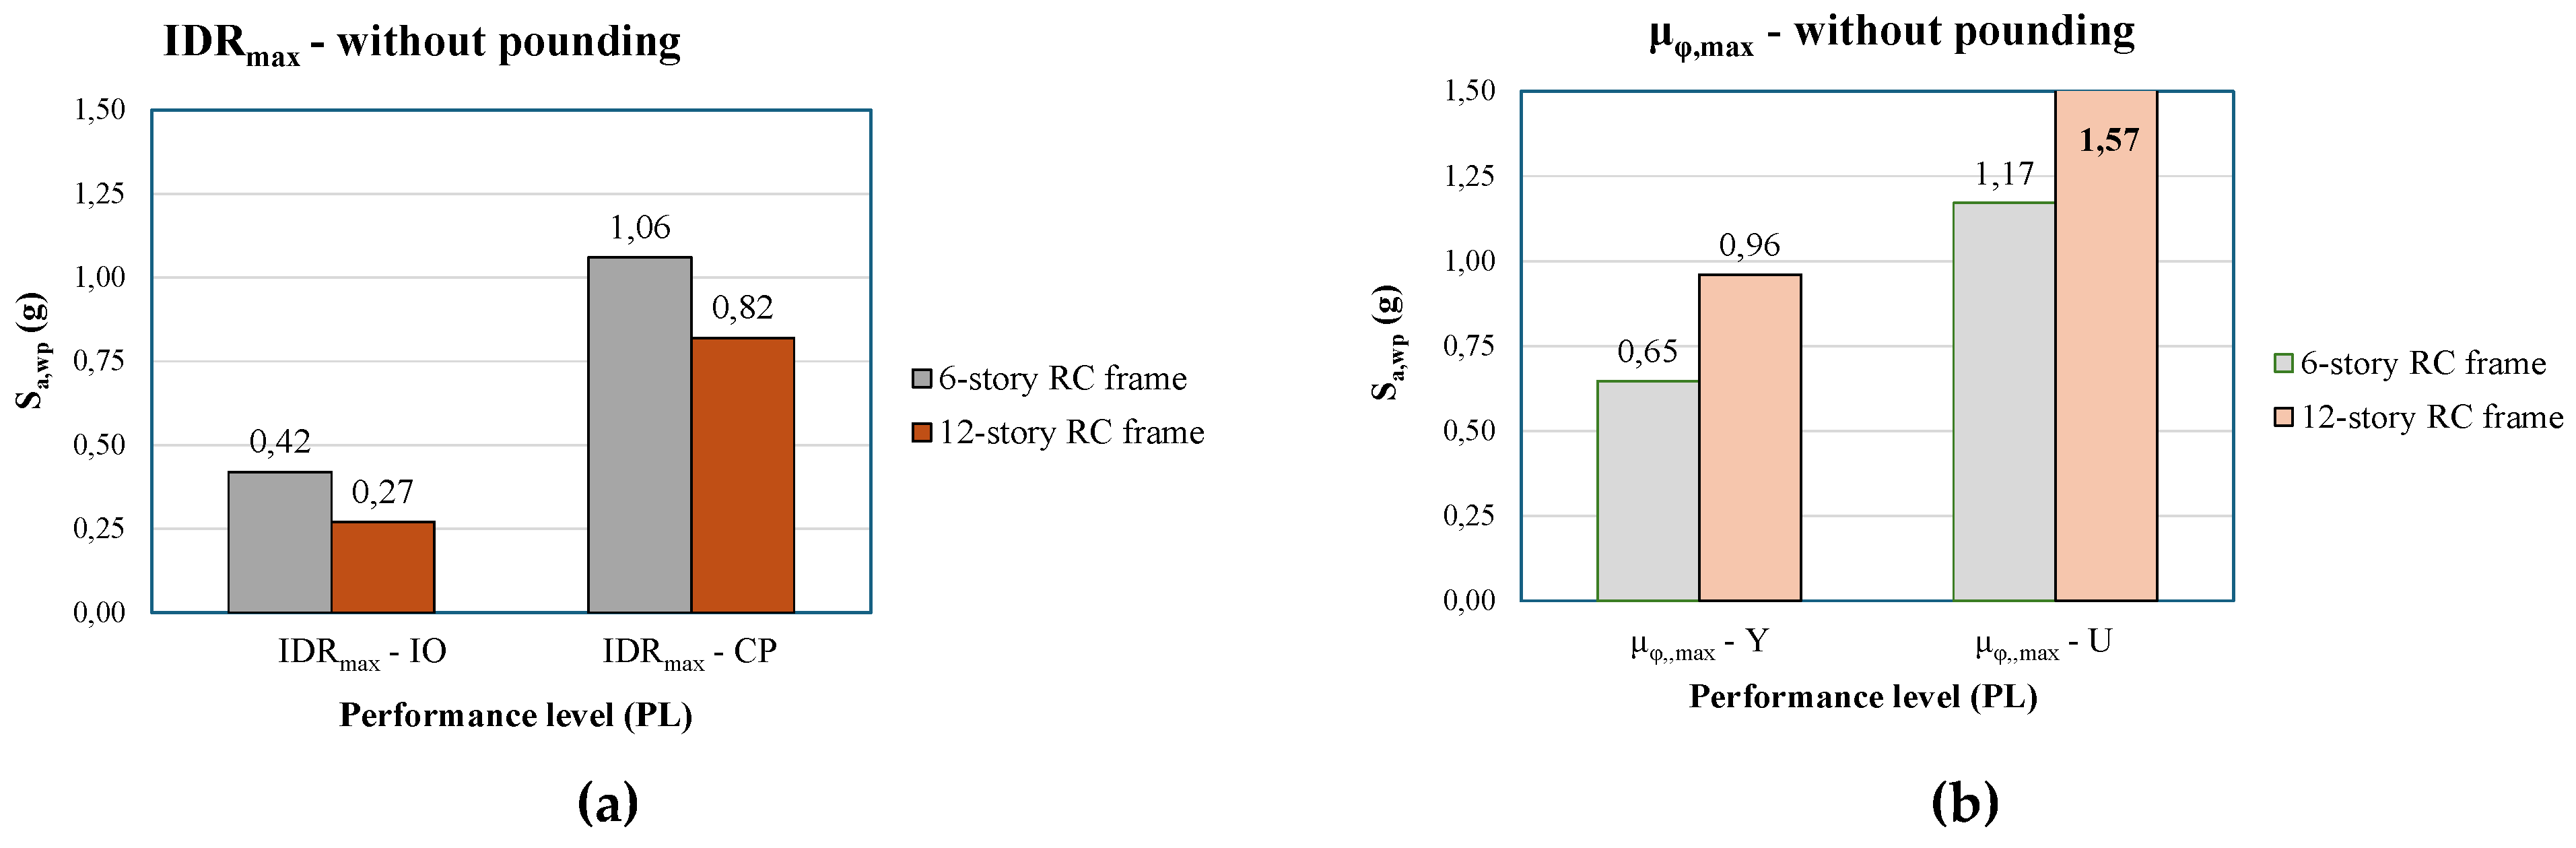
Figure 6.
Median values of Sa,dg as a function of dg at IDRmax - CP, μφ,max – U and when the probability of pounding is equal to 50%.
Figure 6.
Median values of Sa,dg as a function of dg at IDRmax - CP, μφ,max – U and when the probability of pounding is equal to 50%.
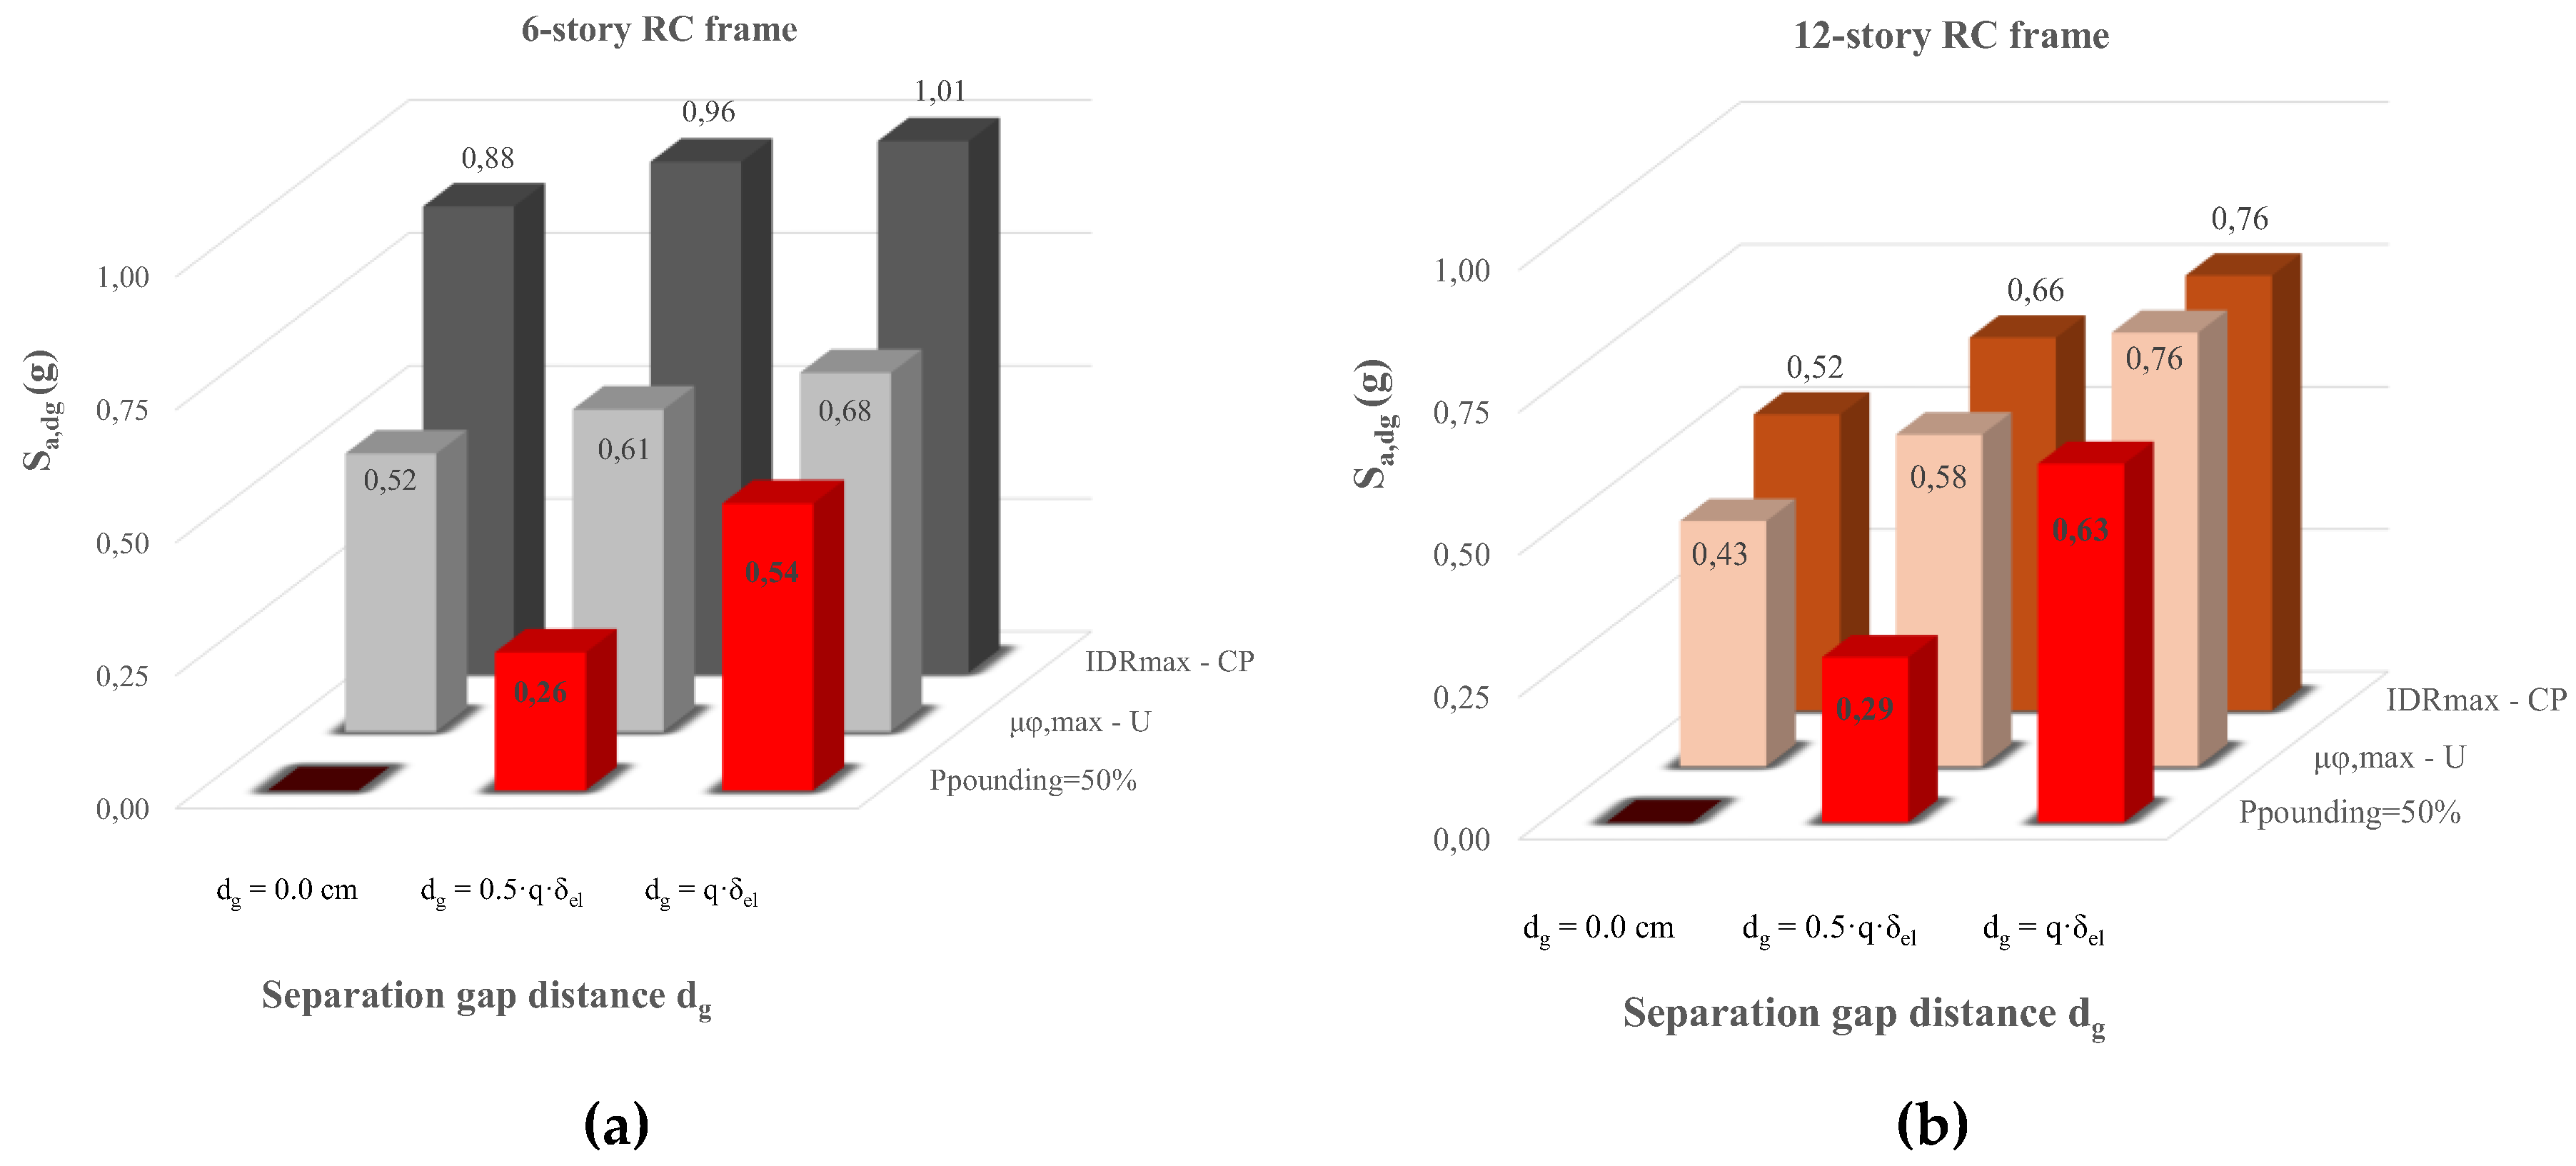
Figure 7.
Probability of pounding as a function of dg at different performance levels of IDRmax, and μφ,max. Results for (i) , (ii) , and (iii) .
Figure 7.
Probability of pounding as a function of dg at different performance levels of IDRmax, and μφ,max. Results for (i) , (ii) , and (iii) .
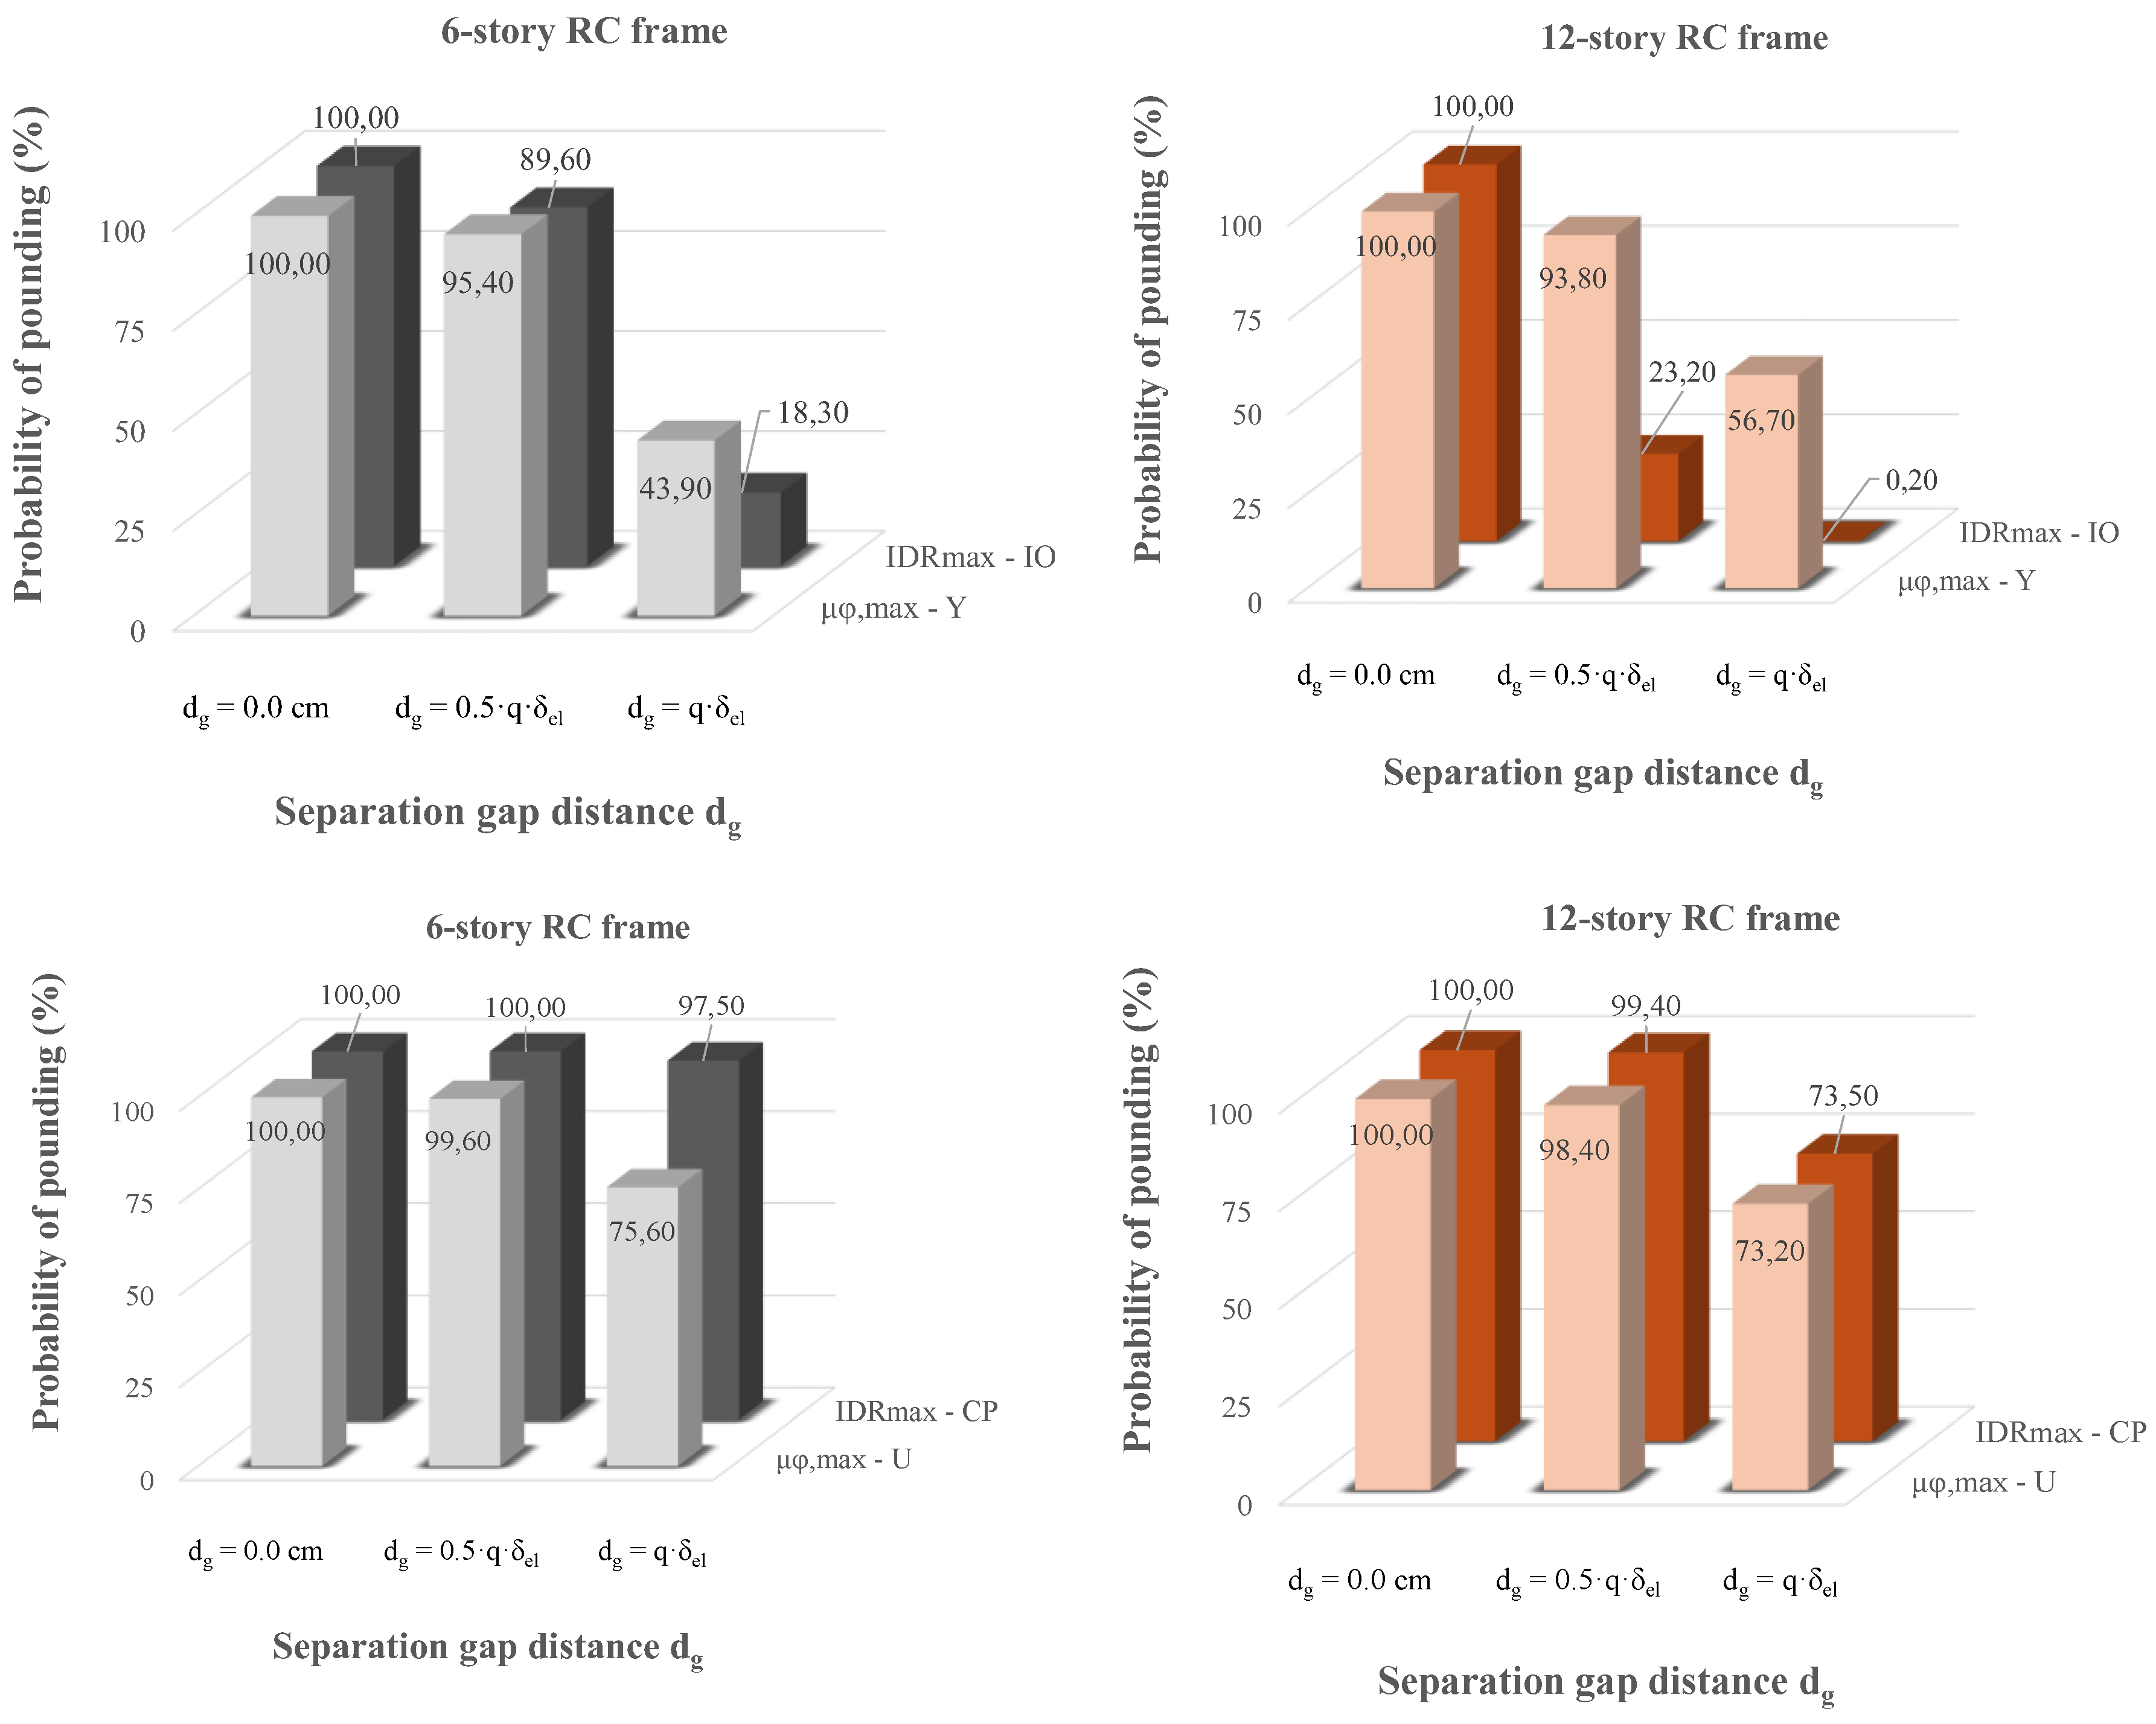
Figure 8.
Evaluation of the examined critical EDPs to assess an acceptable Sa,dg considering structural pounding conditions at different PLs, and at different separation gap distances; (i) , (ii) , and (iii) .
Figure 8.
Evaluation of the examined critical EDPs to assess an acceptable Sa,dg considering structural pounding conditions at different PLs, and at different separation gap distances; (i) , (ii) , and (iii) .
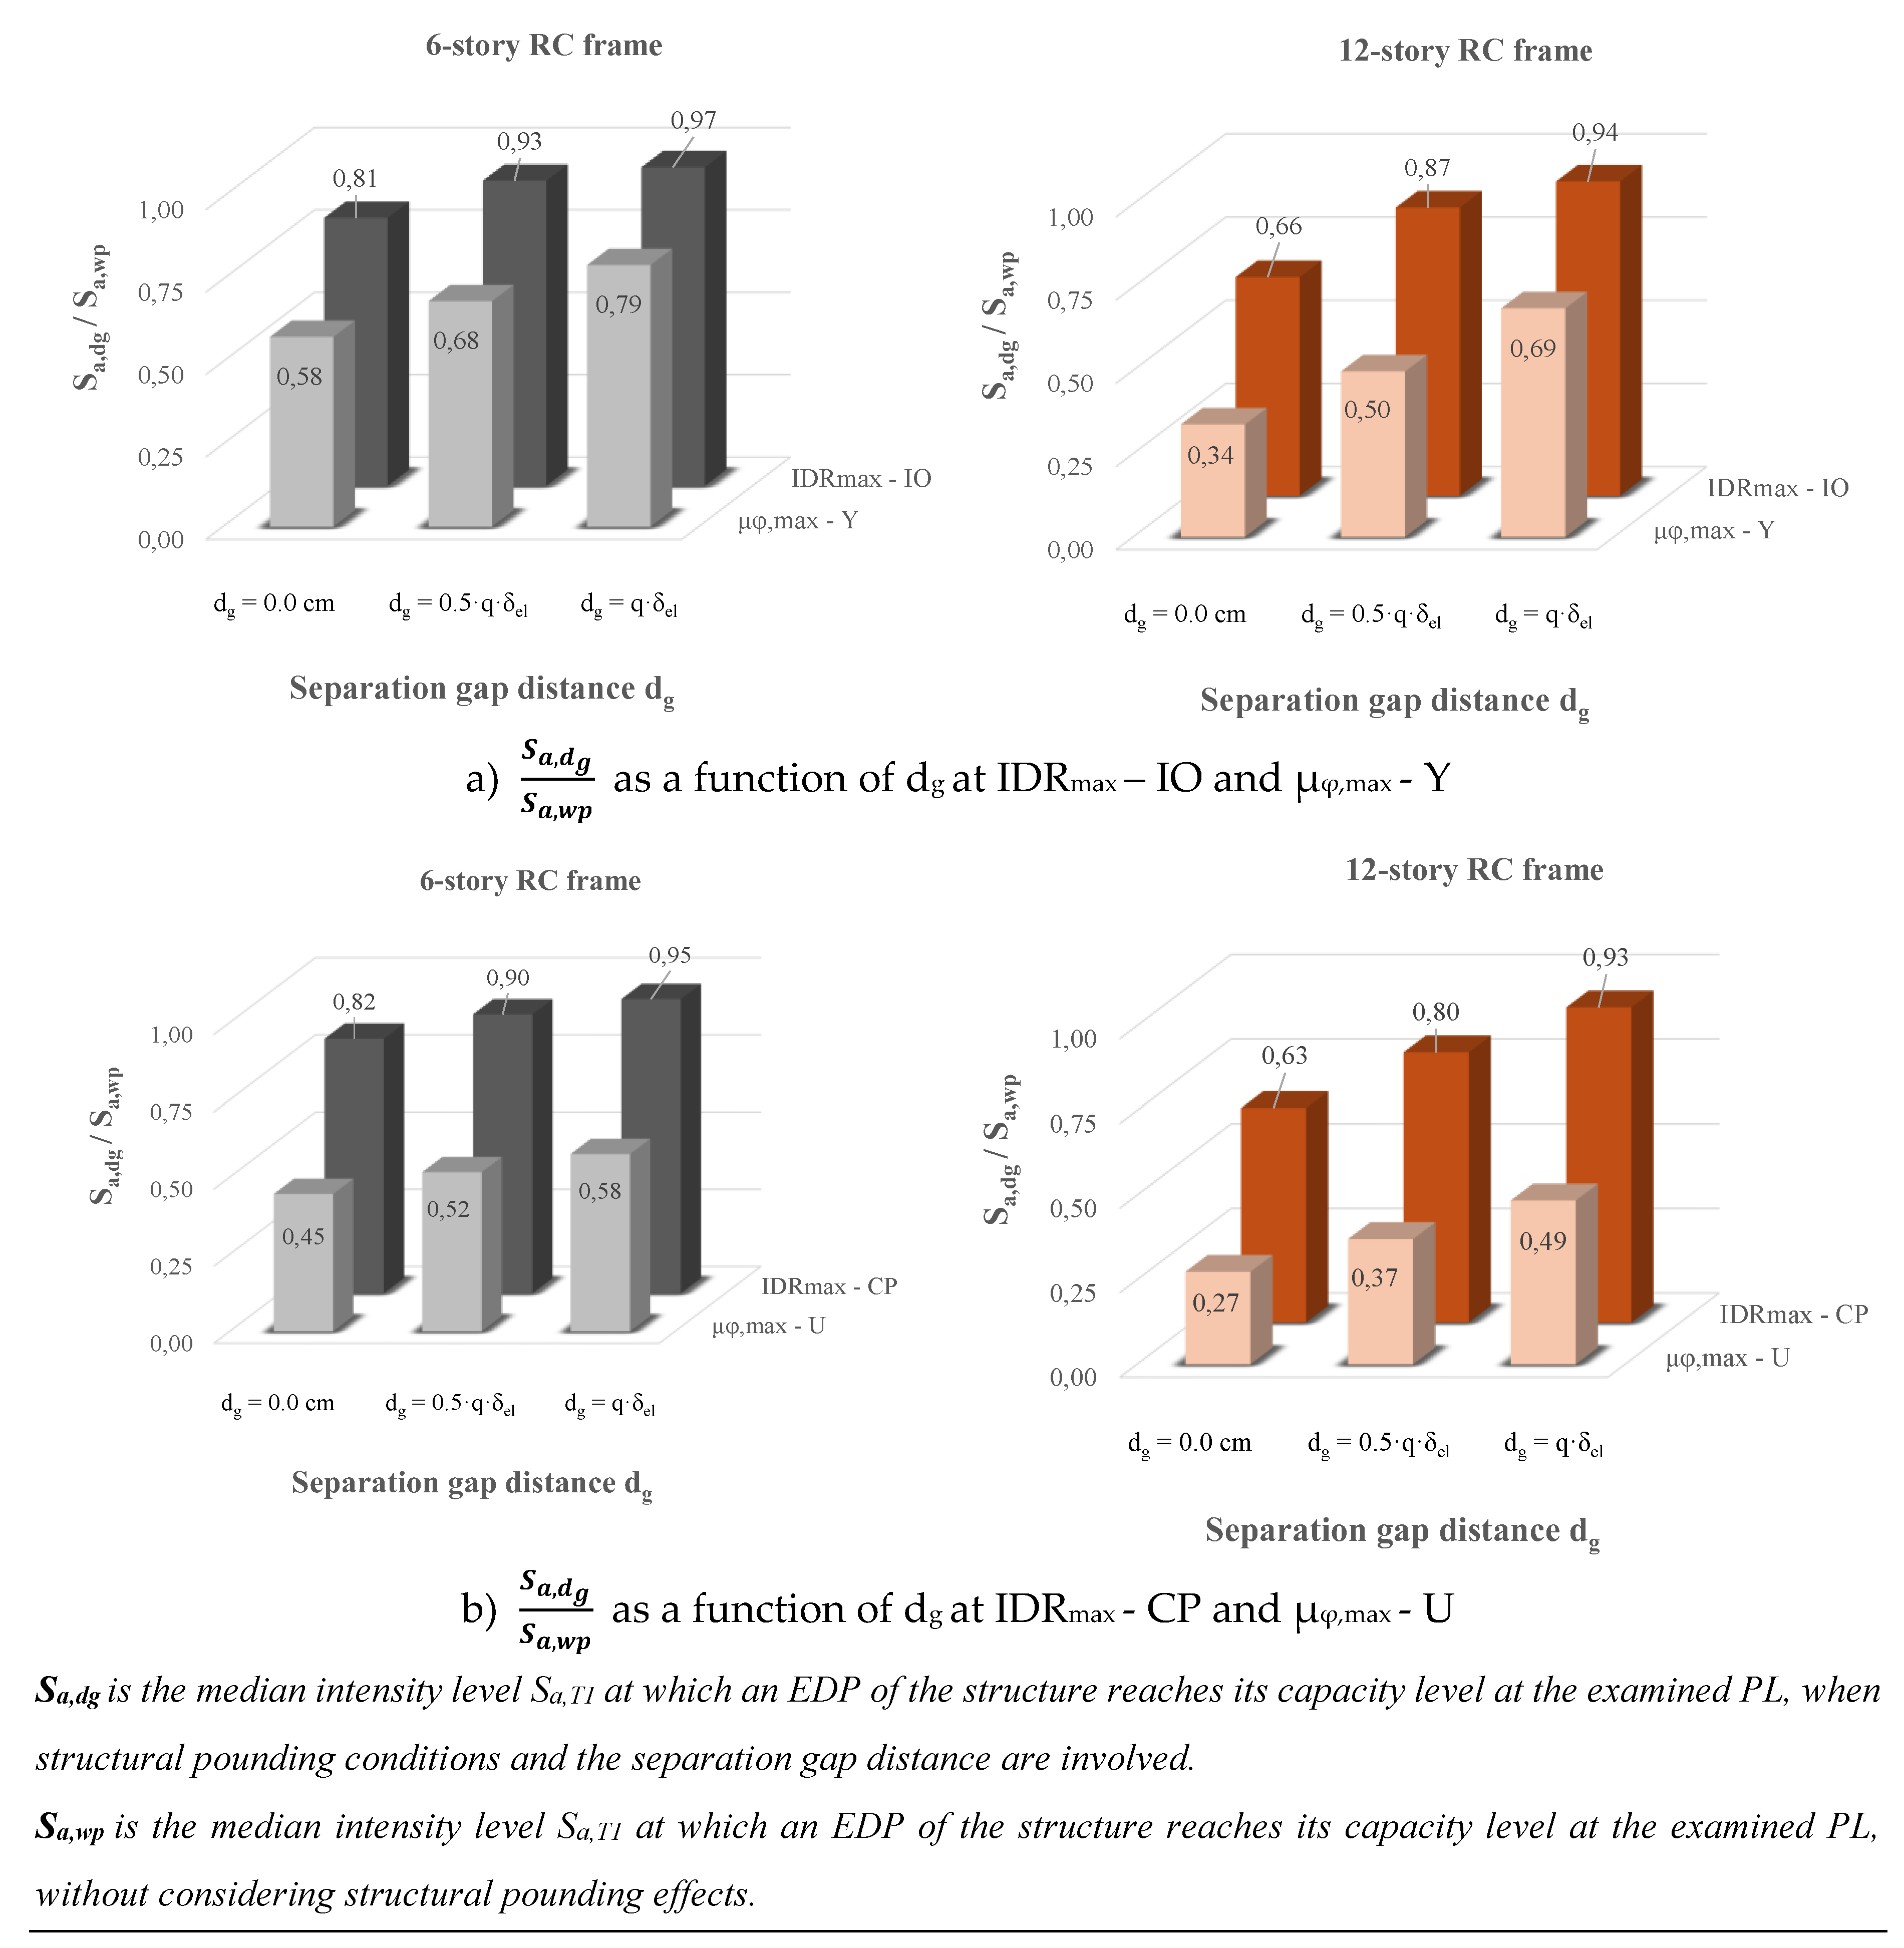

Table 1.
PSDMs of δmax|Sa,T1 , IDRmax|Sa,T1 and μφ,max|Sa,T1 for the multistory RC frame structures for all the examined cases.
Table 1.
PSDMs of δmax|Sa,T1 , IDRmax|Sa,T1 and μφ,max|Sa,T1 for the multistory RC frame structures for all the examined cases.
| Pounding case | RC frame structure | EDP = aΙΜb | βEDP|IM | |
| without pounding | 6-story RC structure | δmax = 0.096 Sa,T10.980 | 0.316 | |
| 12-story RC structure | δmax = 0.218 Sa,T10.913 | 0.291 | ||
| without pounding | 6-story RC structure | IDRmax = 2.354 Sa,T10.978 | 0.286 | |
| 12-story RC structure | IDRmax = 2.939 Sa,T10.819 | 0.275 | ||
| dg = 0.0 cm | 6-story RC structure | IDRmax = 2.835 Sa,T10.964 | 0.314 | |
| 12-story RC structure | IDRmax = 4.349 Sa,T10.845 | 0.266 | ||
| dg = 0.5⋅dg,EC8 | 6-story RC structure | IDRmax = 2.601 Sa,T11.005 | 0.322 | |
| 12-story RC structure | IDRmax = 3.633 Sa,T10.883 | 0.267 | ||
| dg = dg,EC8 | 6-story RC structure | IDRmax = 2.467 Sa,T10.994 | 0.310 | |
| 12-story RC structure | IDRmax = 3.133 Sa,T10.838 | 0.284 | ||
| without pounding | 6-story RC structure | μφ,max - C16 = 1.439 Sa,T10.836 | Sa,T1 ≤ 0.647g | 0.222 |
| μφ,max - C16 = 1.632 Sa,T11.125 | Sa,T1 ≥ 0.647g | 0.577 | ||
| 12-story RC structure | μφ,max - C28 = 1.050 Sa,T10.728 | Sa,T1 ≤ 0.960g | 0.175 | |
| μφ,max - C28 = 1.075 Sa,T11.308 | Sa,T1 ≥ 0.960g | 0.325 | ||
| dg = 0.0 cm | 6-story RC structure | μφ,max - C16 = 2.465 Sa,T10.914 | Sa,T1 ≤ 0.373g | 0.289 |
| μφ,max - C16 = 7.000 Sa,T11.973 | Sa,T1 ≥ 0.373g | 0.729 | ||
| 12-story RC structure | μφ,max - C28 = 2.430 Sa,T10.787 | Sa,T1 ≤ 0.325g | 0.205 | |
| μφ,max - C28 = 13.929 Sa,T12.34 | Sa,T1 ≥ 0.325g | 0.684 | ||
| dg = 0.5⋅dg,EC8 | 6-story RC structure | μφ,max - C16 = 2.173 Sa,T10.952 | Sa,T1 ≤ 0.443g | 0.168 |
| μφ,max - C16 = 5.658 Sa,T12.128 | Sa,T1 ≥ 0.443g | 0.866 | ||
| 12-story RC structure | μφ,max - C28 = 1.925 Sa,T10.882 | Sa,T1 ≤ 0.478g | 0.387 | |
| μφ,max - C28 = 28.646 Sa,T13.355 | Sa,T1 ≥ 0.478g | 1.004 | ||
| dg = dg,EC8 | 6-story RC structure | μφ,max - C16 = 1.831 Sa,T10.907 | Sa,T1 ≤ 0.514g | 0.215 |
| μφ,max - C16 = 5.083 Sa,T12.441 | Sa,T1 ≥ 0.514g | 0.970 | ||
| 12-story RC structure | μφ,max - C28 = 1.426 Sa,T10.809 | Sa,T1 ≤ 0.660g | 0.290 | |
| μφ,max - C28 = 6.639 Sa,T14.513 | Sa,T1 ≥ 0.660g | 1.206 | ||
Disclaimer/Publisher’s Note: The statements, opinions and data contained in all publications are solely those of the individual author(s) and contributor(s) and not of MDPI and/or the editor(s). MDPI and/or the editor(s) disclaim responsibility for any injury to people or property resulting from any ideas, methods, instructions or products referred to in the content. |
© 2025 by the authors. Licensee MDPI, Basel, Switzerland. This article is an open access article distributed under the terms and conditions of the Creative Commons Attribution (CC BY) license (http://creativecommons.org/licenses/by/4.0/).
Copyright: This open access article is published under a Creative Commons CC BY 4.0 license, which permit the free download, distribution, and reuse, provided that the author and preprint are cited in any reuse.


