Preprint
Article

This version is not peer-reviewed.

Fluorescence and Phosphorescence Assay of -D Glucans from Basidiomycete Medicinal Mushrooms

A peer-reviewed article of this preprint also exists.

Submitted:

15 December 2025

Posted:

16 December 2025

You are already at the latest version

Abstract

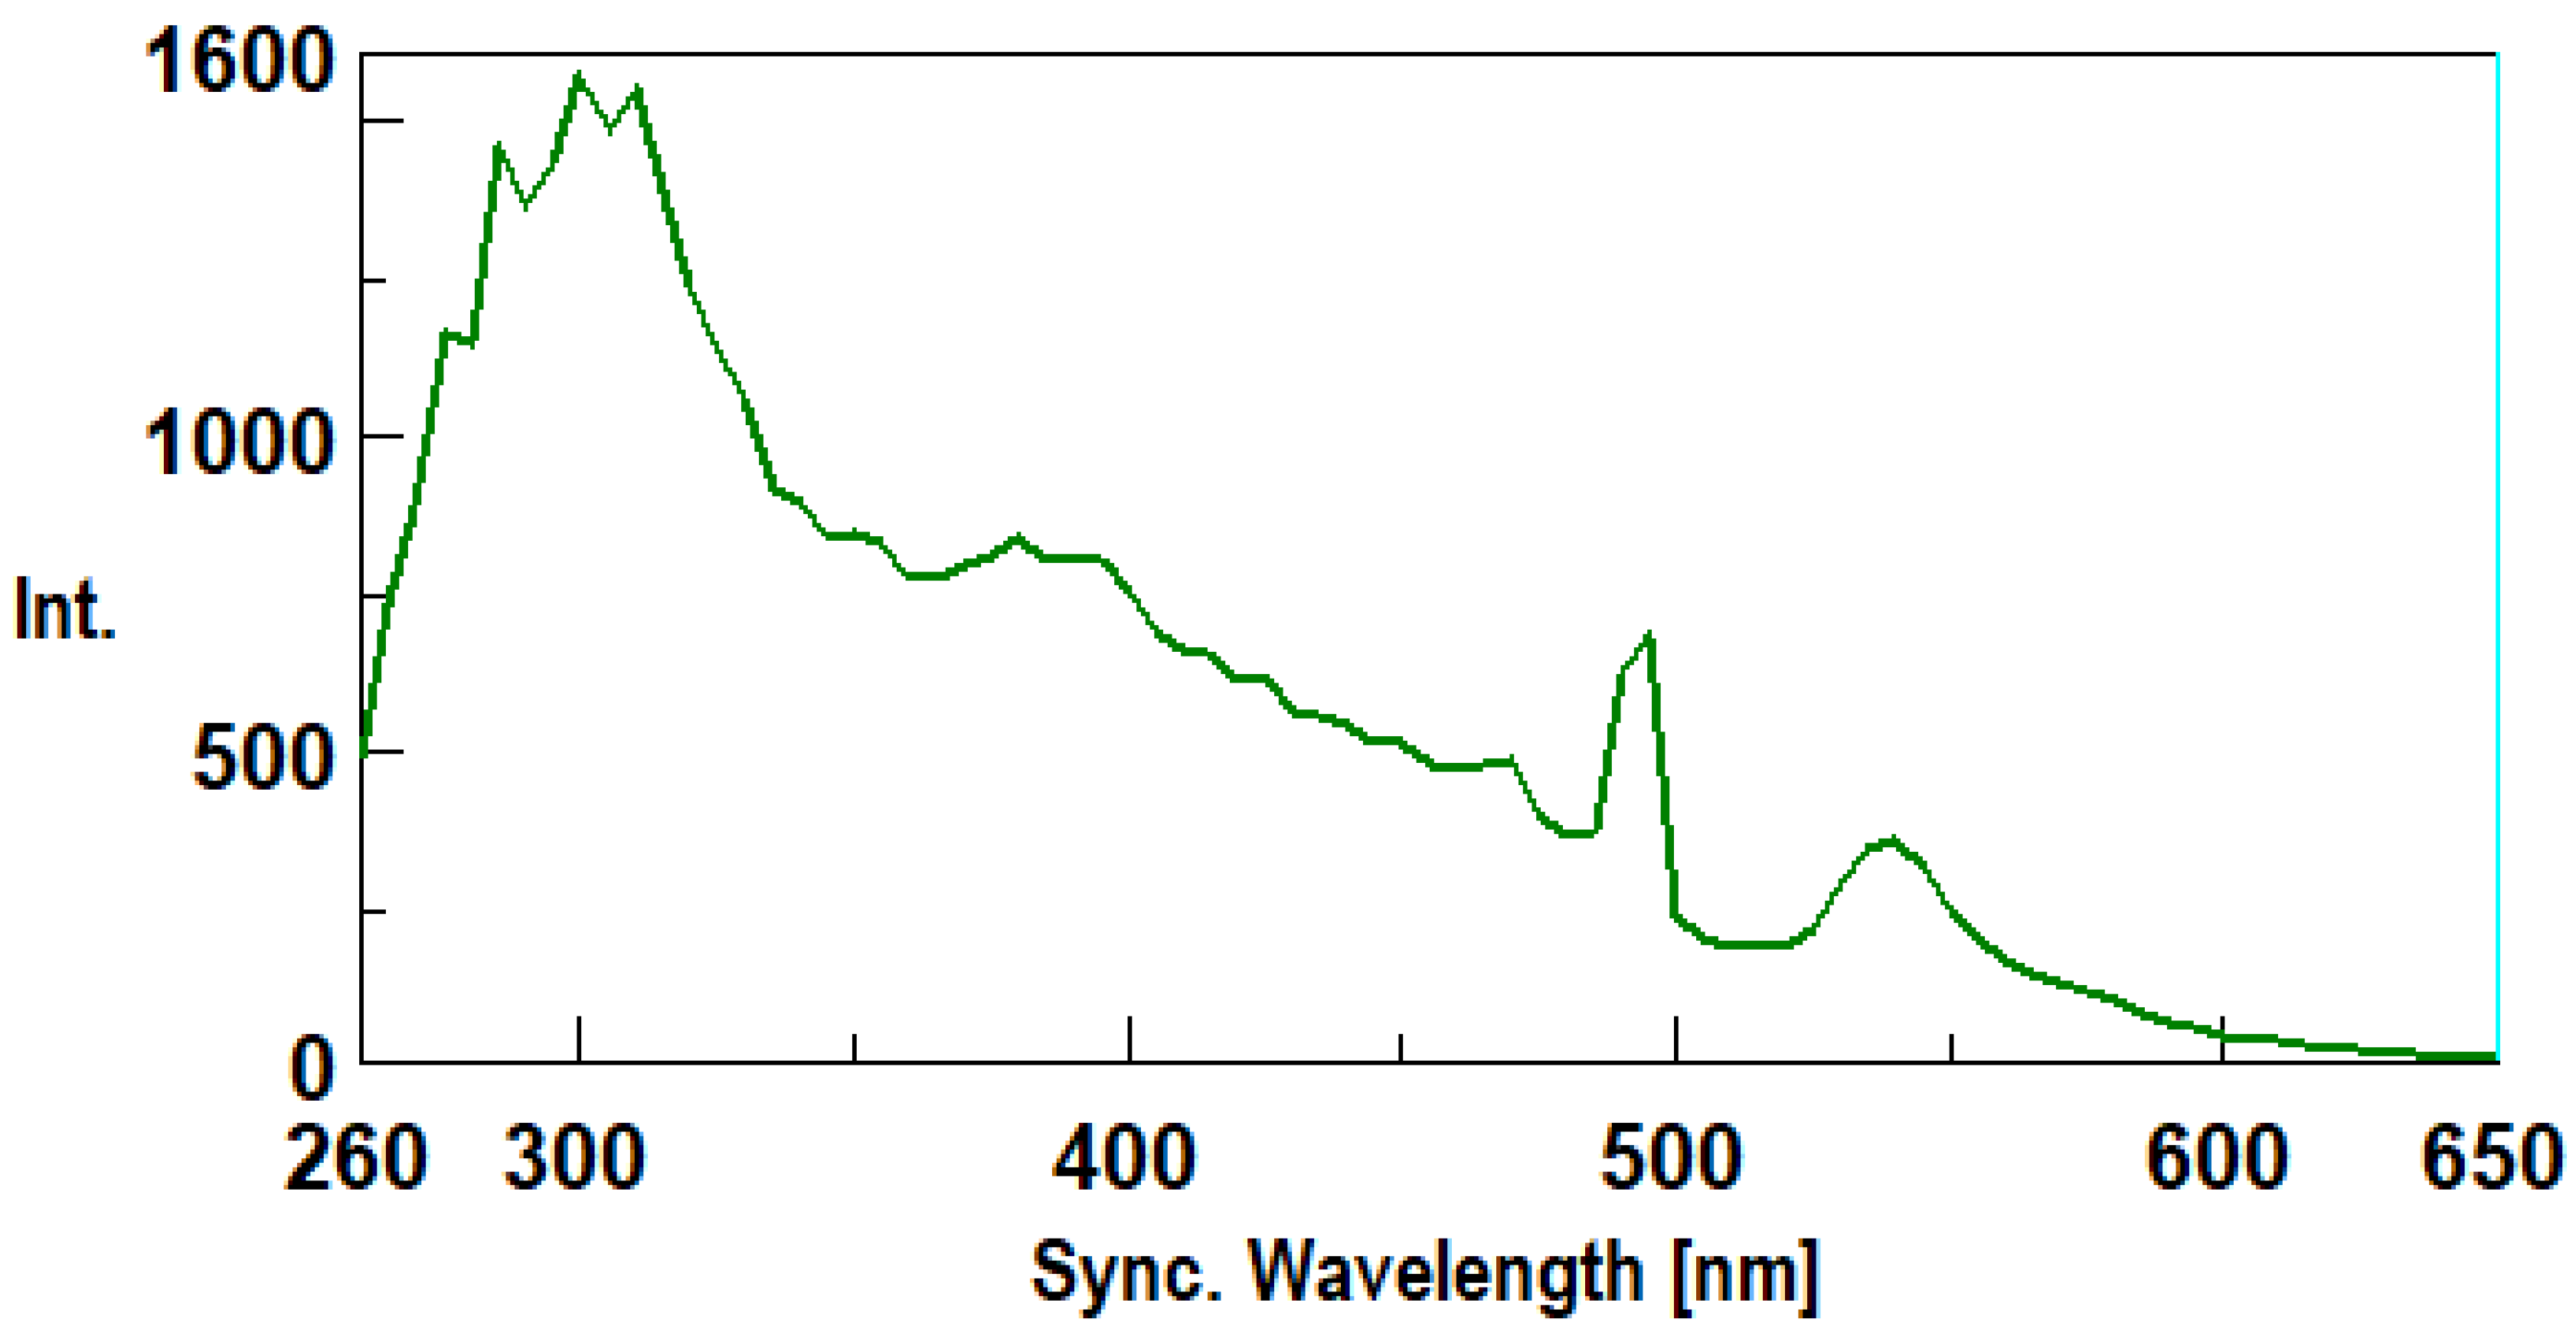
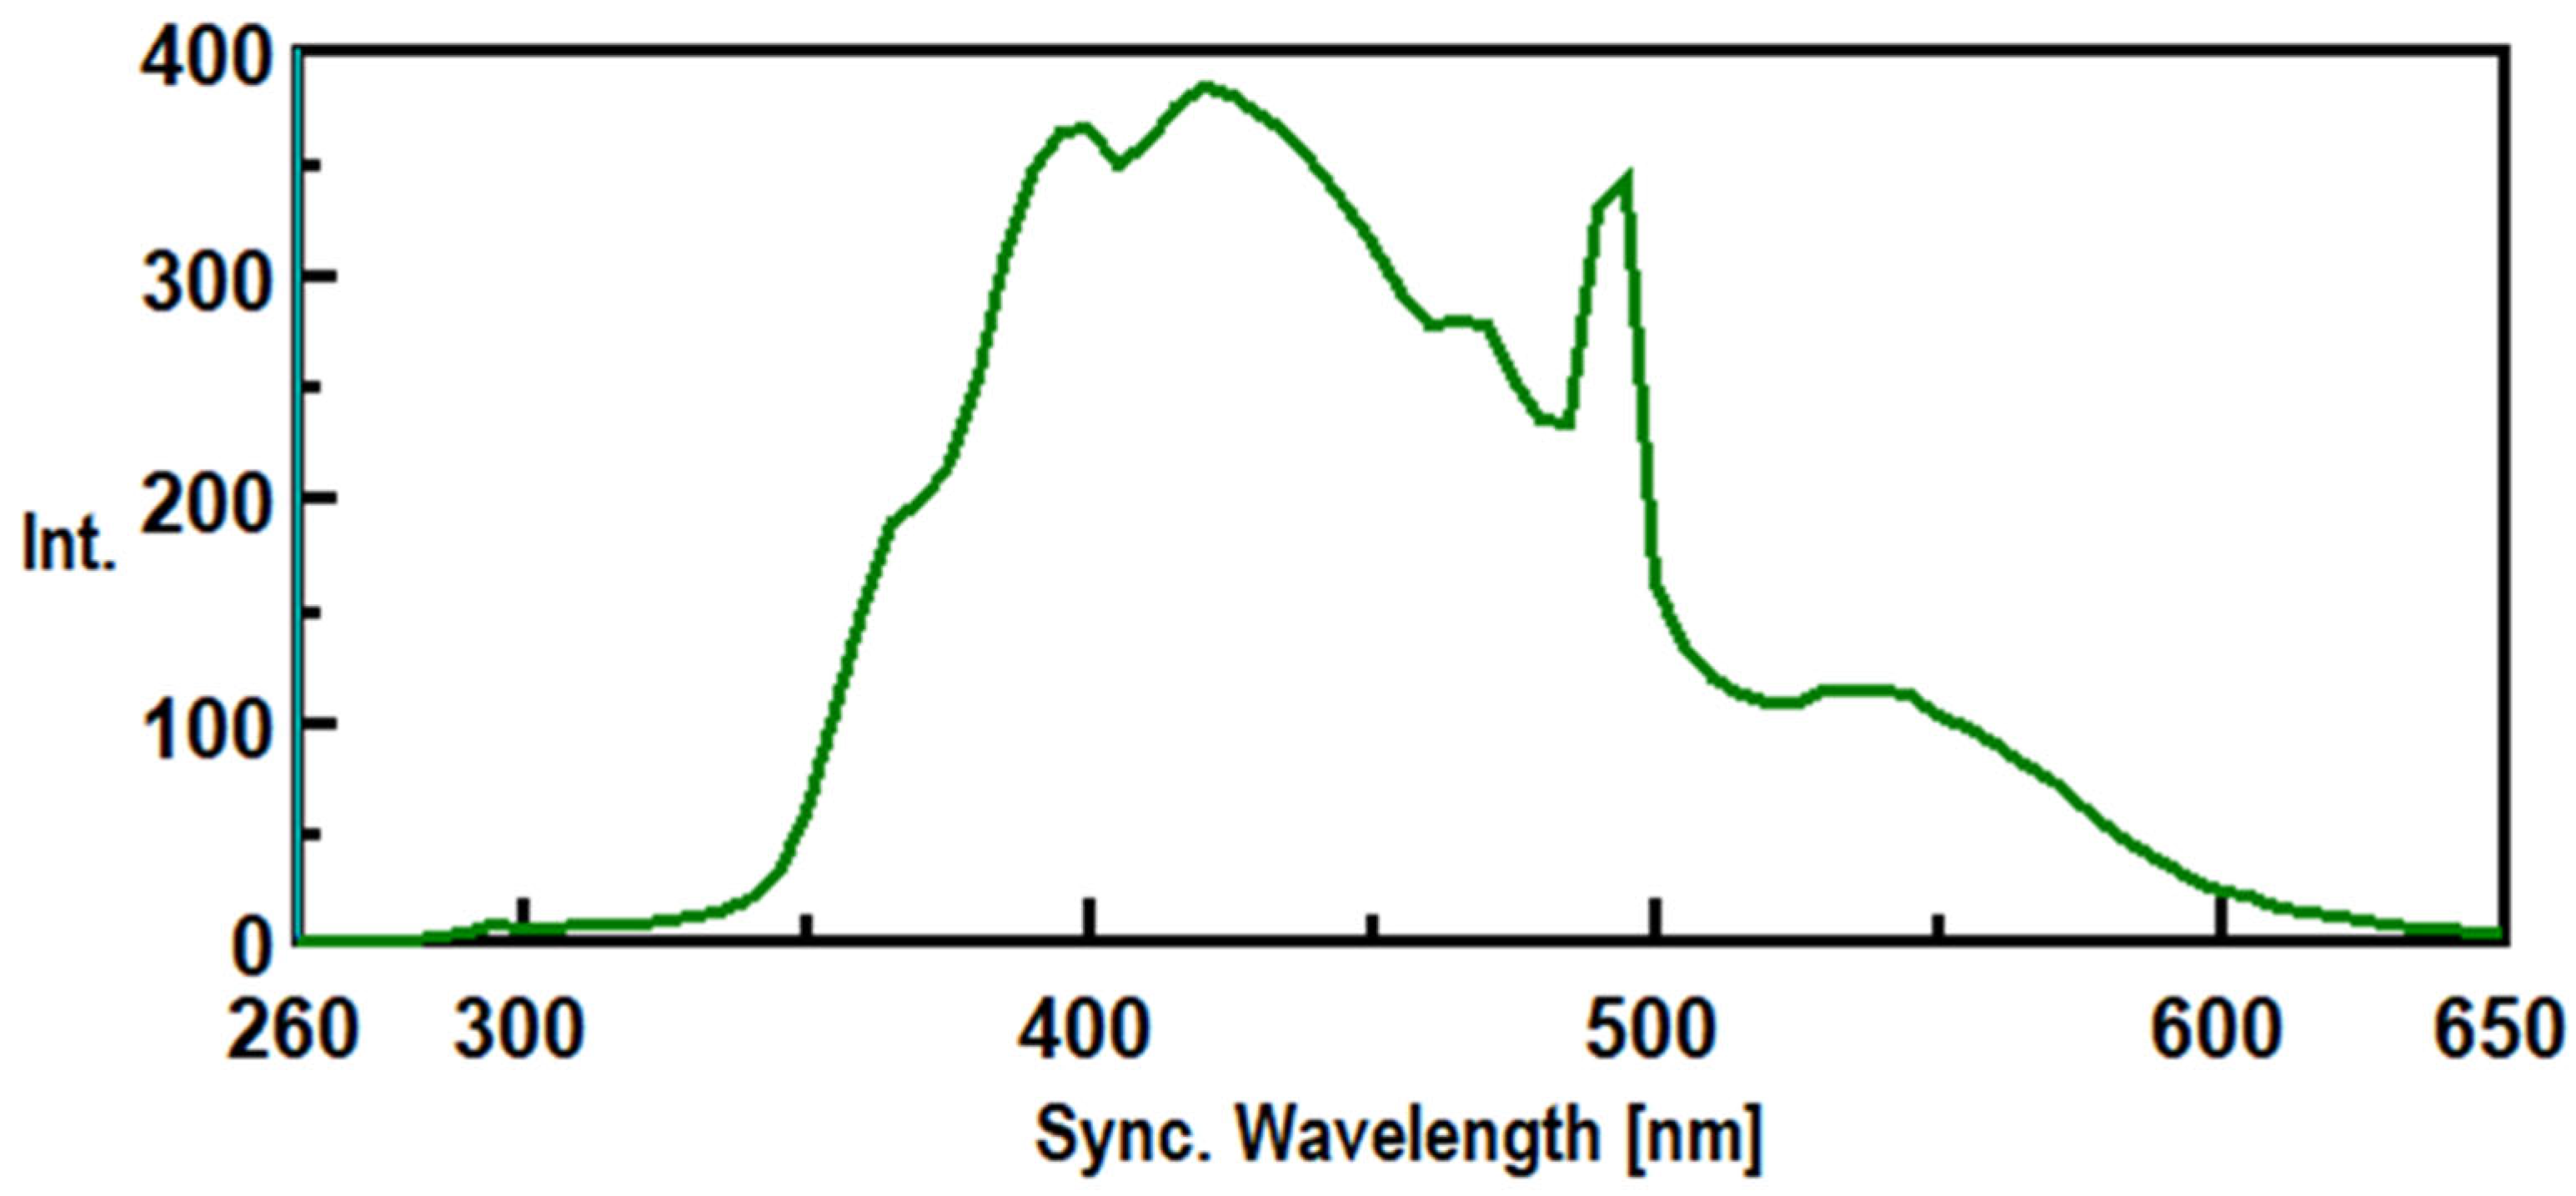
Basidiomycete mushrooms contain complex b-D-glucans which play an important role in immuno-modulating and anti-tumor activities. The present work involves a novel and intrinsic synchronous fluorescent and phosphorescence assay method for b-D-glucans. Synchronous fluorescence and phosphorescence spectroscopy was carried out by a spectrofluorometer in the range of 250 to 750 nm with a Dl range of 5 -30 nm which exhibited peaks at 492, 540 and 550 nm by using b-D-glucan from Euglena gracilis as standard. A micro and high throughput method based on 96-well microtiter plate fluorescence was devised with a excitation and emission l of 420 nm and 528 nm, respectively . This assay method presented several advantages over the published colorimetric methods since it is a non-invasive assay method that requires only 0.97 mg of b-D-glucans in samples, greater sensitivity, speed, assay of many samples and very cheap. b-D-glucans of several mushrooms (i.e Poria coccus, Auricularia auricula, Ganoderma lucidium, Pleurotus ostreatus , Cordyceps sinensis , Agaricus blazei, Polyporus umbellatus, Inonotus obliquee) were isolated by using a sequence of several extractions and quantified by either spectrofluorometer or fluorescence microtiter plate reader. 3-D spectra measurements were carried out of b-D-glucans from medicinal mushroom strains. FTIR spectroscopy was used to study the structural features of b-D-glucans in these mushroom samples.

Keywords: 
;  ;  ;  ;  ;  

Introduction

Some basidiomycete mushrooms have been known to exhibit several biological and medicinal properties for thousands of years in Japanese and other Asian cultures [1,2]. The diverse biological activities of basidiomycete strains include antibacterial, antiviral, antitumor, immunosuppressive, antiallergic, and antisclerotic effects [3,4]. Furthermore, biological substances isolated from these fungi may be used as supplements for lowering blood pressure, antioxidants, and hepatoprotective and anti-inflammatory factors [5]. Among these compounds, polysaccharides, which belong mainly to β- and α-D-glucans, play a key role in immunomodulation and antitumor effects [6,7]. Nowadays, the best analyzed mushroom polysaccharides are β-D-glucans (e.g., lentinan, schizophyllan and grifolan) and their protein derivatives [8,9,10]. The properties of these biological macromolecules involve stimulation of hematopoietic stem cells, activation of the alternative complement pathway, and activation of immune cells such as lymphocytes, macrophages, DC, NK cells, Th cells, Tc cells, and B cells [11]. Although a lot of research has been carried out on their biological effects, the structural features as well as quantitative assay methods for these β-D-glucans have been poorly investigated. There are several types of β-glucans in mushroom species such as β-D-glucans and β-1,3-1,6 glucans [12]. As far as anti-tumour immune enhancing and modulating activities, these three activities are attributed to β-1,3-1,6 glucans which exhibit a triple helix as their tertiary structure [13,14]. The specific quantification of β-glucans in mushrooms with anti-tumour activity is of great clinical importance. As far as the assay methods are concerned, there is a widely used non-specific assay method for polysaccharides based on phenol-sulphuric acid [15]. Recently, some specific assay method for to β-D-glucans have been reported in the literature [14,16] which revealed some advantages and drawbacks. Although these specific methods for quantitative assay of β-D-glucans by these dyes (i.e congo red and alcian blue) have some advantages over other methods, they also have several drawbacks such as dependent on dye concentration, pH and buffer ions and temperature [14,16]. As far as fluorescence spectroscopy is concerned , the aniline blue and curcumin fluorescence assay methods for β-D-glucans involved the use of these compounds as probes to bind to β-D-glucans which revealed some advantages over published assay methods [17,18]. However, they exhibited some drawbacks such as dependent on dye and NaOH concentrations, fluorophore ratio, time and temperature [17,18]. Although the immunochemical assay method for β-D-glucans exhibited some useful advantages over colorimetric methods, it also presented some disadvantages since it is more expensive and slower than those published in the literature as this assay method involves slow antigen–antibody reactions and use of enzyme labeled antibody, substrate and new microtiter plates [19]. Recently, a report has been published in the literature about production, purification and fluorescence properties of β-D-glucans from basidiomycete strains [20]. However, the detailed assay method of β-D-glucans based on intrinsic fluorescence spectroscopy has not been reported in this work [20].
Therefore, the aim of the present work involves the investigation of intrinsic and non-invasive fluorescence and phosphorescence of β-D-glucans in order to design a novel, micro and high throughput intrinsic fluorescence assay method for β-D-glucans both in spectrofluorometer and fluorescence microplate reader. This assay method based on 96-well microtiter plate presents several advantages over the published methods since it only requires 0.973 μg of β-D-glucans in samples, greater sensitivity, speed, assay of many samples, non-invasive and very cheap.

2. Materials and Methods

2.1. Chemicals

β-D-Glucan from barley, Euglena gracilis, pullulan β-D-Glucan, laminarin, congo red were purchased from Sigma–Aldrich (St Louis, MO, USA). Potato dextrose agar (PDA) medium was supplied by HiMedia Laboratories (Mumbai, India). Milk whey was supplied by a local manufacturer. All other chemicals used were of analytical grade.
In order to develop a culture medium for cultivation of mushroom strains for β-D-glucans production, several agro-industrial wastes were tested. The agro-industrial wastes in dry form were corncobs, rice husks, oat husks, sawdust, and lupin seeds which were supplied by the Department of Agronomy of University of Trás-os-Montes and Alto Douro (UTAD). The wet agro-industrial wastes were coffee grounds, pineapple, banana, mango and pear peels.

2.3. Methods

2.3.1. Growth and Maintenance Conditions of Mushroom Strains

All mushroom strains were grown in PDA for 2 weeks at 25 ºC and maintained at 4ºC in PDA.

2.3.2. Production of β-D-Glucan from Basidiomycete Mushroom Strains in Culture Media Containing Agro-Industrial Wastes

All mushroom strains were grown in media containing 1 g/L KH2PO4, 1 g/L MgSO4, 1g/L (NH4)2SO4, 15 g/L of purified agar and 4 g/L either dry residues or 40 g/L of wet residues at pH 5.6. In a second phase, the basidiomycete cultures that exhibited growth in the media described above were inoculated into liquid medium which had the same composition as the solid media, except it did not include purified agar. The mycelia on the solid medium were scraped off and collected in Eppendorf tubes containing sterile saline. After resuspension of the mycelia, it was used as inoculum for the liquid media. The cultures were incubated at 25 °C in an incubator with orbital shaking at 150 rpm for 14 days.

2.3.3. Isolation of of β-D-Glucan from Basidiomycete Mushroom Strains

After fermentation, the mycelial biomass was separated from the fermentation broth by centrifugation for 30 min at 4,500 rpm at 4°C. Extracellular β-D-glucans (EBG) were isolated by precipitation with 4 volumes of 95% ethanol to the supernatant and the mixture was stored overnight at 4 °C. The precipitate was collected after centrifugation for 5 min, 10,000 rpm and 4 °C. Finally, the sediment was dissolved in 50 mM phosphate buffer pH 7.4.
The isolation of intracellular β-D-glucans (IBG) from mycelial biomass pellet from Pleurotus ostreatus, Ganoderma applanatum and Ganoderma carnosum and from young fruiting bodies powder from Agaricus blazei, Ganoderma lucidum, Hericium erinaceus, Coriolus versicolor, Lentinula edodes, Pleurotus ostreatus, Inonotus obliquus, Auricularia auricula, Grifola frondosa, Polyporus umbellatus, Cordyceps sinensis and Poria cocos was performed by multistep water extraction followed by extraction with alkali and acidic solutions as described previously [14]. Briefly, FW1, FW2, FKOH, FHCl, FNaOH represent samples of extraction with cold H2O, hot H2O, KOH, HCl and NaOH, respectively [14]. As far as EBG from Pleurotus ostreatus is concerned, it was recovered by precipitation with 95% (v/v) ethanol

2.3.4. Congo Red Assay for Specific Determination of of β-D-Glucan with Triple Helical Structure

Congo red dye colorimetric assay was carried out to quantify the concentration of β-D-glucans in several samples as described previously by using β-D-glucans from barley as standard [14].

2.3.5. Intrinsic Synchcronous Fluorescence Spectroscopy (SFS) of β-D-Glucans

The samples containing β-D-glucans were analyzed on a spectrofluorimeter (JASCO JP-8300) in quartz cuvettes with a 1 cm optical path length. Spectra Manager software was used for spectral acquisition and processing. The following parameters were set to obtain synchronous fluorescence spectra: excitation wavelength of 250-735 nm; emission wavelength of 260-750 nm; excitation and emission slit widths of 5 nm; variation of delta wavelength Δλ of 5, 10, 20 and 30 nm , excitation wavelength increments of 5 nm; emission wavelength increments of 0.5 nm; response of 0.1 s; light source of Xe lamp and scan speed of 10,000 nm/min [20].

2.3.6. Intrinsic Fluorescence Measurements of β-D-Glucans in Microtiter Plate Reader

For steady-state fluorescence assays in a microtiter plate fluorescence reader, 100 µL of sample was pipetted into a well of a NUNC 96 microplate. The samples consisted of extracellular β-D-glucan from basidiomycete mushroom strains and commercial Euglena gracilis and barley β-D-glucans for comparative purposes. The samples were analyzed in triplicate, and blank assays consisting solely of deionized water and phosphate buffer were performed for each microplate. Intrinsic fluorescence was read in a microplate reader (FLUOstar OPTIMA-BMG Labtec), using excitation filters corresponding to wavelengths of 380, 400, 420, 430, 485, or 510 nm and emission filters corresponding to 480, 528, 542, 550, or 620 nm [20].

2.3.7. Intrinsic Synchcronous Phosphorescence Spectroscopy (SPS) of β-D-Glucans

The samples containing β-D-glucans were analyzed on a spectrofluorimeter (JASCO JP-8300) in quartz cuvettes with a 1 cm optical path length. Spectra Manager software was used for spectral acquisition and processing. The following parameters were set to obtain synchronous phosphorescence spectra: range of measurement wavelength of 210-750 nm; data intervals of 2 nm; data points of 271; Excitation bandwidth of 20 nm; Emission bandwidth of 20 nm; Sensitivity of very low; Chopping period of 100 msec; Delay time of 10 msec; Integration time of 65 msec, variation of delta wavelength (Δλ) of 5, 10, 20 and 30 nm ; response of 0.2 s; light source of Xe lamp and scan speed of 10,000 nm/min.

2.3.8. Intrinsic 3- d Fluorescence Spectra Measurements of β-D-Glucans

The samples containing β-D-glucans were analyzed on a spectrofluorimeter (JASCO JP-8300) in quartz cuvettes with a 1 cm optical path length. Spectra Manager software was used for spectral acquisition and processing. The following parameters were set to obtain intrinsic 3-d fluorescence spectra : Start at 260 nm and End at 750 nm; Data interval of 0.5 nm; Data points of 981; Interval Measurement of Wavelength [nm] points of 98; Start at 250 nm and End at 735 nm; Interval of 5 nm; Mode of Emission; Ex bandwidth of 5 nm; Em bandwidth of 5 nm; Response of 10 msec; Sensitivity of high; Measurement range of 260 - 750 nm; Data interval of 0.5 nm; Ex wavelength of 250.0 nm; Scan speed of 10000 nm/min and Light source of Xe lamp.

2.3.9. FTIR Analysis of β-D-Glucans

In order to exploit the structural features of β-D-glucans, FTIR analysis was performed. All samples were previously freeze-dried with a UNICRYO MC2L. Infrared spectra were recorded on a Bruker Vertex 70 (with OPUS 5.5 software) as KBr pellets, a total of 128 scans at a resolution of 2 cm-1 in a range of 400–4000 cm−1.

2.3.10. Statistical Analysis

SigmaPlot 16.0 (2011-2012 Systat Software inc.) was used to draw graphs in this research work. Experimental results are means of three parallel measurements and the results are presented as mean values ± standard deviation (SD). Correlation and regression analyses were performed with the Excel software 2024 package (Academic License, Microsoft of Portugal). Correlations were considered statistically significant at p < 0.05 according to Tukey HSD and Scheffé test.

3. Results and Discussion

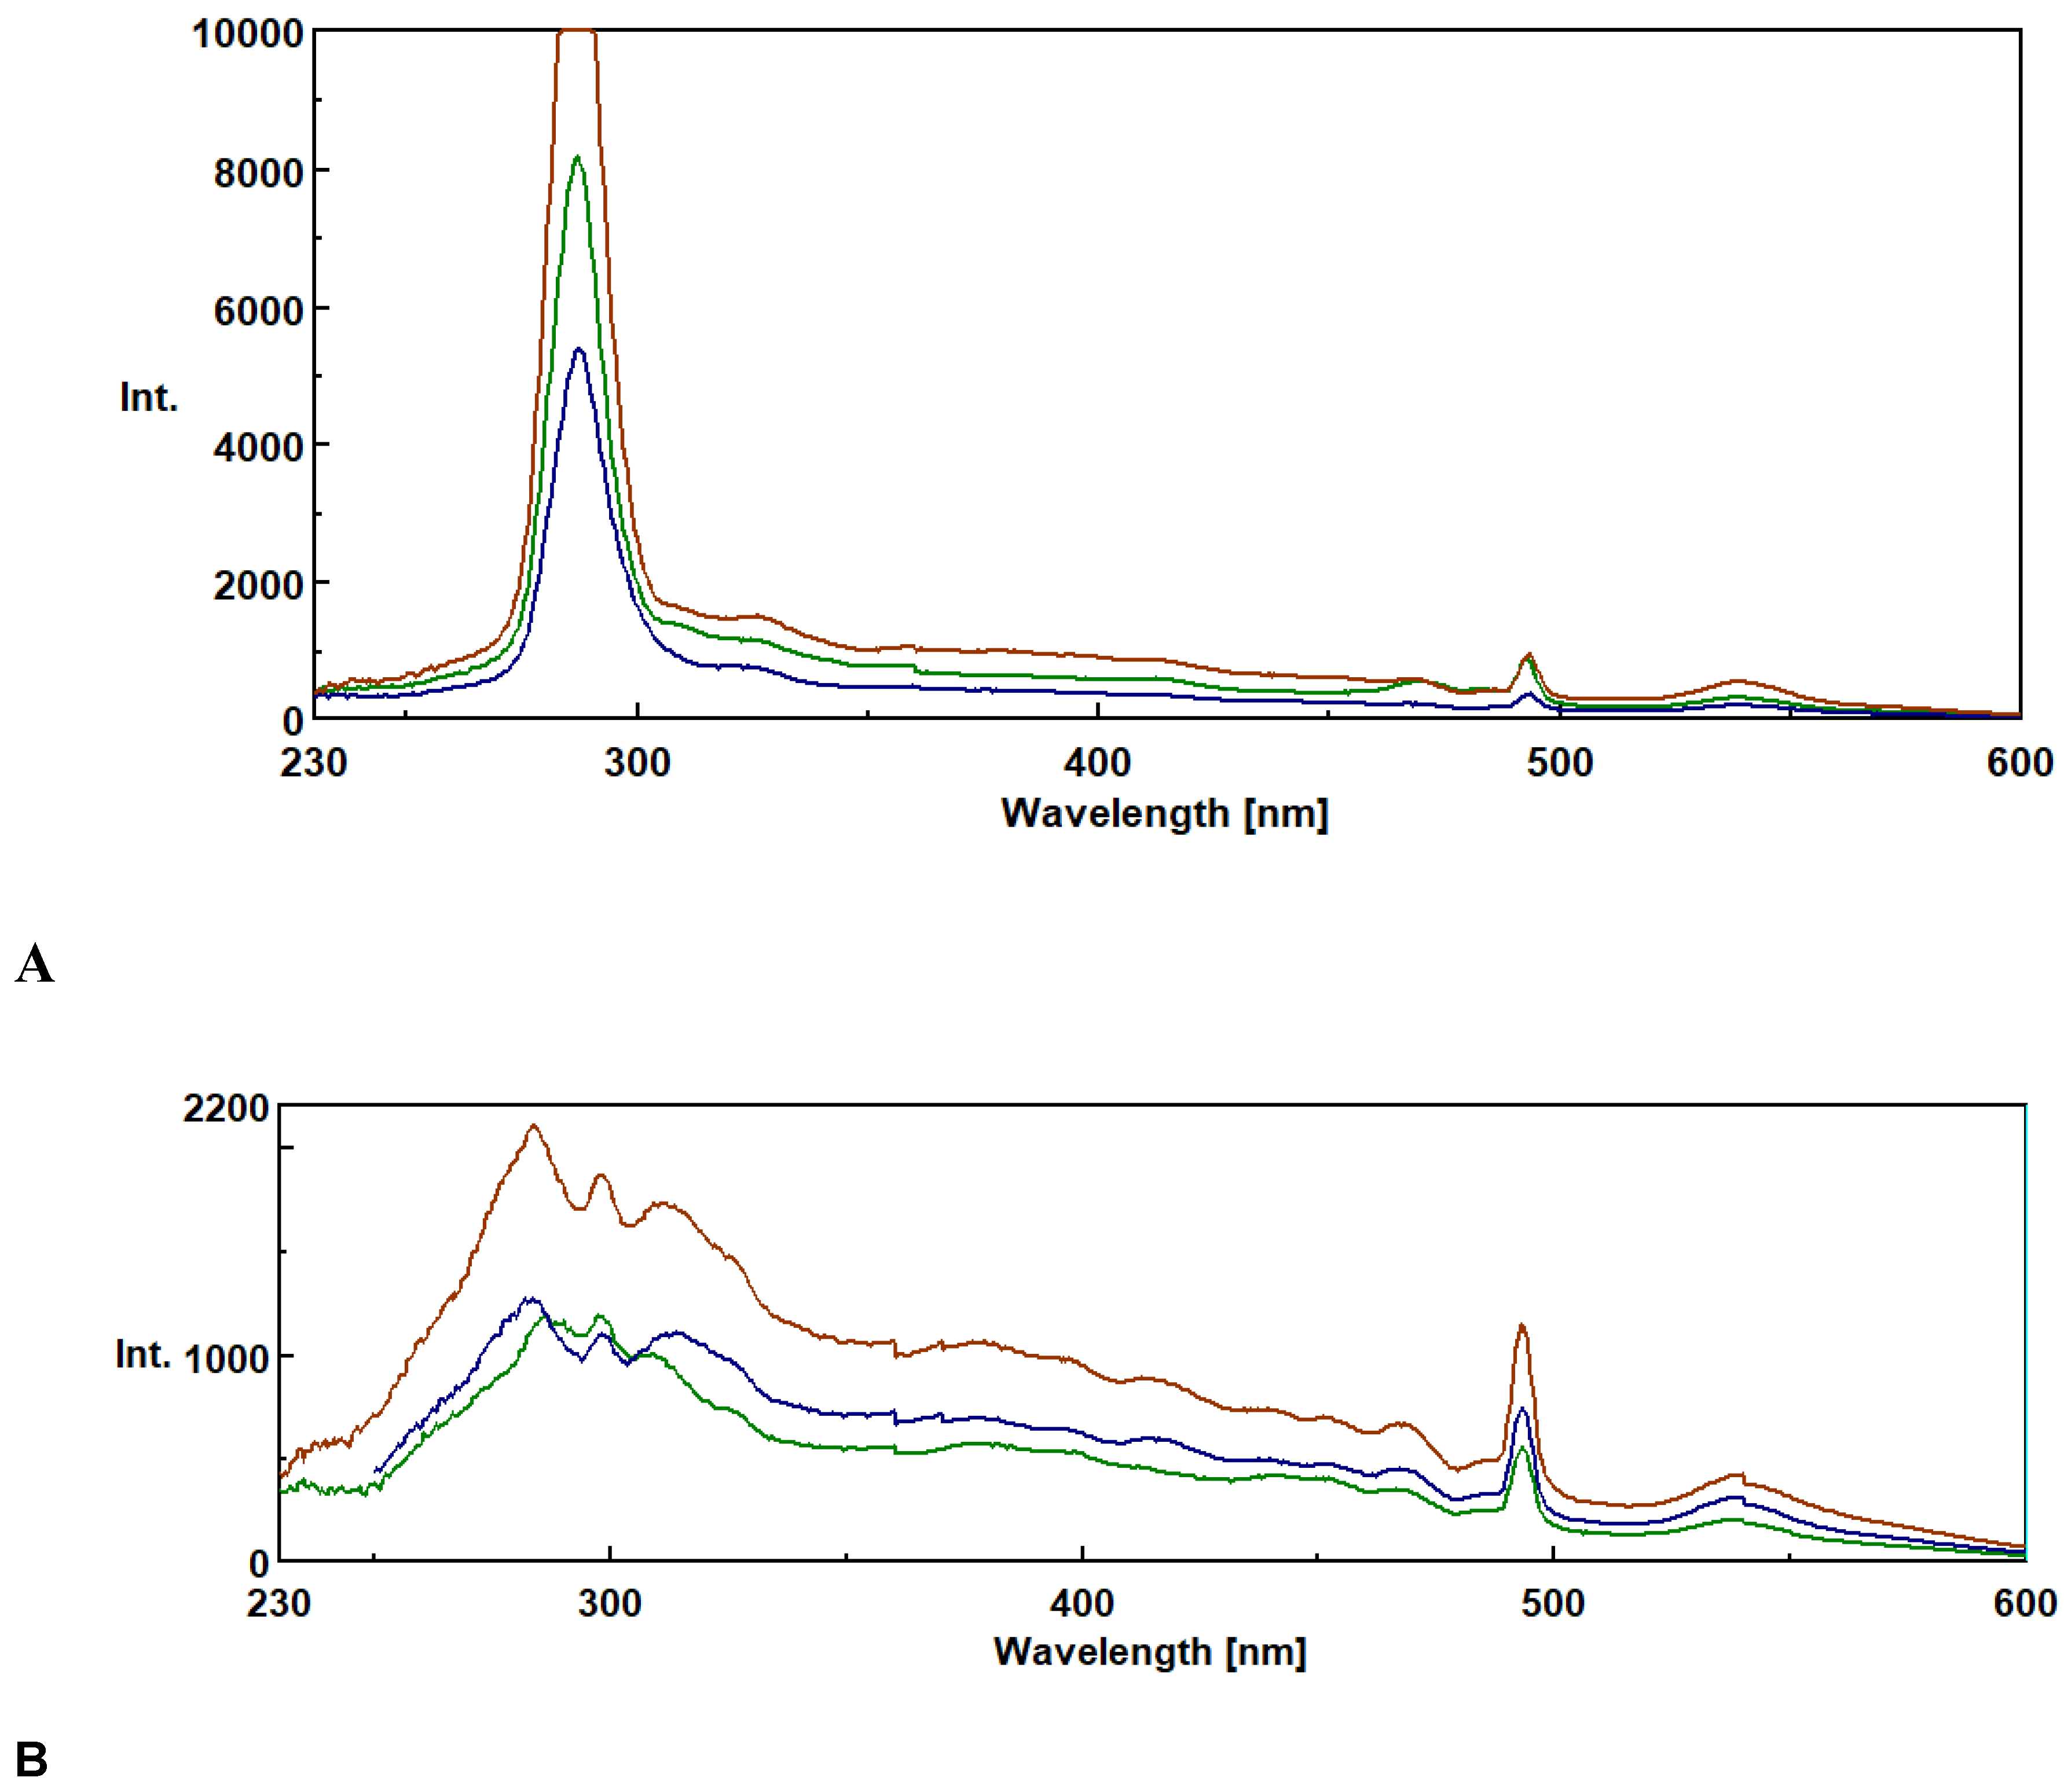
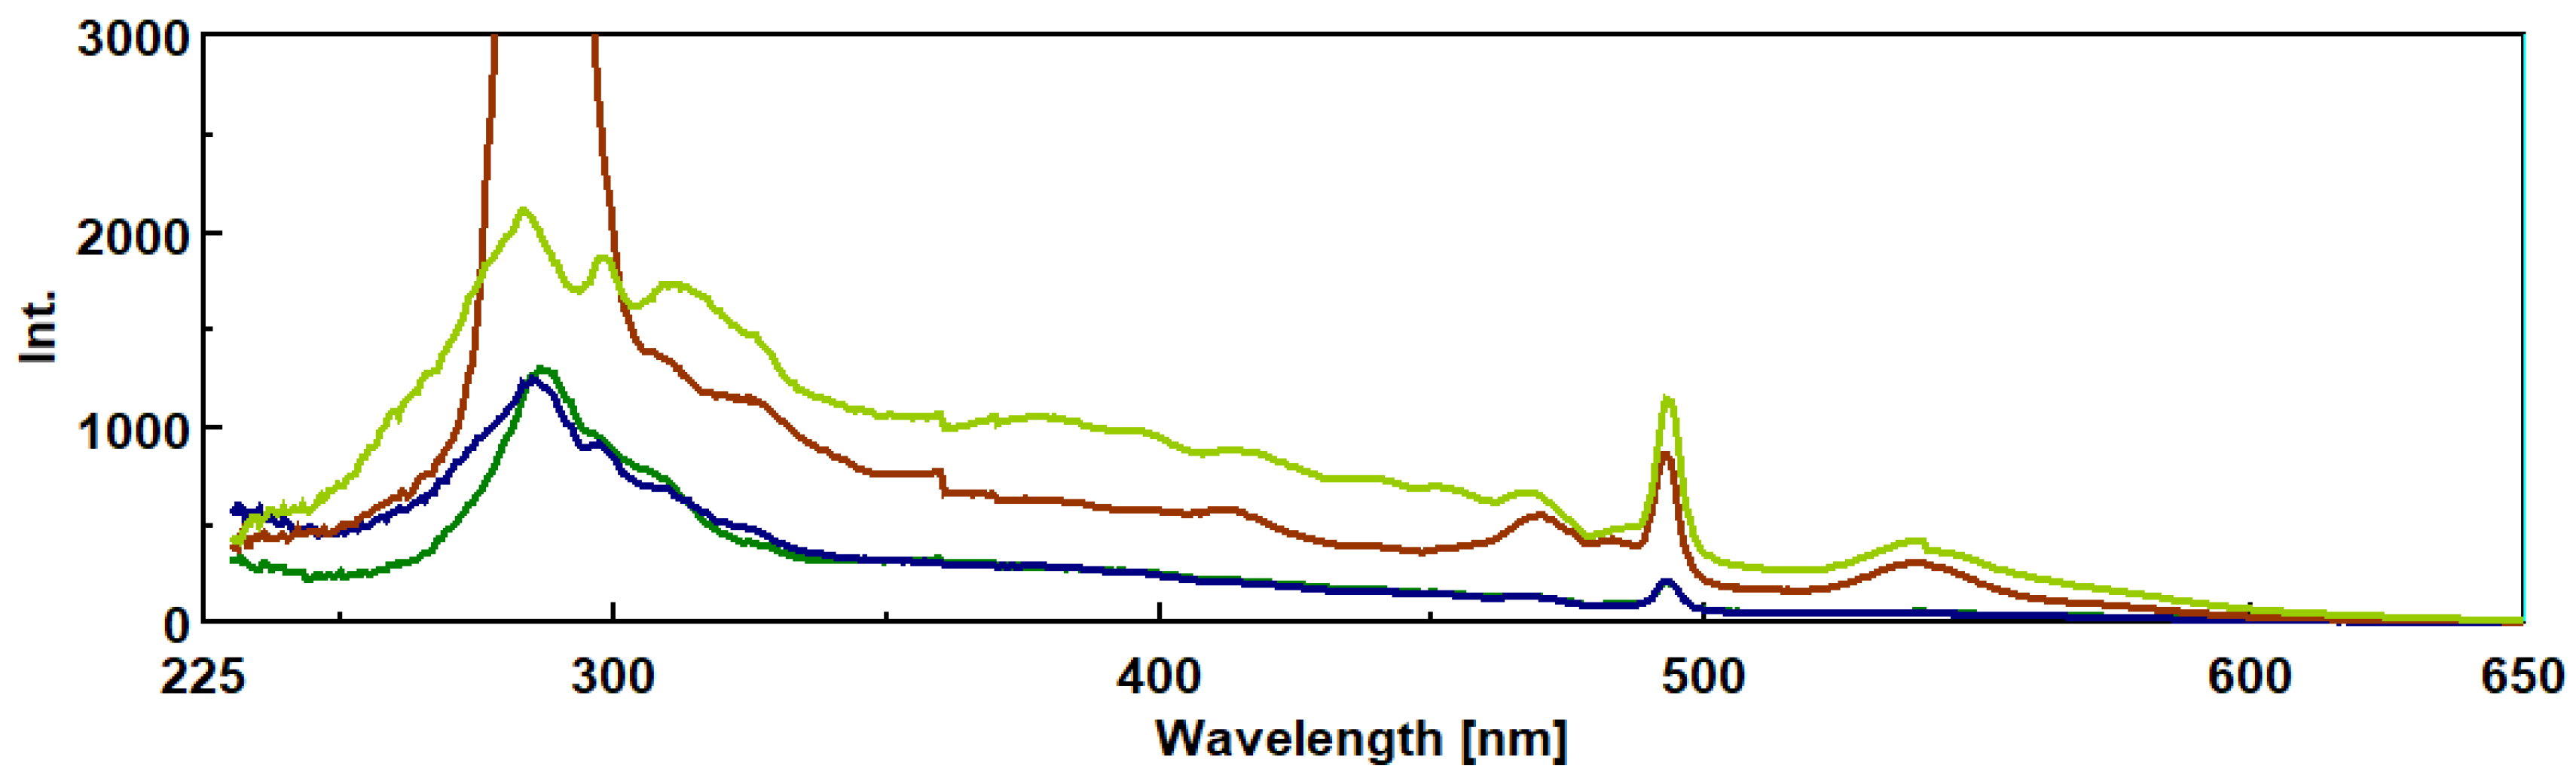
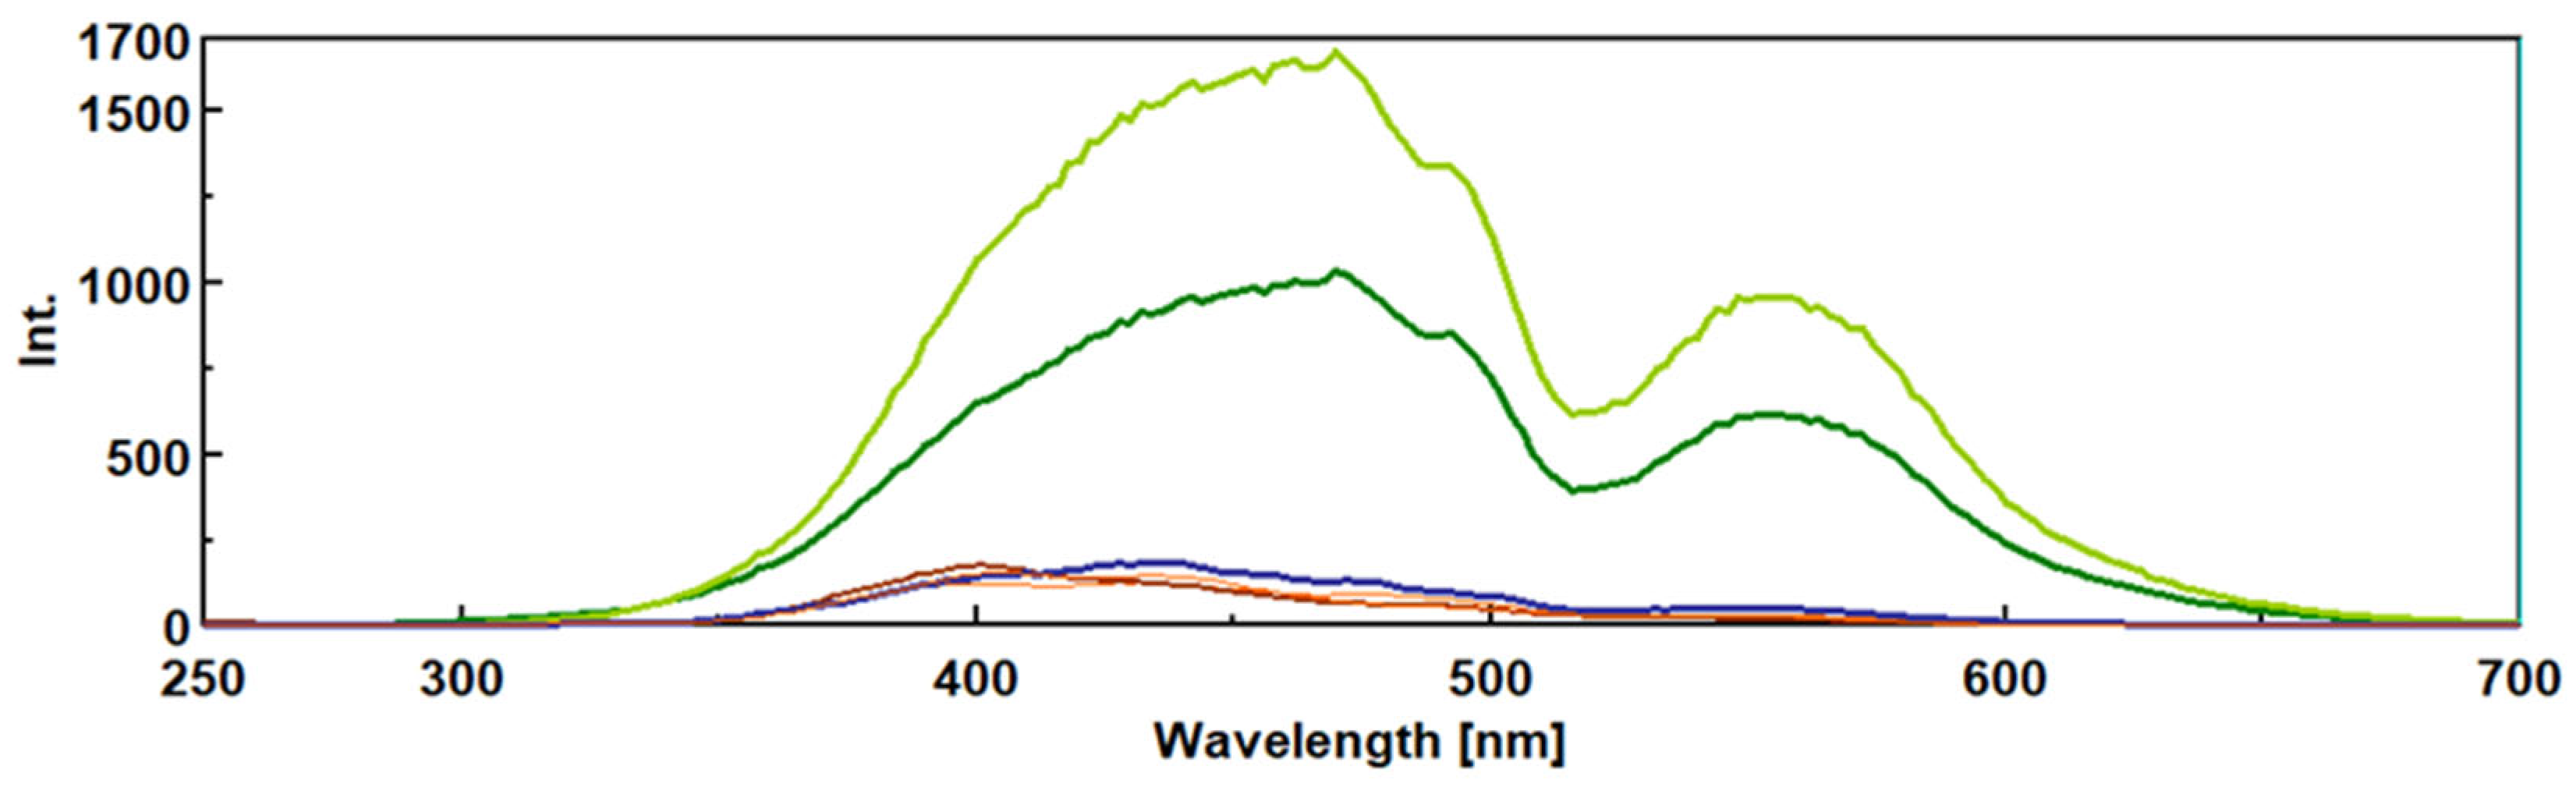
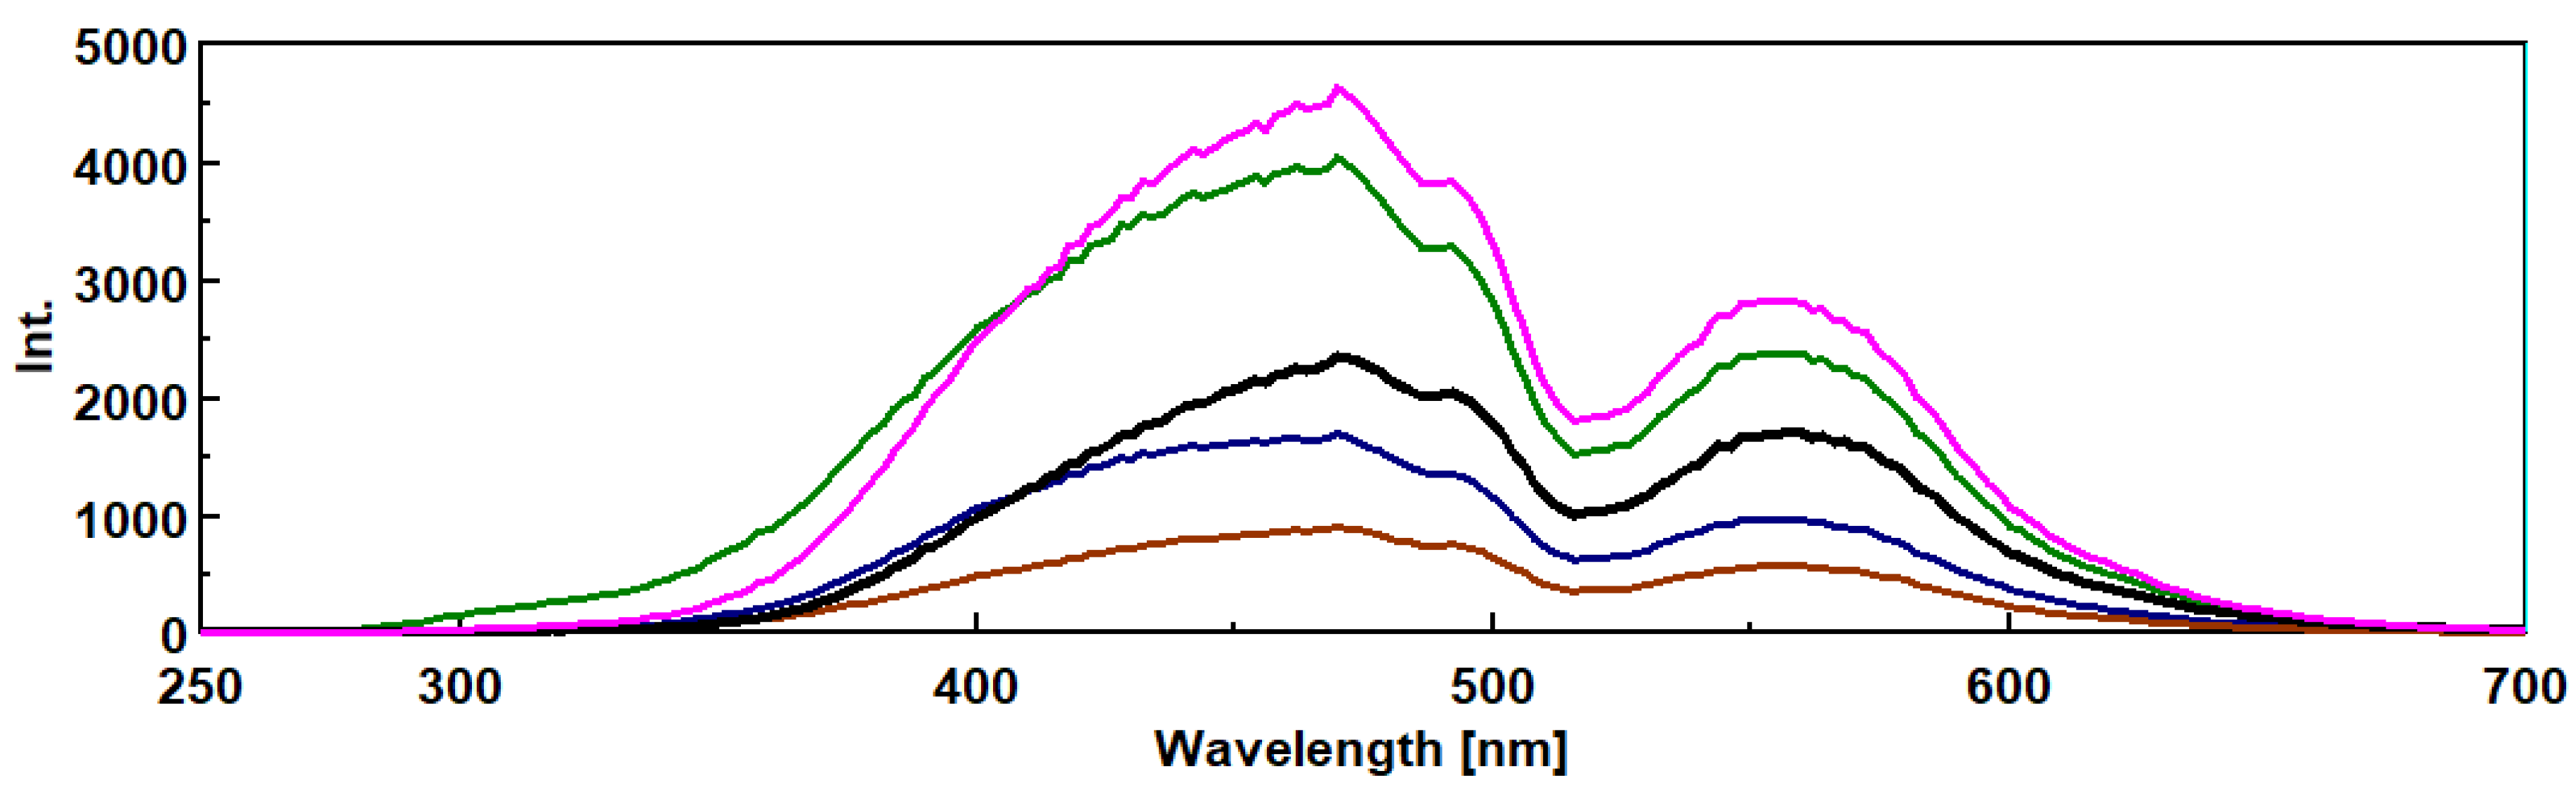
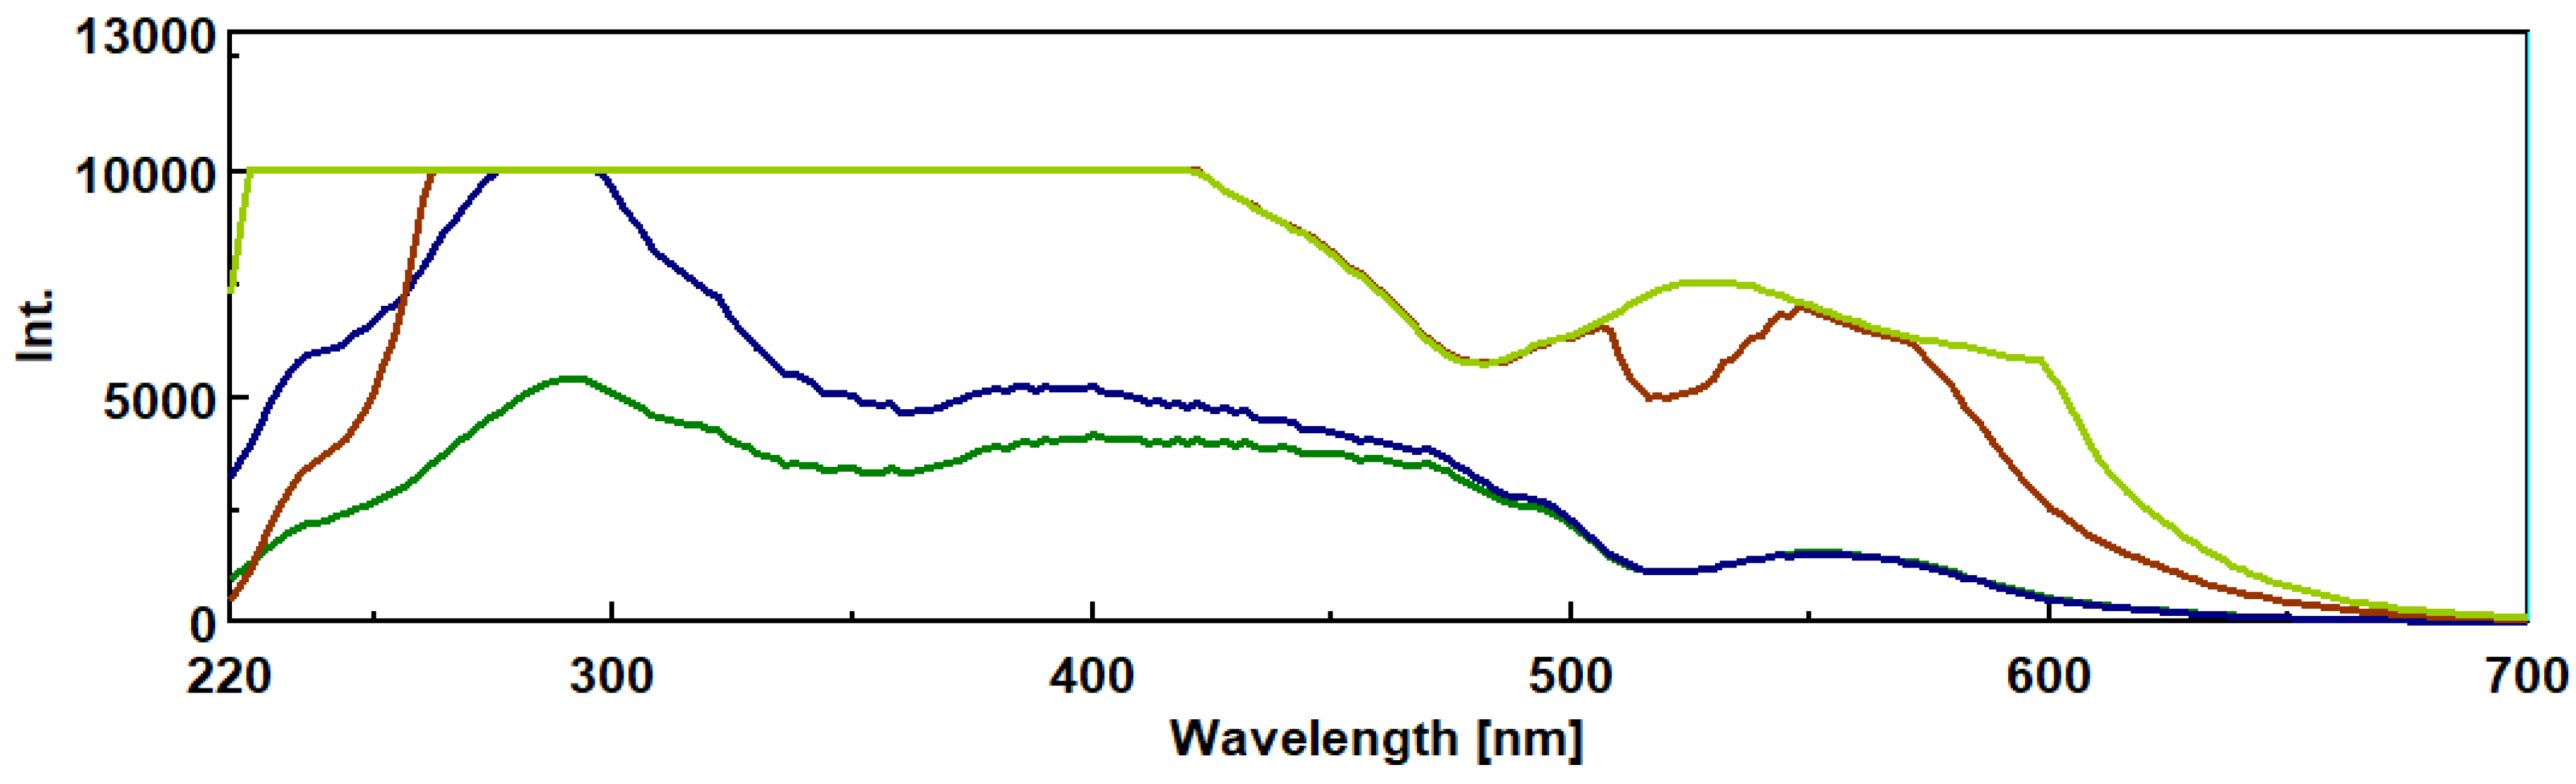
3.1. Synchronous Fluorescence Spectroscopy (SFS)

To author knowledge, there is only one report in the literature on intrinsic fluorescence spectroscopy of mushroom β-D-glucans which described very briefly some properties of these biological macromolecules [20]. Therefore, synchronous fluorescence spectroscopy (SFS) of commercial barley and Euglena gracilis β-D-glucans was investigated in a spectrofluorometer with a Δλ of 10 nm at high sensitivity and different amounts of both β-D-glucans exhibiting two fluorescence peaks at 492 and 542 nm (Figure 1).
Figure 1. Synchronous fluorescence spectra of commercial barley β-D-glucan with high sensitivity and Δλ of 10 nm as follows: A ___ 0.25 mg; ___ 0.5 mg and ___ 1.0 mg; B- β-D-glucan from Euglena gracilis : ___ 0.5 mg; ___ 0.35 mg and ___ 0.7 mg.
Preprints 189829 g001
SFS involves simultaneous scans of both the excitation and emission wavelengths of a sample at a constant wavelength difference (Δλ) in order to produce a simple spectrum. The SFS exhibits sharper and narrower spectra and it has several advantages over conventional fluorescence spectrosocpy such as eliminating light scattering interference, amplify the small spectral features, enhance selectivity, and improve spectral resolution.
The Δλ in SFS is an important parameter to obtain the best resolution , sensitivity and spectral shape for a specific analyte. Therefore, Figure 2A exhibits several synchronous fluorescence spectra at increasing Δλ for Auricularia auricula which revealed increase in fluorescence intensity at 492 and 542 nm. The assay development for β-D-glucans involved the set up of calibration curve with different concentrations of β-D-glucans from commercial Euglena gracilis which exhibited an increase in fluorescence intensity at 492 and 542 nm (Figure 2 B and C)
Figure 2. Synchronous fluorescence spectra of β-D-glucan as follows: A- High sensitivity and variation of Δλ for Auricularia auricula ___ 10 nm; ___ 20 nm and ___ 30 nm; B- Different concentrations of commercial β-D-glucan from Euglena gracilis with medium sensitivity and Δλ of 5 nm as follows: ___ 12.0 μg; ___ 10.0 μg ; ___ 8.0 μg; ___ 6.0 μg; ___ 4.0 μg and ___ 2.0 μg and C- Different concentrations of commercial β-D-glucan from Euglena gracilis with high sensitivity and Δλ of 10 nm as follows: ___ 12.0 μg; ___ 10.0 μg ; ___ 8.0 μg; ___ 6.0 μg; ___ 4.0 μg and ___ 2.0 μg.
Preprints 189829 g002
Figure 3 A revealed the calibration curve for β-D-glucans from commercial Euglena gracilis by SFS with Δλ of 5 nm, medium sensitivity at 492 nm.
Figure 3A. Calibration curve for β-D-glucan from commercial β-D-glucan from Euglena gracilis with medium sensitivity and Δλ of 5 nm by synchronous fluorescence spectroscopy.
Preprints 189829 g003
β-D-glucans from mushroom strains were also analysed by SFS with high sensitivity and Δλ of 10 nm exhibiting two peaks at 492 and 542 nm as shown in Figure 3B.
Figure 3B. Synchronous fluorescence spectra of medicinal mushroom β-D-glucans with high sensitivity and Δλ of 10 nm as follows: ____ Poria coccus ____ Auricularia auricula ____ Ganoderma lucidium ____ Pleurotus ostreatus ____Cordyceps sinensis ____Agaricus blazei ____Polyporus umbellatus ____ Inonotus oblique.
Preprints 189829 g004
In order to investigate the selectivity of SFS for mushroom β-D-glucans, other commercial sources of β-D-glucans were analysed by this analytical technique such as barley, laminarin and pullulan (Figure 3C) which revealed very low fluorescence levels at 492 and 542 nm for laminarin and pullulan.
Figure 3C. Synchronous fluorescence spectra of several commercial sources of β-D-glucan with high sensitivity and Δλ of 10 nm as follows: ____ 0.5 mg Barley ; ____ 1 mg Laminarin; ____ 1 mg pullulan and ____ 0.7 mg Euglena gracilis.
Preprints 189829 g005
The setup of high throughput fluorescence assay method involved the use of microtiter plate fluorescence reader which was used with a excitation λ of 420 nm and emission λ of 528 nm with a gain of 2200. Figure 4 A exhibited a calibration curve for commercial
β-D-glucans from Euglena gracilis.
Figure 4A. Calibration curve for β-D-glucan from commercial β-D-glucan from Euglena gracilis with gain of 2200 with excitation and emission of 420 and 528 nm, respectively in microtiter plate fluorescence reader.
Preprints 189829 g006
The comparative analysis of this fluorescence assay method was investigated by using congo red assay method for several mushroom β-D-glucans as shown in Table 1. These data revealed that the concentration of β-D-glucans in these mushroom strains was very similar (i.e ± 10%) for both assay methods (Table 1).

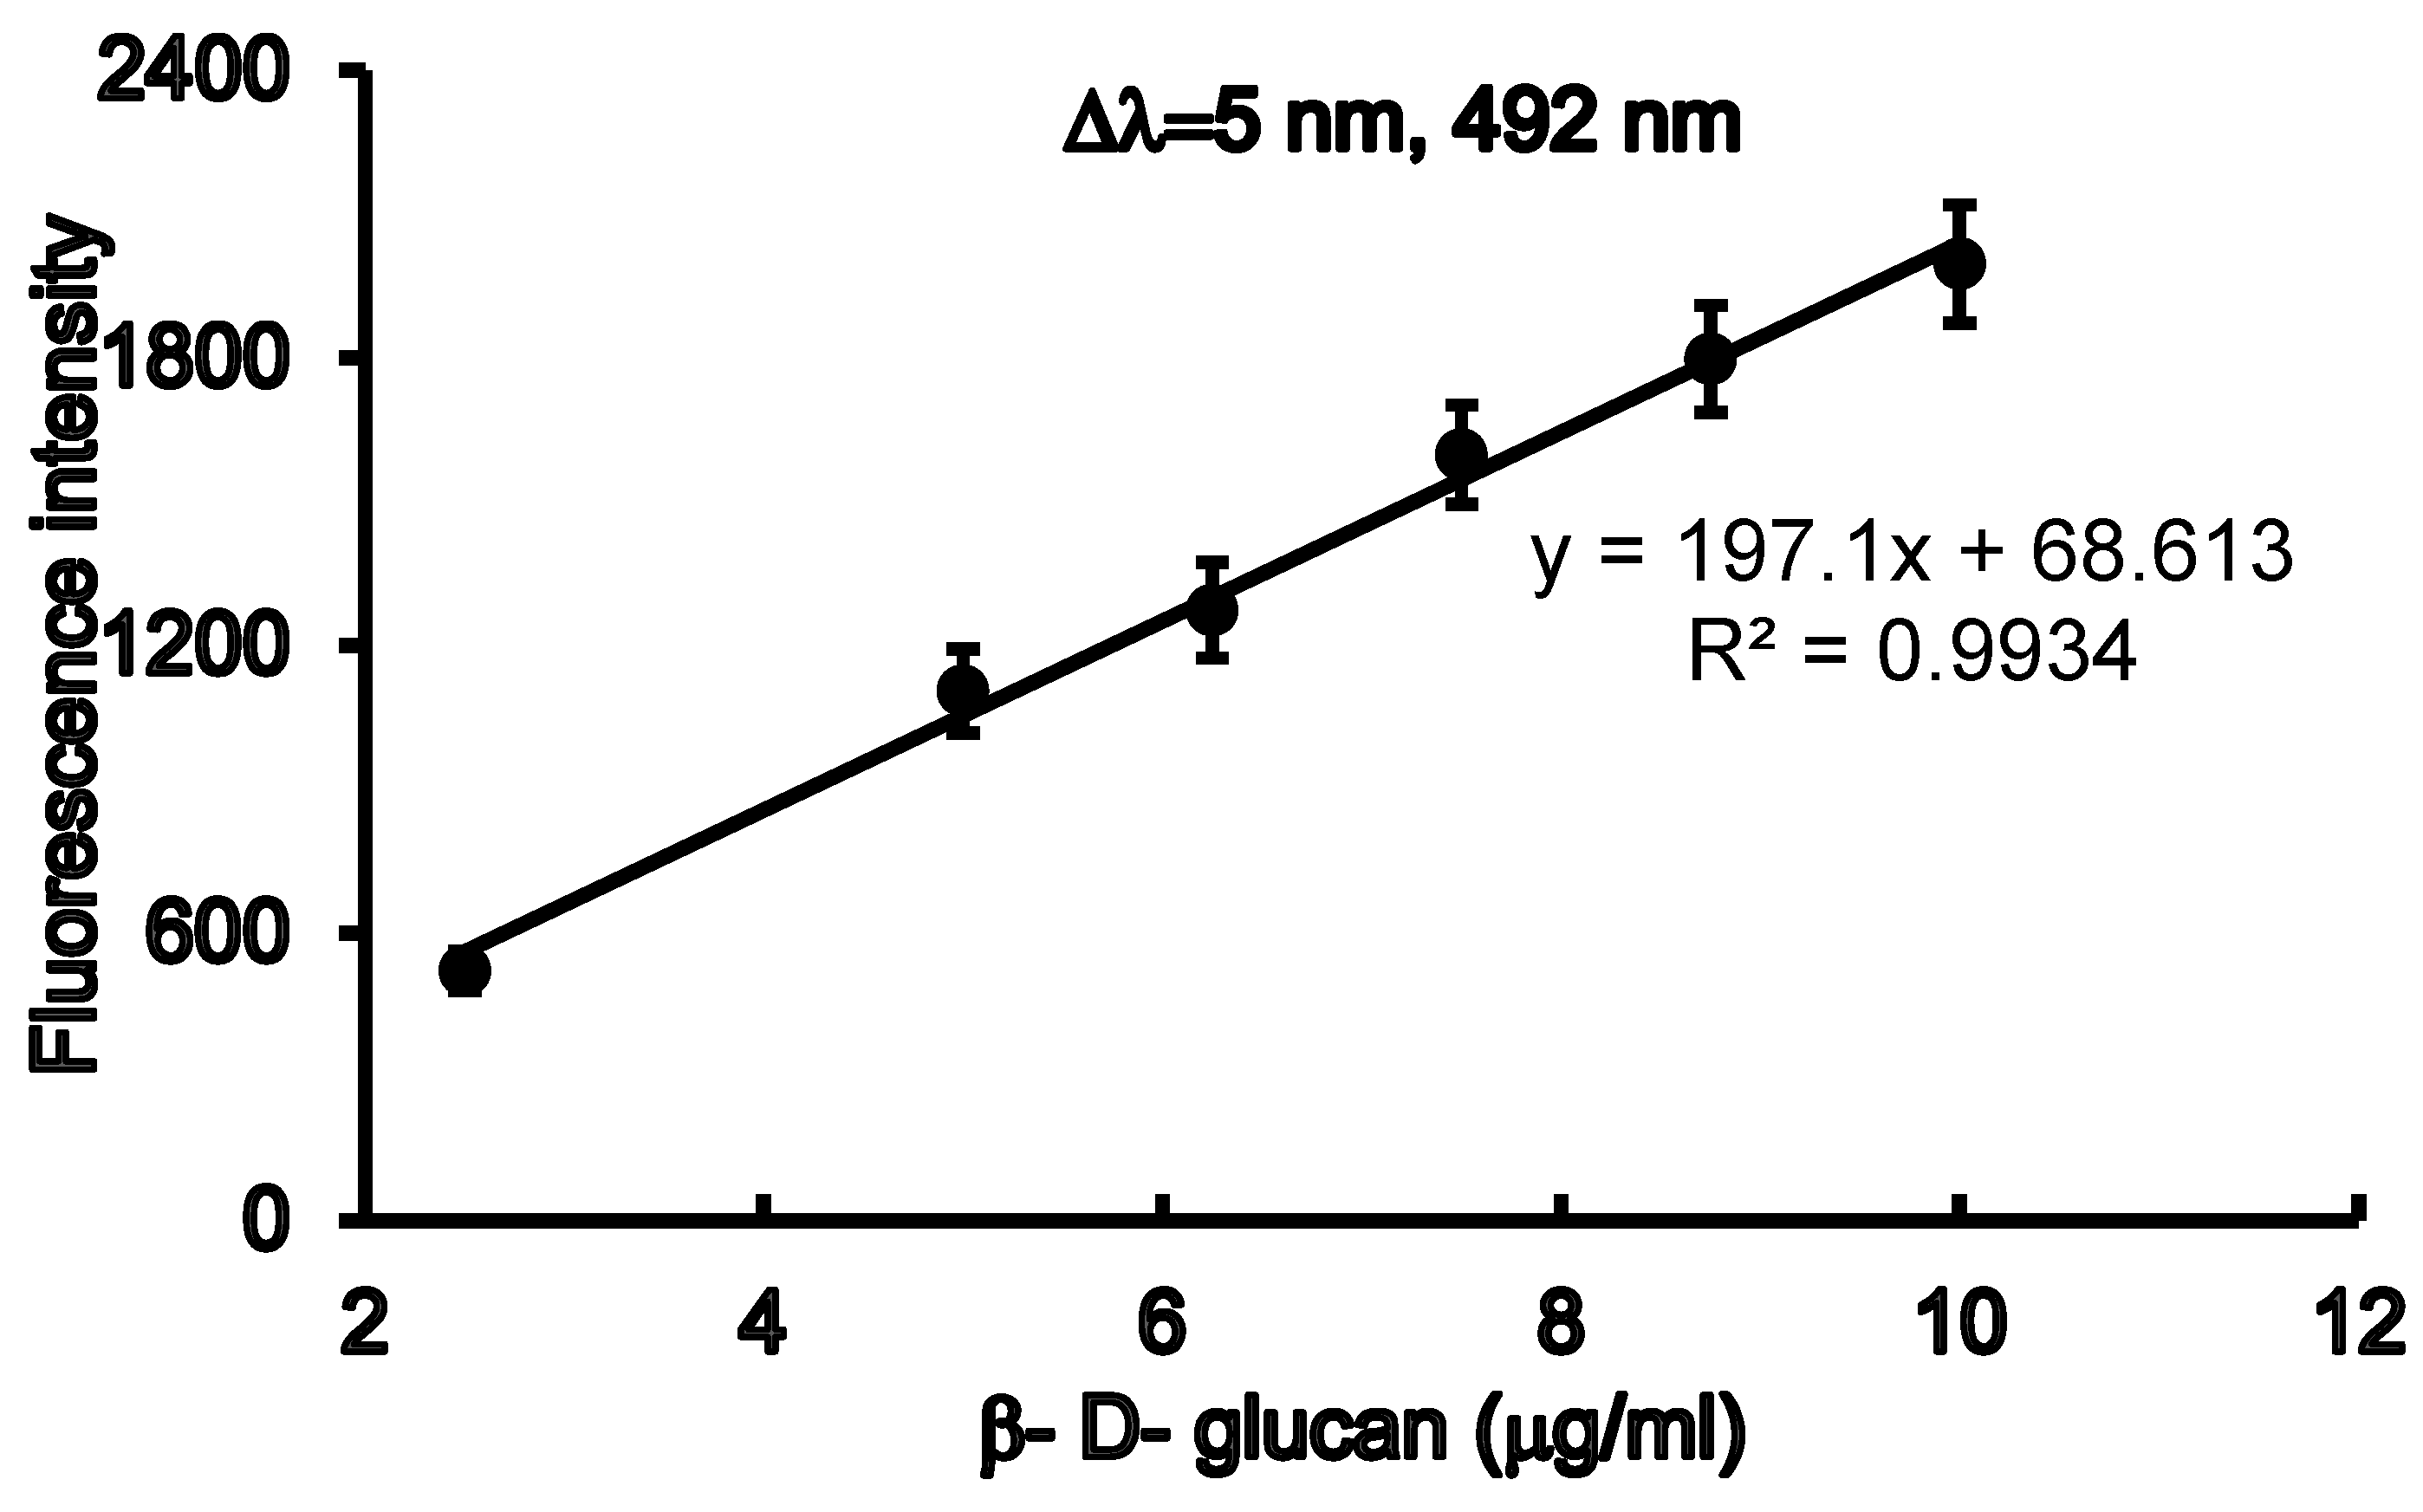
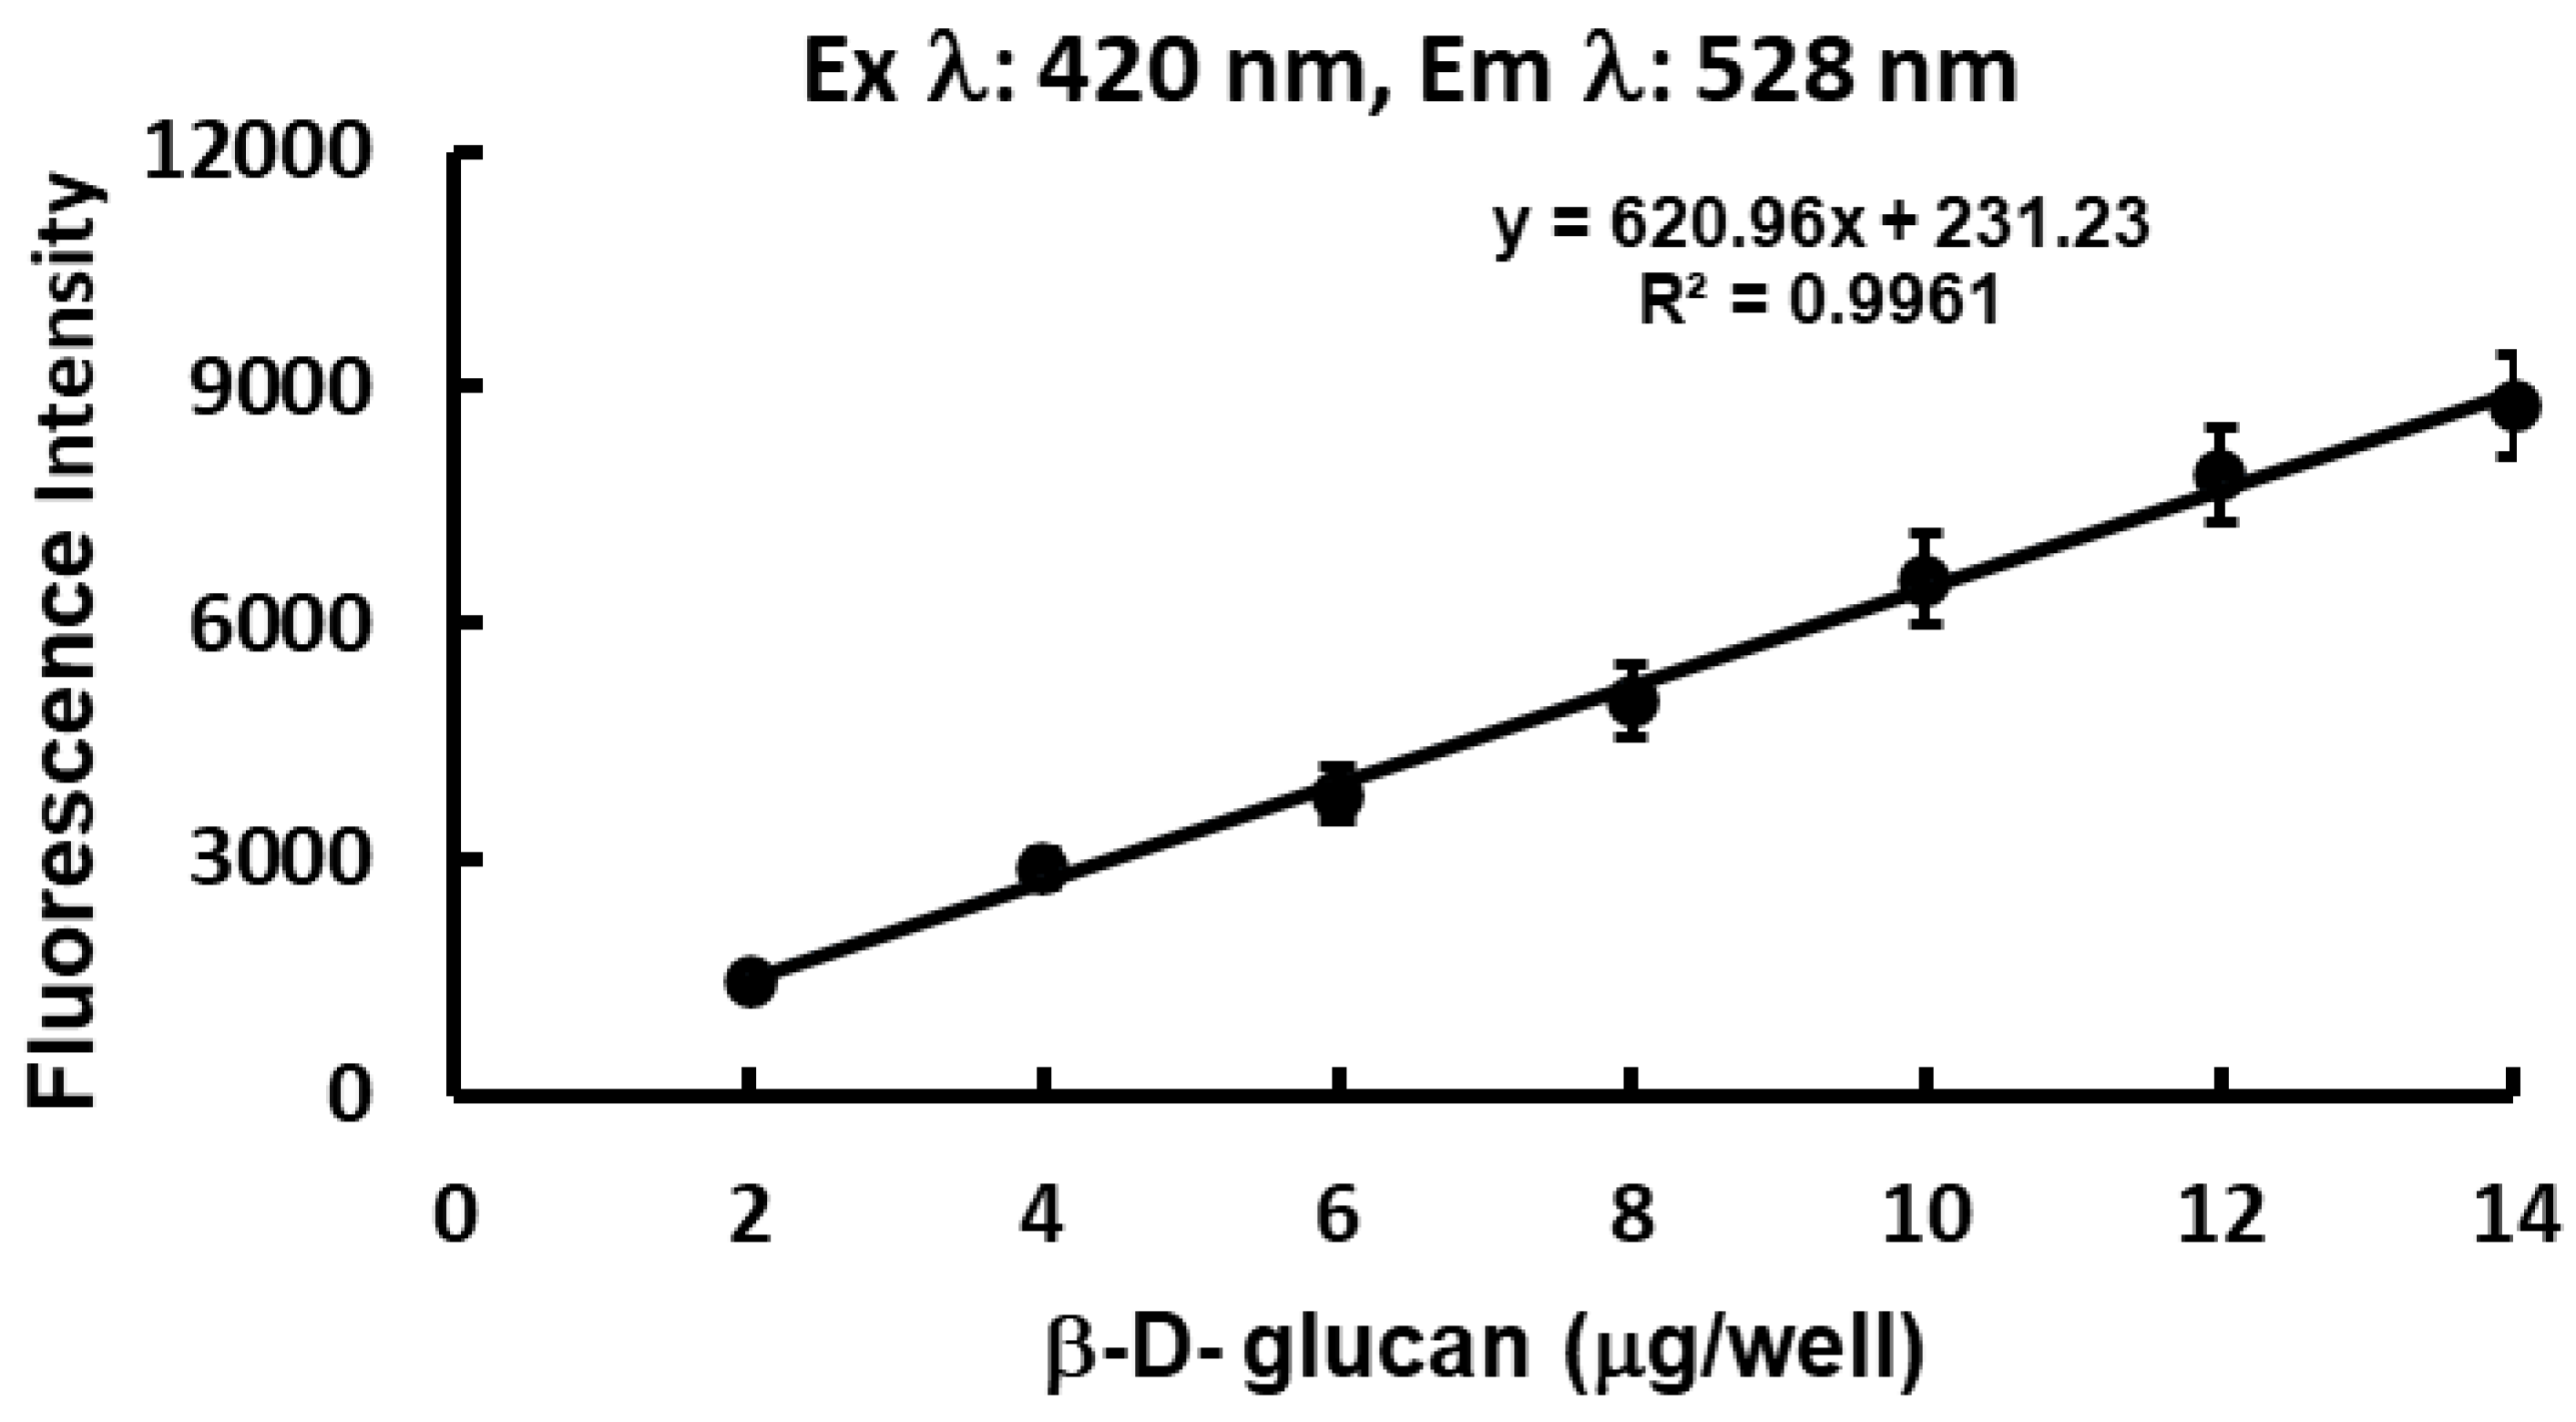
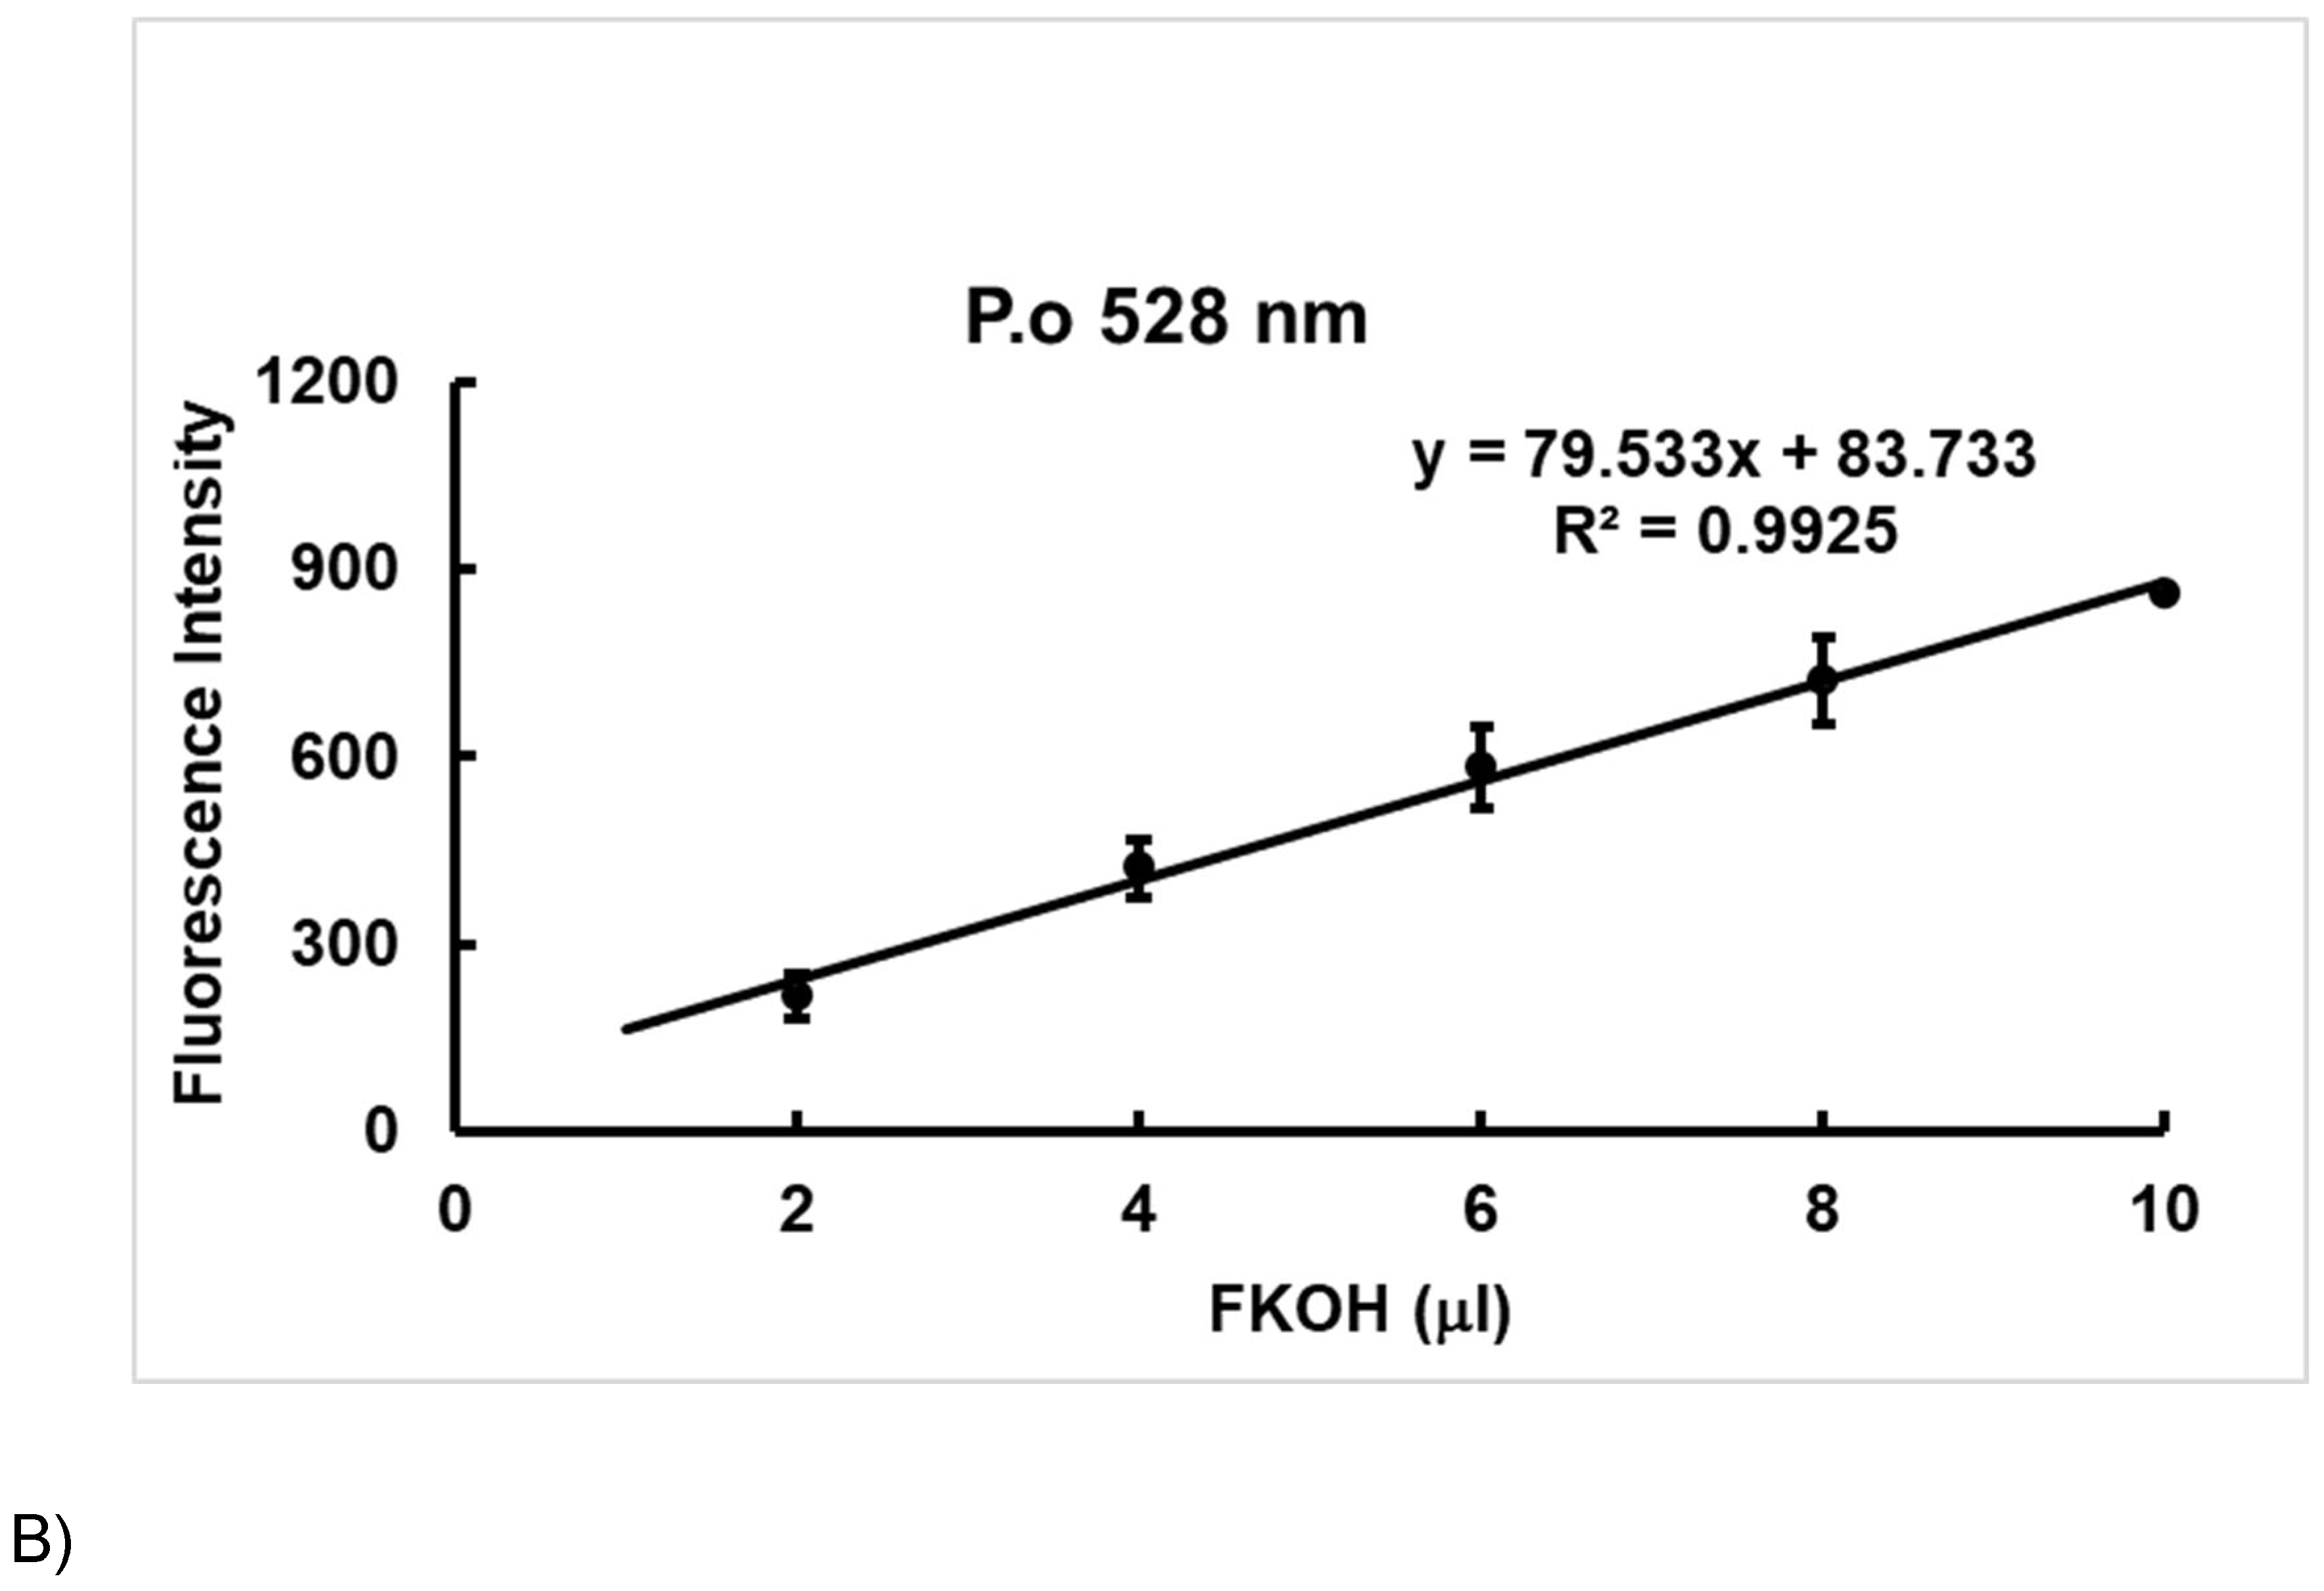
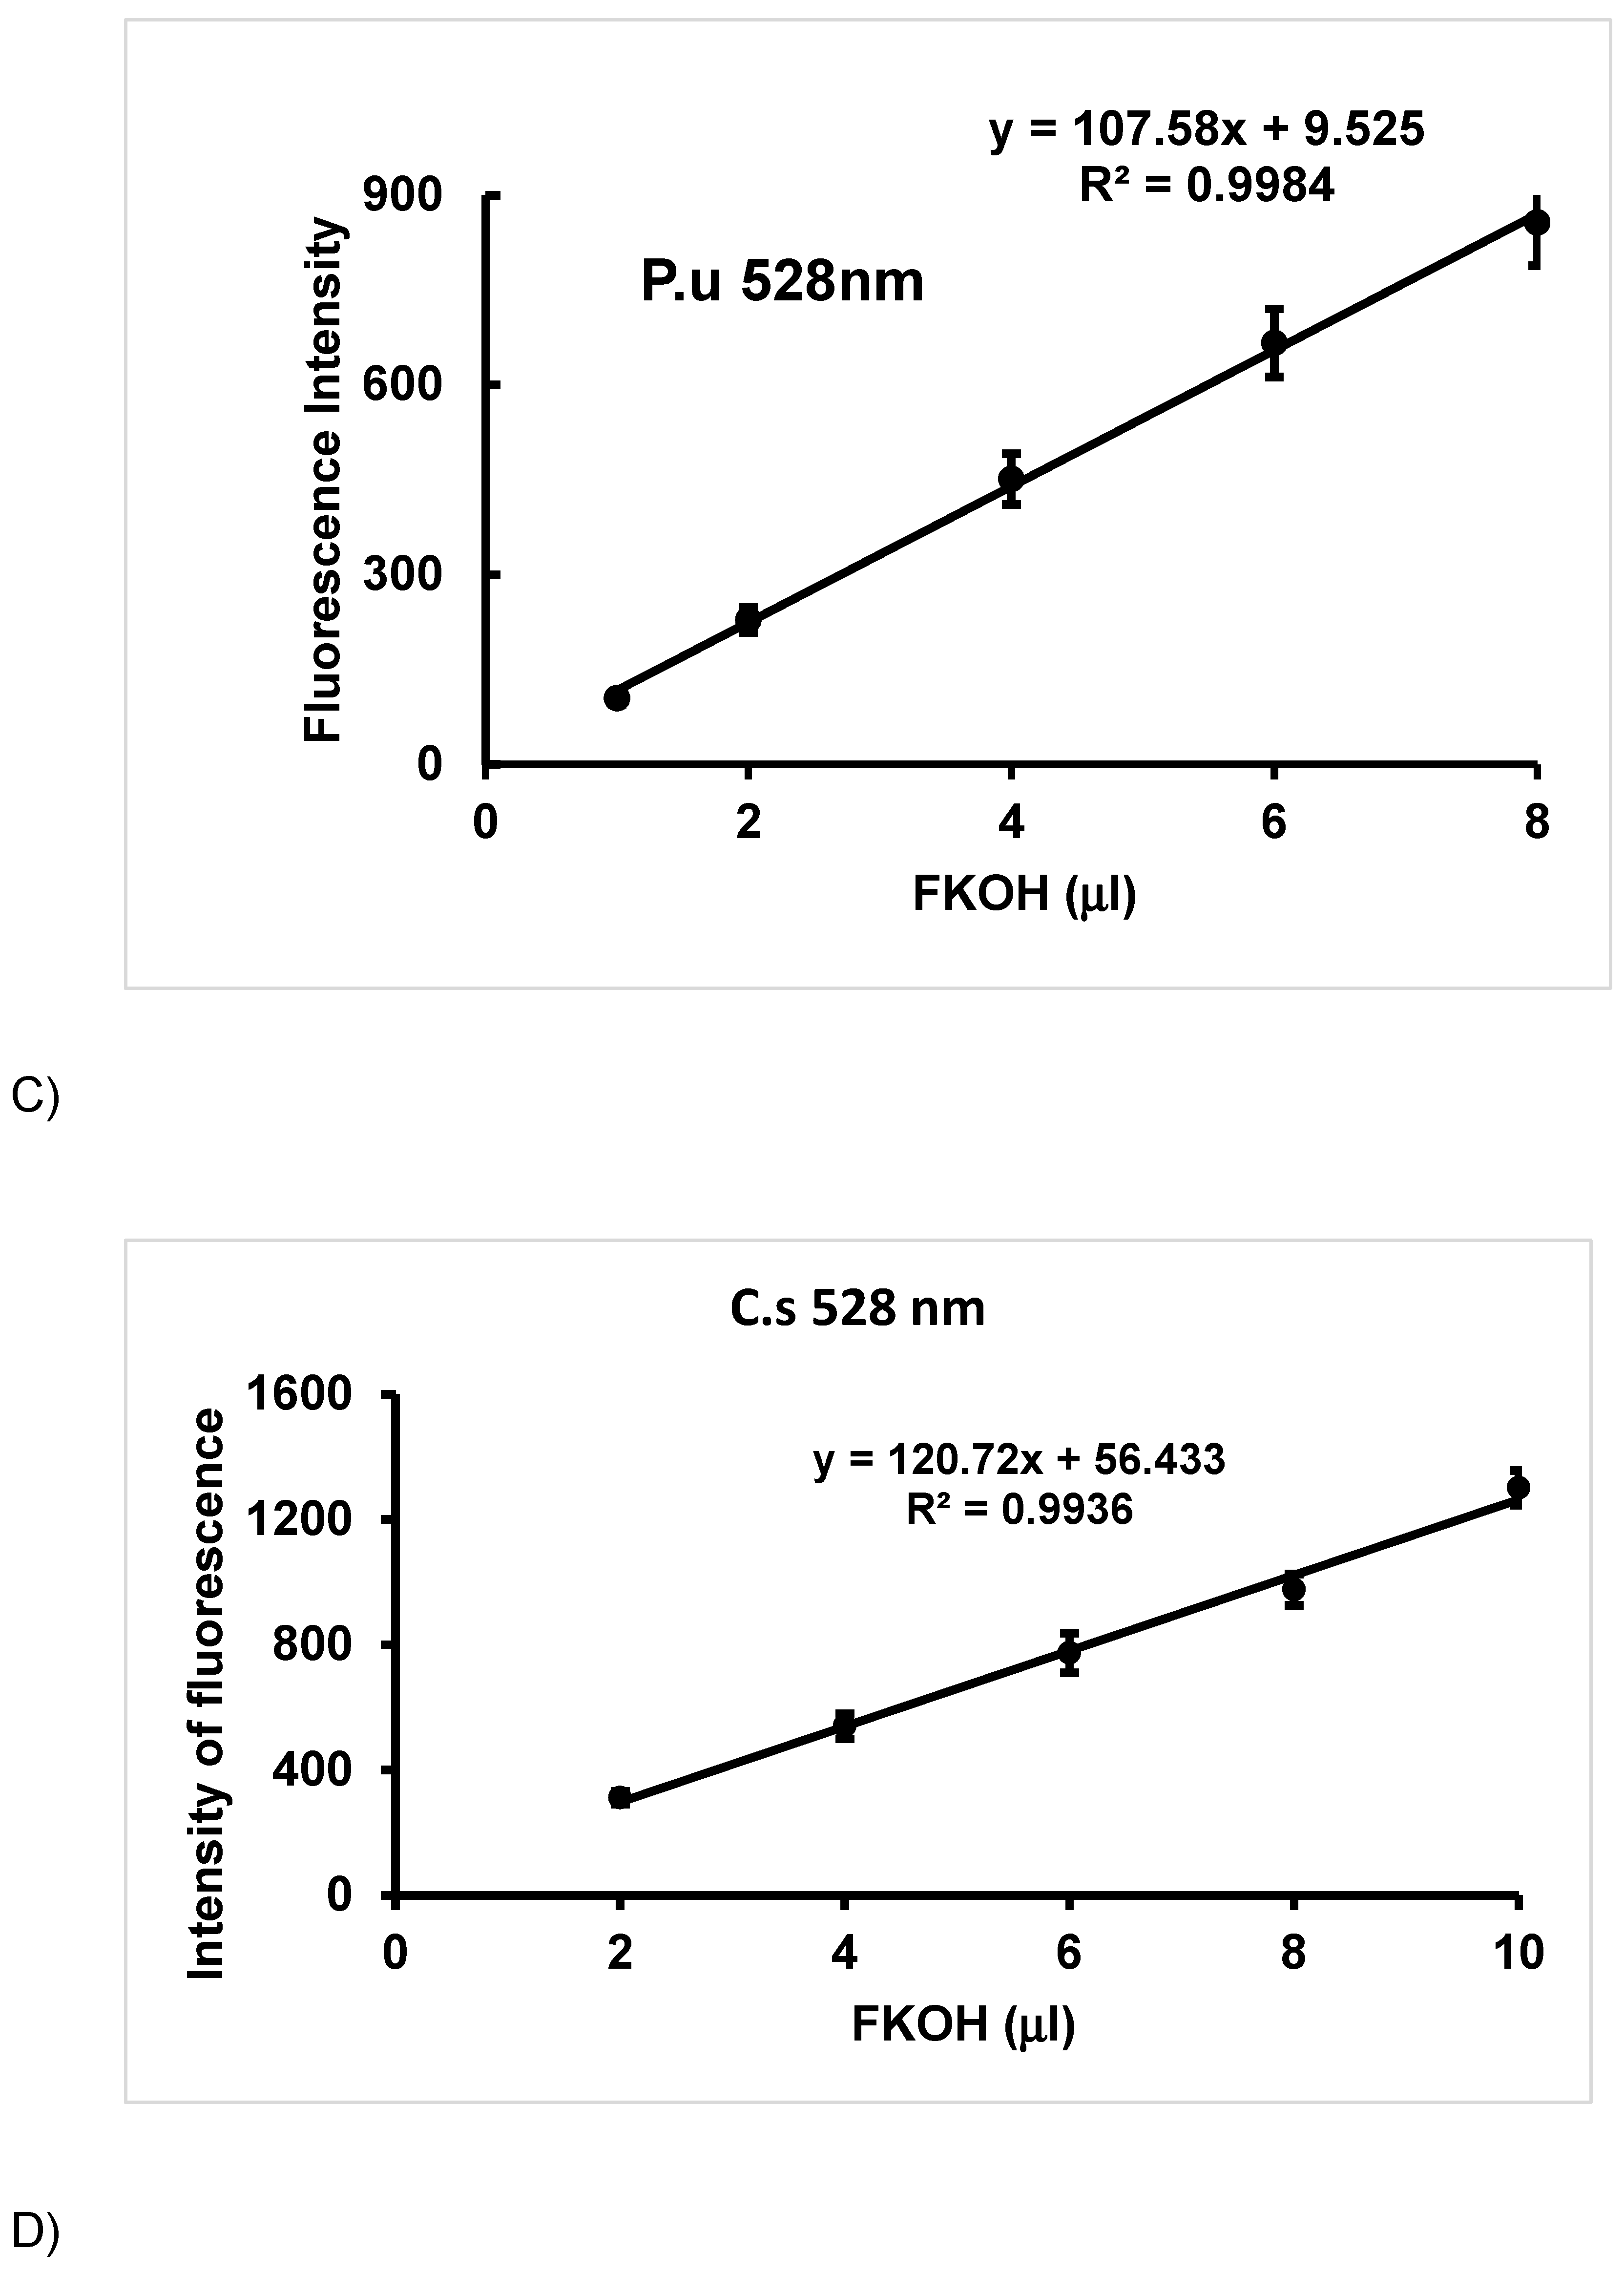
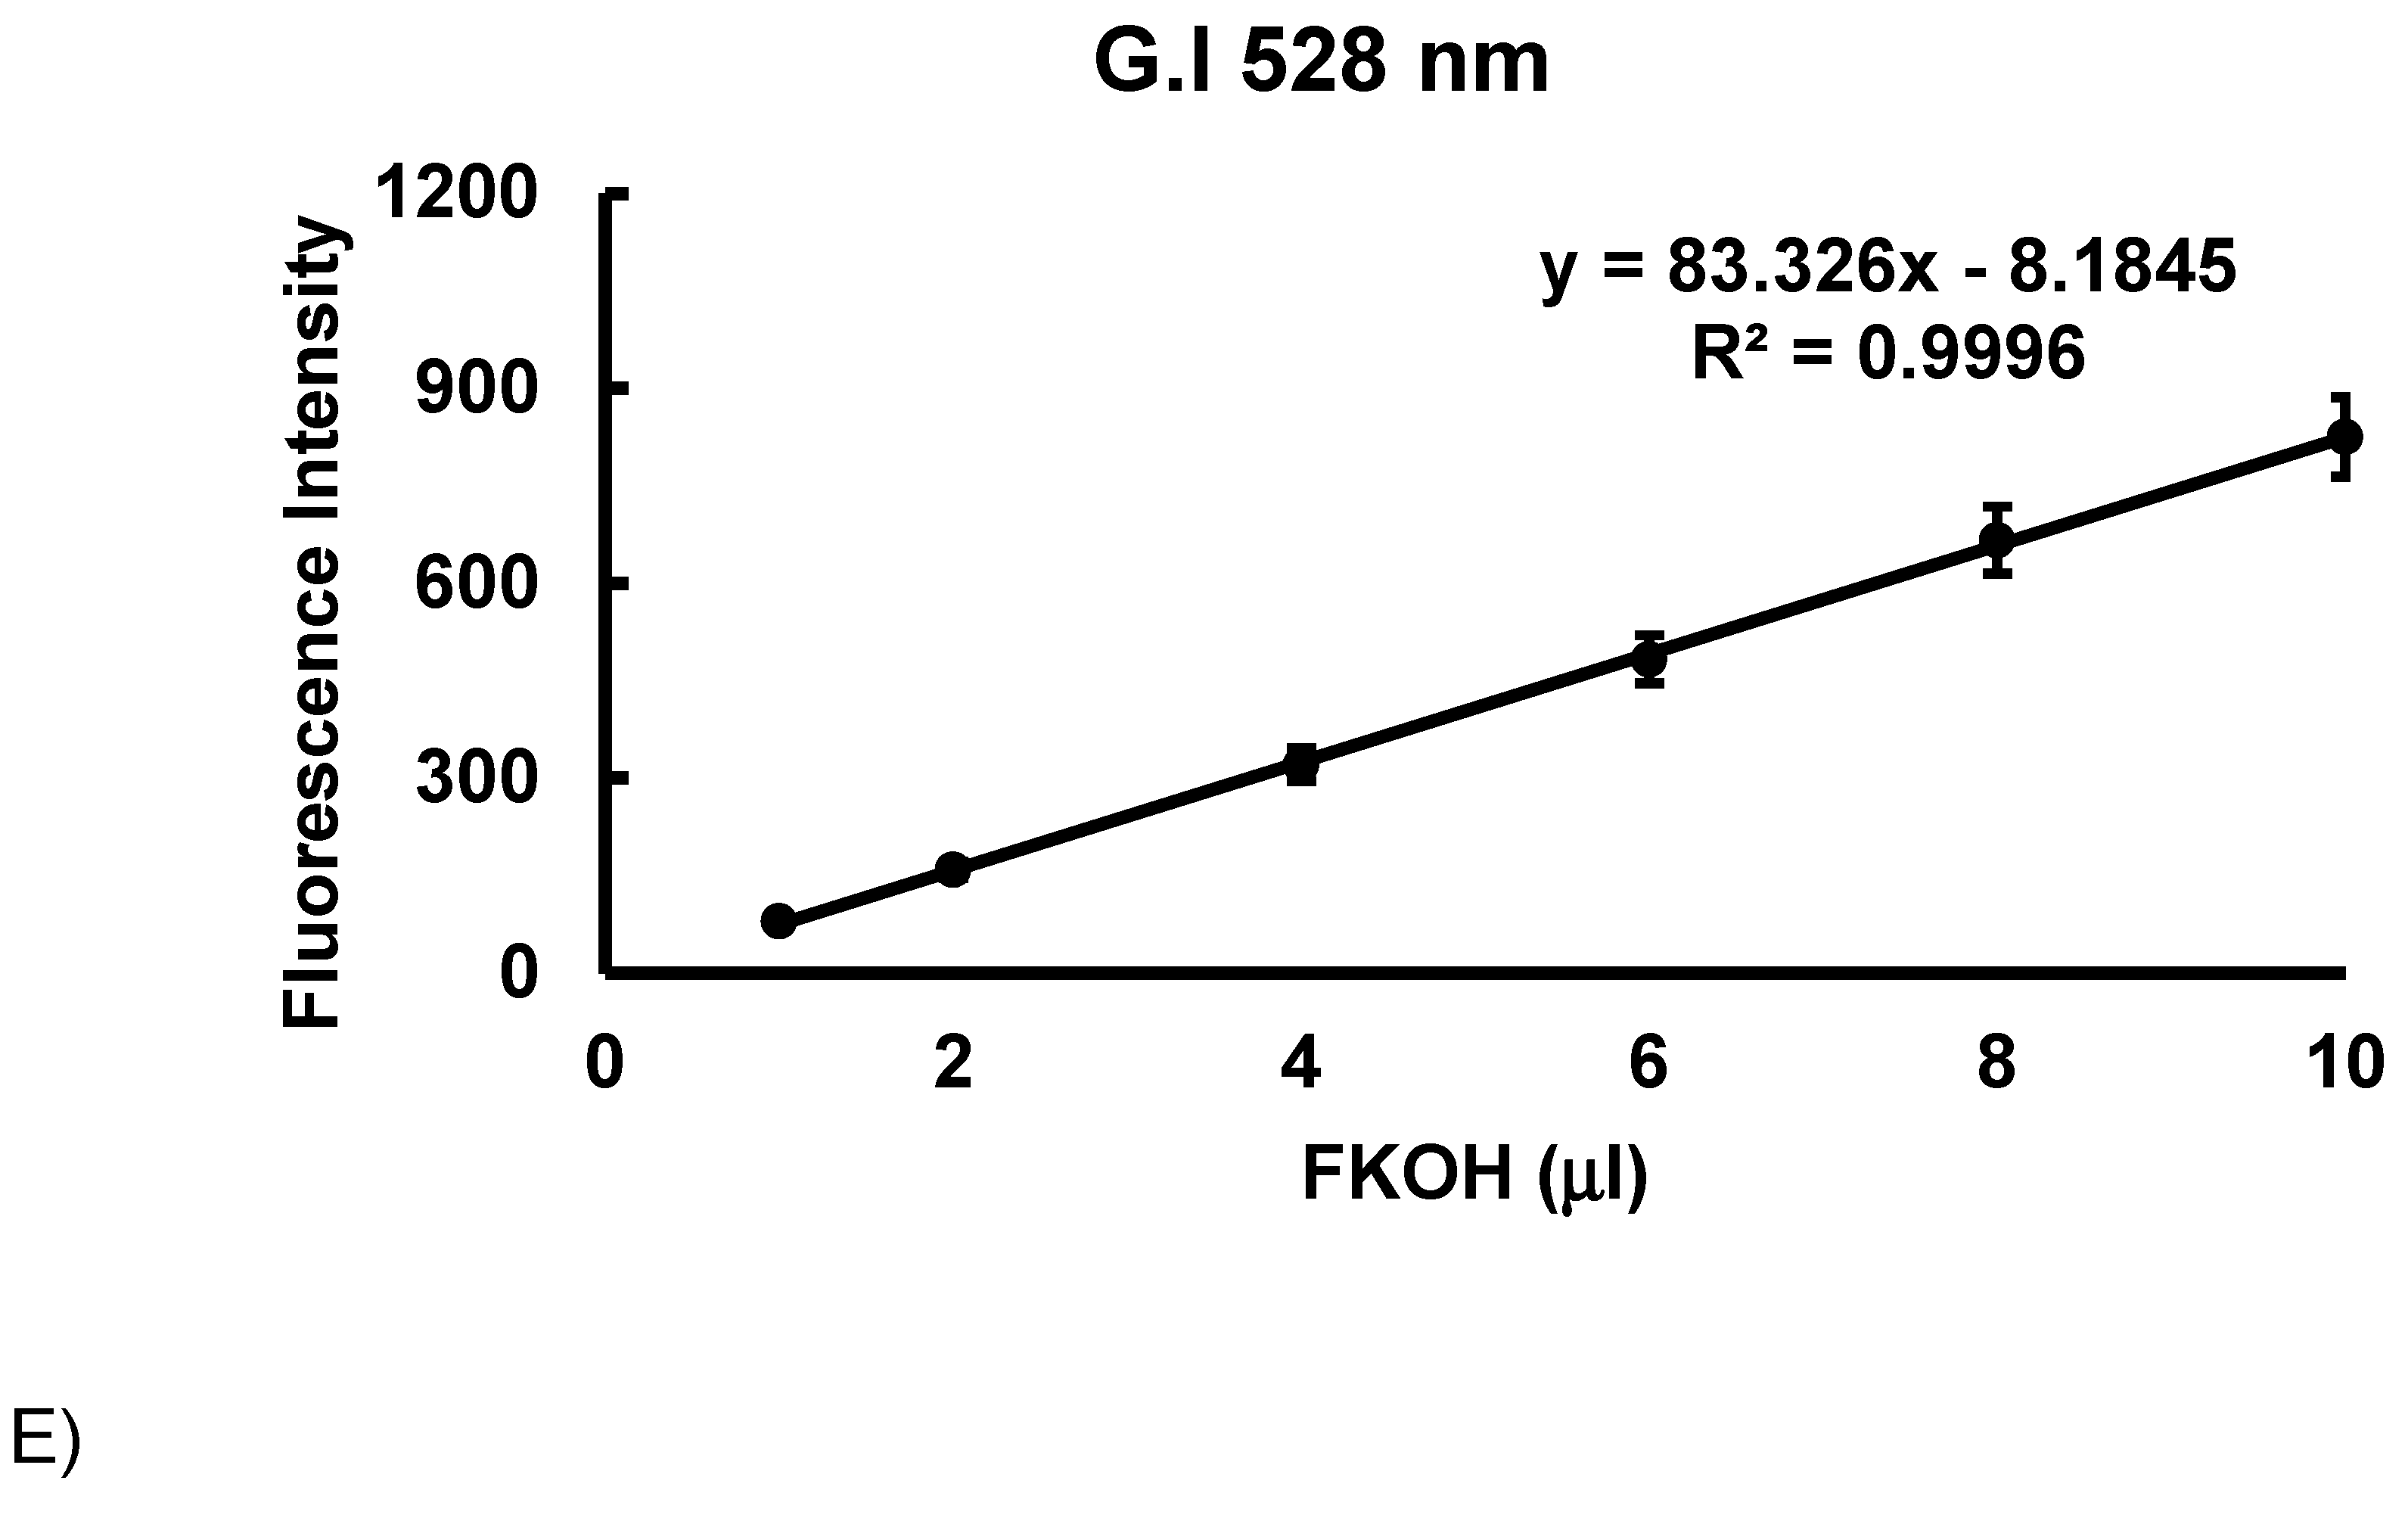
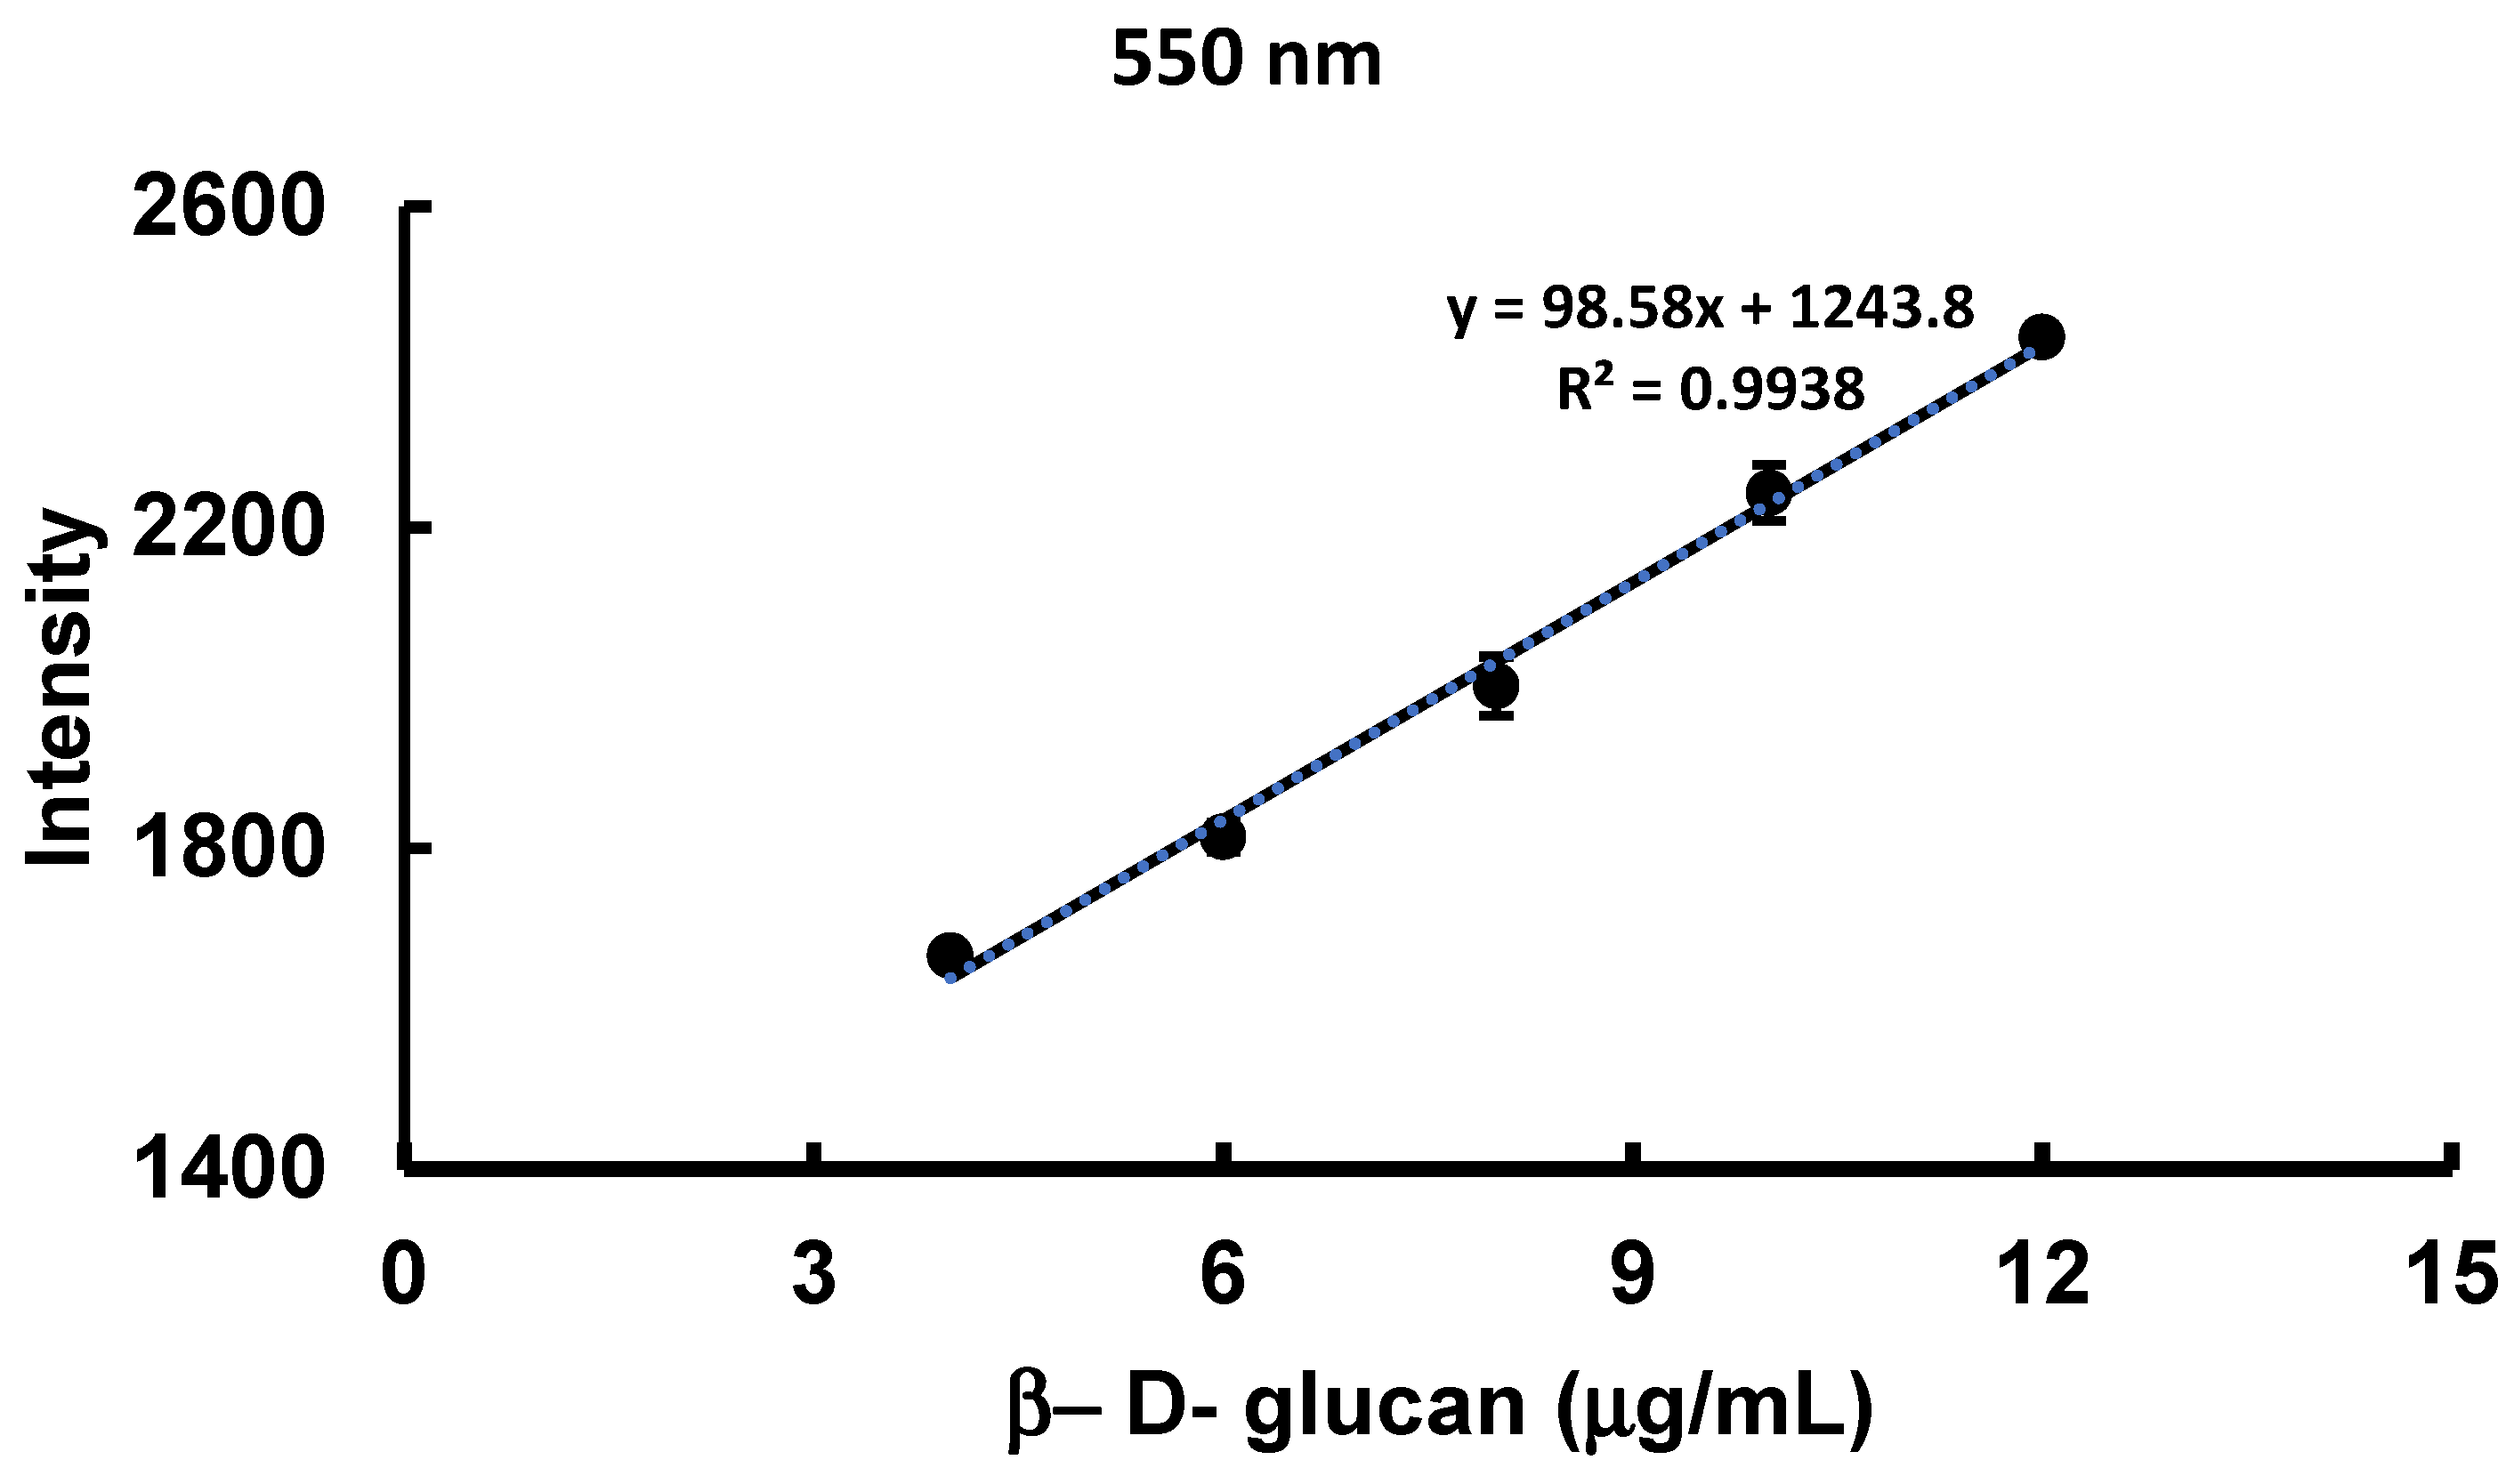
3.2. Method Validation.

This assay method was validated according to the ICH guidelines [21] about validation studies which included linearity and range, precision, accuracy, limits of detection (LOD) and quantitation (LOQ), and selectivity. Therefore, this assay method exhibited good linearity (r2 > 0.996) in the range of 0-14 μg/ per well in microtiteter plates, both LOD and LOQ were calculated from 3.3 × (SE/b), and 10 × (SE/b), respectively, where SE is the standard error and b is the slope of the calibration curves (Table 2).
This assay method was also analysed on precision and accuracy which were carried out as intra-day measurements through the testing of 2 different concentrations (i.e 5 and 10 μg) of β-D-glucans from Euglena gracilis . The values of % RSD were calculated to measure the precision which were 0.845 and 0.984, respectively. Regarding the accuracy, the mean % recovery was determined for each concentration (three replicates) which were 98.3 and 99.1 %, respectively.
This assay method was used to measure the fluorescence intensity as a function of volume of FKOH extract of several mushroom strains which exhibited a linear relationship for assay of β-D-glucans for Pleurotus ostreatus, Cordyceps sinensis, Ganoderma lucidium and Polyporus umbellatus (Figure 4B, C, D. E).
Figure 4B,C,D,E. FKOH fraction of several mushroom strains was analysed in microtiter plate fluorescence reader with a gain of 2200 with excitation l and emission l of 420 and 528 nm, respectively. The final volume was 100 μl per well which was completed with H2O. B- Pleurotus ostreatus; C- Polyporus umbellatus; D - Cordyceps sinensis; E- Ganoderma lucidium .
Preprints 189829 g007aPreprints 189829 g007bPreprints 189829 g007c
As far as intrinsic SFS for β-D-glucans is concerned, there is only one report in the literature which briefly described some fluorescence properties of these biological macromolecules [20]. However, this analytical technique has been reported to assay for several substances such as pharmaceutical products, polycyclic aromatic hydrocarbons in fuels and metabolites in biological fluids [22,23,24].

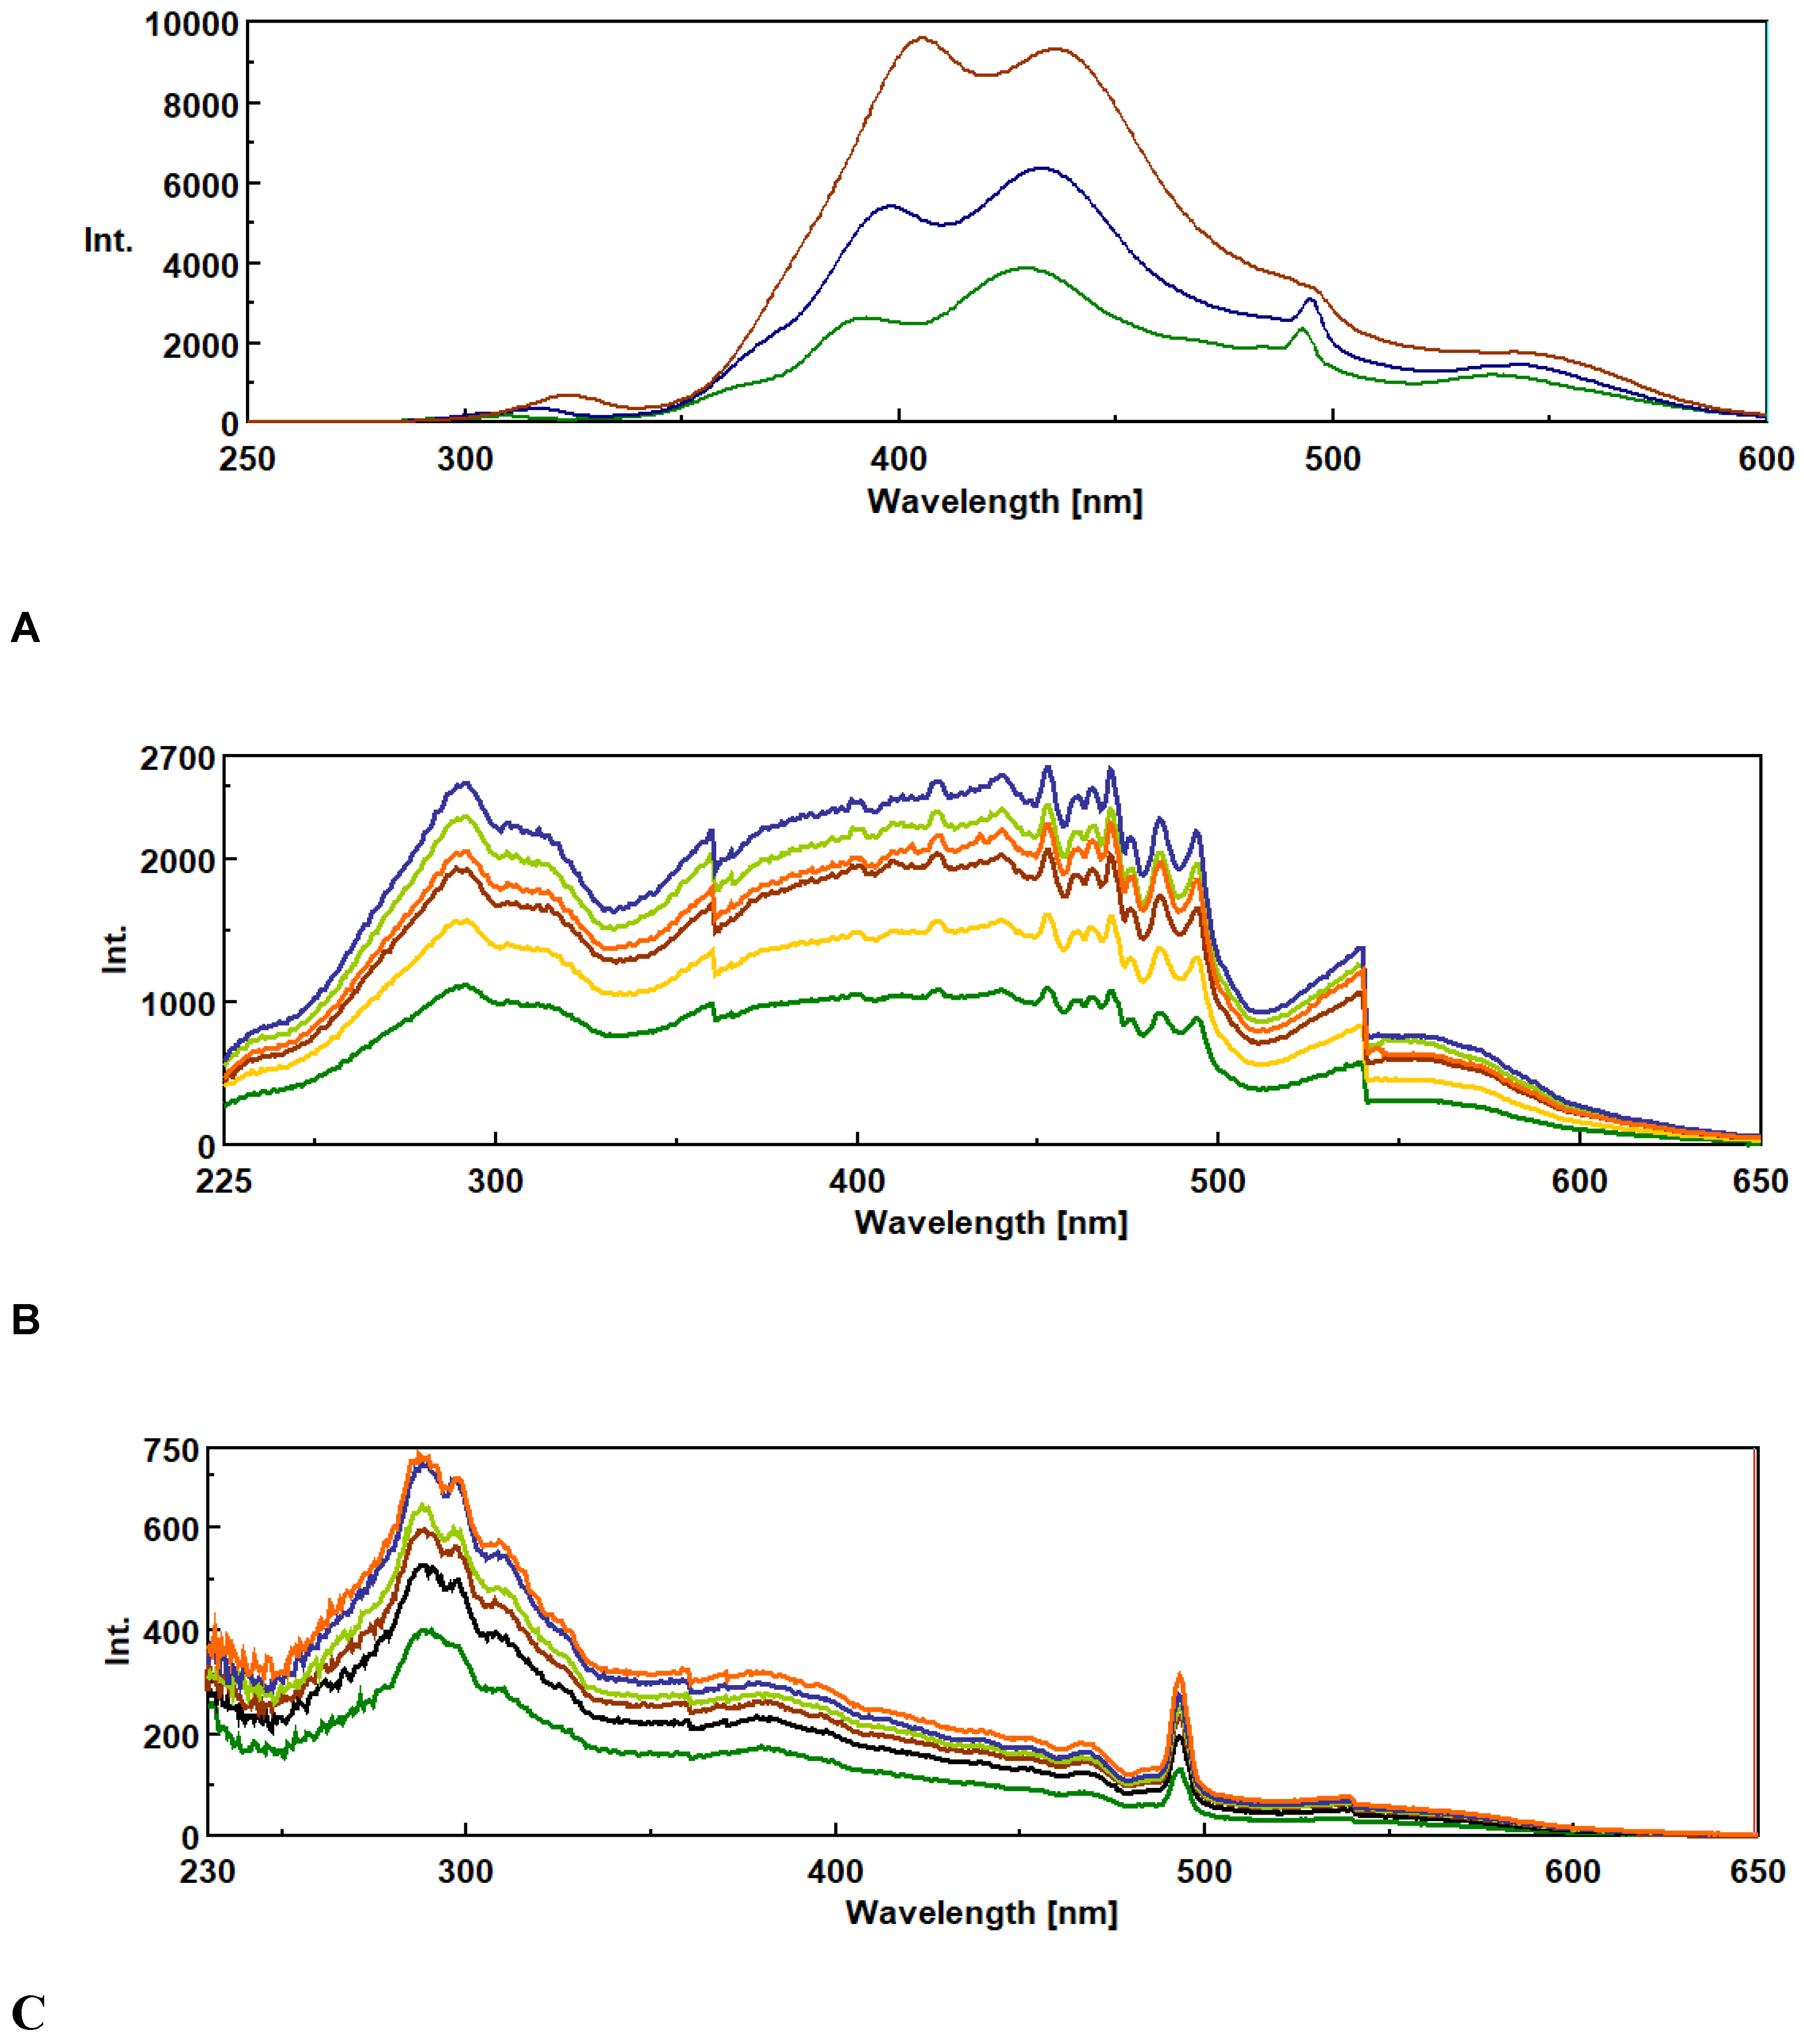
3.2. Intrinsic Synchronous Phosphorescence Spectroscopy (SPS)

Synchronous phosphorescence spectroscopy (SPS) involves the delayed and often long-lasting emission of light from a phosphorescent material that takes place after it has been excited by a light source. The main difference between fluorescence and phosphorescence is that the former is a fast, active measurement technique, whereas synchronous phosphorescence describes a property of slow-decaying light emission.
The Δλ in SPS is an important parameter to obtain the best resolution , sensitivity and spectral shape for a specific analyte. Therefore, Figure 5A exhibits several SPF spectra at increasing Δλ for Ganoderma lucidium and Pleurotus ostreatus which revealed a decrease in fluorescence intensity at 475 and 550 nm
Figure 5A. Synchronous phosphorescence spectra of medicinal mushroom β-D-glucans with very low sensitivity and variation of Δλ as follows: ____ Ganoderma lucidium 10 nm ____ Ganoderma lucidium 20 nm; ____Ganoderm a lucidium 30 nm ____ Pleurotus ostreatus 10 nm ____Pleurotus ostreatus 20 nm ; ____ Pleurotus ostreatus 30 nm.
Preprints 189829 g008
β-D-glucans from several mushroom strains were also analysed by SPS with very low sensitivity and Δλ of 10 nm exhibiting two peaks at 475 and 550 nm as shown in Figure 5B.
Figure 5B. Synchronous phosphorescence spectra of medicinal mushroom β-D-glucans with very low sensitivity and Δλ of 10 nm as follows: ____ Inonotus obliquee ____ Pleurotus ostreatus; ____Auricularia auricula ____ Agaricus blazei ____Cordyceps sinensis.
Preprints 189829 g009
The assay development for β-D-glucans by SPS involved the set up of calibration curve with different concentrations of β-D-glucans from commercial Euglena gracilis which exhibited an increase in phosphorescence intensity at 290, 400 and 550 nm (Figure 5C).
Figure 5C. Synchronous phosphorescence spectra of different concentrations of commercial Euglena gracilis β-D-glucans with low sensitivity and Δλ of 10 nm as follows: ____4.0 μg; ____ 6.0 μg ; ____ 8.0 μg; ____ 10.0 μg and ____ 12.0 μg.
Preprints 189829 g010
Figure 5D revealed the calibration curve for β-D-glucans from commercial Euglena gracilis by SPS with Δλ of 10 nm and low sensitivity at 550 nm.
Figure 5D. Calibration curve of different concentrations of commercial β-D-glucan from Euglena gracilis with low sensitivity and Δλ of 10 nm by SPS at 550 nm.
Preprints 189829 g011
In order to investigate the selectivity of SPS for mushroom β-D-glucans, other commercial sources of β-D-glucans were analysed by this analytical technique such as barley, laminarin and pullulan (Figure 5E) which revealed very low fluorescence levels at 400 and 550 nm for laminarin and pullulan.
Figure 5E. Synchronous phosphorescence spectra of β-D-glucans from several commercial sources (1 mg) with low sensitivity and Δλ of 10 nm as follows: ___ Laminarin ; ___ Pullulan; ___ Euglena gracilis; ___ Barley.
Preprints 189829 g012
Regarding SPS, there are no reports in the literature about the use of this analytical technique for assay of chemical compounds. However, SPS has been very useful to build chemical sensors for detection and quantification of organic and inorganics compounds of environmental concern as well as on phosphorescence energy of organic molecules [25,26].

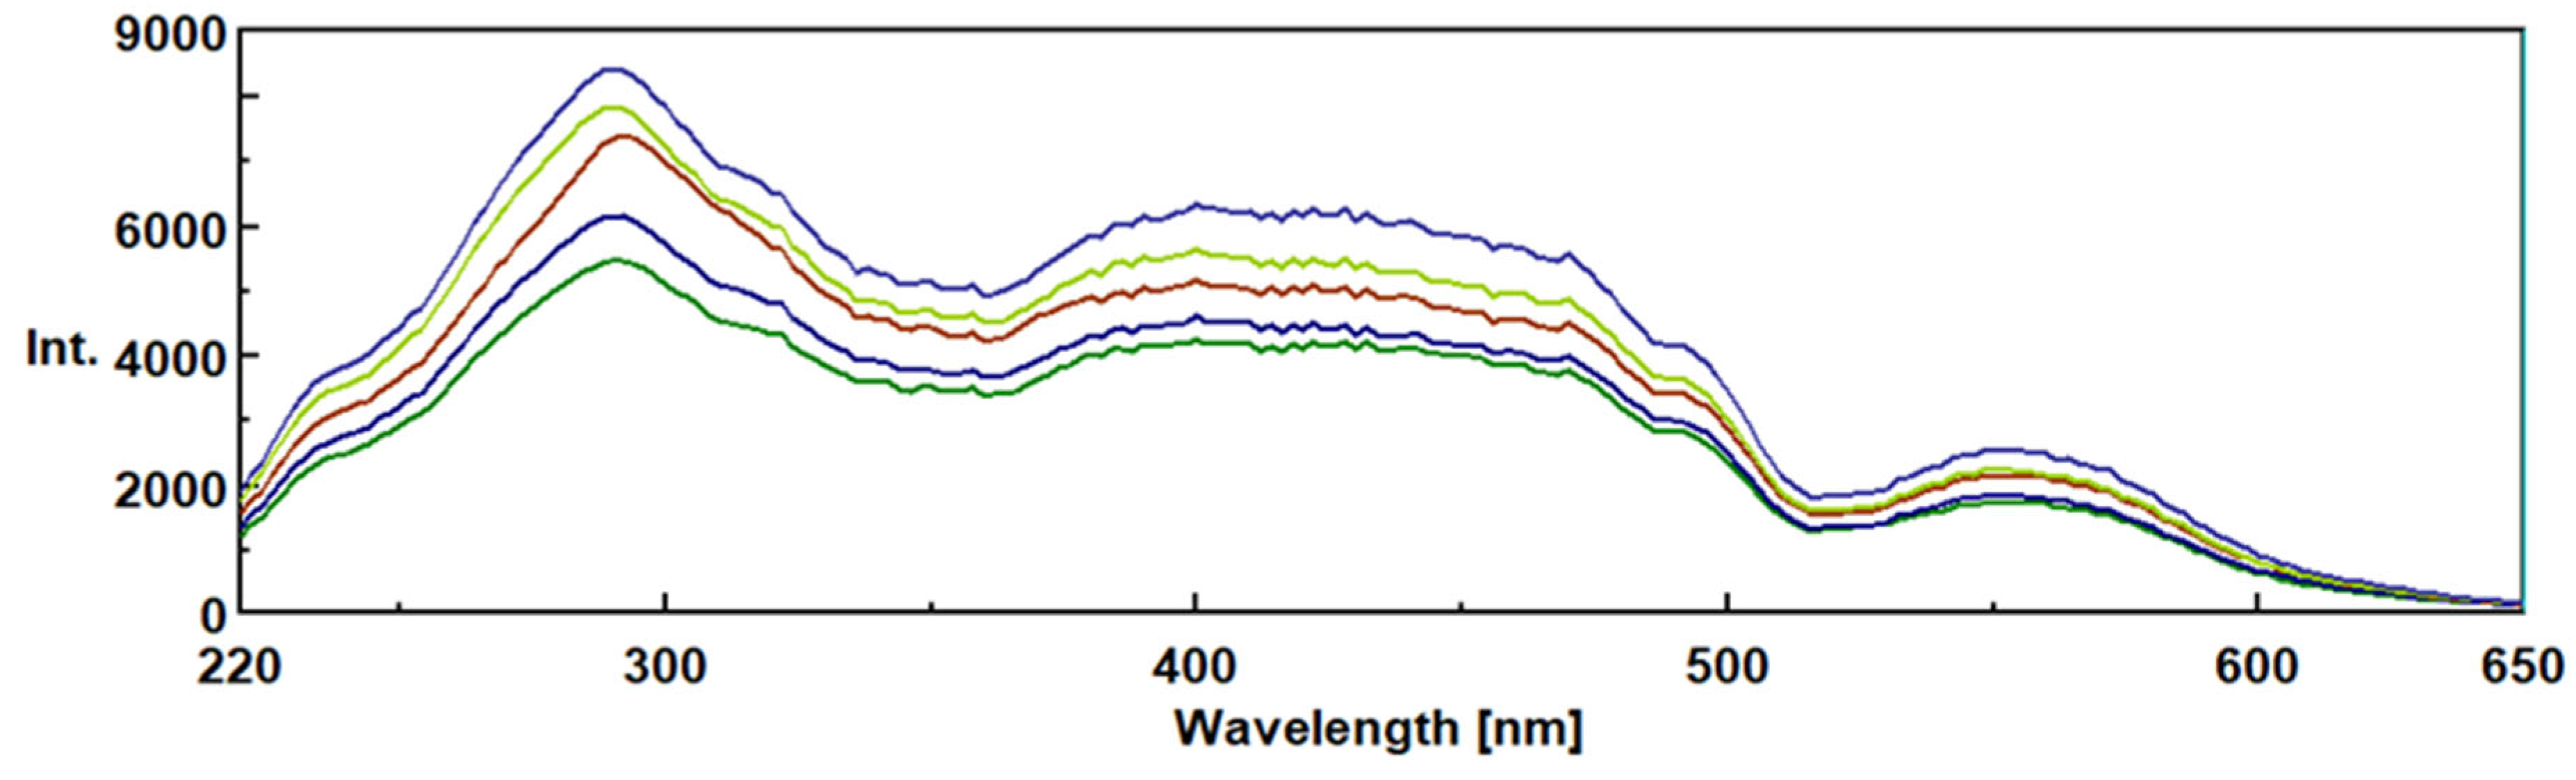
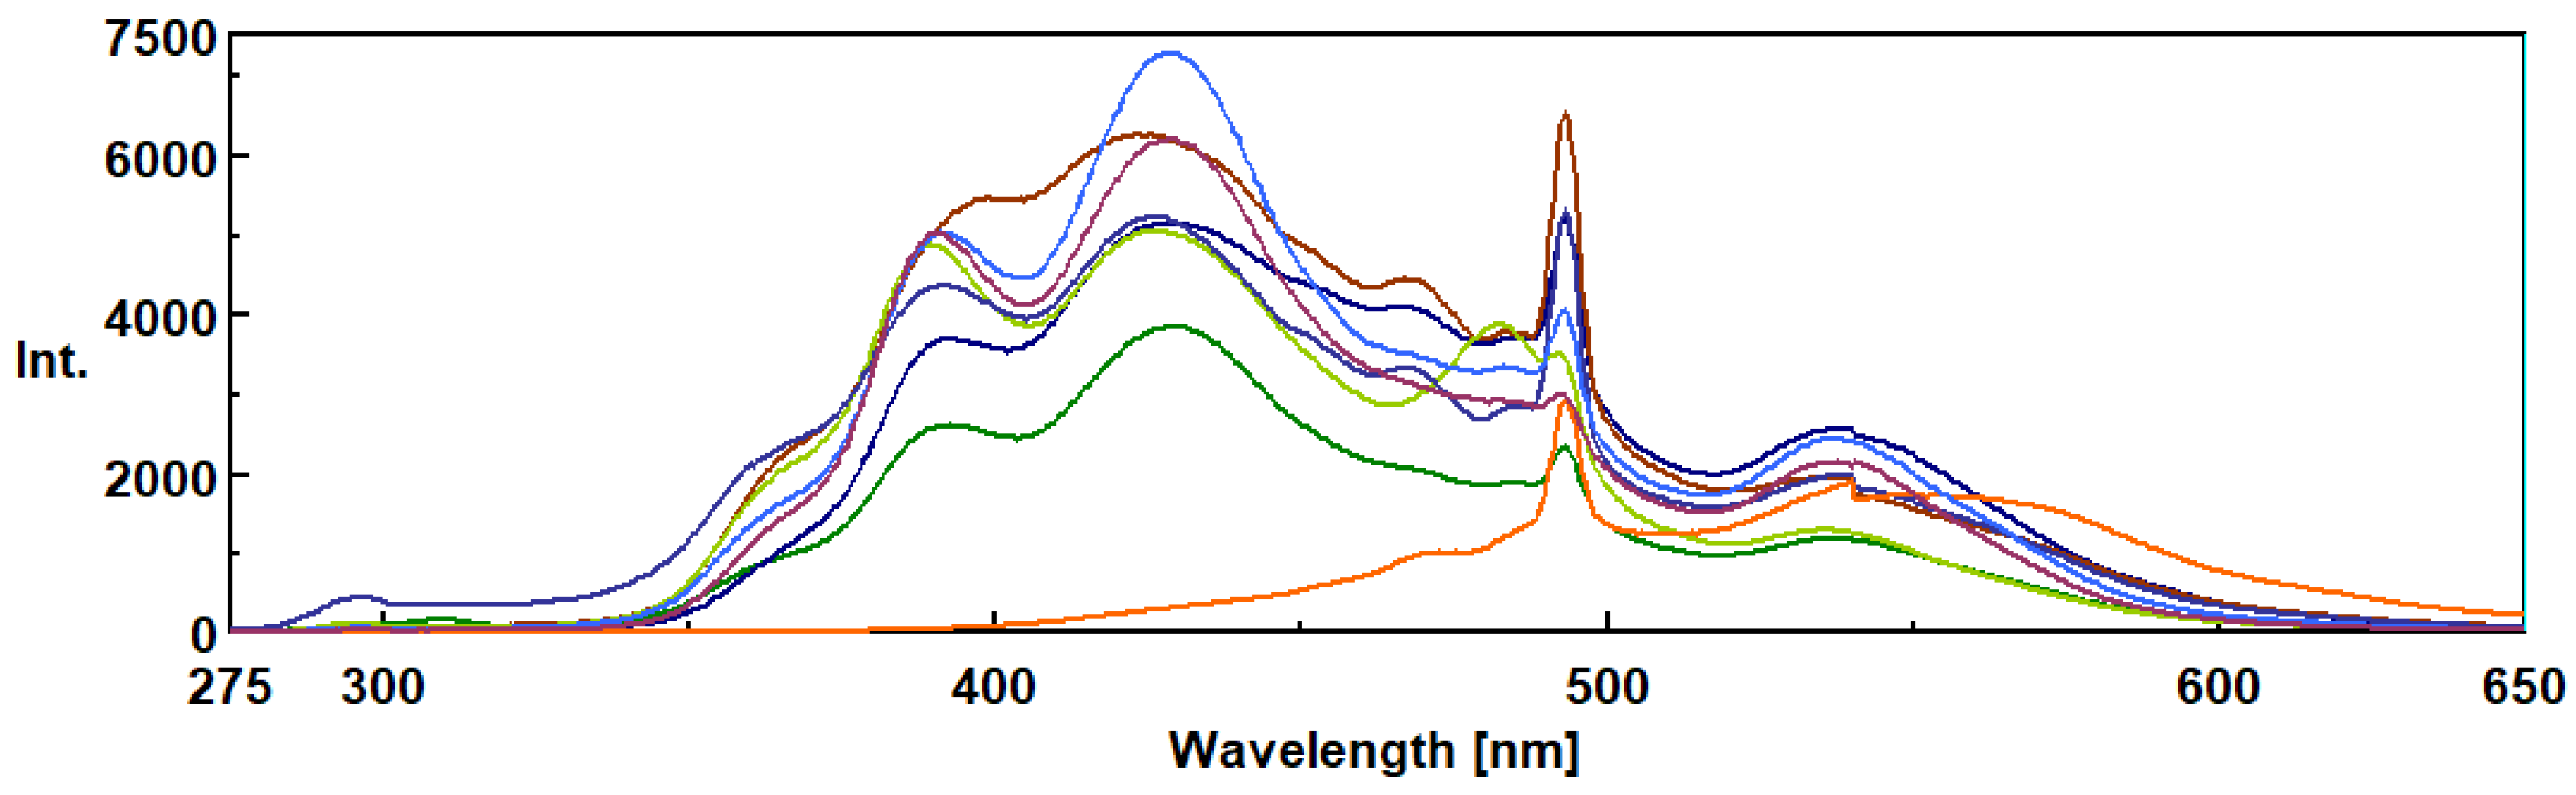
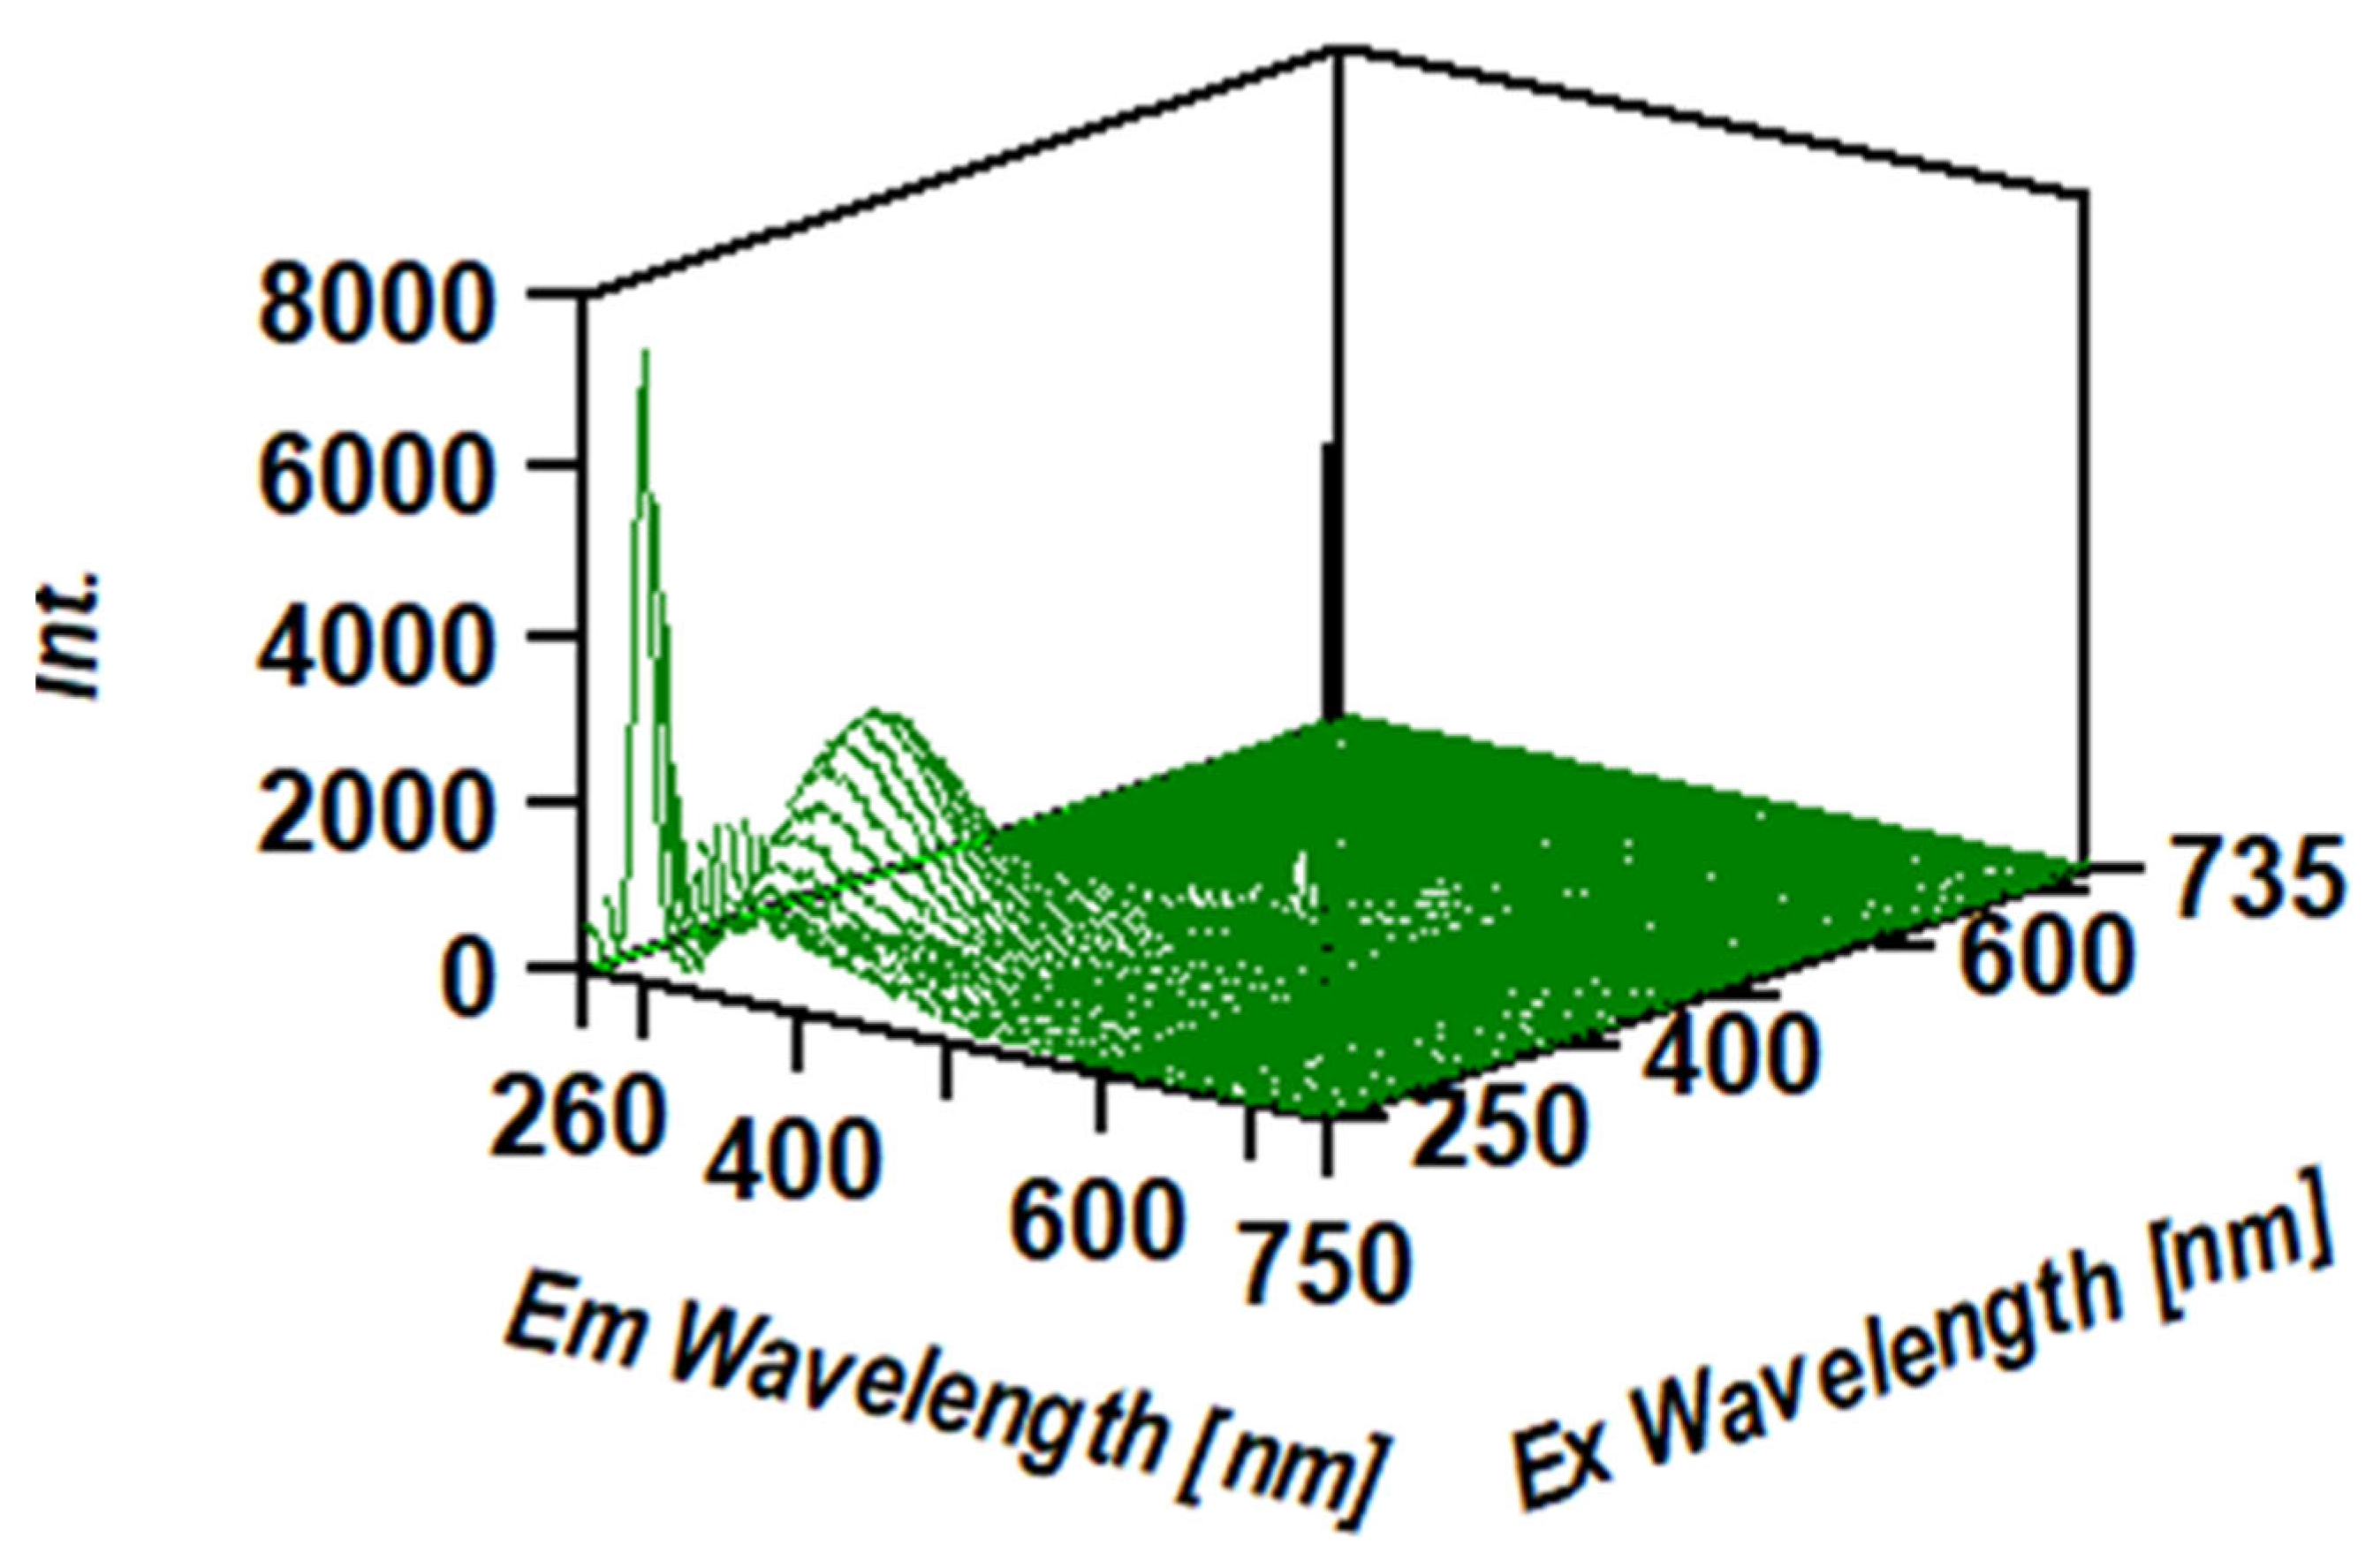
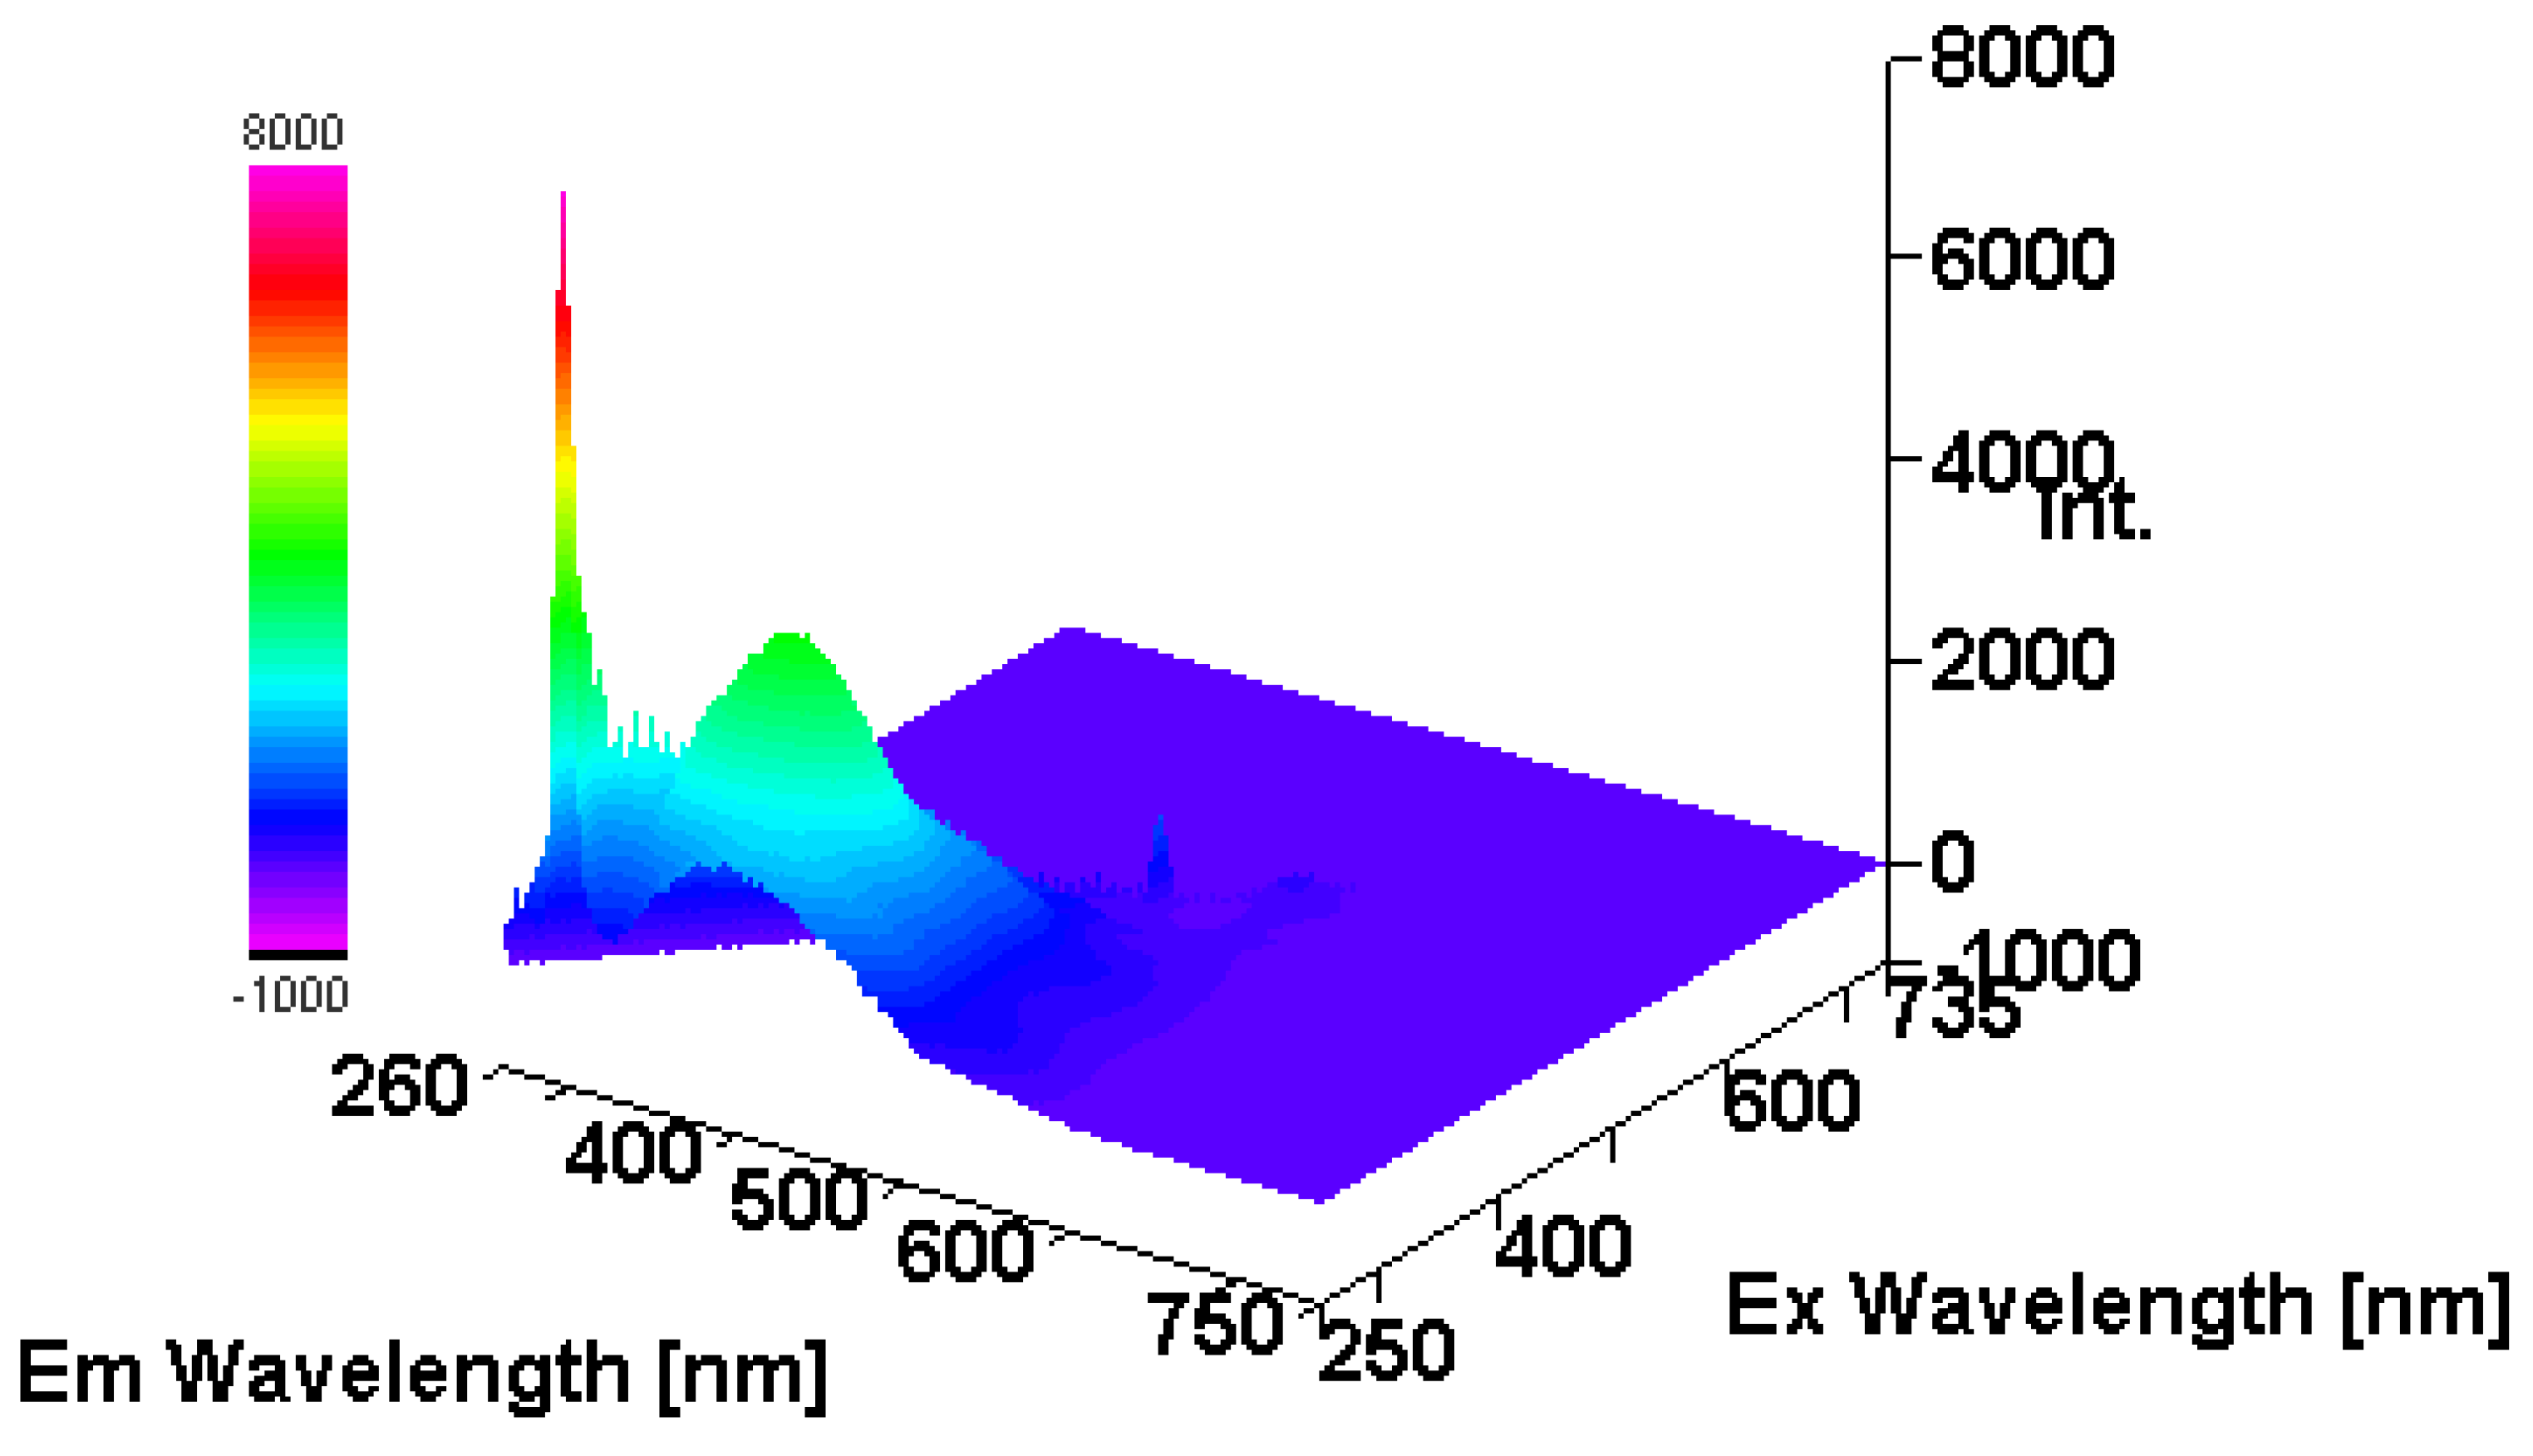
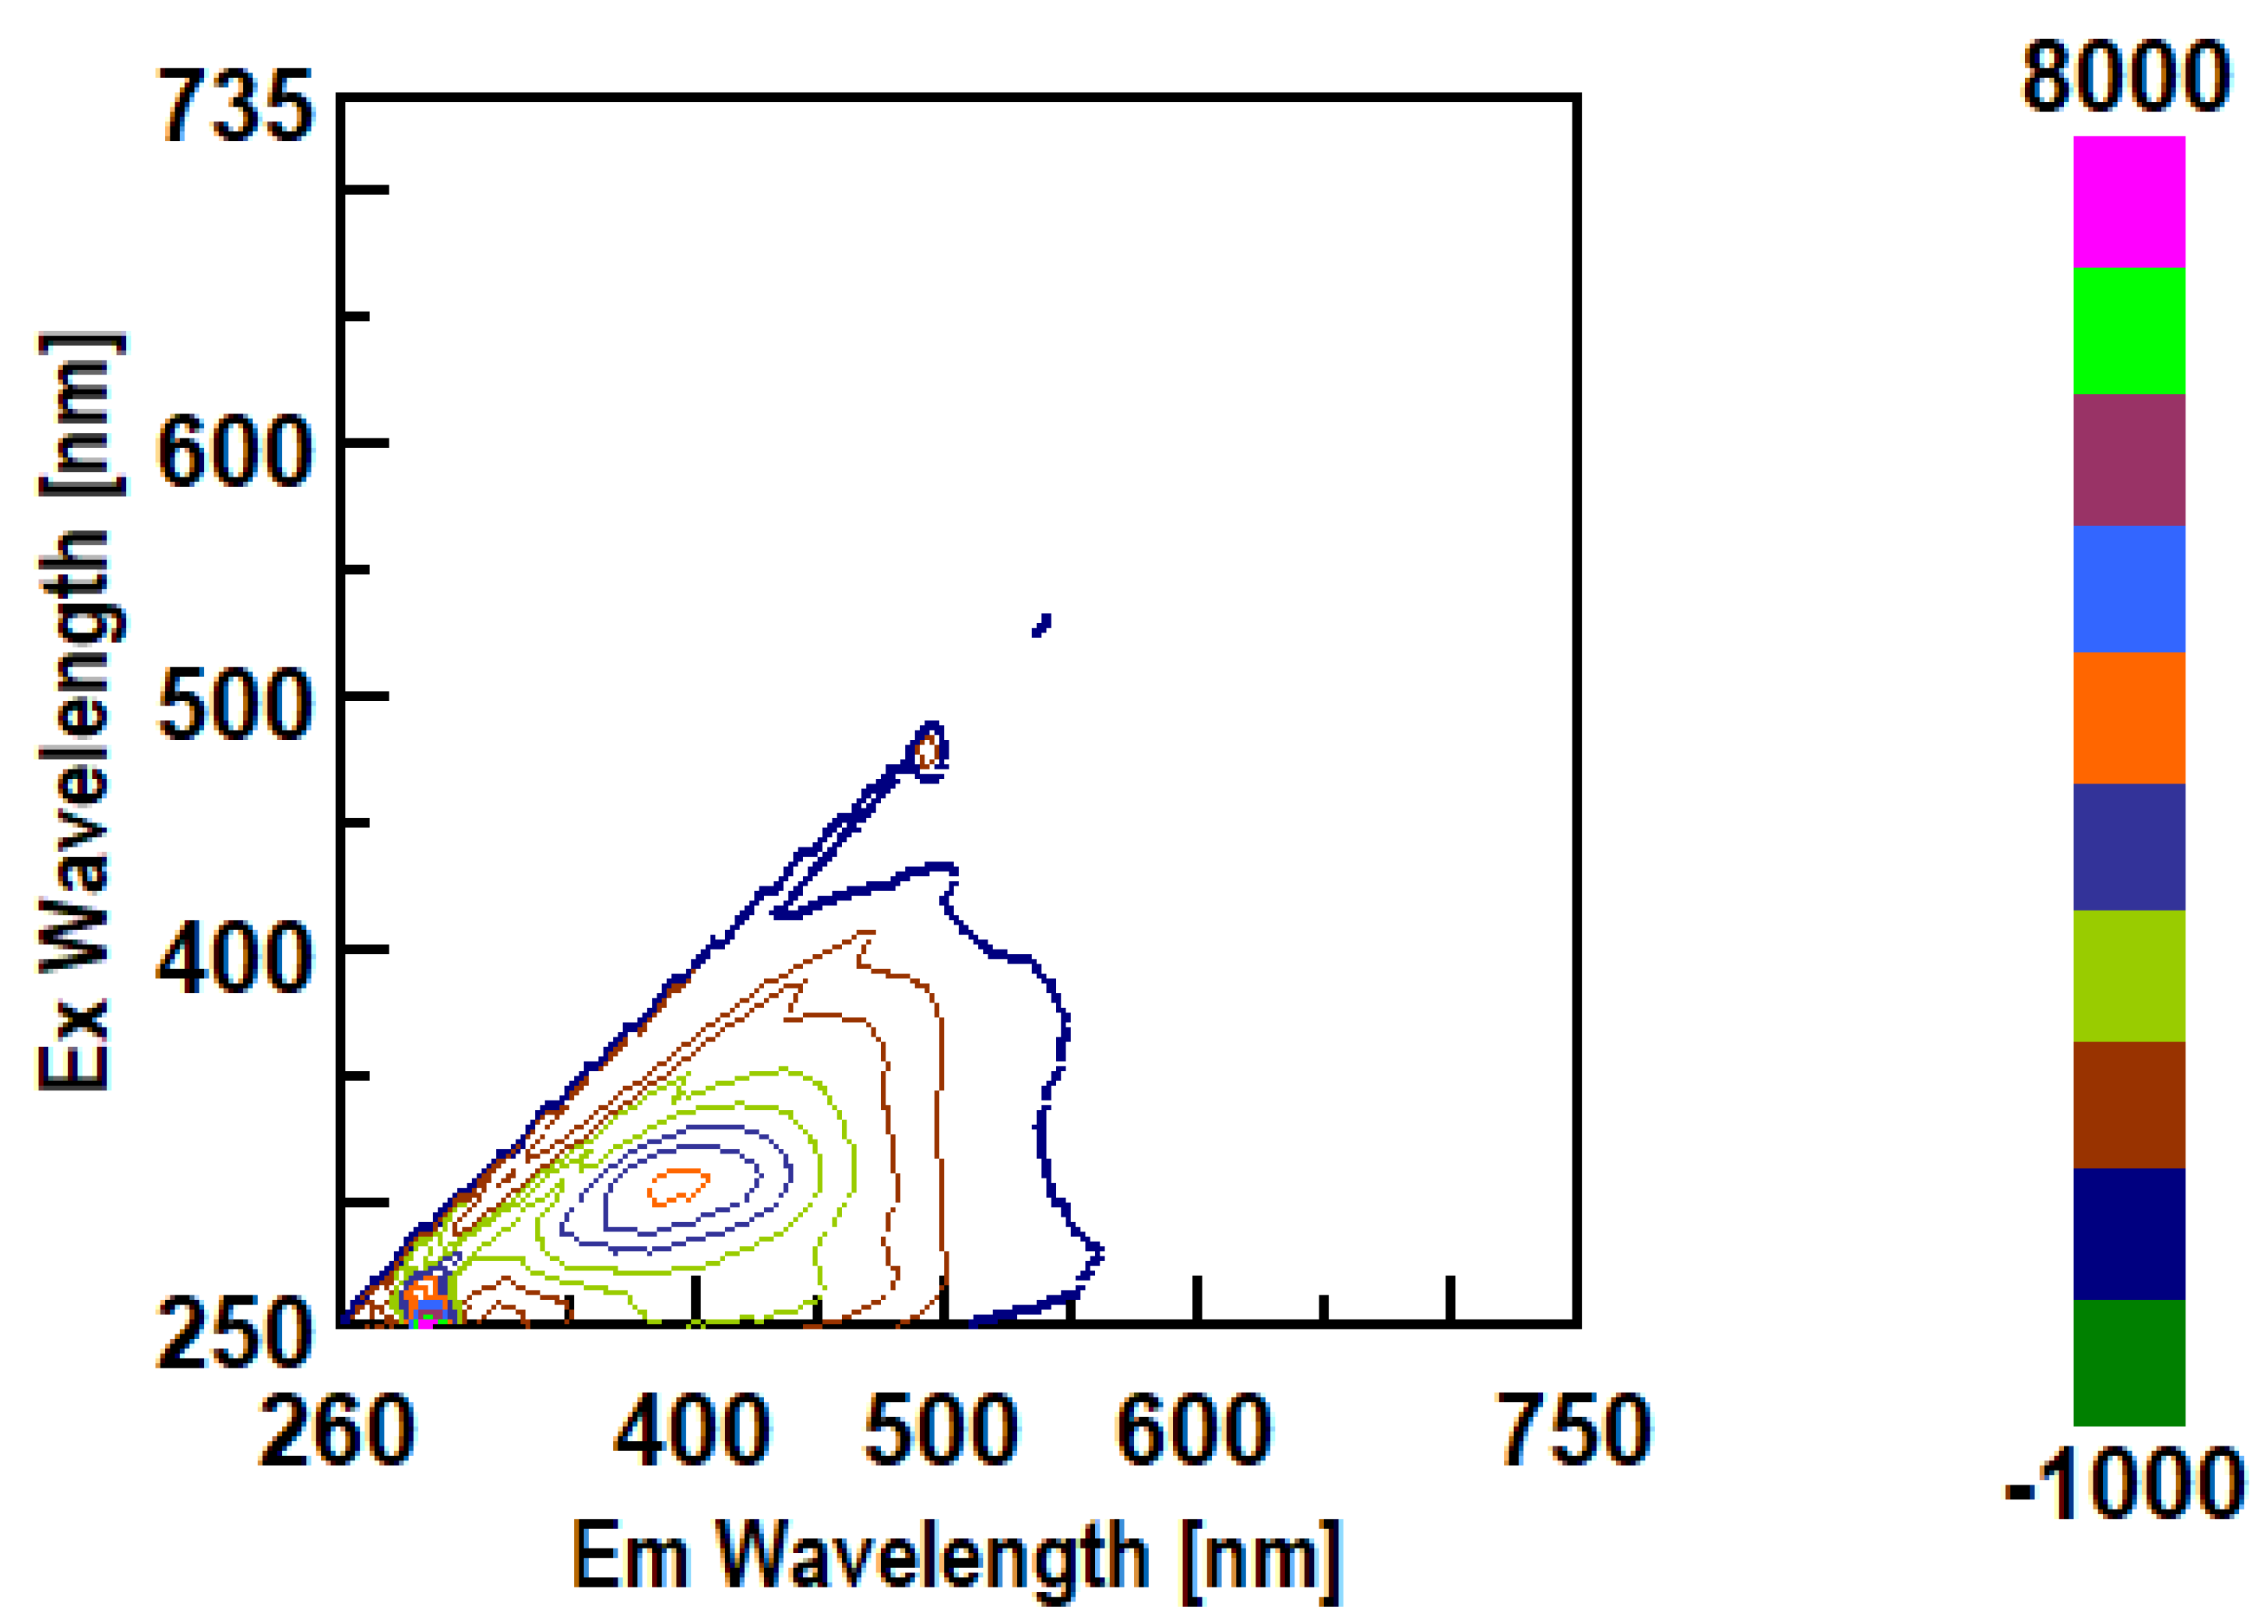
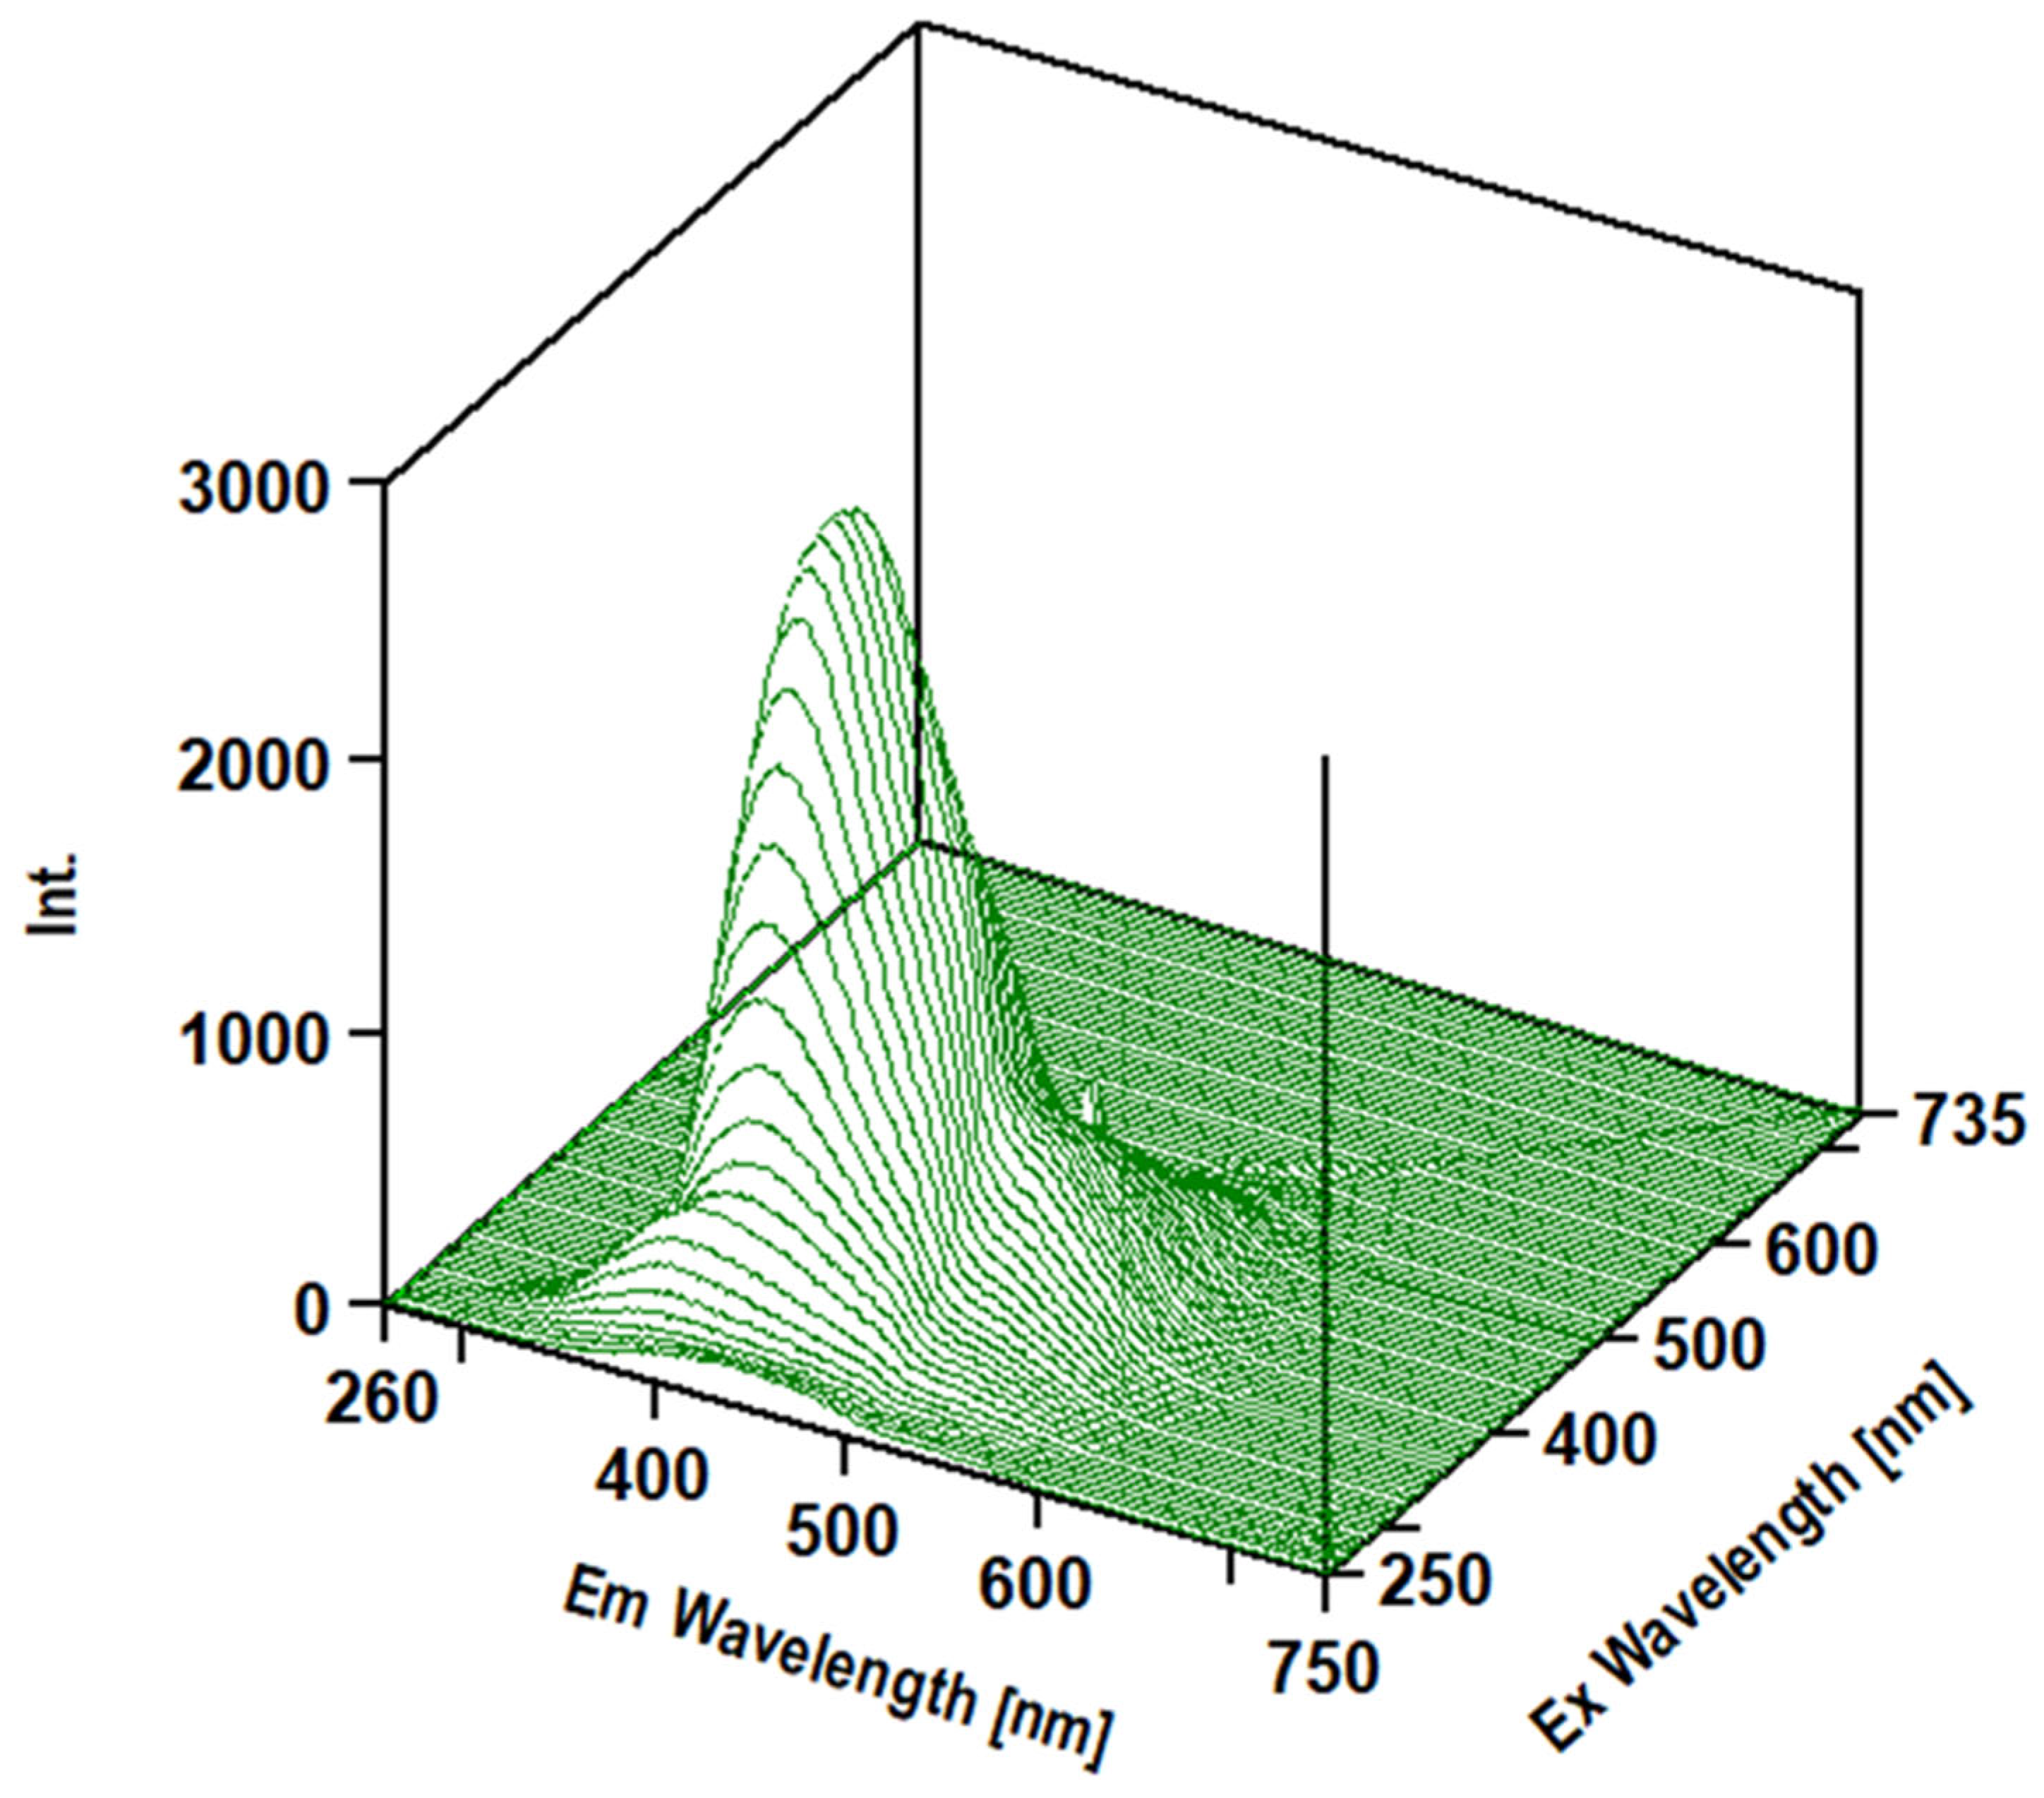
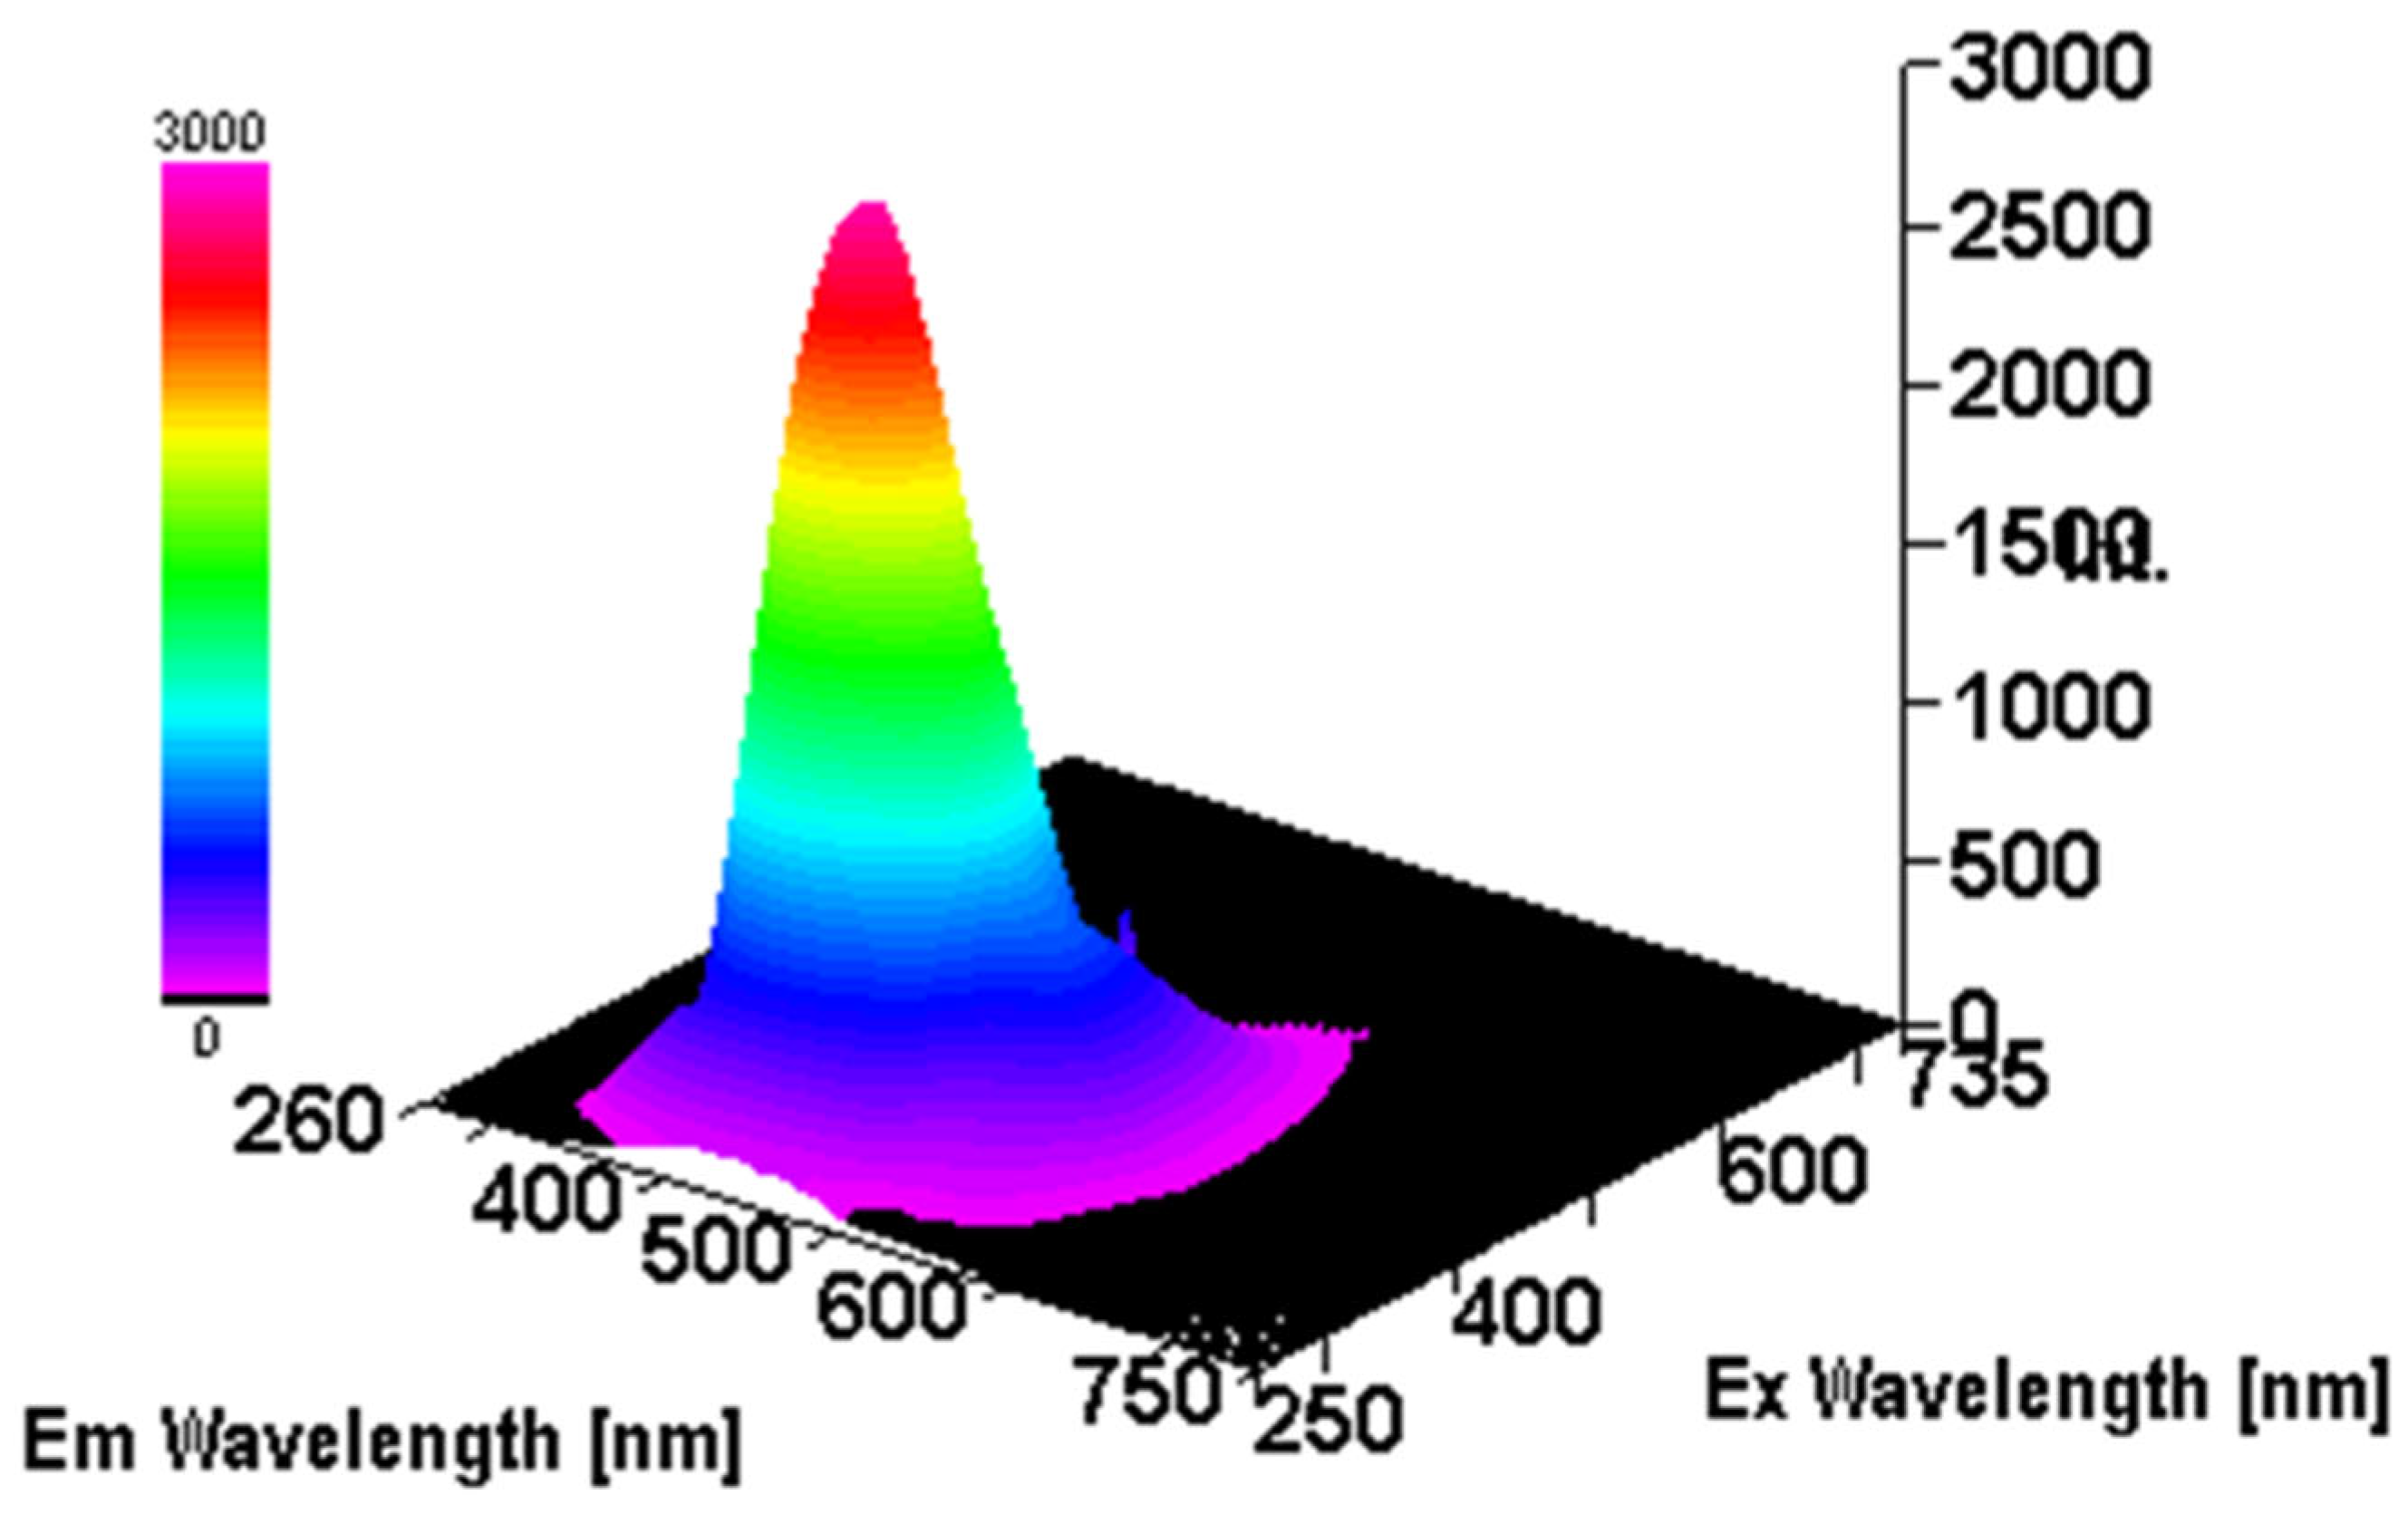
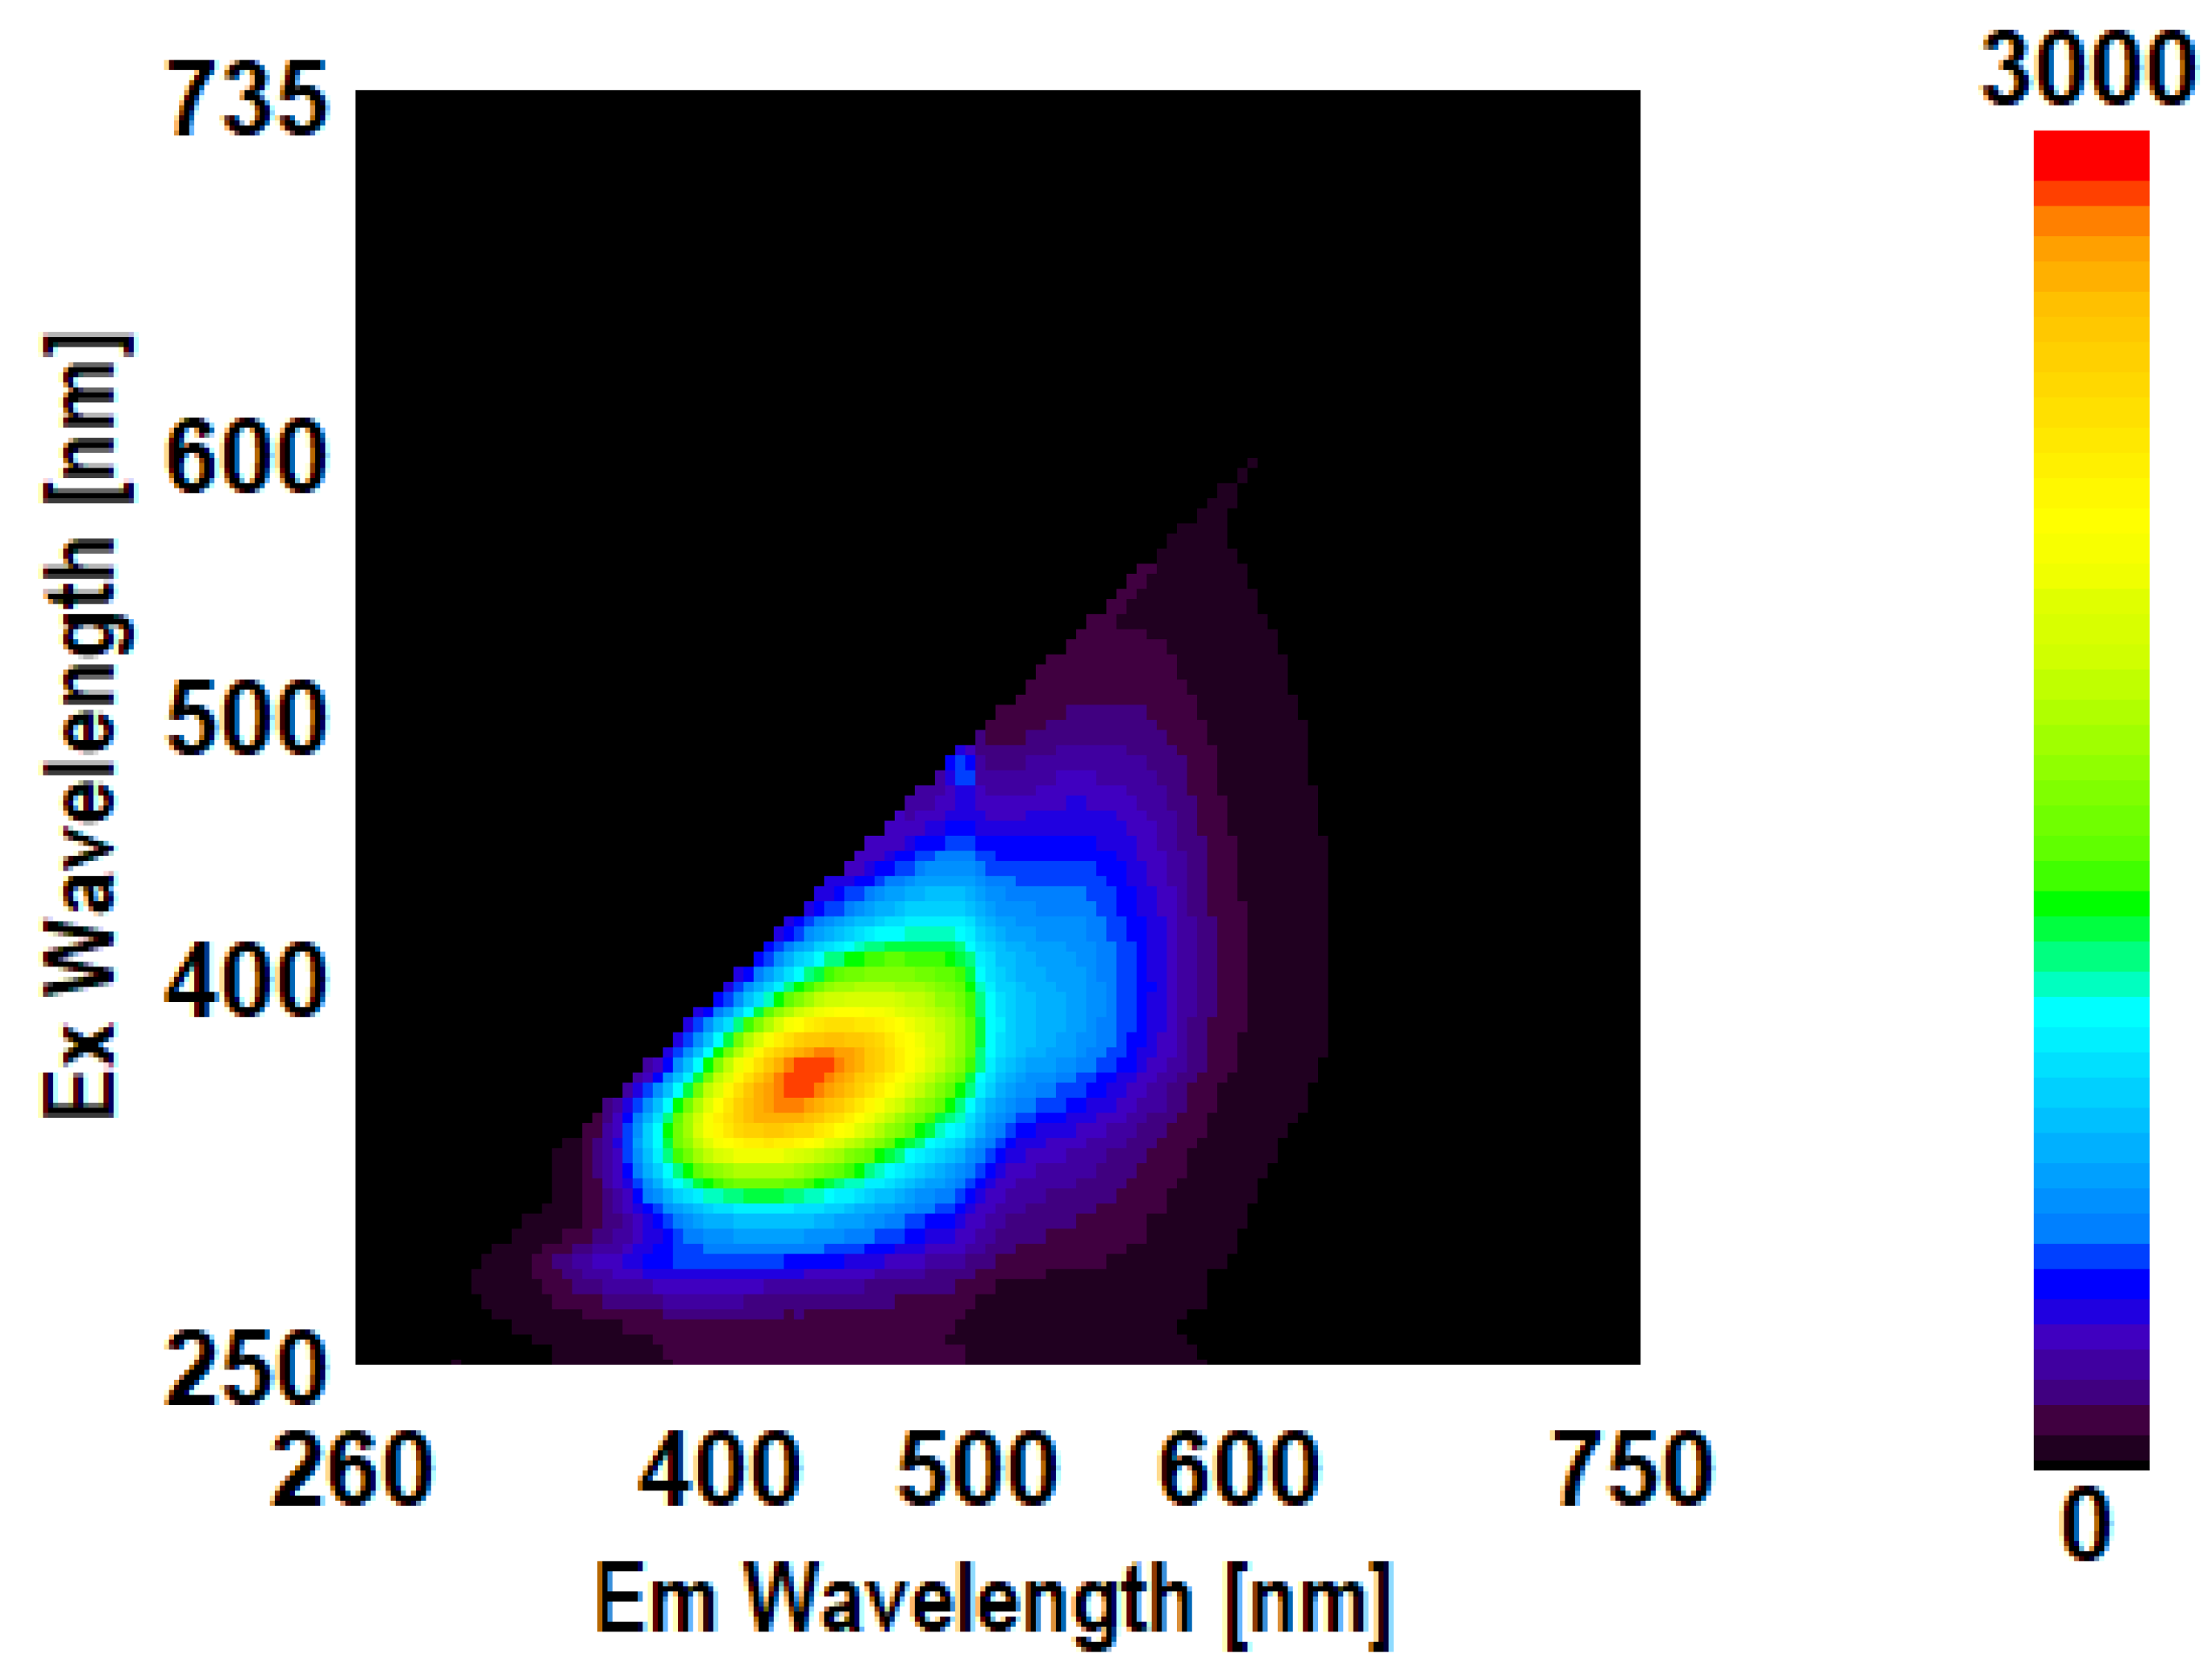
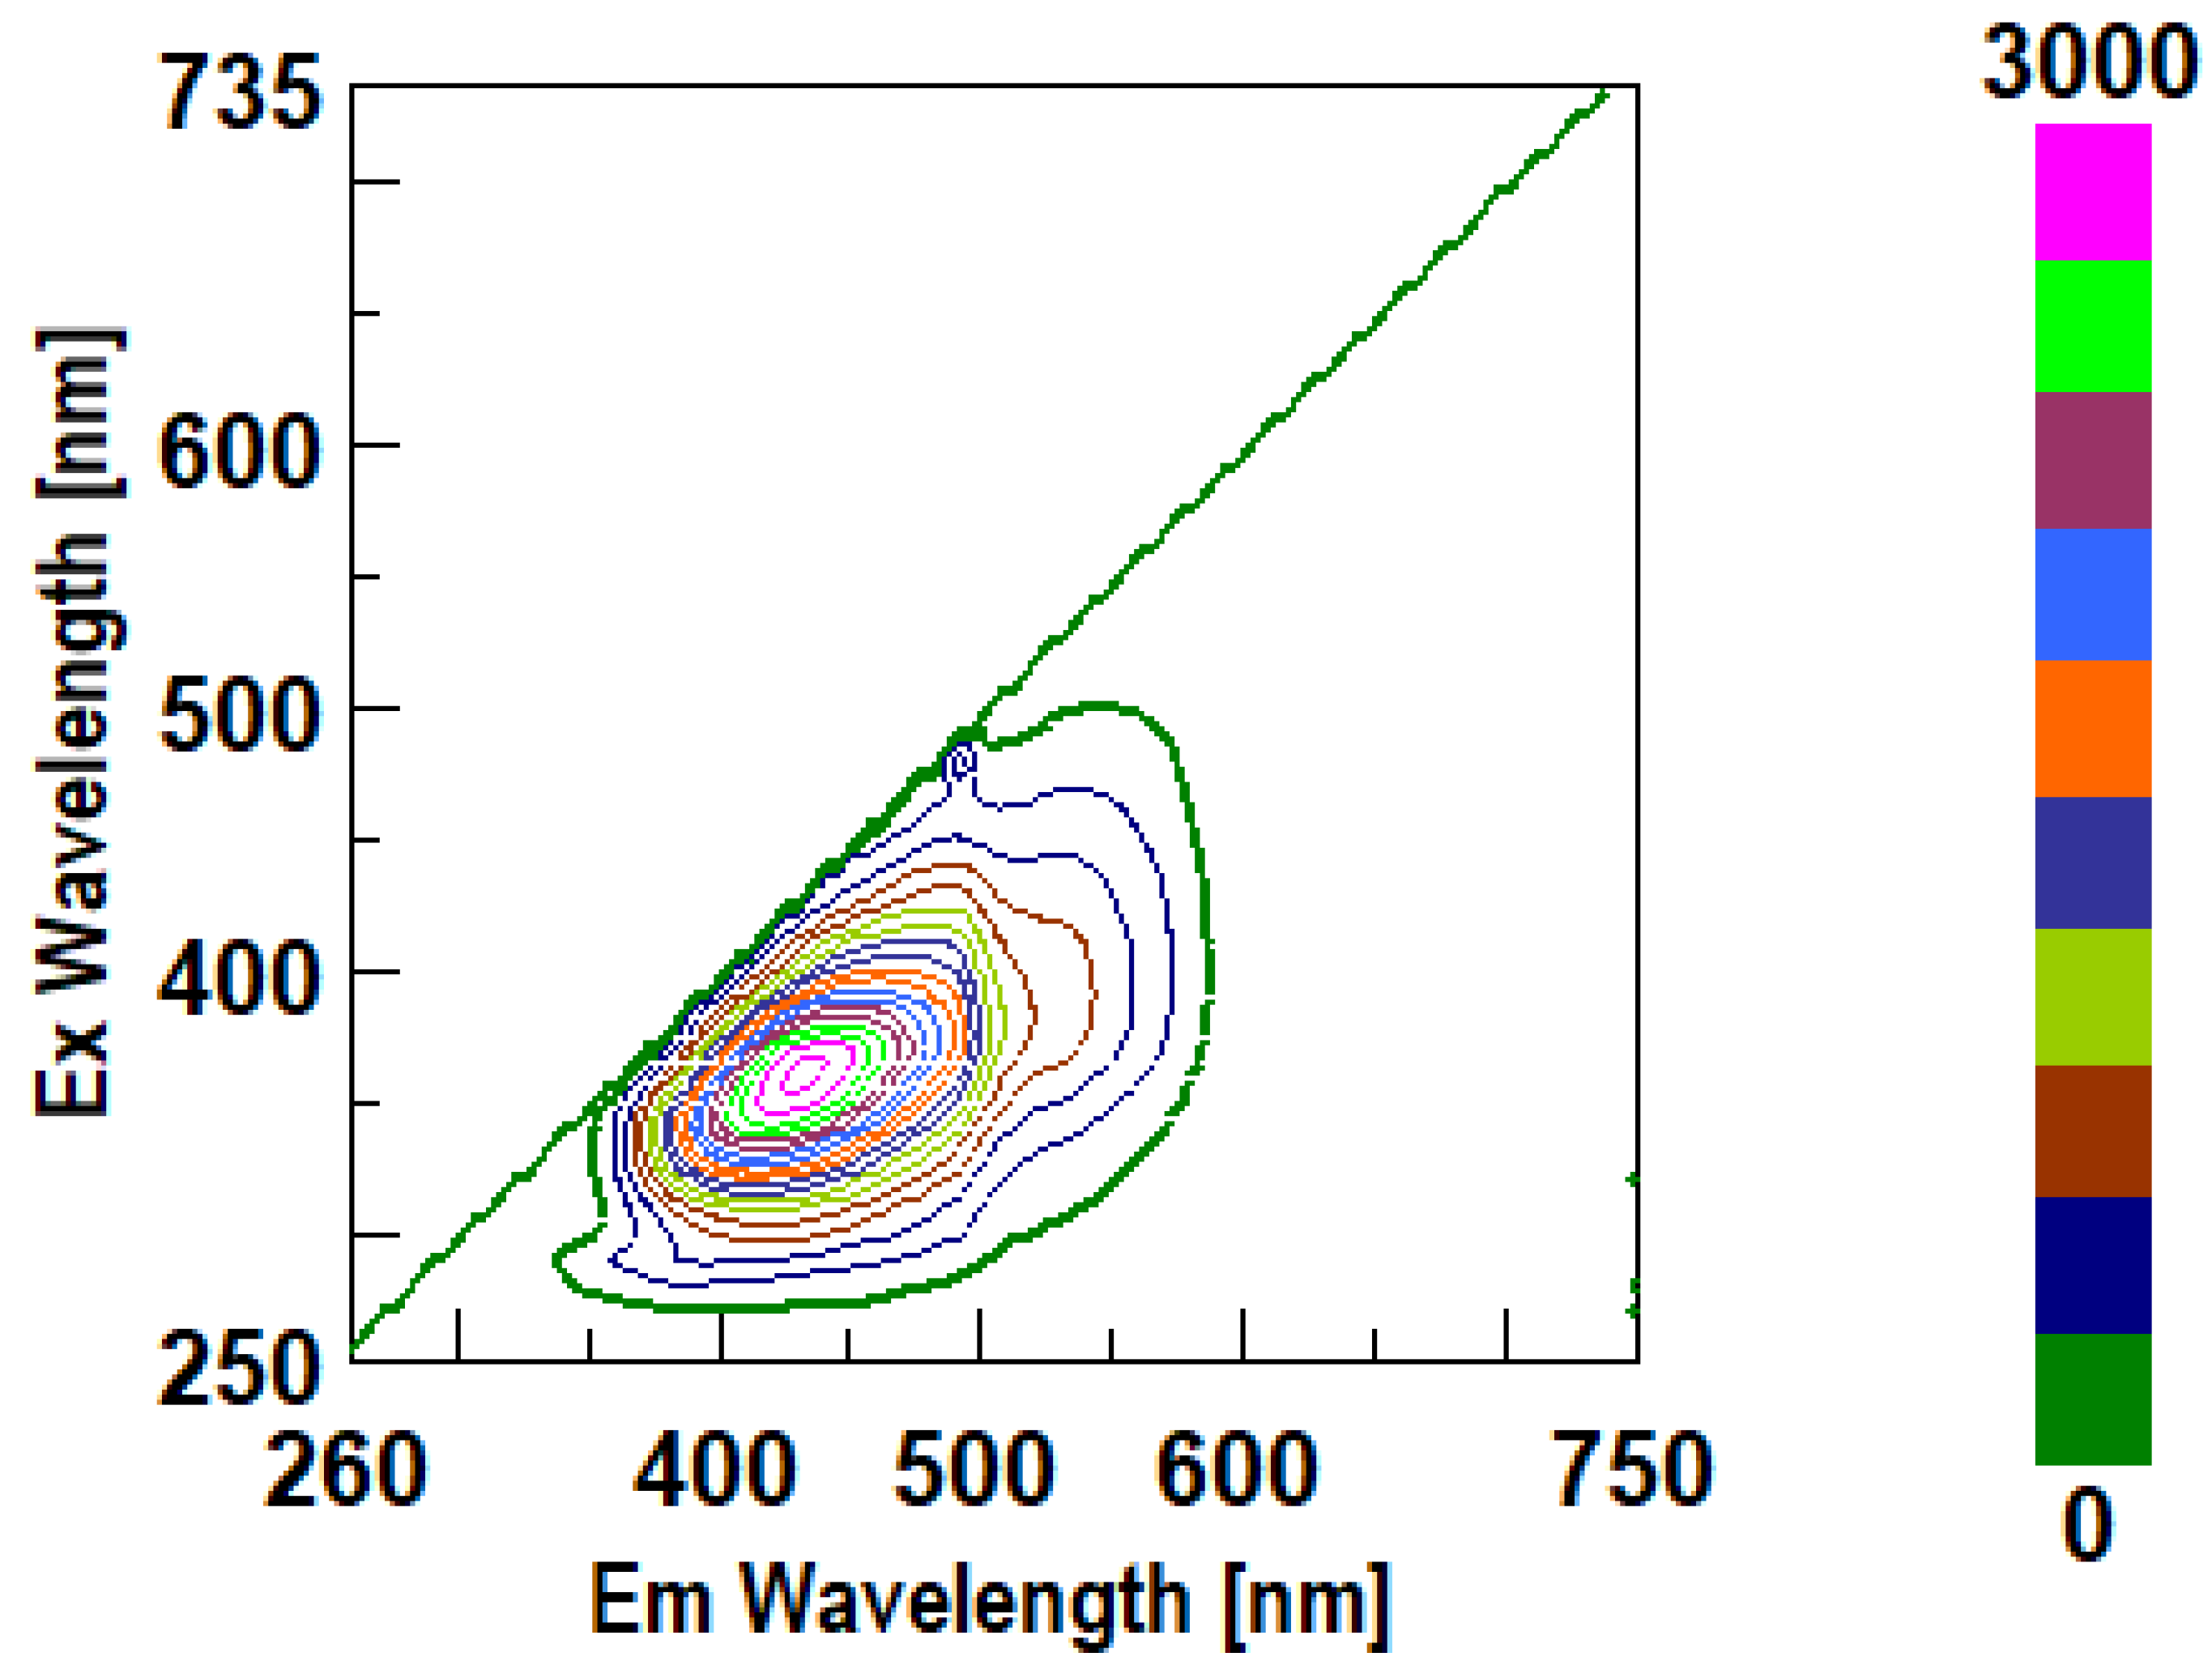
3.3. Intrinsic 3- Dimensional Fluorescence Spectroscopy

3-D- fluorescence spectra are emission–excitation matrices (EEM) and therefore when the excitation and emission monochromators are used successively, it is possible to obtain emission spectra for different excitation λ. Hence, a collection of emission spectra at different excitation λ is obtained in this constant step and EEM exhibited two dimensions: excitation wavelengths and emission λ. Therefore, fluorescence matrices exhibit a fluorescence map of all fluorophores present in a sample for their characterization. Figure 6 A, B, C and D revealed 3-D spectra in different formats for β-D-glucan from Euglena gracilis as well as synchronous 2-d spectrum which exhibited fluorescence peaks at 492 and 540 nm.
Figure 6A. 3- D- spectrum of β-D-glucan from Euglena gracilis (1 mg) with high sensitivity and 10 nm of Δλ.
Preprints 189829 g013
Figure 6B. Colour 3- D- view of β-D-glucan from Euglena gracilis (1 mg) with high sensitivity and 10 nm of Δλ..
Preprints 189829 g014
Figure 6C. Contour view of β-D-glucan from Euglena gracilis (1 mg) with high sensitivity and 10 nm of Δλ..
Preprints 189829 g015
Figure 6D. Synchronous 2-d spectrum of β-D-glucan from Euglena gracilis (1 mg) with high sensitivity and 10 nm of Δλ.
Preprints 189829 g016
As far as β-D-glucan from mushroom strains are concerned, Figure 7 revealed 3-d spectra in several different format as well as synchronous 2-d spectrum from Cordyceps sinensis which exhibited fluorescence peaks at 492 and 540 nm. These data in 3-d spectra of β-D-glucan from mushroom strains are in agreement with the data observed in SFS for β-D-glucan.
Figure 7A. 3- D- spectrum of β-D-glucan from Cordyceps sinensis with high sensitivity and 10 nm of Δλ.
Preprints 189829 g017
Figure 7B. Colour 3-D view of β-D-glucan from Cordyceps sinensis with high sensitivity and 10 nm of Δλ.
Preprints 189829 g018
Figure 7C. Colour view of spectrum of β-D-glucan from Cordyceps sinensis with high sensitivity and 10 nm of Δλ..
Preprints 189829 g019
Figure 7D. Contour view of β-D-glucan from Cordyceps sinensis with high sensitivity and 10 nm of Δλ.
Preprints 189829 g020
Figure 7E. Synchronous 2-d spectrum of β-D-glucan from Cordyceps sinensis with high sensitivity and 10 nm of Δλ..
Preprints 189829 g021
Although the data on 3-d spectra measurement for β-D-glucan has not been reported in the literature, this analytical technique of 3-d spectra has been widely used in research areas such as smart agriculture, clinical diagnosis and food safety [27,28,29,30].

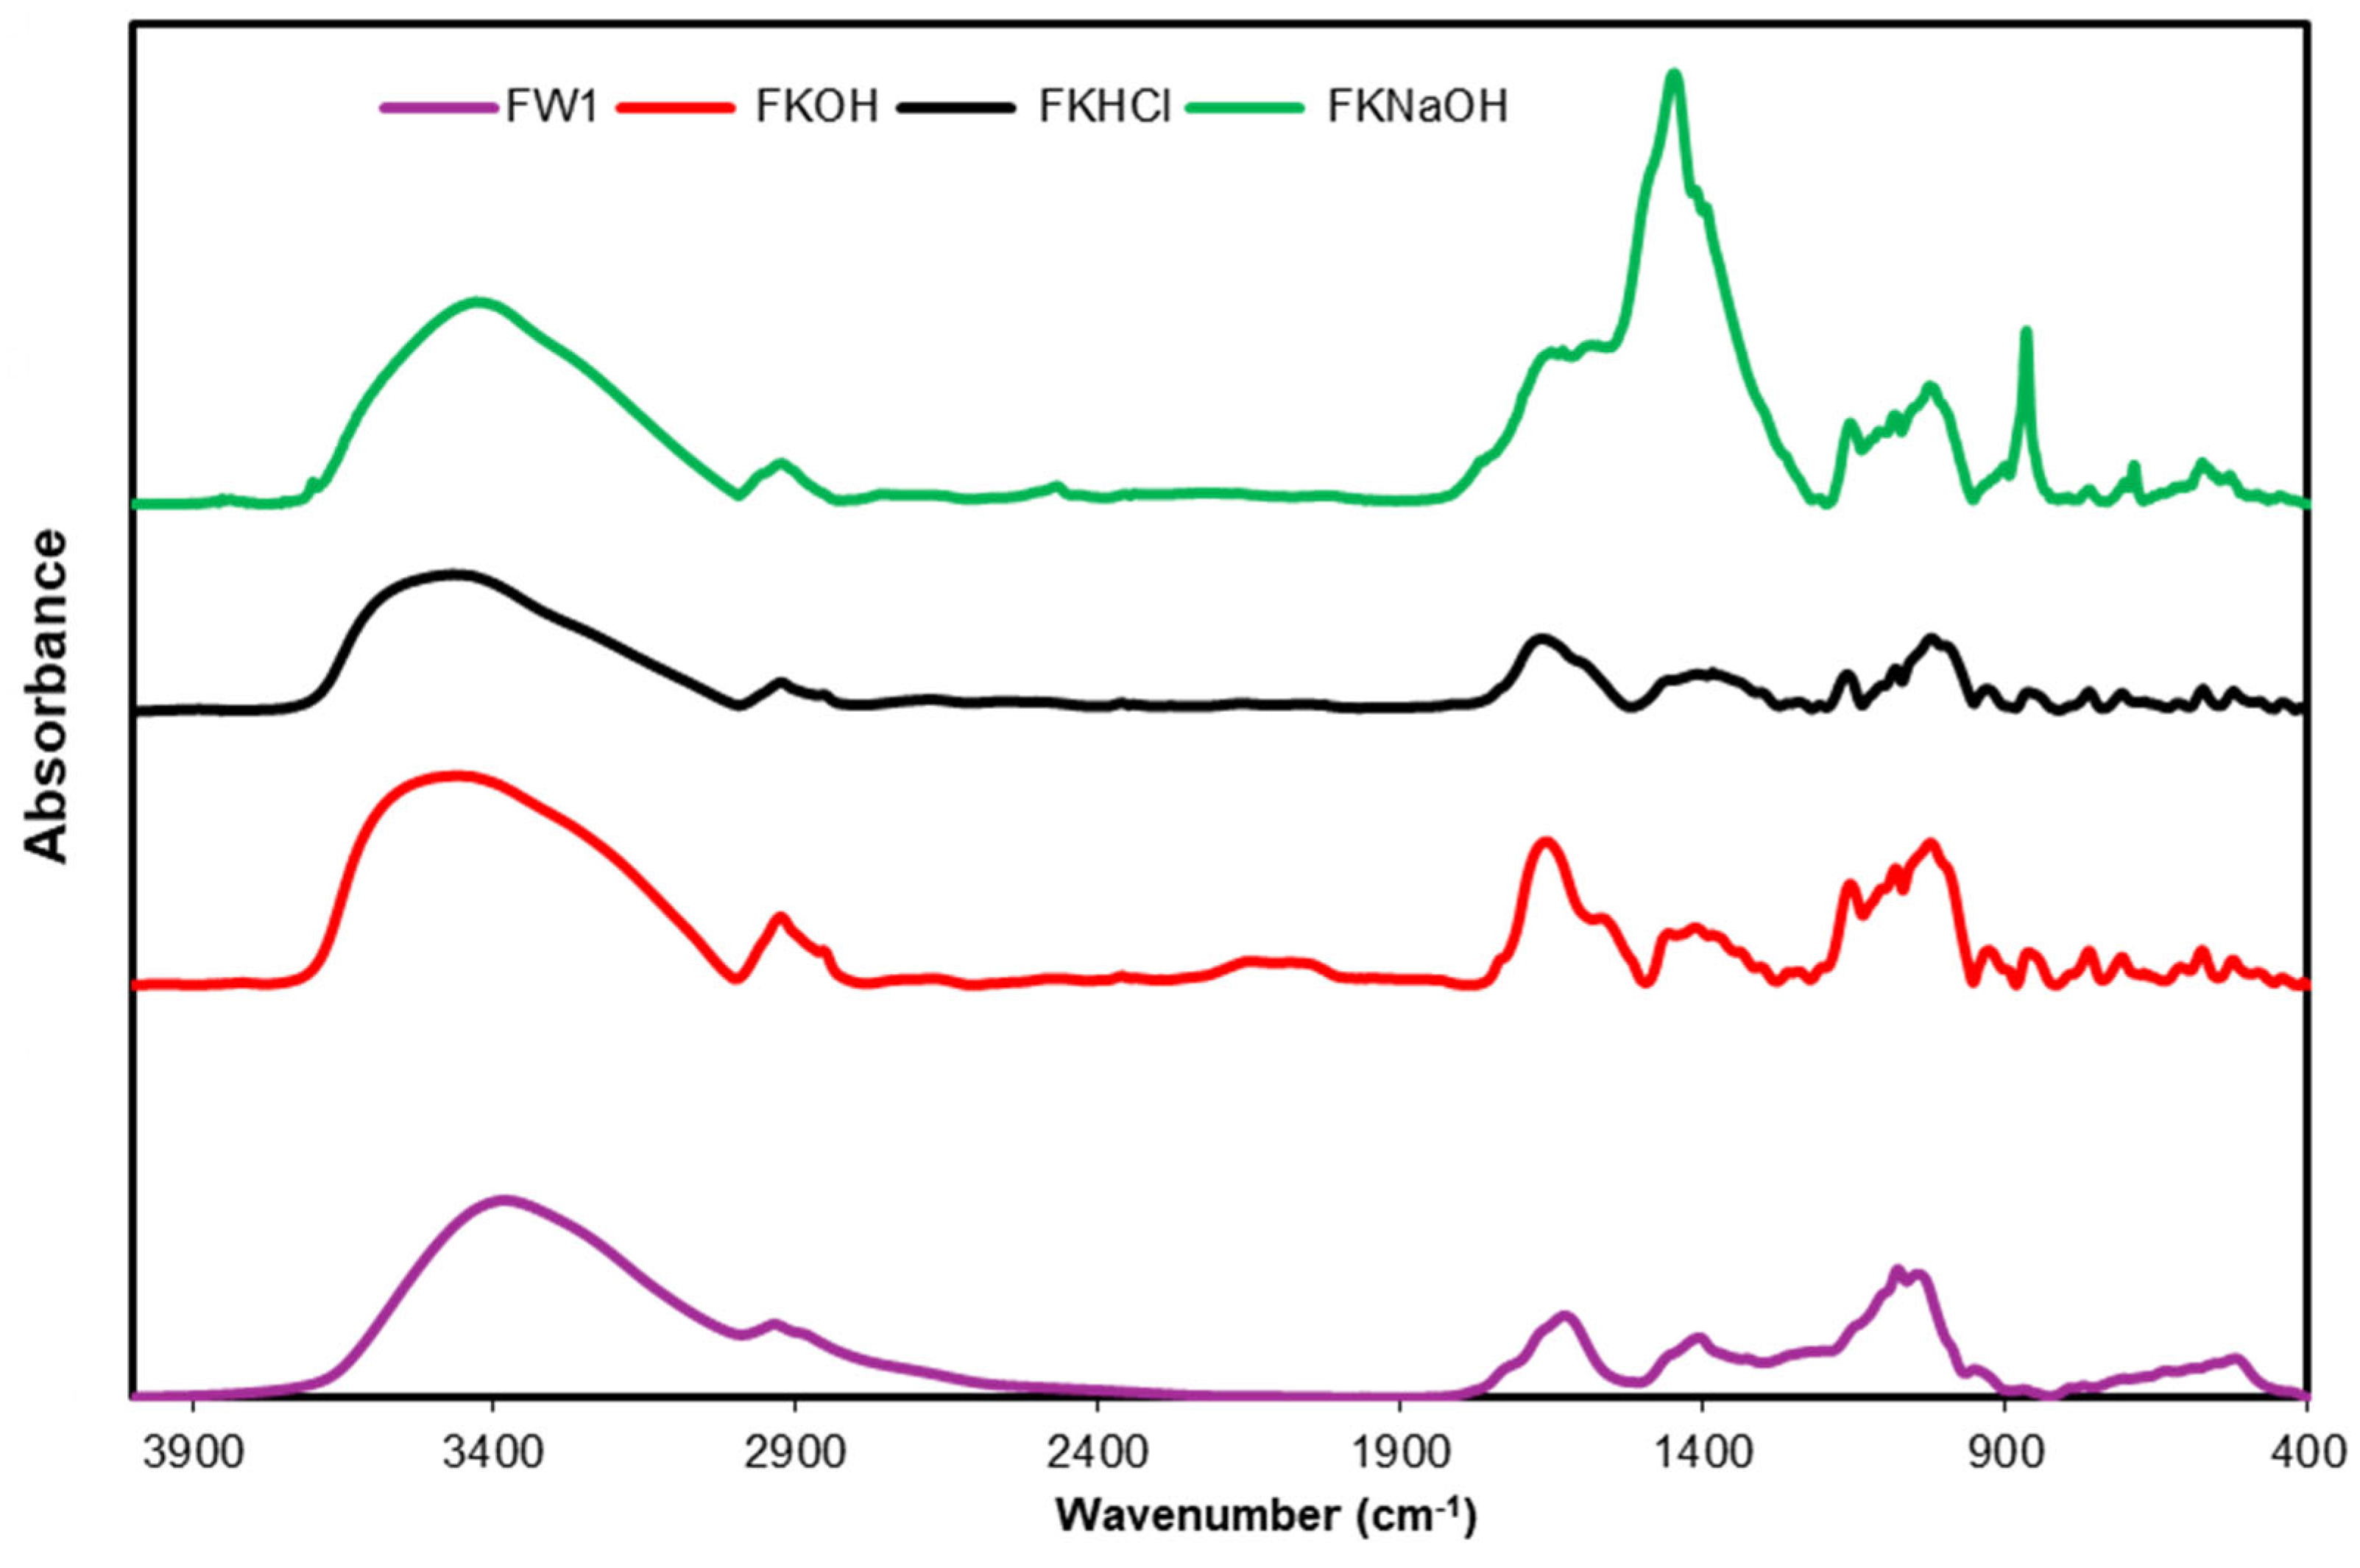
3.4. FTIR Analysis of β-D-Glucans

FTIR spectra of all fractions from Hericium erinaceus were obtained, which revealed typical absorption bands of β-D-glucan in the region of 950–1200 cm−1 (Figure 8).
The strong band at 3474 cm⁻¹ is due to the extension vibration of the O-H bond. This broad band centered near 3300 cm⁻¹ is characteristic of carbohydrates. It has been reported a broad band at 3000-3500 cm⁻¹, related to the O-H extension vibration in hydrogen bonds and the N-H vibration in the spectrum of Ganoderma appllanatum [31]. A band at 1638 cm⁻¹ is observed corresponding to the stretching vibration of the C=O group of amide I, as well as a band at 1619 cm⁻¹ of NH bond deformation and C-N extension of amide II, suggesting the presence of proteins.
Figure 8. FTIR spectra of several fractions of Hericium erinaceus.
Preprints 189829 g022
The characteristic absorption bands of C-O-C deformation (1180 cm⁻¹), the anomeric C vibration of carbohydrates (1080 cm⁻¹), and the β conformation of carbohydrates (865 cm⁻¹) are also observed which suggest the presence of β-D-glucans in all fractions [7,31].

4. Conclusions

To the author’s knowledge, this is first report about the detailed assay method of β-D-glucans from medicinal mushroom strains which is based on SFS and SPS as well as the characterization of 3-d spectra of β-D-glucans. Method validation for this assay was carried out according to ICH guidelines by obtaining a LOD of 0.973 μg/well. β-D-glucans from commercial and mushroom sources were characterized by SFS and SPS as well as 3-d spectra analysis. However, the full structural characterization of purified β-D-glucans should be complemented with future studies by using NMR, HPLC, GC-MS, FTIR, ELISA, HPLC, GC-MS, FTIR and Fluorescence spectroscopy combined with chemometric approach.

Funding

This work was supported by: European Investment Funds by FEDER/COMPETE/POCI – Operacional Competitiveness and Internacionalization Programme, under Project POCI-01-0145-FEDER-006958 and National Funds by FCT - Portuguese Foundation for Science and Technology, under the projects UID/AGR/04033/2013, PTDC/AGR-AAM/74526/2006, PEst-OE/EQB/UI0702/2012-2014 and UID/AGR/04033/2019.

Author contribution

The author carried out all the tasks for writing and experimental work.

Conflict of interest

There are no conflict of interest

Abbreviations

BRM Biological response modifiers
EBG Extracellular β-D-glucans
ELISA Enzyme-linked immunosorbent assay
IBG Intracellular β-D-glucans
PDA Potato dextrose agar
SFS Synchronous Fluorescence Spectroscopy
SPS Synchronous Phosphorescence Spectroscopy

References

  1. Lysakova, V.; Streletskiy, A.; Sineva, O.; Isakova, E.; Krasnopolskaya, L. Screening of Basidiomycete Strains Capable of Synthesizing Antibacterial and Antifungal Metabolites. Int. J. Mol. Sci. 2025, 26, 9802. [Google Scholar] [CrossRef]
  2. Bhambri, A; Srivastava, M; Mahale, VG; Mahale, S; Karn, SK. Mushrooms as Potential Sources of Active Metabolites and Medicines. Front. Microbiol. 2022, 13, 837266. [Google Scholar] [CrossRef] [PubMed]
  3. Case, S; O’Brien, T; Ledwith, AE; Chen, S; Horneck Johnston, CJH; Hackett, EE; O’Sullivan, M; Charles-Messance, H; Dempsey, E; Yadav, S; Wilson, J; Corr, SC; Nagar, S; Sheedy, FJ. b-glucans from Agaricus bisporus mushroom products drive Trained Immunity. Front. Nutr. 2024, 11, 1346706. [Google Scholar] [CrossRef]
  4. Patel, D.K.; Dutta, S.D.; Ganguly, K.; Cho, S.-J.; Lim, K.-T. Mushroom-Derived Bioactive Molecules as Immunotherapeutic Agents: A Review. Molecules 2021, 26, 1359. [Google Scholar] [CrossRef]
  5. Lindequist, U.; Niedermeyer, T.H.J.; Ju¨lich, W-D. Review The Pharmacological Potential of Mushrooms eCAM. 2005, 2(3), 285–299. [Google Scholar] [CrossRef] [PubMed]
  6. Han, B; Baruah, K; Cox, E; Vanrompay, D; Bossier, P. Structure-Functional Activity Relationship of b-Glucans From the Perspective of Immunomodulation: A Mini-Review. Front. Immunol. 2020, 11, 658. [Google Scholar] [CrossRef]
  7. Wang, W.; Tan, J.; Nima, L.; Sang, Y.; Cai, X.; Xue, H. Polysaccharides from fungi: A review on their extraction, purification, structural features, and biological activities. Food Chemistry: X 2022, 15, 100414. [Google Scholar] [CrossRef]
  8. Chugh, RM; Mittal, P; MP, N; Arora, T; Bhattacharya, T; Chopra, H; Cavalu, S; Gautam, RK. Fungal Mushrooms: A Natural Compound With Therapeutic Applications. Front. Pharmacol. 2022, 13, 925387. [Google Scholar] [CrossRef] [PubMed]
  9. Flores, G.A.; Cusumano, G.; Venanzoni, R.; Angelini, P. The Glucans Mushrooms: Molecules of Significant Biological and Medicinal Value. Polysaccharides 2024, 5(3), 212–224. [Google Scholar] [CrossRef]
  10. Arunachalam, K; Sreeja, PS; Yang, X. The Antioxidant Properties of Mushroom Polysaccharides can Potentially Mitigate Oxidative Stress, Beta-Cell Dysfunction and Insulin Resistance. Front. Pharmacol. 2022, 13, 874474. [Google Scholar] [CrossRef]
  11. Moradali, M-F; Mostafavi, H.; Ghods, S.; Hedjaroude, G-A. Review Immunomodulating and anticancer agents in the realm of macromycetes fungi (macrofungi). International Immunopharmacology 2007, 7, 701–724. [Google Scholar] [CrossRef]
  12. Murphy, E.J.; Rezoagli, E.; Major, I.; Rowan, N.; Laffey, J.G. b-Glucans. Encyclopedia 2021, 1, 831–847. [Google Scholar] [CrossRef]
  13. Synytsya, A.; Novak, M. Structural analysis of glucans. Ann. Transl. Med. 2014, 2, 1–17. [Google Scholar]
  14. Semedo, M.C.; Karmali, A.; Fonseca, L. A high throughput colorimetric assay of β-1,3-D-glucans by Congo red dye. J. Microbiol. Meth 2015, 109, 140–148. [Google Scholar] [CrossRef]
  15. Masuko, T.; Minami, A.; Iwasaki, N.; Majima, T.; Nishimura, S.-I.; Lee, Y.C. Carbohydrate analysis by a phenol–sulfuric acid method in microplate format. Anal. Biochem. 2005, 339, 69–72. [Google Scholar] [CrossRef] [PubMed]
  16. Semedo, M.C.; Karmali, A.; Fonseca, L. A novel colorimetric assay of β-D-glucans in basidiomycete strains by alcian blue dye in a 96-well microtiter plate. Biotechnol. Prog. 2015, 31, 1526–1535. [Google Scholar] [CrossRef] [PubMed]
  17. Koenig, S.; Rühmann, B.; Sieber, V.; Schmid, J. Quantitative assay of β-(1,3)-β-(1,6)-glucans from fermentation broth using aniline blue. Carbohydr. Polym. 2017, 174, 57–64. [Google Scholar] [CrossRef]
  18. Theint, P.P.; Sakkayawong, N.; Buajarern, S.; Singkhonrat, S. Development of an analytical fluorescence method for quantifying β-glucan content from mushroom extracts; utilizing curcumin as a green chemical fluorophore. Journal of Food Composition and Analysis 2025, 137, Part A. [Google Scholar] [CrossRef]
  19. Mizono, M.; Minato, K.-I.; Tsuchida, H. Preparation and specificity of antibodies to an anti-tumor β-glucan, lentinan. Biochem. Mol. Biol. Int. 1996, 39, 679–68. [Google Scholar] [CrossRef]
  20. Marques, L.; Karmali, A. Experimental Planning for Production of β-D-Glucan: Purification and Fluorescence Properties from Basidiomycete Strains. Separations 2025, 12, 336. [Google Scholar] [CrossRef]
  21. ICH Harmonised Tripartite Guideline. Validation of analytical procedures: Text and methodology, Q2(R1); Geneva. Available online: http://www.ich.org/fileadmin/Public_Web_Site/ICH_Products/Guidelines/Quality/Q2_R1/Step4/Q2_R1__Guideline.pdf.
  22. Tian, M.; Muhammad, T.; Li, Y-Q; Fan, X.; Wang, L.; Mi, F.; Zheng, Y.; Gao, J. Application of synchronous fluorescence spectroscopy in the analysis of polycyclic aromatic hydrocarbons in petroleum and coal. Applied Spectroscopy Reviews 2025, 60:7, 611–637. [Google Scholar] [CrossRef]
  23. Magdy, G; Belal, F; El-Deen, AK. Green synchronous spectrofluorimetric method for the simultaneous determination of agomelatine and venlafaxine in human plasma at part per billion levels. Sci Rep. 2022, 12(1), 22559. [Google Scholar] [CrossRef] [PubMed]
  24. Freire, P.; Zamora, A.; Castillo, M. Synchronous Front-Face Fluorescence Spectra: A Review of Milk Fluorophores. Foods 2024, 13, 812. [Google Scholar] [CrossRef]
  25. Ibañez, G.A.; Escandar, G.M. Fluorescence and Phosphorescence Chemical Sensors Applied to Water Samples. In Smart Sensors for Real-Time Water Quality Monitoring. Smart Sensors, Measurement and Instrumentation; Mukhopadhyay, S., Mason, A., Eds.; Springer: Berlin, Heidelberg, 2013; vol 4. [Google Scholar] [CrossRef]
  26. Guo, Y.; Zhang, L.; Qu, Z. Benchmark Study on Phosphorescence Energies of Anthraquinone Compounds: Comparison between TDDFT and UDFT. Molecules 2023, 28, 3257. [Google Scholar] [CrossRef]
  27. Cheng, P.; Wang, S.; Zhu, Y.; Cui, C.; Pan, J. Application of Three-Dimensional Fluorescence Spectroscopy in Smart Agriculture — Detection of Oil Pollutants in Water. International Journal of Pattern Recognition and Artificial Intelligence VOL. 37, NO. 03. [CrossRef]
  28. Dubayová, K.; Krajˇcíková, K.; Mareková, M.; Tomeˇcková, V. Derivative Three-Dimensional Synchronous Fluorescence Analysis of Tear Fluid and Their Processing for the Diagnosis of Glaucoma. Sensors 2022, 22, 5534. [Google Scholar] [CrossRef]
  29. Shen, F.; Feng, X.; Li, Y.; Lin, X.; Cai, F. Compact three-dimensional fluorescence spectroscopy and its application in food safety. LWT- Food Science and Technology 2024, 202, 116324. [Google Scholar] [CrossRef]
  30. Tian, S.; Zhang, Y.; Wang, J.; Zhang, R.; Wu, W.; He, Y.; Wu, X.; Sun, W.; Li, D.; Xiao, Y.; et al. New 3-D Fluorescence Spectral Indices for Multiple Pigment Inversions of Plant Leaves via 3-D Fluorescence Spectra. Remote Sens. 2024, 16, 1885. [Google Scholar] [CrossRef]
  31. Kozarski, M.; Klaus, A.; Nikšić, M.; Vrvić, M.; Todorović, N.; Jakovljević, D.; Griensven, L. Antioxidative activities and chemical characterization of polysaccharide extracts from the widely used mushrooms Ganoderma applanatum, Ganoderma lucidum, Lentinus edodes and Trametes versicolor. Journal of Food Composition and Analysis 2012, 26, 144–153. [Google Scholar] [CrossRef]
Table 1. β-D-glucan levels using Congo red dye and fluorescence assay methods.
Mushroom strains Congo Red dye Fluorescence assay
mg/ml mg/ml
Lentinula edodes 153.25±10.27 165.25±9.03
Inonotus obliquee   26.98±1.25   24.13±1.05
Coriolus versicolor 169.60±10.71 182.76±12.35
Agaricus blazei 166.45±8.97 152.87±9.23
Ganoderma applanatum   29.61±1.25   27.04±1.64
Ganoderma carnosum   38.2±1.98   40.97±1.68
Irpex lacteus  16.79±1.03   18.12±1.36
Phlebia Rufa  13.77±1.03   15.24±0.98
Barley  12.25±0.85   10.97±0.72
Table 2. Parameters for β-D- glucan assay.
Emission λ (nm) 528
Excitation λ (nm) 420
Gain 2200
Linearity range (mg/well) 0 -14
Intercept (a) 231.23
Slope (b) 620.96
Correlation coefficient (r2) 0.9961
% RSD 0.857
LOD (mg/well) 0.973
LOQ (mg/well) 2,919
P- value 3.16E-07
Disclaimer/Publisher’s Note: The statements, opinions and data contained in all publications are solely those of the individual author(s) and contributor(s) and not of MDPI and/or the editor(s). MDPI and/or the editor(s) disclaim responsibility for any injury to people or property resulting from any ideas, methods, instructions or products referred to in the content.
Copyright: This open access article is published under a Creative Commons CC BY 4.0 license, which permit the free download, distribution, and reuse, provided that the author and preprint are cited in any reuse.
Prerpints.org logo

Preprints.org is a free preprint server supported by MDPI in Basel, Switzerland.

Subscribe

Disclaimer

Terms of Use

Privacy Policy

Privacy Settings

© 2026 MDPI (Basel, Switzerland) unless otherwise stated