Submitted:
15 December 2025
Posted:
16 December 2025
You are already at the latest version
Abstract
This study proposes a prediction model based on a dynamic spatiotemporal causal graph neural network to address the challenges of complex dynamic dependencies, strong structural correlations, and ambiguous causal relationships in corporate revenue forecasting. The model constructs a time-varying enterprise association graph, where enterprises are represented as nodes and industry or supply chain relationships as edges. A graph convolutional network is used to extract structural dependency features, while a gated recurrent unit captures temporal evolution patterns, achieving joint modeling of structural and temporal features. On this basis, a causal reasoning mechanism is introduced to model and adjust potential influence paths among enterprises. A learnable causal weight matrix is used to describe the strength of economic transmission, suppress spurious correlations, and strengthen key causal paths. The model also employs multi-scale temporal aggregation and attention fusion mechanisms to dynamically integrate multidimensional information, enhancing adaptability to both long-term trends and short-term fluctuations. Experimental results show that the proposed model outperforms mainstream methods in multiple metrics, including MSE, MAE, MAPE, and RMAE, verifying its effectiveness in capturing corporate revenue dynamics, modeling economic causal dependencies, and improving prediction accuracy. This study establishes a unified framework that integrates spatiotemporal dependency modeling with causal structure reasoning, providing new insights and methodological foundations for intelligent forecasting in complex economic systems.
Keywords:
Dynamic spatiotemporal graph neural networks
; causal inference
; corporate revenue forecasting
; economic structure modeling
I. Introduction
In the era of the digital economy, corporate revenue has become a core indicator for evaluating business performance, market competitiveness, and industry development potential. Traditional revenue forecasting relies on statistical modeling and accounting experience, with assumptions often based on linear relationships and static features. However, the real business environment is highly dynamic and uncertain. Macroeconomic cycles, market supply and demand fluctuations, policy changes, supply chain structures, and the evolution of competition all exert complex temporal effects on corporate revenue. In multi-industry, multi-region, and multi-agent economic systems, the interactions among enterprises are not only reflected in numerical correlations but also in causal propagation paths and spatiotemporal dependencies. These nonlinear and dynamic characteristics make traditional methods inadequate for capturing the true patterns of revenue variation [1]. Hence, there is an urgent need for intelligent models with structural modeling and temporal reasoning capabilities to achieve dynamic forecasting and structural understanding of corporate revenue.
With the rapid advancement of artificial intelligence and deep learning [2,3,4], modeling approaches that integrate time series and graph structures have shown strong potential in financial and other fields [5,6,7,8]. Corporate financial systems naturally exhibit graph-like characteristics, where enterprises are interconnected through supply-demand relationships, capital flows, equity holdings, and industrial competition. These relationships evolve dynamically over time, reflecting the behavioral patterns, industrial transmission, and market sentiment of enterprises. Relying solely on time series models neglects structural dependencies and cross-entity propagation effects, while focusing only on graph structures fails to capture temporal dynamics. Therefore, combining graph neural networks with temporal modeling mechanisms to dynamically capture causal relationships and spatiotemporal dependencies among enterprises has become a promising direction for achieving high-precision revenue forecasting.
In corporate operations, identifying and modeling causal relationships are crucial. Changes in corporate revenue are rarely isolated outcomes but are driven by the interplay of multiple factors such as market demand fluctuations, raw material price transmission, policy regulation, and supply chain responses. These factors are not only correlated but also connected through complex causal chains. Static correlation analysis or black-box models often fail to uncover the underlying economic logic or provide interpretable predictions. By employing causal graph neural networks, it is possible to describe dynamic dependencies among variables, identify key nodes and causal paths that drive revenue changes, and provide structured causal explanations for economic decision-making. This causal-based spatiotemporal modeling approach enhances interpretability and offers scientific support for policy intervention, risk warning, and strategic planning.
Moreover, corporate revenue forecasting holds significant macroeconomic and social value. Accurate revenue prediction assists enterprises in budgeting and investment planning and supports financial institutions in credit evaluation, investment decisions, and risk management. On a broader economic scale, revenue forecasts serve as indicators of regional economic health, industrial prosperity, and policy effectiveness, thereby supporting economic monitoring and industrial planning by governmental bodies. In highly volatile environments, fluctuations in corporate revenue often signal the early stages of systemic risk diffusion. Timely identification of such dynamics enables a transition from post-event evaluation to proactive prediction. Therefore, developing models with dynamic perception and causal reasoning capabilities for corporate revenue forecasting carries strong practical significance and social value.
In summary, research on dynamic spatiotemporal causal graph neural networks for corporate revenue forecasting aims to integrate structural and temporal dimensions, breaking traditional assumptions of independent samples and static dependencies. By combining the structural representation power of graph neural networks with the temporal modeling capability of sequence models, and incorporating causal reasoning mechanisms, it becomes possible to dynamically track and infer the causal relationships among enterprises. This approach reveals the essential drivers of revenue changes and provides a data-driven theoretical foundation for business and investment decisions. Furthermore, it offers a new intelligent pathway for interpretable economic modeling, risk monitoring, and macroeconomic regulation, carrying important theoretical and practical implications for advancing intelligent economic analysis and data-driven decision-making.
II. Related Work
Research on graph neural networks for time series modeling has established a solid basis for combining relational structure and temporal dynamics. Comprehensive surveys on graph neural networks for time series summarize unified architectures that couple graph message passing with sequence modeling and demonstrate their advantages in forecasting, classification, imputation, and anomaly detection under complex multivariate dependencies [9]. Building on this foundation, temporal and heterogeneous graph neural networks have been proposed to jointly handle temporal evolution and heterogeneity in nodes and edges within a single learning framework [10]. Dynamic graph neural network models further introduce time-varying graph structures, allowing the relational topology to evolve along with the underlying system states and thus improving the ability to track changing dependency patterns [11]. Spatial–temporal graph attention networks extend these ideas by incorporating attention mechanisms over both structure and time, enabling selective aggregation of influential neighbors and time steps in the prediction process [12]. Spatiotemporal graph neural networks tailored for load or traffic-like prediction tasks reinforce the effectiveness of jointly modeling spatial correlations and temporal dynamics in high-dimensional, networked systems [13]. Related architectures for graph-based anomaly detection with temporal dynamics and advanced sequence models for discriminative sequence modeling show that combining graph structure, temporal recurrence/recurrence-like operators, and expressive sequence backbones is a powerful design pattern for complex dynamic data [14,15]. These works collectively motivate the use of a dynamic spatiotemporal graph neural network in this study, where structural dependencies among entities and temporal evolution of revenues are modeled in an integrated manner.
Beyond pure correlation-based modeling, there is a growing body of work that connects graph neural networks with causality. Methodological studies on graph neural networks and causality discuss how causal assumptions, intervention-based reasoning, and counterfactual thinking can be incorporated into message-passing architectures, with the goal of making models sensitive to causal directions and robust under distribution shifts [16]. In parallel, surveys and evaluations of causal discovery methods for time series provide a systematic view of constraint-based, score-based, functional, and hybrid approaches for learning causal graphs from temporal data, clarifying identifiability conditions, algorithmic choices, and practical trade-offs [17]. These contributions suggest that spatiotemporal graph models can benefit from explicit causal components—such as learnable causal weight matrices or structure-refining mechanisms—that suppress spurious correlations and emphasize meaningful transmission paths, which is precisely the idea adopted in the causal reasoning module of the proposed model.
Structured representation learning on graphs offers additional tools for capturing complex dependencies and abnormal patterns. Approaches that integrate knowledge-structured reasoning with pretrained models show how relational constraints and graph semantics can be injected into latent representations, improving the consistency between learned embeddings and underlying structured dependencies [18]. Graph neural network–based classification frameworks further demonstrate that neighborhood aggregation and message passing effectively encode high-order interactions in relational data, which is important when modeling the influence propagation among multiple interacting entities [19]. Advanced sequence modeling architectures for discriminating subtle patterns in high-dimensional sequences complement these graph-based approaches by providing expressive temporal encoders that can capture non-trivial dynamics and regime changes. These methodological developments support the design of a relation-aware encoder and latent-structure modeling in this work, where structural embeddings and temporal dynamics are integrated into a unified representation of corporate revenue evolution. Robust, scalable intelligent systems provide additional inspiration for stability and adaptability in complex forecasting settings. Multi-agent reinforcement learning frameworks study how multiple decision-making entities can learn cooperative policies under shared constraints, emphasizing coordination and adaptive behavior in dynamic environments [20]. Related work on collaborative evolution of intelligent agents investigates how populations of agents co-adapt and share knowledge to improve global performance, highlighting the importance of interaction and joint optimization in large-scale systems [21]. Agent-based architectures with information-constrained retrieval demonstrate how modular components can perform retrieval, filtering, and reasoning under explicit information budgets, improving controllability and structured reasoning in complex tasks [22]. Contrastive knowledge transfer combined with robust optimization has been explored to align large models with desired behaviors while explicitly enhancing robustness against perturbations and distribution shifts [23]. Differential privacy–enhanced federated learning introduces privacy-aware mechanisms into distributed training, showing how robustness and security can be incorporated into learning algorithms operating on sensitive data [24]. Methodologically, these lines of research emphasize modular design, robustness, constrained information flow, and coordinated adaptation. The dynamic spatiotemporal causal graph neural network proposed in this paper follows similar principles by introducing a learnable causal weight matrix to refine influence paths, employing multi-scale temporal aggregation and attention-based fusion to adaptively integrate long- and short-term information, and providing a structured and causally informed framework for corporate revenue forecasting in complex economic systems.
III. Proposed Framework
This study applies a dynamic spatiotemporal causal graph neural network framework for enterprise revenue prediction, aiming to jointly capture the dynamic evolution of enterprise business behaviors over time and the causal relationship structures between enterprises in the spatial dimension. The framework adopts multi-head self-attention mechanisms [25] to identify evolving anomaly patterns and adjust the strength of dynamic interactions among enterprise nodes. In modeling temporal patterns, the method utilizes deep representation strategies based on autoencoders for sequential anomaly detection [26], enabling robust extraction of latent features from enterprise event sequences. For spatial structural modeling and causal propagation, the approach integrates granularity-aware attention networks [27], which enhance the discrimination and aggregation of multi-level enterprise relationships and supply chain effects. These methodological innovations allow the model to construct a time-varying enterprise association graph, model causal influence paths, and dynamically aggregate multi-scale temporal and spatial information. The overall model architecture is illustrated in Figure 1.
Assume the set of firms is , where each node represents a firm, and the set of edges is , representing economic, supply chain, or industry relationships between firms. We first construct a temporal graph , where edge weights change over time to reflect the dynamic strength of economic connections. The node feature matrix is denoted as , representing the multidimensional financial feature inputs of firms at time t. To model their temporal dependencies, we obtain structural representations through graph convolution operations:
Where is the normalized adjacency matrix, is the graph convolution weight matrix, and is the nonlinear activation function. Through this operation, the model can integrate the local dependency structure between firms in each time slice and embed financial features into a unified graph representation space, providing a foundation for subsequent dynamic modeling.
To capture the dynamic patterns of firm revenue changes over time, the model further incorporates a time-series encoding mechanism. Assuming represents the graphical representation of the time series, we employ a gated recurrent unit (GRU) or a variant thereof to model its temporal evolution:
Here, represents the time-series state vector at time t, which encodes the behavioral trends and structural changes of the firm over continuous time. This dynamic update process enables the model to simultaneously perceive historical dependencies and future trends, thereby more accurately describing the trajectory of revenue changes. Building upon this, the model introduces multi-scale time windows, achieving adaptive modeling of short-term and long-term dependencies through the aggregation of historical states of different lengths.
Where represents the time decay coefficient, which is used to balance the impact of different time scales on the current forecast.
While capturing dynamic dependencies, the model emphasizes causal structure modeling mechanisms to characterize potential causal relationships and economic impact paths among firms. To achieve this, we define a causal strength matrix among firms, where element represents the causal influence strength of firm on firm ’s revenue. This matrix can be obtained through a learnable function mapping:
Here, and are learnable nonlinear mapping functions. Subsequently, we introduce a propagation operator based on causal weights to causally adjust the structural representation:
This operation allows the model to dynamically adjust edge weights during graph structure propagation, making the transmission path more consistent with economic causal logic and reducing noise propagation caused by pure correlation. This mechanism enables enterprise revenue forecasting to be based not only on statistical correlation but also on structured economic explanatory power.
Finally, the model performs joint predictions by combining the causal-enhanced structural representation with temporal dynamic features. The fusion layer uses a multi-head attention mechanism to weightedly integrate temporal feature and structural feature .
Where represents the firm’s revenue prediction at time t, represents the attention fusion operation, and MLP stands for Multilayer Perceptron Mapping. The model is optimized by minimizing the joint loss of the prediction error and the structural constraint term.
The first term represents the prediction error, and the second term represents the causal symmetry constraint, used to suppress the occurrence of spurious causal relationships. This joint optimization framework achieves an organic integration of structural interpretability and dynamic prediction capabilities, thereby enabling the model to possess robust income dynamic modeling and prediction capabilities in complex economic environments with multiple firms, multiple time periods, and multiple causal interactions.
IV. Dataset Introduction
The main dataset used in this study is the Compustat North America Fundamentals Annual Dataset. This dataset contains the annual financial information of publicly listed companies in the U.S. securities markets. It covers multiple industry sectors, including manufacturing, technology, energy, and finance. The dataset includes more than 6,000 companies and provides over 40 years of continuous financial reports. It records multidimensional indicators such as operating revenue, net profit, balance sheet items, cash flow, and capital expenditure. All data come from standardized corporate financial disclosures, ensuring high authenticity and comparability. This provides a reliable data foundation for modeling the long-term dynamics of corporate revenue.
To construct the dynamic spatiotemporal graph structure among enterprises, each company in the dataset is treated as a node. The similarities in industry type, supply chain relationships, and market correlations between companies are represented as weighted edges. In the temporal dimension, data are arranged in chronological order by year, forming continuous time slices. This enables the model to learn revenue trends and structural dependencies over time. Through alignment and normalization of multi-year financial data, the model can identify dynamic patterns across years and industries and uncover potential causal relationships among enterprises. In addition, the dataset contains multidimensional financial indicators that serve as rich model inputs and can be combined with macroeconomic variables such as GDP growth, CPI, and industry average returns to capture external drivers of revenue variation. Its structured and temporally complete characteristics enable the dynamic spatiotemporal causal graph neural network to perform robust modeling and deliver accurate revenue predictions under complex economic conditions, providing solid support for subsequent research.
V. Experimental Results and Analysis
A. Comparative Experimental Results
This paper first conducts a comparative experiment, and the experimental results are shown in Table 1.
Overall, the dynamic spatiotemporal causal graph neural network achieves the best performance across all metrics, with the lowest MSE, MAE, MAPE, and RMAE, showing superior ability to model nonlinear dynamics and temporal dependencies in corporate revenue changes. Traditional models such as decision trees and MLP capture only static correlations, and LSTM/BiLSTM improve temporal modeling but still ignore economic linkages and causal propagation among enterprises. While Transformers handle long-term dependencies better, they remain limited in modeling structural influence. By integrating causal reasoning, graph representation, and spatiotemporal fusion, the proposed model adaptively refines inter-enterprise correlation weights, filters spurious relations, strengthens key economic pathways, and offers both higher forecasting accuracy and clearer structural interpretability for financial analysis and risk assessment.
B. The Impact of Hidden Layer Dimension on MAPE Experimental Results
This paper also presents the impact of the hidden dimension on the MAPE experimental results, and the experimental results are shown in Figure 2. The findings indicate that variations in the hidden dimension significantly affect the model’s representational capacity and its ability to generalize across complex enterprise income patterns. Through comparative analysis, it is observed that an optimal hidden dimension allows the model to effectively balance feature expressiveness and computational efficiency, thereby achieving lower prediction error and more stable performance.
The experimental results demonstrate that the hidden layer dimension significantly impacts the performance of the corporate revenue forecasting model. When the hidden dimension increases from 64 to 256, the Mean Absolute Percentage Error (MAPE) decreases from 3.89% to 3.54%. This indicates that the model’s representation ability is greatly enhanced in this range, allowing it to capture nonlinear relationships and temporal dependencies among financial features more effectively. However, when the dimension further increases to 512 and 1024, the error slightly rises. This suggests that overly high feature dimensions may cause redundant representations and reduce generalization performance. The trend suggests that the model achieves the best balance at a moderate dimensionality, maintaining expressive power while avoiding overfitting risks. Based on the structural characteristics of the model, a moderate hidden dimension ensures greater stability when the dynamic spatiotemporal causal graph neural network captures causal relationships and temporal patterns among enterprises. Therefore, the results confirm the model’s nonlinear sensitivity to multidimensional feature interactions. They further indicate that a properly chosen hidden layer dimension enhances the precision of causal structure modeling and strengthens the coupling of spatiotemporal features, enabling more accurate dynamic forecasting of corporate revenue.
C. The Effect of Temporal Window Size on Experimental Results
As shown in Figure 3, temporal window size strongly affects model performance. Short windows (3 or 5) yield higher MAPE because limited history cannot capture revenue trends or cyclical fluctuations. Performance improves as the window grows, reaching the lowest MAPE at length 7, where the model best balances short-term variations and long-term dependencies and learns meaningful temporal coupling among financial indicators. When the window extends further (9 or 11), prediction error rises again, suggesting that overly long histories introduce noise and dilute key causal signals. Overall, these results highlight the model’s sensitivity to temporal context and show that an appropriately chosen window is essential for stable and accurate dynamic revenue forecasting.
VI. Conclusion
This paper addresses the key economic problem of corporate revenue forecasting by proposing a dynamic spatiotemporal causal graph neural network that integrates temporal modeling, graph structure learning, and causal reasoning. The study begins with multidimensional relationships among enterprises, incorporating financial data, industrial connections, and temporal evolution into a unified modeling framework. This enables the joint modeling of structural dependencies and dynamic features. Compared with traditional approaches, the proposed framework captures both temporal patterns and potential economic transmission paths, achieving more accurate and interpretable forecasts of corporate revenue trends. The model expands the theoretical application boundaries of deep learning in economic modeling and provides new insights for financial analysis and intelligent decision-making in practice.
The core innovation of this study lies in the introduction of causal structural constraints and graph-based spatiotemporal interaction mechanisms. These allow the model to identify dynamic influences among enterprises while suppressing spurious correlations at the structural level. This design enhances interpretability, enabling the model not only to generate predictions but also to reveal the key factors and pathways driving revenue fluctuations. Experimental results show that the model outperforms mainstream baselines across multiple metrics, demonstrating the strong potential of spatiotemporal fusion and causal reasoning in financial forecasting. This approach breaks away from traditional paradigms that rely on static features or single-dimensional time series and provides a generalizable framework for structured learning of economic behaviors. From an application perspective, the proposed method can be widely applied to enterprise performance evaluation, portfolio optimization, credit risk monitoring, and macroeconomic early warning. By modeling structural dependencies and dynamic variations among enterprises, the system can offer more interpretable risk assessment models for financial institutions, multi-level economic fluctuation analysis tools for regulators, and data-driven decision support for enterprises. Meanwhile, the causal interpretability of the model ensures transparency and auditability, meeting the growing needs for compliance and reliability in intelligent financial decision systems.
Future research can be further expanded in three directions. First, by incorporating multimodal economic signals such as market sentiment, macroeconomic indicators, and supply chain flow data, the model can achieve multi-source heterogeneous integration of economic systems. Second, exploring cross-regional and cross-industry dynamic transfer mechanisms can improve the model’s generalization ability under different industrial structures and economic cycles. Third, integrating adaptive uncertainty estimation and interpretable generative modules can help build self-correcting economic forecasting frameworks, enabling truly intelligent financial decision support. Overall, this study provides a new theoretical and methodological foundation for intelligent economic analysis and opens new research pathways for data-driven enterprise decision-making and macroeconomic regulation.
References
- Xu, N.; Kosma, C.; Vazirgiannis, M. TimeGNN: temporal dynamic graph learning for time series forecasting. In Proceedings of the International Conference on Complex Networks and Their Applications; Springer Nature: Switzerland, 2023; pp. 87–99. [Google Scholar]
- Meng, R.; Wang, H.; Sun, Y.; Wu, Q.; Lian, L.; Zhang, R. Behavioral Anomaly Detection in Distributed Systems via Federated Contrastive Learning. arXiv 2025, arXiv:2506.19246. [Google Scholar] [CrossRef]
- Pan, S.; Wu, D. Trustworthy Summarization via Uncertainty Quantification and Risk Awareness in Large Language Models. 2025. [Google Scholar] [CrossRef]
- Liu, Z.; Zhang, Z. Graph-Based Discovery of Implicit Corporate Relationships Using Heterogeneous Network Learning. Journal of Computer Technology and Software 2024, 3(7). [Google Scholar]
- Yan, L.; Wang, Q.; Liu, C. Semantic Knowledge Graph Framework for Intelligent Threat Identification in IoT. 2025. [Google Scholar] [CrossRef]
- Zou, Y. Hierarchical Large Language Model Agents for Multi-Scale Planning in Dynamic Environments. Transactions on Computational and Scientific Methods 2024, vol. 4(no. 2). [Google Scholar]
- Jiang, M.; Liu, S.; Xu, W.; Long, S.; Yi, Y.; Lin, Y. Function-Driven Knowledge-Enhanced Neural Modeling for Intelligent Financial Risk Identification. 2025. [Google Scholar]
- Xu, Z.; Ma, K.; Liu, Y.; Sun, W.; Liu, Y. Causal Representation Learning for Robust Anomaly Detection in Complex Environments. 2025. [Google Scholar] [PubMed]
- Jin, M.; Koh, H. Y.; Wen, Q. A survey on graph neural networks for time series: Forecasting, classification, imputation, and anomaly detection. IEEE Transactions on Pattern Analysis and Machine Intelligence, 2024. [Google Scholar]
- Xiang, S.; Cheng, D.; Shang, C. Temporal and heterogeneous graph neural network for financial time series prediction. In Proceedings of the 31st ACM International Conference on Information & Knowledge Management, 2022; pp. 3584–3593. [Google Scholar]
- Kumar, P. N.; Umeorah, N.; Alochukwu, A. Dynamic graph neural networks for enhanced volatility prediction in financial markets. arXiv 2024, arXiv:2410.16858. [Google Scholar] [CrossRef]
- Feng, R.; Jiang, S.; Liang, X. STGAT: Spatial-Temporal Graph Attention Neural Network for Stock Prediction. Applied Sciences 2025, vol. 15(no. 8), Article 4315. [Google Scholar] [CrossRef]
- Qiu, Z.; Liu, F.; Wang, Y.; Hu, C.; Cheng, Z.; Wu, D. Spatiotemporal Traffic Prediction in Distributed Backend Systems via Graph Neural Networks. arXiv 2025, arXiv:2510.15215. [Google Scholar] [CrossRef]
- Zhang, Q.; Lyu, N.; Liu, L.; Wang, Y.; Cheng, Z.; Hua, C. Graph Neural AI with Temporal Dynamics for Comprehensive Anomaly Detection in Microservices. arXiv 2025, arXiv:2511.03285. [Google Scholar] [CrossRef]
- Xu, Z.; Xia, J.; Yi, Y.; Chang, M.; Liu, Z. Discrimination of Financial Fraud in Transaction Data via Improved Mamba-Based Sequence Modeling. 2025. [Google Scholar] [CrossRef]
- Jiang, W.; Liu, H.; Xiong, H. When graph neural network meets causality: Opportunities, methodologies and an outlook. arXiv 2023, arXiv:2312.12477. [Google Scholar]
- Assaad, C. K.; Devijver, E.; Gaussier, E. Survey and evaluation of causal discovery methods for time series. Journal of Artificial Intelligence Research 2022, vol. 73, 767–819. [Google Scholar] [CrossRef]
- Liu, X.; Qin, Y.; Xu, Q.; Liu, Z.; Guo, X.; Xu, W. Integrating Knowledge Graph Reasoning with Pretrained Language Models for Structured Anomaly Detection. 2025. [Google Scholar]
- Liu, R.; Zhang, R.; Wang, S. Graph Neural Networks for User Satisfaction Classification in Human-Computer Interaction. arXiv 2025, arXiv:2511.04166. [Google Scholar] [CrossRef]
- Yao, G.; Liu, H.; Dai, L. Multi-agent reinforcement learning for adaptive resource orchestration in cloud-native clusters. arXiv 2025, arXiv:2508.10253. [Google Scholar]
- Li, Y.; Han, S.; Wang, S.; Wang, M.; Meng, R. Collaborative Evolution of Intelligent Agents in Large-Scale Microservice Systems. arXiv 2025, arXiv:2508.20508. [Google Scholar] [CrossRef]
- Zheng, J.; Chen, Y.; Zhou, Z.; Peng, C.; Deng, H.; Yin, S. Information-Constrained Retrieval for Scientific Literature via Large Language Model Agents. 2025. [Google Scholar] [CrossRef]
- Zheng, J.; Zhang, H.; Yan, X.; Hao, R.; Peng, C. Contrastive Knowledge Transfer and Robust Optimization for Secure Alignment of Large Language Models. arXiv 2025, arXiv:2510.27077. [Google Scholar] [CrossRef]
- Li, Y. Differential Privacy-Enhanced Federated Learning for Robust AI Systems. Journal of Computer Technology and Software 2024, vol. 3(no. 4). [Google Scholar]
- Wang, Y.; Fang, R.; Xie, A.; Feng, H.; Lai, J. Dynamic Anomaly Identification in Accounting Transactions via Multi-Head Self-Attention Networks. arXiv 2025, arXiv:2511.12122. [Google Scholar]
- Chen, X.; Gadgil, S. U.; Gao, K.; Hu, Y.; Nie, C. Deep Learning Approach to Anomaly Detection in Enterprise ETL Processes with Autoencoders. arXiv 2025, arXiv:2511.00462. [Google Scholar] [CrossRef]
- Su, X. Deep Forecasting of Stock Prices via Granularity-Aware Attention Networks. Journal of Computer Technology and Software 2024, vol. 3(no. 7). [Google Scholar]
- Blockeel, H.; Devos, L.; Frénay, B. Decision trees: from efficient prediction to responsible AI. Frontiers in Artificial Intelligence 2023, vol. 6, 1124553. [Google Scholar] [CrossRef]
- Tolstikhin, I.O.; Houlsby, N.; Kolesnikov, A. Mlp-mixer: An all-mlp architecture for vision. Advances in Neural Information Processing Systems 2021, vol. 34, 24261–24272. [Google Scholar]
- Lindemann, B.; Müller, T.; Vietz, H. A survey on long short-term memory networks for time series prediction. Procedia CIRP 2021, vol. 99, 650–655. [Google Scholar] [CrossRef]
- Nsengiyumva, E.; Mung’atu, J. K.; Ruranga, C. A comparative study of multivariate CNN, BiLSTM and hybrid CNN-BiLSTM models for forecasting foreign exchange rate using deep learning. Cogent Economics & Finance 2025, vol. 13(no. 1), 2526148. [Google Scholar]
- Papa, L.; Russo, P.; Amerini, I. A survey on efficient vision transformers: algorithms, techniques, and performance benchmarking. IEEE Transactions on Pattern Analysis and Machine Intelligence 2024, vol. 46(no. 12), 7682–7700. [Google Scholar] [CrossRef] [PubMed]
Figure 1.
Overall model architecture diagram.
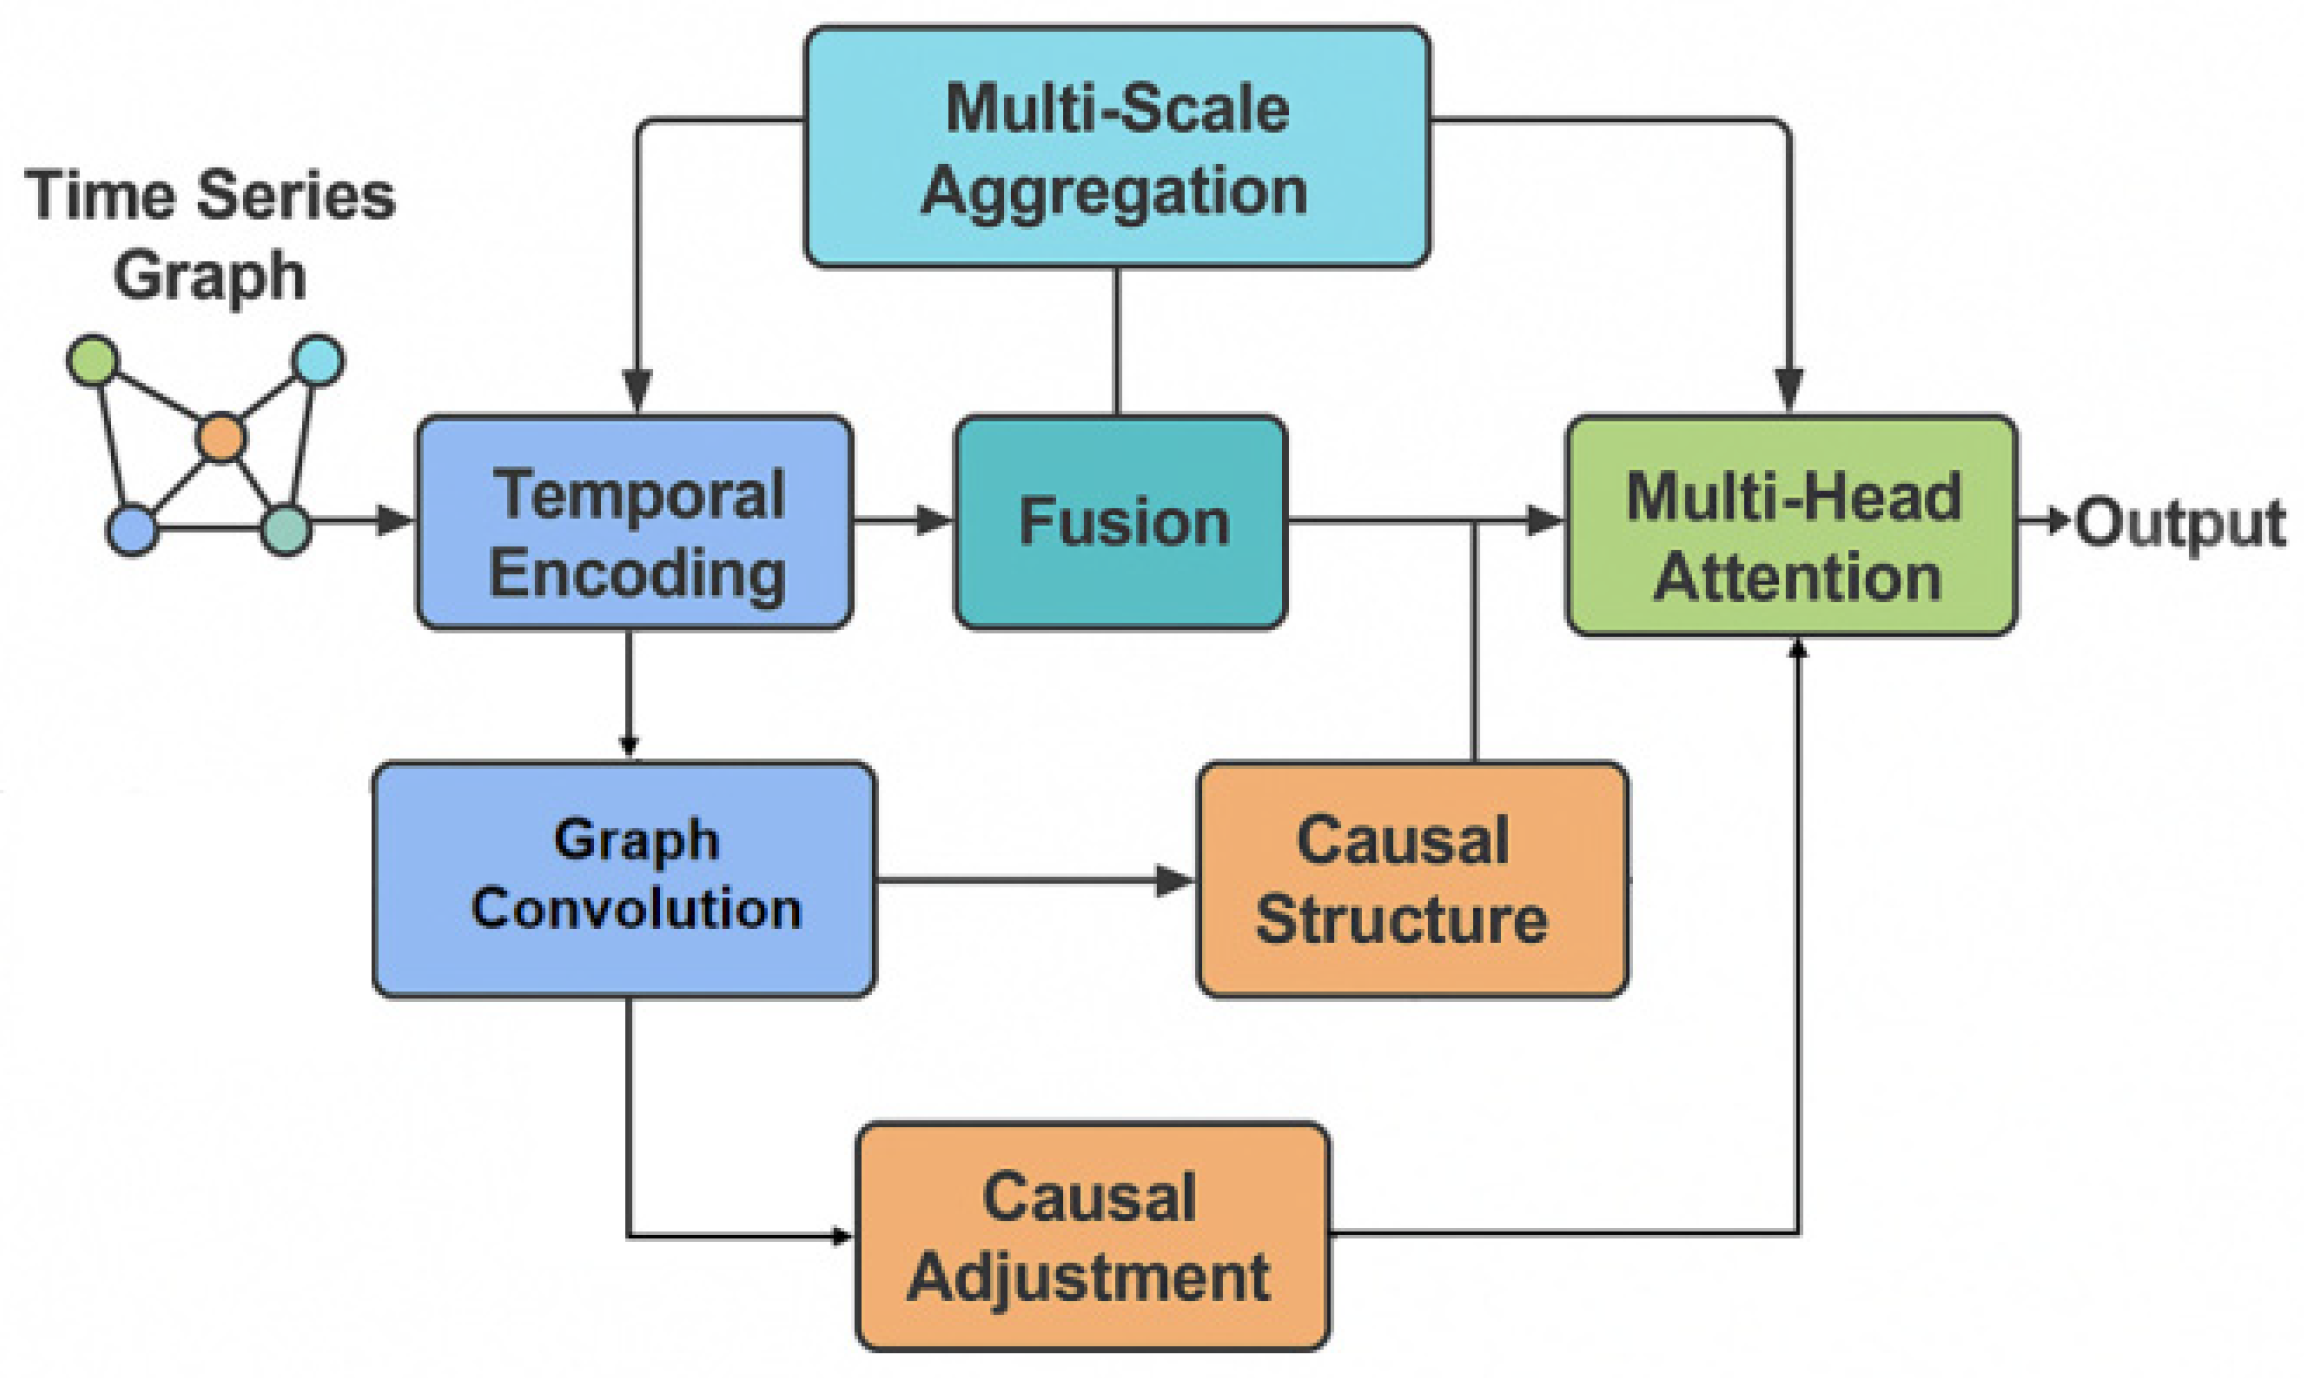
Figure 2.
The impact of hidden layer dimension on MAPE experimental results.
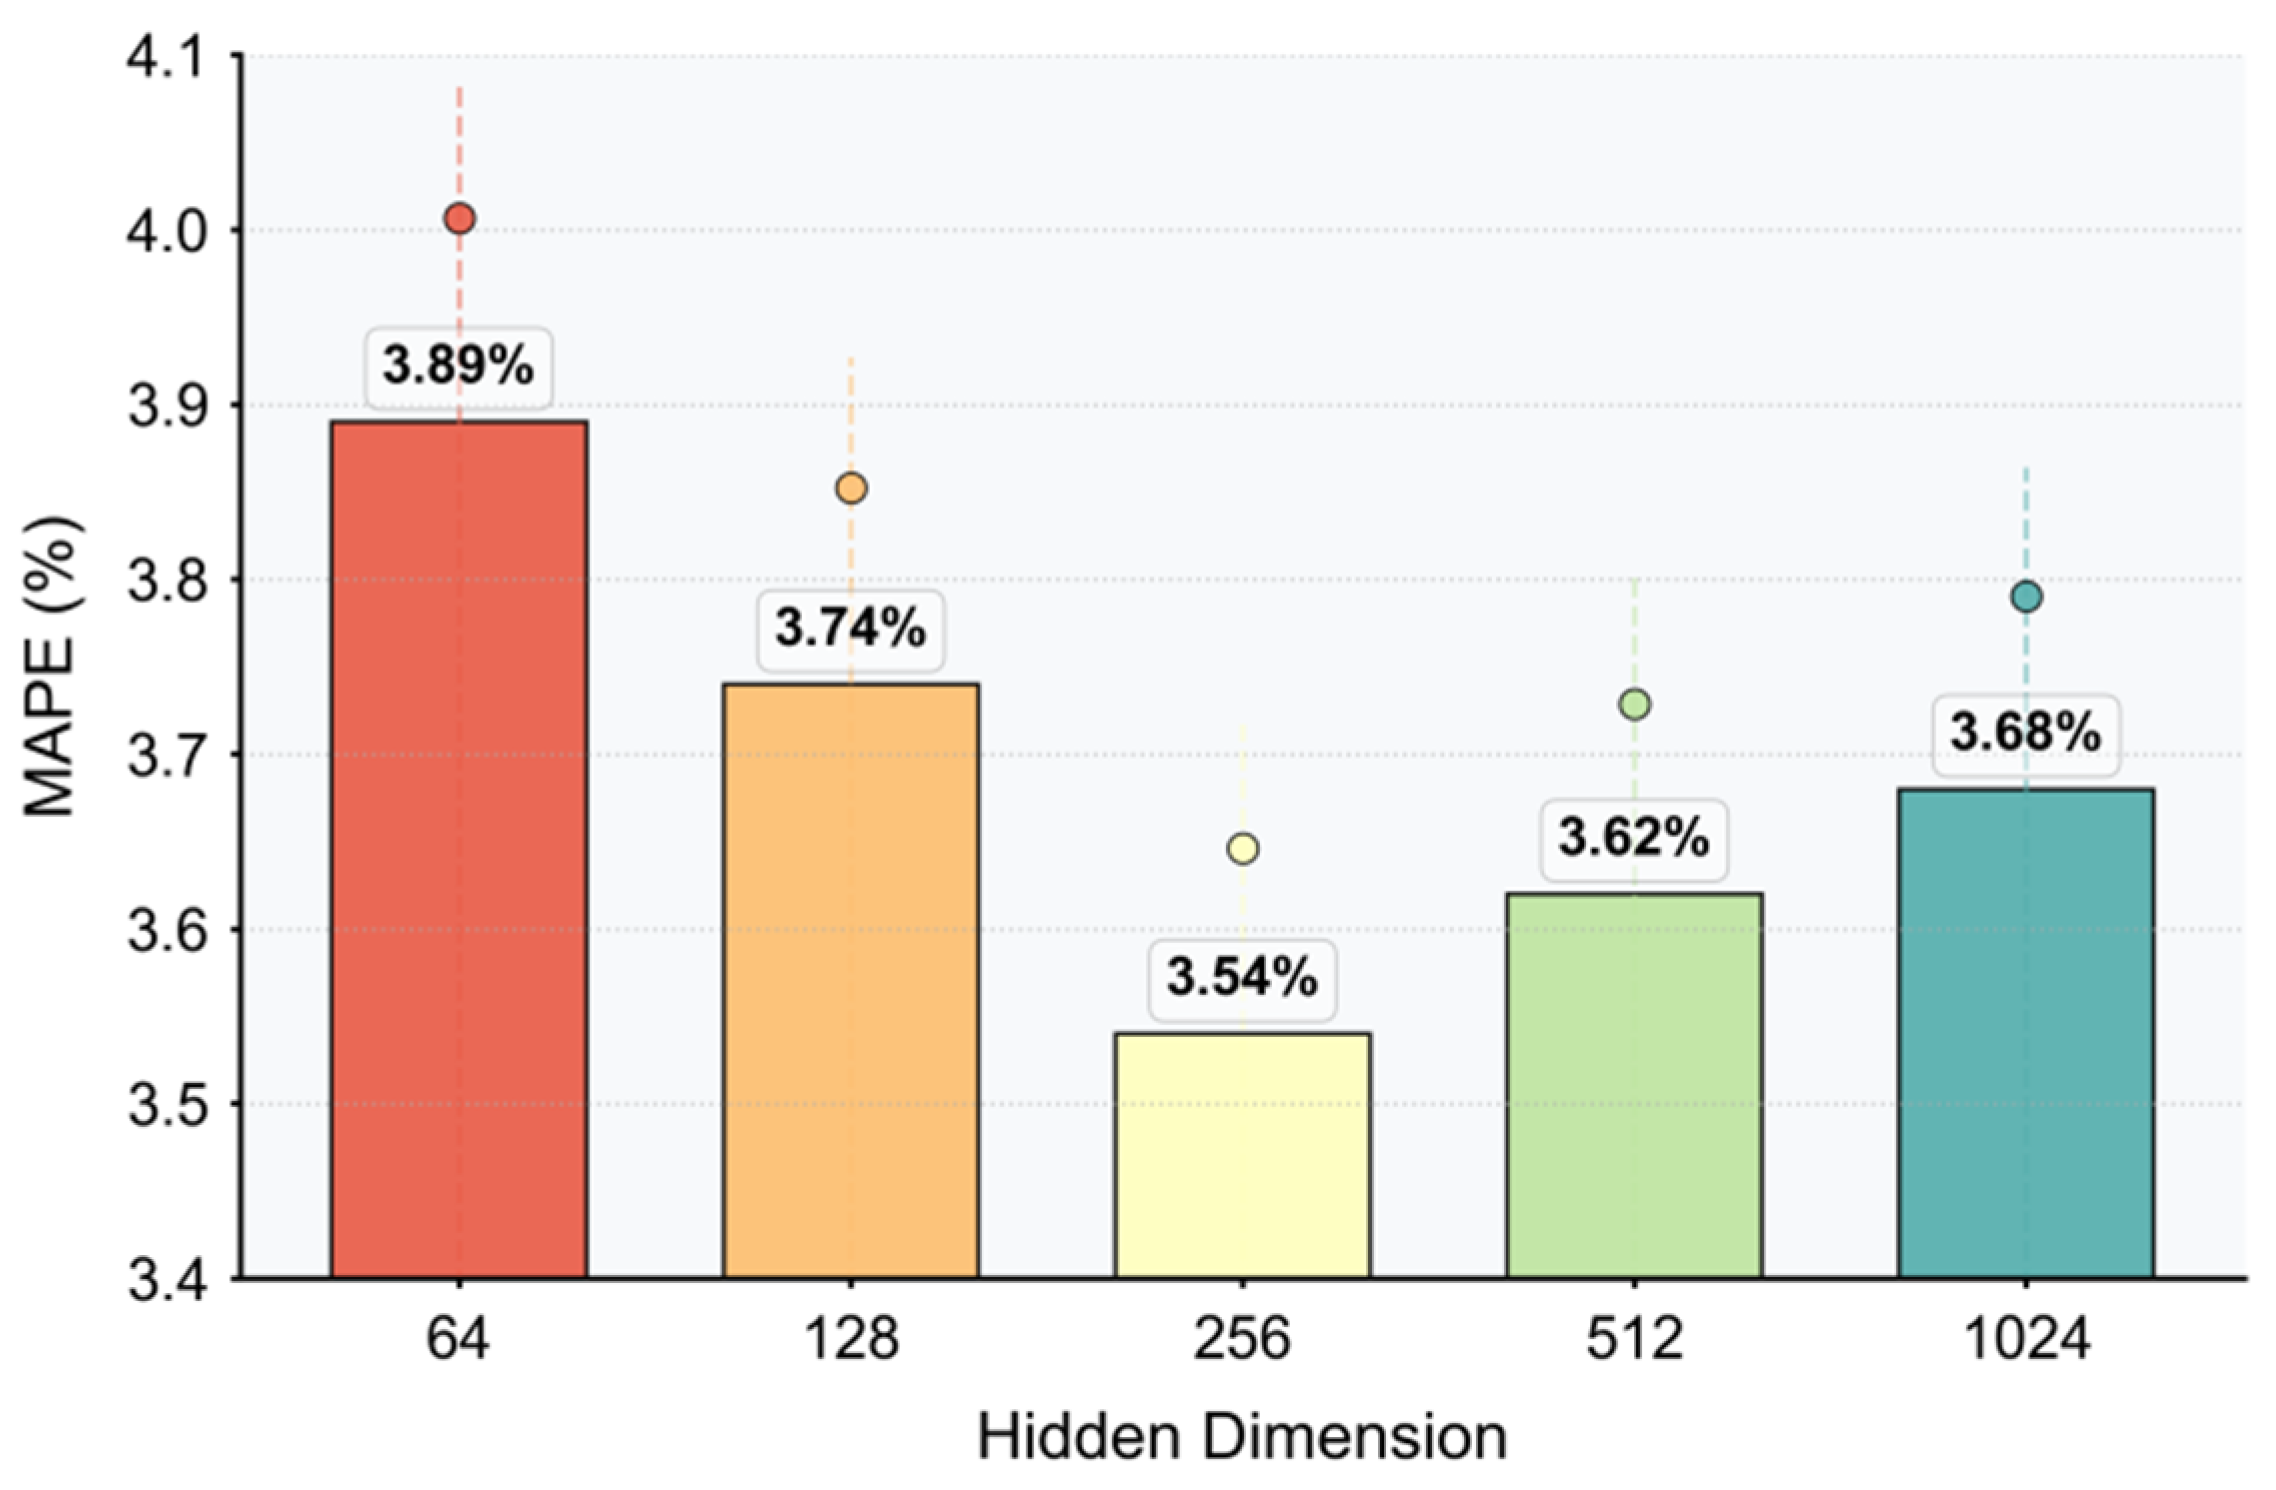
Figure 3.
This paper also presents the impact of the temporal window size on the experimental results.
Figure 3.
This paper also presents the impact of the temporal window size on the experimental results.
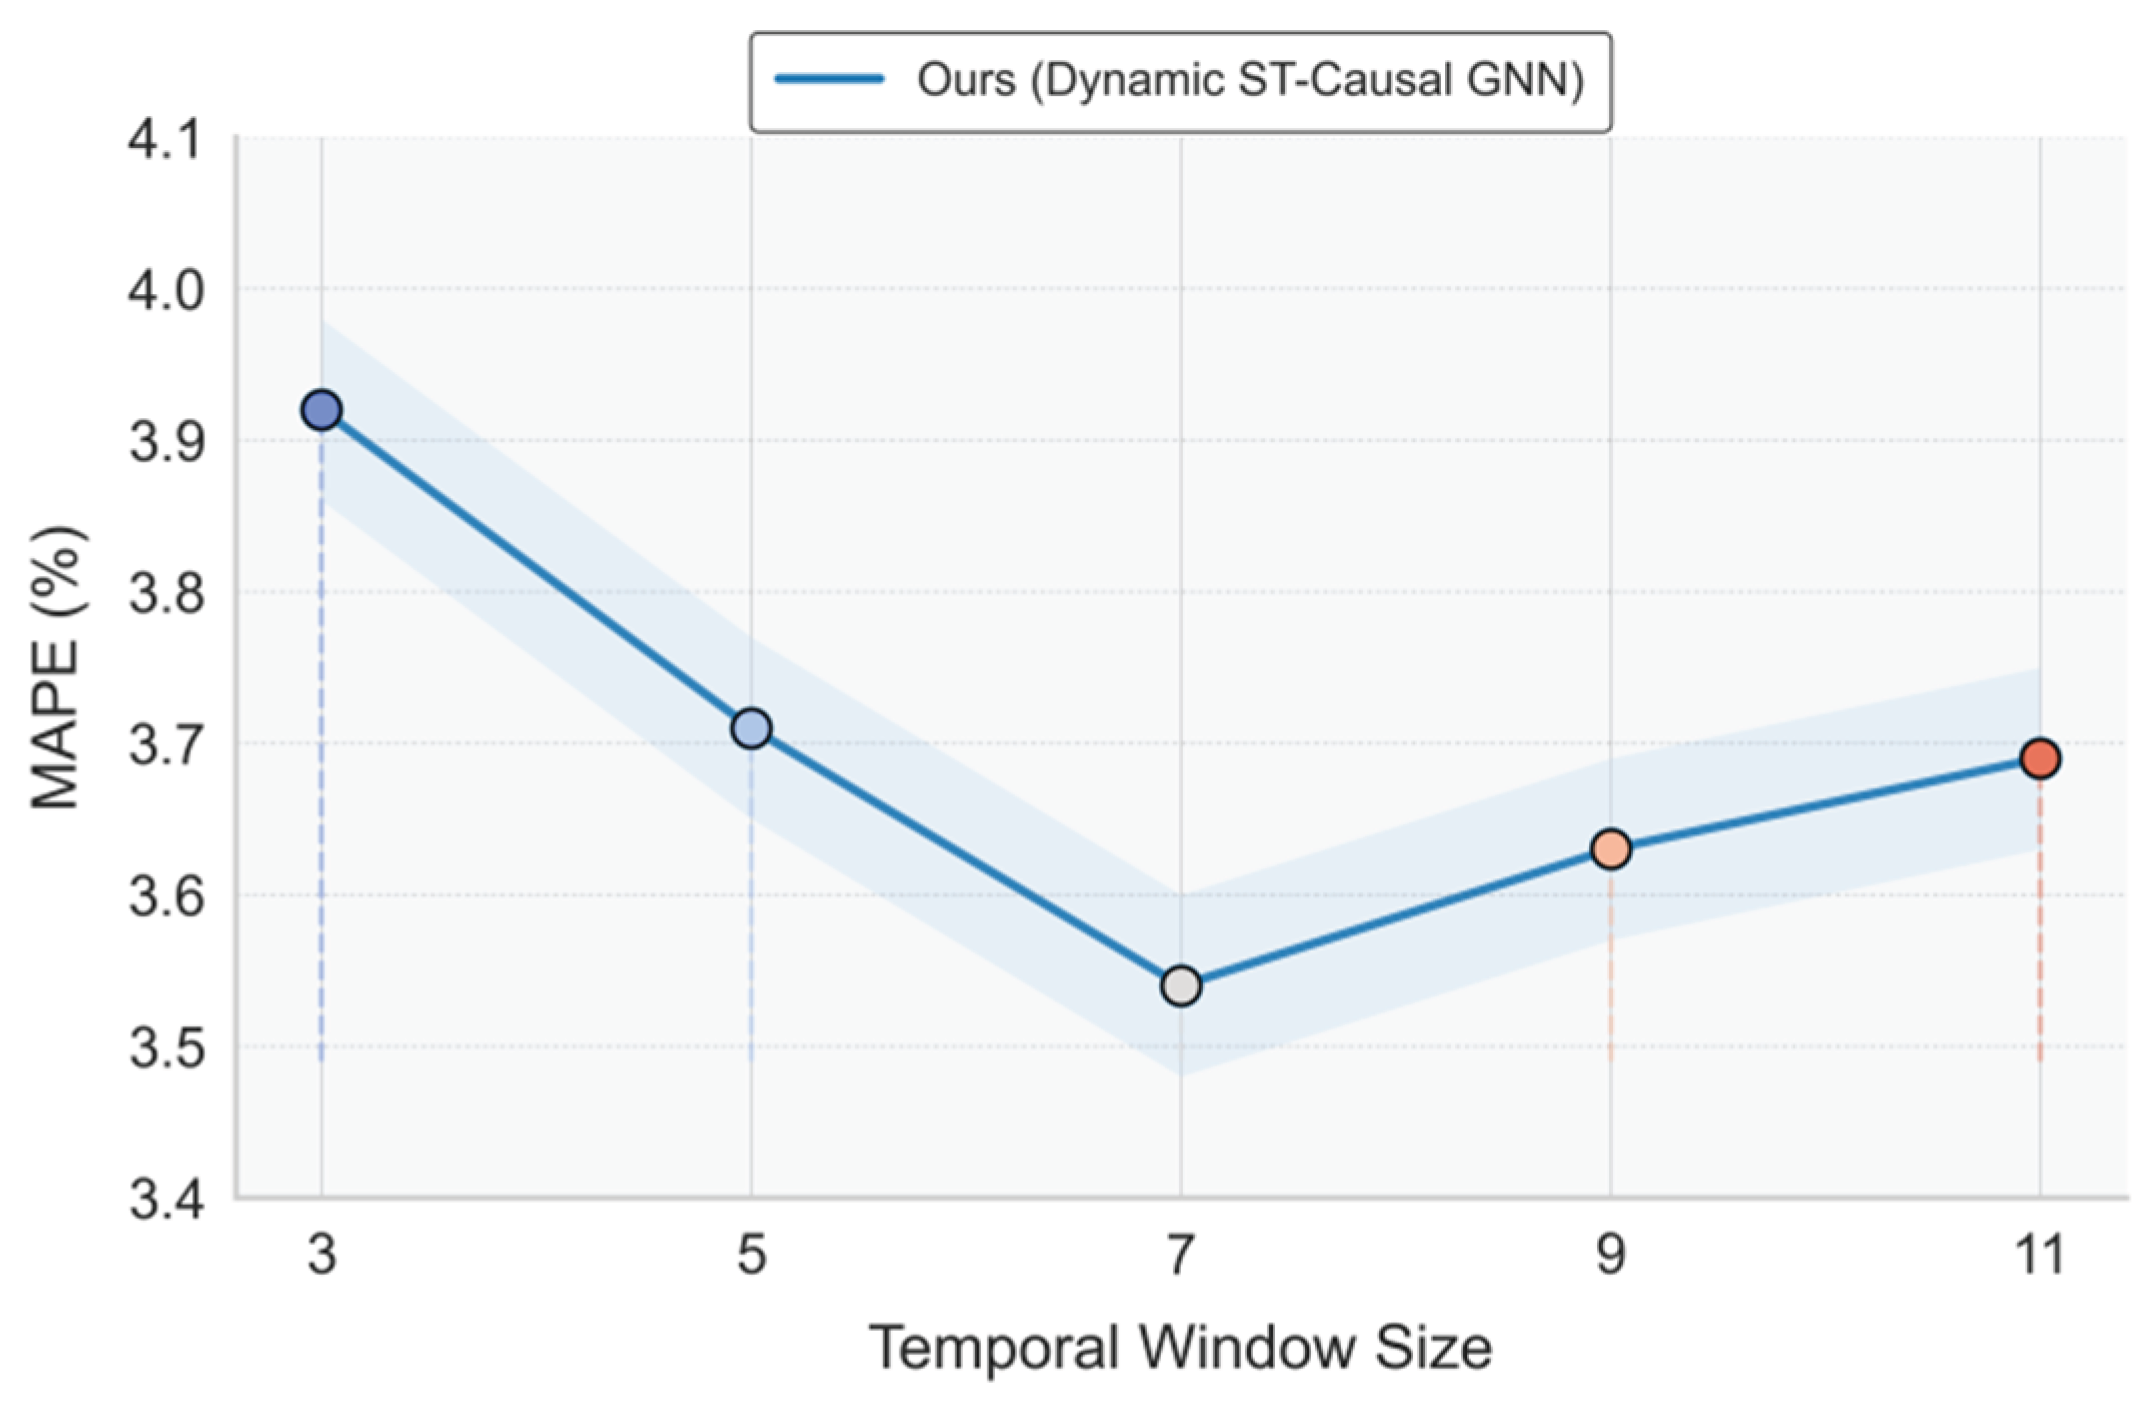

Table 1.
Comparative experimental results.
| Method | MSE | MAE | MAPE | RMAE |
|---|---|---|---|---|
| Decesion Tree [28] | 0.00482 | 0.0457 | 5.36% | 0.2135 |
| MLP [29] | 0.00425 | 0.0421 | 4.88% | 0.2051 |
| LSTM [30] | 0.00379 | 0.0398 | 4.42% | 0.1962 |
| BILSTM [31] | 0.00352 | 0.0374 | 4.17% | 0.1895 |
| Transformer [32] | 0.00325 | 0.0359 | 3.92% | 0.1826 |
| Ours | 0.00284 | 0.0327 | 3.54% | 0.1731 |
Disclaimer/Publisher’s Note: The statements, opinions and data contained in all publications are solely those of the individual author(s) and contributor(s) and not of MDPI and/or the editor(s). MDPI and/or the editor(s) disclaim responsibility for any injury to people or property resulting from any ideas, methods, instructions or products referred to in the content. |
© 2025 by the authors. Licensee MDPI, Basel, Switzerland. This article is an open access article distributed under the terms and conditions of the Creative Commons Attribution (CC BY) license (http://creativecommons.org/licenses/by/4.0/).
Copyright: This open access article is published under a Creative Commons CC BY 4.0 license, which permit the free download, distribution, and reuse, provided that the author and preprint are cited in any reuse.


