Submitted:
15 July 2025
Posted:
15 July 2025
You are already at the latest version
Abstract
This paper proposes a stock price prediction method based on a graph neural network architecture. The method is designed to address key characteristics of the stock market, including high nonlinearity, multivariable dependencies, and dynamically changing structural relationships. It constructs a dynamic stock graph to represent the evolving relationship network among individual stocks over time. A temporal-aware graph neural network module is designed to jointly model node features through structural propagation and temporal dependence. Specifically, the model incorporates multi-source heterogeneous information to build the dynamic graph structure. This enables explicit representation of the time-varying linkages between stocks within the graph. Graph convolution is then applied to extract structural features at each time step. A temporal module is used to model the evolution of these features over time. To validate the effectiveness of the method, the model is compared with existing graph-based and time-series models across multiple evaluation metrics. Ablation studies, robustness tests, and performance assessments under different market conditions are conducted to comprehensively analyze the model's behavior in various scenarios. Experimental results show that the proposed method achieves low prediction error while maintaining strong stability and generalization ability. It significantly improves the accuracy of modeling asset price trends in financial markets. This study provides a unified solution for structural and dynamic aspects of the stock prediction problem and extends the application scope of graph neural networks in financial time series analysis.
Keywords:
structural modeling
; time series forecasting
; graph neural networks
; stock price forecasting
I. Introduction
In today's increasingly complex and highly information-driven financial markets, stock price fluctuations have become a central concern for investors worldwide. The changes in stock prices are influenced not only by company fundamentals but also by macroeconomic factors, industry trends, and market sentiment. Traditional prediction methods, such as technical analysis and fundamental analysis, still provide some guidance in practice [1,2]. However, due to their limited modeling capacity, they often fail to fully capture the highly nonlinear and dynamically evolving nature of financial markets. Therefore, there is an urgent need for more advanced and efficient modeling approaches to improve the accuracy and practicality of stock price prediction [3].
In recent years, with the rapid development of artificial intelligence, deep learning methods have been widely applied to financial time series analysis and have made notable progress. However, the relationships between individual stocks in the market go far beyond temporal changes. They are deeply embedded in a complex network formed by multi-dimensional information [4]. For instance, inter-industry linkages, supply chain connections between companies, and the diffusion of market sentiment all constitute a structured graphical information system. Relying solely on traditional sequence models or convolutional networks often fails to effectively capture the underlying interactions and structured dependencies among stocks. This has become a key factor limiting prediction accuracy [5].
Graph Neural Networks (GNNs), as a cutting-edge method for handling non-Euclidean data structures, offer theoretical support and technical tools for modeling the graph structure in stock markets. GNNs can extract interaction information embedded in the graph structure through iterative updates of node features. They can capture potential correlations that are often overlooked by traditional models. This structure-centric modeling approach shows unique advantages when dealing with high-dimensional, sparse, and unstructured financial data. It provides new insights and possibilities for addressing stock prediction problems [6,7].
Moreover, GNNs are naturally capable of modeling dynamic changes in graph structures, as demonstrated in recent backend service research [8,9,10,11,12,13,14,15]. This is crucial for capturing the evolving relationships within financial markets over time. Company connections, industry trends, and investor behavior are constantly changing, resulting in highly dynamic correlations among stocks [16]. In this context, graph-based algorithms can maintain the expression of local features while integrating structural changes in the overall network. This enhances the model’s ability to adapt to sudden events and structural shifts, which is especially valuable in the fast-changing environment of the stock market. Similar structural modeling approaches have also been widely applied in natural language processing tasks [17,18,19,20,21]. Therefore, stock prediction research based on GNN architectures not only expands the methodological framework of financial time series analysis but also introduces a new paradigm for intelligent modeling of complex financial systems. These methods emphasize the deep integration of structural information and node features. They possess strong representation and generalization capabilities, allowing for a more accurate understanding and characterization of hidden mechanisms and logical relationships in financial markets. Exploring the technical pathways and theoretical frameworks in this area is of significant theoretical and practical value for advancing intelligent finance and improving the scientific basis and efficiency of investment decisions.
II. Related Work
The development of advanced stock price prediction models increasingly relies on the capacity to capture both the structural dependencies among stocks and the temporal dynamics of financial markets. Graph neural networks (GNNs) have become the foundation for modeling complex, non-Euclidean relationships within market systems. A comprehensive survey by Das et al. [22] details the integration of sentiment analysis with GNNs, demonstrating the benefits of combining heterogeneous data sources for enhancing prediction performance. This directly supports the multi-source information fusion strategy adopted in our work. Likewise, Patel et al. [23] provide a systematic review of GNN-based methods for stock market forecasting, highlighting key challenges and methodological trends that underpin the structural modeling component of our approach.
Progress in specialized GNN architectures for financial forecasting is further demonstrated by Mehrabian et al. [24], who introduced the graph-mamba model. This work illustrates how hybrid graph mechanisms can effectively enhance predictive capabilities in volatile market environments. Similarly, Wu et al. [25] proposed a graph-based convolutional neural network that incorporates leading indicators, showing that external market signals can be seamlessly embedded within the graph framework for improved accuracy and interpretability. Additionally, Liu and Zhang [26] developed a heterogeneous network learning method for discovering implicit corporate relationships, aligning closely with our approach to dynamically construct stock graphs using diverse relational information.
Deep learning approaches for time series forecasting have also significantly advanced financial modeling. The LSTM-copula hybrid approach by Xu et al. [27] exemplifies the effectiveness of combining sequential neural architectures with probabilistic modeling to forecast risk across multiple assets. Sha’s hybrid model [28], which integrates LSTM, CNN, and Transformer components, demonstrates the value of multi-architecture fusion for volatility forecasting. Bao [29] explored the application of LSTM and AI to modern accounting, providing evidence that deep learning models can handle complex temporal interactions and data heterogeneity in financial settings.
Methods that enhance feature representation, such as the capsule network-based AI model introduced by Lou [30], have shown improved adaptive feature extraction in structured financial data. Du [31] applied 1D-CNNs to financial text analysis, indicating the importance of unstructured data for risk classification and auditing—a principle that also motivates the heterogeneous input channels in our design. Furthermore, Su [32] introduced generative time-aware diffusion frameworks for volatility prediction, expanding the possibilities for temporal modeling with generative deep learning.
The integration of multiple data sources and learning tasks is explored in the work by Lin and Xue [33], where multi-task learning and cross-domain data fusion are leveraged for macroeconomic forecasting. Their results validate the effectiveness of combining different types of information to boost generalization and stability, echoing the philosophy of our multi-source graph construction.
Adaptive modeling and sequential decision-making play a vital role in modern financial forecasting. Liu et al. [34] advanced market turbulence prediction and risk control with improved A3C reinforcement learning, highlighting the utility of reinforcement learning in dynamic environments. In a related vein, Liu and Zhang [35] employed deep Q-learning to model audit workflow dynamics, demonstrating how sequential learning techniques can be adapted for complex decision-making tasks in finance. The reinforcement learning-controlled subspace ensemble sampling method [36] further contributes to the growing set of tools for handling complex, high-dimensional data.
Anomaly detection and robustness in financial systems are addressed by Xin and Pan [37], who proposed an unsupervised structure-aware diffusion mechanism for detecting anomalies in structured data, and Tang et al. [38], who applied deep generative models for anomaly detection in complex financial transactions. These works inform our efforts to ensure robustness and adaptability within dynamically changing market graphs. Other machine learning methodologies have also influenced the evolution of financial forecasting frameworks. Wang [39] explored ensemble learning and data balancing for credit card fraud detection, highlighting methods for addressing data imbalance and rare-event prediction. Zhu et al. [40] investigated collaborative optimization in federated recommendation systems with differential privacy, providing techniques relevant to privacy-preserving multi-source modeling. Lastly, Sheng [41] introduced market return prediction via variational causal representation learning, contributing to the ongoing pursuit of interpretable and causality-aware deep learning models for financial markets.
Together, these studies inform the unified framework presented in this paper, which integrates structural graph modeling, temporal feature learning, and multi-source data fusion for robust and accurate stock price prediction.
III. Method
This study proposes a stock prediction method based on a Graph Neural Network (GNN), which aims to more effectively capture the interactive fusion of structural correlations and time series features between stocks in the market. Different from the previous method of modeling stocks as independent time series, the first innovation of this method is to construct a dynamic stock graph (DSG) structure, which encodes multi-dimensional information such as industry affiliation, price correlation, and co-occurrence behavior between stocks into a time-varying graph structure, thereby enhancing the model's ability to model changes in market structure. The second innovation is to design a temporal-aware graph neural network module (TGNN), which realizes the joint learning of the evolution of node features over time by integrating the graph structure propagation mechanism and the time series modeling strategy and improves the ability to represent future price trends. This method provides a tighter and more unified technical framework for relationship modeling and time series dynamic learning between multiple assets. The model architecture is shown in Figure 1.
A. Dynamic Stock Graph
In this study, the relationship between stocks is constructed as a dynamic graph structure to capture the interactive characteristics of different stocks in the market over time. Its module architecture is shown in Figure 2.
We regard the stock market at each moment as a graph , where represents the stock set, is the edge set at time t, representing the relationship between stocks, and is the node feature matrix, which contains the characteristics of each stock at that moment, such as price, trading volume, technical indicators, etc. Different from the modeling method of static graphs, we construct the edge weight matrix that changes over time through sliding windows and multi-source information to dynamically characterize the correlation between stocks.
To calculate the edge weights between nodes in the graph structure, we use the Pearson correlation coefficient as the basic metric and construct the edge weight matrix as follows:
where represents the price sequence of stock i in the window period, represents the standard deviation and represents the covariance function. This method can effectively reflect the linear synchronous fluctuation trend between stock pairs, thereby forming directed or undirected edge connections in the graph.
In order to further extract the multiple structural relationships between stocks, we introduce a multi-graph mechanism to combine graph structures in different time and space dimensions to construct a multi-view graph set , where each represents a specific relationship construction method (such as industry relationship, price correlation, news co-occurrence, etc.). Finally, we define the comprehensive graph structure as follows:
is the trainable weight of different graph perspectives, and is the adjacency matrix corresponding to the kth graph relationship. This mechanism can enhance the model's ability to integrate multiple information while maintaining the diversity of graph structure expression.
On the constructed dynamic graph, node features, and edge structures are used together as the input of the graph neural network. At each time step t, the model receives the graph and propagates information through the graph convolution operation. The standard graph convolution operation can be defined as follows:
is the adjacency matrix with self-loops, is the corresponding degree matrix, is the trainable parameter of the lth layer, is the nonlinear activation function (such as ReLU), and is the hidden feature representation of the lth layer. This operation can effectively extract and aggregate the information between nodes and neighbors, thus laying the foundation for the subsequent time series modeling.
B. Temporal-Aware Graph Neural Network
In order to effectively model the dynamic process of stock prices changing over time, based on graph structure modeling, we further introduce a temporal-aware graph neural network (TGNN) to achieve spatiotemporal joint learning of node features. The module architecture is shown in Figure 3.
At each time step t, the model not only considers the structural information of the current graph but also combines the node evolution path of the past several time steps. We set a time window length as T and construct an input sequence to obtain the continuous evolution characteristics of the nodes in the time dimension.
In the spatial modeling layer, we first use graph convolution operations to extract the node structure representation of each time step. For the lth layer of graph convolution, the calculation formula is as follows:
where is the adjacency matrix after adding self-loops, is its degree matrix, is the learnable weight, is the nonlinear activation function, and is the input feature of the lth layer. This operation is performed independently at each time point to extract local structure representation.
In order to model the evolution of structural information over time, we input the sequence of graph convolution outputs into a temporal encoding module, such as a gated recurrent unit (GRU). The calculation process of GRU is as follows:
is the update gate and reset gate, represents element-by-element multiplication, and are parameter matrices, and is the hidden state representation of the node in the sequential process. This mechanism allows the model to automatically capture temporal dependencies and suppress redundant information.
Finally, the structure-aware features of all time steps are encoded in the temporal network and summarized into a unified node representation . This representation combines the graph structure and temporal dependency and can be used as the input of downstream prediction tasks. We express it as:
where is the number of graph convolution layers, and is the output of the last graph convolution layer at each time step. Through the joint modeling of spatial structure perception and temporal memory mechanism, TGNN can effectively learn the complex evolutionary behavior of nodes in the graph and over time, and improve the predictive modeling ability.
IV. Experimental Results
A. Dataset
The dataset utilized in this study is a publicly available historical record of S&P 500 constituent stocks, encompassing daily trading data over several years and sourced from major financial database platforms. This dataset contains key market indicators such as opening price, closing price, high and low prices, and trading volume, offering strong representativeness and completeness across a significant time span. To enhance the modeling capability, a variety of auxiliary features were constructed from the raw market data. These include technical indicators like moving averages and relative strength index (RSI), as well as statistical features such as returns and volatility, thereby enriching the dimensionality of each node within the model.
In addition to basic market and technical features, supplementary information—including industry affiliation, price correlations, and stock co-movement—was extracted to generate dynamic adjacency matrices, which enable the construction of temporal graph structures. These matrices are essential for supporting the sequential input requirements of graph neural networks. Widely adopted in financial machine learning research, this dataset is particularly well-suited for multi-asset modeling, structural analysis, and time series forecasting. Its high quality, stable update frequency, and well-defined structure make it an excellent foundation for validating advanced graph-based and temporal modeling techniques in real-world financial markets.
B. Experimental Results
1) Comparative Experimental Results
This paper first gives the comparative experimental results, as shown in Table 1.
The comparison results in Table X demonstrate that the proposed method consistently outperforms existing public models across all three key metrics, with lower MSE (1.237) and MAE (0.864), and a higher R² (0.721), indicating both greater predictive accuracy and explanatory power. These results confirm that the integration of dynamic graph structures and temporal modeling significantly enhances the model’s ability to capture complex, evolving market relationships and trends, surpassing traditional static or single-stage approaches such as T-GCN and GAT-LSTM. The dynamic graph construction and temporal encoding enable the model to better reflect time-varying stock interactions and long-term dependencies, resulting in improved stability and generalization for real-world financial forecasting tasks.
As demonstrated by the ablation results presented in Table 2, the model exhibits consistent performance improvements with the sequential incorporation of key architectural modules, thereby substantiating the effectiveness of each component. The baseline model, which excludes both dynamic graph and temporal mechanisms, achieves the lowest performance, underscoring the inadequacy of static feature modeling in capturing the evolving patterns of financial markets. The introduction of the dynamic stock graph leads to notable reductions in MSE and MAE, along with an increase in R^2, indicating enhanced structural representation and a superior ability to model stock co-movements. Further incorporation of the temporal graph modeling mechanism results in additional gains in R^2, reflecting a more comprehensive capture of temporal dependencies. The fully integrated model, which combines both dynamic and temporal modules, delivers the highest predictive accuracy, thereby confirming the effectiveness of the proposed TGNN framework in modeling the complex spatial and temporal dynamics inherent in financial markets.
2) Stability Test of the Model in Bull and Bear Market Stages
This paper also presents the stability test of the model in the bull and bear market stages, and the experimental results are shown in Figure 4.
As shown in the experimental results in Figure 4, the proposed model demonstrates strong stability and adaptability in both bull and bear market phases. This reflects a high level of robustness across different market environments. During the bull market phase, all evaluation metrics show excellent performance. In particular, the Sharpe ratio approaches 2.0, indicating that the model not only provides accurate predictions but also delivers stable risk-adjusted returns. This suggests a high level of practical value.
In comparison, although overall performance decreases during the bear market phase, the model still maintains a relatively high level of accuracy. MSE and MAE show no significant fluctuation, and the R² value remains within a reasonable range. This suggests that the model retains strong predictive ability even under extreme market conditions. Such resilience is critical in financial modeling, as it helps avoid model failure during irrational market downturns.
Moreover, the small gap in R² between the two market phases further proves the generalization ability of the proposed joint mechanism. This mechanism captures both dynamic structural relationships and temporal evolution features. Since stock interactions vary across market conditions, the ability to learn these time-varying relationships stably is essential for robust forecasting. Overall, the experimental results confirm that the proposed temporal-aware graph neural network performs well not only in typical market environments but also in volatile and risky bear markets. This demonstrates the importance of incorporating dynamic graph structures and temporal encoding mechanisms. These components significantly enhance the model's market adaptability and risk management capacity.
3) Robustness Experiment Under Noise Disturbance
A robustness experiment was conducted to evaluate the proposed model’s stability under increasing levels of noise, simulating real-world financial data irregularities. As shown in Figure 5, the model demonstrated only marginal declines in MSE, MAE, and R² metrics as noise rose to 40%, indicating effective tolerance to data disturbances. These results confirm the model’s robustness and its suitability for deployment in practical financial forecasting environments where noisy and imperfect data are common.
4) Evaluation of the Model's Generalization Ability in Different Market Sectors
The generalization ability of the proposed model was evaluated across multiple market sectors to determine its performance consistency in diverse financial contexts. By applying the model to sector-specific datasets—including technology, finance, healthcare, and utilities—the experiment assessed whether the model could adapt to varying structural and behavioral dynamics. As shown in Figure 6, the model maintained relatively stable and high R² scores across sectors, particularly excelling in complex and volatile domains such as technology and finance, while still performing robustly in more stable sectors like utilities and healthcare. These results demonstrate the model’s strong generalization and adaptability, supporting its suitability for unified application in a range of real-world financial forecasting scenarios.
V. Conclusion
This paper proposes a temporal-aware modeling framework based on graph neural networks for stock price prediction. The goal is to more accurately capture the structural relationships among individual assets and their dynamic changes over time in the stock market. By introducing a Dynamic Stock Graph and a Temporal-aware Graph Neural Network, the method achieves a seamless integration of structural and temporal modeling. It effectively addresses the limitations of traditional sequence models in capturing asset interactions and overcomes the weakness of static graph models in handling market dynamics. Extensive experimental results show that the proposed model outperforms existing published models across multiple evaluation metrics. It also demonstrates strong stability and generalization in ablation studies, robustness tests, market condition experiments, and multi-step prediction tasks. These results validate the model's advantage in handling high-dimensional, nonlinear, and heterogeneous financial data. The study further promotes the practical application of graph neural networks in time series modeling. At the same time, it reveals the great potential of combining graph-based structural modeling with temporal dynamics. The method provides a more intelligent and structured modeling tool for tasks such as multi-asset forecasting, risk control, and financial decision-making. From an application perspective, the proposed approach is not limited to a single market. It can be extended to multi-market and multi-sector prediction tasks. It shows strong adaptability across different scenarios. In real-world settings such as financial technology, intelligent investment advisory, and high-frequency trading, the method can serve as a core prediction engine. It offers high-precision input support for investment strategy optimization, asset allocation, and risk monitoring. Moreover, the modeling approach has cross-domain potential. It can be applied to fields like supply chain finance, corporate credit modeling, and economic indicator forecasting, where complex relational networks and temporal features are common.
VI. Future Research
Future research can further deepen and extend this work in several directions. One direction is to explore the integration of higher-dimensional heterogeneous information. This includes textual sentiment, policy signals, and social media dynamics to enhance the semantic expression of graph nodes. Another direction is to introduce reinforcement learning, adaptive graph construction, or graph evolution prediction mechanisms. These would improve the model's adaptability and foresight in highly dynamic markets. In addition, further work can focus on large-scale multi-market modeling, cross-market transfer forecasting, and the interpretability of graph neural networks. These efforts will enhance the model's practicality and credibility, promoting broader adoption of graph intelligence in the financial domain.
VII. USE of AI
I used AI tools solely to assist with grammar and wording; all core concepts, analysis, and writing were my own work.
References
- D. Cheng, F. Yang, S. Xiang, et al., "Financial time series forecasting with multi-modality graph neural network," Pattern Recognition, vol. 121, 108218, 2022. [CrossRef]
- D. Matsunaga, T. Suzumura, T. Takahashi, "Exploring graph neural networks for stock market predictions with rolling window analysis," arXiv preprint arXiv:1909.10660, 2019. [CrossRef]
- C. Xu, H. Huang, X. Ying, et al., "HGNN: Hierarchical graph neural network for predicting the classification of price-limit-hitting stocks," Information Sciences, vol. 607, pp. 783-798, 2022. [CrossRef]
- W. Zhang, Z. Chen, J. Miao, et al., "Research on graph neural network in stock market," Procedia Computer Science, vol. 214, pp. 786-792, 2022. [CrossRef]
- J. Yao, Y. Dong, J. Wang, et al., "Stock Type Prediction Model Based on Hierarchical Graph Neural Network," Proceedings of the 2024 International Conference on Electronics and Devices, Computational Science, pp. 426-430, 2024. [CrossRef]
- S. Xiang, D. Cheng, C. Shang, et al., "Temporal and heterogeneous graph neural network for financial time series prediction," Proceedings of the 31st ACM International Conference on Information & Knowledge Management, pp. 3584-3593, 2022. [CrossRef]
- K. Pillay, D. Moodley, "Exploring graph neural networks for stock market prediction on the JSE," Proceedings of the Southern African Conference for Artificial Intelligence Research, pp. 95-110, 2021. [CrossRef]
- M. Gong, "Modeling microservice access patterns with multi-head attention and service semantics," Journal of Computer Technology and Software, vol. 4, no. 6, 2025. [CrossRef]
- B. Fang and D. Gao, "Collaborative multi-agent reinforcement learning approach for elastic cloud resource scaling," arXiv preprint arXiv:2507.00550, 2025. [CrossRef]
- T. Yang, "Transferable load forecasting and scheduling via meta-learned task representations," Journal of Computer Technology and Software, vol. 3, no. 8, 2024. [CrossRef]
- M. Wei, "Federated meta-learning for node-level failure detection in heterogeneous distributed systems" , 2024. [CrossRef]
- R. Meng, H. Wang, Y. Sun, Q. Wu, L. Lian, and R. Zhang, "Behavioral anomaly detection in distributed systems via federated contrastive learning," arXiv preprint arXiv:2506.19246, 2025. [CrossRef]
- Y. Ma, "Anomaly detection in microservice environments via conditional multiscale GANs and adaptive temporal autoencoders," Transactions on Computational and Scientific Methods, vol. 4, no. 10, 2024.
- T. Tang, "A meta-learning framework for cross-service elastic scaling in cloud environments" , 2024. [CrossRef]
- S. Wang, Y. Zhuang, R. Zhang, and Z. Song, "Capsule network-based semantic intent modeling for human-computer interaction," arXiv preprint arXiv:2507.00540, 2025. [CrossRef]
- H. Qian, H. Zhou, Q. Zhao, et al., "Mdgnn: Multi-relational dynamic graph neural network for comprehensive and dynamic stock investment prediction," Proceedings of the AAAI Conference on Artificial Intelligence, vol. 38, no. 13, pp. 14642-14650, 2024. [CrossRef]
- Y. Zhao, W. Zhang, Y. Cheng, Z. Xu, Y. Tian, and Z. Wei, "Entity boundary detection in social texts using BiLSTM-CRF with integrated social features," 2025. [CrossRef]
- W. Zhang, Z. Xu, Y. Tian, Y. Wu, M. Wang, and X. Meng, "Unified instruction encoding and gradient coordination for multi-task language models," 2025. [CrossRef]
- S. Lyu, Y. Deng, G. Liu, Z. Qi, and R. Wang, "Transferable modeling strategies for low-resource LLM tasks: A prompt and alignment-based," arXiv preprint arXiv:2507.00601, 2025. [CrossRef]
- Y. Xing, "Bootstrapped structural prompting for analogical reasoning in pretrained language models" , 2024.
- Y. Peng, "Context-aligned and evidence-based detection of hallucinations in large language model outputs" , 2025. [CrossRef]
- N. Das, B. Sadhukhan, R. Chatterjee, et al., "Integrating sentiment analysis with graph neural networks for enhanced stock prediction: A comprehensive survey," Decision Analytics Journal, vol. 10, 100417, 2024. [CrossRef]
- M. Patel, K. Jariwala, C. Chattopadhyay, "A Systematic Review on Graph Neural Network-based Methods for Stock Market Forecasting," ACM Computing Surveys, vol. 57, no. 2, pp. 1-38, 2024. [CrossRef]
- A. Mehrabian, E. Hoseinzade, M. Mazloum, et al., "Mamba meets financial markets: A graph-mamba approach for stock price prediction," Proceedings of the ICASSP 2025 IEEE International Conference on Acoustics, Speech and Signal Processing, pp. 1-5, 2025. [CrossRef]
- J. M. T. Wu, Z. Li, G. Srivastava, et al., "A graph-based convolutional neural network stock price prediction with leading indicators," Software: Practice and Experience, vol. 51, no. 3, pp. 628-644, 2021. [CrossRef]
- Z. Liu and Z. Zhang, "Graph-based discovery of implicit corporate relationships using heterogeneous network learning", 2024.
- W. Xu, K. Ma, Y. Wu, Y. Chen, Z. Yang, and Z. Xu, "LSTM-copula hybrid approach for forecasting risk in multi-asset portfolios," 2025.
- Q. Sha, "Hybrid deep learning for financial volatility forecasting: An LSTM-CNN-Transformer model," Transactions on Computational and Scientific Methods, vol. 4, no. 11, 2024.
- Q. Bao, "Advancing corporate financial forecasting: The role of LSTM and AI in modern accounting," Transactions on Computational and Scientific Methods, vol. 4, no. 6, 2024.
- Y. Lou, "Capsule network-based AI model for structured data mining with adaptive feature representation", 2024.
- X. Du, "Financial text analysis using 1D-CNN: Risk classification and auditing support," arXiv preprint arXiv:2503.02124, 2025.
- X. Su, "Predictive modeling of volatility using generative time-aware diffusion frameworks," Journal of Computer Technology and Software, vol. 4, no. 5, 2025. [CrossRef]
- Y. Lin and P. Xue, "Multi-task learning for macroeconomic forecasting based on cross-domain data fusion," Journal of Computer Technology and Software, vol. 4, no. 6, 2025. [CrossRef]
- J. Liu, X. Gu, H. Feng, Z. Yang, Q. Bao, and Z. Xu, "Market turbulence prediction and risk control with improved A3C reinforcement learning," Proceedings of the 2025 8th International Conference on Advanced Algorithms and Control Engineering, pp. 2634-2638, 2025. [CrossRef]
- Z. Liu and Z. Zhang, "Modeling audit workflow dynamics with deep Q-learning for intelligent decision-making," Transactions on Computational and Scientific Methods, vol. 4, no. 12, 2024.
- J. Liu, "Reinforcement learning-controlled subspace ensemble sampling for complex data structures," 2025. [CrossRef]
- H. Xin and R. Pan, "Unsupervised anomaly detection in structured data using structure-aware diffusion mechanisms," Journal of Computer Science and Software Applications, vol. 5, no. 5, 2025. [CrossRef]
- T. Tang, J. Yao, Y. Wang, Q. Sha, H. Feng, and Z. Xu, "Application of deep generative models for anomaly detection in complex financial transactions," Proceedings of the 2025 4th International Conference on Artificial Intelligence, Internet and Digital Economy, pp. 133-137, 2025. [CrossRef]
- Y. Wang, "A data balancing and ensemble learning approach for credit card fraud detection," Proceedings of the 2025 4th International Symposium on Computer Applications and Information Technology, pp. 386-390, 2025.
- L. Zhu, W. Cui, Y. Xing, and Y. Wang, "Collaborative optimization in federated recommendation: Integrating user interests and differential privacy," Journal of Computer Technology and Software, vol. 3, no. 8, 2024. [CrossRef]
- Y. Sheng, "Market return prediction via variational causal representation learning" , 2024. [CrossRef]
- B. Zhang, M. Tao, "Design and Implementation of a Multi-factor Intelligent Mining System for Stocks Based on GA-TGCN," IEIE Transactions on Smart Processing & Computing, vol. 14, no. 2, pp. 178-190, 2025. [CrossRef]
- R. Feng, S. Jiang, X. Liang, et al., "STGAT: Spatial–Temporal Graph Attention Neural Network for Stock Prediction," Applied Sciences, vol. 15, no. 8, 4315, 2025. [CrossRef]
- W. Bao, Y. Cao, Y. Yang, et al., "Data-driven stock forecasting models based on neural networks: A review," Information Fusion, 102616, 2024. [CrossRef]
- Z. Chi, J. Gao, C. Wang, "Global Stock Market Volatility Forecasting Incorporating Dynamic Graphs and All Trading Days," arXiv preprint arXiv:2409.15320, 2024. [CrossRef]
Figure 1.
Overall model architecture diagram.
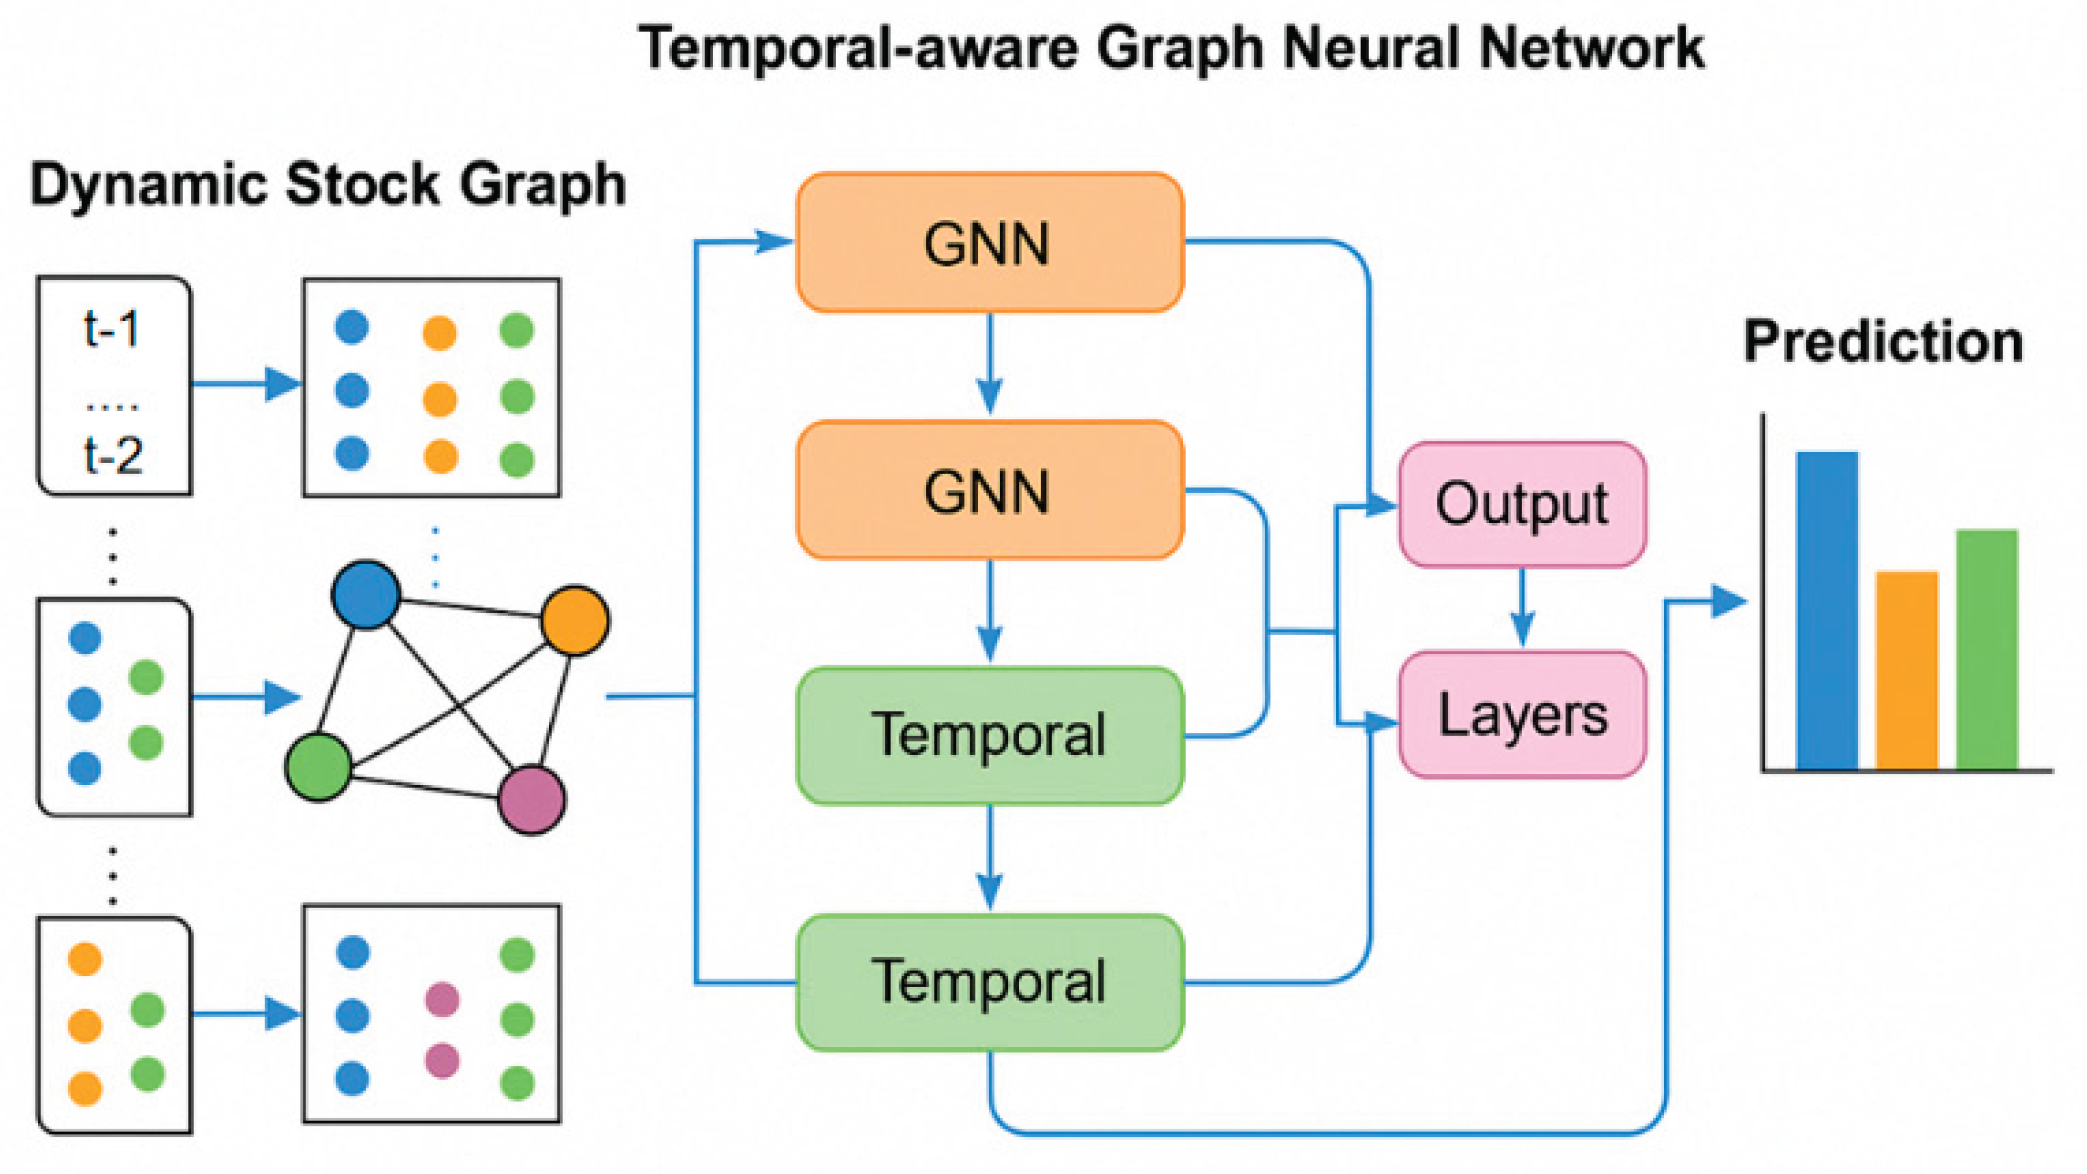
Figure 2.
DSG module architecture.
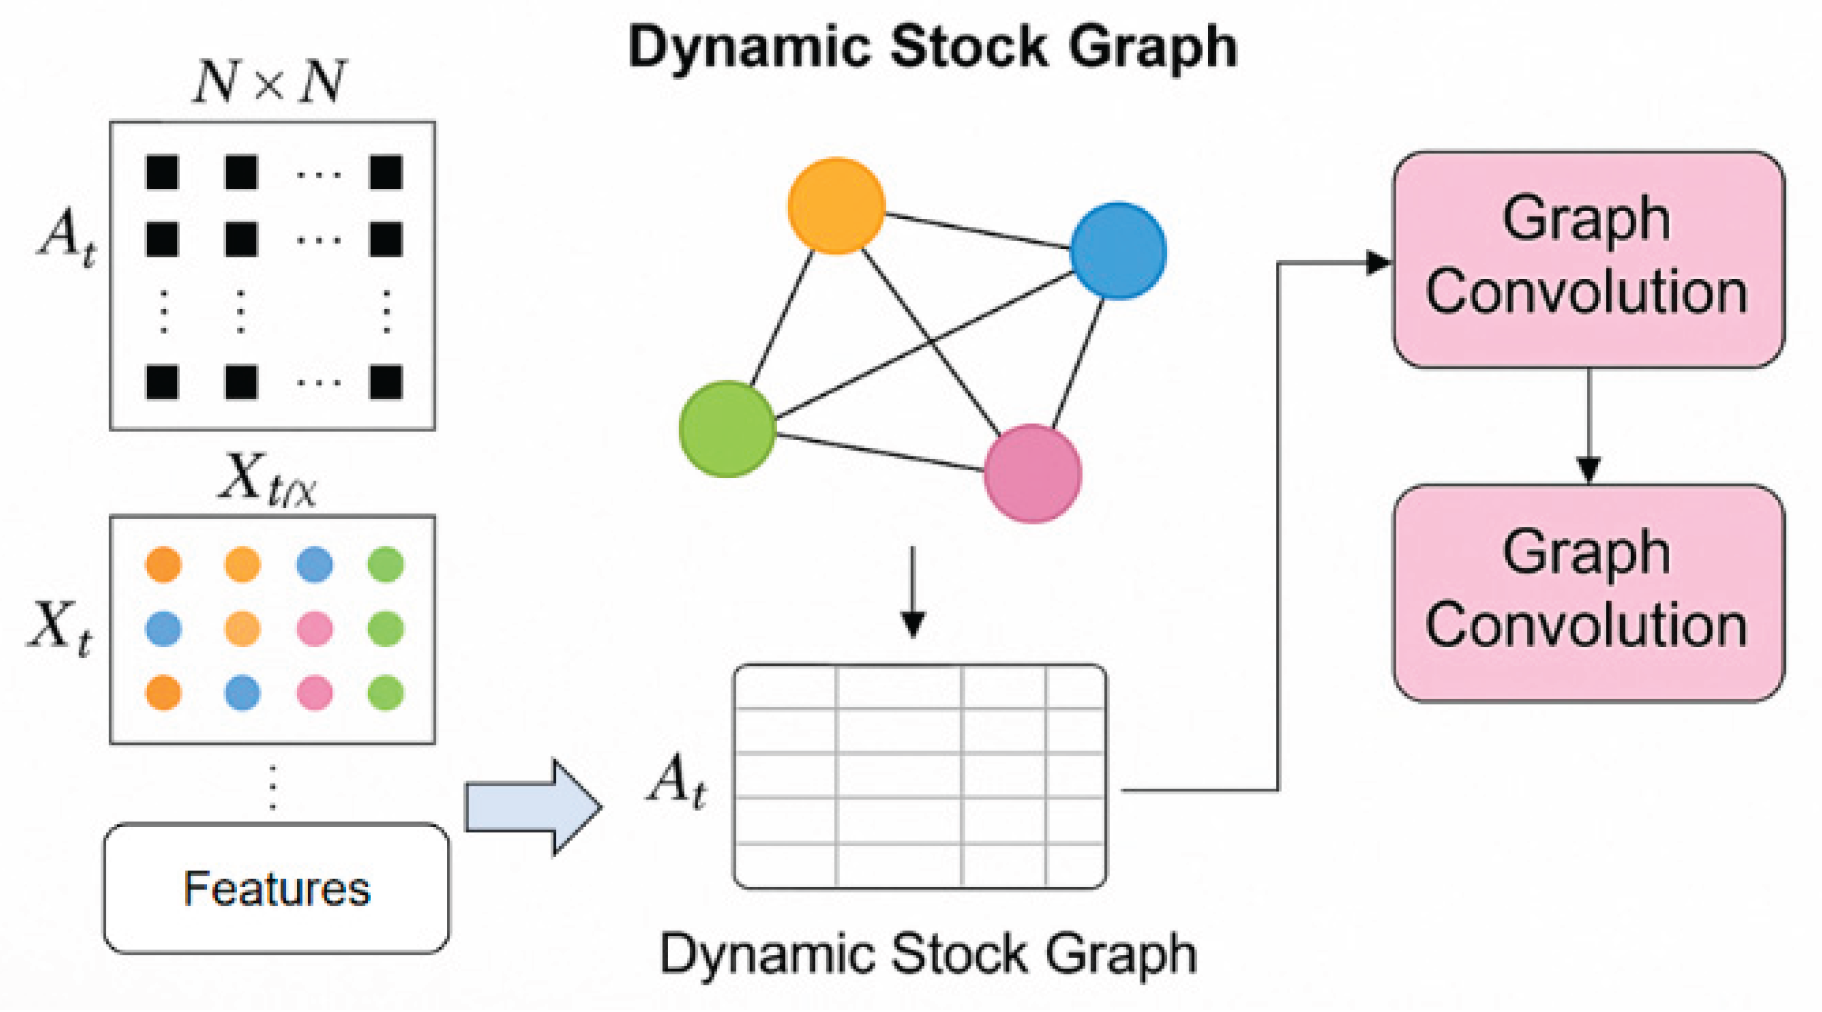
Figure 3.
TGMM Module Architecture.
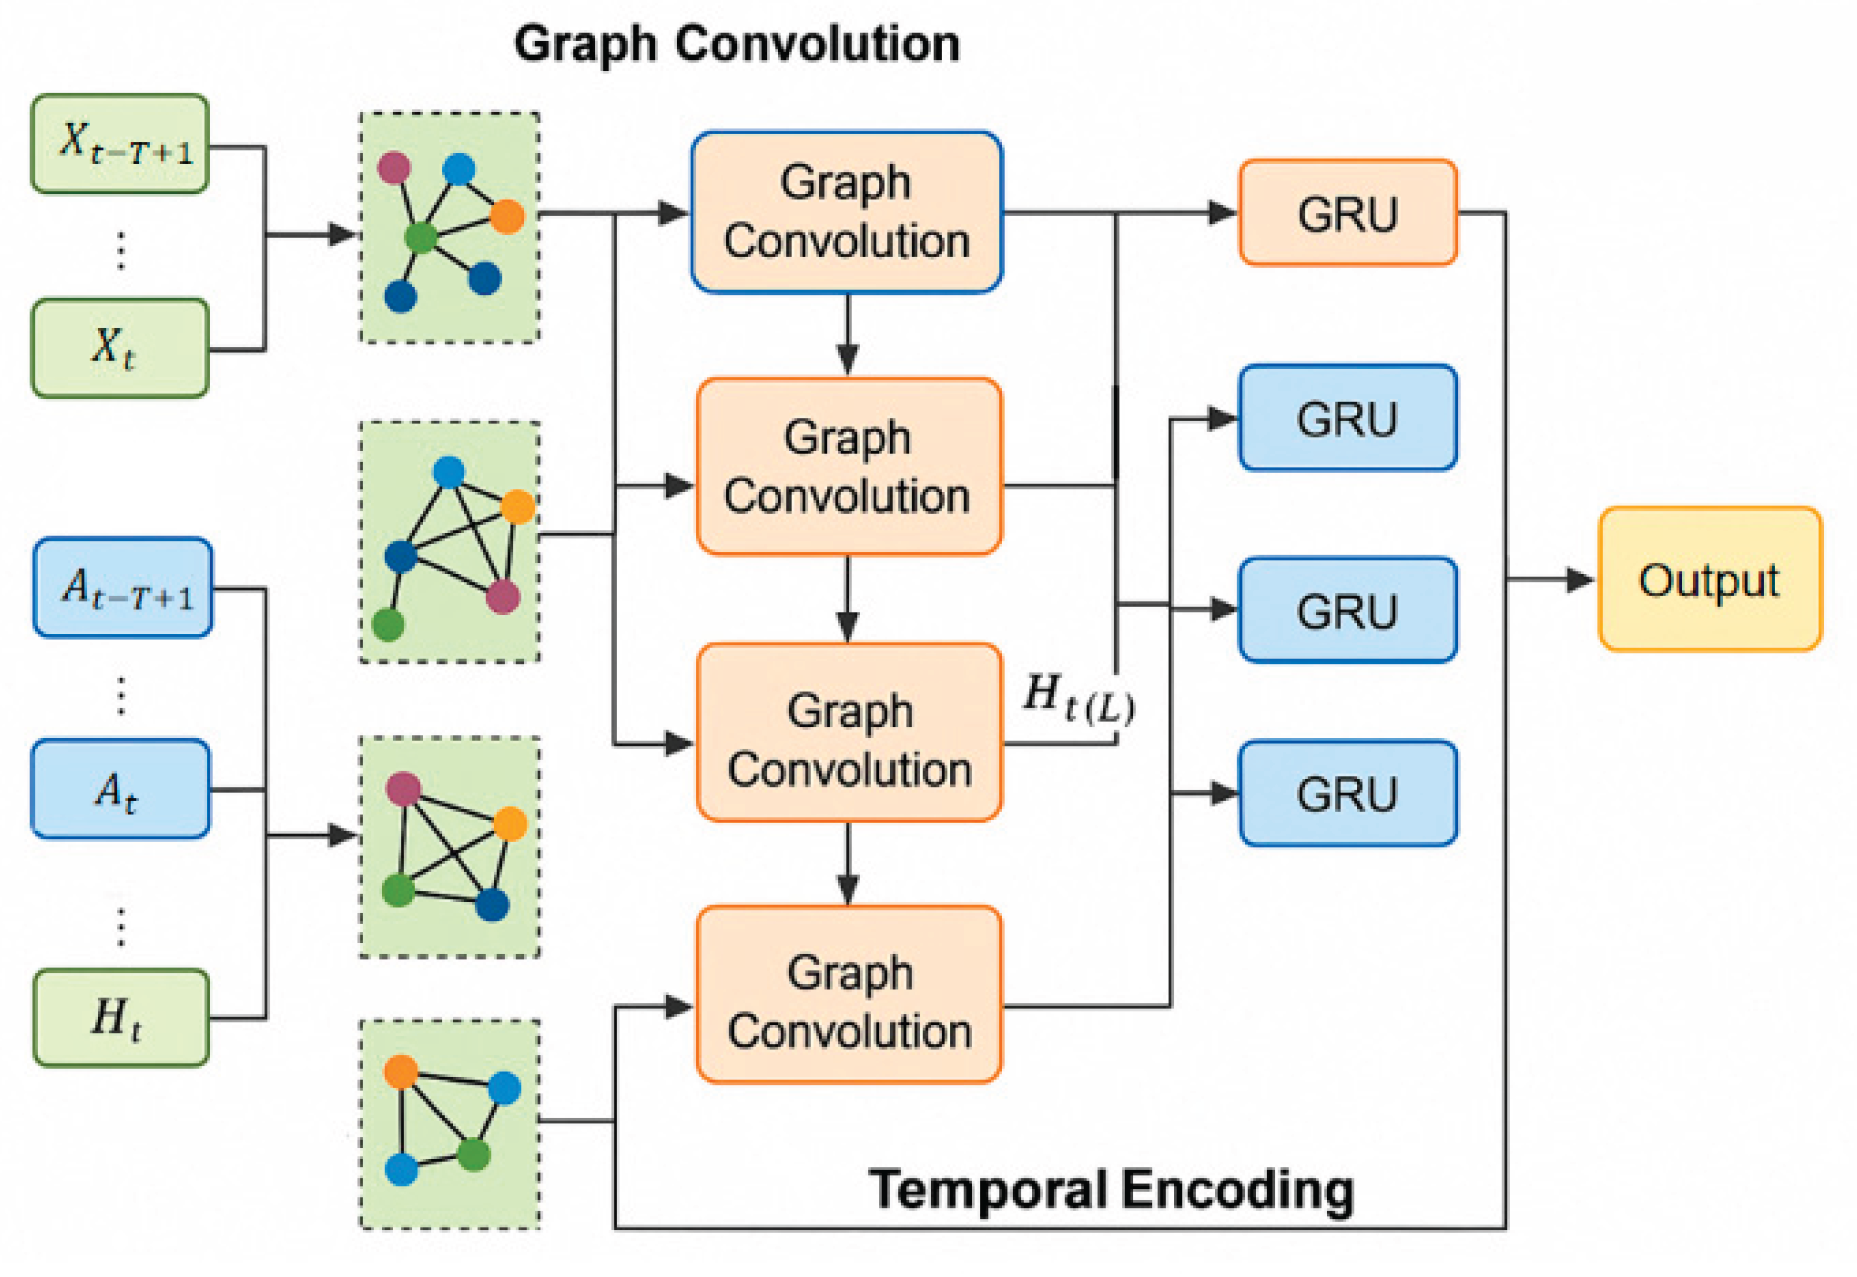
Figure 4.
Stability test of the model in bull and bear market stages.
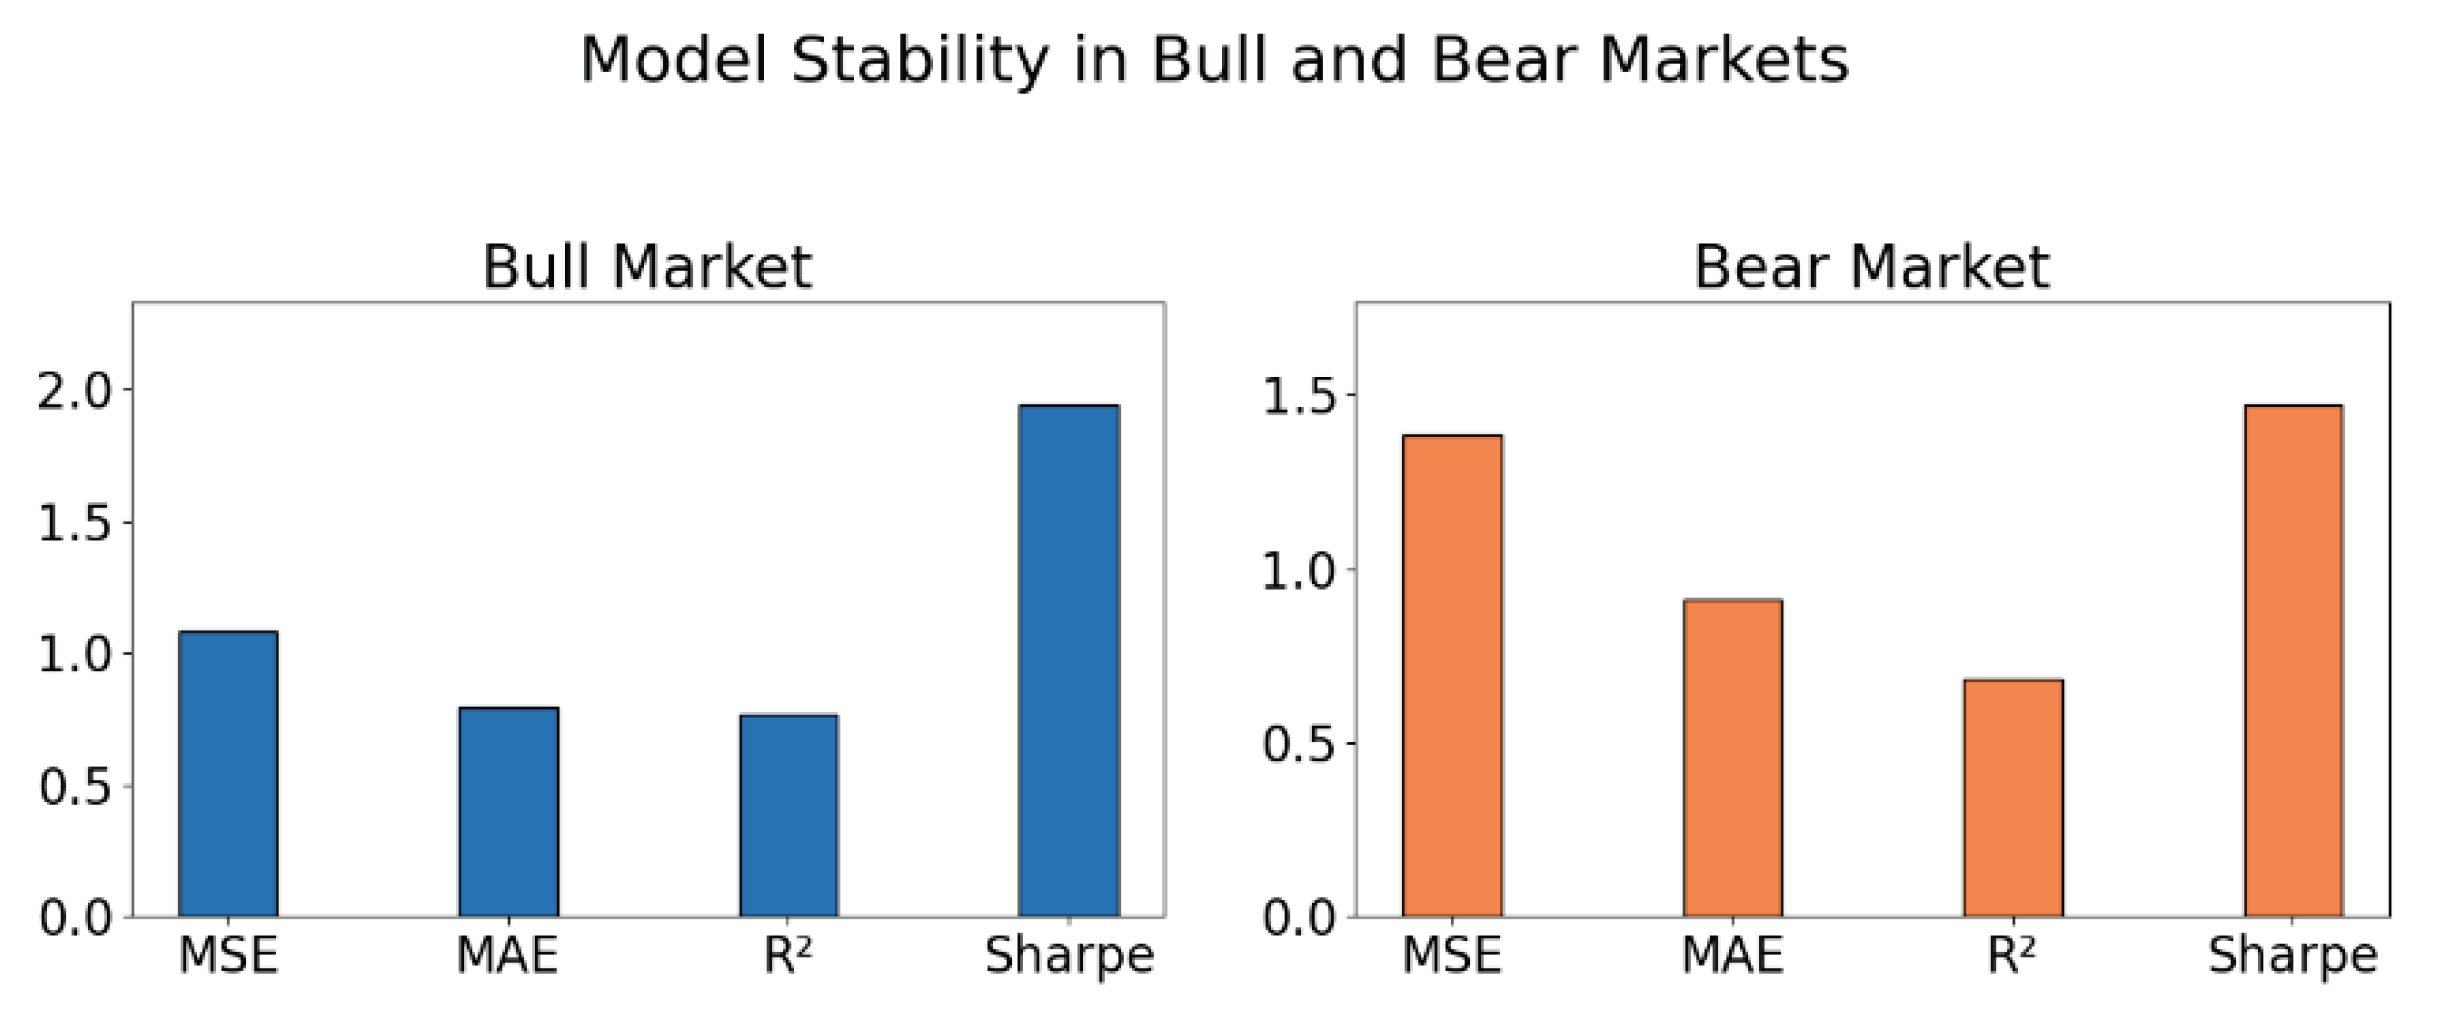
Figure 5.
Robustness experiment under noise disturbance.
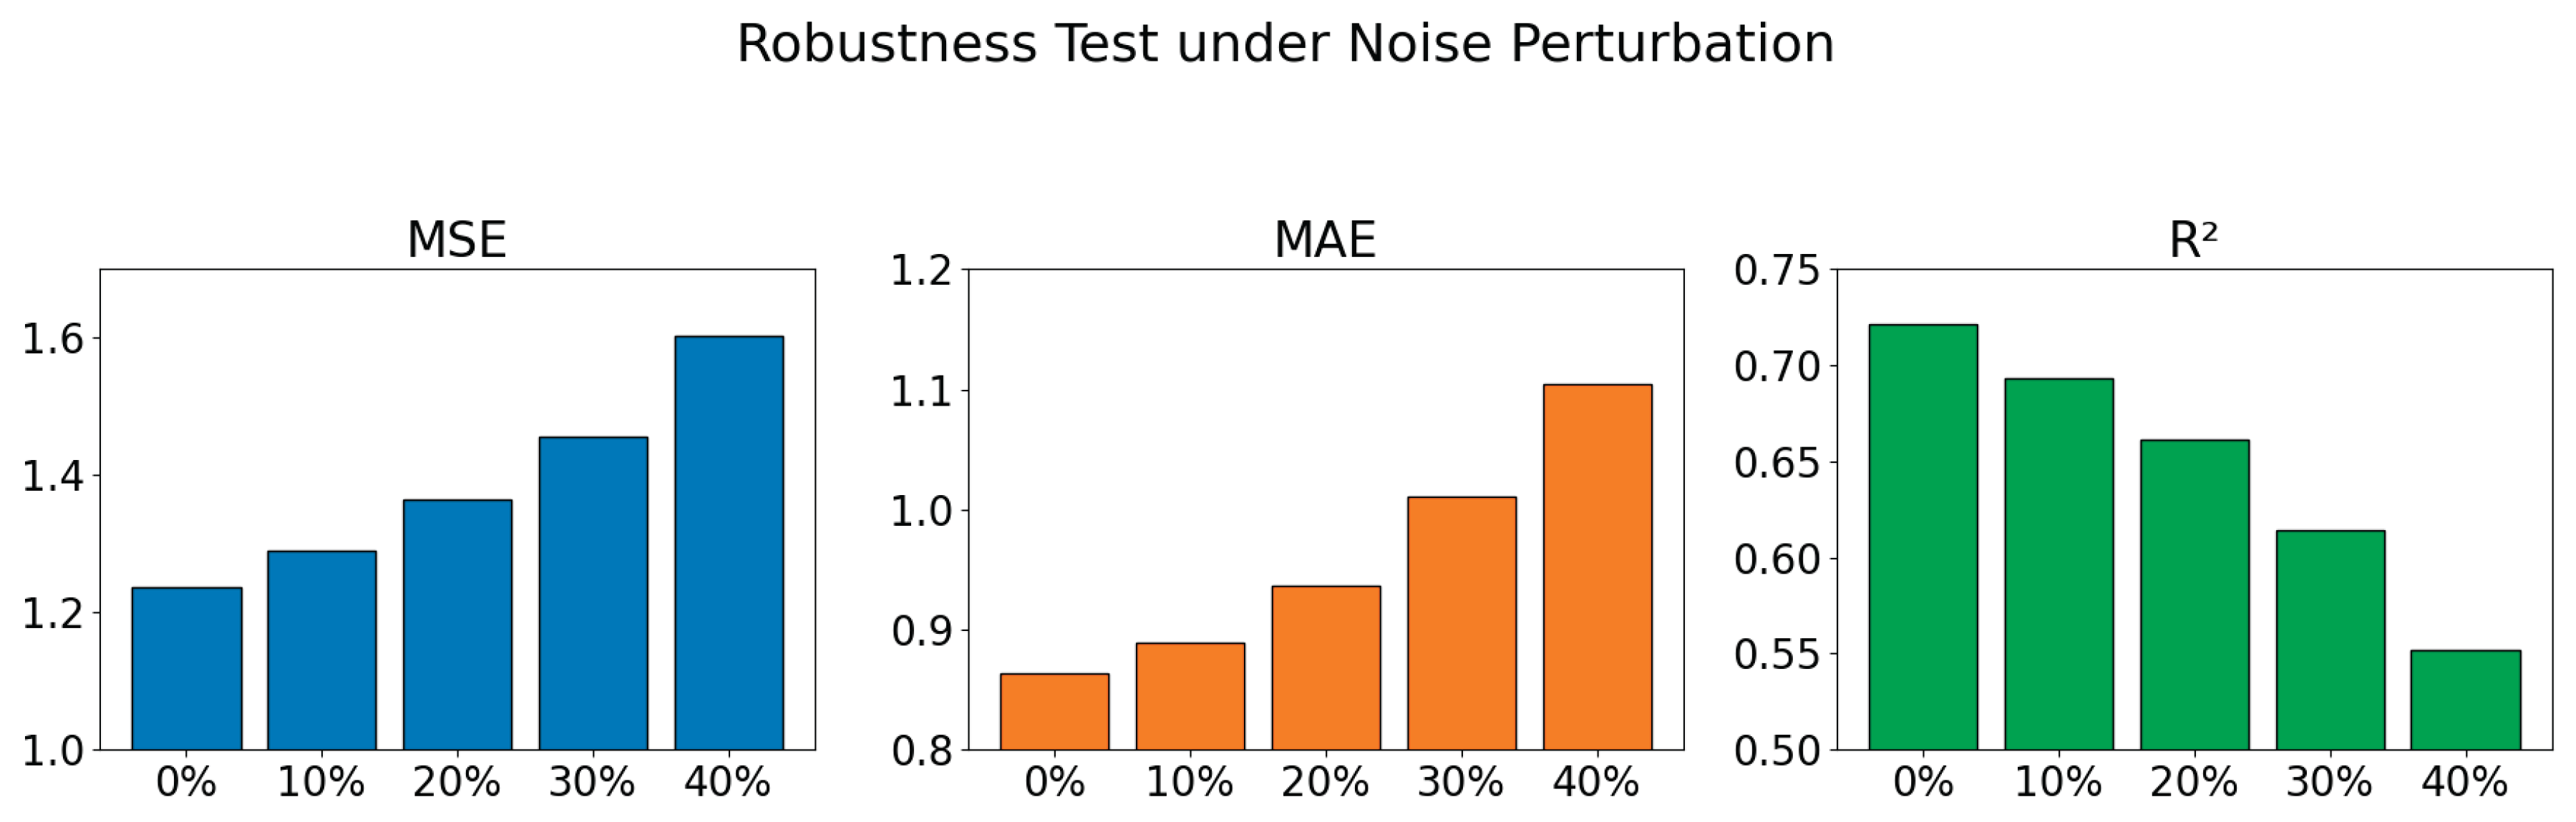
Figure 6.
Evaluation of the model's generalization ability in different market sectors.
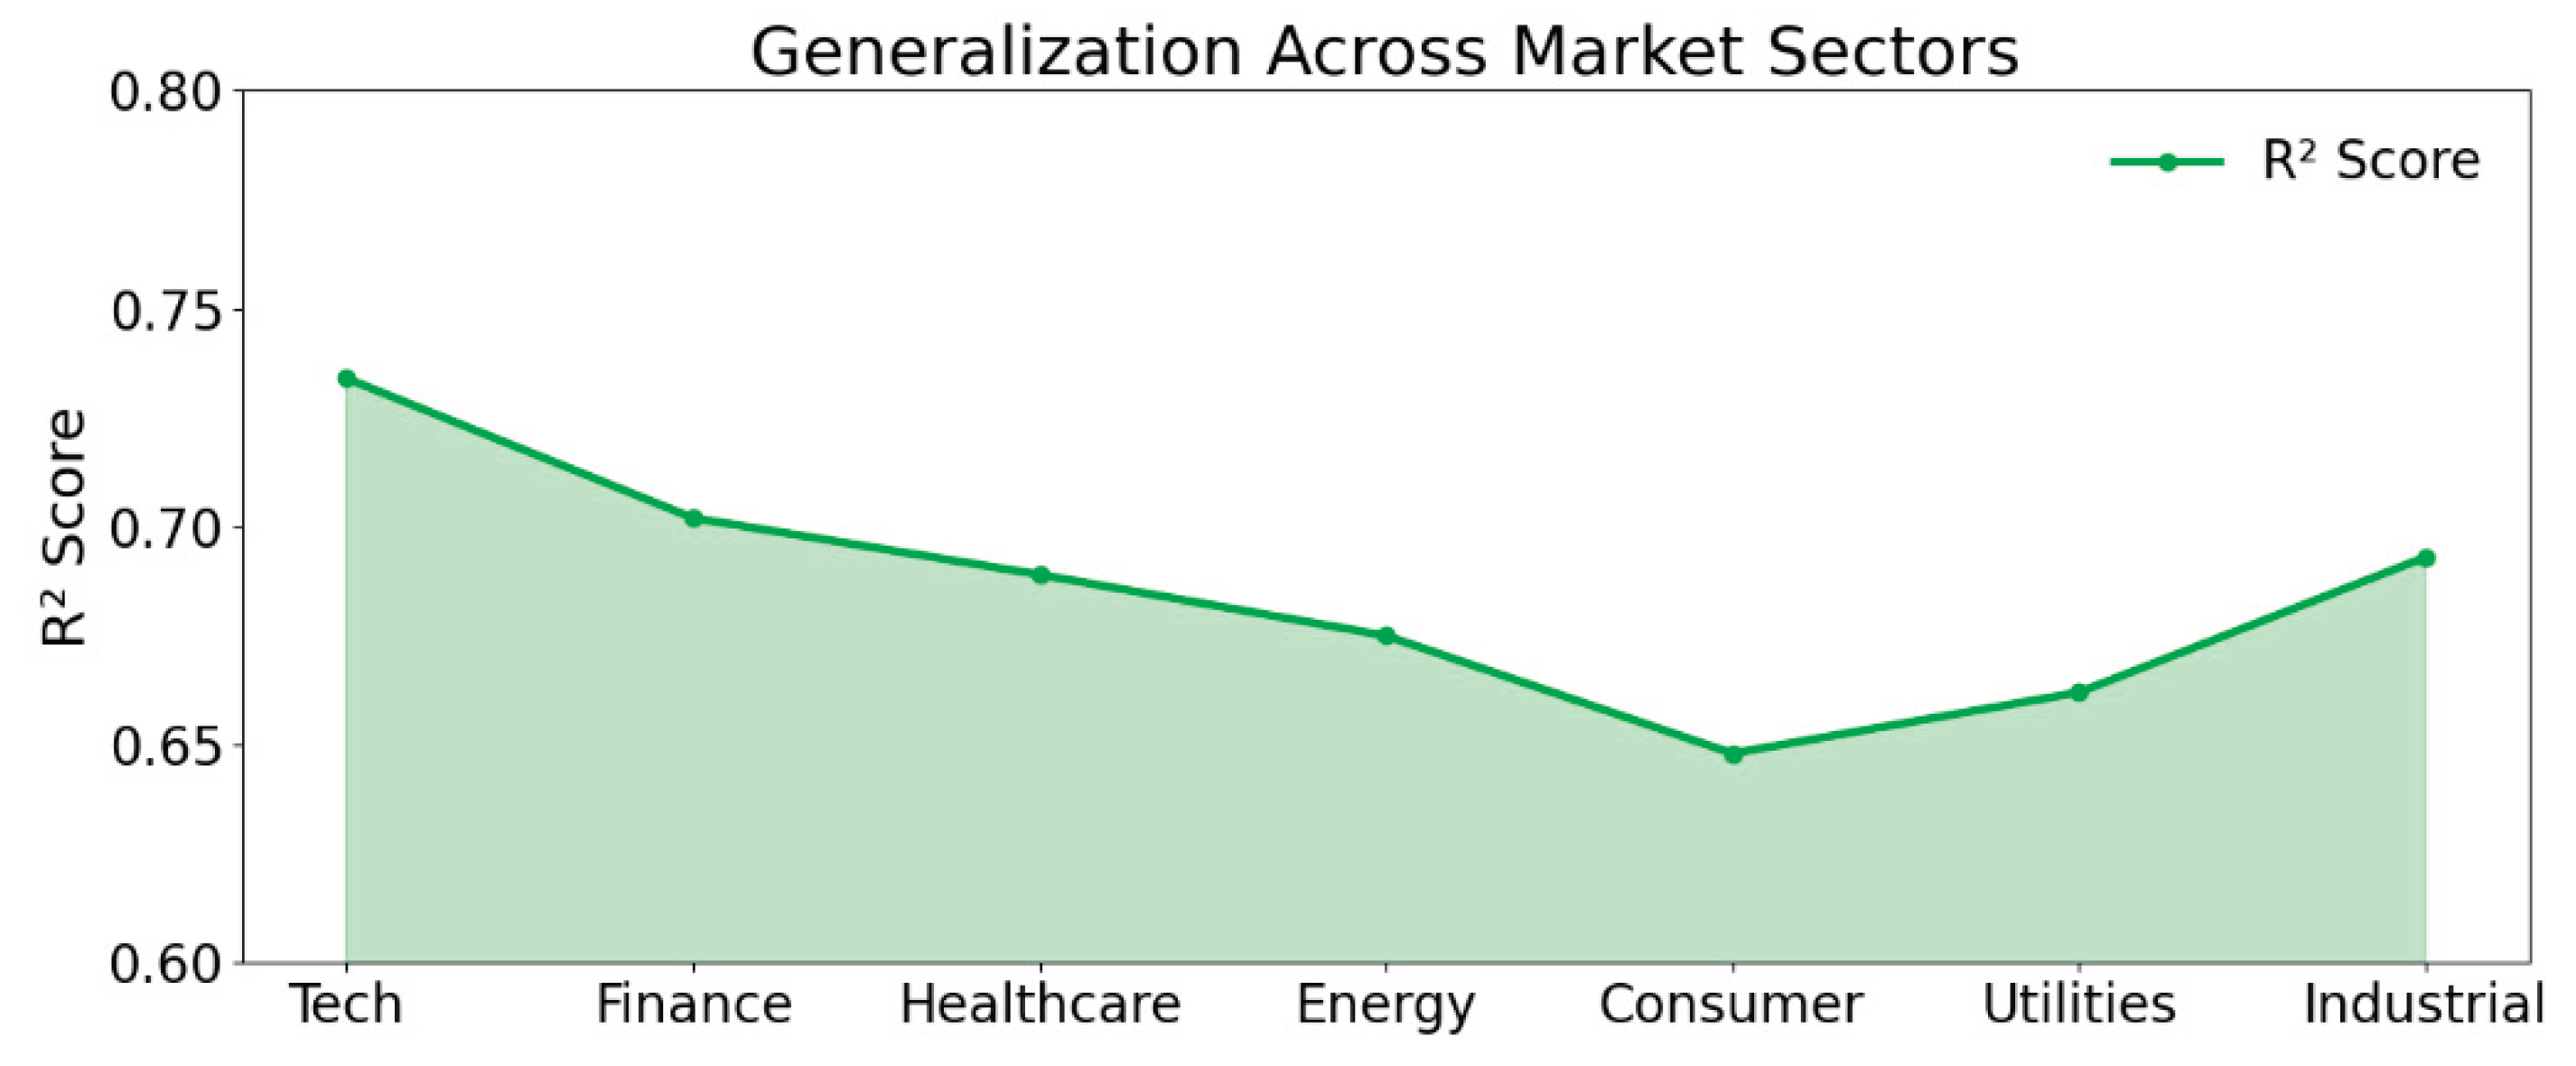

Table 1.
Comparative experimental results.
| Method | MSE | MAE | R2 |
|---|---|---|---|
| T-GCN [42] | 1.394 | 0.921 | 0.652 |
| GAT [43] | 1.512 | 0.978 | 0.605 |
| GAT-LSTM [44] | 1.476 | 0.973 | 0.611 |
| DCRNN [45] | 1.582 | 1.002 | 0.589 |
| Ours | 1.237 | 0.864 | 0.721 |
Table 2.
Ablation Experiment Results.
| Method | MSE | MAE | R2 |
|---|---|---|---|
| Baseline | 1.684 | 1.108 | 0.482 |
| +DSG | 1.452 | 0.987 | 0.588 |
| +TGMM | 1.369 | 0.929 | 0.635 |
| Ours | 1.237 | 0.864 | 0.721 |
Disclaimer/Publisher’s Note: The statements, opinions and data contained in all publications are solely those of the individual author(s) and contributor(s) and not of MDPI and/or the editor(s). MDPI and/or the editor(s) disclaim responsibility for any injury to people or property resulting from any ideas, methods, instructions or products referred to in the content. |
© 2025 by the authors. Licensee MDPI, Basel, Switzerland. This article is an open access article distributed under the terms and conditions of the Creative Commons Attribution (CC BY) license (http://creativecommons.org/licenses/by/4.0/).
Copyright: This open access article is published under a Creative Commons CC BY 4.0 license, which permit the free download, distribution, and reuse, provided that the author and preprint are cited in any reuse.


