
Submitted:
29 May 2025
Posted:
11 June 2025
You are already at the latest version
Abstract
Stock Market Volatility (SMV) study with an AI diagnosis model examines stock market movements with artificial intelligence to detect changes, forecast trends, and evaluate risks in order to make wiser financial decisions. Investors, analysts, and policymakers alike are confronted with stock market volatility because it is dynamic and difficult to predict. Most traditional models do not have the ability to represent dynamic interactions between financial instruments. To counter these challenges, this study suggested a Holographic Multi-Relational Convolutional Graph Neural Network with Circulatory System-Based Optimization (HMRCGN2Nets+CSBO) architecture. Inputs of data are taken from the Stock Market Volatility dataset. These data are preprocessed initially using A Reversible Automatic Selection Normalization (ARASN) method. Features are extracted using Efficient Inception Transformer (EIT). Future Prediction of the SMV with an AI Diagnosis Model is subjected to the Holographic Multi-Relational Convolutional Graph Neural Network (HMRCGN2Nets), again optimized using the Circulatory System-Based Optimization (CSBO). Stock Market Volatility dataset is used to determine how effective the proposed model HMRCGN2Nets+CSBO is, with a whopping accuracy of 99.9% and a 99.8% recall. The proposed method is implemented on the Python platform. The result of the suggested HMRCGN2Nets+CSBO model proved to be outstanding in forecasting stock market volatility. It successfully improved accuracy and recall over standard techniques and maximized decision-making and risk management techniques in financial markets through sophisticated data processing and predictive methods.
Keywords:
a reversible automatic selection normalization
; circulatory system-based optimization
; efficient inception transformer
; holographic multi-relational convolutional graph neural network
; stock market volatility
1. Introduction
The major impacts of stock market volatility raise concern among investors and financial analysts along with policymakers (Rahmani 2023; Amir Masoud 2023, et al.2023). Price volatility of financial instruments over a given period comes to be called volatility that reflects both market risks and unforeseen elements. Increasing market uncertainty typically triggers enhanced price instability that causes rapid market movements in conjunction with high investment risks (Zhang 2023; Yue-Jun 2023; Han Zhang 2023; Rangan Gupta 2023). Stock market volatility calls for expertise for the traders to come up with sound strategies as well as well-tested risk control structures and make logical investment choices. Financial market prediction calls for high-level analysis due to the fact that they are unpredictable but ride on many economic indicators combined with world events as well as emotions of the investors as per studies (Liu 2023; Fang 2023; Muhammad Umair 2023; Junjun Gao 2023). Previous data collections of prices determine statistical rules for market returns as the bases of such predicting models (Wu 2023; Feng-lin 2023; et al.2023). Investigations by configurations ongoing unveil market patterns still effectively but find detection of more complex market non-linear relations coupled with speedy markets changes in line with current problems (Salisu2022; Afees A.2022; et al.2022; Bakry2022; Walid 2022). Methods of conventional prediction lack poor performance in the adapting to changing volatility that result due to disruptions and changes in markets, changes in investor beliefs and economic disruption. Advanced development of artificial intelligence opens up opportunities for enhancing forecasting accuracy and responsiveness of volatility via research in (Liu 2023, Shasha 2023, Huixian Zhao 2023, Gaowen Kong 2023). Refining market conditions and complex pattern recognition are achievable via deep learning and machine learning algorithms that are AI-based per (Liu 2022, Min 2022). Suitable financial data analysis results from machine learning methods because they boost prediction accuracy while revealing otherwise hidden patterns in the data (Chen 2023, Shengming 2023, et al. 2023. Xiuzhen, Xie 2022, Wenxiu Zheng 2022, and Muhammad Umair 2022). AI models for diagnosis are designed to improve volatility prediction through the combination of adaptive learning algorithms with real-time data processing. In contrast to traditional models, AI models can accept a wider range of data inputs, including macroeconomic indicators, market sentiment, news headlines, and social media opinions (Gao 2022, Yang2022, et al.2022.). This allows them to be able to observe the bigger picture of market trends more effectively and respond to new information more easily (Kundu 2022, Srikanta 2022, and Amartya Paul 2022). For example, sentiment analysis based on natural language processing (NLP) enables AI models to quantify market sentiment and predict how investor sentiment might influence future price swings. Beyond this, AI models can leverage ensemble learning, where combinations of different algorithms are employed to improve overall forecasting capability and robustness (Liu 2023, Min 2023, et al. 2023. Khan 2022, Wasiat 2022). Nevertheless, even with these advances, significant challenges remain in applying AI for volatility forecasting. Geopolitics, monetary policy shifts, and unexpected economic shocks are some of the many interconnected variables that affect financial markets and are hard to forecast with precision by any model (Lin 2022, Yu2022; et al.2022). Existing methods, such as GARCH and stochastic volatility models, struggle to handle high-frequency data and nonlinear market behavior, often failing to adapt to sudden market changes and structural shifts effectively. This study aims to address the problems identified.
Novelty As Well As Contribution
The Contribution and Novelty of the paper is as follows:
- ➢
- To develop HMRCGN2Nets+CSBO architecture for improved stock market volatility prediction by enhancing model accuracy and relationship modeling.
- ➢
- To preprocess Stock Market Volatility data using the ARASN approach, aiming to enhance data quality, improve model accuracy, and ensure reversible normalization for better interpretability and consistency in analysis.
- ➢
- To extract key features from Stock Market Volatility data using the Efficient Inception Transformer (EIT).
- ➢
- To predict Stock Market Volatility using an AI Diagnosis Model with HMRCGN2Nets optimized through CSBO, enhancing prediction accuracy, capturing complex relationships, and improving model efficiency for reliable market trend forecasting.
The remaining manuscript is divided into 5 sections: section two, literature review; section three, suggested methods; section four, results and discussion; and section five, conclusion and upcoming projects.
2. Literature Survey
The papers related to A Study of Stock Market Volatility using an AI Diagnosis Model based on neural network methods are given below:
In 2023, Mukherjee, et al. (Mukherjee 2023, Somenath 2023, et al.2023) has introduced CNN-ANN popular models for stock market price prediction. ANN (artificial neural networks) repeats recursively, predicting future the values of data from the previous few days. Significant results have been obtained via deep learning optimization; CNN-ANN both achieved 98.92% and 97.66% accuracy, respectively. CNN (Convolutional neural networks) employs a novel method for evaluating quantized datasets: 2-D histograms. The effectiveness of these algorithms for predicting the stock market was demonstrated by an example investigation regarding the COVID-19 pandemic, which revealed a 91% accuracy rate.
In 2023, Sheth, et al. (Sheth 2023, Dhruhi 2023, Manan Shah 2023) has introduced a LSTM-SVM-ANN based method for stock market prediction. They do have some shortcomings, though, which are being fixed to enhance subsequent outcomes. Because it can take into account intricate, non-linear correlations and patterns, ANNs which depends on neural networks, tend to get the greatest results. Better outcomes are anticipated in the future using Support Vector Machine (SVM), a relatively young technique. A possible disadvantage of Long Short-Term Memory (LSTM) is that it only produces decent results when an expansive dataset is supplied.
In 2023, Chandola, et al. (Chandola 2023, Deeksha 2023, et al. 2023) has presented a Word2Vec-LSTM technique to predict stock values using news headlines and financial time data. The model is designed to assist investors in making more informed decisions by forecasting the trend of stock price movement. The performance of the model is measured by its ability to forecast the direction of change in stock prices for five firms in various industries. This approach addresses the challenges in forecasting stock market conditions due to their volatility and complexity.
In 2023, Zhao, et al. (Zhao 2023, Yanli 2023, Guang Yang 2023) has proposed a SA-DLSTM, a stock market as well as simulation trading prediction hybrid model. It combines long short-term memory models (LSTM), denoising autoencoders (DAE) models, and emotion-enhanced convolutional neural networks (ECNN). The most important features of stock trading data are extracted and enriched with user comments. The method generates reliable sentiment indexes by considering the speed at which emotions shift. The experiment results indicate high return and risk performance along with greater accuracy of prediction, facilitating investors to make informed choices.
In 2023, Mu, et al. (Mu 2023, Guangyu 2023, et al. 2023) has presented a MS-SSA-LSTM method for forecasting stock prices that integrates deep learning, swarm intelligence, and sentiment analysis. It optimizes the Long and short-term memory network (LSTM) parameters using the Sparrow Search Algorithm and a special sentiment vocabulary from the East Money forum. The model has a high degree of universal applicability and performs better than other models. The study discovered that China’s significant market instability makes it appropriate for short-term prediction, that LSTM hyperparameters may be optimized via SSA, and that adding an emotional index improves predictive performance.
In 2023, Han, et al. (Han 2023, Yechan 2023, Jaeyun Kim 2023, David Enke 2023) has introduced an N-Period Min-Max (NPMM) branding method to get around price change sensitivity, which labels data at particular time points. Additionally, it creates an automatic trading system with XGBoost. The approach is compared to other well-known labeling techniques and tested on 92 NASDAQ companies. According to the study, NPMM is an effective and superior technique for predicting stock price trends.
In 2022, Jiao, et al. (Jiao 2022, Xingrui 2022, et al.2022) has presented a text mining-based neural network PSO-LSTM model for forecasting crude oil market volatility. Textual components from news headlines, such as risk factors, sentiment toward investor’s classifications, and emotional polarity score, are combined with other market actions to improve forecasting results. A deep learning LSTM model is optimized using PSO (particle swarm optimization) to enhance predicting. The study found that the PSO-LSTM strategy reduced predicting accuracy as well as MAE by 5.12% as well as 6.77%, respectively, when compared to the PSO-LSTM strategy that excluded textual features. Table 1 provides a summary of the examined methodology.
Problem Statement
Stock market volatility presents significant challenges for investors and financial analysts due to its unpredictable nature and complex underlying factors. Traditional models often fail to capture the dynamic, multi-relational, and interconnected structure of financial markets, leading to suboptimal predictions and increased risk. Hierarchical structures and multi-relational dependencies in the patterns of stock market data pose great challenges to today’s deep learning models in realizing their fullest capabilities. Also, the durability and accuracy of the predictions provided by these models are further limited due to a lack of a suitable optimization system. To deal with these difficulties, this paper presents an AI-diagnosis model via a Holographic Multi-Relational Convolutional Graph Neural Network with Circulatory System-Based Optimization (HMRCGN2Nets+CSBO) approach. The model seeks to encapsulate the intricate, interdependent relationships of stock market data and enhance the accuracy of volatility prediction through the use of multi-relational graph structures and biologically inspired optimization techniques, thus facilitating better decision-making and risk management approaches.
3. Proposed Methodology
This part presents the Holographic Multi-Relational Convolutional Graph Neural Network with Circulatory System-Based Optimization (HMRCGN2Nets+CSBO), a new framework specifically designed to analyze SMV via an advanced AI Diagnosis Model. The introduced model adopts a structured five-stage method to make sure of correct and reliable prediction: (1) Data Collection – Collects in-depth and applicable data from the Stock Market Volatility Dataset in order to develop a robust platform for analysis. (2) Preprocessing –Enhances the quality of data by handling missing values, removing outliers, Cleans, normalizes, and ensuring consistency. (3) Feature Extraction – Finds and identifies important patterns, trends, and contributing factors from the preprocessed data to improve model performance. (4) Prediction – Uses the extracted features to make precise predictions regarding stock market volatility. (5) Optimization – Enhances prediction accuracy by dynamically adjusting model parameters through a circulatory system-based optimization approach, ensuring adaptive learning and improved performance over time. Figure 1 illustrates the detailed workflow of the suggested HMRCGN2Nets+CSBO model, highlighting the interaction between different stages and the continuous feedback loop that refines the model’s predictive capabilities.
3.1. Data Collection
In this research, the input data comes from the Stock Market Volatility Dataset. The Stock Market Volatility Dataset contains 5,000 daily records from 2020 to the present, capturing key financial indicators for AI-driven volatility analysis. It includes 10 features: Date, Stock_Price ($50-$500), Trading_Volume (1,000-1,000,000), Market_Index (1,000-5,000), Volatility (0.5-5), Sentiment_Score (-1 to 1), AI_Volatility_Prediction (Low, Medium, High), AI_Confidence_Score (0.60-0.99), Economic_Indicator (50-150), and News_Impact_Score (0-1). The dataset is structured for financial forecasting and AI-based market trend studies.
The data under consideration in this study undergo extensive preprocessing, which is thoroughly explained in the following discussions.
3.2. Pre-Processing Using A Reversible Automatic Selection Normalization (ARASN)
The RASN framework preprocesses stock market data using adaptive normalization, utilizing the z-score, interval, integer calibration, and min-max techniques to standardize data, improve consistency, and enhance model training and prediction accuracy. A Reversible Automatic Selection Normalization (ARASN) (Jin 2022, Xuebo 2022, et al. 2022) approach is to preprocess stock market volatility data for improving the prediction performance of an AI-based diagnosis model. The RASN framework includes some parts as below,
- Adaptive Normalization Layer
This layer processes input data using four different normalization methods to enhance data consistency and correlation, The Min-Max Normalization scales data between 0 and 1, it is given by equation (1):
The Interval Normalization scales data to a specific range, is given by equation (2):
The Decimal Calibration scales data based on the decimal position is given by equation (3):
The Z-Score Normalization scales data to have zero mean and unit variance is given by equation (4):
The layer calculates key statistics (mean, variance, min, max, decimal shift) using an exponentially weighted average to adapt to changing data patterns is given by equation (5):
- Adaptive Inverse Normalization Layer
Adaptive Inverse Normalization Layer performs the reverse of the normalization process to restore data to its original scale after prediction. It uses trainable scaling and a translation factor to adapt to nonstationary data is given by equation (6):
- Normalization Method Selection Module
Selects the best normalization method based on the lowest error values, it is given by equation (7):
The RASN framework preprocesses stock market data using adaptive normalization, which applies four methods to handle different data characteristics. A GRU-based deep learning model captures time-series dependencies effectively. Adaptive renormalization ensures reversibility and consistency by restoring normalized data to its original scale. The choice module cross-compares prediction performance by RMSE and MAE, and chooses the optimum normalization scheme for improving the accuracy of the predictions. The technique of feature extraction is utilized for extracting essential features from data and the summary is given below.
3.3. Feature Extraction Using Efficient Inception Transformer (EIT)
Following preprocessing, feature extraction takes place. The Efficient Inception Transformer (EIT) (Fu 2022, Lihua 2022, et al.2022) is an advanced feature extraction model derived from the Inception Transformer framework. It integrates the benefits of both convolutions as well as self-attention operations in handling complex time-series data, such as stock exchange volatility. Time-series data with dimensions constitute the input data set. Fine-grained temporal models are crucial to the stock market volatility analysis, and this allows the model to extract them. The Enhanced Feed-Forward Network (E-FFN) and Inception of Multi-Head Self-Attention (Incep-MHSA) blocks from the encoder.
- Incep-MHSA
Inspired by InceptionNet, Incep-MHSA processes input through three parallel branches: Depth-wise convolution with kernel size to capture local dependencies is given by equation (8):
Depth-wise convolution with kernel size for spatial context is given by equation (9):
Average pooling followed by depth-wise convolution to capture broader patterns given by equation (10):
The combined feature map is flattened and concatenated equation (11):
- E-FFN
The feed-forward network enhances feature representations using 2D locality. First, the input sequence is reshaped into a 2D feature map is given by equation (12):
The decoder reconstructs the output by upsampling and combining multi-scale features: Features at each scale are upsampled to a common size and concatenated.
The Efficient Inception Transformer (EIT) model effectively captures both short-term (fine-grained) and long-term (coarse) patterns in stock market data, including price trends, market momentum, and volatility spikes. By combining convolution for local patterns and self-attention for global dependencies, it reduces computational complexity through depth-wise convolutions and multi-scale feature extraction. This enables improved attention to key market movements and enhances the model’s ability to predict sudden market changes, leading to more accurate forecasting of stock market volatility. These features are subsequently utilized to predict Stock Market Volatility using an AI Diagnosis Model, with detailed explanations provided below.
3.4. Prediction Using Holographic Multi-Relational Convolutional Graph Neural Network (HMRCGN2Nets)
The HMRCGN2Nets model improves feature handling of the extracted features through the incorporation of a Holographic Convolutional Neural Network (HCNN) and a Multi-Relational Graph Attention Network (MRGAT) for predicting Stock Market Volatility via an AI Diagnosis Model. In order to improve predictive precision, we present the Holographic Multi-Relational Convolutional Graph Neural Network (HMRCGN2Nets) model. A marriage of the above two architectures taps both convolutional learning and graph relational attention based on the concept to capture both spatial, temporal, and relational dependencies within the data in stock markets. Below is a vivid description of the proposed approach,
3.4.1. Holographic Convolutional Neural Network (HCNN)
A Holographic Convolutional Neural Network (HCNN) (Wagner 2019, Kelvin H.2019, Sean McComb 2019) is an optical neural network structure based on holography and convolution to handle intricate data. In stock market volatility prediction, an HCNN can facilitate high-throughput computation.
The input signal represents the optical neural activity at position and wavelength. The field is a weighted sum of Gaussian pixel spots with width and spacingis given by equation (13):
where, neural activity at position . Gaussian spot function. is wave vector. is angular frequency. lens axis offset. This field undergoes a Fourier transform using a lens of focal length, producing the Fourier-domain signal is given by equation (14):
where, Fourier transform of Gaussian beam. is a weight parameter. is a bias parameter. A polarization-switching phase-conjugate reflector (PCM) is used to phase-conjugate the output signal. Photorefractive interference is used to dynamically record the convolutional weights in a holographic material: The convolutional weights are dynamically adjusted as a result of the interference between the backpropagated error signal and the phase-conjugated forward beam.
An HCNN uses pixel-based optical patterns to encode historical market data, such as stock prices and trading volume, in order to forecast stock market volatility. During forward propagation, this data is processed through dynamic holographic convolutional layers to extract market patterns. Phase-conjugation in backpropagation adjusts error signals based on market fluctuations. The holographic recording dynamically updates convolution weights to improve accuracy. The trained HCNN then predicts future volatility by analyzing the learned market patterns in real-time with high computational throughput. HCNN-based stock market prediction relies on dynamic optical learning, where holographic interference enables adaptive adjustment of convolutional weights providing fast, high-throughput insights into market volatility.
3.4.2. Multi-Relational Graph Attention Network (MRGAN)
A graph-based deep learning model called Multi-Relational Graph Attention Network (MRGAT) (Dai 2022, Guoquan 2022, et al.2022) is capable of efficiently capturing the intricate connections and relationships among various items in a knowledge graph. MRGAT portrays the financial sector as a homogenous graph, with nodes standing for financial companies and edges for relationships, when used to anticipate stock market volatility. A stock market can be represented as a multi-relational directed graph is given by equation (15):
where, set of entities (e.g., stocks, companies). set of edge types (e.g., correlation, causation). set of edges (e.g., specific relationships between entities). An edge means that there is a relationship of type between node and node . Figure 2 shows the architecture of MRGAT,
- Encoder
MRGAT uses an Encoder-Decoder framework, where the encoder learns node embeddings by aggregating neighborhood information using attention. To handle multiple types of relationships in a heterogeneous graph, MRGAT defines separate query and key matrices for each relation type. For a central node and its neighbor with relation, the query and key vectors are computed as equation (16 and 17):
where, embeddings of nodes. trainable query and key matrices for relation .dimension of query and key vectors. The attention score is calculated using the dot product between the query and key vectors is given by equation (18):
The aggregation module combines the neighborhood information based on the attention scores given by equation (19):
where, attention score of neighbour. For multi-head attention, the embeddings from multiple attention heads are concatenated. To retain the original node information, a residual connection is applied is given by equation (20):
where, is an activation function (e.g., ReLU).
- Decoder
The decoder predicts stock market volatility based on the node representations generated by the encoder. MRGAT adopts Conv-TransE as the decoder, which captures entity-relationship interactions using convolutional layers. The score for the triplet is passed through a sigmoid function to generate a probability is given by equation (21):
In stock market volatility prediction using MRGAT, nodes represent stocks, market indicators, and external factors, while edges capture relationships like correlations, market events, and dependencies. The encoder generates embeddings that encode both neighborhood and global structural information using a multi-relational attention mechanism, which assigns different importance to various relationships. The decoder then computes the probability of a stock experiencing high or low volatility based on these learned embeddings, enabling more accurate and context-aware predictions. MRGAT can predict stock market volatility by learning the dynamic relationships between stocks, market indicators, and external factors, leading to more accurate and context-aware predictions.
The HCNN module takes local temporal patterns and market indicators by convolving historical stock prices with convolutional layers, effectively extracting short-term trends and patterns. The MRGAT module captures intricate cross-asset dependencies and market organizations with graph attention, enabling the model to emphasize important inter-stock relationships and market drivers. The integration of HMRCGN2Nets improves the model’s capacity to predict volatility under multi-relational, nonlinear environments by combining both temporal and relational knowledge, resulting in more precise and reliable predictions. In order to enhance the precision of predictions while reducing error rates, processing time, complexity, and expenses, the CSBO approach optimizes the HMRCGN2Nets model. The major steps in optimizing the HMRCGN2Nets model include:
3.5. Optimization Using the Circulatory System Based Optimization (CSBO)
CSBO is applied with this method in order to tune the weight parameters of the model HMRCGN2Nets. Through their dynamic adjustment, the performance of the model increases, while that of bias can be reduced at the minimum, minimizing costs, computational complexity, processing time, and error rate. The algorithm Circulatory System Based Optimization (CSBO) (Ghasemi 2023, Mojtaba 2023, et al.2023) simulates human body blood circulation and the blood flow process as a means for optimizing solutions to a search space. Below is a structured explanation of the CSBO algorithm, including key steps for hyperparameter optimization of the HMRCGN2Nets method, Figure 3 provides a detailed, step-by-step explanation of the CSBO approach.
Step1: Initialization
Define the search space for the hyperparameters of HMRCGN2Nets. Initialize the population of blood masses with size using a random function within the defined problem range is given by equation (22):
where, and are minimum and maximum bounds for hyperparameters. number of hyperparameters (dimensions), random vector between 0 and 1.
Step 2: Generation of Random Variables
Generation of random variables involves creating numerical values from a defined probability distribution (e.g., uniform, normal) to introduce randomness in optimization, enabling diverse exploration of the search space.
Step 3: Evaluation of Fitness Function
Fitness function that evaluates the performance of the HMRCGN2Nets model based on the given hyperparameters. It aims to enhance model performance by minimizing the error rate and maximizing accuracy. This optimization process is mathematically expressed in Equation (23):
where, is used to reduce cost, computational complexity, processing time, and error rate, while simultaneously improving accuracy.
Step 4: Exploration to improve accuracy
Exploration in optimization refers to the process of searching new, unvisited regions of the solution space to discover diverse solutions and avoid getting trapped in local optima.
- Blood Mass Movement in the Veins
Each blood mass moves based on the imposed force or pressure, which reflects the gradient of the fitness function, is given by equation (24):
where, determines the direction of movement is given by equation (25):
where, random value between 0 and 1 controlling step size. ,, blood masses with different fitness values
Step 5: Exploitation to lower the cost, computational complexity, processing time, and error rate
Exploitation in optimization refers to refining and improving existing solutions by focusing on promising areas of the search space, using knowledge gained from previous evaluations to converge toward the optimal solution.
- Pulmonary Circulation (Weaker Population Improvement)
Weaker blood masses (solutions) enter pulmonary circulation to improve their fitness is given by equation (26):
where, random normal number, random value from Cauchy distribution. Step size is adjusted for this weaker population is given by equation (27):
- Systematic Circulation (Strong Population Refinement)
Better solutions circulate systematically to explore better regions is given by equation (28):
Update step size based on fitness is given by equation (29):
where, and best and worst fitness values in the current iteration
Step 6: Termination
Repeat exploration and exploitation until maximum number of iterations reached or no significant improvement in the fitness value over several iterations or Convergence threshold is met.
This section presents a comprehensive framework for predicting SMV using an AI-based Diagnostic Model built on a Holographic Multi-Relational Convolutional Graph Neural Network with Circulatory System-Based Optimization (HMRCGN2Nets+CSBO). The model integrates advanced techniques to improve accuracy and reliability. Data preprocessing is managed by ARASN, which effectively addresses inconsistencies and noise, ensuring high-quality input data. Detailed patterns and relationships within the data are captured through EIT-based feature extraction. The HMRCGN2Nets model delivers optimal predictions, further refined through CSBO for enhanced performance. The following section explores the results in detail, demonstrating the effectiveness and broader implications of this predictive framework.
4. Results and Discussions
This section presents the results and evaluation of the suggested method, which was executed in Python. Table 2 provides specifics on the implementation parameters.
4.1. Dataset Descriptions
This section provides an in-depth analysis of predicting stock market volatility using an AI-driven Diagnostic Model. The study utilizes the Stock Market Volatility dataset, with further details about the dataset provided in the following sections.
Stock Market Volatility Dataset
The Stock Market Volatility Dataset contains 5,000 daily records from 2020 to the present, capturing key financial indicators for AI-driven volatility analysis. It includes 10 features: Date, Stock_Price ($50-$500), Trading_Volume (1,000-1,000,000), Market_Index (1,000-5,000), Volatility (0.5-5), Sentiment_Score (-1 to 1), AI_Volatility_Prediction (Low, Medium, High), AI_Confidence_Score (0.60-0.99), Economic_Indicator (50-150), and News_Impact_Score (0-1). The dataset is structured for financial forecasting and AI-based market trend studies. Eighty percent of these are utilized for training, and 20 percent are used for testing.
4.2. Performance Metrics
The effectiveness of the proposed HMRCGN2Nets+CSBO method is evaluated by comparing it with several established approaches, including CNN-ANN [16], LSTM-SVM-ANN [17], Word2Vec-LSTM [18], SA-DLSTM [19], MS-SSA-LSTM [20], NPMM [21], and PSO-LSTM [22]. The evaluation is based on various performance metrics, such as RMSE, MAPE, MSE, error rate, recall, F1 score, accuracy, MAE, precision, training time, computational complexity, and processing time. The mathematical formulations of these evaluation metrics are presented in Table 3.
where, represents the input data used for evaluating SMV, including historical price movements, trading volumes, market sentiment, and macroeconomic indicators. denotes the outcome of the volatility assessment process. is the total number of observations or data points in the dataset. refers to the AI-driven method used for training the volatility prediction model. represents the predicted volatility values generated by the diagnostic model. is the actual observed volatility at a given time. is the predicted volatility value.
4.3. Performance Analysis of Proposed Methods
This section evaluates the performance of the HMRCGN2Nets+CSBO method. Table 4 presents a comparison between the proposed approach and existing methods.
Table 4 compares the proposed HMRGCN2Net+s+CSBO model with other deep learning methods. The proposed model shows the highest performance across key metrics: accuracy (99.9%), recall (99.8%), precision (99.8%), specificity (99.7%), and F1-score (99.6%). It also achieves the lowest error rates with MSE (0.1), MAE (2.0), and RMSE (2.1), demonstrating its superior predictive accuracy and consistency. These results highlight the model’s enhanced capability in handling complex data compared to existing approaches. Table 5 presents the analysis of the hypotheses.
Table 5 compares different models based on computational cost, complexity, speed, efficiency, and strength. The proposed HMRGCN2Nets+CSBO model outperforms others with the lowest computational cost (0.01) and complexity (0.04), while achieving the highest speed (0.99), efficiency (0.99), and strength (0.99). This indicates that the proposed model is highly efficient and strong while maintaining minimal computational overhead, making it more effective and practical than other existing models for complex tasks. Figure 4 shows the (a) AI confidence score distribution and (b) Sentiment score distribution,
Figure 4 presents two histograms: (a) shows the distribution of AI confidence scores, which are concentrated between 0.60 and 1.00, with notable fluctuations and a visible density curve indicating variation in model confidence. (b) displays the sentiment score distribution, spanning from -1.00 to 1.00, indicating a more balanced spread of positive and negative sentiment scores. The smoother density curve suggests more uniformity in sentiment classification. Both graphs highlight the frequency of different score values, reflecting the AI model’s performance and sentiment analysis balance. Figure 5 shows the (a) Market index vs. volatility and (b) volatility vs. stock price,
Figure 5 presents two scatter plots: (a) shows the relationship between Market Index and Volatility, with AI predictions color-coded as Low (blue), Medium (orange), and High (red). The spread indicates no clear pattern, suggesting unpredictability in volatility across the market index. (b) Illustrates Volatility vs. Stock Price with a dense red scatter, showing a uniform spread and no obvious correlation. Both plots highlight the complex and seemingly random nature of volatility in relation to market index and stock prices. Figure 6 shows the (a) AI volatility prediction counts and (b) stock price trend over time,
Figure 6 shows two plots: (a) illustrates AI volatility prediction counts, where the Low category dominates with nearly 2000 counts, while High predictions are fewer, and Medium predictions are absent, indicating a skewed prediction pattern. (b) Depicts the stock price trend over time, showing high volatility and frequent fluctuations from 2000 to 2014. The dense clustering of data points suggests consistent market activity, but no clear upward or downward trend, reflecting complex stock price behavior over time. Figure 7 shows the model accuracy as well as loss,
Figure 7 shows the model’s accuracy as well as loss over 200 epochs. The training accuracy (orange) quickly reaches 1.0, indicating perfect learning, while the validation accuracy (blue) stabilizes near 1.0, suggesting good generalization. The training loss (green) and validation loss (purple) drop rapidly and stabilize close to zero, indicating effective model convergence with minimal error. The rapid improvement and consistent performance reflect a well-trained model with high accuracy and low overfitting risk. Figure 8 shows the (a) trading volume distribution and (b) news impact score vs. volatility,
Figure 8 presents’ two plots: (a) shows the trading volume distribution, which appears relatively uniform with moderate variation and a smooth density curve, indicating consistent trading activity across different volumes. (b) Depicts the relationship between news impact score and volatility, represented by a dense scatter plot of orange points. The even spread suggests no clear correlation between news impact scores and market volatility, implying that news events may not have a predictable effect on volatility levels. Figure 9 shows the correlation heat map,
Figure 9 shows a correlation heatmap representing the relationships between various financial metrics. With blue denoting negative correlations and red denoting positive correlations, the color intensity represents the direction and degree of correlations. Stock price, trading volume, market index, and other factors show weak correlations (close to zero), and suggesting minimal linear relationships among them. The diagonal values are all 1.0, representing perfect self-correlation. The overall weak correlations reflect complex and non-linear interactions in financial data. Figure 10 shows the function value over iterations in 3D space.
Figure 10 presents a 3D surface plot showing the function value over iterations. The x and y axes represent iteration values, while the z-axis shows the function value. The color gradient, from purple (low) to yellow (high), indicates changes in function value. Peaks and valleys in the surface suggest the function’s complex behavior, with sharp increases and decreases. This visualization helps analyze optimization patterns and convergence behavior during model training or mathematical function evaluation. Figure 11 shows the economic indicator,
Figure 11 shows the density distribution of the economic indicator. The plot reveals a relatively uniform distribution with slight variations, indicating that the economic indicator values are fairly evenly spread across the range of approximately 40 to 160. The density peaks are consistent, suggesting that certain economic indicator values appear more frequently. The smooth curve reflects a balanced spread without significant skewness or clustering, implying stable economic performance over the observed period.
4.4. A Comparison of the Suggested Approach with Existing Techniques Statistically
The efficacy of the suggested method is assessed using five statistical tests: the Shapiro-Wilk (SW) as well as Kolmogorov-Smirnov (KS) tests for normalcy testing, the Kruskal-Wallis H test, the Wilcoxon Signed-Rank (WSR) test, and the Friedman (FT) test. Table 6 presents an analysis of variance between the suggested approach and current approaches.
Table 6 presents a statistical comparison of the proposed HMRGCN2Nets+CSBO approach with existing methods. The proposed model shows the lowest p-values (<0.001) across SW, WSR, H, and KS tests, indicating strong statistical significance. It achieves the lowest mean (65,923.20), standard deviation (6,599.93), and variance inflation factor (1.001), reflecting high consistency and low variability. The FT test value of 1 confirms its robustness. These results demonstrate the proposed model’s superior stability and predictive reliability.
4.5. Ablation Study of the Suggested Approach
The ablation study demonstrates the incremental contributions of each component in the HMRCGN2Nets+CSBO model. Table 7 presents the findings of this analysis for the proposed approach.
Table 7 evaluates ablation study contribution of HCNN, MRGAT, and CSBO components to the model’s performance. The full model (HMRGCN2Nets+CSBO) achieves the highest accuracy (99.9%), precision (99.8%), recall (99.7%), and F1-score (99.6%). Removing any component reduces performance, with the largest drop seen when HCNN or MRGAT is absent. The results highlight that combining all three components enhances overall model performance, confirming their individual and collective importance in achieving optimal predictive accuracy and consistency.
4.6. Discussion
The proposed HMRCGN2Nets+CSBO model demonstrates outstanding predictive accuracy and efficiency in forecasting stock market volatility. The thorough comparison with well-known models as CNN-ANN, LSTM-SVM-ANN, as well as PSO-LSTM demonstrates the superiority of the suggested approach. It maintained the lowest error rates with MSE (0.1), MAE (2.0), and RMSE (2.1) while achieving the maximum accuracy (99.9%), recall (99.8%), precision (99.8%), specificity (99.7%), as well as F1-score (99.6%). These outcomes demonstrate how well the model handles dynamic and complex financial data in comparison to alternative deep learning techniques. According to the performance analysis, HMRCGN2Nets+CSBO performs exceptionally well in terms of both accuracy and computational efficiency. It recorded the lowest computational cost (0.01) and complexity (0.04), while achieving the highest speed (0.99) and efficiency (0.99). This shows that not only is the model highly accurate but it is also light on computation, rendering it usable in real-time analysis of stock markets. Ablation study further validates each of the component’s (HCNN, MRGAT, and CSBO) contribution in terms of improvement in model performance. The entire model performs better than individual or partially combined versions, demonstrating the fact that bringing together all of them is needed to achieve peak predictive accuracy. Statistical testing supports the validity and accuracy of the model proposed. The model had the lowest p-values (<0.001) under the SW, WSR, H, and KS tests, which signify very high statistical significance. It had the lowest mean (65,923.20) and variance inflation factor (1.001), which suggest its stability and robustness under varying market environments. Visual analysis of AI confidence scores, sentiment scores, and market indices displays the model’s ability to capture intricate financial patterns. The proposed model’s capacity for adjusting to different market conditions and delivering constant high accuracy makes it a powerful financial forecasting and strategic planning resource. These results define HMRCGN2Nets+CSBO as an extremely effective and accurate solution for stock market volatility forecasting.
5. Conclusions
In this manuscript, the HMRCGN2Nets+CSBO is successfully implemented. The input data which are derived from the Stock Market Volatility dataset are pre-processed initially through the ARASN method and further feature extraction through the EIT method. The prediction of the SMV by an AI Diagnosis Model is given to the HMRCGN2Nets model, and the optimization is done through the CSBO approach to facilitate precise measurement of Stock Market Volatility by an AI Diagnosis Model. The system is designed through Python. The proposed HMRCGN2Nets+CSBO approach is tested with the Stock Market Volatility dataset with a very high accuracy of 99.9% and an extremely low rate of error of 0.1%. This reflects how good it can perform and grow in the future for this area and also reflects how good it is compared to existing methods. Future research can focus on improving model scalability, incorporating real-time data feeds, optimizing circulatory strategies, enhancing interpretability, and scaling the model to various financial markets to enhance predictive performance and resilience to different market conditions.
References
- Rahmani, A. M. , et al. Applications of artificial intelligence in the economy, including applications in stock trading, market analysis, and risk management. IEEE Access 2023, 11, 80769–80793. [Google Scholar] [CrossRef]
- Zhang, Y.-J. , Zhang, H., & Gupta, R. A new hybrid method with data-characteristic-driven analysis for artificial intelligence and robotics index return forecasting. Financial Innovation 2023, 9, 75. [Google Scholar] [CrossRef] [PubMed]
- Liu, F. , Umair, M., & Gao, J. Assessing oil price volatility co-movement with stock market volatility through quantile regression approach. Resources Policy 2023, 81, 103375. [Google Scholar] [CrossRef]
- Wu, F.-L. , et al. Stock market volatility and Russia–Ukraine conflict. Finance Research Letters 2023, 55, 103919. [Google Scholar] [CrossRef]
- Salisu, A. A. , et al. Geopolitical risk and stock market volatility in emerging markets: A GARCH–MIDAS approach. The North American Journal of Economics and Finance 2022, 62, 101755. [Google Scholar] [CrossRef]
- Bakry, W. , et al. Response of stock market volatility to COVID-19 announcements and stringency measures: A comparison of developed and emerging markets. Finance Research Letters 2022, 46, 102350. [Google Scholar] [CrossRef]
- Liu, S. , Zhao, H., & Kong, G. Enterprise digital transformation, breadth of ownership, and stock price volatility. International Review of Financial Analysis 2023, 89, 102713. [Google Scholar] [CrossRef]
- Liu, M. The driving forces of green bond market volatility and the response of the market to the COVID-19 pandemic. Economic Analysis and Policy 2022, 75, 288–309. [Google Scholar] [CrossRef]
- Chen, S. , et al. The Russia–Ukraine war and energy market volatility: A novel application of the volatility ratio in the context of natural gas. Resources Policy 2023, 85, 103792. [Google Scholar] [CrossRef]
- Xiuzhen, X. , Zheng, W., & Umair, M. Testing the fluctuations of oil resource price volatility: A hurdle for economic recovery. Resources Policy 2022, 79, 102982. [Google Scholar] [CrossRef]
- Gao, Y. , et al. Effects of investor sentiment on stock volatility: New evidence from multi-source data in China’s green stock markets. Financial Innovation 2022, 8, 77. [Google Scholar] [CrossRef] [PubMed]
- Kundu, S. , & Paul, A. Effect of economic policy uncertainty on stock market return and volatility under heterogeneous market characteristics. International Review of Economics & Finance 2022, 80, 597–612. [Google Scholar] [CrossRef]
- Liu, M. , et al. Trading volume and realized volatility forecasting: Evidence from the China stock market. Journal of Forecasting 2023, 42, 76–100. [Google Scholar] [CrossRef]
- Khan, W. , et al. (2022). Stock market prediction using machine learning classifiers and social media, news. Journal of Ambient Intelligence and Humanized Computing. [CrossRef]
- Lin, Y. , et al. Forecasting the realized volatility of stock price index: A hybrid model integrating CEEMDAN and LSTM. Expert Systems with Applications 2022, 206, 117736. [Google Scholar] [CrossRef]
- Mukherjee, S. , et al. Stock market prediction using deep learning algorithms. CAAI Transactions on Intelligence Technology 2023, 8, 82–94. [Google Scholar] [CrossRef]
- Sheth, D. , & Shah, M. Predicting stock market using machine learning: Best and accurate way to know future stock prices. International Journal of System Assurance Engineering and Management 2023, 14, 1–18. [Google Scholar] [CrossRef]
- Chandola, D. , et al. Forecasting directional movement of stock prices using deep learning. Annals of Data Science 2023, 10, 1361–1378. [Google Scholar] [CrossRef]
- Zhao, Y. , & Yang, G. Deep learning-based integrated framework for stock price movement prediction. Applied Soft Computing 2023, 133, 109921. [Google Scholar] [CrossRef]
- Mu, G. , et al. A stock price prediction model based on investor sentiment and optimized deep learning. IEEE Access 2023, 11, 51353–51367. [Google Scholar] [CrossRef]
- Han, Y. , Kim, J., & Enke, D. A machine learning trading system for the stock market based on N-period Min-Max labeling using XGBoost. Expert Systems with Applications 2023, 211, 118581. [Google Scholar] [CrossRef]
- Jiao, X. , et al. Volatility forecasting for crude oil based on text information and deep learning PSO-LSTM model. Journal of Forecasting 2022, 41, 933–944. [Google Scholar] [CrossRef]
- Jin, X. , et al. A reversible automatic selection normalization (RASN) deep network for predicting in the smart agriculture system. Agronomy 2022, 12, 591. [Google Scholar] [CrossRef]
- Fu, L. , et al. IncepFormer: Efficient inception transformer with pyramid pooling for semantic segmentation. arXiv, arXiv:2212.03035. [CrossRef]
- Wagner, K. H. , & McComb, S. Optical rectifying linear units for back-propagation learning in a deep holographic convolutional neural network. IEEE Journal of Selected Topics in Quantum Electronics 2019, 26, 1–18. [Google Scholar] [CrossRef]
- Dai, G. , et al. MRGAT: Multi-relational graph attention network for knowledge graph completion. Neural Networks 2022, 154, 234–245. [Google Scholar] [CrossRef]
- Ghasemi, M. , et al. Gaussian bare-bones Levy circulatory system-based optimization for power flow in the presence of renewable units. Engineering Science and Technology, an International Journal 2023, 47, 101551. [Google Scholar] [CrossRef]
Figure 1.
The detailed workflow of the suggested HMRCGN2Nets+CSBO model.
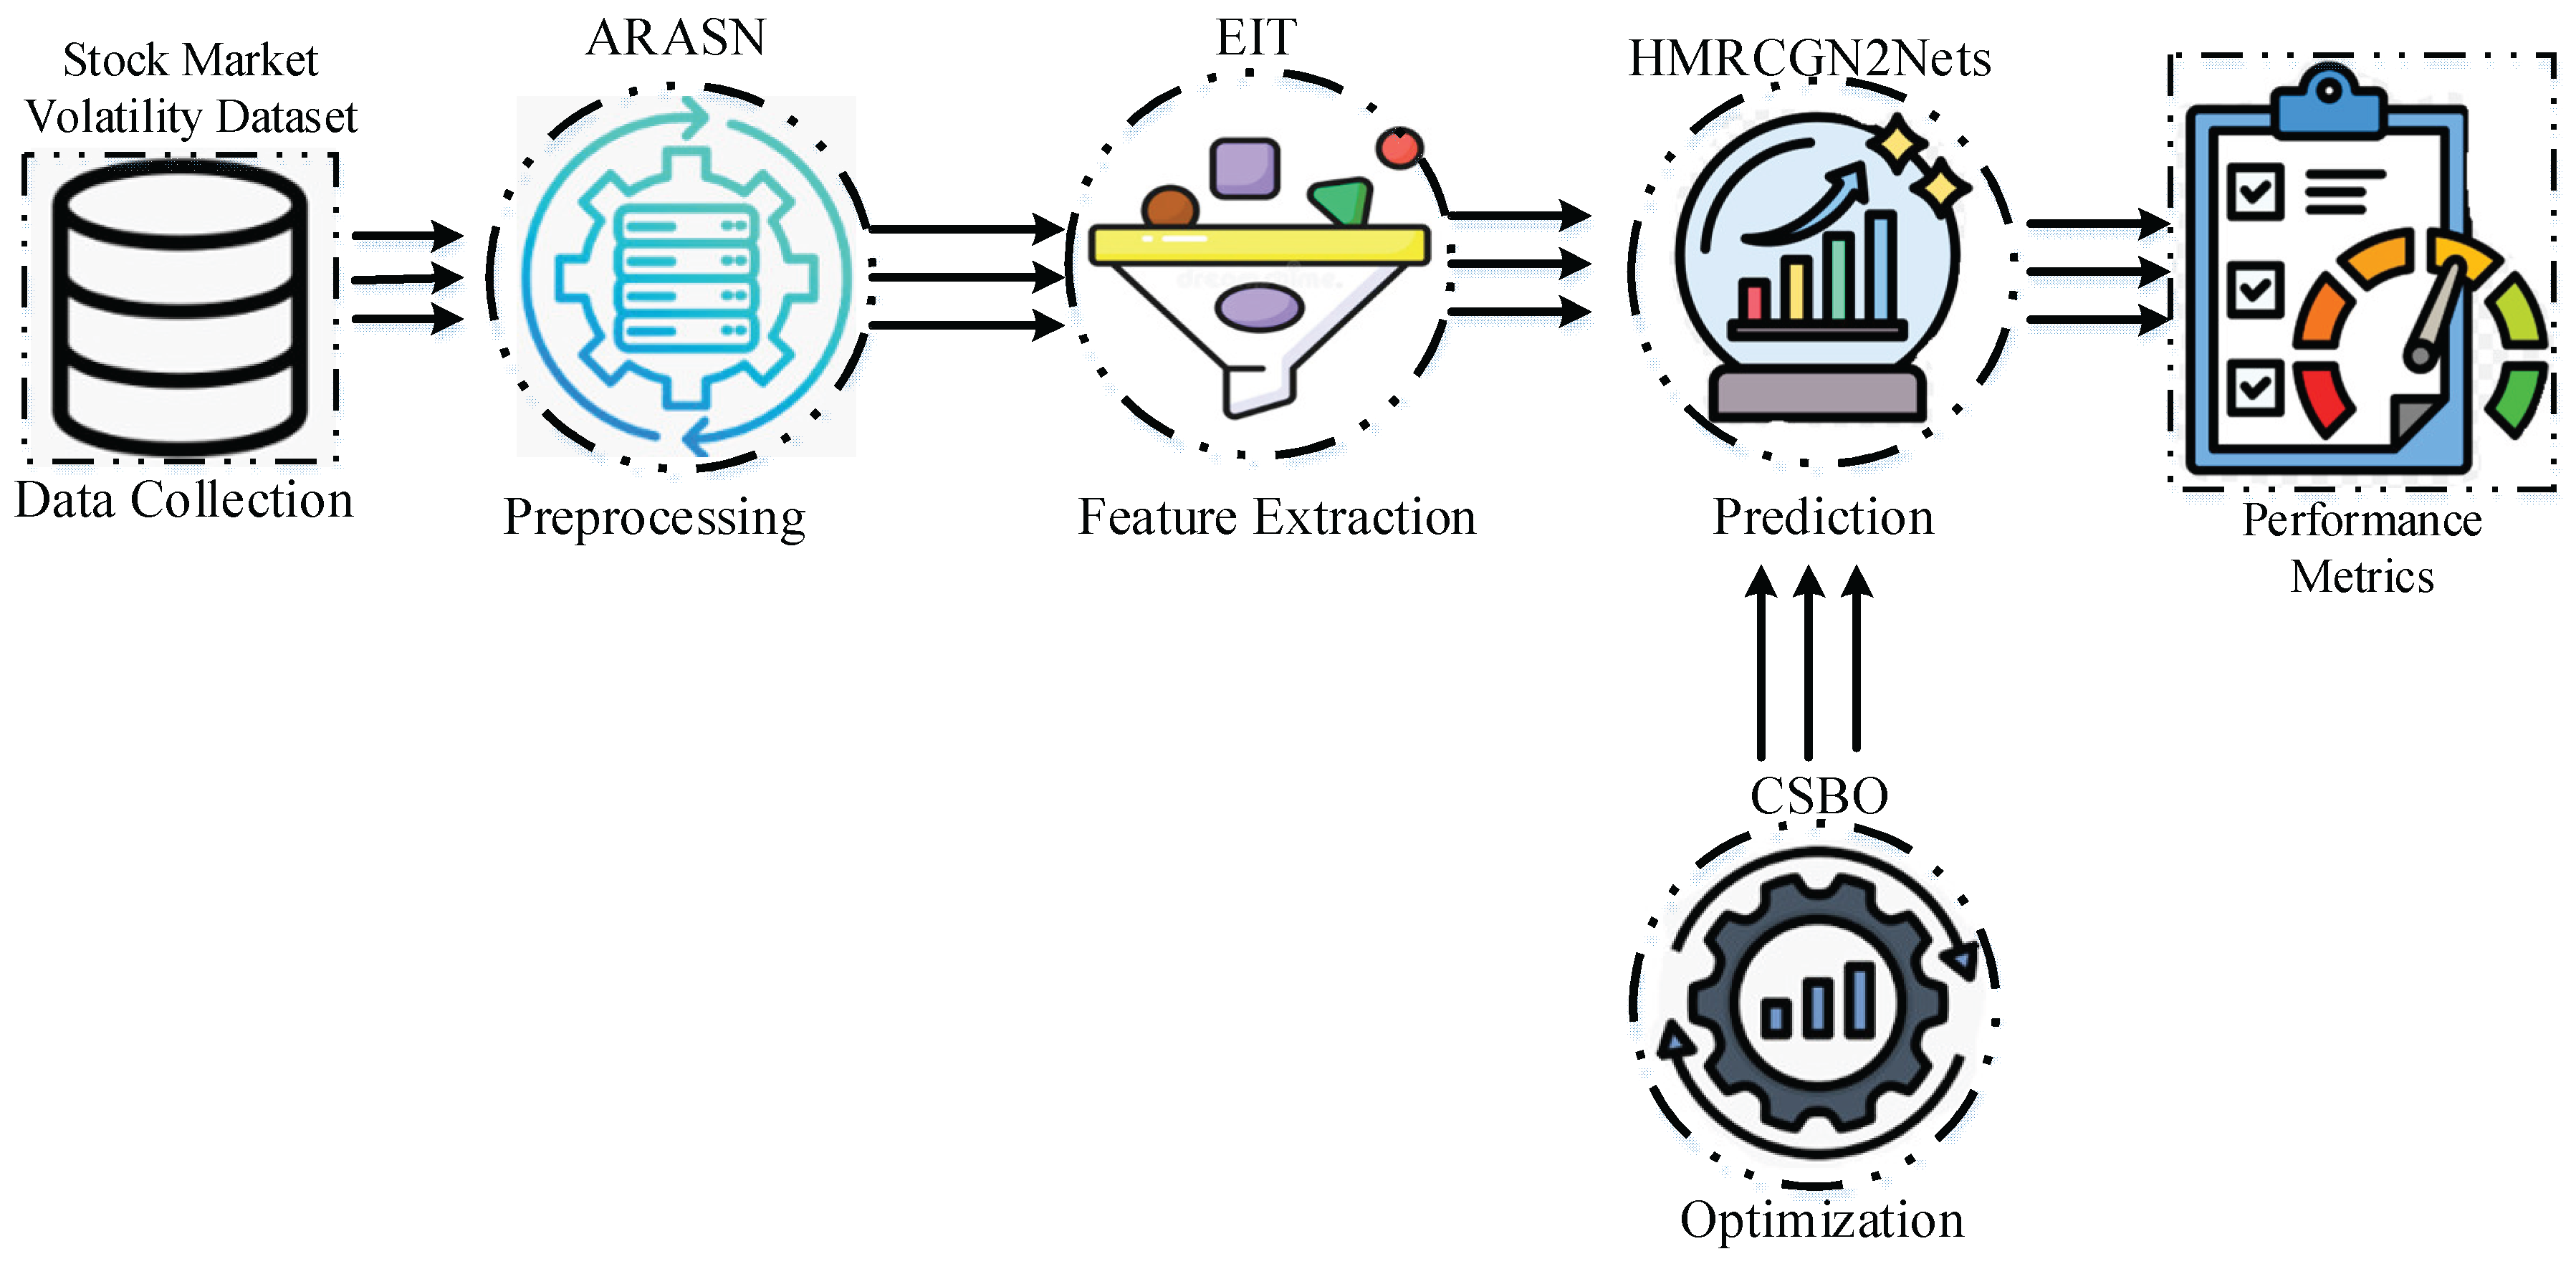
Figure 2.
The Architecture of MRGAT.
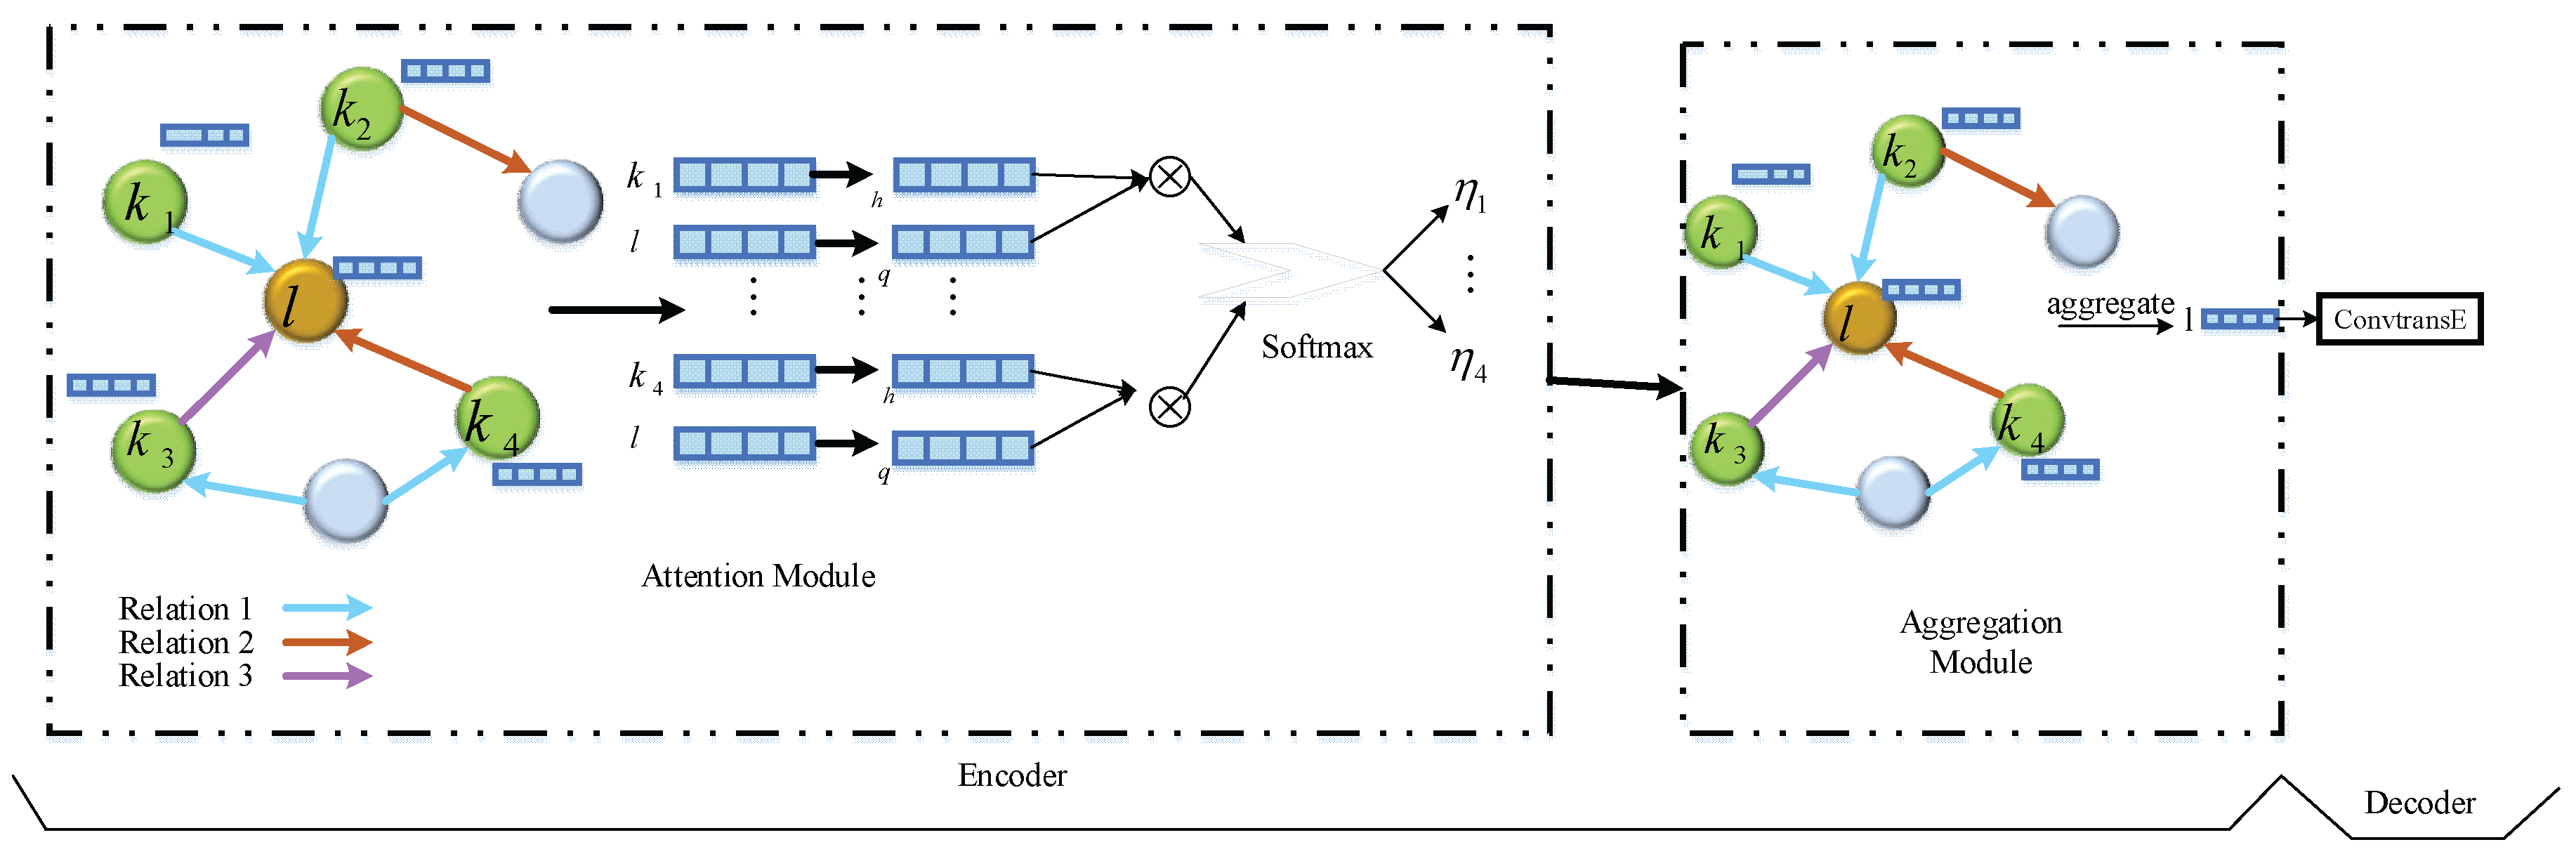
Figure 3.
A step-by-step explanation of the CSBO approach.
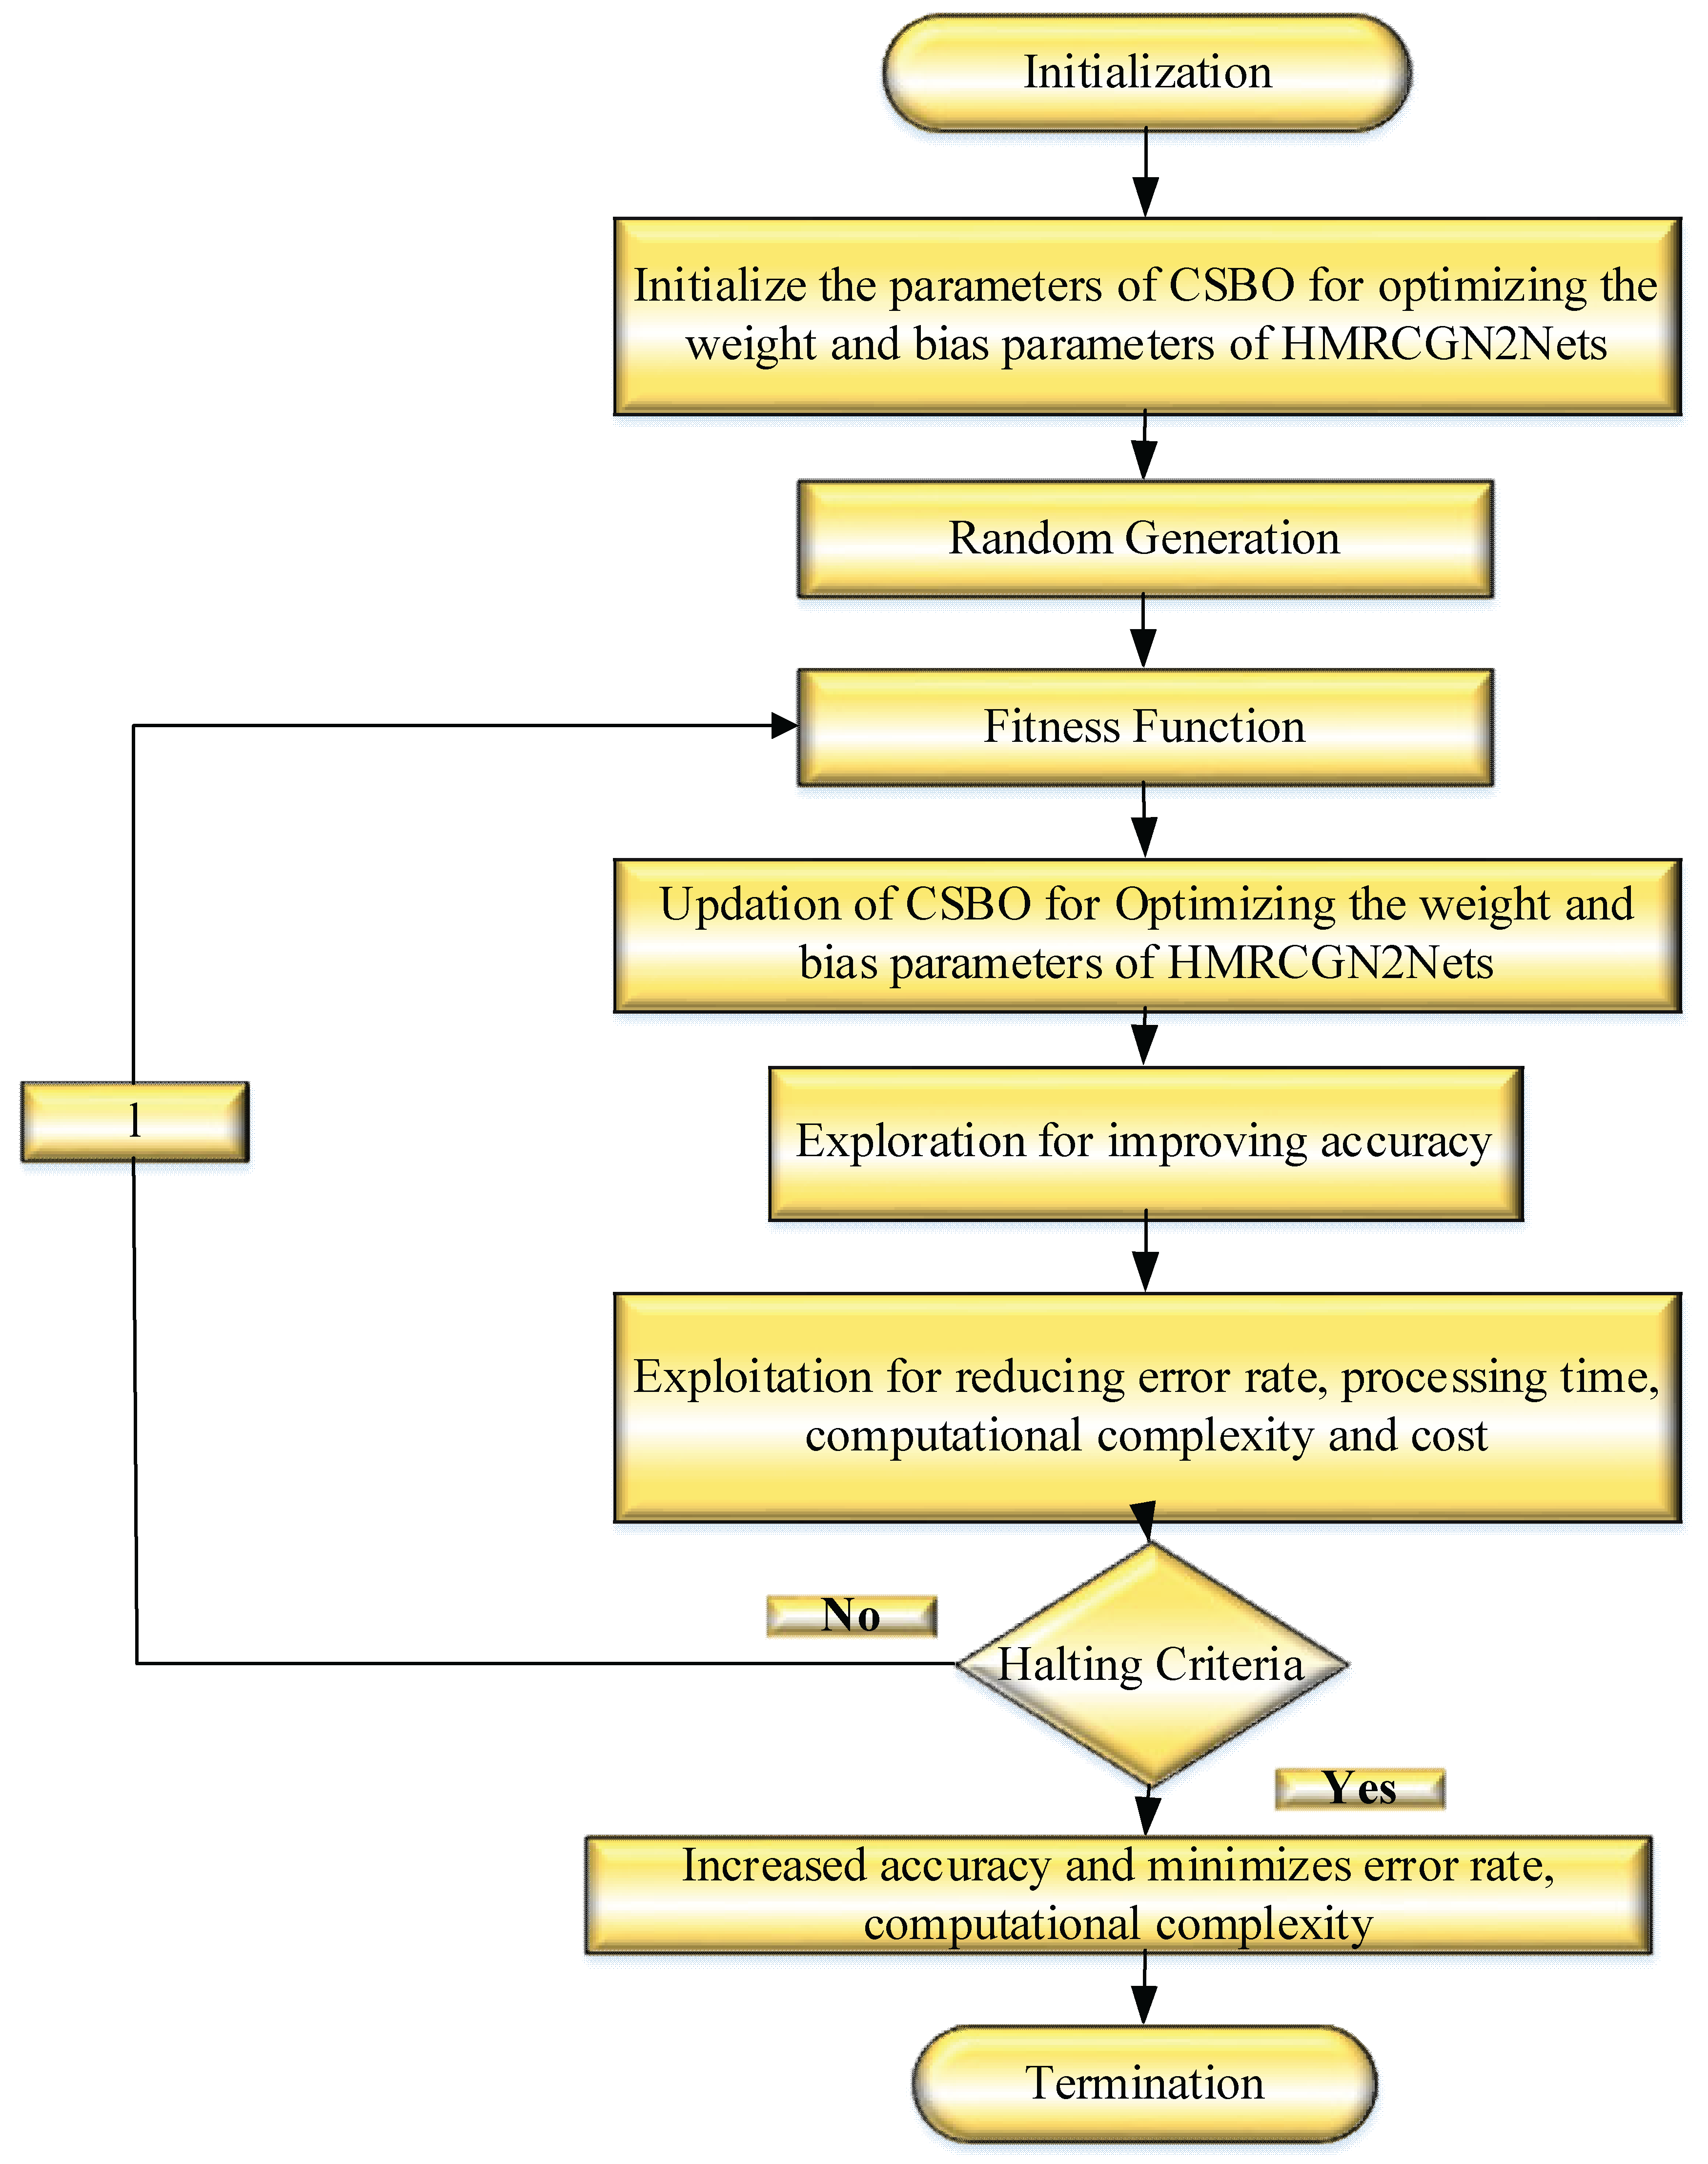
Figure 4.
The (a) AI confidence score distribution and (b) Sentiment score distribution.
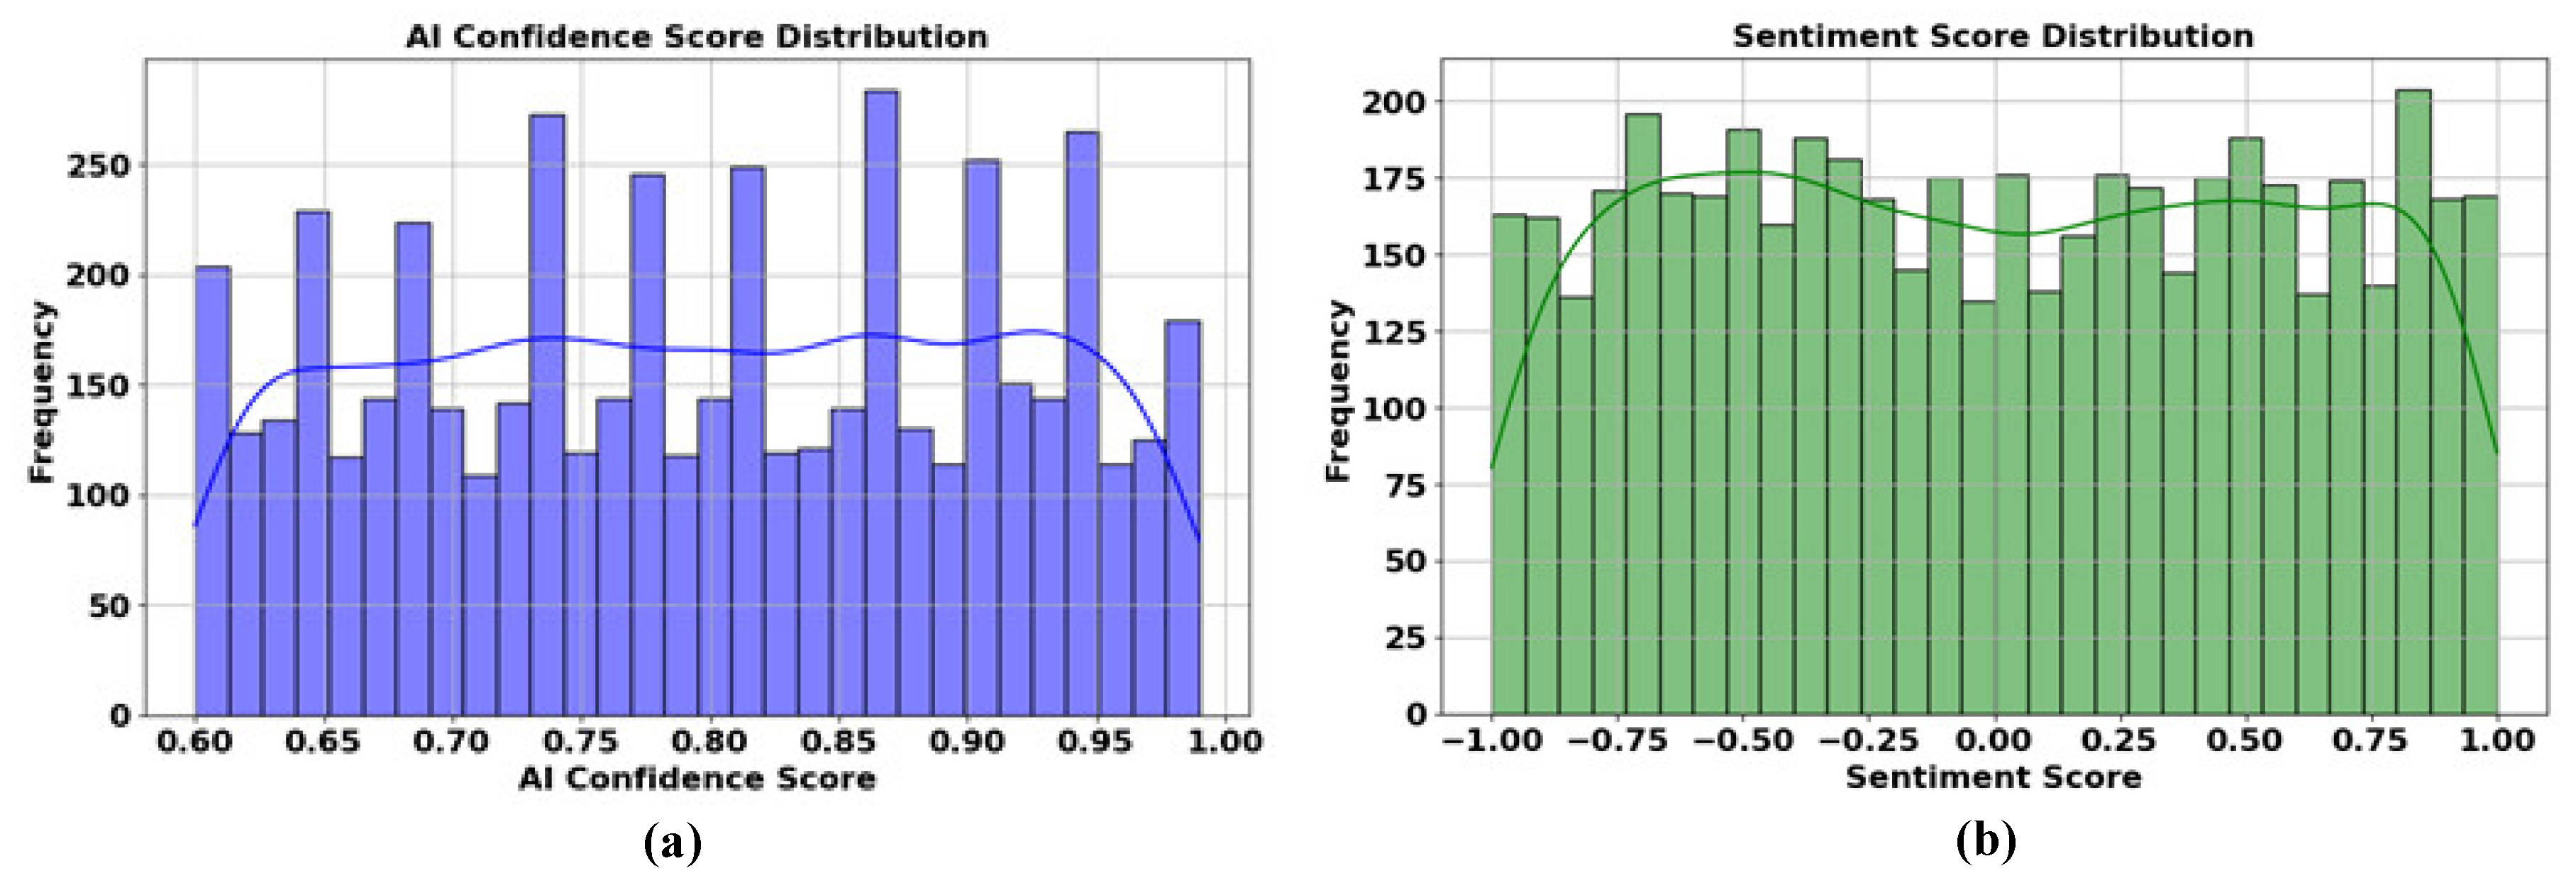
Figure 5.
The (a) Market index vs. volatility and (b) volatility vs. stock price.
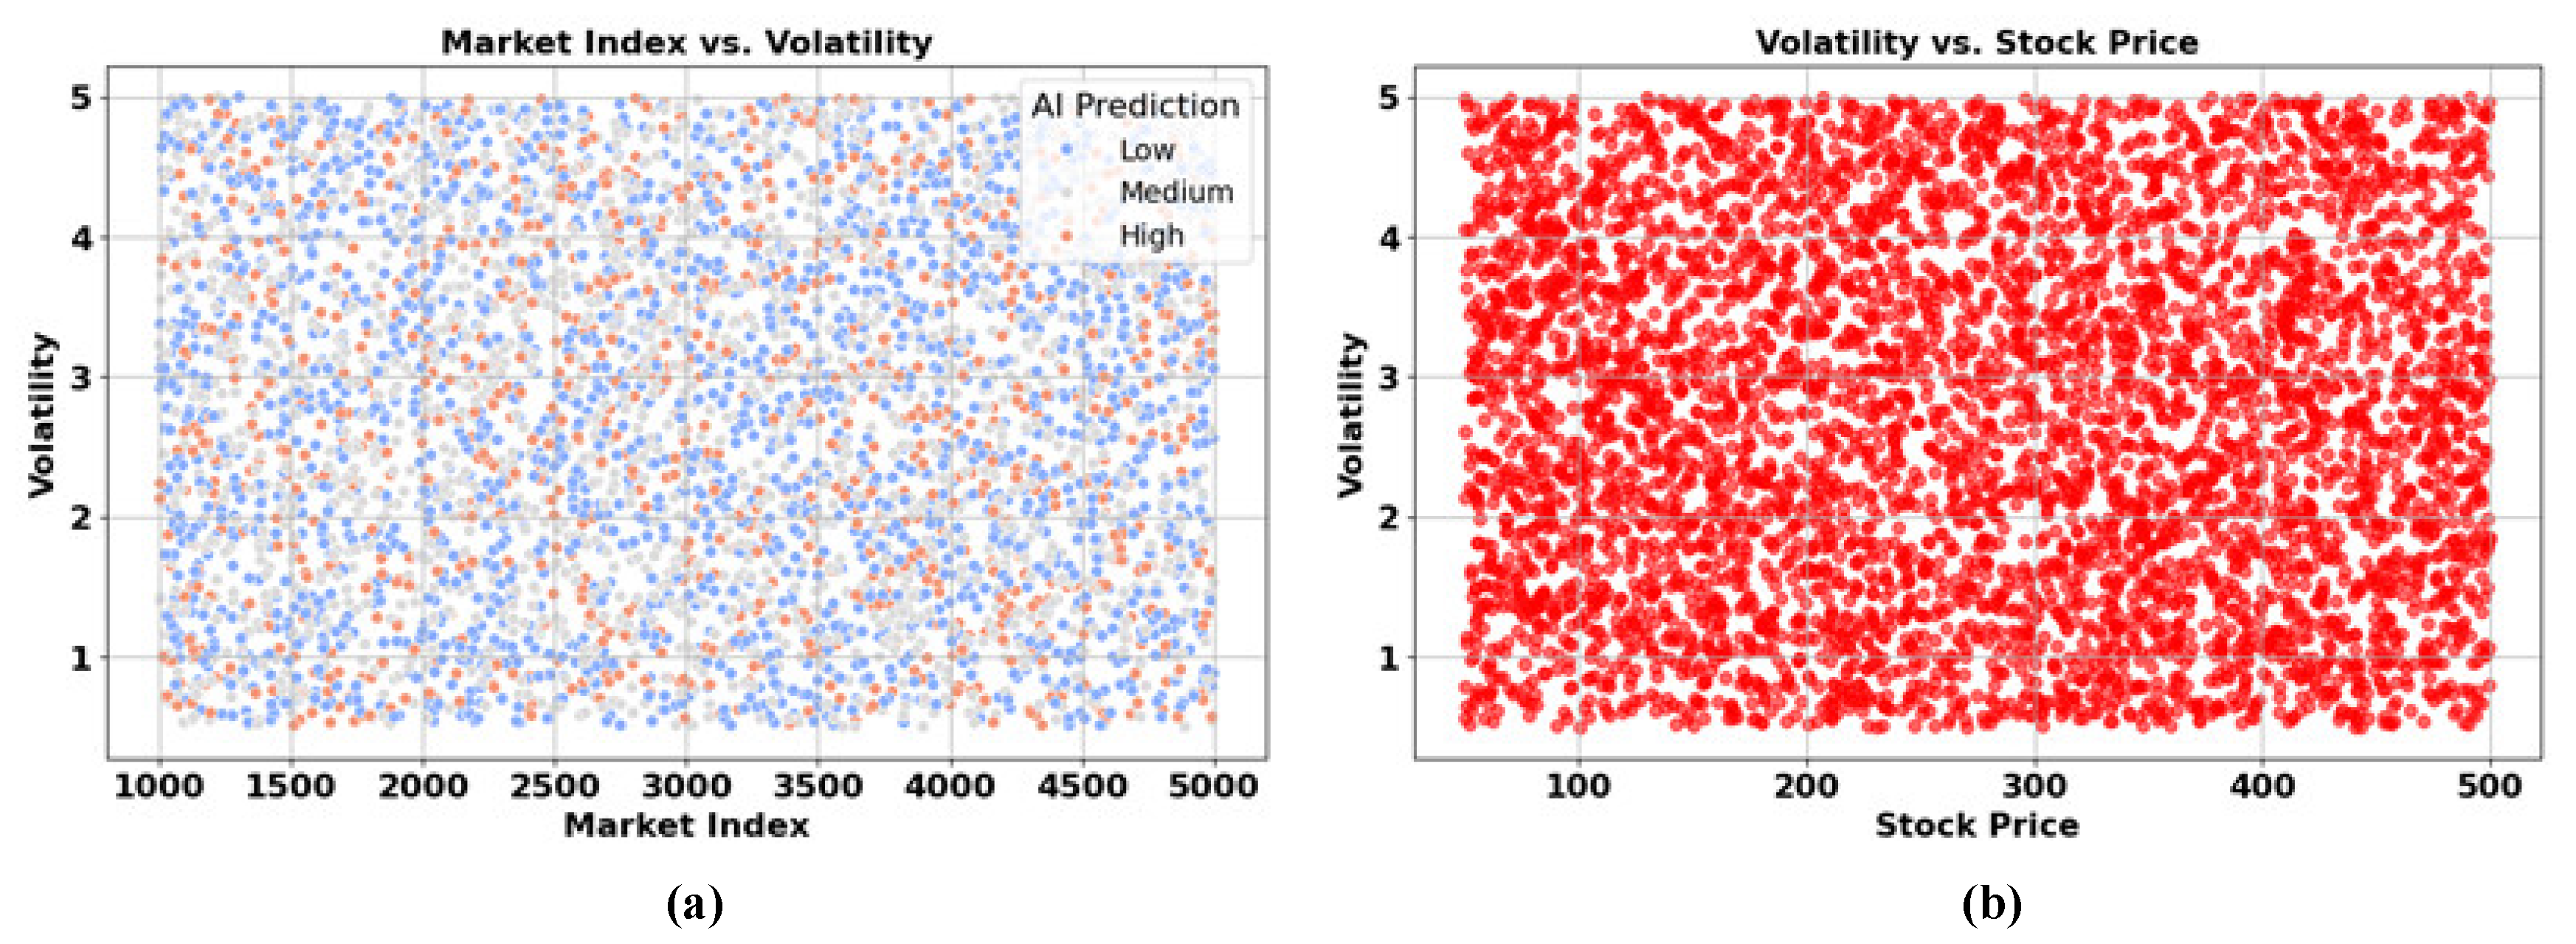
Figure 6.
The (a) AI volatility prediction counts and (b) stock price trend over time.
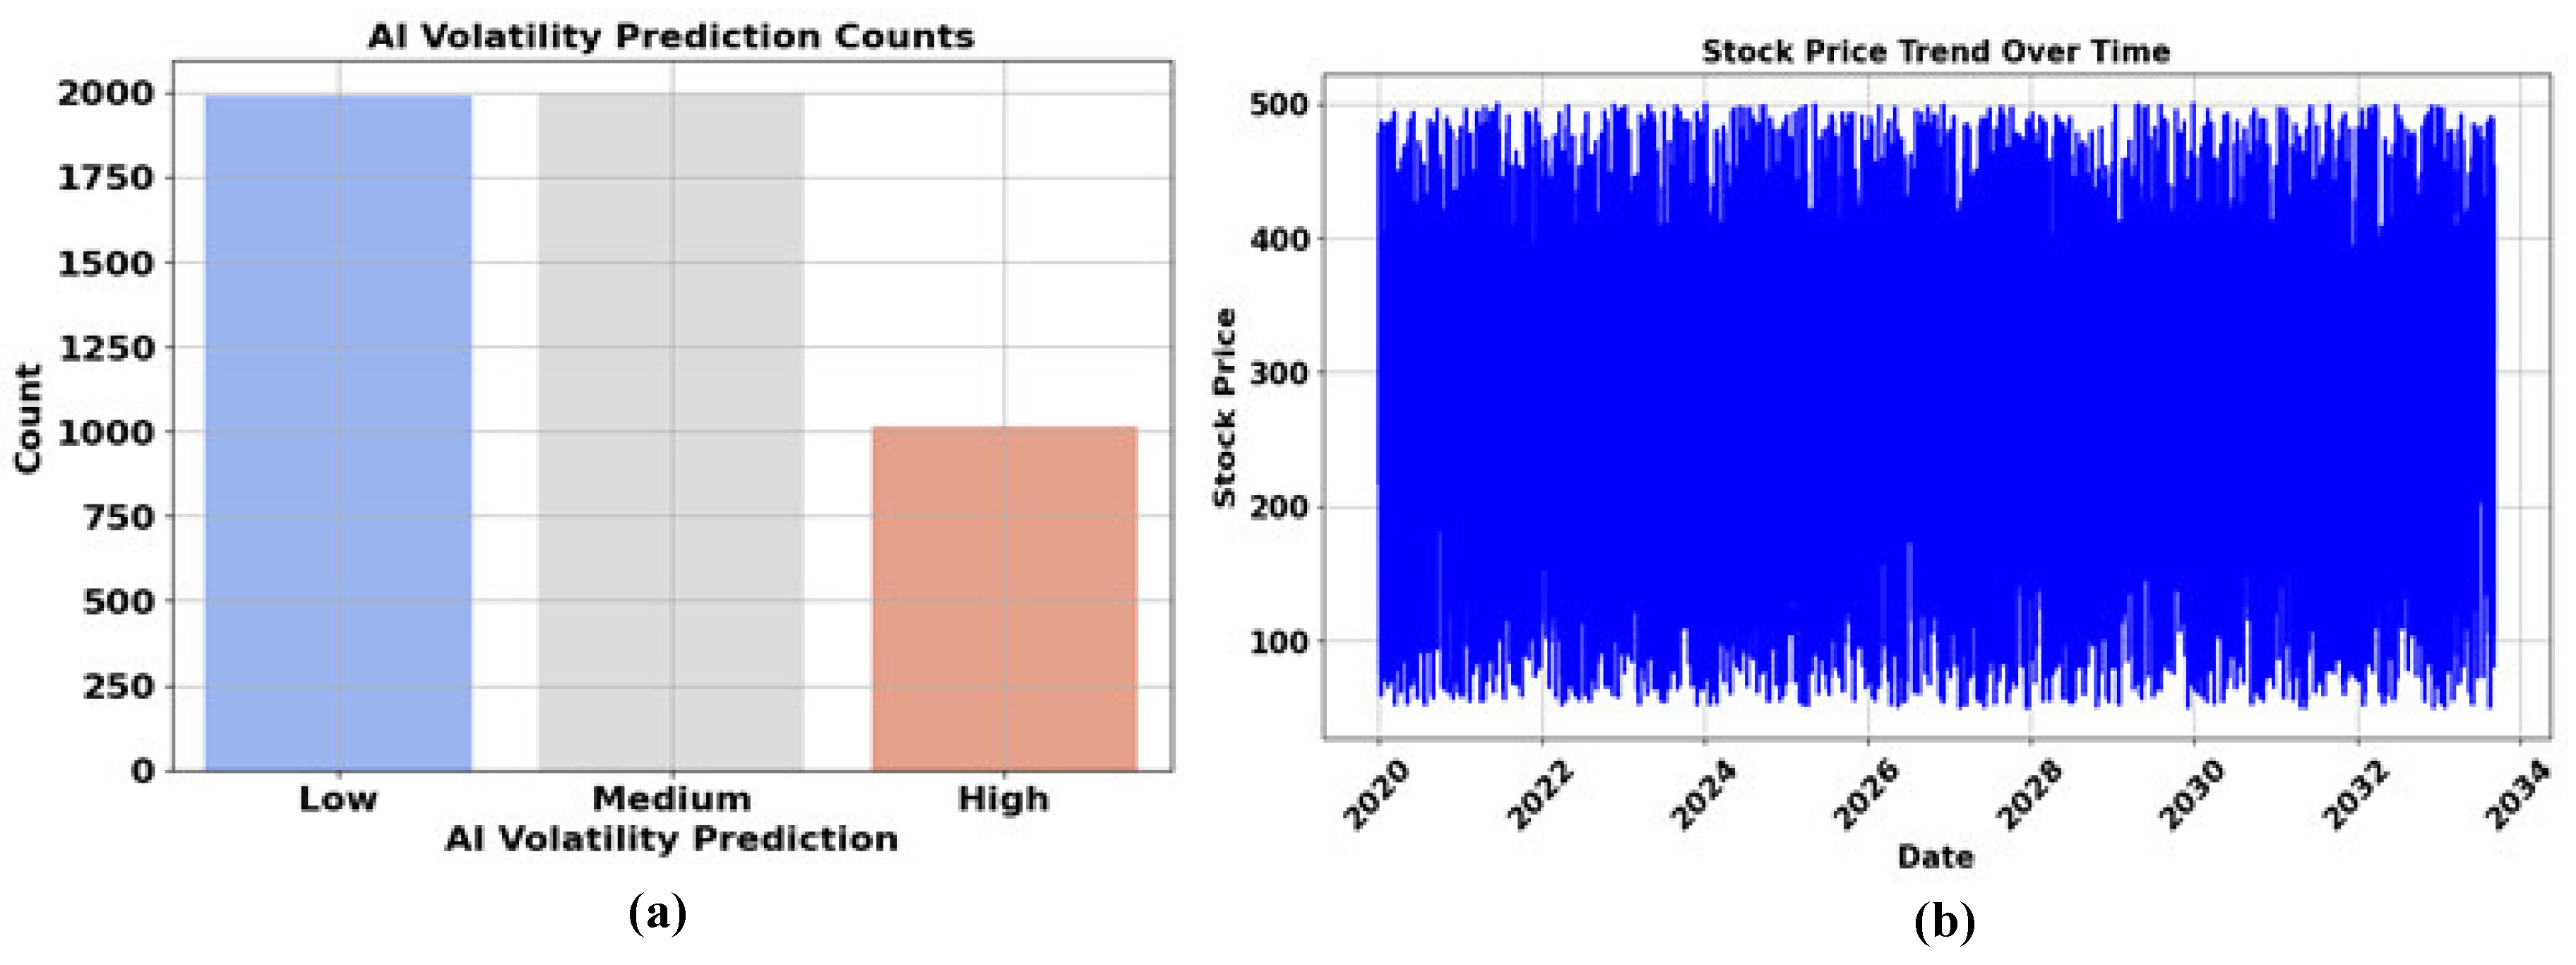
Figure 7.
The model accuracy as well as loss.
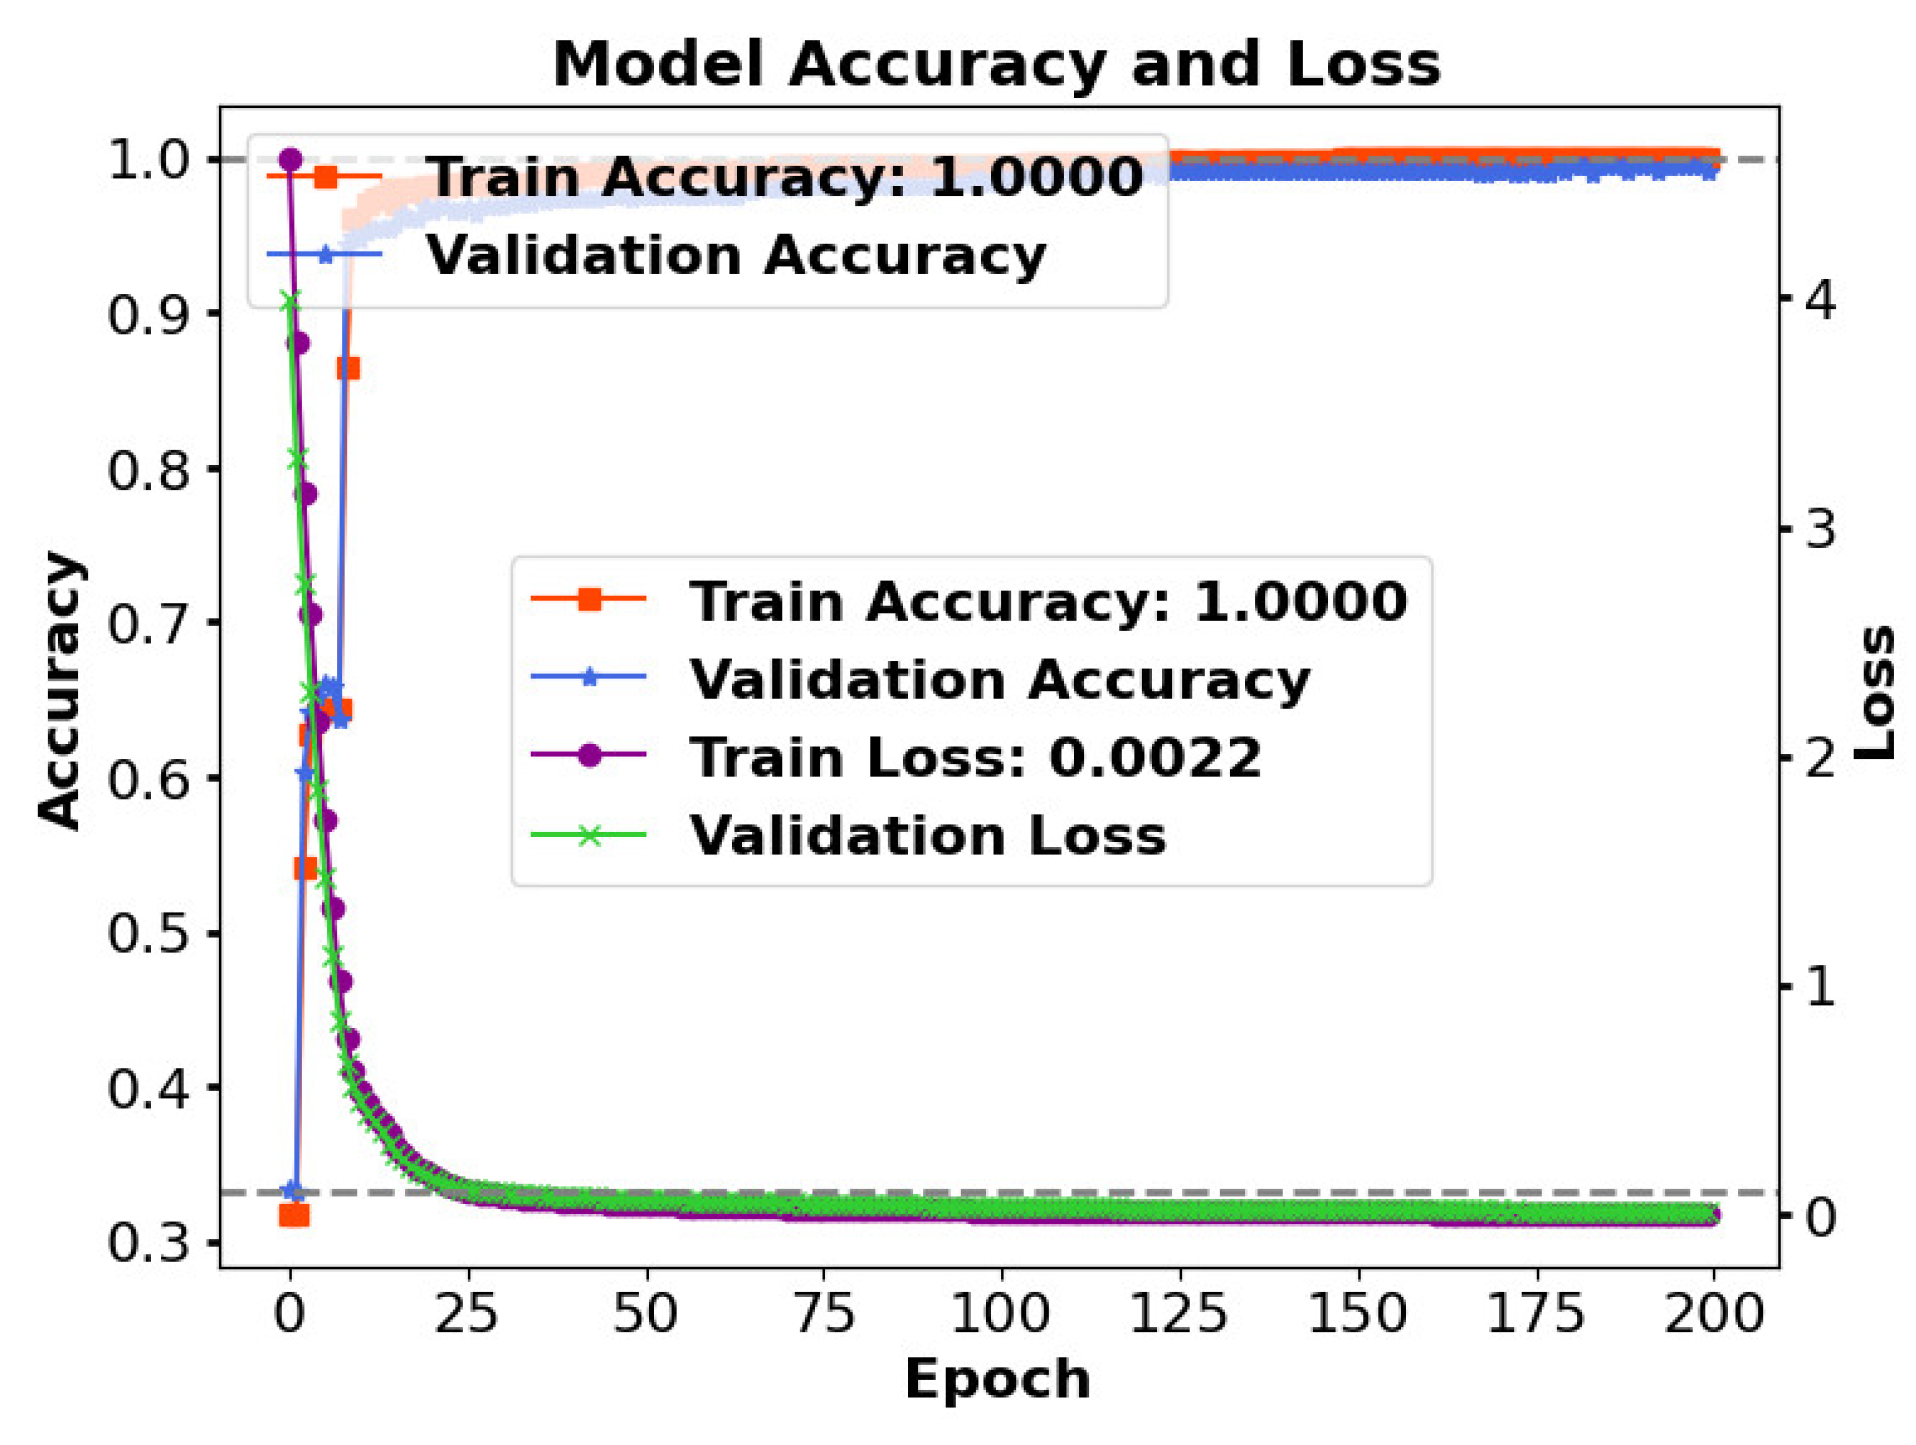
Figure 8.
The (a) trading volume distribution and (b) news impact score vs. volatility.
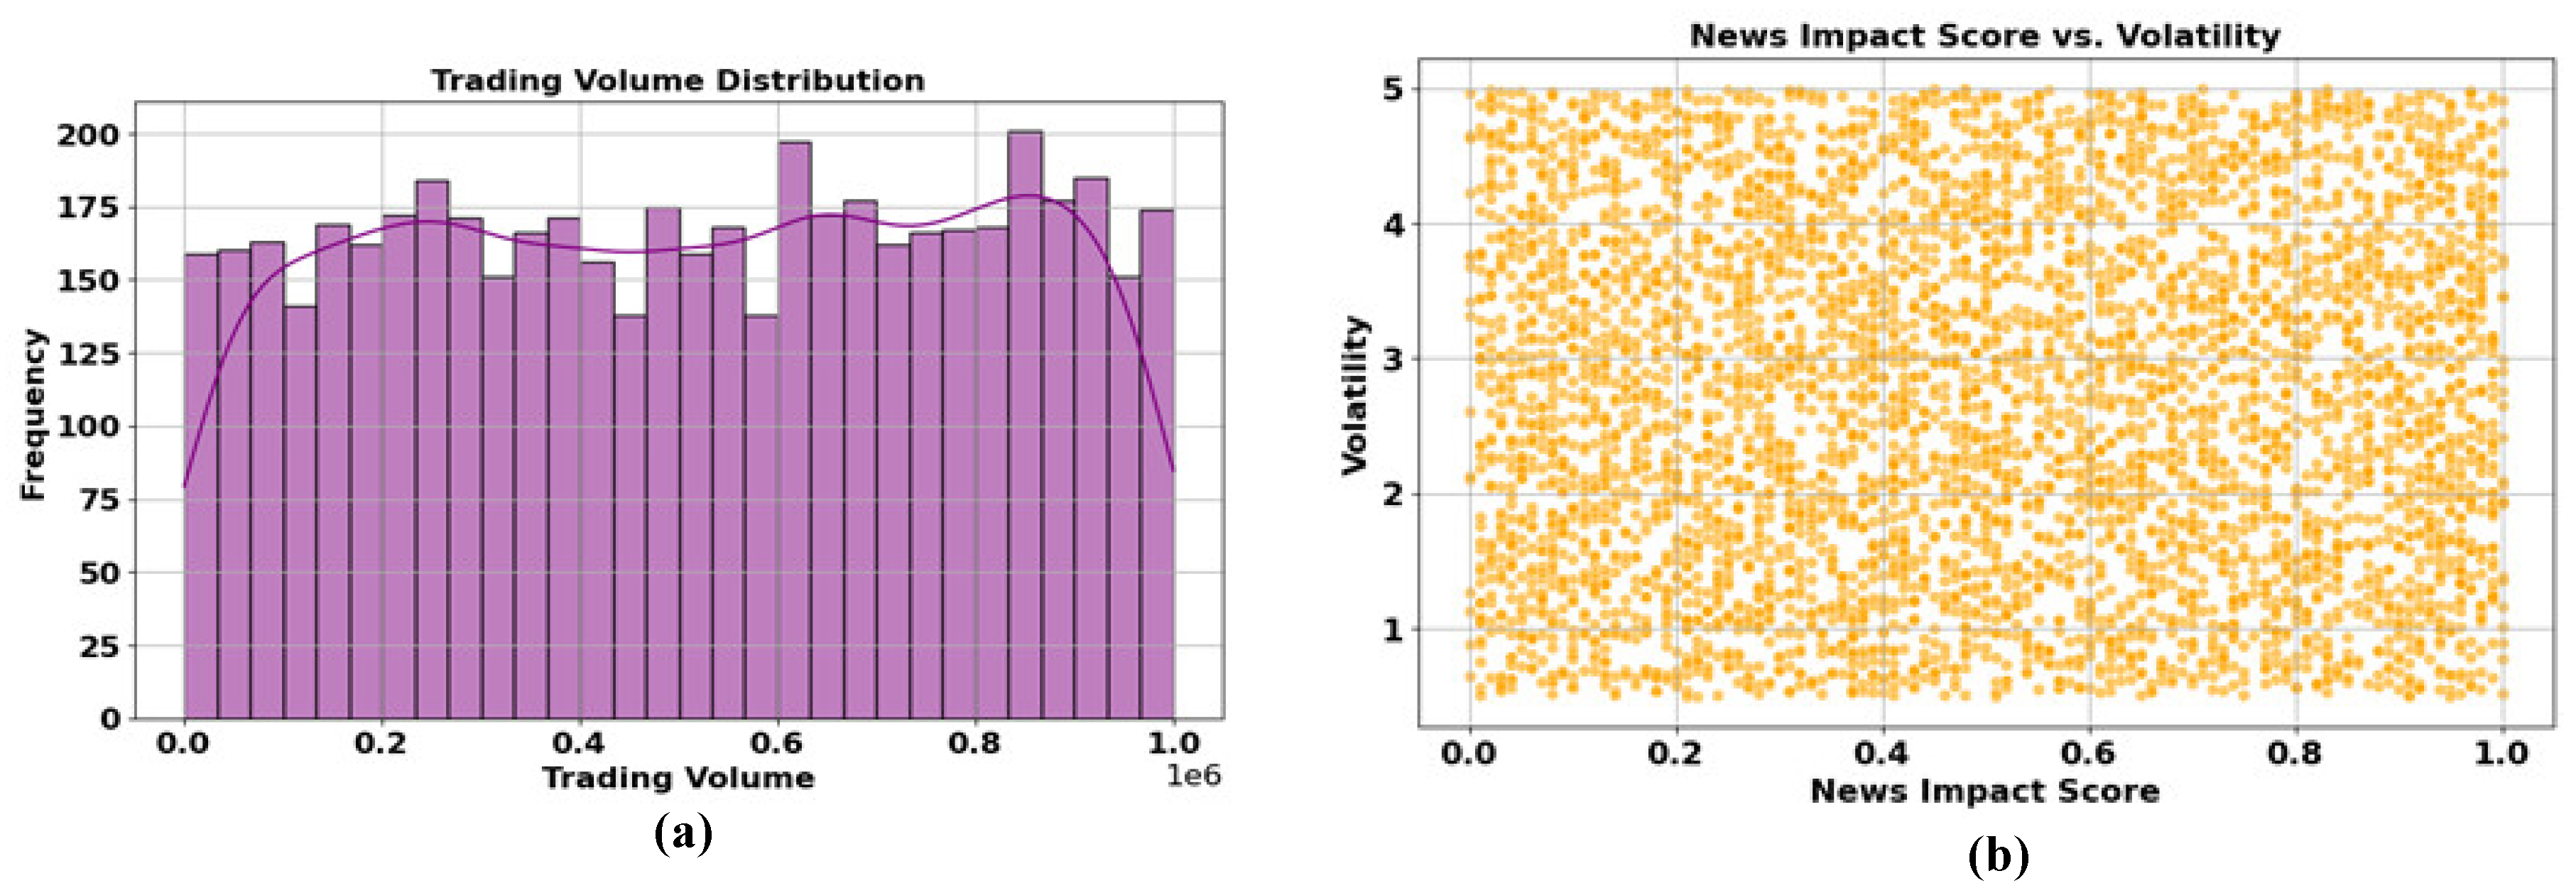
Figure 9.
The Correlation Heatmap.
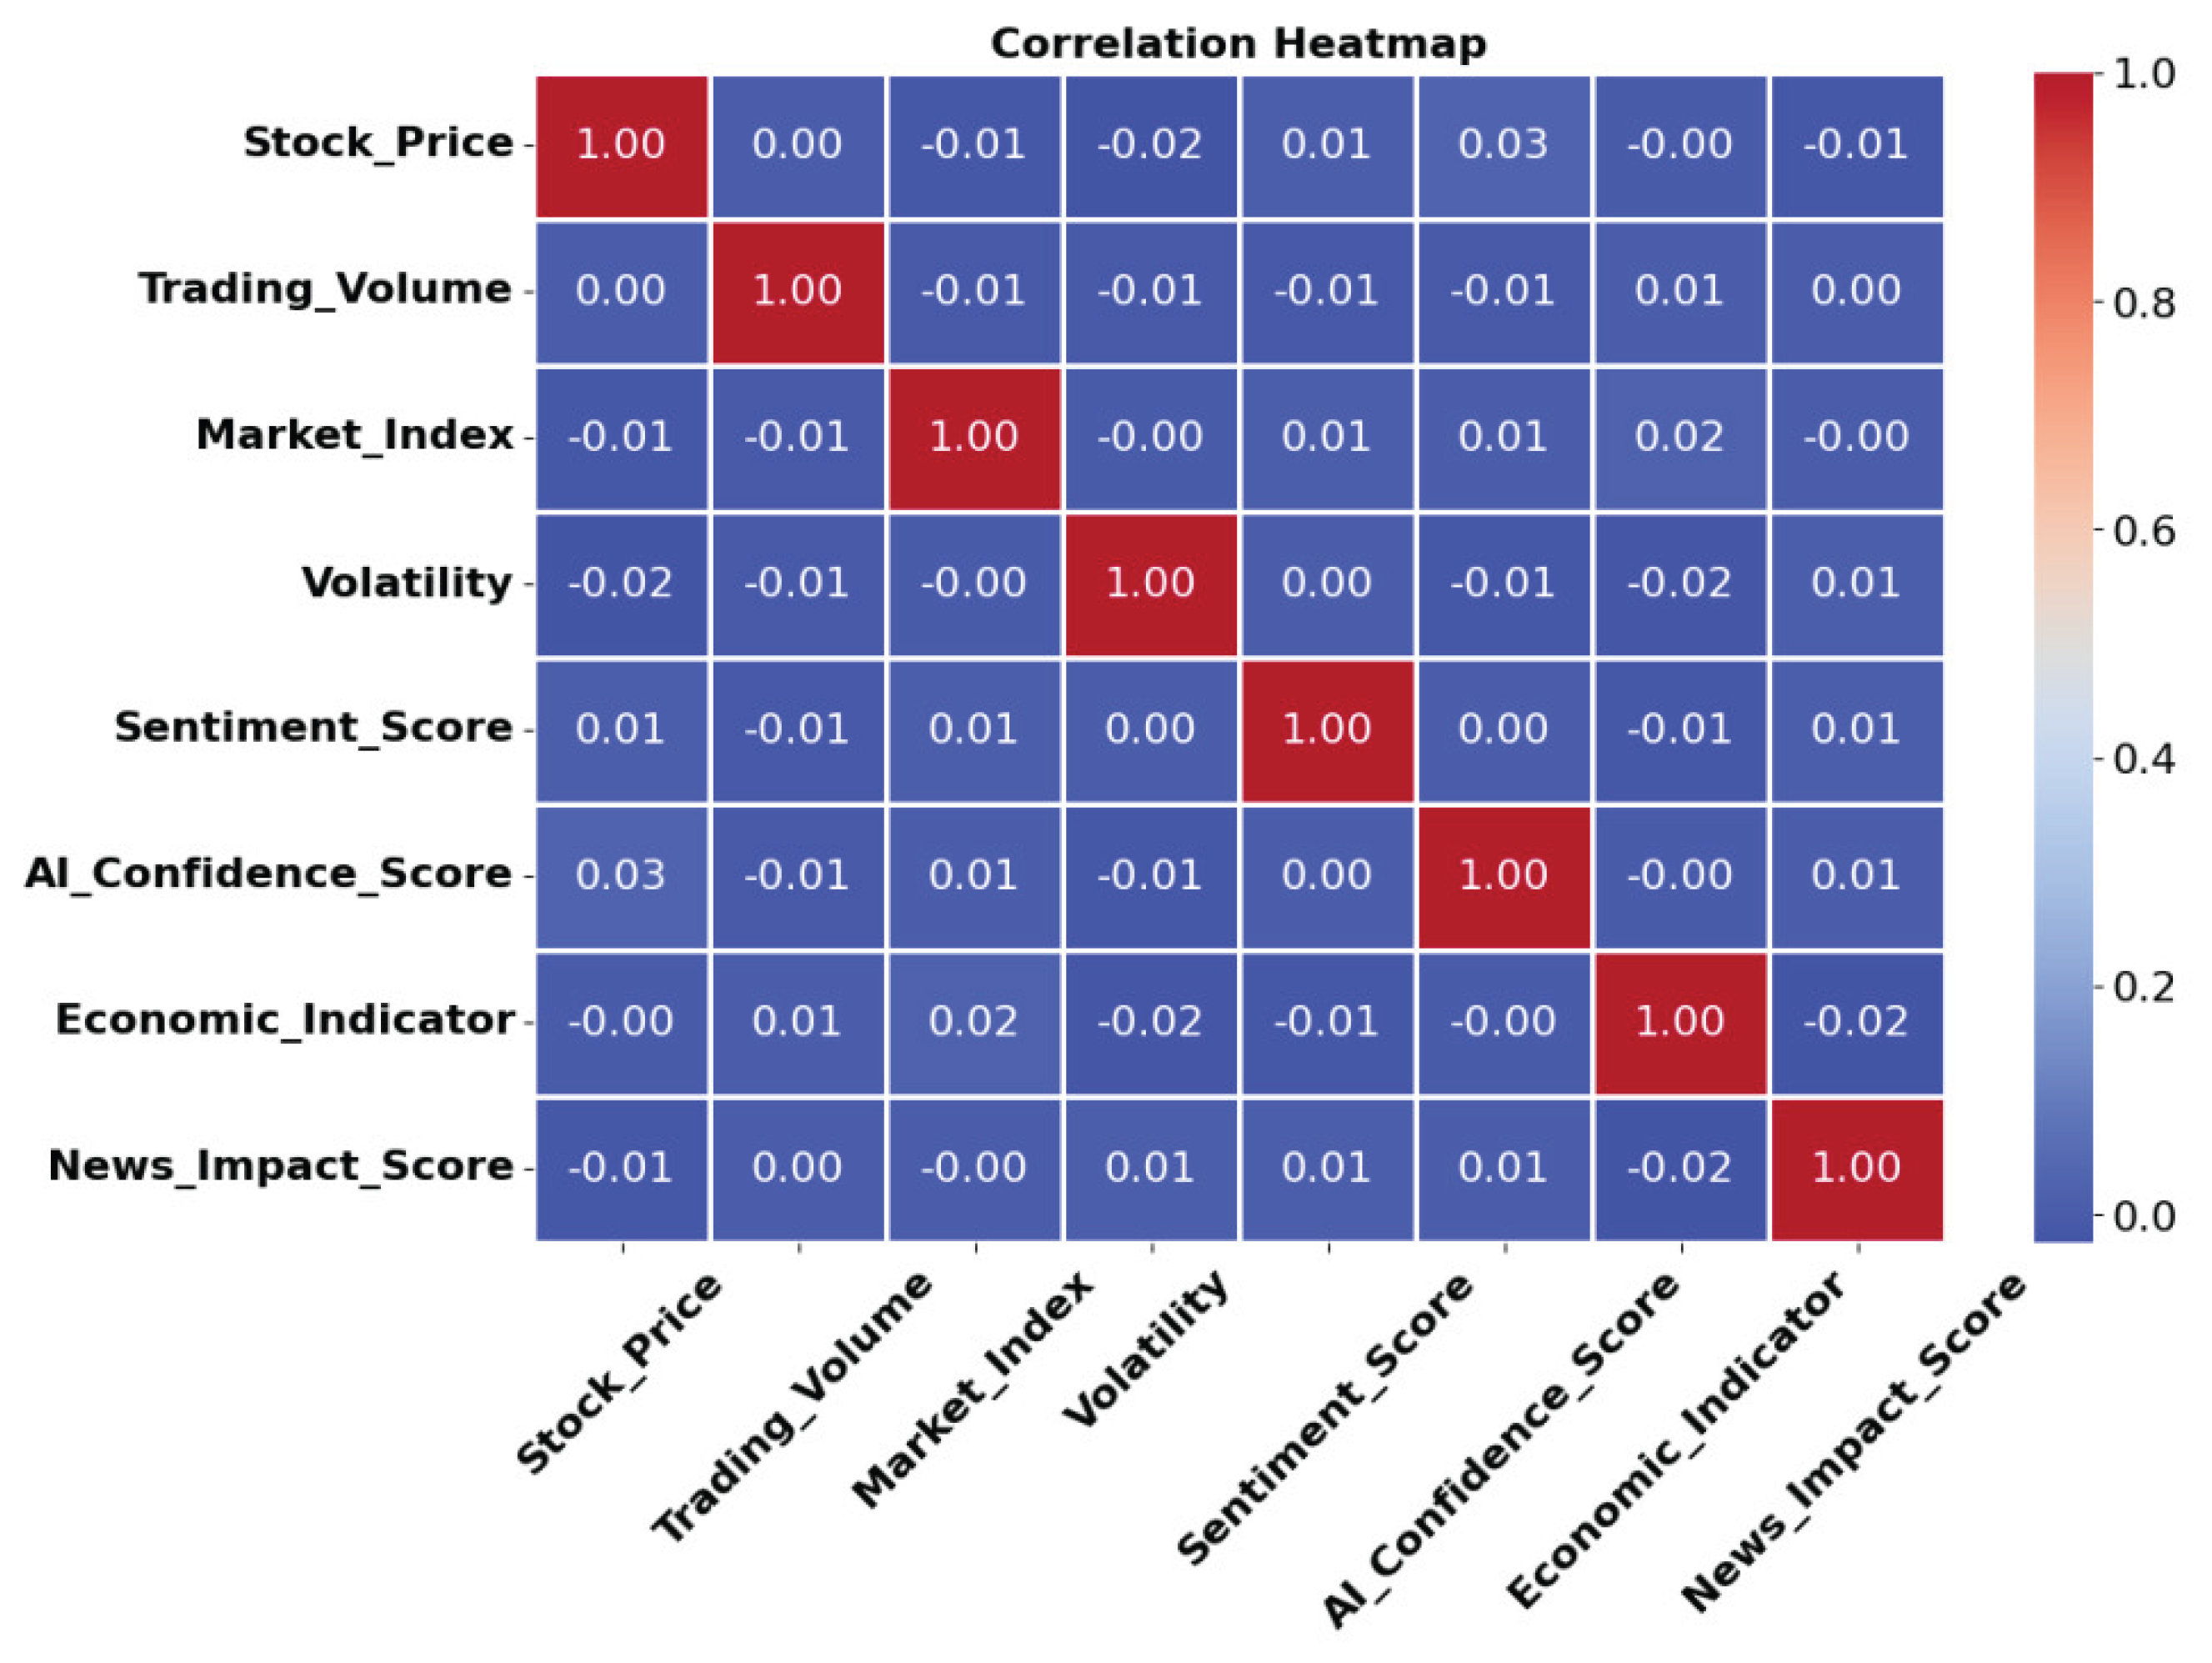
Figure 10.
The function value over iterations in 3D space.
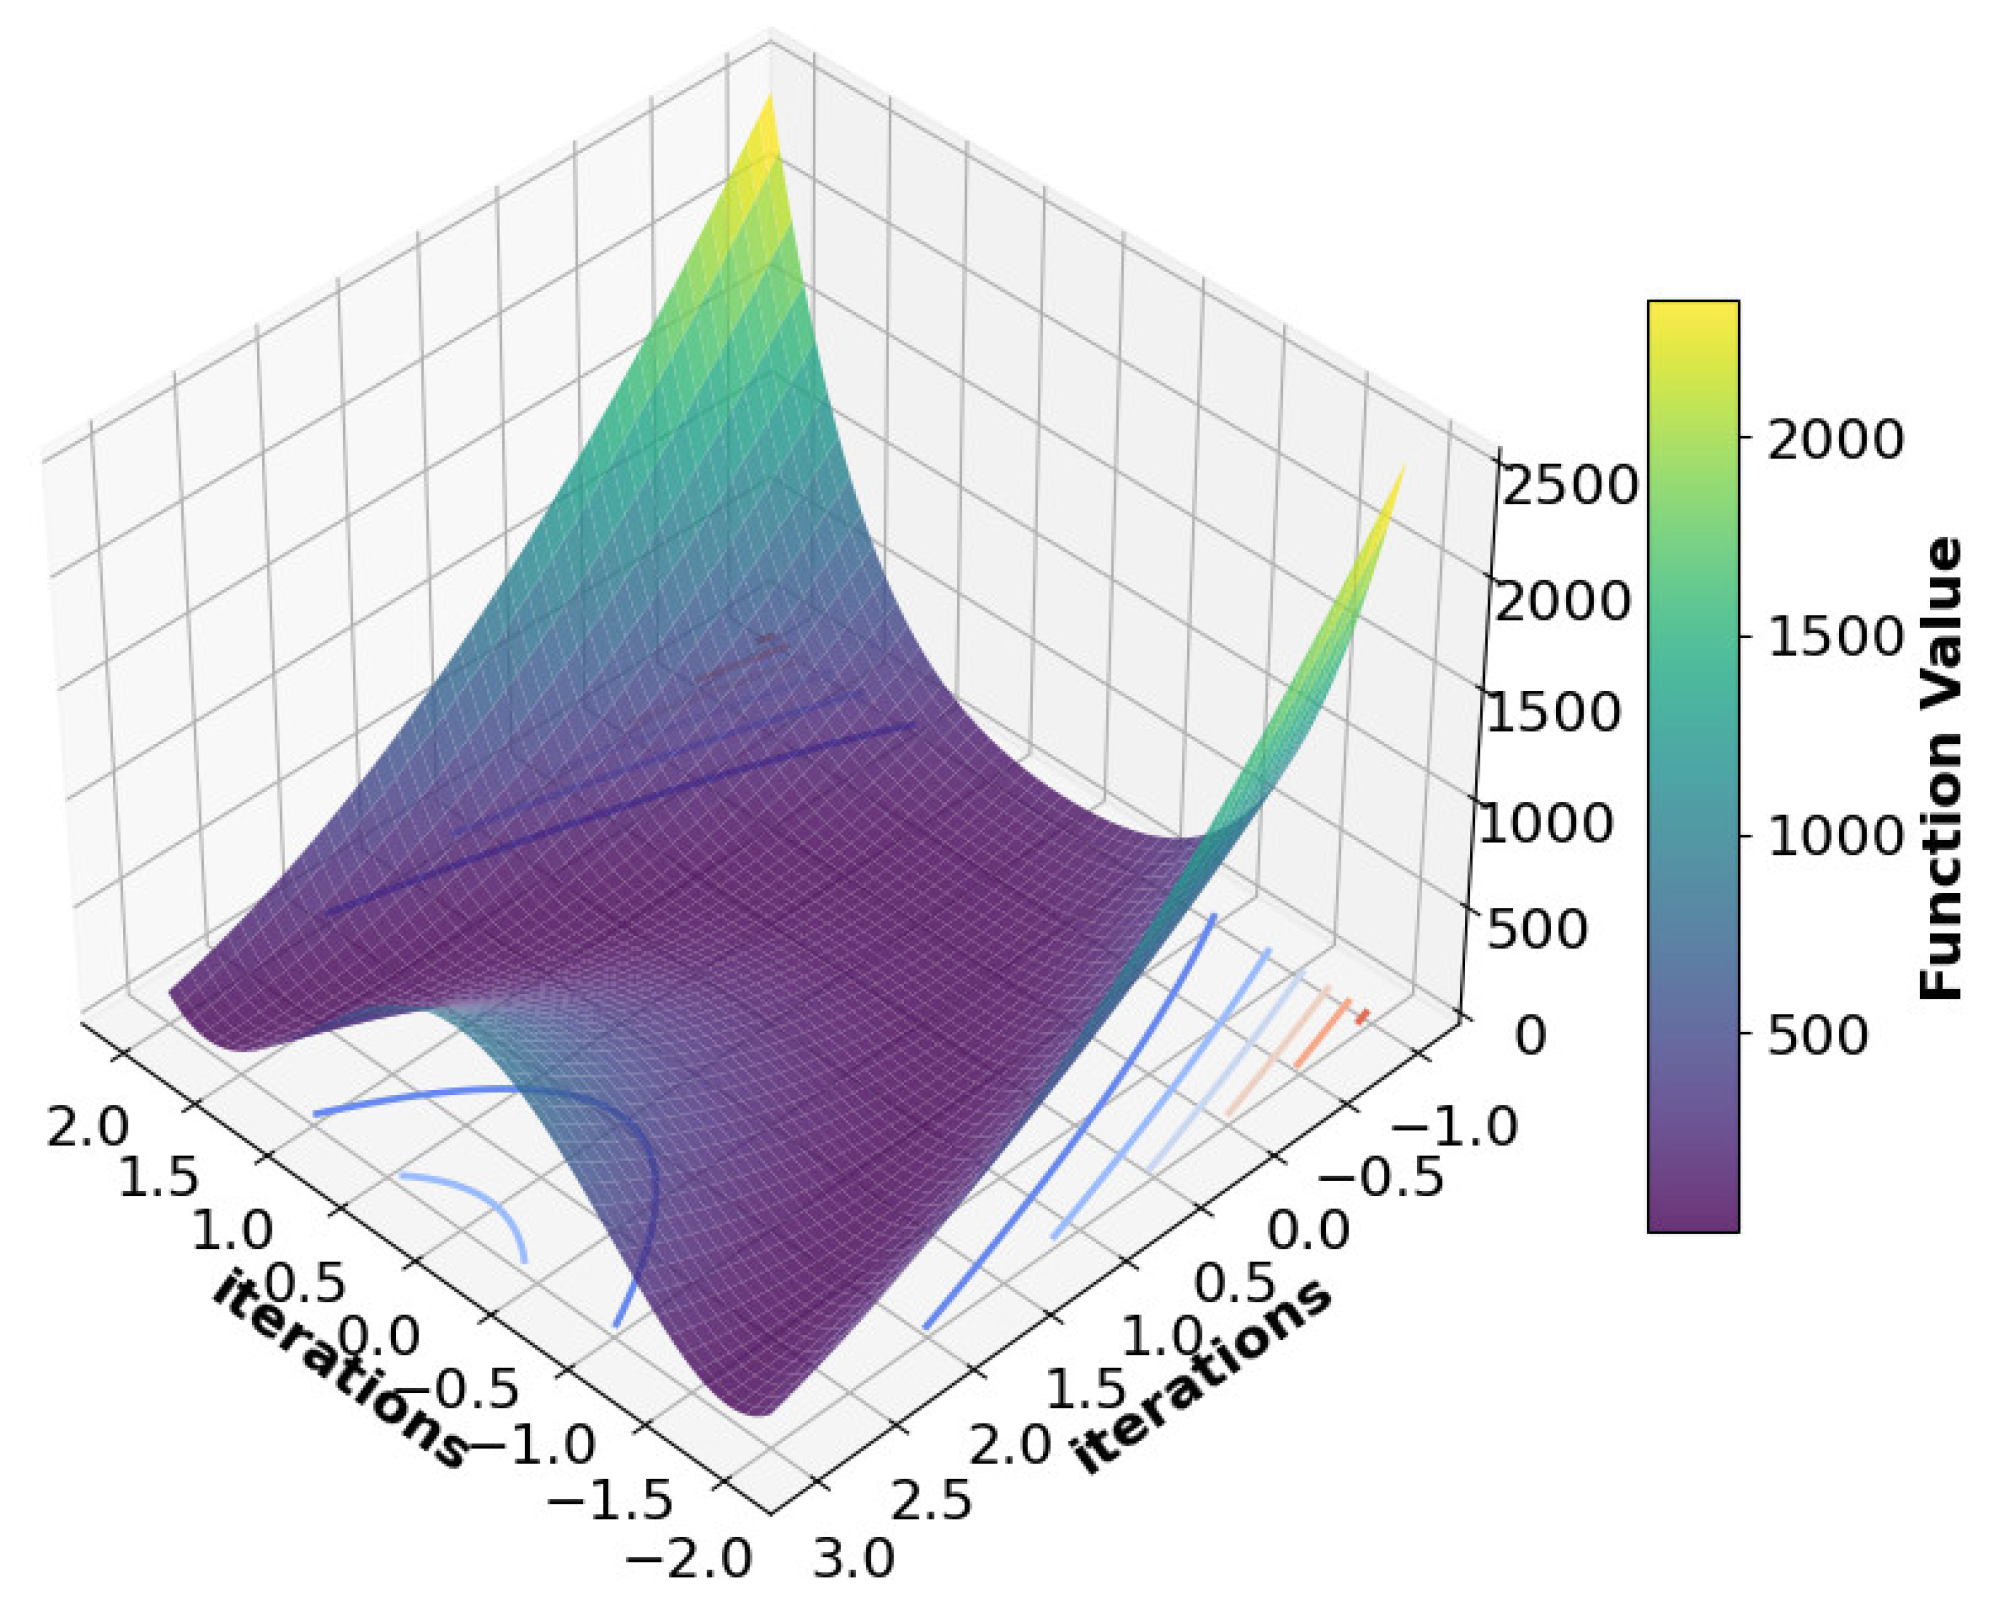
Figure 11.
The economic indicator.
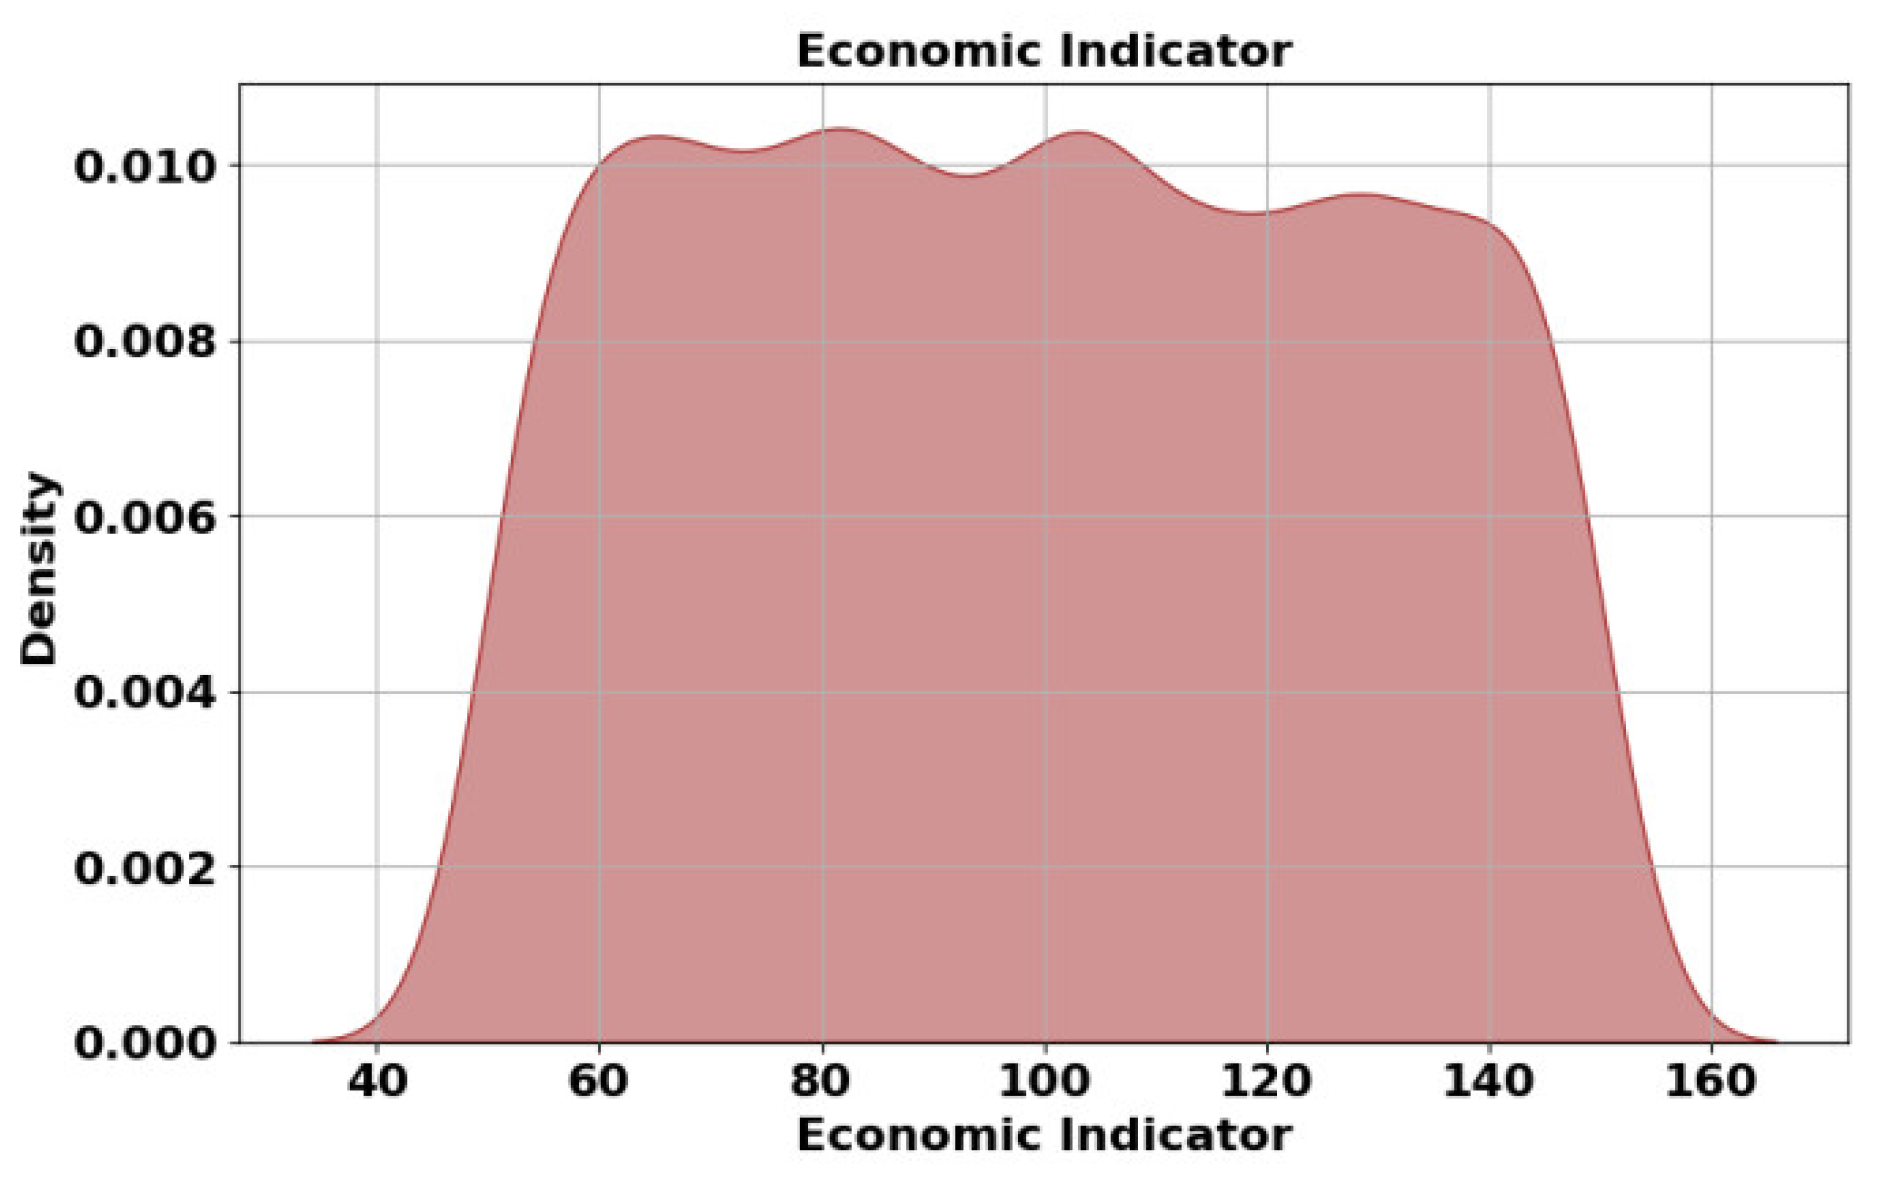

Table 1.
An overview of the method under evaluation.
| References | Methods | Advantages | Disadvantages |
|---|---|---|---|
| Mukherjee, et al. (Mukherjee, Somenath, et al.) | CNN-ANN | Deep learning optimization improves predictive performance. CNN uses a novel method (2D histograms) for dataset evaluation. | Computationally intensive due to deep learning models. Requires large datasets for effective training. |
| Sheth, et al. (Sheth, Dhruhi, and Manan Shah) | LSTM-SVM-ANN | Considers complex, non-linear correlations and patterns. ANN and SVM enhance prediction accuracy. | LSTM requires large datasets to perform well. High computational cost and complex training process. |
| Chandola, et al. (Chandola, Deeksha, et al.) | Word2Vec-LSTM | Considers both financial time series and news headlines. Improves decision-making by forecasting stock price direction. | Dependent on the quality of the text data and financial reports. Complexity increases with multi-source data. |
| Zhao, et al. (Zhao, Yanli, and Guang Yang) | SA-DLSTM | Combines LSTM, DAE, and ECNN for better feature extraction. Considers emotional changes to enhance prediction. |
High model complexity increases computational cost. Sentiment analysis can be sensitive to noise in user-generated data. |
| Mu, et al. (Mu, Guangyu, et al.) | MS-SSA-LSTM | Sentiment analysis improves predictive accuracy. Suitable for short-term prediction in volatile markets. |
Market instability can lead to overfitting. Requires specialized sentiment vocabulary for different markets. |
| Han, et al. (Han, Yechan, Jaeyun Kim, and David Enke) | NPMM | Market instability can lead to overfitting. Requires specialized sentiment vocabulary for different markets. | Performance depends on the quality of labeled data. May not generalize well to non-NASDAQ markets. |
| Jiao, et al. (Jiao, Xingrui, et al.) | PSO-LSTM | Combines text mining with market data for better predictions. Particle Swarm Optimization enhances LSTM performance. | Sensitive to noise in textual data. PSO adds computational complexity and longer training time. |
Table 2.
Implementation Parameters.
| Parameters | Description |
|---|---|
|
Proposed Neural Network OS Optimization Dataset Software |
HMRCGN2Nets Windows 10 CSBO Stock Market Volatility Python 3.7 |
Table 3.
Performance metrics.
| Performance metrics | Equations (30-35) |
|---|---|
| Precision | (30) |
| Recall | (31) |
| F1-Score | (32) |
| Accuracy | (33) |
| MAE | (34) |
| RMSE | (35) |
Table 4.
comparison of the suggested strategy with current practices.
| Methods |
CNN-ANN [16] |
LSTM-SVM-ANN [17] |
Word2Vec-LSTM [18] |
SA-DLSTM [19] |
MS-SSA-LSTM [20] |
NPMM [21] |
PSO-LSTM [22] |
HMRCGN2Nets+CSBO (Proposed) |
|---|---|---|---|---|---|---|---|---|
| Metrics | ||||||||
|
Accuracy (%) |
90.8 | 97.2 | 93.4 | 91.7 | 94.3 | 96.7 | 92.5 | 99.9 |
|
Recall (%) |
89.1 | 91.5 | 95.4 | 93.5 | 89.3 | 92.2 | 90.4 | 99.8 |
|
Precision (%) |
90.1 | 93.4 | 95.5 | 89.7 | 92.4 | 94.7 | 96.8 | 99.8 |
| Specificity (%) | 97.8 | 94.6 | 95.2 | 91.8 | 86.8 | 92.7 | 90.8 | 99.7 |
|
F1-Score (%) |
96.3 | 90.4 | 91.4 | 95.8 | 93.9 | 94.7 | 89.5 | 99.6 |
| MSE | 8.1 | 6.9 | 7.8 | 5.4 | 8.5 | 6.0 | 7.3 | 0.1 |
| MAE | 9.8 | 8.4 | 6.2 | 7.9 | 7.4 | 8.5 | 9.2 | 2.0 |
| RMSE | 6.0 | 7.8 | 8.5 | 9.2 | 8.4 | 7.3 | 6.8 | 2.1 |
Table 5.
Analysis of Hypotheses.
| Methods | Computational Cost | Complexity of Computation | Speed | Efficiency of Computation | Strongness |
|---|---|---|---|---|---|
| CNN-ANN [16] | 0.90 | 0.70 | 0.20 | 0.15 | 0.28 |
| LSTM-SVM-ANN [17] | 0.80 | 0.88 | 0.19 | 0.21 | 0.25 |
| Word2Vec-LSTM [18] | 0.59 | 0.70 | 0.28 | 0.10 | 0.10 |
| SA-DLSTM [19] | 0.78 | 0.85 | 0.30 | 0.20 | 0.21 |
| MS-SSA-LSTM [20] | 0.60 | 0.67 | 0.45 | 0.39 | 0.18 |
| NPMM [21] | 0.88 | 0.74 | 0.18 | 0.29 | 0.25 |
| PSO-LSTM [22] | 0.72 | 0.87 | 0.21 | 0.20 | 0.30 |
|
HMRCGN2Nets+CSBO (Proposed) |
0.01 | 0.04 | 0.99 | 0.99 | 0.99 |
Table 6.
Statistical Comparison of the Proposed Approach with Existing Approaches.
| Methods | SW Test p-Value | WSR test/U-test p-Value | H-test p-Value | KS test p-Value | FT p-Value | Mean | Standard Deviation | Variance Inflation Factor |
|---|---|---|---|---|---|---|---|---|
| CNN-ANN [16] | 0.470 | 0.380 | 0.69 | 0.079 | 0.090 | 278,700.17 | 3,310.19 | 1.95 |
| LSTM-SVM-ANN [17] | 0.360 | 0.270 | 0.75 | 0.068 | 0.077 | 460,990.20 | 2,220.65 | 1.89 |
| Word2Vec-LSTM [18] | 0.390 | 0.170 | 0.89 | 0.090 | 0.087 | 81,800.37 | 3,175.81 | 1.77 |
| SA-DLSTM [19] | 0.420 | 0.260 | 0.70 | 0.067 | 0.060 | 384,925.21 | 2,320.92 | 1.81 |
| MS-SSA-LSTM [20] | 0.310 | 0.399 | 0.92 | 0.078 | 0.075 | 282,450.91 | 1,143.74 | 1.90 |
| NPMM [21] | 0.355 | 0.437 | 0.80 | 0.080 | 0.080 | 69,780.51 | 5,322.80 | 1.70 |
| PSO-LSTM [22] | 0.282 | 0.310 | 0.78 | 0.098 | 0.091 | 66,840.50 | 1,382.89 | 1.49 |
|
HMRCGN2Nets+CSBO (Proposed) |
<0.001 | <0.001 | <0.001 | <0.001 | <0.001 | 65,923.20 | 6,599.93 | 1.001 |
Table 7.
Ablation study.
| Model Configuration | HCNN | MRGAT | CSBO | Accuracy (%) | Precision (%) | Recall (%) | F1 Score (%) |
|---|---|---|---|---|---|---|---|
| Baseline (Without CSBO) | ✔ | ✔ | ✘ | 90.3 | 92.1 | 93.5 | 94.8 |
| HCNNOnly | ✔ | ✘ | ✘ | 81.8 | 79.3 | 76.9 | 80.1 |
| MRGATOnly | ✘ | ✔ | ✘ | 82.6 | 80.8 | 78.9 | 83.9 |
| HCNN+ CSBO | ✔ | ✘ | ✔ | 89.5 | 90.9 | 89.7 | 91.3 |
| MRGAT+ CSBO | ✘ | ✔ | ✔ | 88.7 | 91.5 | 88.9 | 92.4 |
| Full Model (HMRCGN2Nets+CSBO) | ✔ | ✔ | ✔ | 99.9 | 99.8 | 99.7 | 99.6 |
Disclaimer/Publisher’s Note: The statements, opinions and data contained in all publications are solely those of the individual author(s) and contributor(s) and not of MDPI and/or the editor(s). MDPI and/or the editor(s) disclaim responsibility for any injury to people or property resulting from any ideas, methods, instructions or products referred to in the content. |
© 2025 by the authors. Licensee MDPI, Basel, Switzerland. This article is an open access article distributed under the terms and conditions of the Creative Commons Attribution (CC BY) license (http://creativecommons.org/licenses/by/4.0/).
Copyright: This open access article is published under a Creative Commons CC BY 4.0 license, which permit the free download, distribution, and reuse, provided that the author and preprint are cited in any reuse.


