
Submitted:
18 October 2024
Posted:
18 October 2024
You are already at the latest version
Abstract
This research presents a comparative analysis of various deep learning models—including Recurrent Neural Networks (RNN), Long Short-Term Memory (LSTM), Convolutional Neural Networks (CNN), Gated Recurrent Units (GRU), and Attention LSTM—in predicting stock prices of major companies in the Indian stock market, specifically HDFC, TCS, ICICI, Reliance, and Nifty. The study evaluates model performance using key regression metrics such as Mean Absolute Error (MAE), Mean Squared Error (MSE), and R-Squared (R²). The results indicate that CNN and GRU models generally outperform the others, depending on the specific stock, and demonstrate superior capabilities in forecasting stock price movements. This investigation provides insights into the strengths and limitations of each model while highlighting potential avenues for improvement through feature engineering and hyperparameter optimization.
Keywords:
Stock Prediction
; Deep Learning
; Recurrent Neural Networks
; Long Short-Term Memory
; Convolutional Neural Networks
; Indian Stock Market
1. Introduction
In the finance sector, stock price prediction remains a critical challenge for organizations as it offers key insights that investors, traders, and financial institutions need to make informed decisions, manage risks, and enhance their profitability. The inherent complexity, dynamism, and non-linearity of financial markets make it particularly difficult to develop accurate forecasting models [1,2]. For decades, traditional statistical techniques such as Autoregressive Integrated Moving Average (ARIMA) and Generalised Autoregressive Conditional Heteroskedasticity (GARCH) have been the backbone of financial time-series forecasting. However, these models typically assume linearity and often struggle to capture the intricate non-linear dependencies present in stock price data.
Efforts to improve prediction accuracy through machine learning techniques have seen moderate success. Support Vector Machines (SVM) and Random Forests, for instance, have been applied to stock price forecasting, yielding promising results [3,4,5,6]. Nevertheless, these methods often fall short in capturing long-term dependencies, which are crucial for accurate predictions in the financial domain.
In contrast, deep learning models, particularly Recurrent Neural Networks (RNNs), Long Short-Term Memory (LSTM) networks, and Gated Recurrent Units (GRUs), have emerged as powerful tools for time-series analysis within the financial sector [7,8]. RNNs are designed to handle temporal dependencies, but their performance is frequently hindered by the vanishing gradient problem, which limits their ability to model long-term dependencies. LSTM and GRU architectures, with their memory cells and gating mechanisms, effectively address these limitations, enabling them to discern both short-term fluctuations and long-term trends in time-series data.
Additionally, Convolutional Neural Networks (CNNs), which have primarily been utilized for image processing, have demonstrated potential in financial forecasting by identifying local temporal patterns in stock prices [7]. Hybrid models that integrate LSTM networks with attention mechanisms further enhance predictive accuracy by focusing on essential components of the input sequence.
Despite the growing body of literature on the application of deep learning models for stock price prediction, there remains a paucity of comprehensive comparisons regarding the efficacy of these models across various stocks, particularly within the Indian market. This study aims to bridge this gap by conducting a thorough comparative analysis of RNN, LSTM, CNN, GRU, and Attention LSTM models in predicting the stock prices of five major Indian companies: HDFC, TCS, ICICI, Reliance, and the Nifty 50 index [9]. These companies are pivotal to key sectors of the Indian economy, making them suitable candidates for evaluating the effectiveness of different deep learning strategies [10].
Furthermore, this study will not only elucidate the performance of various models in stock price prediction but will also discuss the implications of these findings for investors and practitioners in the financial sector. The following sections will provide a comprehensive literature review of existing research on stock price prediction using deep learning methodologies, detailing the processes of data acquisition and model deployment. This will be followed by an in-depth comparison of the results and a discussion of the broader implications of the study’s findings.
2. Related Work
Predicting stock prices has long been regarded as a formidable challenge due to the inherent volatility and unpredictability of financial markets. Traditional approaches to financial forecasting have primarily relied on time series models, such as Autoregressive Integrated Moving Average (ARIMA) and Generalised Autoregressive Conditional Heteroskedasticity (GARCH). While these models are beneficial for specific forecasting tasks, they suffer from significant limitations, particularly their reliance on linearity. This is problematic given the non-linear nature of stock market data, which often necessitates more sophisticated modeling techniques [11]. In recent years, researchers have increasingly turned to machine learning models for stock price prediction. A pivotal study by Patel et al. examined various traditional machine learning approaches, including Support Vector Machines (SVM), Random Forest (RF), and Artificial Neural Networks (ANN). Their findings indicated that machine learning models outperformed statistical methods due to their ability to handle complex relationships and process large datasets. However, these models also faced challenges in addressing the sequential and temporal dynamics inherent in stock market data [11]. To effectively manage sequential data, Recurrent Neural Networks (RNNs) were among the first deep learning architectures applied to time series forecasting. While RNNs are designed to capture temporal dependencies, they encounter limitations due to the vanishing gradient problem, which hinders their capacity to represent long-range relationships in time-series data [12]. To overcome these challenges, Hochreiter and Schmidhuber introduced Long Short-Term Memory (LSTM) networks in 1997, which incorporate memory cells and gating mechanisms to enhance predictive accuracy for financial time series. Numerous studies have demonstrated the efficacy of LSTMs in stock price forecasting. For example, Shen and Shafiq [13] investigated the application of LSTMs for short-term trend predictions in the Chinese stock market, finding that LSTMs provided superior accuracy and stability compared to traditional machine learning models. Similarly, research by Fathali et al. [4], which compared LSTM, RNN, and CNN models for forecasting the Nifty 50 index, confirmed that LSTMs generally exhibited lower mean squared error (MSE) and higher prediction accuracy. Initially developed for image processing tasks, Convolutional Neural Networks (CNNs) have been adapted for time series forecasting, including stock price predictions. CNNs excel at capturing local temporal patterns, making them particularly effective for stocks that exhibit stable and repetitive behaviors. The integration of CNNs with LSTMs has shown to enhance predictive performance. For instance, Sen et al. [14] explored a hybrid CNN-LSTM model for stock price prediction in the Indian markets and found that this combined approach outperformed models utilizing LSTMs or CNNs in isolation. Gated Recurrent Units (GRUs) simplify the architecture of LSTMs by merging the forget and input gates into a single gate. This simplification enhances computational efficiency while retaining the ability to model long-term dependencies effectively. Studies have indicated that GRUs perform exceptionally well in predicting stock prices, particularly for volatile assets. Singh [3] examined the effectiveness of GRU models in predicting stock prices for prominent Indian companies, concluding that GRUs offer similar predictive accuracy to LSTMs while being more computationally efficient. Recent research has focused on hybrid models that combine various deep learning techniques to improve prediction accuracy. A notable example is the Attention LSTM model, which integrates attention mechanisms with LSTM architecture. This approach enables the model to concentrate on critical time steps or features relevant to the prediction task, enhancing both interpretability and performance [3]. Hernández et al. [15] further noted that attention mechanisms could refine a model’s focus on essential temporal trends, thereby improving the precision of time-series forecasting [15]. While considerable progress has been made in stock price prediction using deep learning models, the current literature lacks comprehensive analyses of various methodologies applied across different market conditions, particularly in the Indian context. This study contributes to the field by:
- Conducting a thorough analysis of RNN, LSTM, CNN, GRU, and Attention LSTM models for stock price prediction.
- Evaluating these models using a selection of Indian stocks, including HDFC, TCS, ICICI, Reliance, and the Nifty 50 index.
- Assessing the strengths and weaknesses of each model, with a particular focus on their ability to manage both volatile and stable stocks.
The following sections will detail the processes of data collection, preprocessing, and the experimental framework designed to evaluate the performance of these models.
3. Materials and Methods
In this section of the analysis, we examine the dataset that underpins predicting stock prices, describe the preprocessing activities carried out, showcase the deep learning models implemented, detail the training procedure, and present the evaluation criteria. Each component of the methodology aims to secure the most precise and efficient evaluation of different deep learning models for making stock price forecasts within the Indian stock market. Figure 1 depicts the methodology flow of the experiment.
3.1. Data Collection
The stock price data for this study was sourced from the National Stock Exchange (NSE) of India, focusing on five major companies: HDFC, TCS, ICICI, Reliance, and the Nifty 50 index. The selection of these companies was deliberate, as they represent various sectors of the Indian economy, including finance, technology, energy, and the broader stock market itself through the Nifty 50. The dataset encompasses a timeframe from January 2016 to December 2021, providing over five years of daily stock price data. The collected data includes the following key metrics:
- Open Price: The price at which the stock begins trading when the market opens.
- Close Price: The price at which the stock concludes trading when the market closes.
- High Price: The highest price at which the stock was traded during the day.
- Low Price: The lowest price at which the stock was traded during the day.
- Volume: The total number of shares traded during the day.
Utilizing a five-year dataset is crucial to ensure that the models are exposed to a diverse range of market conditions, including bull and bear markets, as well as periods of heightened volatility that are typical in stock trading. While several previous studies have employed similar datasets for stock price forecasting, they have predominantly focused on shorter timeframes.
3.2. Data Preprocessing
Stock market data is often noisy and incomplete due to factors such as non-trading days and market fluctuations, necessitating thorough preprocessing before the application of deep learning models. The following steps were implemented to ensure data quality:
3.2.1. Handling Missing Data
Missing data may arise from non-trading days (e.g., weekends and holidays) or market outages. Such gaps can hinder model training and degrade performance. To address this issue, a common technique known as linear interpolation was employed to handle missing values. This method estimates missing values by leveraging data from the preceding and subsequent trading days [16]. By using linear interpolation, the time series remains continuous, minimizing biases that can result from random data imputation.
3.2.2. Normalization
With the diverse nature of stock prices and trading volumes, we normalized all features using Min-Max scaling, resulting in a range of [0,1]. Achieving faster convergence speed in deep learning models while ensuring none overpower the learning process depends significantly on this normalization technique [17,18]. Many financial forecasting techniques find MinMax normalization helpful, as it improves performance with extensive datasets featuring different scales. The normalization formula is as follows:
where x is the original feature value, is the minimum value of the feature, and is the maximum value of the feature.
3.2.3. Train-Test Split
In order to gauge the performance of the deep learning models with unseen data, the dataset was separated into splitting it into training and testing sets. The training data, amounting to 80% of the total (from January 2016 through to December 2020), was coupled with a 20% testing subset (from January through to December 2021). This partition ensures that, during training, historical data is utilized and that, for validation, more recent and previously unseen data is incorporated [18,19]. The training proposed varied conditions, facilitating learning for the models through diverse stock market stages, such as growth cycles, market corrections, and periods of heightened volatility.
3.3. Deep Learning Architectures
This study explores five different deep learning architectures: A Recurrent Neural Network (RNN), a Long Short-Term Memory (LSTM), a Convolutional Neural Network (CNN), a Gated Recurrent Unit (GRU), and an Attention LSTM are all part of the discussion. The selection of each architecture was due to its relevance for time-series prediction tasks, especially within financial markets [1,20,21,22,23,24].
3.3.1. Vanilla RNN
The sequential data processing of neural network models includes RNNs among the earliest in existence. The skill to preserve inconspicuous states that amass information from earlier time steps makes them perfect for time-series data, in which each data point is linked to preceding data[12,17,19]. Nonetheless, RNNs suffer from the vanishing gradient challenge, making them ineffective for the representation of extended relationships in time series. In this work, we trained a basic RNN of one hidden layer and 100 units using the Adam optimizer.
3.3.2. LSTM
The creation of LSTM networks was meant to address the deficiencies of regular RNNs through the deployment of memory cells that can hold information for prolonged lengths of time [25]. The recognition capability of memory cells in LSTMs for immediate and historical dependencies makes them extremely valuable for stock price prediction, because trends usually follow long-term styles [16,19,26]. The LSTM model as part of this research includes two LSTM layers, each composed of 64 units, leading to a dense layer for final predictions. An addition of a dropout layer helped alleviate overfitting [27].
3.3.3. CNN
Generally speaking, CNNs are employed in image processing, but they have also been modified for time-series data owing to their strength in local pattern recognition [18,28]. By sliding a filter over the time series, CNNs in stock price forecasting can detect short-term trends, including rapid price changes and minor corrections[14,18,29]. The CNN model implemented in this study consists of one convolutional layer, which has 64 filters and a kernel that is 3 in size. Once these layers are complete, maximum pooling layers are in place to contract feature maps and lower the computational weight. In the end, the model features a fully connected dense layer to deliver the predicted stock prices. CNNs have shown a remarkable ability to uncover short-term trends while successfully adding to financial forecasting models [18].
3.3.4. GRU
GRUs exhibit a prototype of LSTMs that simplify computational complexity by fusing the forget gate and the input gate into an update gate [19,23,26,30]. In conditions where computational resources are limited, the fast training capabilities of these GRUs together with their potential to analyze long-term dependencies make them suitable for stock price prediction [26]. The GRU model employed in this study has two layers of GRU with 64 units each, followed by an output layer that is dense. Showings reveal that GRUs can better perform than LSTMs in specific time-series forecasting jobs thanks to their simplified designs and faster convergence.
3.3.5. LSTM with Attention Mechanism
Due to their ability to target important parts of the input sequence, attention mechanisms have recently become a popular choice in time-series forecasting [15]. The model can measure the significance of particular time steps by applying attention mechanisms to stock price prediction, which provides both improved interpretability and better prediction accuracy [15]. The attention layer of the Attention LSTM model featured in this study operates after an LSTM layer, assigning weight to each time step based on its importance for the prediction task. Successful implementation of attention mechanisms has occurred in many areas, such as stock market prediction, where they facilitate better results by permitting the model to focus on key market happenings.
3.4. Model Training
All models used the Adam optimizer, a widely adopted choice in deep learning for its capability to modify learning rates during the training phase [30]. At the outset, the learning rate was 0.001, and the application of early stopping helped to ward off overfitting. After 10 unchanging epochs of validation loss, trigging early stopping is the subsequent action taken. The training for the models took place over 50 epochs, with a batch size of 64, a frequent selection for time series data. Within training, the models were gauged on a validation set to keep track of their performance and make hyperparameter corrections. We carried out the training using an NVIDIA Tesla GPU that greatly decreased training time when compared to training utilizing CPUs. Thanks to GPU acceleration, we were able to efficiently train large models like LSTM and Attention LSTM, which need additional computational power because of their elaborated architectures. Earlier research has pointed out that GPU acceleration plays a key role in the training of deep learning models with large amounts of data, which includes stock market data.
3.5. Evaluation Metrics
To evaluate the performance of the deep learning models, we used several standard regression metrics commonly applied in financial forecasting:
Mean Absolute Error (MAE): MAE measures the typical significance of prediction errors, which delivers an easy assessment of accuracy while treating big and small errors equally [31].
The MAE is given by the formula below:
where is the actual value, is the predicted value, and n is the total number of data points.
Mean Squared Error (MSE): The approach taken by MSE highlights minor errors better than MAE, making it more robust against outliers. This is especially useful for stock price forecasting, since large price changes can substantially influence the precision of model predictions[31].
Root Mean Squared Error (RMSE): The root of MSE, RMSE, gives us an error metric which is in original scale of stock prices which may be easier for the financial applications. The causes for this is that RMSE is usually used in predicting stock prices since it offers simple interpretation of prediction errors that is in the units of the original scale [31].
R-Squared (R²): R-Squared or the Coefficient of Determination measure how close the predicted values are to the actual values, with regard to their quality. It includes the amount of explained variations in the dependent variable by the independent variables [31]. R² values range from 0 to 1 where a model with higher value of R² is a better model. R² evaluates the possibility to apply a model to the forecast of stock prices, pointing to its ability to describe the market.
where is the mean of the actual values. represents the proportion of variance in the dependent variable that is predictable from the independent variables.
The chosen indicators allow analyzing the efficiency of the selected models in terms of accuracy: the ‘typical’ accuracy (MAE, MSE) and the ability to work with extreme and significant differences from actual stock prices (RMSE, R²).
4. Results and Discussion
This section presents the results of the comparative analysis of five deep learning models—RNN, LSTM, CNN, GRU, and Attention LSTM—used for stock price prediction on five major Indian stocks: HDFC, TCS, ICICI, Reliance, along with Nifty 50. The evaluation of the models considered Mean Absolute Error (MAE), Mean Squared Error (MSE), Root Mean Squared Error (RMSE), and R-Square (R²). The discussion pertains to each stock in regard to data analysis and model performance.
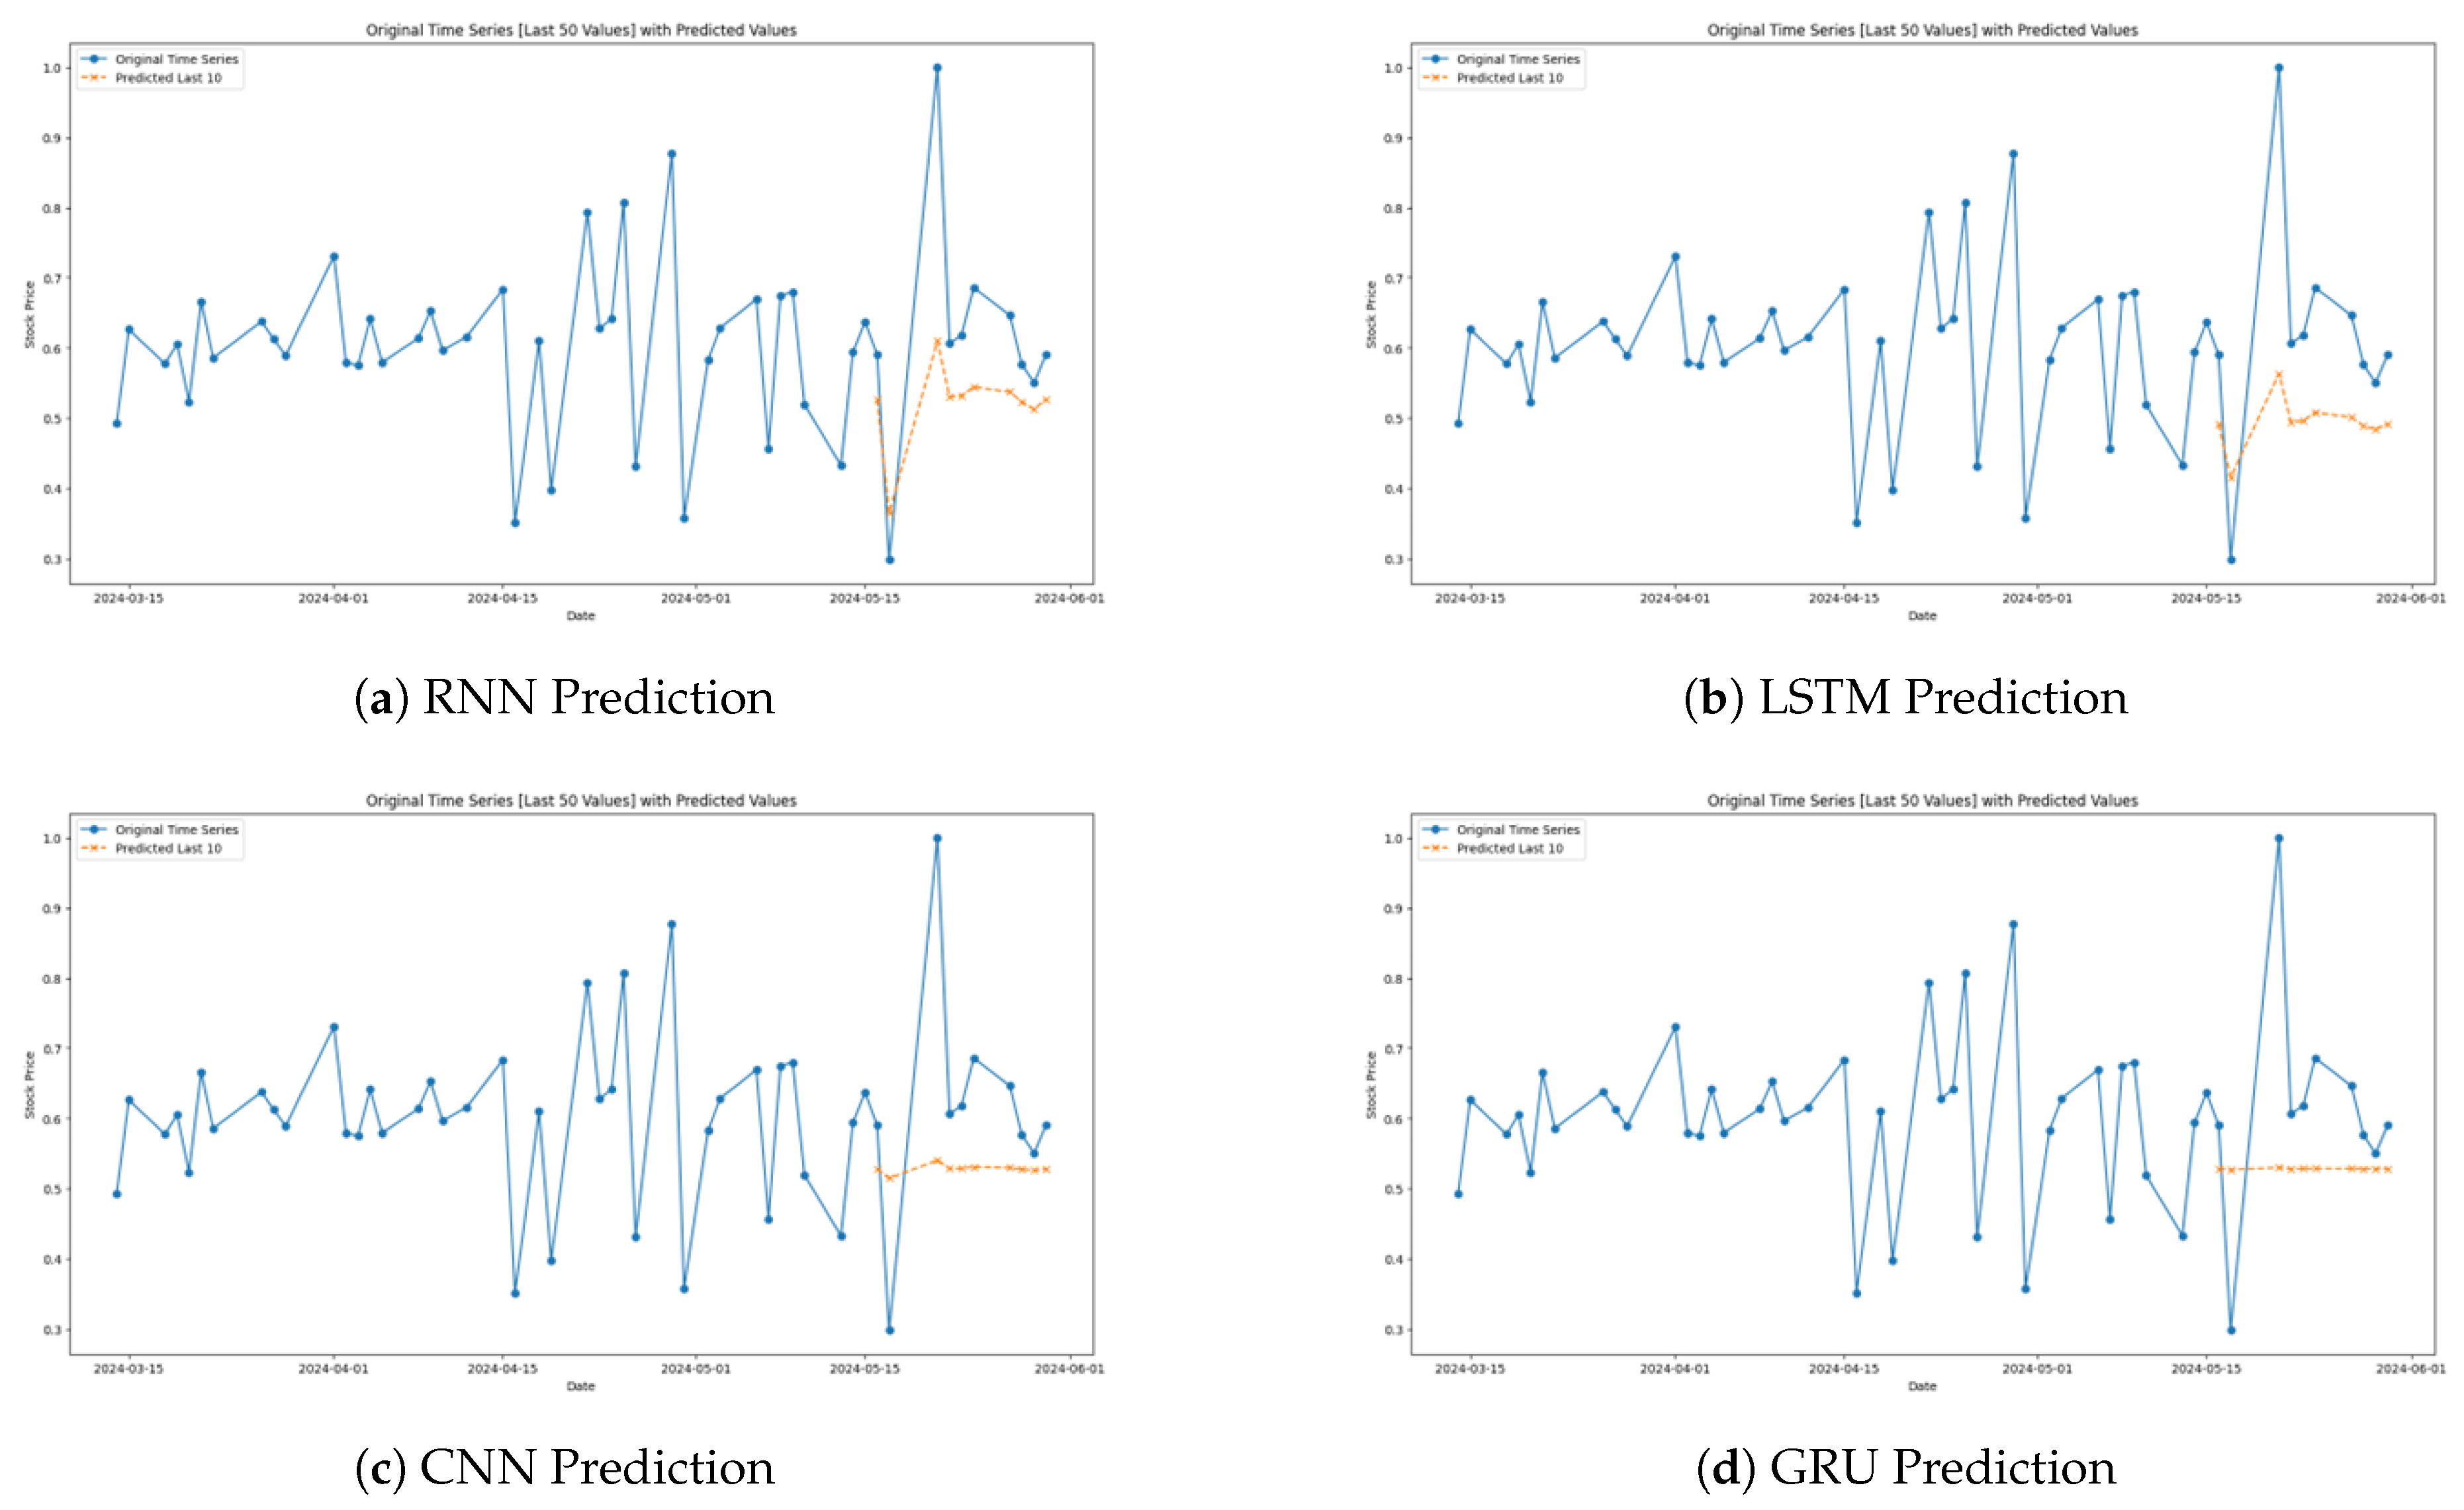
4.1. HDFC Stock
The performance of the models for HDFC stock prediction is summarized in Table 1. The RNN model demonstrated the lowest performance, with an R-Square of -0.014790, indicating poor correlation between predicted and actual stock prices. The LSTM model slightly improved upon this with an R-Square of 0.015231. However, the CNN model performed the best for HDFC, achieving a MAE of 0.201941, an MSE of 0.074096, and an R-Square of 0.007445, indicating better prediction accuracy. GRU and Attention LSTM models performed similarly, though slightly worse than CNN.
The prediction for the models specifically for the HDFC Stock is shown in Figure 2 below.
As for the models, the basic RNN performs worst in predicting the actual stock price path with considerable distortions from the real trends (Figure 2a). Although RNNs are basic for sequential data analysis, they are often replaced by more effective models, such as LSTM and GRU in cases when patterns are more comprehensive or when the analysis involves a larger memory of dependencies.The LSTM model validates the potential of approximating the variation of HDFC’s stock price accurately in all the directions (Figure 2b).
Specifically, the general behavior of the CNN model is to stay close to the trendline of the underlying stock price data, though, at specific moments, it considerably differs, especially during high volatile moments (Figure 2c). It is very good at capturing bigger trends but not so great at capturing specific highs and lows.
The resulting GRU model makes for a decent performance which plots the general trajectory of the stock prices as follows (Figure 2d). However, it also has a weakness; it does not capture abrupt changes on the market such as the CNN’s ability to demonstrate a steep rise and a steep fall. GRUs perform adequately for slight deviations and are highly reliable but fail to capture the overall extrema concerning the price fluctuations.
As therefore seen from the graphs above, the Attention LSTM model is highly accurate in predicting the trends and fluctuations of the HDFC stock prices (Figure 2e). It also predicts well actual results especially in areas that the stock has made sharp movements.
4.2. TCS Stock
The model performance for TCS stock prediction is presented in Table 2. The RNN model exhibited the worst performance with an R-Square of −1.792222, reflecting a poor fit to the data. The LSTM and CNN models showed better predictive performance, with the LSTM model achieving a MAE of 0.286867 and an R-Square of −0.226954. The CNN model performed similarly, with an MSE of 0.119834. The Attention LSTM model had the best performance for TCS, with a MAE of 0.275316 and an R-Square of −0.051711, indicating an improvement over the other models.
The prediction for the models specifically for the TCS Stock is shown in Figure 3 below.
As seen from the first graph of the RNN model (Figure 3a), there is quite a major problem of fitting a low and high intensity in predicting the TCS stock prices as it prominently under and over fit. This behaviour shows another problem of the RNN, which does not work well with patterns in stock data. Because of its structure, although they are considered as a staple for sequential data processing, the problems associated with them, for instance, long dependency sequences and vanishing gradients impact the performance of the RNNs in dynamic settings like the stock market where precise data is required.
The second graph shows the impact of LSTM model (Figure 3b) in forecasting the movements of TCS stock price movements better than RNN. Since the LSTM can retain information over long periods, owing to its complex gating mechanism, the volatility of the stock prices is effectively managed by the model. It quickly adapts to sharp density fluctuations of the price level and provides a closer match to the cyclic patterns inherent in the stock exchange.
The third graph depicts that the CNN (Figure 3c) has a fairly good performance in mimicking the overall trend of TCS stock prices but lacks in capturing both high and low fluctuations of prices. CNNs are employed to recognize spatial patterns over the slid- ing time windows within time series analysis; these are well-known for that purpose. These results imply that while moderate and calm patterns are capture correctly by this model, it does not compare as well with the sudden and sharp patterns characteristic of financial markets.
The fourth graph shows the GRU model (Figure 3d) as it has similar performance as the LSTM but more sensitive to price changes. Like LSTMs, GRUs have a great capability the handle temporal dependencies, but it has a simpler structure. This attribute makes the GRU most effective for tick data such as the stock prices as they require the model to pay attention to relevant information especially when it’s new, without the increased computational requirement of other advances gating mechanisms.
Interestingly, the Attention LSTM model (Figure 3e) for the invest of the stocks does not reveal the best alignment with actual stock prices. They fail to capture the minute details of the change in the data of TCS, along with the broader trends. The addition of attention mechanism, that should make the model pay more attention to specific segments of the input data, does not seem to provide for the increase of the model’s accuracy in this case.
4.3. ICICI Stock
The model performance for ICICI stock prediction is summarized in Table 3. Both the RNN and LSTM models performed similarly, with an R-Square of 0.138293, showing moderate predictive accuracy. The CNN model had a slightly lower R-Square of 0.039685, while the GRU model showed better results than CNN with an R-Square of 0.054675. Attention LSTM, however, had the weakest performance with an R-Square of −0.026750, making it the least effective model for ICICI stock prediction.
Figure 4 shows the prediction of the models for the last 10 samples of the ICICI stock data.
The first graph (Figure 4a) shows the forecasted values with the help of the RNN for incremental stock prices of ICICI. While it indicates some similarity to actual equity flows it also presents important discrepancies including the inability to show more fluctuation. As a basic recurrent neural network, the given architecture fails to deal with such intricacies and sharp fluctuations characteristic of the stock data, which highlights the inherent weakness of the approach caused by the cardinality of long sequences with the corresponding problems, such as vanishing gradients.
As Figure 4b shows, the CNN model als different from the real ICICI stock prices yet it mimics the general trends though inay not capture the peaks and trough of the model accurately. CNNs which are remarkable in finding spatial patterns in diverse fields use their pattern recognition feature over moving windows in time series. This caused the CNN to pick up more general trends, although its performance drops when faced with fast, highly unpredictable oscillations suitable in financial contexts.
The third graph (Figure 4c) below reveals the GRU’s forecast whereby it display better fit of the real stock prices as compared to the RNN. Using GRU the complex form of LSTM is reduced; but the temporal dependencies can still not be ignored as in the case of applied financial time series data. Its performance here suggest that the network can easily update information relevant with the market hence providing a good base for efficient and effective response to market.
The fourth graph (Figure 4d) depicting the Attention LSTM offer an indecisive result. Although it tries to mimic the general course of the stock value, one can clearly see that it fails to be precise toward the last data points, producing jagged values that are too high when approaching an accumulation peak or too low when approaching a trough.
4.4. Reliance Stock
Table 4 summarizes the performance of the models for predicting Reliance stock prices. Both RNN and LSTM performed poorly, with an R-Square of −1.251171. The CNN model demonstrated better performance with a MAE of 0.328005 and an R-Square of 0.008383, while GRU showed slightly lower performance. The best results were achieved by the Attention LSTM model, with a MAE of 0.317918 and an R-Square of 0.077228, indicating its effectiveness in predicting Reliance stock prices.
Figure 5 below depicts the performances of the implemented models on the Reliance Stock.
Based on the pattern of the graph herein showing the performance of the RNN (Figure 5a), it is seen that the model correlates well with the stock prices of Reliance but also shows inconsistencies and underscores the failure of the RNN to depict other mountains and valleys akin to undertake a more accurate workout of the dramatic movements of the Reliance stock prices. Such behavior is inherent to basic RNNs that, while being capable of processing sequential data, suffer from problems of long memory dependencies, or vanishing gradients. These drawbacks can significantly reduce their capacity to appropriately simulate the high level of variation of stock market data.
The performance graph of the CNN (Figure 5c) revealed it as moderately capable of tracing fluctuations in Reliance’s stock prices. It gives the overall trend with reasonable efficiency but fails to provide precise estimates of the larger oscillations. CNNs are well recognized spatial pattern discriminative model and are used here in a similar fashion to identify patterns over sliding time windows to detect trends. This performance imply that although CNNs can work for broader movement, its efficiency reduces when it comes to faster least predictable market movements, which are vital in the volatile world of stock trading.
It can be noticed that the graph of the GRU model resemble real stock prices more than the RNN and CNN models specific in capturing both the overall movement of the prices and other fluctuations ((Figure 5d). Compared to LSTM, GRUs make some changes in the architecture but still hold strong ability to handle temporal dependencies. This attribute makes them especially useful for financial datasets in which timely and efficient ability to respond to new information is a valuable asset. It is perceptible from the graph that GRUs are capable of capturing the quantitative volatility of stock prices and are thus promising in representing predictive tasks in finance.
Lastly, the LSTM model graph shows efficiency, synchronizing with the actual Reliance’s stocks prices movements (Figure 5b). It tracks quite well both contraction and expansionary movements in the markets and displays high sensitivity to market fluctuations. Enhanced for temporal sequence learning, LSTMs are good alternatives for RNNs because they have accomplished the challenge of learning long-term dependencies with their elaborate gating mechanisms. This capability enables them to perform well when used in places like prediction of stock price where information on trends can significantly improve upon the prediction.
4.5. Nifty 50
The performance of models for Nifty 50 stock is summarized in Table 5. Both RNN and LSTM models showed poor predictive accuracy, with negative R-Square values. The CNN and GRU models outperformed the others, with CNN achieving a MAE of 0.232070 and an R-Square of −0.049331. However, the Attention LSTM model performed the worst, with an R-Square of −1.937318, indicating poor predictive capability for Nifty 50 stock.
The performance of the models for the Nifty50 index data is depicted in Figure 6.
Figure 6.
Model Predictions for the Nifty50 Index.
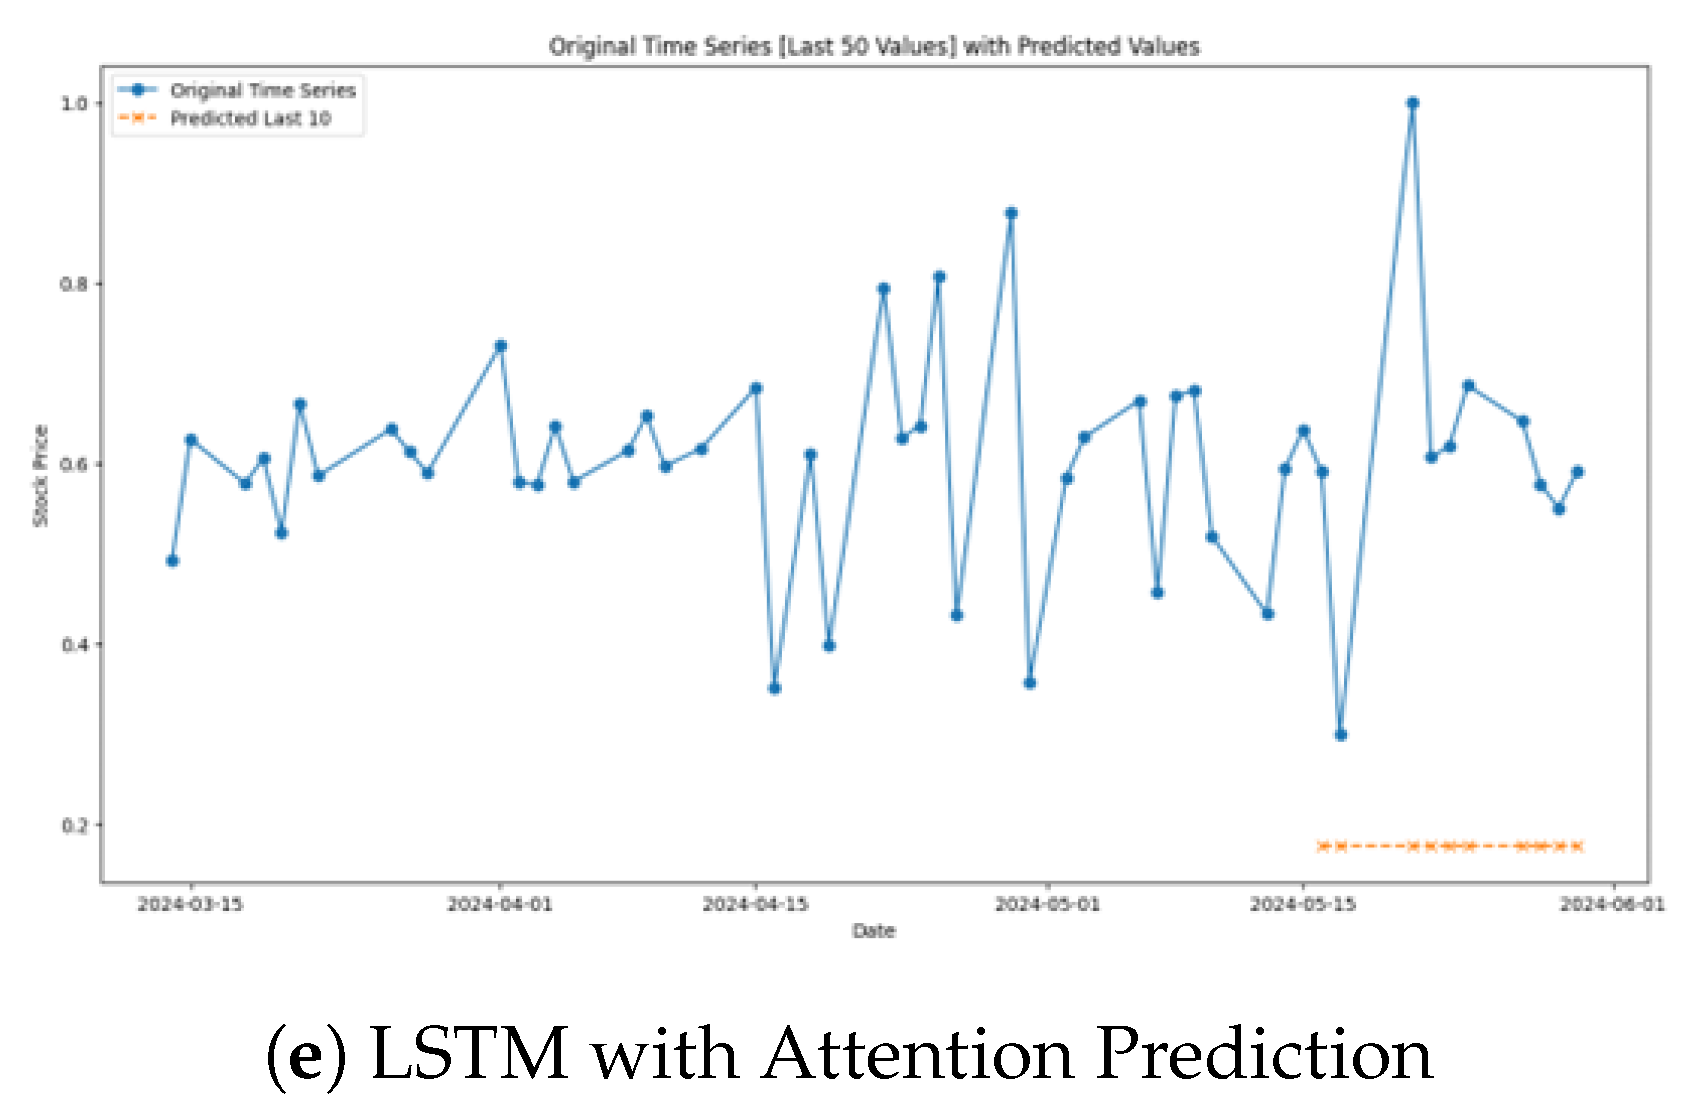
The above indicated RNN graph also establishes the model’s general performance of following the changes in the Nifty50 Index but has weak performances during fluctuations (Figure 6a). The forecasts are sometimes too high or too low in relation to concrete changes, and usually do not capture important highs and lows. They also exposed basic problems of RNNs like long-term dependencies and vanishing gradients that hamper its fitness for use in markets that require precise timely predictions.
It is evidently clear from the graph of the CNN model that the overall trends of the Nifty50 Index can be tracked with a modest accuracy (Figure 6c). Even though it describes the overall trend, it fails to predict small changes, especially the sharp changes in the market. CNNs are particularly good at identifying spatial patterns, and when used in time series, it applies pattern detection across the sliding windows. From this transition method, it emerged that although CNNs are proficient in identifying trends, they are lacking in agility in turning market swifts around.
The graph for the GRU model is more consistent with real market data than the RNN and CNN and corresponds to most of the change in the index (Figure 6d). GRUs make LSTM structures less complicated at that point preserve the force of temporal dependency control, which makes them perfect for applied to numerical financial information since timely changes to new data are somehow essential. What this analysis shows about the GRU’s performance is that it is valuable in tracking the complex patterns of stock index prices accurately.
Among the proposed LSTM models the LSTM model graph demonstrates the highest performance of tracking the actual movement of Nifty50 Index (Figure 6b). It correctly aligns to markets and changes to address their needs appropriately, which proves it has better ways of handling long-term dependencies. This characteristic is particularly relevant in stock market conditions where information patterns in the past are often extremely powerful in shaping future trends and hence the LSTM as a most promising tool in field of financial prediction.
The Attention LSTM’s prediction graph of the Nifty 50 Index offers a clear insight of how this more complex model goes about in forecasting the trends of the stock market (Figure 6e). Comparing the predictions with the last 50 values of the Nifty50 Index as depicted in the figure, it can easily be seen that apart from a few fluctuations, the Attention LSTM commonly predicts the overall directionality of the index with weak accuracy. The model showed some disparities especially when forecasting the stock future trend.
4.6. Model Comparison
On several outfits, both the CNN and GRU models captured favorable performance for different equities commodity including the HDFC and the Nifty 50 as a stable stock. The Attention LSTM model performed brilliantly in the prediction of prices for the volatile stocks including Relience which evidences that it’s capable of comprehending the complex mechanisms of stock prices in such a scenario. The RNN and LSTM models presented less precise patterns, where LSTM presented in general, better performance than RNN. CNN has been developed as the best model for predicting the stock prices and it has been able to give a compromise of higher accuracy and less time for computations.
5. Conclusions
This study conducted a comprehensive comparative analysis of five deep learning models—Recurrent Neural Network (RNN), Long Short-Term Memory (LSTM), Convolutional Neural Network (CNN), Gated Recurrent Unit (GRU), and Attention LSTM—for predicting stock prices of five major Indian companies: HDFC, TCS, ICICI, Reliance and Nifty 50 group of stocks. The regression metrics which were employed for evaluation of models included MAE, MSE RMSE, and R². The outcomes showed that model performance changed based on the individual stock being analyzed. CNN and GRU architectures effectively outpaced RNN and LSTM models, especially regarding stable stocks including HDFC and Nifty 50. The CNN model achieved both lower error rates and more robust R-Squared values in most of its implementations. The Attention LSTM model has shown to be far more efficient than its counterparts in enhancing predictive accuracy for volatile stocks including Reliance.
Even with the overall effectiveness of the models, the study revealed certain difficulties. The RNN design generated consistently bad outcomes because it was unable to recognize long-term dependencies, and the LSTM design managed better results with pressures that surfaced in a few instances. The Attention LSTM model, while effective in some volatility, had poor performance with Nifty 50, suggesting that its complexity may not work well for every kind of stock. In closing, this study points out the relevance of matching the suitable deep learning model to stock characteristics. Both CNN and GRU models became highly regarded general-purpose models, but the Attention LSTM model provided benefit regarding volatility. The findings contribute to the expanding research base applying deep learning for the forecasting of financial time series, offering important insights to both finance academics and practitioners.
Future Work
Several pathways for future research and development have originated from this study. Initially, there exists a strong possibility to increase model performance by including extra external data, consisting of macroeconomic indicators, market news, and social media sentiment analysis. Such external attributes bring important context to the stock price figures and may improve models in their ability to pinpoint market developments that have a notable effect on stock prices. In the second place, examining additional research on hyperparameter optimization methods, notably Bayesian optimization and grid search, could increase model accuracy. For this study, standard hyperparameters were applied to all models, yet fine-tuning them specifically for each stock has the potential to improve results, particularly with regard to more volatile stocks. Also, advanced deep learning models, especially Transformer networks, require investigation for their use in stock price prediction. The ability of transformer architectures to employ self-attention mechanisms, combined with their talent for dealing with huge data sequences, could outperform RNN models, especially in the task of finding long-term dependencies and trends within stock prices. Also, models that combine deep learning with the traditional methods of financial analysis might develop to improve interpretability together with robustness. Integrating deep learning with econometric models, for example, might help close the division between unclear predictions and financial theory, yielding more useful insights for both investors and traders. At last, extending this research to consider a wider variety of stocks and lengthening the forecasting duration would give a more complete insight into model performance in multiple sectors and time periods. In addition, further investigation is necessary into how these models act in real time for predicting stock prices and whether they can successfully conjugate with automated trading systems for usefulness in financial markets.
Funding
This research received no external funding.
Conflicts of Interest
The authors declare no conflicts of interest.
Abbreviations
The following abbreviations are used in this manuscript:
| RNN | Recurrent Neural Networks |
| LSTM | Long Short-Term Memory |
| CNN | Convolutional Neural Netoworks |
| GRU | Gated Recurrent Unit |
| MAE | Mean Absolute Error |
| MSE | Mean Squared Error |
| RMSE | Root Mean Squared Error |
| R-Squared (Coefficient of Determination) | |
| SVM | Support Vector Machine |
| RF | Random Forest |
| ANN | Artificial Neural Network |
| ARIMA | Autoregressive Integrated Moving Average |
| GARCH | Generalized Autoregressive Conditional Heteroskedasticity |
| NSE | National Stock Exchange (India) |
References
- Sachdeva, A.; Jethwani, G.; Manjunath, C.; Balamurugan, M.; Krishna, A.V.N. An Effective Time Series Analysis for Equity Market Prediction Using Deep Learning Model. 2019 International Conference on Data Science and Communication (IconDSC). IEEE, 2019, pp. 1–5. doi:10.1109/IconDSC.2019.8817035. [CrossRef]
- Selvamuthu, D.; Kumar, V.; Mishra, A. Indian stock market prediction using artificial neural networks on tick data. Financial Innovation 2019, 5, 16. doi:10.1186/s40854-019-0131-7. [CrossRef]
- Singh, J. Indian Stock Markets Data Analysis and Prediction using Machine Learning. International Journal for Research in Applied Science and Engineering Technology 2020, 8, 631–636. doi:10.22214/ijraset.2020.30996. [CrossRef]
- Fathali, Z.; Kodia, Z.; Said, L.B. Stock Market Prediction of NIFTY 50 Index Applying Machine Learning Techniques. Applied Artificial Intelligence 2022, 36. doi:10.1080/08839514.2022.2111134. [CrossRef]
- Piyush.; Amarjeet.; Sharma, A.; Kumar, S.; Ansari, N.N. Stock Price Prediction Using Machine Learning. Proceedings of International Conference on Recent Trends in Computing. Springer, 2023, pp. 79–87. doi:10.1007/978-981-19-8825-7_8. [CrossRef]
- Weng, B.; Lu, L.; Wang, X.; Megahed, F.M.; Martinez, W. Predicting short-term stock prices using ensemble methods and online data sources. Expert Systems with Applications 2018, 112, 258–273. doi:10.1016/j.eswa.2018.06.016. [CrossRef]
- Kanwal, A.; Lau, M.F.; Ng, S.P.; Sim, K.Y.; Chandrasekaran, S. BiCuDNNLSTM-1dCNN — A hybrid deep learning-based predictive model for stock price prediction. Expert Systems with Applications 2022, 202, 117123. doi:10.1016/j.eswa.2022.117123. [CrossRef]
- Parray, I.R.; Khurana, S.S.; Kumar, M.; Altalbe, A.A. Time series data analysis of stock price movement using machine learning techniques. Soft Computing 2020, 24, 16509–16517. doi:10.1007/s00500-020-04957-x. [CrossRef]
- Gupta, D.; Parikh, A.; Datta, T.K. A multi-criteria decision-making approach to rank the sectoral stock indices of national stock exchange of India based on their performances. National Accounting Review 2021, 3, 272–292. doi:10.3934/NAR.2021014. [CrossRef]
- Ab.Khalil, M.; Bakar, A.A. A Comparative Study of Deep Learning Algorithms in Univariate and Multivariate Forecasting of the Malaysian Stock Market. Sains Malaysiana 2023, 52, 993–1009. doi:10.17576/jsm-2023-5203-22. [CrossRef]
- Patel, J.; Shah, S.; Thakkar, P.; Kotecha, K. Predicting stock and stock price index movement using Trend Deterministic Data Preparation and machine learning techniques. Expert Systems with Applications 2015, 42, 259–268. doi:10.1016/j.eswa.2014.07.040. [CrossRef]
- Salehinejad, H.; Sankar, S.; Barfett, J.; Colak, E.; Valaee, S. Recent Advances in Recurrent Neural Networks, 2018, [arXiv:cs.NE/1801.01078].
- Shen, J.; Shafiq, M.O. Short-term stock market price trend prediction using a comprehensive deep learning system. Journal of Big Data 2020, 7, 66. doi:10.1186/s40537-020-00333-6. [CrossRef]
- Sen, J.; Mehtab, S. A Robust Predictive Model for Stock Price Prediction Using Deep Learning and Natural Language Processing, 2021. doi:10.36227/techrxiv.15023361.v1. [CrossRef]
- Hernández, A.; Amigó, J.M. Attention Mechanisms and Their Applications to Complex Systems. Entropy 2021, 23, 283. doi:10.3390/e23030283. [CrossRef]
- Sunday, D.O. Application of Long Short-Term Memory (LSTM) in Stock Price Prediction. International Journal of Development and Economic Sustainability 2024, 12, 36–45. doi:10.37745/ijdes.13/vol12n33645. [CrossRef]
- Pipin, S.J.; Purba, R.; Kurniawan, H. Prediksi Saham Menggunakan Recurrent Neural Network (RNN-LSTM) dengan Optimasi Adaptive Moment Estimation. Journal of Computer System and Informatics (JoSYC) 2023, 4, 806–815. doi:10.47065/josyc.v4i4.4014. [CrossRef]
- Vijh, S.; Pandey, A.K.; Vijh, G.; Kumar, S. Stock Forecasting for Time Series Data using Convolutional Neural Network. 2021 11th International Conference on Cloud Computing, Data Science & Engineering (Confluence). IEEE, 2021, pp. 866–870. doi:10.1109/Confluence51648.2021.9377128. [CrossRef]
- Satria, D. PREDICTING BANKING STOCK PRICES USING RNN, LSTM, AND GRU APPROACH. Applied Computer Science 2023, 19, 82–94. doi:10.35784/acs-2023-06. [CrossRef]
- Chaudhary, P. A Deep Learning-based Approach for Stock Price Prediction. Turkish Journal of Computer and Mathematics Education (TURCOMAT) 2020, 11, 1983–1989. doi:10.17762/turcomat.v11i3.13595. [CrossRef]
- Long, W.; Lu, Z.; Cui, L. Deep learning-based feature engineering for stock price movement prediction. Knowledge-Based Systems 2019, 164, 163–173. doi:10.1016/j.knosys.2018.10.034. [CrossRef]
- Paul, M.K.; Das, P. A Comparative Study of Deep Learning Algorithms for Forecasting Indian Stock Market Trends. International Journal of Advanced Computer Science and Applications 2023, 14. doi:10.14569/IJACSA.2023.0141098. [CrossRef]
- Hemajothi, S.; Babu, S.S.; Prathiksha, V.; B, S.; E, S.; K, S. Prediction of Stock Price Model through the Implementation of Hybrid BiLSTM-GRU. 2024 International Conference on Recent Advances in Electrical, Electronics, Ubiquitous Communication, and Computational Intelligence (RAEEUCCI). IEEE, 2024, pp. 1–6. doi:10.1109/RAEEUCCI61380.2024.10547920. [CrossRef]
- Sudriyanto, S.; Faid, M.; Malik, K.; Supriadi, A. Evaluasi Model Jaringan Saraf Tiruan Berbasis LSTM dalam Memprediksi Fluktuasi Harga Bitcoin. Jurnal Advanced Research Informatika 2024, 2, 15–22. doi:10.24929/jars.v2i2.3398. [CrossRef]
- Jafar, S.H.; Akhtar, S.; El-Chaarani, H.; Khan, P.A.; Binsaddig, R. Forecasting of NIFTY 50 Index Price by Using Backward Elimination with an LSTM Model. Journal of Risk and Financial Management 2023, 16, 423. doi:10.3390/jrfm16100423. [CrossRef]
- Polepally, V.; Reddy, N.S.N.; Sindhuja, M.; Anjali, N.; Reddy, K.J. A Deep Learning Approach for Prediction of Stock Price Based on Neural Network Models: LSTM and GRU. 2021 12th International Conference on Computing Communication and Networking Technologies (ICCCNT). IEEE, 2021, pp. 1–4. doi:10.1109/ICCCNT51525.2021.9579782. [CrossRef]
- Srivastava, N.; Hinton, G.; Krizhevsky, A.; Sutskever, I.; Salakhutdinov, R. Dropout: A Simple Way to Prevent Neural Networks from Overfitting. Journal of Machine Learning Research 2014, 15, 1929–1958.
- Mehtab, S.; Sen, J. Stock Price Prediction Using Convolutional Neural Networks on a Multivariate Time Series, 2021. doi:10.36227/techrxiv.15088734.v1. [CrossRef]
- Sen, J.; Mehtab, S.; Nath, G. Stock Price Prediction Using Deep Learning Models, 2021. doi:10.36227/techrxiv.16640197.v1. [CrossRef]
- Ahmed, S.F.; Alam, M.S.B.; Hassan, M.; Rozbu, M.R.; Ishtiak, T.; Rafa, N.; Mofijur, M.; Ali, A.B.M.S.; Gandomi, A.H. Deep learning modelling techniques: current progress, applications, advantages, and challenges. Artificial Intelligence Review 2023, 56, 13521–13617. doi:10.1007/s10462-023-10466-8. [CrossRef]
- Spuler, M.; Sarasola-Sanz, A.; Birbaumer, N.; Rosenstiel, W.; Ramos-Murguialday, A. Comparing metrics to evaluate performance of regression methods for decoding of neural signals. 2015 37th Annual International Conference of the IEEE Engineering in Medicine and Biology Society (EMBC). IEEE, 2015, pp. 1083–1086. doi:10.1109/EMBC.2015.7318553. [CrossRef]
Figure 1.
Methodology Diagram.
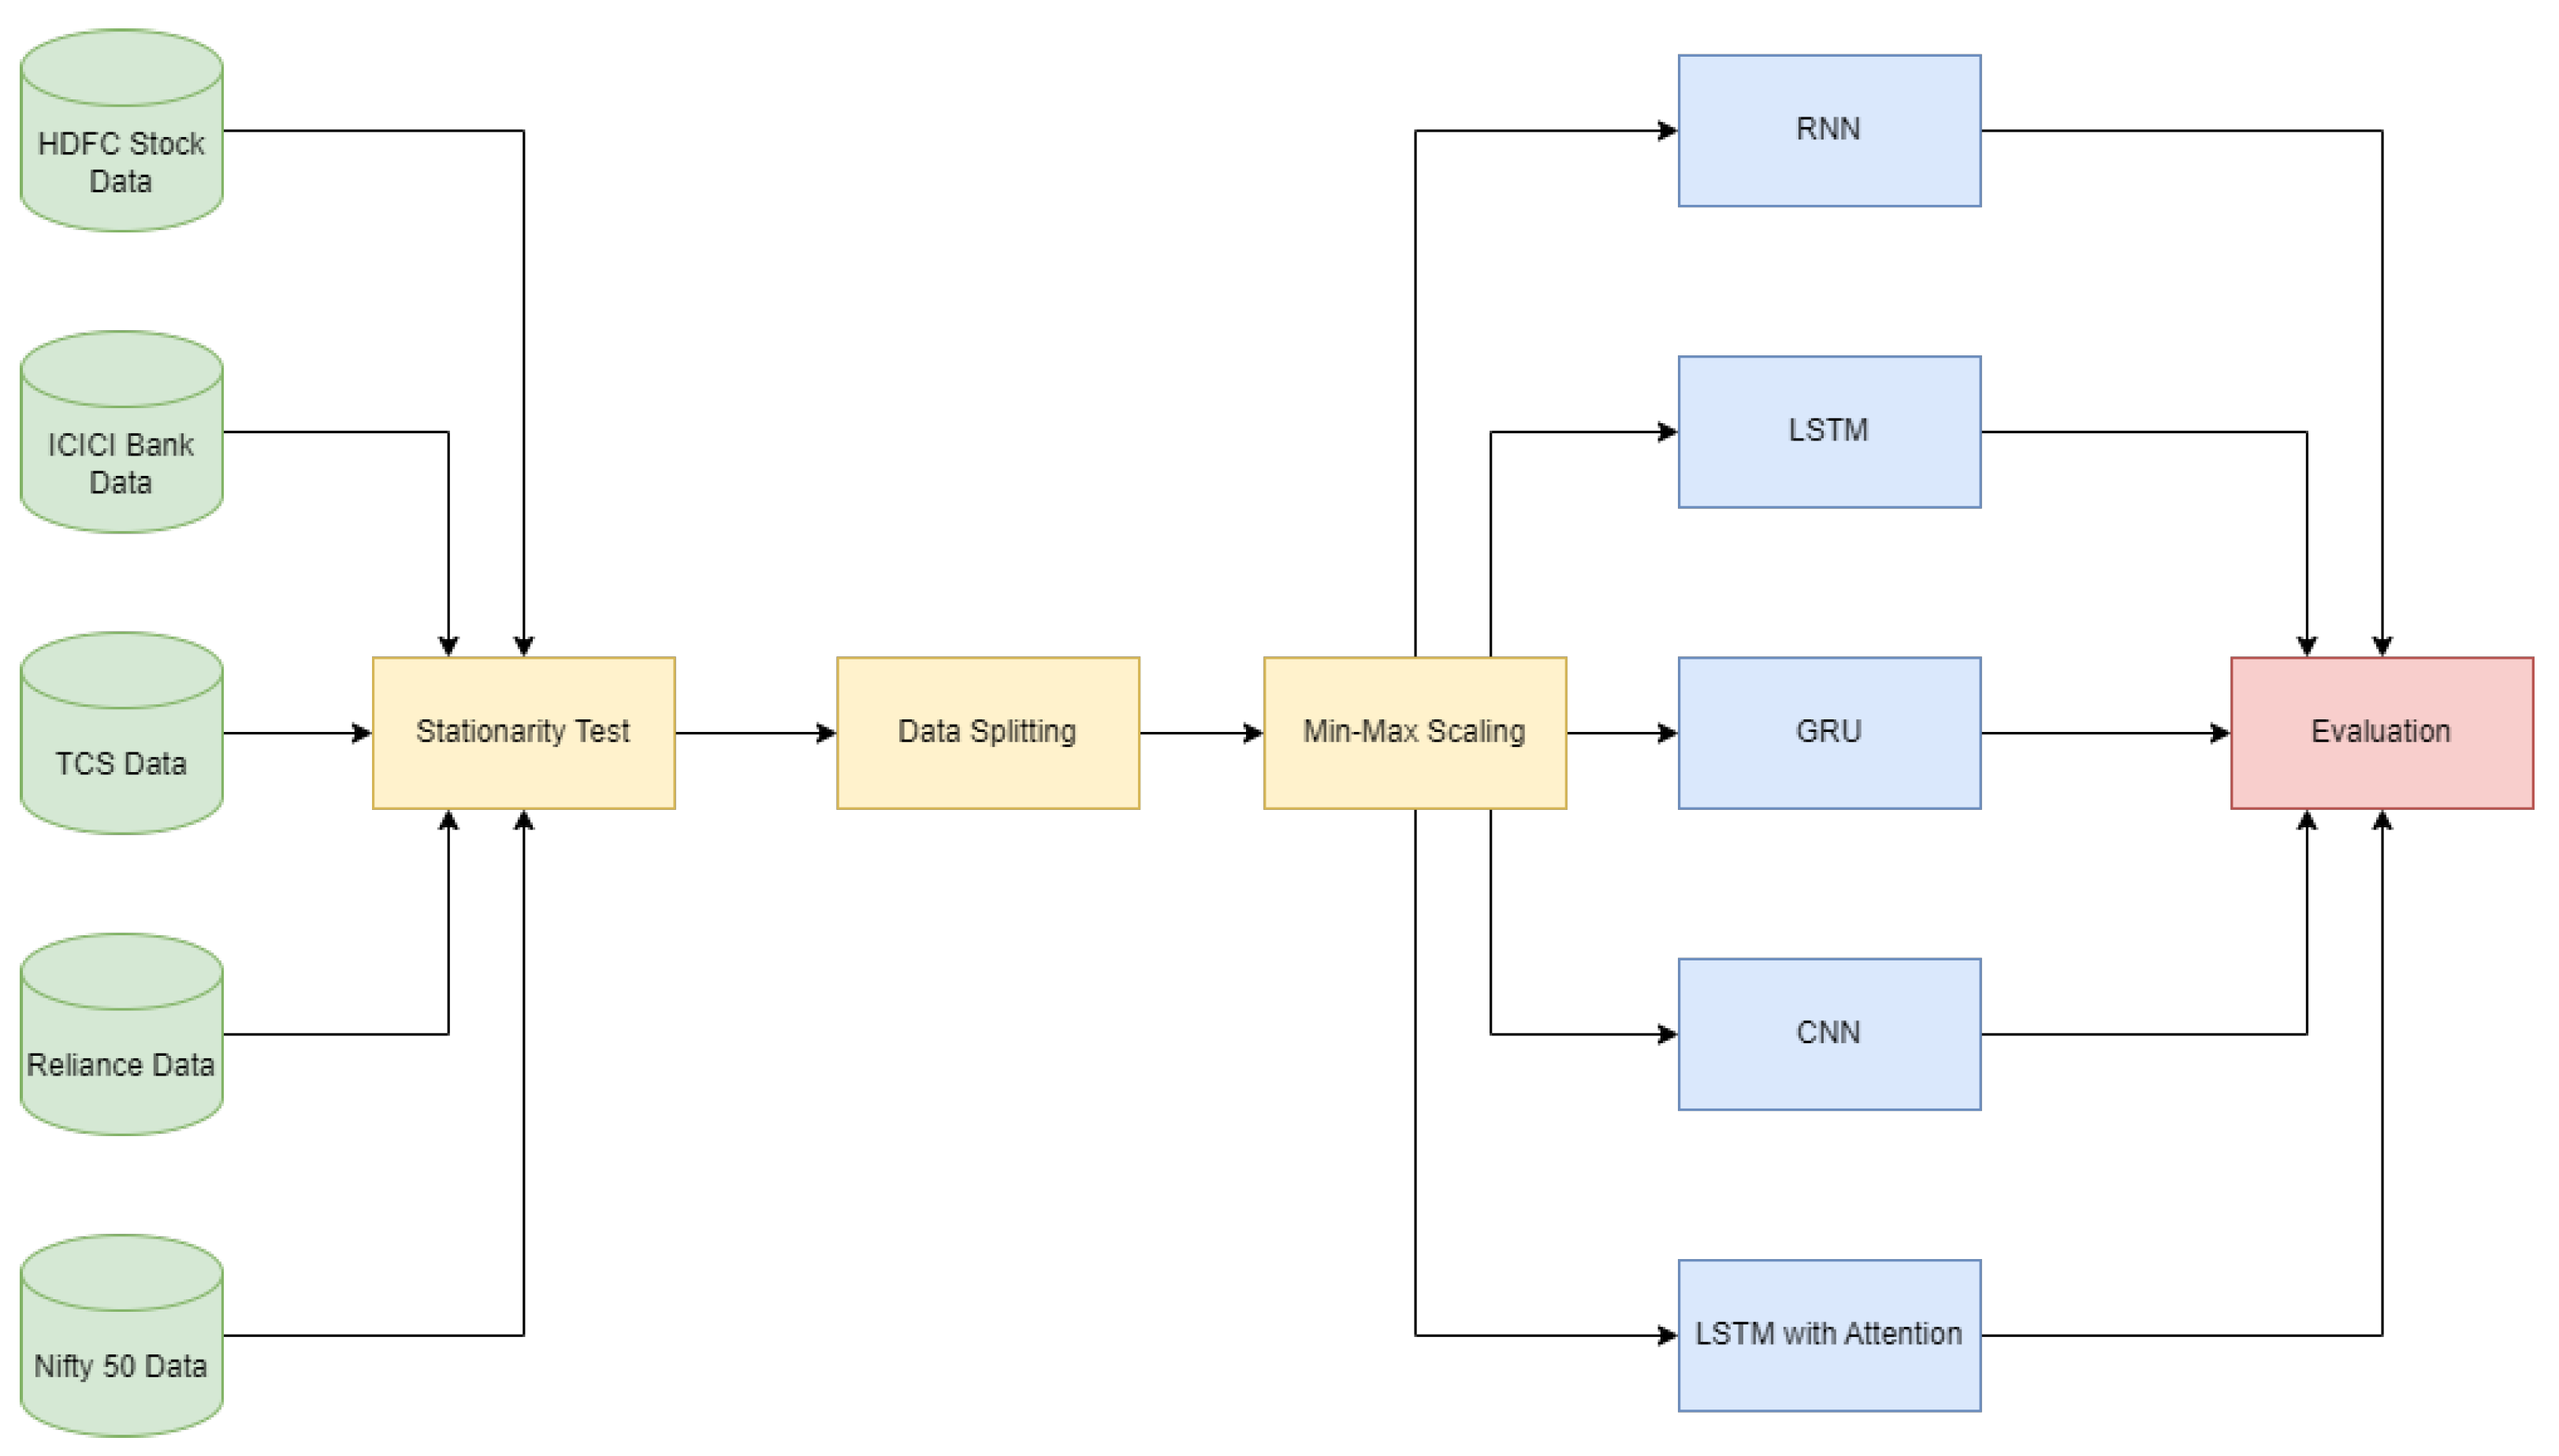
Figure 2.
Model Predictions for the HDFC Stock.
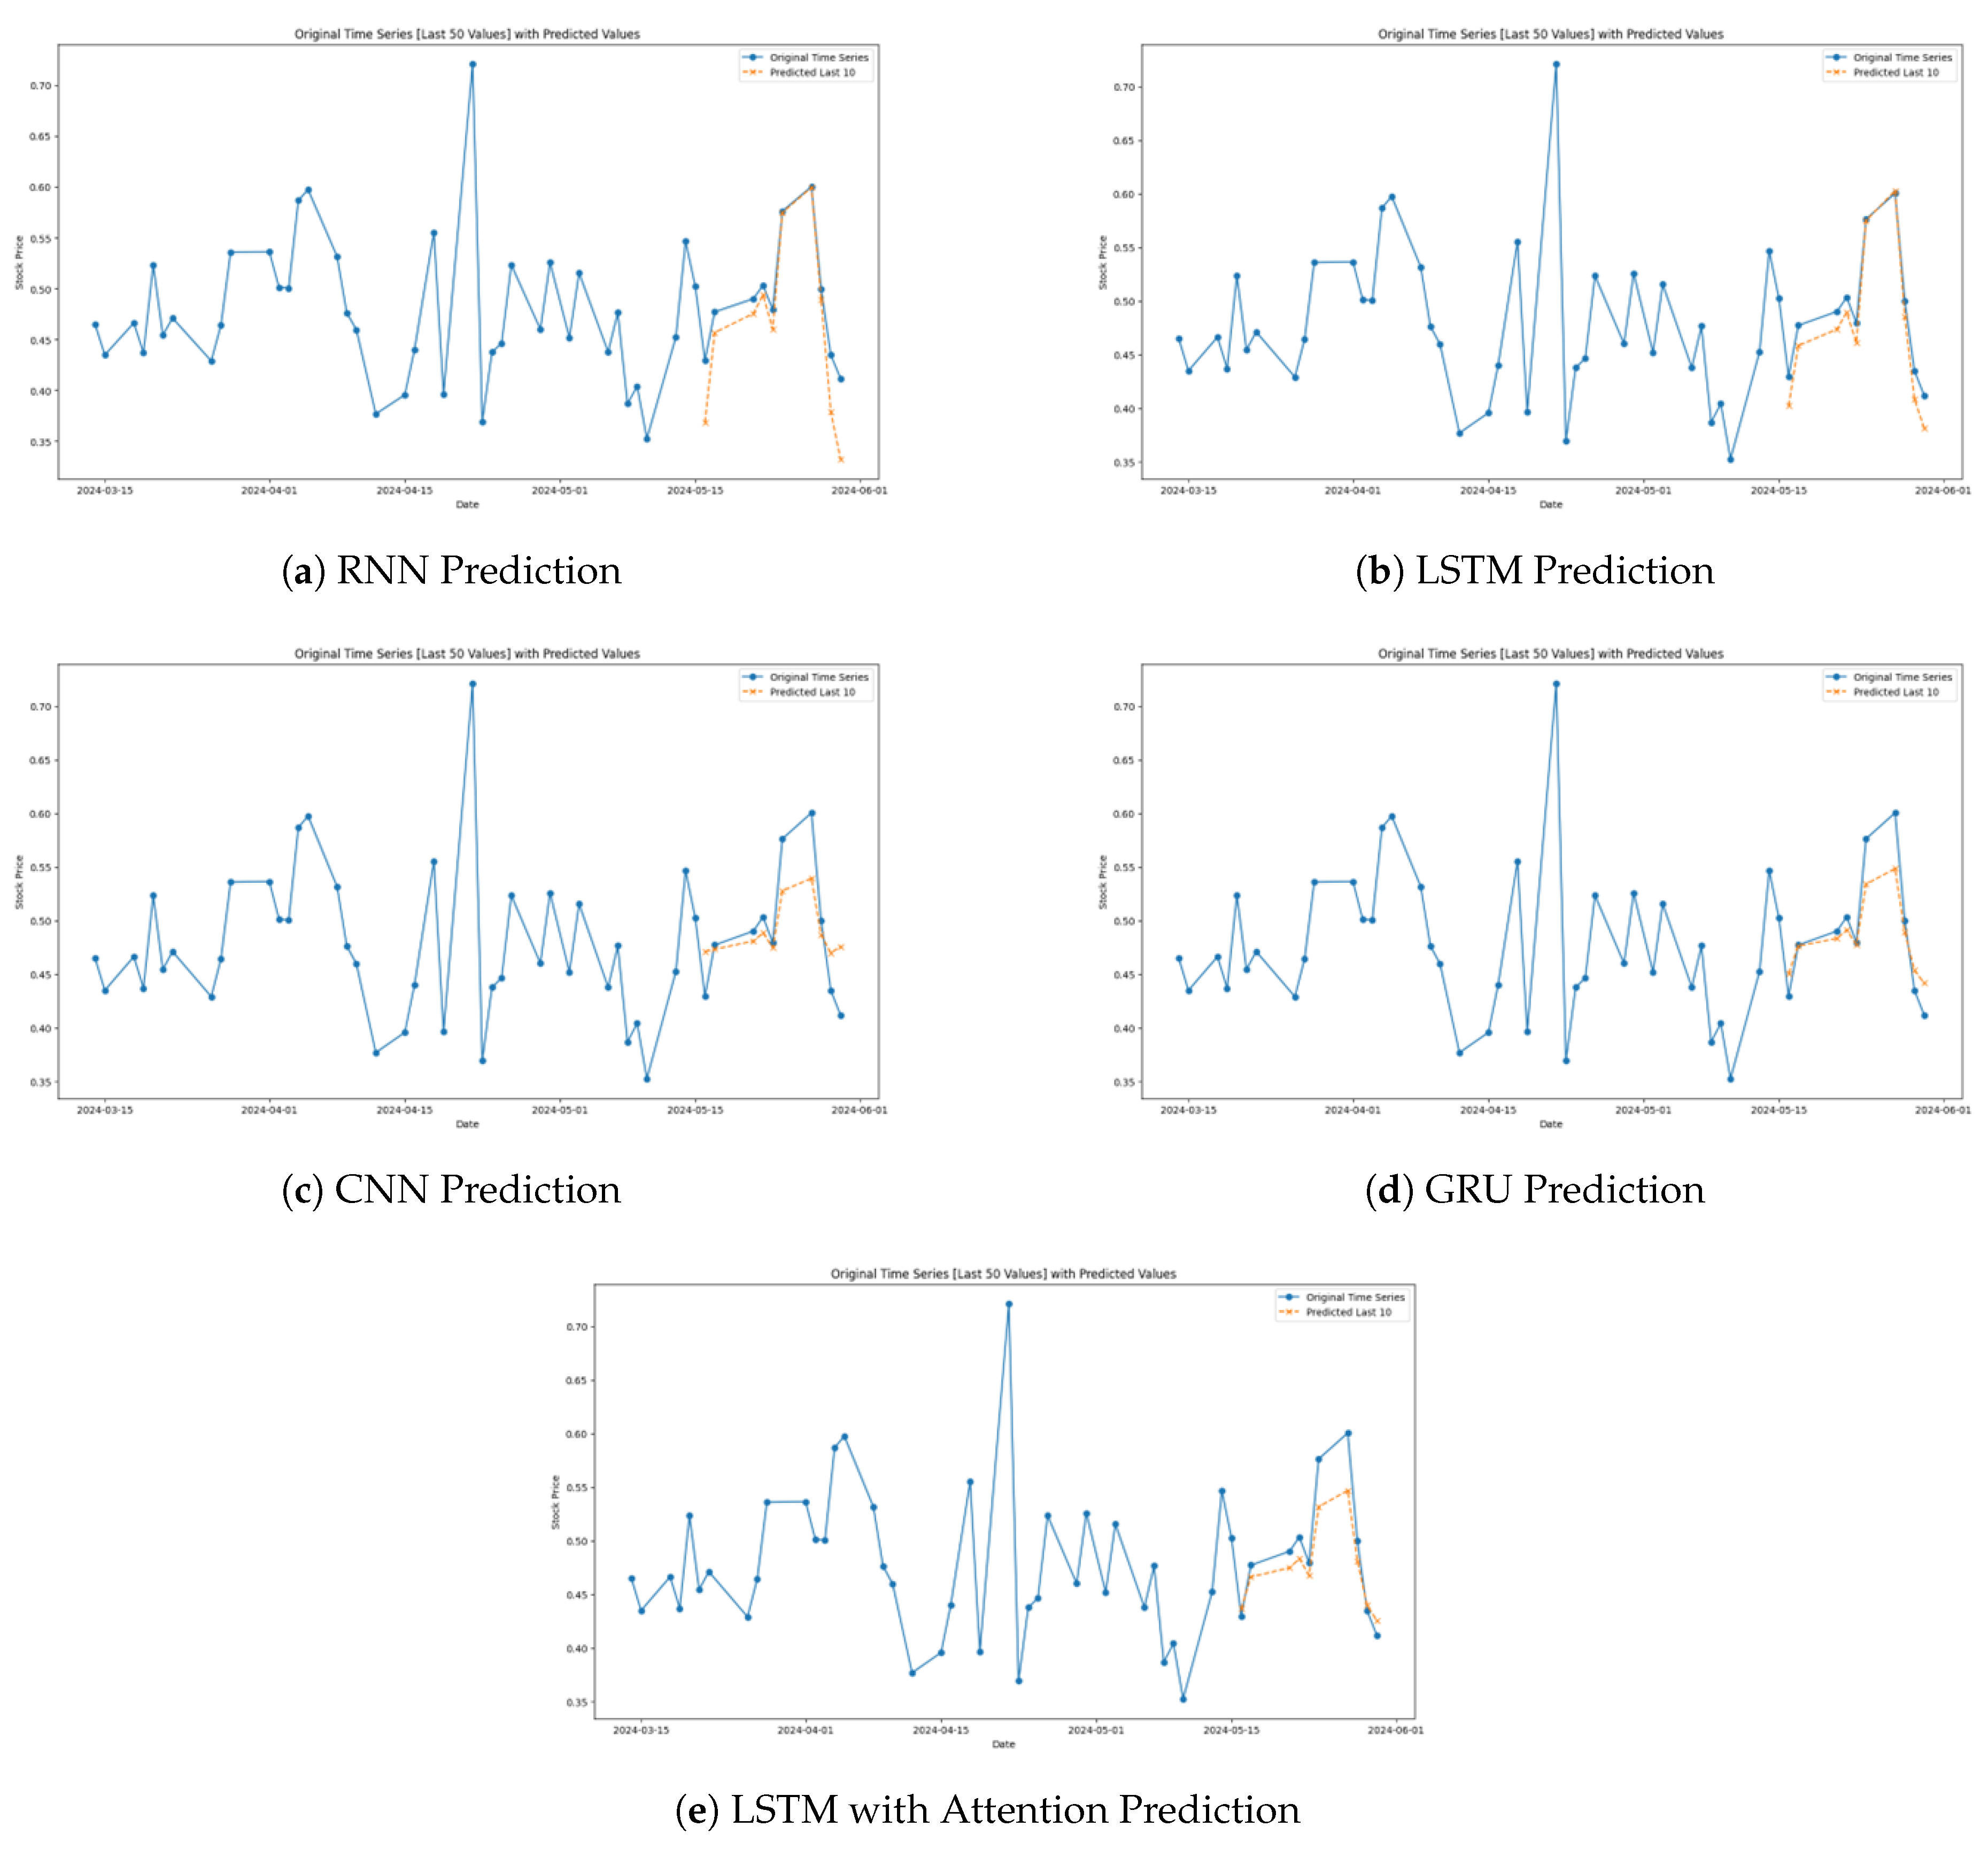
Figure 3.
Model Predictions for the TCS Stock.
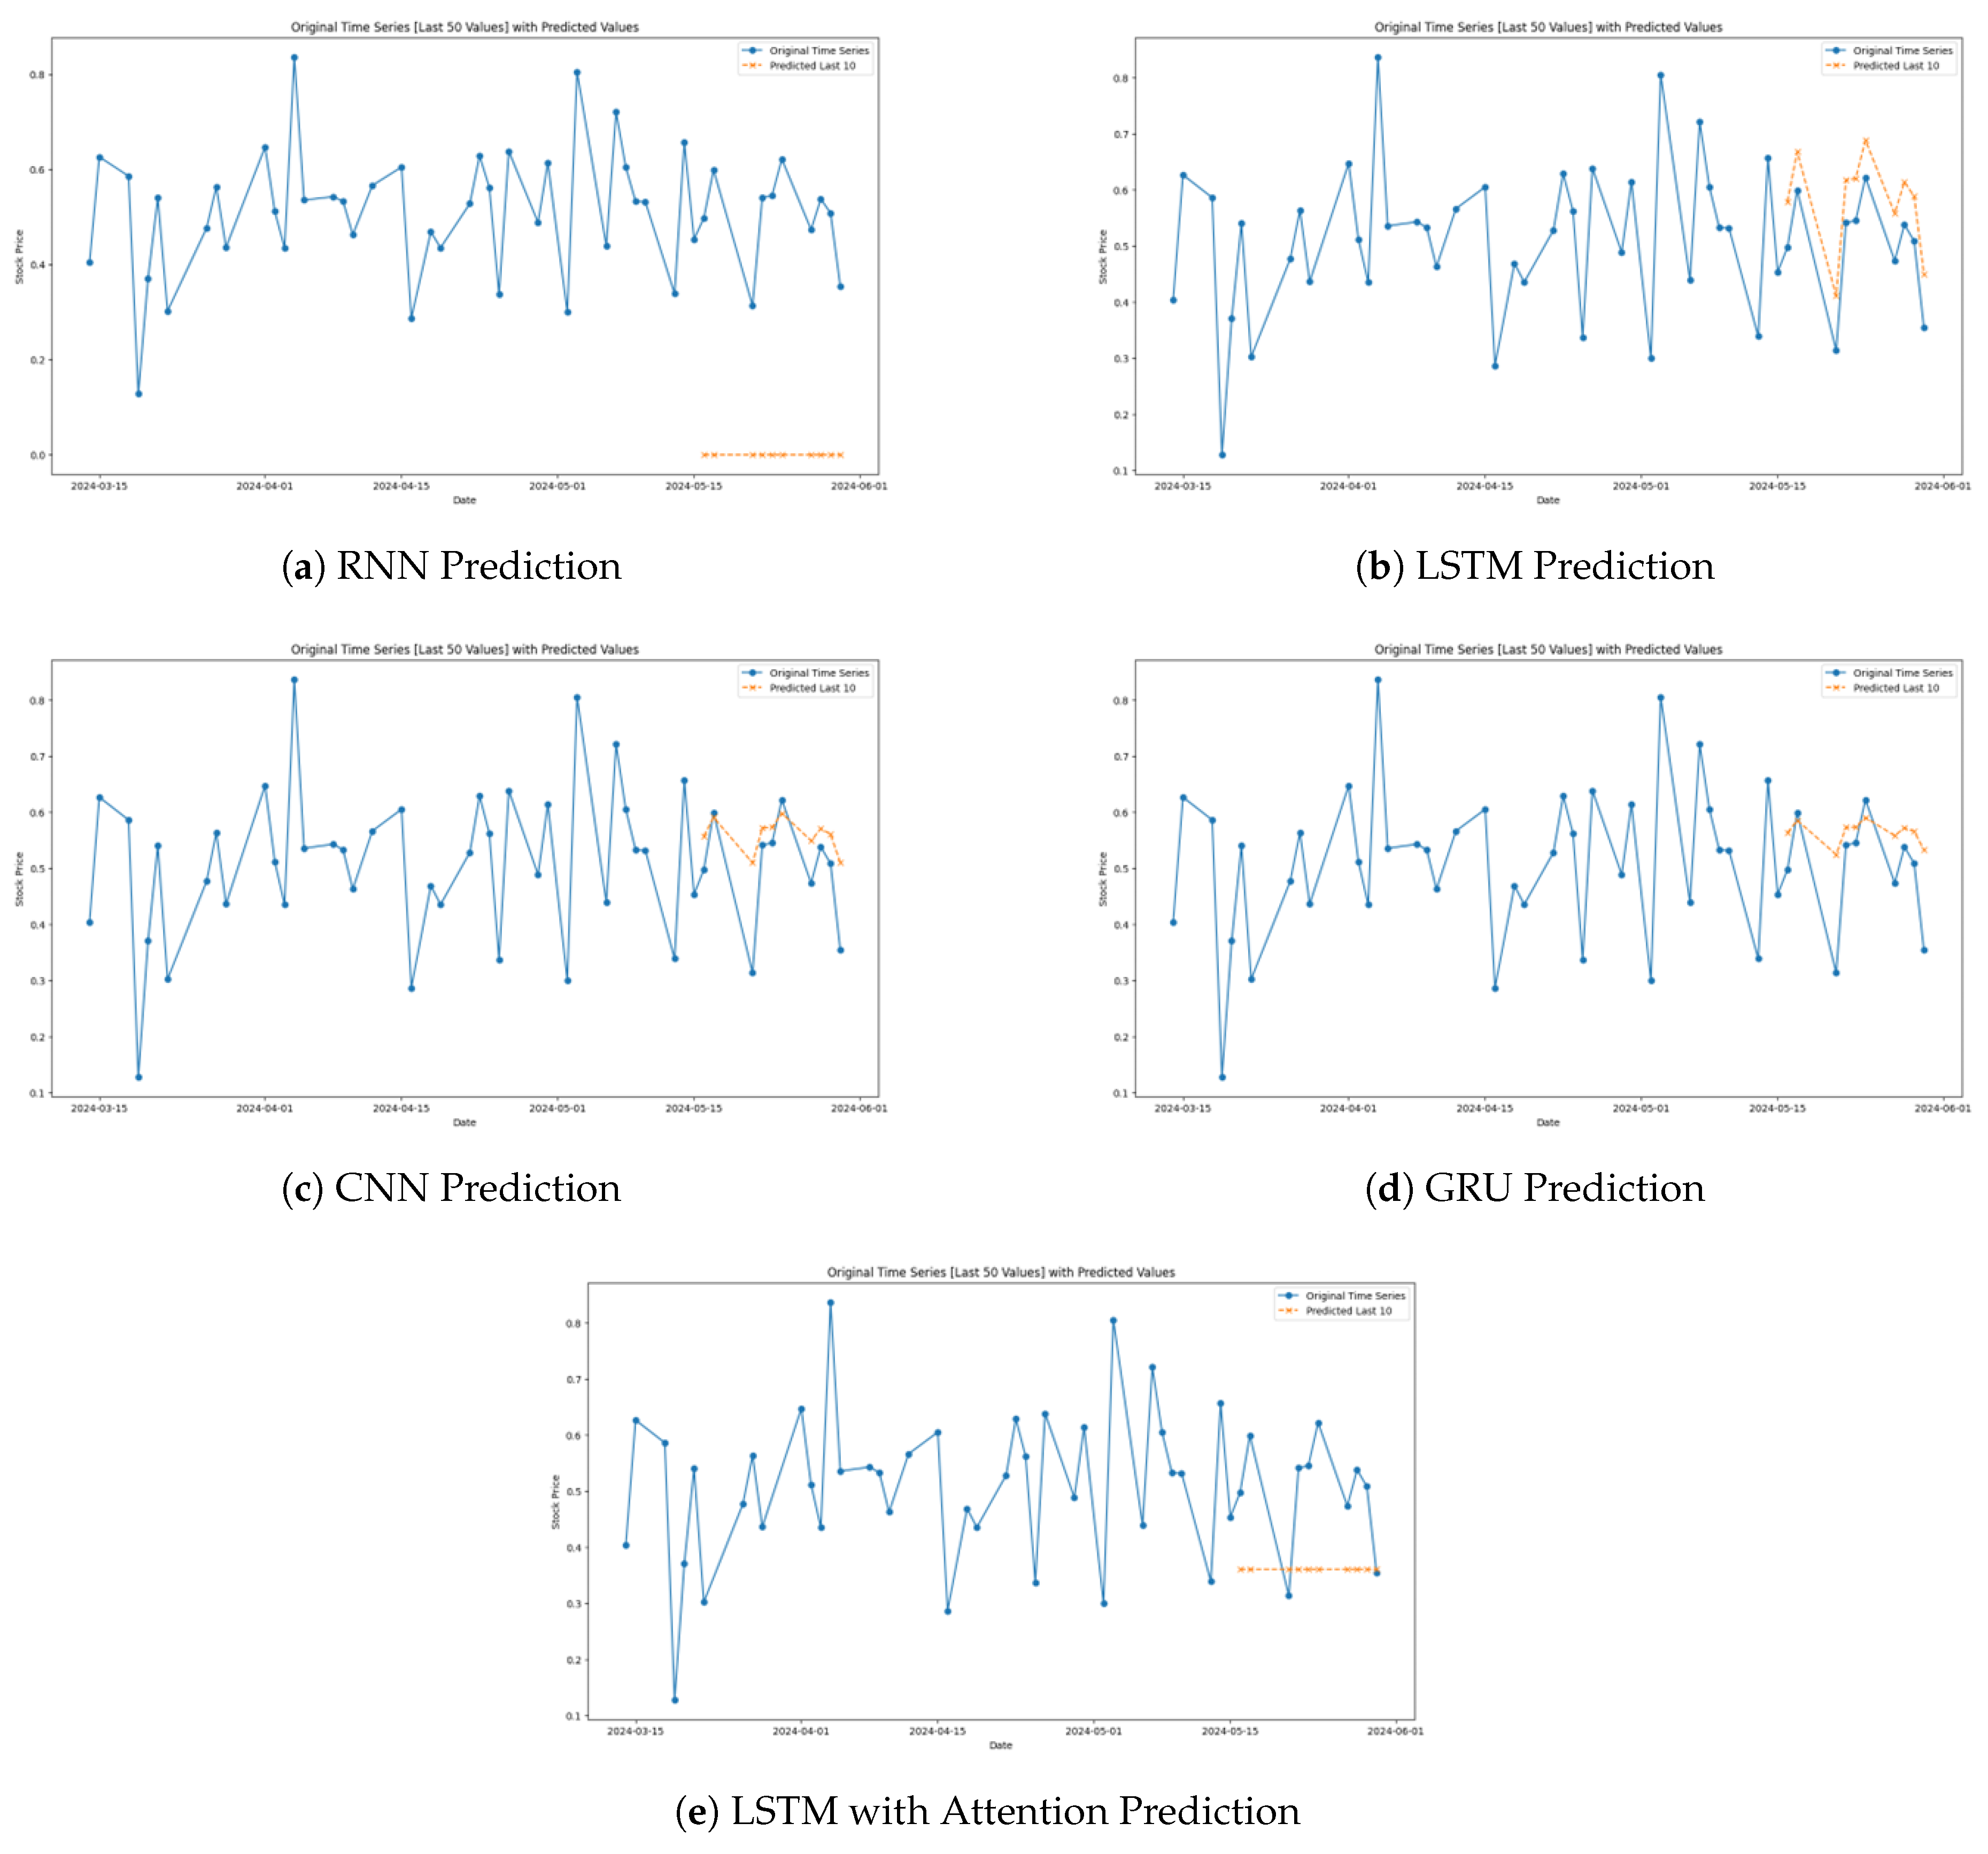
Figure 4.
Model Predictions for the ICICI Stock.
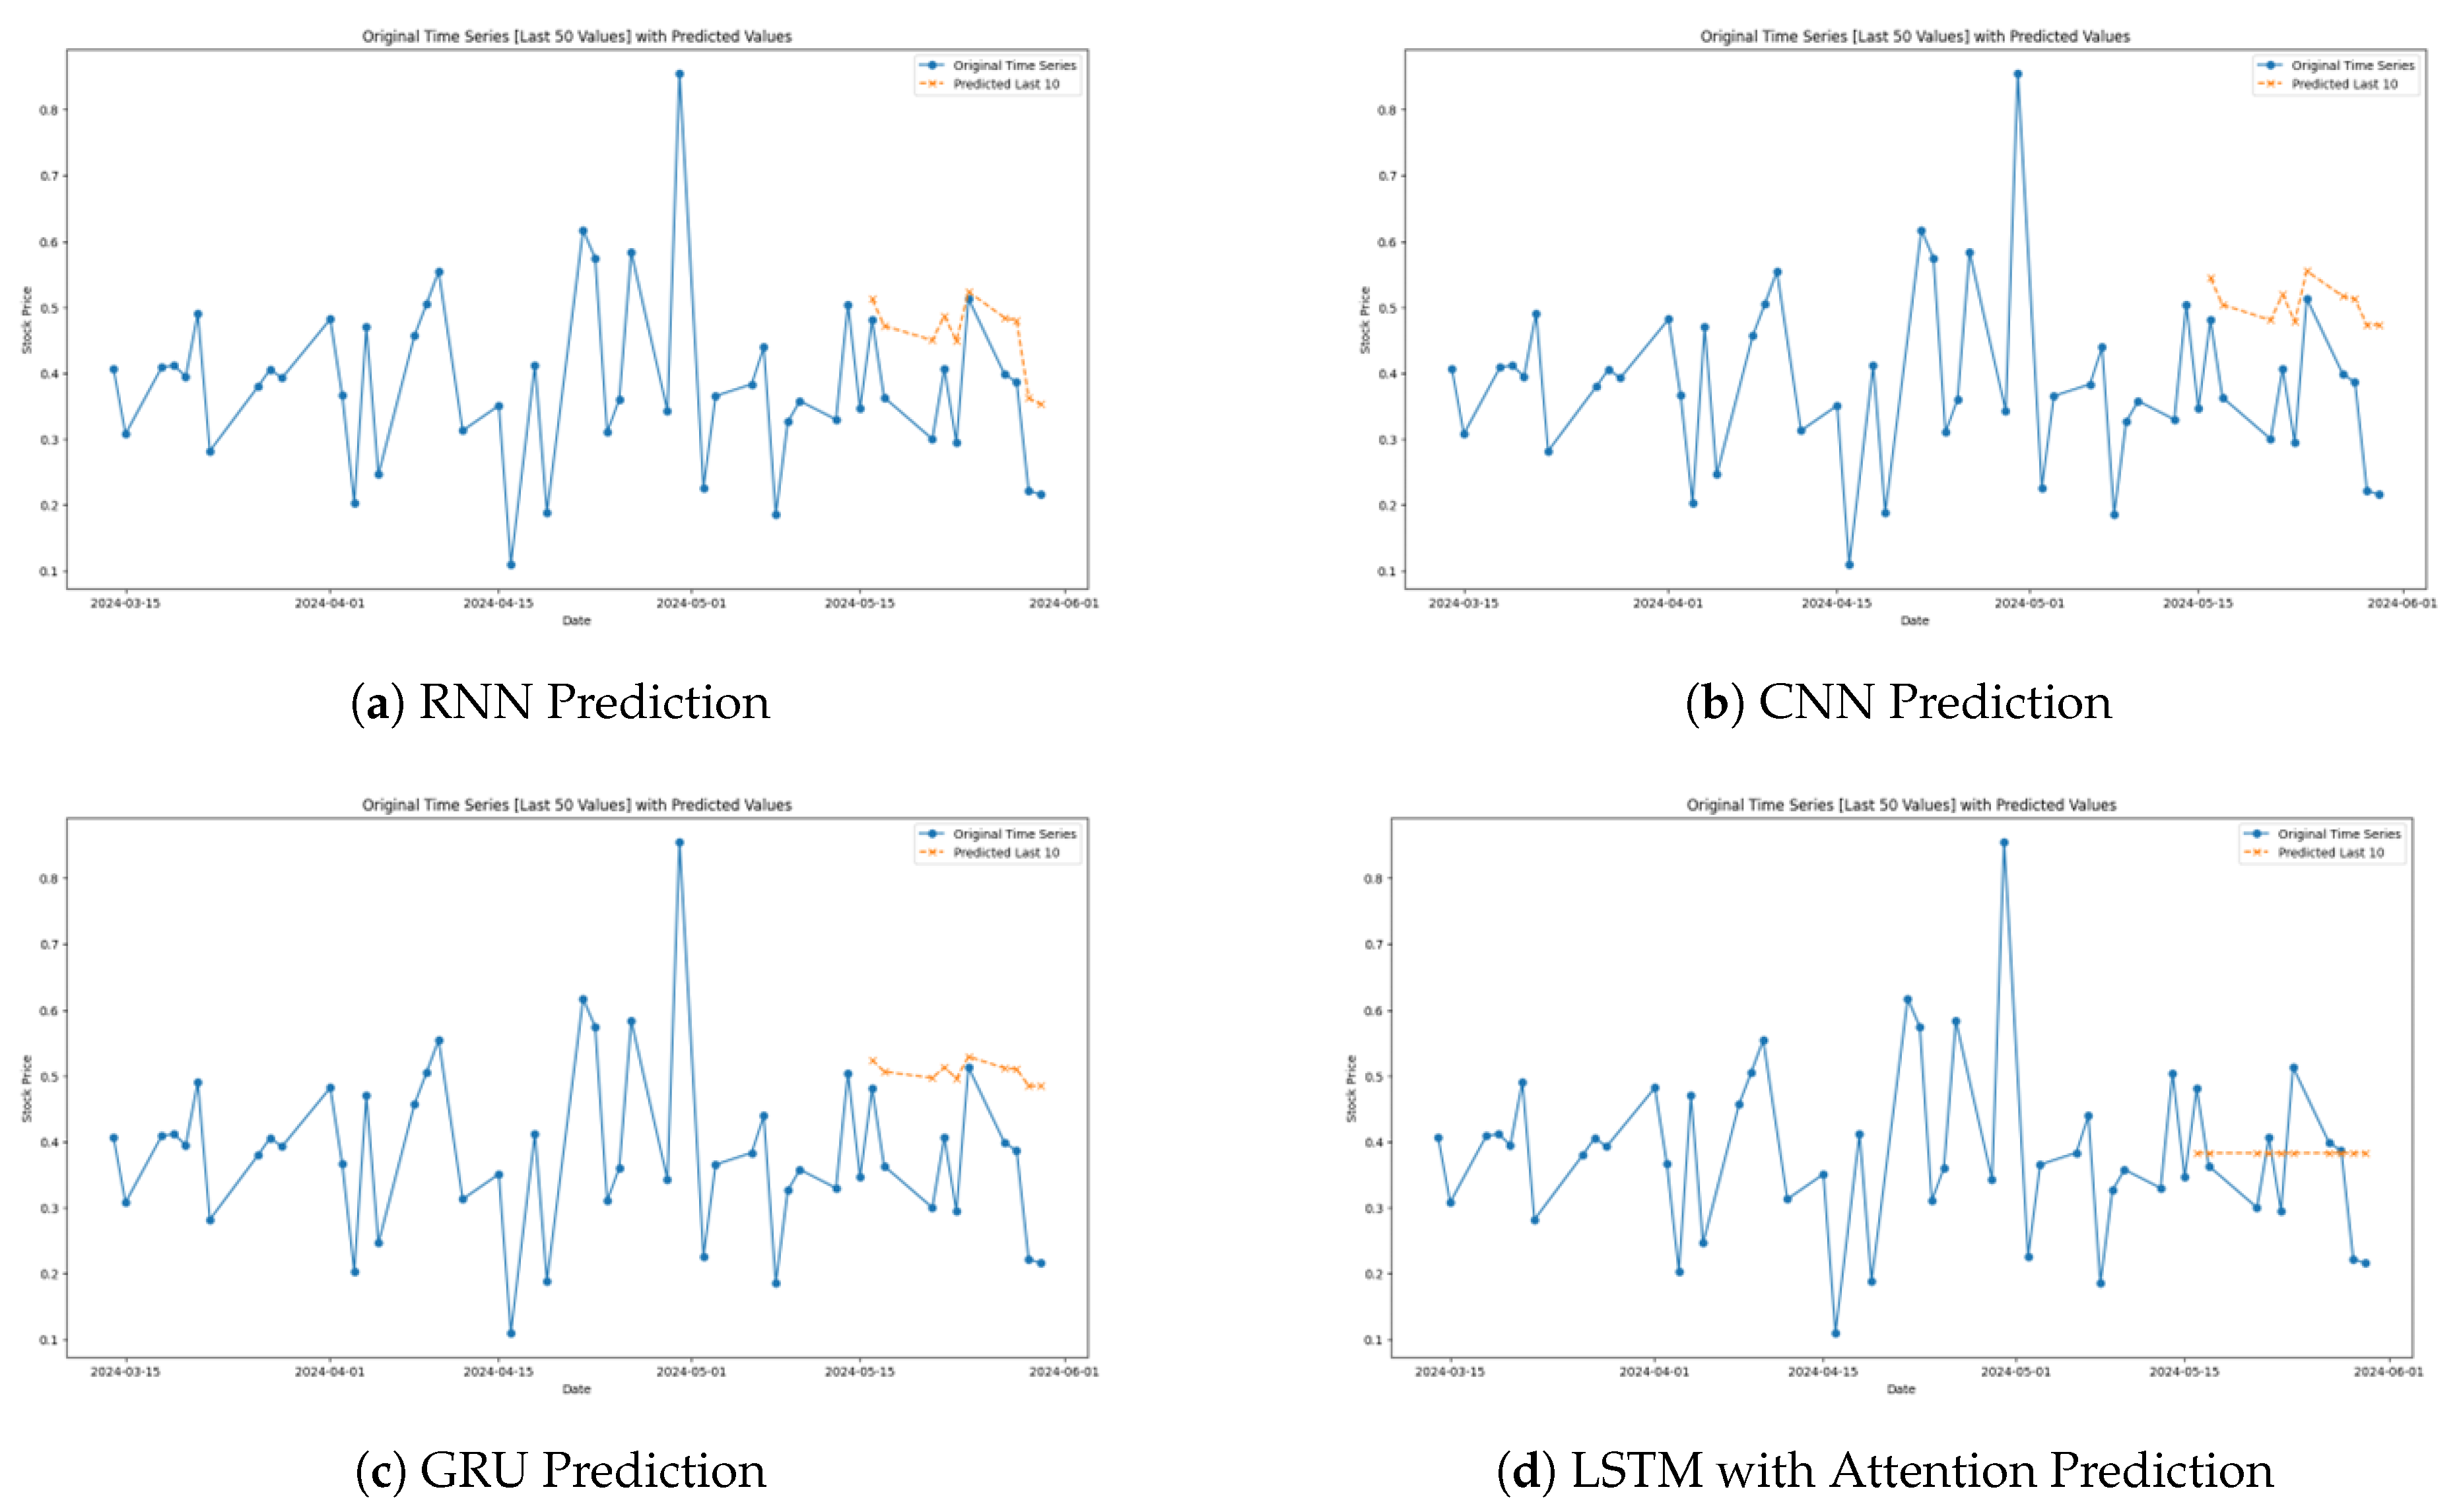
Figure 5.
Model Predictions for the Reliance Stock.
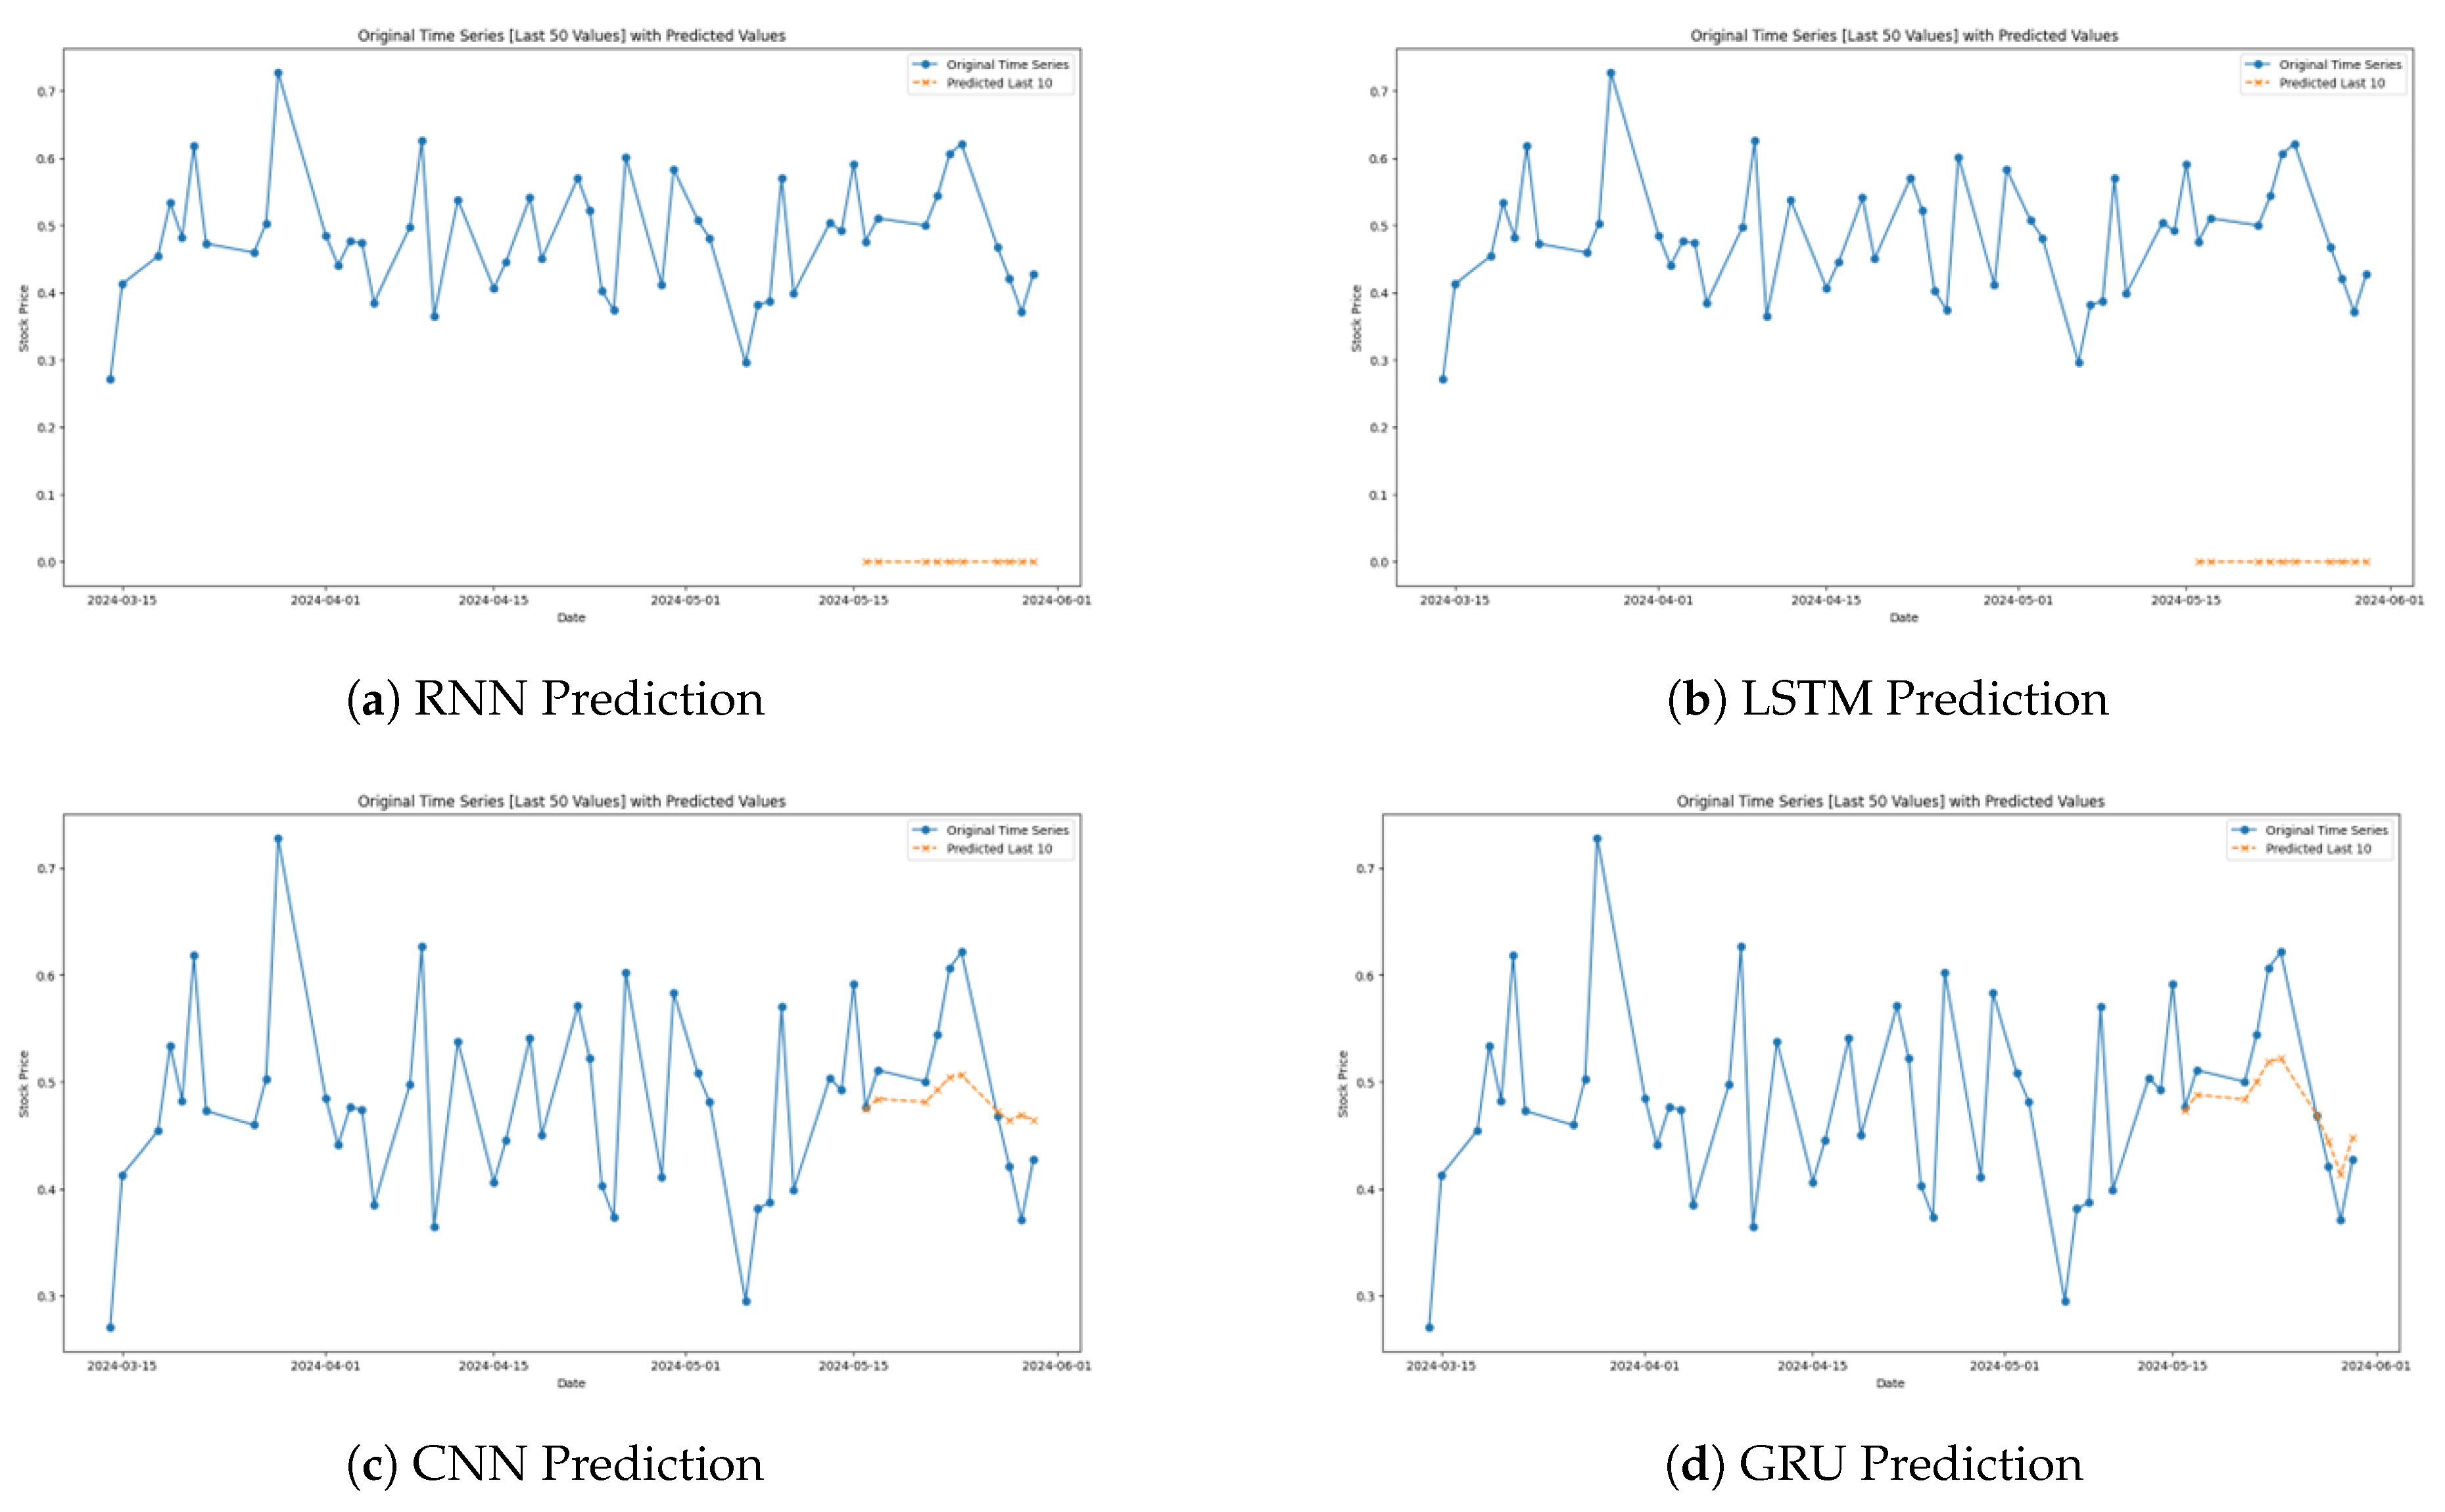

Table 1.
Model performances on the HDFC Stock Data in terms of the evaluation metrics.
| Model | MAE | MSE | RMSE | R-Square |
|---|---|---|---|---|
| RNN | 0.211425 | 0.075756 | 0.275238 | −0.014790 |
| LSTM | 0.205168 | 0.073515 | 0.271136 | 0.015231 |
| CNN | 0.201941 | 0.074096 | 0.272206 | 0.007445 |
| GRU | 0.204980 | 0.073715 | 0.271506 | 0.012543 |
| Attention LSTM | 0.205012 | 0.074433 | 0.272824 | 0.002933 |
Table 2.
Model performances on the TCS Stock Data in terms of the evaluation metrics.
| Model | MAE | MSE | RMSE | R-Square |
|---|---|---|---|---|
| RNN | 0.433488 | 0.292760 | 0.541073 | −1.792222 |
| LSTM | 0.286867 | 0.128644 | 0.358670 | −0.226954 |
| CNN | 0.288108 | 0.119834 | 0.346170 | −0.142925 |
| GRU | 0.291298 | 0.121207 | 0.348147 | −0.156017 |
| Attention LSTM | 0.275316 | 0.110270 | 0.332070 | −0.051711 |
Table 3.
Model performances on the ICICI Stock Data in terms of the evaluation metrics.
| Model | MAE | MSE | RMSE | R-Square |
|---|---|---|---|---|
| RNN | 0.202412 | 0.064328 | 0.253630 | 0.138293 |
| LSTM | 0.202412 | 0.064328 | 0.253630 | 0.138293 |
| CNN | 0.205847 | 0.071689 | 0.267748 | 0.039685 |
| GRU | 0.205716 | 0.070570 | 0.265651 | 0.054675 |
| Attention LSTM | 0.210881 | 0.076649 | 0.276855 | −0.026750 |
Table 4.
Model performances on the Reliance Stock Data in terms of the evaluation metrics.
| Model | MAE | MSE | RMSE | R-Square |
|---|---|---|---|---|
| RNN | 0.406110 | 0.296743 | 0.544741 | −1.251171 |
| LSTM | 0.406110 | 0.296743 | 0.544741 | −1.251171 |
| CNN | 0.328005 | 0.130712 | 0.361541 | 0.008383 |
| GRU | 0.333059 | 0.136330 | 0.369229 | −0.034238 |
| Attention LSTM | 0.317918 | 0.121637 | 0.348765 | 0.077228 |
Table 5.
Model performances on the Nifty50 Index in terms of the evaluation metrics.
| Model | MAE | MSE | RMSE | R-Square |
|---|---|---|---|---|
| RNN | 0.252424 | 0.105110 | 0.324207 | -0.203869 |
| LSTM | 0.246831 | 0.101502 | 0.318594 | -0.162540 |
| CNN | 0.232070 | 0.091618 | 0.302684 | -0.049331 |
| GRU | 0.230114 | 0.090895 | 0.301488 | -0.041058 |
| Attention LSTM | 0.446610 | 0.256458 | 0.506417 | -1.937318 |
Disclaimer/Publisher’s Note: The statements, opinions and data contained in all publications are solely those of the individual author(s) and contributor(s) and not of MDPI and/or the editor(s). MDPI and/or the editor(s) disclaim responsibility for any injury to people or property resulting from any ideas, methods, instructions or products referred to in the content. |
© 2024 by the authors. Licensee MDPI, Basel, Switzerland. This article is an open access article distributed under the terms and conditions of the Creative Commons Attribution (CC BY) license (http://creativecommons.org/licenses/by/4.0/).
Copyright: This open access article is published under a Creative Commons CC BY 4.0 license, which permit the free download, distribution, and reuse, provided that the author and preprint are cited in any reuse.


