
Submitted:
12 December 2025
Posted:
15 December 2025
You are already at the latest version
Abstract
The introduction of uridine modifications to improve the efficiency of protein translation and immune activation is a key area of development in mRNA technologies, determining their therapeutic potential in the treatment of various diseases. This research was aimed to study the impact of certain uridine modifications on target protein translation and the main pathways of the immune response at cellular level. Uridine-modified mRNA-GFP variants were obtained in a single-step in vitro transcription reaction and transfected into HEK293 and THP-1 cells. Transfection efficiency and GFP-fluorescence intensity were measured using flow cytometry and a live-cell imaging system. The number of GFP copies for both cell cultures was also determined with RT-qPCR for each mRNA preparation studied. GFP protein translation was assessed with Western blotting. Interferon response gene levels were estimated with multiplex cytokine analysis and RT-qPCR. The data obtained show that complete substitution of the uracyl with pseudouridine was associated with the highest translation levels and more significant IRF7-mediated interferon response. On the contrary, complete substitution of the uracyl with 5'-methoxyuridine significantly reduces the immunogenicity of the drug. Meanwhile, 50% substitution with pseudo- or 5'-methoxyuridine produces approximately the same results in terms of GFP expression levels and cellular immune response. Pseudouridine modifications may be potentially useful for minimizing the use of adjuvants in the production of oncotherapeutic mRNA vaccines, while 5'-methoxyuridine modifications help reduce the intrinsic immunogenicity of the mRNA, which may be of potential use in treatment of infectious diseases. However, it makes sense to explore the possibility of gently modulating the immunogenic potential of target drugs by altering the ratio of uridine modifications.
Keywords:
mRNA
; in vitro transcription
; uridine modifications
; pseudouridine
; methoxyuridine
; translation efficiency
; immune response activation
1. Introduction
The mRNA vaccine development is currently a promising area of research. Implementation of this technology into clinical practice has come since the coronavirus pandemic and continues to this day. Thus, a number of vaccines have now been developed for both the prevention of infectious diseases and the treatment of oncology [1].
Activation of the innate immune response to mRNA preparations can both enhance the adaptive immune response and increase vaccine efficacy (in particular, this is what adjuvants are used for [2]), as well as lead to adverse reactions and limit the therapeutic potential of mRNA due to immune activation and decreased protein synthesis [3]. Since entering the cell, foreign RNA is recognized by internal endosomal and cytoplasmic receptors (e.g., RIG-1, MDA5) [4,5,6,7]. The main endosomal RNA sensors in the cell are TLR-7 and TLR-8, recognizing single-stranded RNA, and TLR-3, recognizing double-stranded RNA [8]. When activated, toll-like receptors dimerize and initiate further signaling via transcription factors. Thus, TLR-7 and TLR8 activate the MyD88-dependent downstream signaling pathway, and TLR3 activates the MyD88-independent signaling pathway (through TRIF) [9] (Figure 1).
Further, as a result of endosomal and cytoplasmic RNA sensors interaction, activation of the NF-κB, IRF3 and IRF7 genes occurs through a series of signaling cascades and recruiting specific adapter proteins and kinases. That triggers the transcription of type I interferons and inflammatory cytokines including TNFα (tumor necrosis factor α), interleukins IL1α and IL6, chemokines CXCL10 and CXCL1, MIP1α and MIP1β. As a result, the release of proinflammatory cytokines causes the activation of neutrophils and their migration to the inflammation site [13,14]. In addition, local inflammation can cause the migration of monocytes and macrophages through the activation of the MCP1 cytokine [15]. All described inflammatory processes can ultimately initiate the apoptosis of cells that have been affected by foreign RNA [14]. Thus, activation of innate immune systems can lead to a decrease in the adaptive response to the mRNA vaccine and, therefore, directly influence its efficiency.
The problem of innate immunity activation in approved mRNA-based vaccines has been solved by introducing nucleotide modifications [16,17]. All bases can be modified and used to obtain stably translated RNA, however, it has been shown that uracil has a more significant impact on activation of innate immunity [18]. Thus, it has been found that mRNA molecules containing unmodified uracil are capable of activating RNA-dependent protein kinase (PKR), which inhibits translation through the phosphorylation reaction of the transcription factor eIF-2A [16,19].
Currently, the most common uracil modifications are pseudouridine (Ψ) and N1-methylpseudouridine. Complete replacement of uracil with pseudouridine in the mRNA sequence leads to increased translation efficiency, since the modified structure protects RNA from degradation by endonucleases and prevents activation of RNA-dependent protein kinase [19]. Pseudouridine also stabilizes the RNA structure (the A-Ψ bond is stronger than A-U) and improves mRNA binding to ribosomes [20].
Substitution of pseudouridine with N1-methylpseudouridine increases the number of ribosomal complexes on mRNA, leading to increased translation levels, despite a decrease in the elongation rate (due to the steric effect of the additional methyl group), which leads to an increase in the duration of the translation process [21,22]. However, as a result of movement slowdown a shift in the reading frame may occur during protein synthesis, which potentially leads to the formation of off-target peptides with unknown functions [23,24,25]. The precise mechanism of Ψs on mRNA therapeutic outcome are not yet fully understood and need to be adjusted depending on the specific application and target cell/tissue type [26].
In addition to Ψs, other modifications of uracil, such as N5-methyluridine, 2-thiouridine, 5′-methoxyuridine, can be used to obtain mRNA [27]. 5′-Methoxyuridine is currently of research interest, since the addition of a methyl group to the 5′ position of the uridine base increases the lipophilic properties of RNA, facilitating penetration into cells, enhances thermodynamic stability and can increase protein translation, at the same time reducing the likelihood of the innate immune response activation due to less efficient recognition by DC receptors [28]. Along with, the effect of frameshifting upon the introduction of 5′-methoxyuridine was not detected [23]. The need for complete replacement of uracil with modified bases remains controversial, as activation of the innate immune system is often the trigger for the immune response [29]. Partial replacement of uracil with its derivatives reduces the immune system’s ability to perceive exogenous RNA as a threat, reduces adverse reactions, and improves therapy tolerability. In this work, we have aimed to consider in more detail the effect of partial and complete uracyl replacement with 5′-methoxyuridine compared to pseudouridine on the levels of mRNA expression and the activation of innate immune systems.
2. Materials and Methods
2.1. Genetic Engineering
The DNA construct for the mRNA vectors under development is based on a plasmid DNA preparation with a GFP reporter gene (pAAV_CMV_GFP, #AAV-400-CB, Cell Biolabs), which is further used as a validated positive control where applicable. The T7 promoter, necessary for mRNA transcription from the current template, was inserted into this sequence, as well as the 5′ and 3’ untranslated regions (3’ UTR) to increase translation efficiency. An additional positive control mRNA carrying the GFP sequence, containing the Aes12R (3’ UTR of BNT162b2, Pfizer/BioIntech).
2.2. mRNA Synthesis
2.2.1. In vitro Transcription
Linearized pAAV_CMV-T7_GFP was used as a template for mRNA samples synthesis with different contents of UTP, Pseudo-UTP and 5-OMe-UTP at in vitro transcription reactions. The reaction mixture included ATP and CTP (Biosan) 6 mM each, 1.5 mM GTP (Biosan), 4.5 mM ARCA cap structure analog (Biosan), 5 mM DTT (NEB), 2 U/μl RNAse inhibitor (Biolabmix), 50 U/ml inorganic pyrophosphatase (Biolabmix), 80 U/μl T7 DNA-dependent RNA polymerase (Biolabmix) and standard manufacturer buffer for T7 DNA-dependent RNA polymerase. UTP (Biosan) was added to 6 mM to the control unmodified RNA sample (hereinafter referred to as Nm), Ψ50% - UTP (Biosan) to 3 mM and Pseudo-UTP (Biosan) to 3 mM, Ψ100% - Pseudo-UTP (Biosan) to 6 mM to the samples with 5′-methoxyuridine (meU) modification: meU50% - UTP (Biosan) to 3 mM and 5-OMe-UTP (Biosan) to 3 mM, and 5-OMe-UTP (Biosan) to 6 mM to the meU100% sample. In vitro transcription was performed for 2.5 h at 37℃, after 1 h of incubation, 5 mM GTP (Biosan) was additionally added to each sample.
After in vitro transcription, the samples were treated with DNase I, for which the reaction mixture was diluted 5 times, DNase I-XT Reaction Buffer (NEB) was added to 1x and DNase I-XT (NEB) to a concentration of 80 U/ml. The mixture was incubated for 1 h at 37℃.
2.2.2. Dephosphorylation
Dephosphorylation of the obtained mRNA samples was carried out in a reaction mixture of the following composition: 1 U/μl RNase inhibitor (Biolabmix), 1x Cut Smart (NEB), Quick CIP (NEB) at a rate of 5 U per 1 μg of the original template. Incubation was carried out for 1 hour at 37 °C.
2.2.3. Polyadenylation
For enzymatic polyadenylation of dephosphorylated mRNA samples, a reaction mixture was prepared with 1 U/µl RNase inhibitor (Biolabmix), 1x Poly(A) Polymerase Reaction Buffer (NEB), 1 mM ATP, and Poly(A) Polymerase (NEB) at a concentration of 10 U/µg of initial template. The mixture was incubated for 3 hours at 37 °C.
2.2.4. Purification
After completion of the in vitro transcription, DNA template removal, dephosphorylation, and polyadenylation reactions, the RNA samples were purified using the Monarch Spin RNA Cleanup Kit (NEB). The concentrations of the resulting RNAs on each step were determined fluorimetrically using the Equalbit RNA HS (High Sensitivity) Assay Kit (Vazyme).
2.2.5. Quality Control
To assess the quality of the obtained mRNA and the efficiency of the polyadenylation, electrophoresis was performed in a 2% agarose gel prepared in a 1×TBE buffer containing ethidium bromide at a concentration of 0.5 μg/ml. Samples were mixed with 2× RNA Loading Dye (NEB), heated for 3 minutes at 90 °C, and then cooled on ice for 5 minutes. Electrophoresis was performed in a 1× TBE buffer in a horizontal chamber at 120 V for 100 minutes. After electrophoresis, DNA was visualized using the ChemiDoc gel documentation system (Bio-rad).
2.3. Cell Culture
To evaluate transfection efficiency, determine differential expression of the reporter gene (GFP), immune response genes, and changes in GFP protein translation, HEK293 embryonic kidney cells (ATCC) and THP-1 acute monocytic leukemia cells (ATCC) were used. Both cell cultures were incubated at 37 °C in a humidified atmosphere containing 5% CO2.
HEK293 were cultured in DMEM (Capricorn) supplemented with 10% fetal bovine serum (FBS, Gibco™), 2 mM L-glutamine (GlutaMax, Gibco™), and 10 μl/ml penicillin/streptomycin (PanEco Ltd.) and were passivated every 2-3 days using trypsin-EDTA solution (TrypLE, Gibco™). THP-1 was cultured in RPMI-1640 medium (PanEco) supplemented with 10% fetal bovine serum (FBS, Gibco™), 2 mM L-glutamine, and 10 μl/ml penicillin/streptomycin (PanEco). THP-1 passage was performed by selection and addition of an equal volume of complete culture medium.
2.4. Transfection Efficiency and mRNA Expression
The accumulation of GFP-fluorescence over time in cells transfected with mRNA preparations was evaluated by IncuCyte ® (Sartorius, Germany). The transfection efficiency (%) and GFP-fluorescence signal metrics (525/40, ex488) at the end point was measured by flow cytometry for live single cells (Cytoflex S, Beckman Coulter, USA). Quantitative PCR to determine GFP expression levels by the number of GFP copies was performed using a standard curve based on tenfold serial dilutions from 109 GFP copy number (~5ng pAAV_CMV_GFP). The sample preparation and specifics of the qPCR reaction and primers are presented in 2.5.2. RT-qPCR section.
2.5. Translation Levels (Western Blotting)
HEK293 cells were seeded at 6∙104 cells in 24-well plates and transfected with Lipofectamine 3000 (Thermo S) according to individual protocols: Ψ50% (1 μg), Ψ100% (1 μg), MeU50% (1 μg), MeU100% (1 μg), NM (1 μg), and pAAV_CMV_GFP (1 μg). After 48 h of exposure, the cells were removed with trypsin-EDTA solution, reprecipitated in PBS, and lysed with RIPA solution (Cell Signaling Technology) containing protease inhibitors (Halt™ Protease Inhibitor Cocktail (100X)). Before loading onto the gel, the samples were heated in a dry incubator (95 °C, 5 min) in 1X Laemmli and 20X b-mercaptoethanol. Protein electrophoresis in polyacrylamide gels (10% Mini-PROTEAN® TGX™ Precast Protein Gels) was carried out in TGBS at 100 V (1.5 h) with a loading of 5 μg of total protein per well. The gel was then equilibrated in a transfer buffer (TGB 20% EtOH) for 15 min. Semi-dry protein transfer from the gel to nitrocellulose membranes (0.45 μm, Bio-rad) was performed in Trans-Blot® SD Semi-Dry Transfer Cells with the cutoff parameters of 1 A; 15 V; 30 min. After transfer, the membrane was washed in distilled water for 5 minutes and blocked with EveryBlocking buffer supplemented with 0.1% Tween20 (Bio-rad) for 30 minutes. Next, the membrane was washed with PBST (0.05% Tween20) and stained with primary antibodies against alpha-tubulin (#GB11200, Servicebio) and GFP (#AB011, Eurogen) in 5% non-fat dry milk (ServiceBio) solution in TBST (0.05% Tween20) overnight at +4C. The next day, the membranes were washed three times with PBST for 30 minutes and stained with a solution of secondary antibodies conjugated with horseradish peroxidase (#1662408EDU, Bio-rad) for 60 minutes at room temperature. The membranes were washed with PBST and developed using peroxide solution and Luminol (#1705061, Bio-rad) in the ChemiDoc™ Imaging System (#12003153, Bio-rad) in channels 602/50, 700/50, 647SP.
2.5. Cell Response to mRNA Invasion
2.5.1. Multiplex Analysis
The THP-1 culture was seeded at 2∙105 cells in 96-well plates and transfected with Lipofectamine MessengerMax (Thermo S) according to individual protocols: Ψ50% (120ng, 400ng, 800ng), Ψ100% (120ng, 400ng, 800ng), MeU50% (120ng, 400ng, 800ng), MeU100% (120ng, 400ng, 800ng), Nm (120ng, 400ng, 800ng). For positive control of changes in the cytokine profile, 800ng of poly(I:C) (#B5551, ApexBio Technology) was used as a multiplex assay. After 20 h of exposure, the plate was unscrewed, the supernatants were collected for multiplex analysis (2.5.1), the cell pellets were resuspended and analyzed by flow cytometry as in 2.4.1.
Quantitative multiplex analysis of cytokine/chemokine levels was performed using the HCYTOMAG-60K magnetic bead set (EMD Millipore Corporation) on a FlexMap 3D multiplex flow fluorometer. All incubations were performed at room temperature. The beads were incubated for two hours, then washed twice with wash buffer and incubated with antibodies for one hour. The analytical panel contained epidermal growth factor (EGF), fibroblast growth factor (FGF-2), eotaxin, transforming growth factor (TGF)-a, granulocyte and granulocyte-macrophage colony-stimulating factor (G-CSF, GM-CSF), Flt-3L, Fractalkine, interferon (IFN)-a2, IFN-y, GRO, interleukins: (IL)-10, IL-12p40, IL-12P70, IL-13, IL-15, sCD40L, IL-17A, IL-1RA, IL-1a, IL-9, IL-1b, IL-2, IL-3, IL-4, IL-5, IL-6, IL-7, IL-8, IP-10, monocyte MCP-3, macrophage chemokine (MDC), macrophage inflammatory protein (MIP)1α and MIP1β, tumor necrosis factor TNFa, TNFb, and vascular endothelial growth factor (VEGF) were used. To complete the reaction, Streptavidin-Phycoerythrin was added to the surface of each microsphere after incubation with antibodies, the mixture was incubated for 30 minutes, washed with wash buffer, resuspended for 10 minutes in flow fluid on a shaker, and loaded into the FLEXMAP 3D® multiplex analyzer. Calculation analysis was performed using MILLIPLEX® Analyst 5.1 software using prediluted standards and control compensation; the results are presented as median concentrations in pg/mL.
2.5.2. RT-qPCR
The THP-1 culture was seeded at 2∙105 cells in 96-well plates and transfected with Lipofectamine MessengerMax (Thermo S) according to individual protocols: Ψ50% (120ng, 200ng, 400ng), Ψ100% (120ng, 200ng, 400ng), MeU50% (120ng, 200ng, 400ng), MeU100% (120ng, 200ng, 400ng), Nm (120ng, 200ng, 400ng), Aes12R (K+, 200ng). After 20 h of exposure, the cells were pooled into 4 wells per replicate (three replicates), collected in test tubes and re-precipitated in ExtractRNA (Eurogen), 15min. Total RNA from cell cultures was isolated using the standard phenol-chloroform method. The HEK293 culture was seeded at 60∙103 cells in 24-well plates and transfected with Lipofectamine (Lipofectamine 3000, Thermo S) according to individual protocols: Ψ50% (1 μg), Ψ100% (1 μg), MeU50% (1 μg), MeU100% (1 μg), Nm (1 μg), pAAV_cmv_GFP (1 μg), in triplicate. After 40 hours of exposure, ExtractRNA was added to the cells (15 min) and total RNA was further isolated using the phenol-chloroform method. For reverse transcription, 1 μg of template, 0.4 μM oligo(dT)15 primer, and 100 units of MMLV reverse transcriptase were used per reaction according to the manufacturer’s recommendations (MMLV RT kit, Eurogen). Real-time PCR was performed using qPCRmix-HS reagent mix (Eurogen), SYBR intercalating dye (Eurogen), 5% DMSO (optional) and primers for genes of interest (Table 1).
Primer sequences for the genes of interest were designed using NCBI Primer-BLAST (NCBI, USA) and OligoAnalyzer Tool (Integrated DNA Technologies, Inc, USA). Commercial primers (OriGene Technologies) were also used. Standard curves were constructed for each primer pair (Table 1) to evaluate the amplification efficiency on the intact THP-1 cell cDNA template and to justify the use of the 2-ddCq threshold cycle normalization calculation to the selected reference gene (ActB). The relative expression level of the control sample (cells treated with lipofectamine) was set to 1. The GFP titer was determined using pAVV_CMV_GFP, based on the titer of the standard curve from 109 copies.
2.6. Statistical Analysis
Statistical significance between the two groups was calculated with Student’s t-test. Comparisons between few groups were conducted by one-way analysis of variance (ANOVA) and nonparametric Wilcoxon or Dunn’s tests. p value < 0.05 was considered statistically significant, *p < 0.05, **p < 0.005, ***p < 0.0005 ****p < 0.0001.
3. Results
3.1. mRNA Preparations
The efficiency of polyadenylation reaction and mRNA quality were assessed using gel electrophoresis (Figure 2). A polyA-tail was observed for all polyadenylated samples, while no genomic DNA contamination or mRNA degradation was detected in either the polyadenylated or untreated samples.
3.2. Comparison of Uridine-Modified mRNA Preparations: Fluorescence Intensity, GFP Expression and Protein Translation
The efficiency of mRNA delivery relative to the control was assessed in HEK293 cells. GFP fluorescence intensity and sample preparation for flow cytometry were performed according to the Materials and Methods section. The signal intensity of GFP events and their number were recorded using IncuCyte at time points of 0 h, 8 h, 16 h, 24 h, 32 h, and 40 h (Figure 3). It is noticeable that the fluorescence of cells exposed to mRNA reaches a plateau after 24 h, reaching the intensity limit, while cells transfected with plasmid DNA have not yet reached the maximum intensity.
Next, the number of GFP events and fluorescence intensity were assessed by flow cytometry of live single cells with a gate set to intact cells and correction using Lipofectamine 3000. For all mRNA preparations, transfection efficiency in HEK293 was greater than 90%. Сells exposed to mRNA preparations with pseudouridine modifications demonstrated the highest intensity (Figure 4a).
GFP protein translation was assessed using immunoblotting (Figure 4d). When normalized to tubulin, the intensity distribution pattern determined by flow cytometry was preserved but showed less scatter; a graph constructed using averaged intensity metrics is shown in Figure 4e. Minimal GFP translation intensity was observed for unmodified mRNA (NM), and the translation intensity of mRNA with 100% 5′-methoxyuridine was significantly lower than that of mRNA with 100% pseudouridine. Translation intensities of mRNA with 50% pseudouridine and 50% 5′-methoxyuridine were approximately the same.
Thus, all mRNA preparations modified with uridine demonstrated increased fluorescence intensity compared to the control. No significant differences were found between preparations modified with 50% pseudouridine and 50% 5′-methoxyuridine, unlike preparations modified with 100% pseudouridine and 100% 5′-methoxyuridine. One could argue for an inverse correlation, however, in some studies, the translation efficiency of mRNA with 100% 5′-methoxyuridine exceeds that of mRNA with 100% pseudouridine [30,31]. These discrepancies are likely caused by the uracil content of the mRNA matrix. It has been found that optimizing the mRNA sequence to reduce the uracil content increases translation efficiency, even without modifications [32]. Furthermore, mRNA expression with different modifications may vary in different cell types, as we observed in HEK293 model cell lines. In this experiment, the highest translation level was observed for the GFP mRNA preparation containing 100% pseudouridine. Translation levels for GFP mRNA containing 50% pseudouridine and 50% 5′-methoxyuridine were approximately the same, while the translation level for cells exposed to mRNA containing 100% 5′methoxyuridine was lower. The lowest translation level was observed for unmodified mRNA.
3.3. Altered Expression of Genes Involved in Innate Immune Response
Since THP-1 lipofection is not highly effective [33], it was necessary to separately assess the percentage of GFP-positive cells for correct interpretation of the results (a plasmid transfection control was also not used in the experiment, since the DNA transfection efficiency for THP-1 is less than 5% [34]). The studied samples were centrifuged, the cell pellets were resuspended in PBS, and flow cytometry and qPCR were performed as described in the Materials and Methods section (Figure 5a, b).
The number of GFP-positive events and fluorescence intensity were assessed in live single cells with a gate set to intact cells and correction using Lipofectamine MM. Transfection efficiency was 20-30%, with a comparatively higher efficiency demonstrated by the mRNA preparation with 100% modification by 5′-methoxyuridine. However, when normalizing the data, the GFP signal intensity for this treatment was the lowest.
Changes in the expression of genes involved in the innate immune response were recorded for cDNA from the studied samples (Figure 6).
Pattern recognition receptors respond to foreign RNA and initiate a series of sequential reactions that lead to phosphorylation and activation of transcription factors (IRF3, IRF7, NF-kB) [35]. The transcription factors enter the nucleus, bind to the promoter regions of interferons (IFN-α, IFN-β, IFN-λ), and stimulate their expression. The released interferons act on neighboring cells and the infected cell itself, and through JAK/STAT-mediated signaling pathways, create unfavorable conditions for the synthesis of foreign proteins and induce apoptosis of infected cells [36].
In this case, unchanged IRF3 levels indicate that the foreign agent recognition phase has passed (usually lasting about a few hours after RNA entry into the cell), and by the time the experiment is terminated, the IRF7-driven interferon production stage predominates. On the other hand, the low level of IRF3 activation for uridine-modified mRNA variants may be associated with the low percentage of double-stranded RNA, which is a byproduct of the transcription reaction. Thus, IRF3 activation occurs via a signaling cascade from cytoplasmic TLR3 receptors, which sense double-stranded RNA.
Increased IRF7 and IFNα levels indicate the initiation of an antiviral immune response. This is consistent with the situation when cells react to the presence of drugs that mimic a viral infection (e.g., mRNA preparations). Increased IRF7 and IFNα levels are not accompanied by a significant increase in TNFα for modified mRNA, indicating that the immune response prevails over the general inflammatory process, unlike the response to unmodified RNA. Importantly, the reduced activation of general inflammatory markers, such as TNFα, may be considered an advantage, as it reduces the risk of unwanted side effects associated with systemic inflammation.
To more thoroughly assess the development of the primary immune response, a multiplex assay was performed. Transfection was performed according to section 1.1.6.4. GFP signal intensity and the number of GFP-positive events were recorded using IncuCyte at four time points: 0 h, 8 h, 16 h, and 22 h (Figure S1). Cell samples were collected in triplicate, centrifuged (500 g for 5 min), and the cytokine profile of the supernatants was analyzed relative to the negative control (Lipofectamine Messenger Max) and positive control (polyI/C) (Figure 7).
The observed simultaneous increase in the expression of TNFα, IL-1α, Il1Rα, MIP1α, MIP1β, and CXCL10 in cells treated with unmodified mRNA indicates activation of the immune response and an inflammatory reaction. In this case, TNFα acts as the primary trigger of the inflammatory cascade, and IL-1α is an early indicator of inflammation. Elevated Il1Rα levels indicate the activation of regulatory mechanisms aimed at reducing excessive IL-1-associated inflammation. At the organism level, IL-1 promotes the mobilization of immune cells through MyD88-dependent pathways and the formation of a local protective response, while MIP1α, MIP1β are important factors in attracting phagocytic cells (neutrophils and macrophages) to the site of inflammation via CCR receptors. Elevated CXCL10 levels in this case also indicate active inflammation, while in the in vivo model, CXCL10 is associated with the activation of signaling cascades involving adaptive immunity. Modifications with pseudouridine and 5′-methoxyuridine are associated with milder activation of the innate immune system.
Despite the pronounced activation of IRF7 and IFNα observed in qPCR, for 100% pseudouridine there was modest response of proinflammatory cytokines in cell supernatant, which is expressed in a moderate increase of CXCL10, TNFα, IL1α, IL1RA, MIP1α, MIP1β relative to the negative control. On the contrary 100% 5′-methoxyuridine even reduced the expression of TNFα, CXXL1 and MIP1b which is more comparable an inflammation modulator, a controlling excessive immune response.
4. Discussion
The study of uridine modifications is an important and promising area of research, as many questions remain regarding the reduction of the proinflammatory immune response for the clinical use of mRNA preparations, both for effective protection against serious viral infections and as components of combination vaccines and protective antitumor therapy.
Our observations confirm that RNA preparations unmodified during in vitro transcription significantly affect the innate immune system, which carries a high risk of side effects, including the development of a systemic inflammatory response. Pseudouridine modifications traditionally have high potential for use in mRNA vaccine and protein therapy, where high protein synthesis rates and reduced primary immunogenicity are required. Furthermore, we observed a significant reduction in the proinflammatory response for 50% and 100% 5′-methoxyuridine compared to 50% pseudouridine and 100% pseudouridine. However, a decrease in the translation efficiency of mRNA with 5′-methoxyuridine was observed with an increasing percentage of modified nucleotides. These data are consistent with previous studies that noted a decrease in GFP mRNA expression when 5′-methoxyuridine was introduced into its sequence [37]. To achieve optimal vaccine or drug product characteristics, uridine modifications can be combined by replacing uracil with different ratios of modified bases. For example, modification with pseudouridine and methoxyuridine in combination could produce a synergistic effect, protecting against degradation, minimizing immunoreactivity, and ensuring high productivity of target protein synthesis.
Thus, the choice of a specific modification depends on the therapeutic goals, the required duration of action of the drug, and the desired level of immune response.
5. Conclusions
In conclusion, our results demonstrate that the introduction of modifications into mRNA sequence during in vitro transcription can affect the degree of activation of the immune response and the degree of translation of the target protein, which in turn can be used in the development of mRNA drugs with different putative mechanisms of action. The increased translation rate in preparations containing 100% pseudouridine is associated either with an increased number of ribosomal complexes or with accelerated movement of ribosomal complexes along the RNA molecule. Thus, the introduction of a methoxy group at the 5′ position of the uracil molecule may slow the movement of ribosomal complexes, causing a decrease in protein translation. However, further research is required to confirm this hypothesis.
Pseudouridine modifications may be potentially useful for minimizing the use of adjuvants in the production of oncotherapeutic mRNA vaccines due to their more pronounced activation of the immune response. 5′-Methoxyuridine modifications are more suitable for vaccines and therapeutic products that require long-term RNA circulation in tissues and a minimal immune response in the presence of high invasiveness.
The degree of modification can be modulated depending on the desired outcome. Further analysis is required to study the synergetic effects of combining several modifications in one mRNA sequence.
Supplementary Materials
The following supporting information can be downloaded at the website of this paper posted on Preprints.org, Figure S1: IncuCyte (THP-1): fluorescence intensity and GFP-positive events metrics of mRNA preparations (0 h, 8 h, 16 h, 22 h).
Author Contributions
Conceptualization, D.M.F. and M.V.S.; methodology, D.M.F., M.V.S., V.A.A., A.I.B., N.V.B.; software, D.M.F., M.V.S., V.E.M.; validation, M.V.S. and V.A.A.; formal analysis, D.M.F., M.V.S.; investigation, D.M.F., M.V.S., V.A.A., A.I.B., N.V.B.; resources, V.S.U., A.A.K.; data curation, D.M.F., V.V.M.; writing—original draft preparation, M.V.S, D.M.F., V.E.M.; writing—review and editing, V.V.M., V.S.U., A.A.K., U.; visualization, M.V.S., V.E.M.; supervision, V.V.M., V.S.U.; project administration, A.A.K., S.M.U.; funding acquisition, S.M.U. All authors have read and agreed to the published version of the manuscript.
Funding
This research was funded by Federal Medical-Biological Agency of the Russian Federation, grant number 388-00083-25-00. The APC was funded by Federal State Budgetary Institution «Centre for Strategic Planning and Management of Biomedical Health Risks» of the Federal Medical-Biological Agency.
Institutional Review Board Statement
Not applicable.
Informed Consent Statement
Not applicable.
Data Availability Statement
The data presented in this study are available on request from the corresponding author due to the presence of patentable materials, such as UTR sequences.
Acknowledgments
The authors express their gratitude to Federal Medical-Biology Agency for funding this research.
Conflicts of Interest
The authors declare no conflicts of interest.
Abbreviations
The following abbreviations are used in this manuscript:
| CCR | CC chemokine receptors (or beta chemokine receptors) |
| CXCL 1 or 10 | C-X-C motif chemokine ligand |
| EGF | Epidermal growth factor |
| eIF-2A | Eukaryotic translation initiation factor 2A |
| FGF-2 | Fibroblast growth factor |
| Flt-3L | Fms-related tyrosine kinase 3 ligand |
| G-CSF, GM-CSF | Granulocyte and granulocyte-macrophage colony-stimulating factor |
| GFP | Green Fluorescent Protein |
| GRO | Growth-Regulated Oncogene |
| IFN | Interferon |
| IL | Interleukin |
| IP-10 | Interferon-gamma-inducible protein 10 |
| IRF | Interferon Regulatory Factor |
| MCP | Monocyte chemoattractant protein |
| MDA | Melanoma differentiation-associated protein |
| MDC | Macrophage-Derived Chemokine (CCL22) |
| MIP | Macrophage Inflammatory Protein |
| MyD88 | Myeloid differentiation primary response 88 |
| NF-κB | Nuclear factor kappa-light-chain-enhancer of activated B cells |
| PKR | Protein Kinase R |
| poly(I:C) | Polyinosinic:polycytidylic acid |
| RIG-1 | Retinoic acid-inducible gene 1 |
| sCD40L | soluble CD40 ligand, |
| TGF | Transforming growth factor |
| TRIF | TIR-domain containing adaptor protein |
| TLR | Toll-like receptor |
| TNF | Tumor necrosis factor |
| VEGF | Vascular endothelial growth factor |
References
- Shi, Y.; et al. Progress and prospects of mRNA-based drugs in pre-clinical and clinical applications. Signal Transduct. Target. Ther. 2024; 9(1): pp.1–20. [CrossRef]
- Xie, C.; Yao, R.; Xia, X. The advances of adjuvants in mRNA vaccines. NPJ Vaccines 2023; 8(1): 162. [CrossRef]
- Verbeke, R.; Lentacker, I.; De Smedt, S.C.; Dewitte, H. Three decades of messenger RNA vaccine development. Nano Today 2019; 28 (100766). [CrossRef]
- Onomoto, K.; Onoguchi, K.; Yoneyama, M. Regulation of RIG-I-like receptor-mediated signaling: interaction between host and viral factors. Cell Mol Immunol 2021; 18: pp. 539–555. [CrossRef]
- Markiewicz, L.; Drazkowska, K.; Sikorski, P.J. Tricks and threats of RNA viruses - towards understanding the fate of viral RNA. RNA Biol 2021; 18(5): pp. 669–687. [CrossRef]
- Hühn, M.H.; McCartney, S.A.; Lind, K.; Svedin, E.; Colonna, M.; Flodström-Tullberg, M. et al. Melanoma differentiation-associated protein-5 (MDA-5) limits early viral replication but is not essential for the induction of type 1 interferons after Coxsackievirus infection. Virology 2010; 401(1): pp. 42–48. [CrossRef]
- Gitlin, L.; et al. Essential role of mda-5 in type I IFN responses to polyriboinosinic: polyribocytidylic acid and encephalomyo-carditis picornavirus. Proc. Natl. Acad. Sci. U. S. A. 2006; 103(22): pp. 8459–8464.
- Uehata, T.; Takeuchi, O. RNA Recognition and Immunity-Innate Immune Sensing and Its Posttranscriptional Regulation Mechanisms. Cells 2020; 9(7): pp. 1701. [CrossRef]
- Chai, Z.; Zhou, Y.; Yang, L.; et al. MyD88 Contributes to TLR3-Mediated NF-κB Activation and Cytokine Production in Macrophages. Cells 2025; 14(19): pp. 1507. [CrossRef]
- Kato, H.; Takeuchi, O.; Sato, S.. Differential roles of MDA5 and RIG-I helicases in the recognition of RNA viruses. Nature 2006; 441(1): pp. 101–105. [CrossRef]
- McNab, F.; Mayer-Barber, K.; Sher, A.; Wack, A.; O’Garra, A. Type I interferons in infectious disease. Nat Rev Immunol 2015; 15(2): pp. 87–103. [CrossRef]
- Dias Junior, A.G.; Sampaio, N.G.; Rehwinkel, J. A Balancing Act: MDA5 in Antiviral Immunity and Autoinflammation. Trends Microbiol 2019; 27(1): pp. 75–85. [CrossRef]
- Stumpo, D.J.; Lai, W.S.; Blackshear, P.J. Inflammation: cytokines and RNA-based regulation. Wiley Interdiscip Rev RNA 2010; 1(1): pp. 60–80. [CrossRef]
- Singh, S.; Anshita, D.; Ravichandiran, V. MCP-1: Function, regulation, and involvement in disease. Int Immunopharmacol 2021; 101(Pt B): 107598. [CrossRef]
- Jafarzadeh, A.; Chauhan, P.; Saha, B.; Jafarzadeh, S.; Nemati, M. Contribution of monocytes and macrophages to the local tissue inflammation and cytokine storm in COVID-19: Lessons from SARS and MERS, and potential therapeutic interventions. Life Sci 2020; 257: pp. 118102. [CrossRef]
- Freund, I.; Eigenbrod, T.; Helm, M.; Dalpke, A.H. RNA Modifications Modulate Activation of Innate Toll-Like Receptors. Genes (Basel) 2019; 10(2): 92. [CrossRef]
- Verbeke, R.; Hogan, M.J.; Loré, K.; Pardi, N. Innate immune mechanisms of mRNA vaccines. Immunity 2022; 55(11): pp. 1993–2005. [CrossRef]
- Thompson, M.G.; Sacco, M.T.; Horner, S.M. How RNA modifications regulate the antiviral response. Immunol Rev 2021; 304(1): pp. 169–180. [CrossRef]
- Svitkin, Y.V.; Cheng, Y.M.; Chakraborty, T.; Presnyak, V.; John, M.; Sonenberg, N. N1-methyl-pseudouridine in mRNA enhances translation through eIF2α-dependent and independent mechanisms by increasing ribosome density. Nucleic Acids Res 2017; 45(10): pp. 6023–6036. [CrossRef]
- Borchardt, E.K.; Martinez, N.M.; Gilbert, W.V. Regulation and Function of RNA Pseudouridylation in Human Cells. Annu Rev Genet. 2020; 54: pp. 309–336. [CrossRef]
- Andries, O.; Mc Cafferty, S.; De Smedt, S.C.; Weiss, R.; Sanders, N.N.; Kitada, T. N(1)-methylpseudouridine-incorporated mRNA outperforms pseudouridine-incorporated mRNA by providing enhanced protein expression and reduced immunogenicity in mammalian cell lines and mice. J Control Release 2015; 217: pp. 337–344. [CrossRef]
- Mulroney, T.E.; Pöyry, T.; Yam-Puc, J.C.; et al. N1-methylpseudouridylation of mRNA causes +1 ribosomal frameshifting. Nature 2024; 625(7993): pp. 189–194. [CrossRef]
- Liu, A.; Wang, X. The Pivotal Role of Chemical Modifications in mRNA Therapeutics. Front. Cell Dev. Biol. 2023; 11: pp. 1–15. [CrossRef]
- Monroe, J.; Eyler, D.E.; Mitchell, L.; et al. N1-Methylpseudouridine and pseudouridine modifications modulate mRNA decoding during translation. Nat Commun 2024; 15: 8119. [CrossRef]
- Acevedo-Whitehouse, K.; Bruno, R. Potential health risks of mRNA-based vaccine therapy: A hypothesis. Med Hypotheses 2023; 171: 111015. [CrossRef]
- Lin, T.Y.; Mehta, R.; Glatt, S. Pseudouridines in RNAs: switching atoms means shifting paradigms. FEBS Lett. 2021; 595(18): pp.2310–2322. [CrossRef]
- Johnson, R. Medicine from modified mRNA. Nat Chem Biol 2023; 19: 1443. [CrossRef]
- Xu, S.; Yang, K.; Li, R.; Zhang, L. mRNA Vaccine Era-Mechanisms, Drug Platform and Clinical Prospection. Int J Mol Sci 2020; 21(18): 6582. [CrossRef]
- Vivier, E.; Malissen, B. Innate and adaptive immunity: specificities and signaling hierarchies revisited. Nat Immunol 2005; 6: pp. 17–21. [CrossRef]
- Moradian, H.; Roch, T.; Anthofer, L.; Lendlein, A.; Gossen, M. Chemical modification of uridine modulates mRNA-mediated pro-inflammatory and antiviral response in primary human macrophages. Mol Ther Nucleic Acids 2022; 27: pp. 854–869. [CrossRef]
- Drzeniek, N.M.; Kahwaji, N.; Picht, S.; Dimitriou, I.M.; Schlickeiser, S.; Moradian, H.; Geissler, S.; Schmueck-Henneresse, M.; Gossen, M.; Volk, H.D. In Vitro Transcribed mRNA Immunogenicity Induces Chemokine-Mediated Lymphocyte Recruitment and Can Be Gradually Tailored by Uridine Modification. Adv Sci (Weinh) 2024; 11(21): e2308447. [CrossRef]
- Vaidyanathan, S.; Azizian, K.T.; Haque, A.K.M.A.; Henderson, J.M.; Hendel, A.; Shore, S.; Antony, J.S.; Hogrefe, R.I.; Kormann, M.S.D.; Porteus, M.H.; McCaffrey, A.P. Uridine Depletion and Chemical Modification Increase Cas9 mRNA Activity and Reduce Immunogenicity without HPLC Purification. Mol Ther Nucleic Acids 2018; 12: pp. 530–542. [CrossRef]
- Schnoor, M.; Buers, I.; Sietmann, A.; Brodde, M.F.; Hofnagel, O.; Robenek, H.; Lorkowski, S. Efficient non-viral transfection of THP-1 cells. J Immunol Methods 2009; 344(2): pp. 109–115. [CrossRef]
- Tang, X.; Aljahdali, B.; Alasiri, M.; Bamashmous, A.; Cao, F.; Dibart, S.; Salih, E. A method for high transfection efficiency in THP-1 suspension cells without PMA treatment. Anal Biochem 2018; 544: pp. 93–97. [CrossRef]
- Uehata, T.; Takeuchi, O. RNA Recognition and Immunity-Innate Immune Sensing and Its Posttranscriptional Regulation Mechanisms. Cells 2020; 9(7): 1701. [CrossRef]
- Fleming, S.B. Viral Inhibition of the IFN-Induced JAK/STAT Signalling Pathway: Development of Live Attenuated Vaccines by Mutation of Viral-Encoded IFN-Antagonists. Vaccines (Basel) 2016; 4(3): 23. [CrossRef]
- Sioud, M.; Juzeniene, A.; Sæbøe-Larssen, S. Exploring the Impact of mRNA Modifications on Translation Efficiency and Immune Tolerance to Self-Antigens. Vaccines (Basel) 2024; 12(6): 624. [CrossRef]
Figure 1.
Cellular response to mRNA preparation: RIG-I binds to mRNA and recruits the MAVS adapter, initiating further signaling via the serine-threonine kinases TBK-1 and IKKε. These enzymes, in turn, phosphorylate the transcription factor IRF-3, promoting the expression of type I interferon and enhancing antiviral immunity. Concurrently, TLR-7 and TLR-8 recognize pathogen-associated molecular patterns, activating the adapter protein MyD88, which triggers cascades through NF-kB and IRF-7, stimulating the production of cytokines and chemokines.
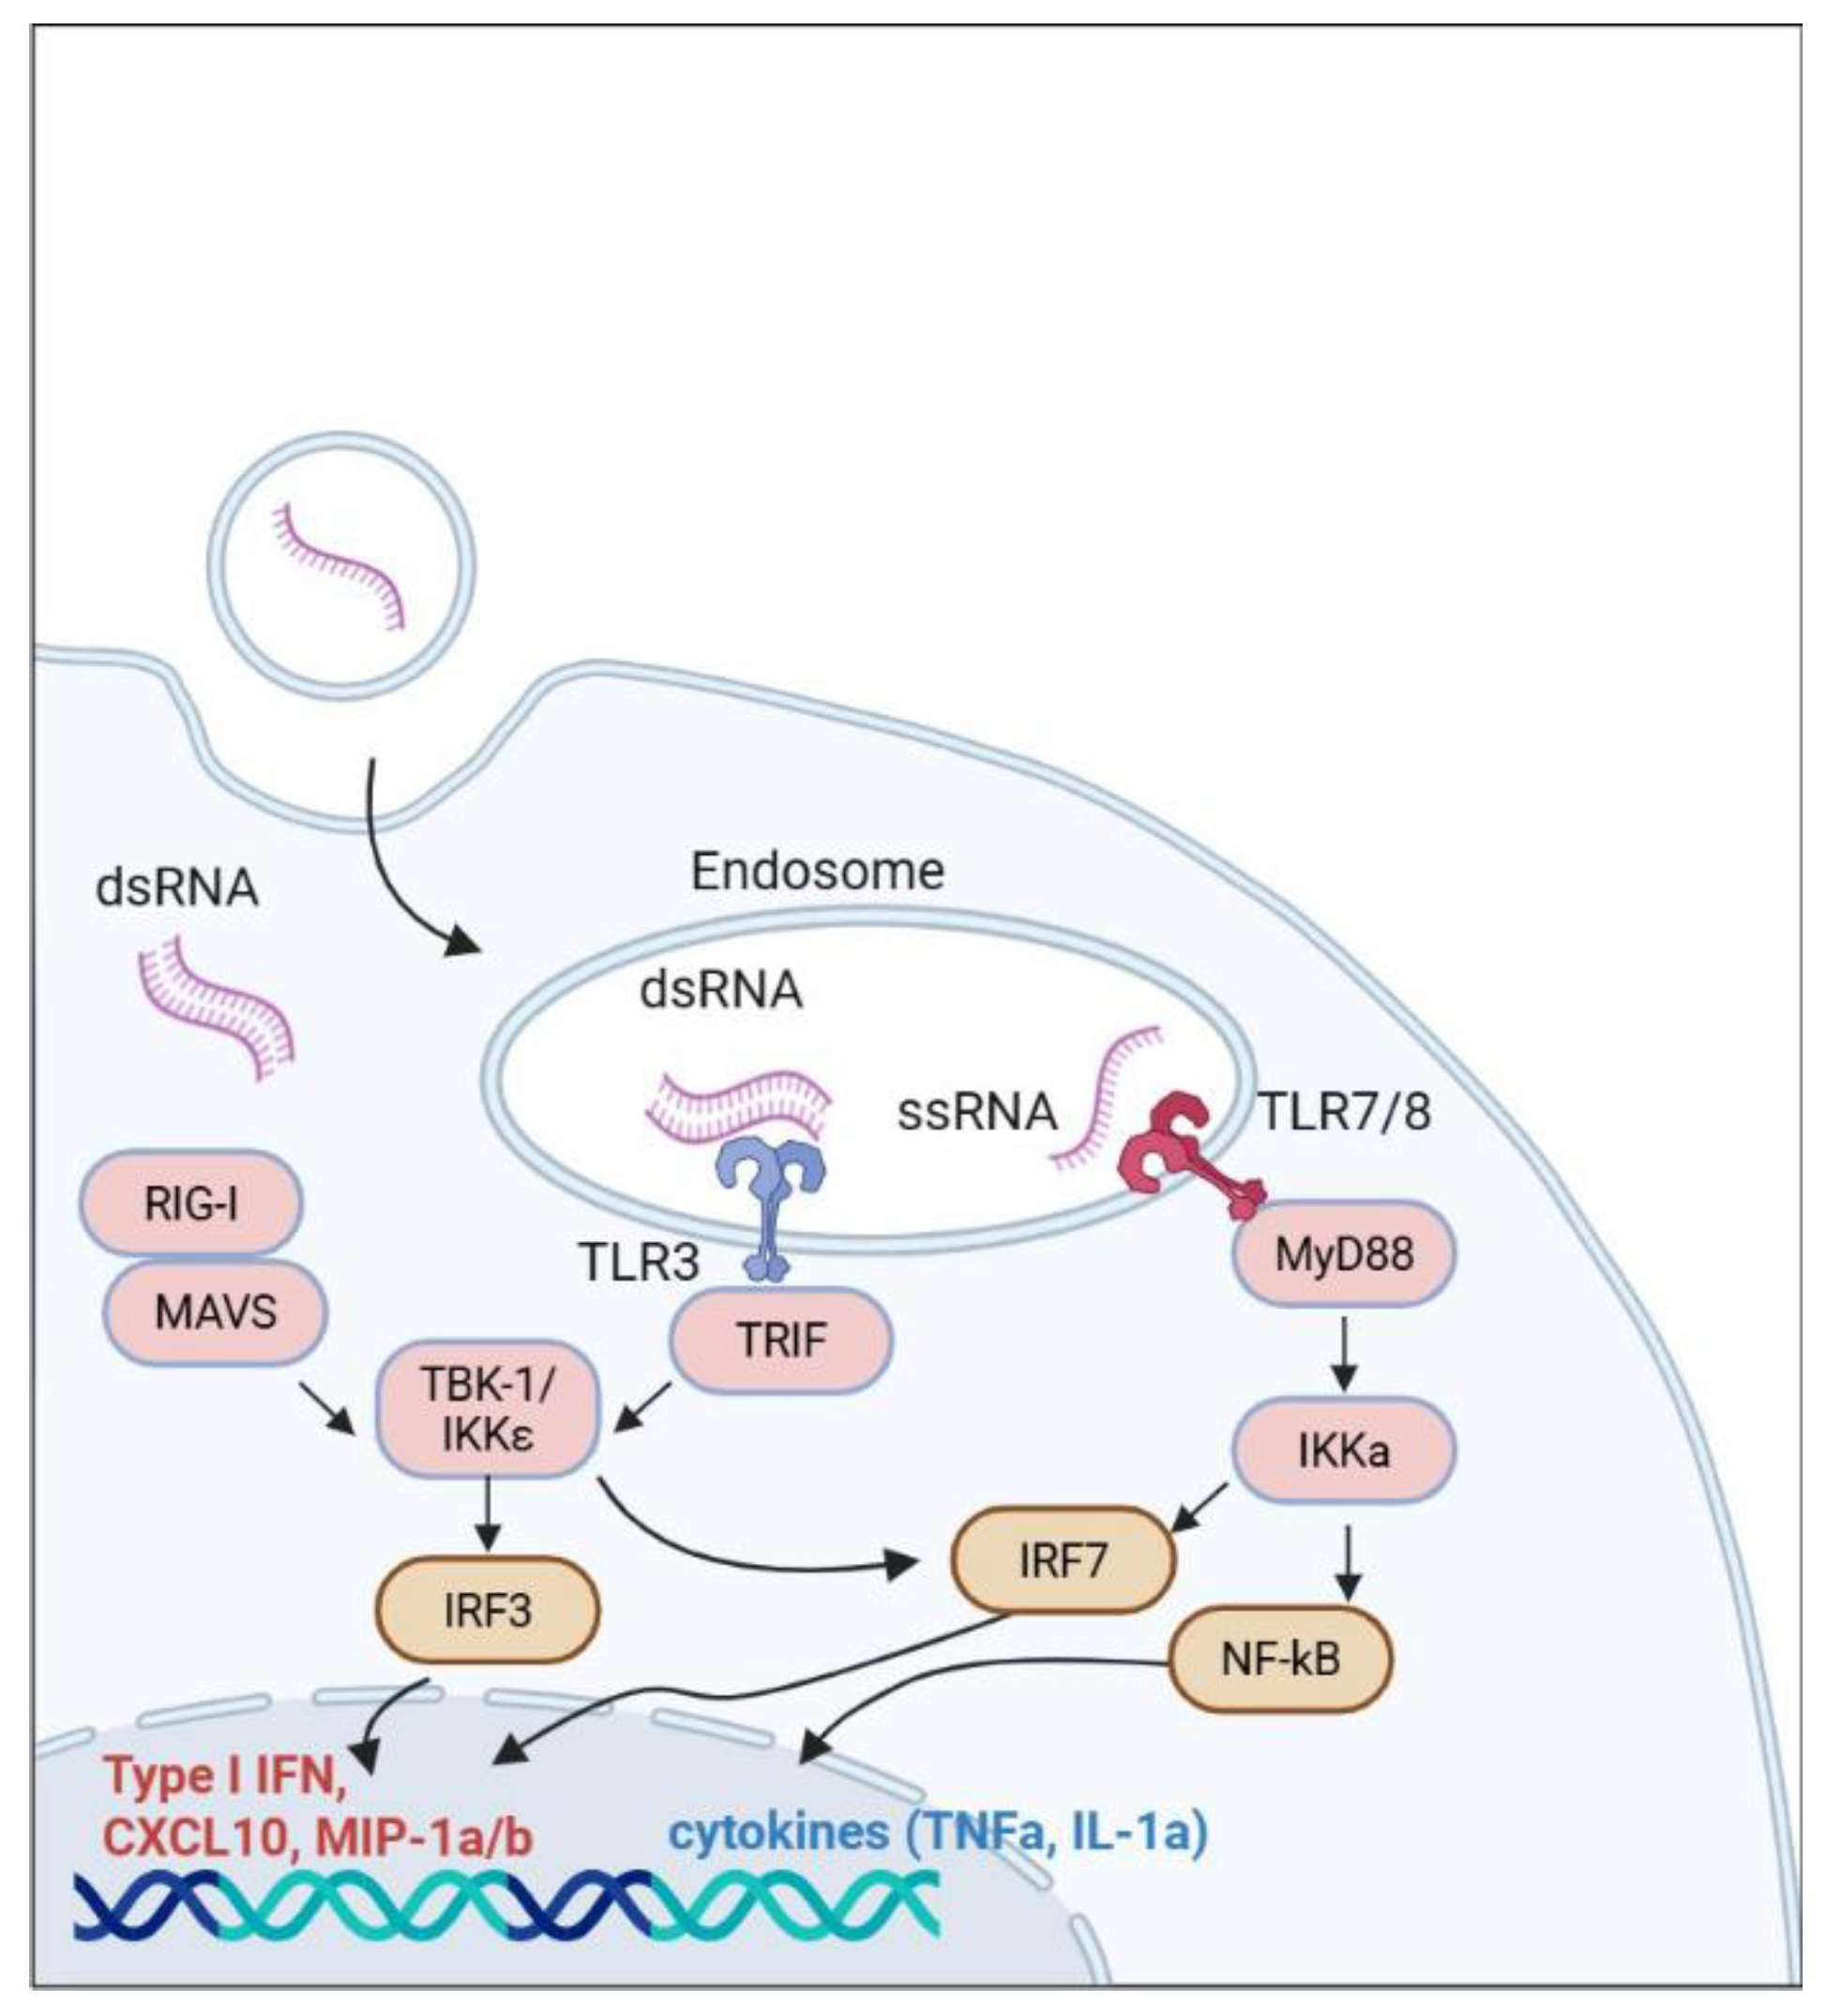
Figure 2.
de nono synthesized mRNA: (а) Target region of the original template (↑ site of enzymatic extension of the polyA tail in the polyadenylation reaction). (b) Quality control of mRNA preparations: electrophoresis in 2% agarose gel (TBE, EtBr) after dephosphorylation: polyadenylated (500 ng) and original (1 μg) samples.
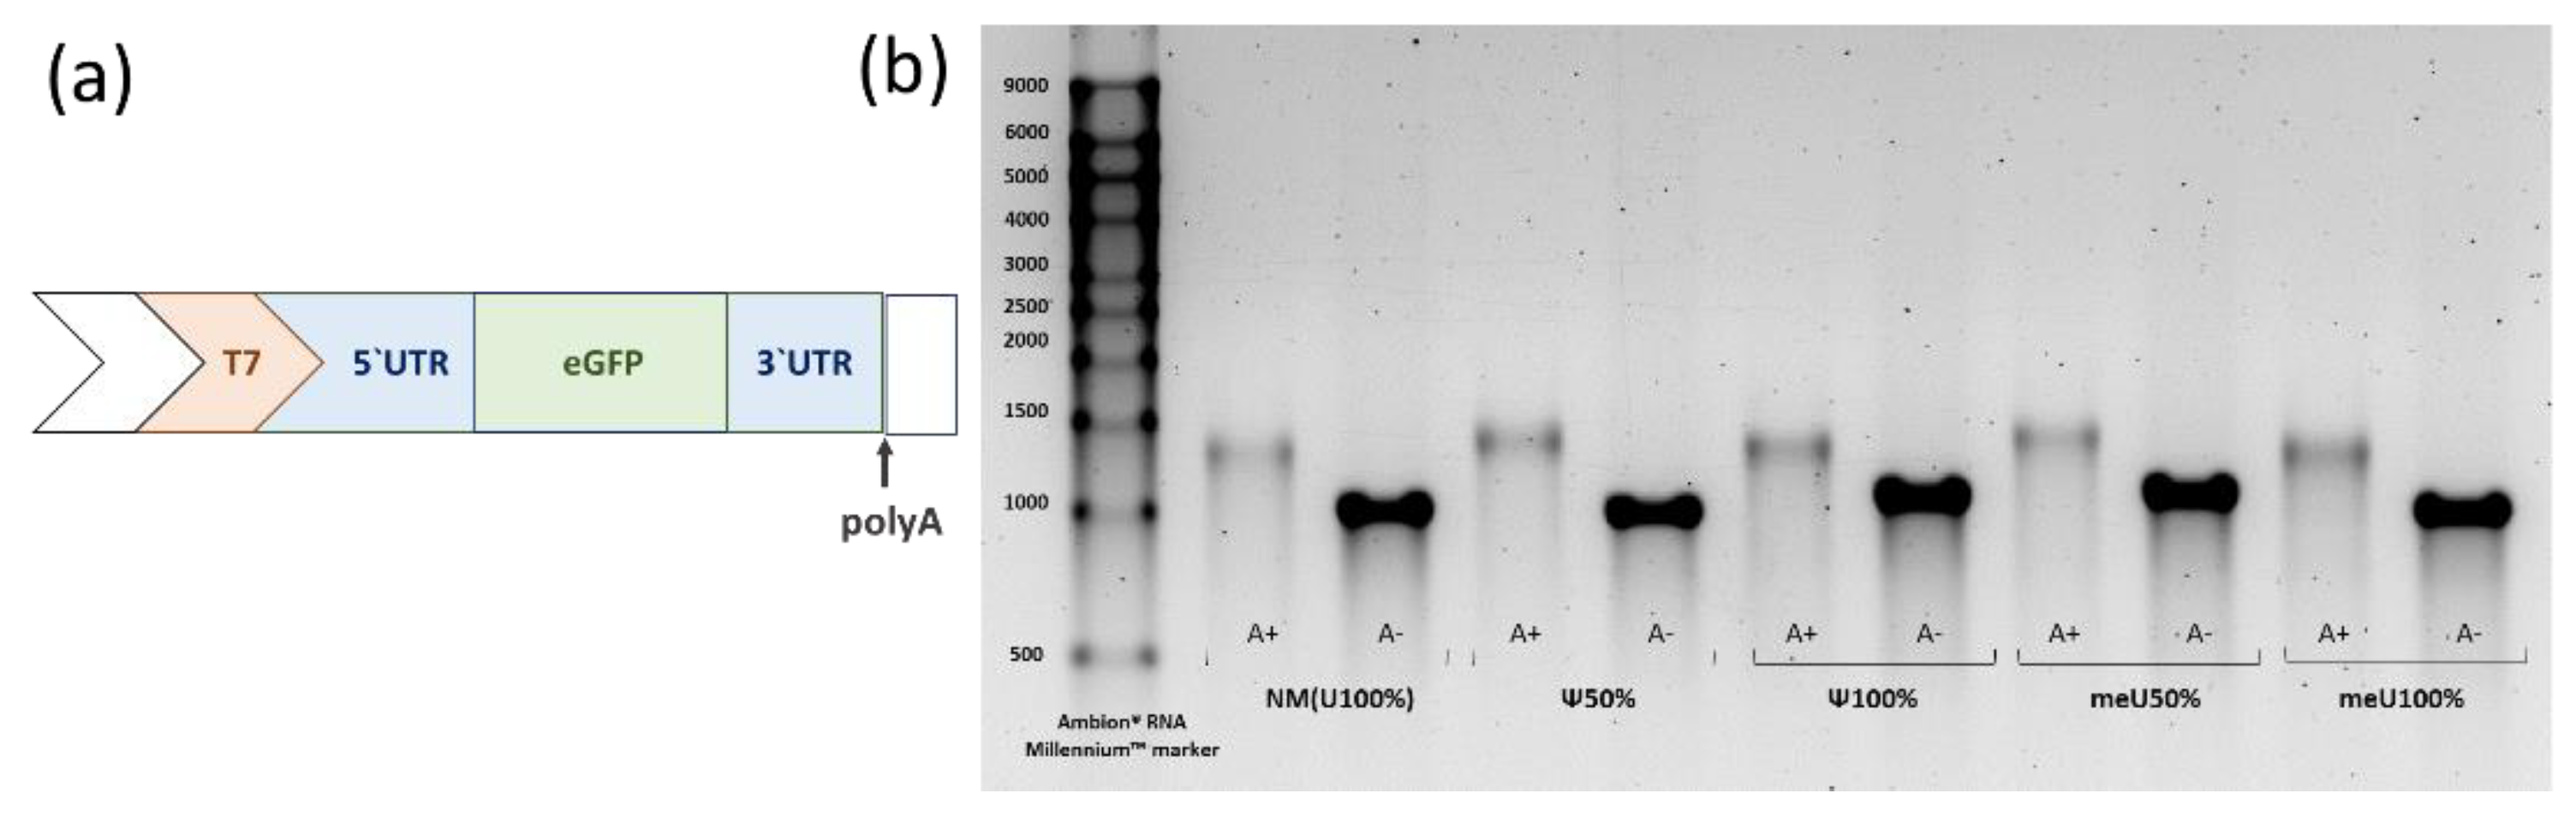
Figure 3.
mRNA-transfected HEK293 (40h). GFP-positive events metrics and representative images (Incucyte: 0h, 8h, 24h, 40h): (a) mRNA preparations and (b) K+ samples.
Figure 3.
mRNA-transfected HEK293 (40h). GFP-positive events metrics and representative images (Incucyte: 0h, 8h, 24h, 40h): (a) mRNA preparations and (b) K+ samples.
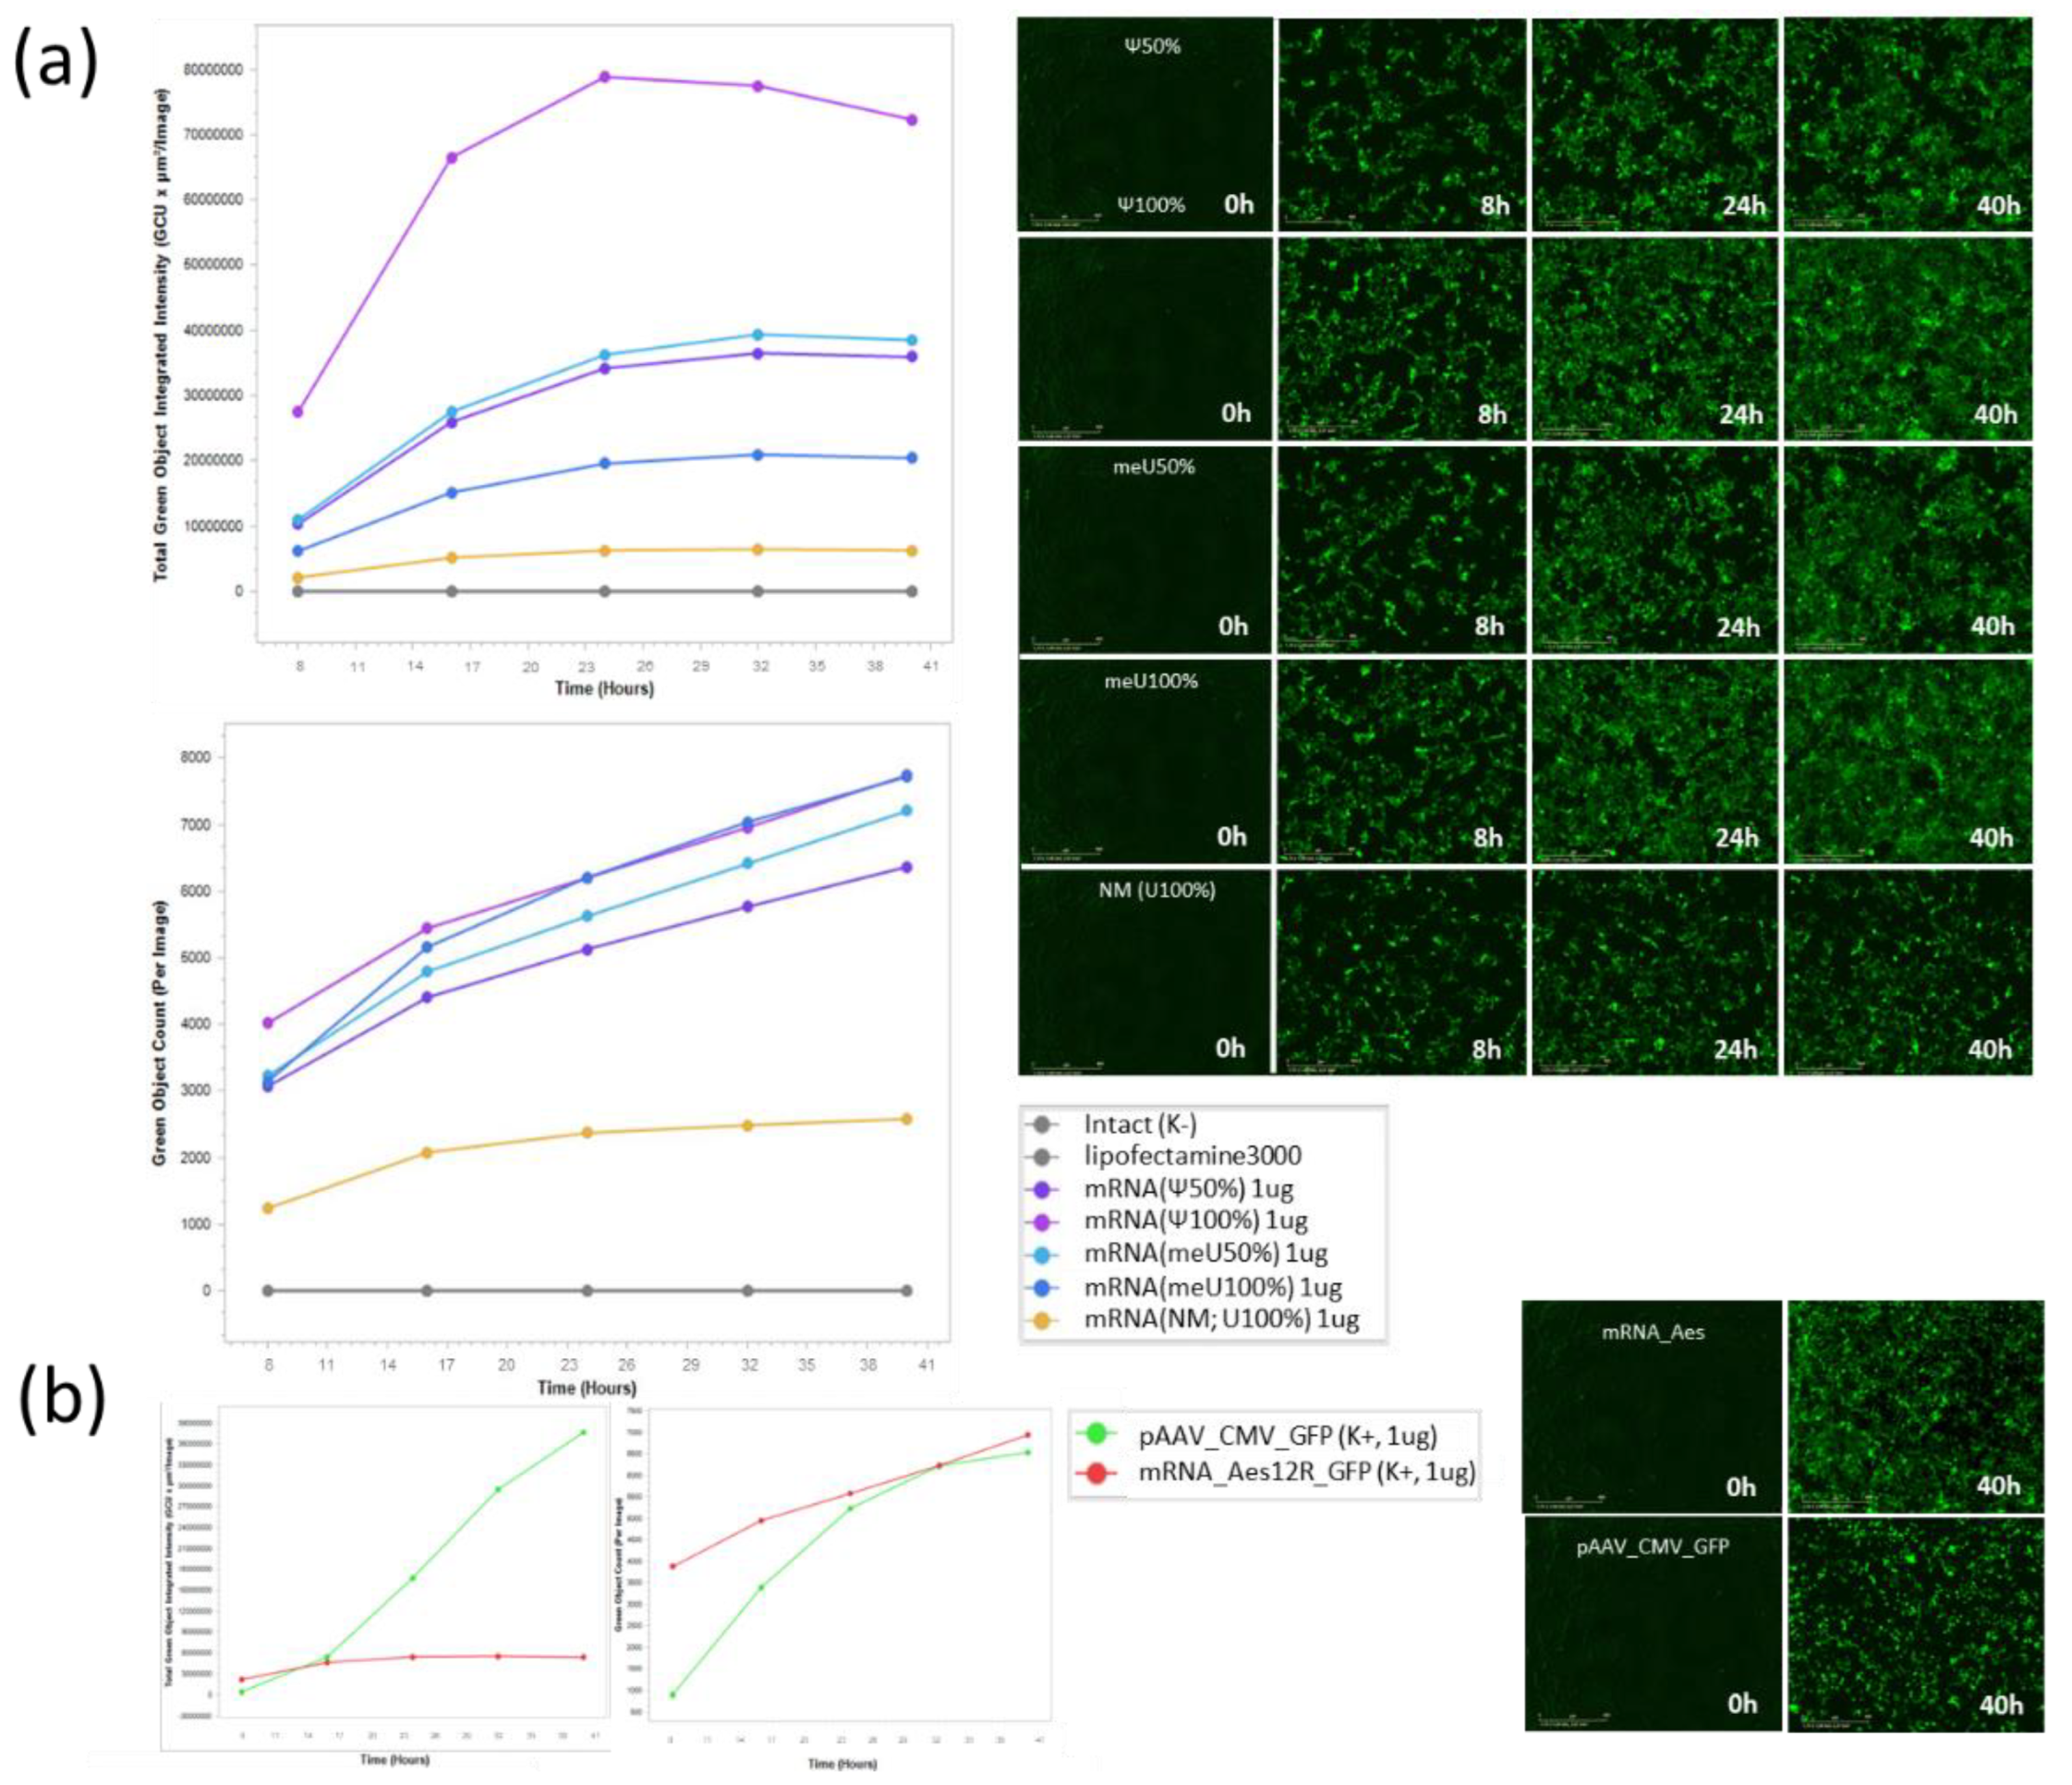
Figure 4.
mRNA-transfected HEK293 (40h): (a) Metrics of the number of GFP-positive cells and the intensity of GFP fluorescence in the target mRNA construct with uridine modifications variants (flow cytometry) **p<0.005, ****p<0.00005; ####p<0.00005 (ANOVA); (b)-(c) qPCR data (intensity, normalized to non-modified mRNA (2-ddCq) and GFP copy number, determined with pAAV_CMV_GFP titer curve, normalized to ActB). Modified mRNA variants vs. non-modified mRNA: ### p<0.0005, #### p<0.00005 (t-test); ****p<0.0001, F (4, 22) = 23,08, R2=0.8076 (one-way ANOVA). (d) GFP translation dependence on uridine modifications: one-moment gel-doc exposition of membranes; (e) Relative band intensity (box-plot diagram).
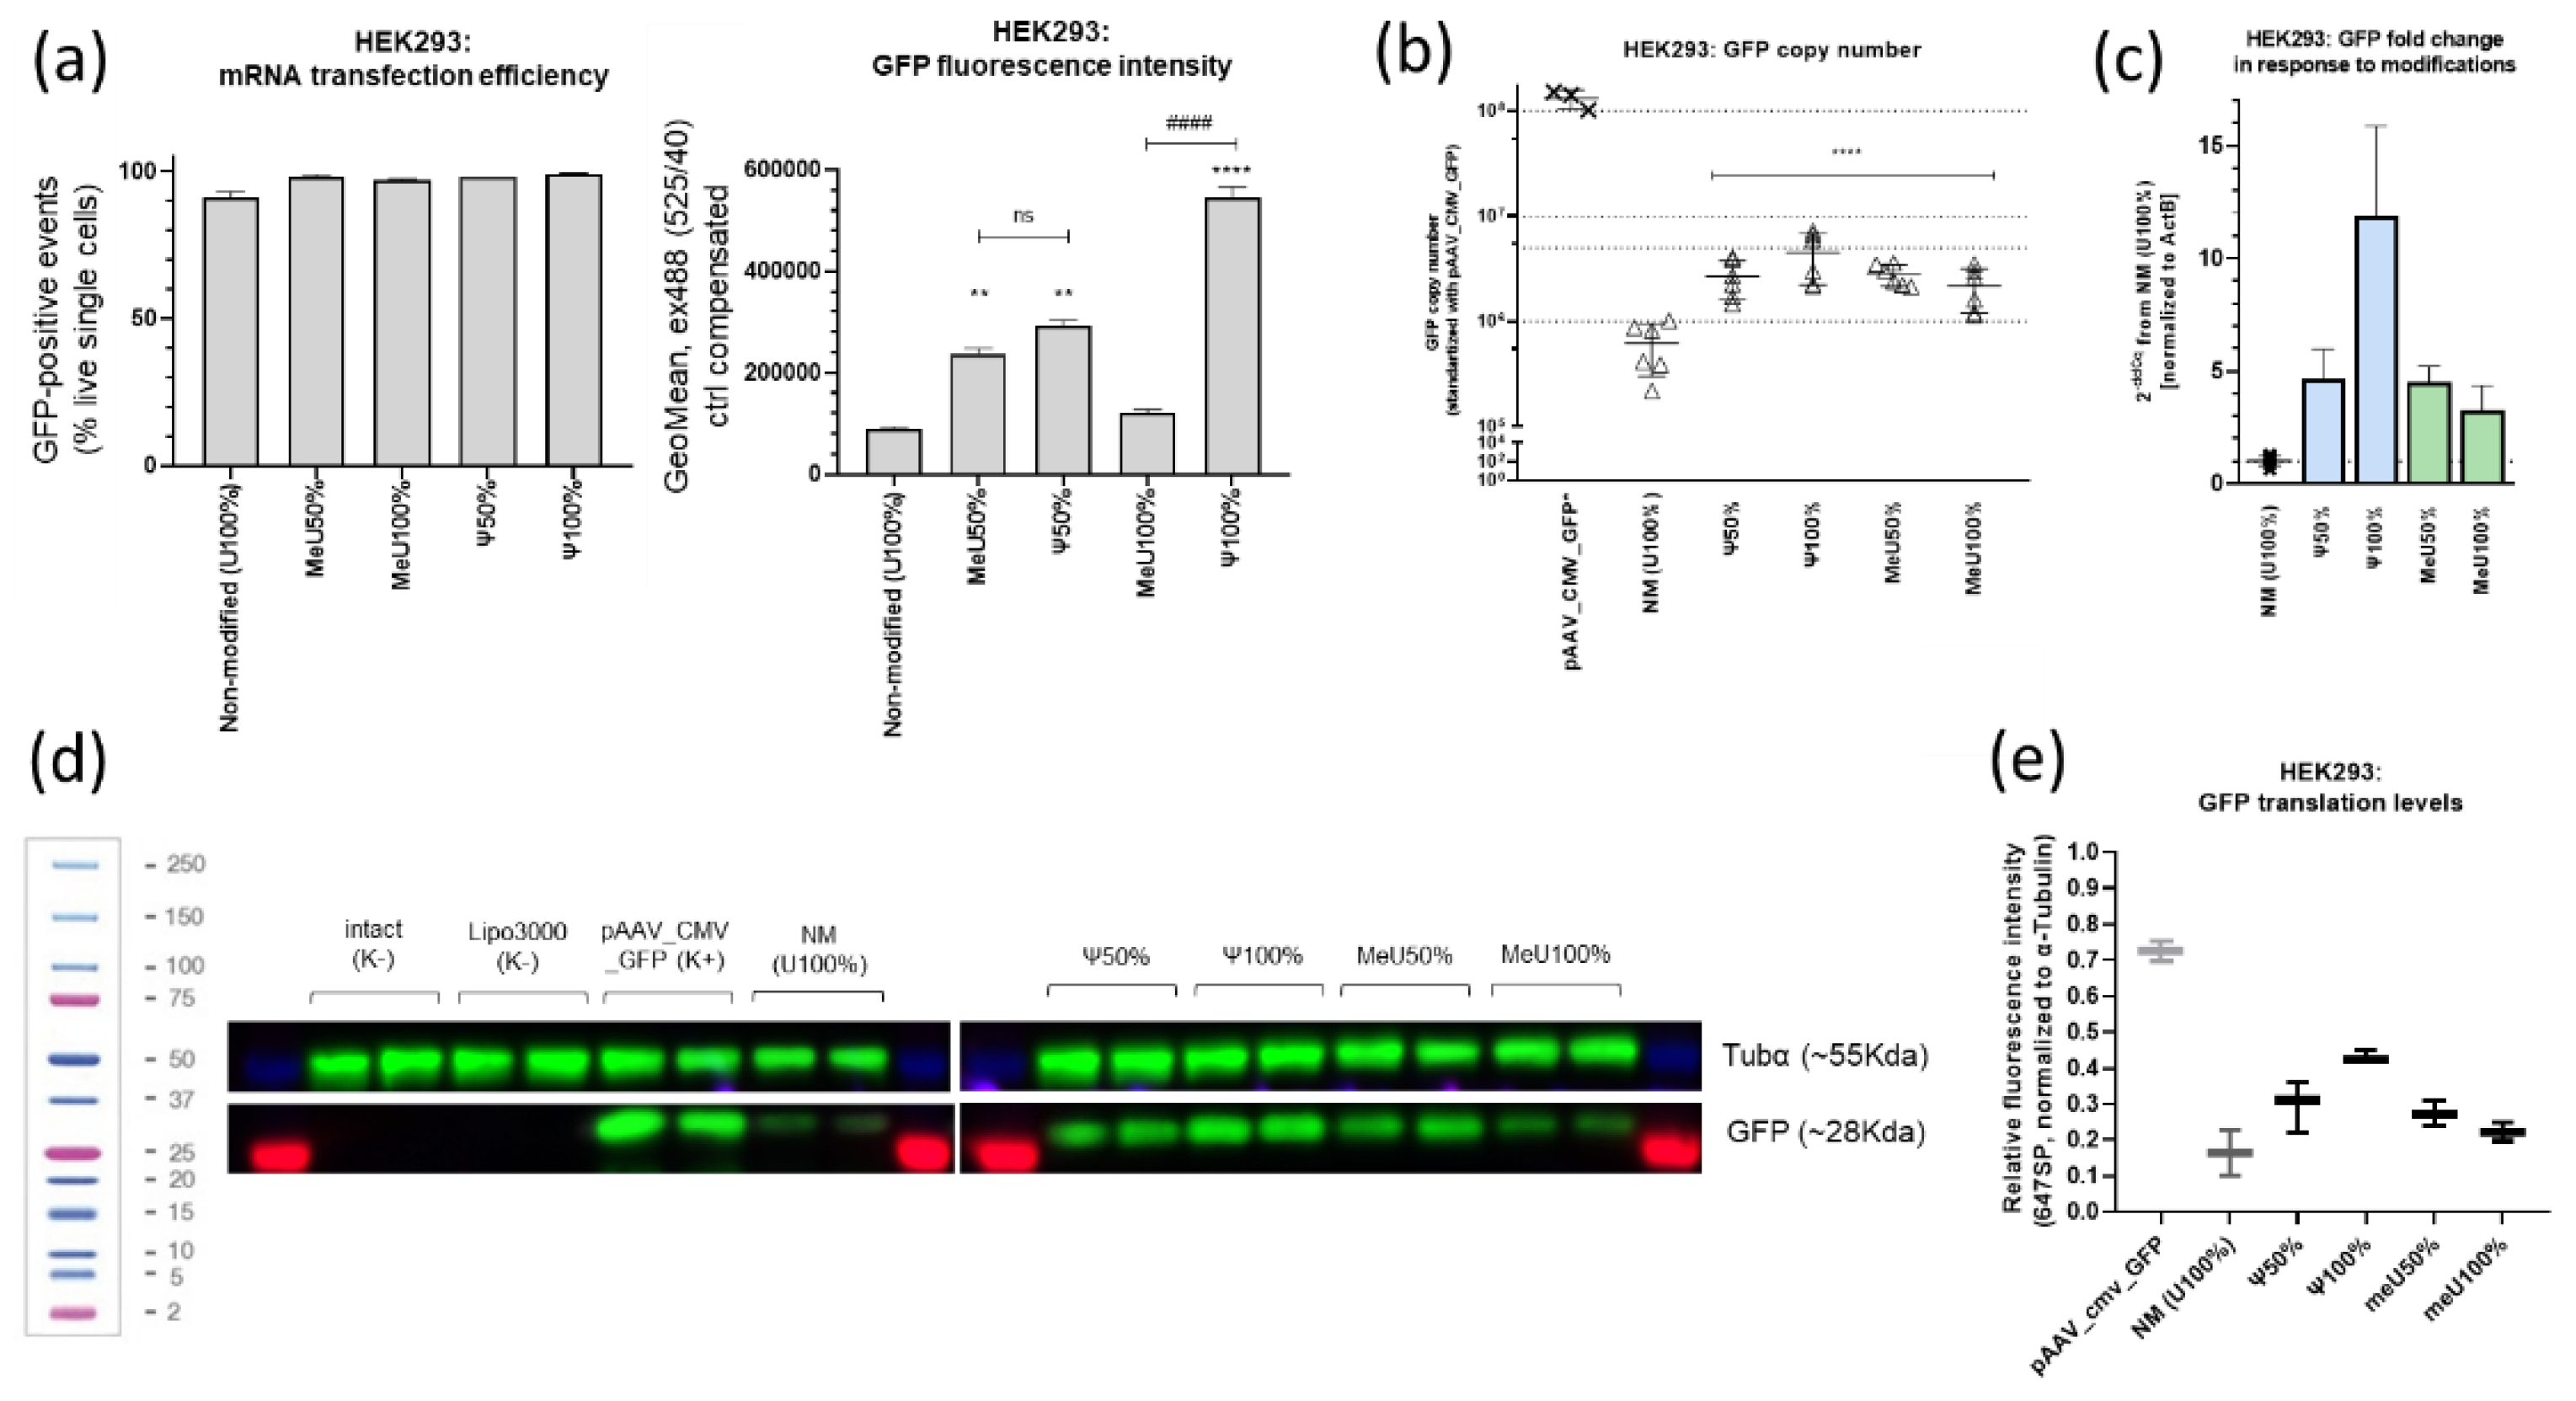
Figure 5.
mRNA-transfected THP-1 (20h): (a) Metrics of the number of GFP-positive cells and the intensity of GFP fluorescence of the target mRNA construct with uridine modifications variants (flow cytometry). Modified mRNA variants vs. non-modified mRNA: *p<0.05, ** p<0.005, ***p<0.0005 (t-test); ###p<0.0005 (ANOVA). Non-modified mRNA vs. MeU100% mRNA: ### p<0.0005 (ANOVA); (b) qPCR data. The change in GFP fold, relative to samples transfected with unmodified RNA, was determined using ActB (R2=0.989) and GFP (R2=0.996) standard curves builded with non-modidied mRNA cDNA dilutions. GFP copy number was determined with pAAV_CMV_GFP standard curve (R2=0.977) and normalized to ActB.
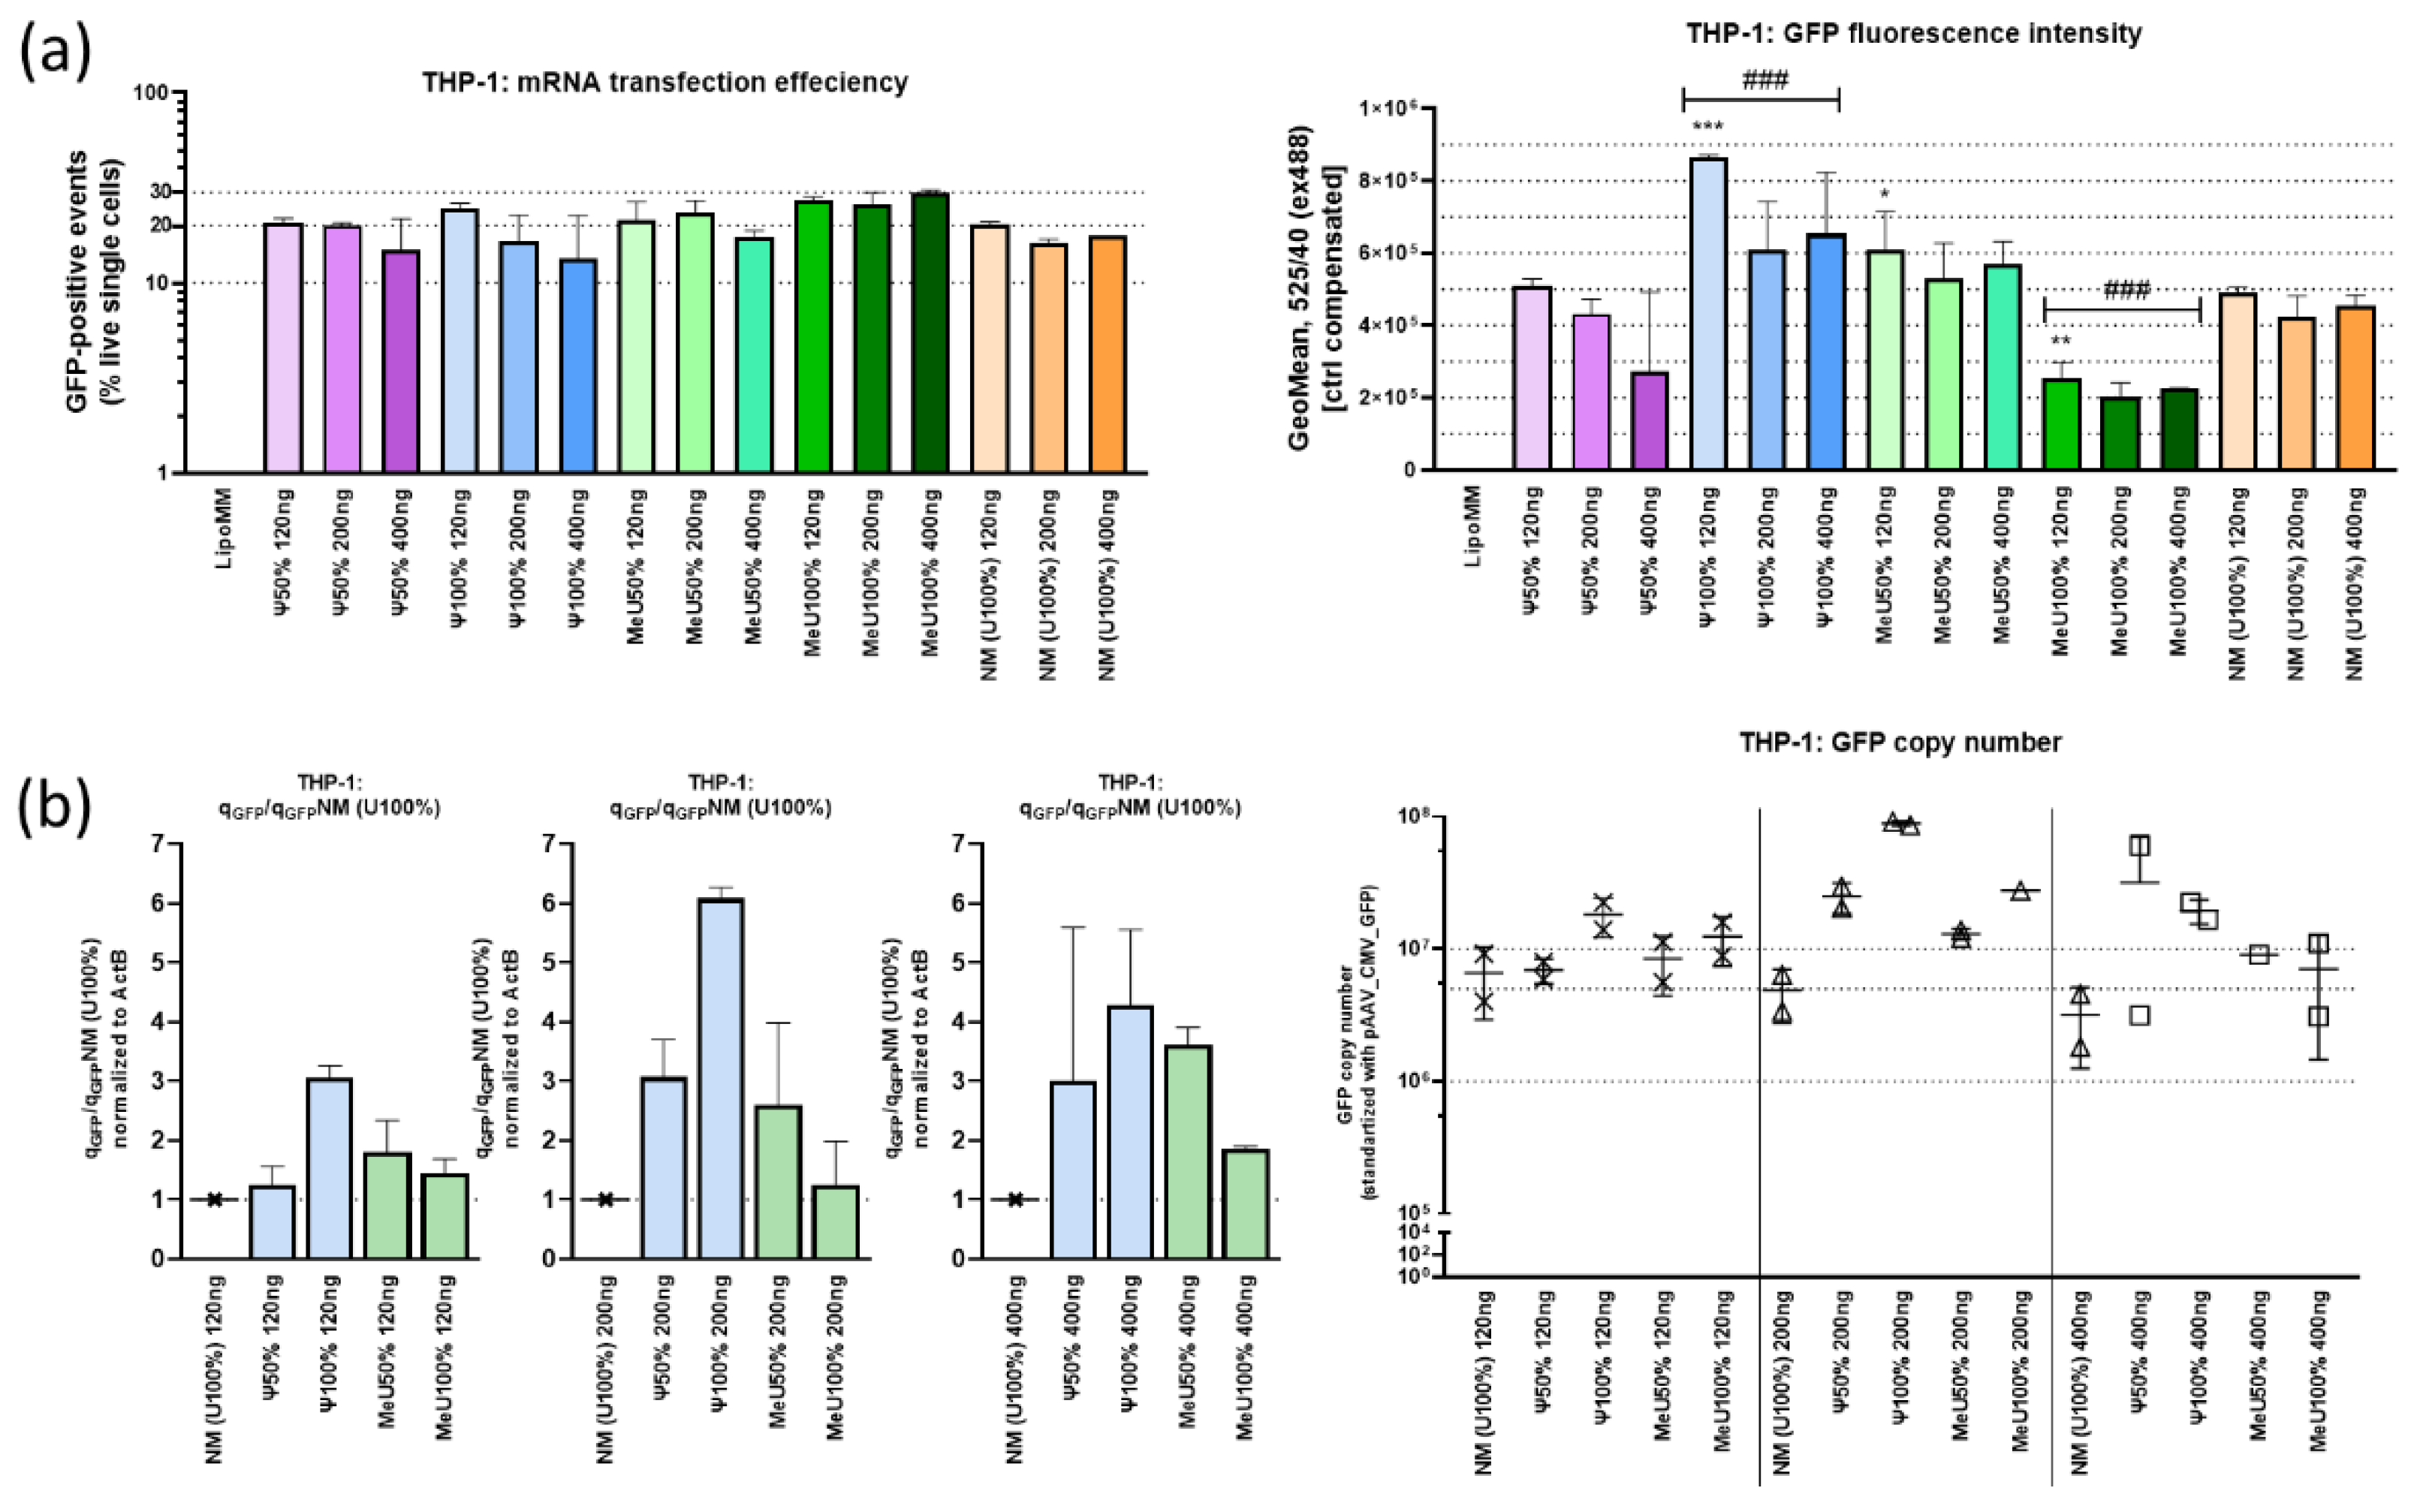
Figure 6.
mRNA-transfected THP-1 (20h): The expression fold change of genes involved in immune response reactions: interferon response is presumably induced through IRF7. TNFα levels increase upon transfection with unmodified RNA (p < 0.05 for 200 ng, 400 ng), and show a trend (not statistically significant) toward increased levels with pseudouridine modifications. This suggests all uridine modifications mitigate the proinflammatory response as TNFα plays a major role in initiating inflammation. IRF3 showed no significant changes in expression levels, which indicates overcoming an early antiviral response to mRNA invasion. IRF7 regulates the production of interferons (especially type I), which are critical for the antiviral response. IRF7 levels were elevated in all samples (p<0.05-0.0005 vs. ctrl), but changing uracyl to 5′-meU (50-100%) was less immunogenic than unmodified RNA (p<0.05 vs. NM). IFNα increases dramatically with pseudouridine modifications of mRNA, indicating high immunogenicity (p<0.05, p<0.005 vs. NM and p<0.0005 vs. K- [lgFC=1]). IFNα stimulates a wide range of defense mechanisms, including antiviral properties, apoptosis of infected cells, and modulation of the immune system.
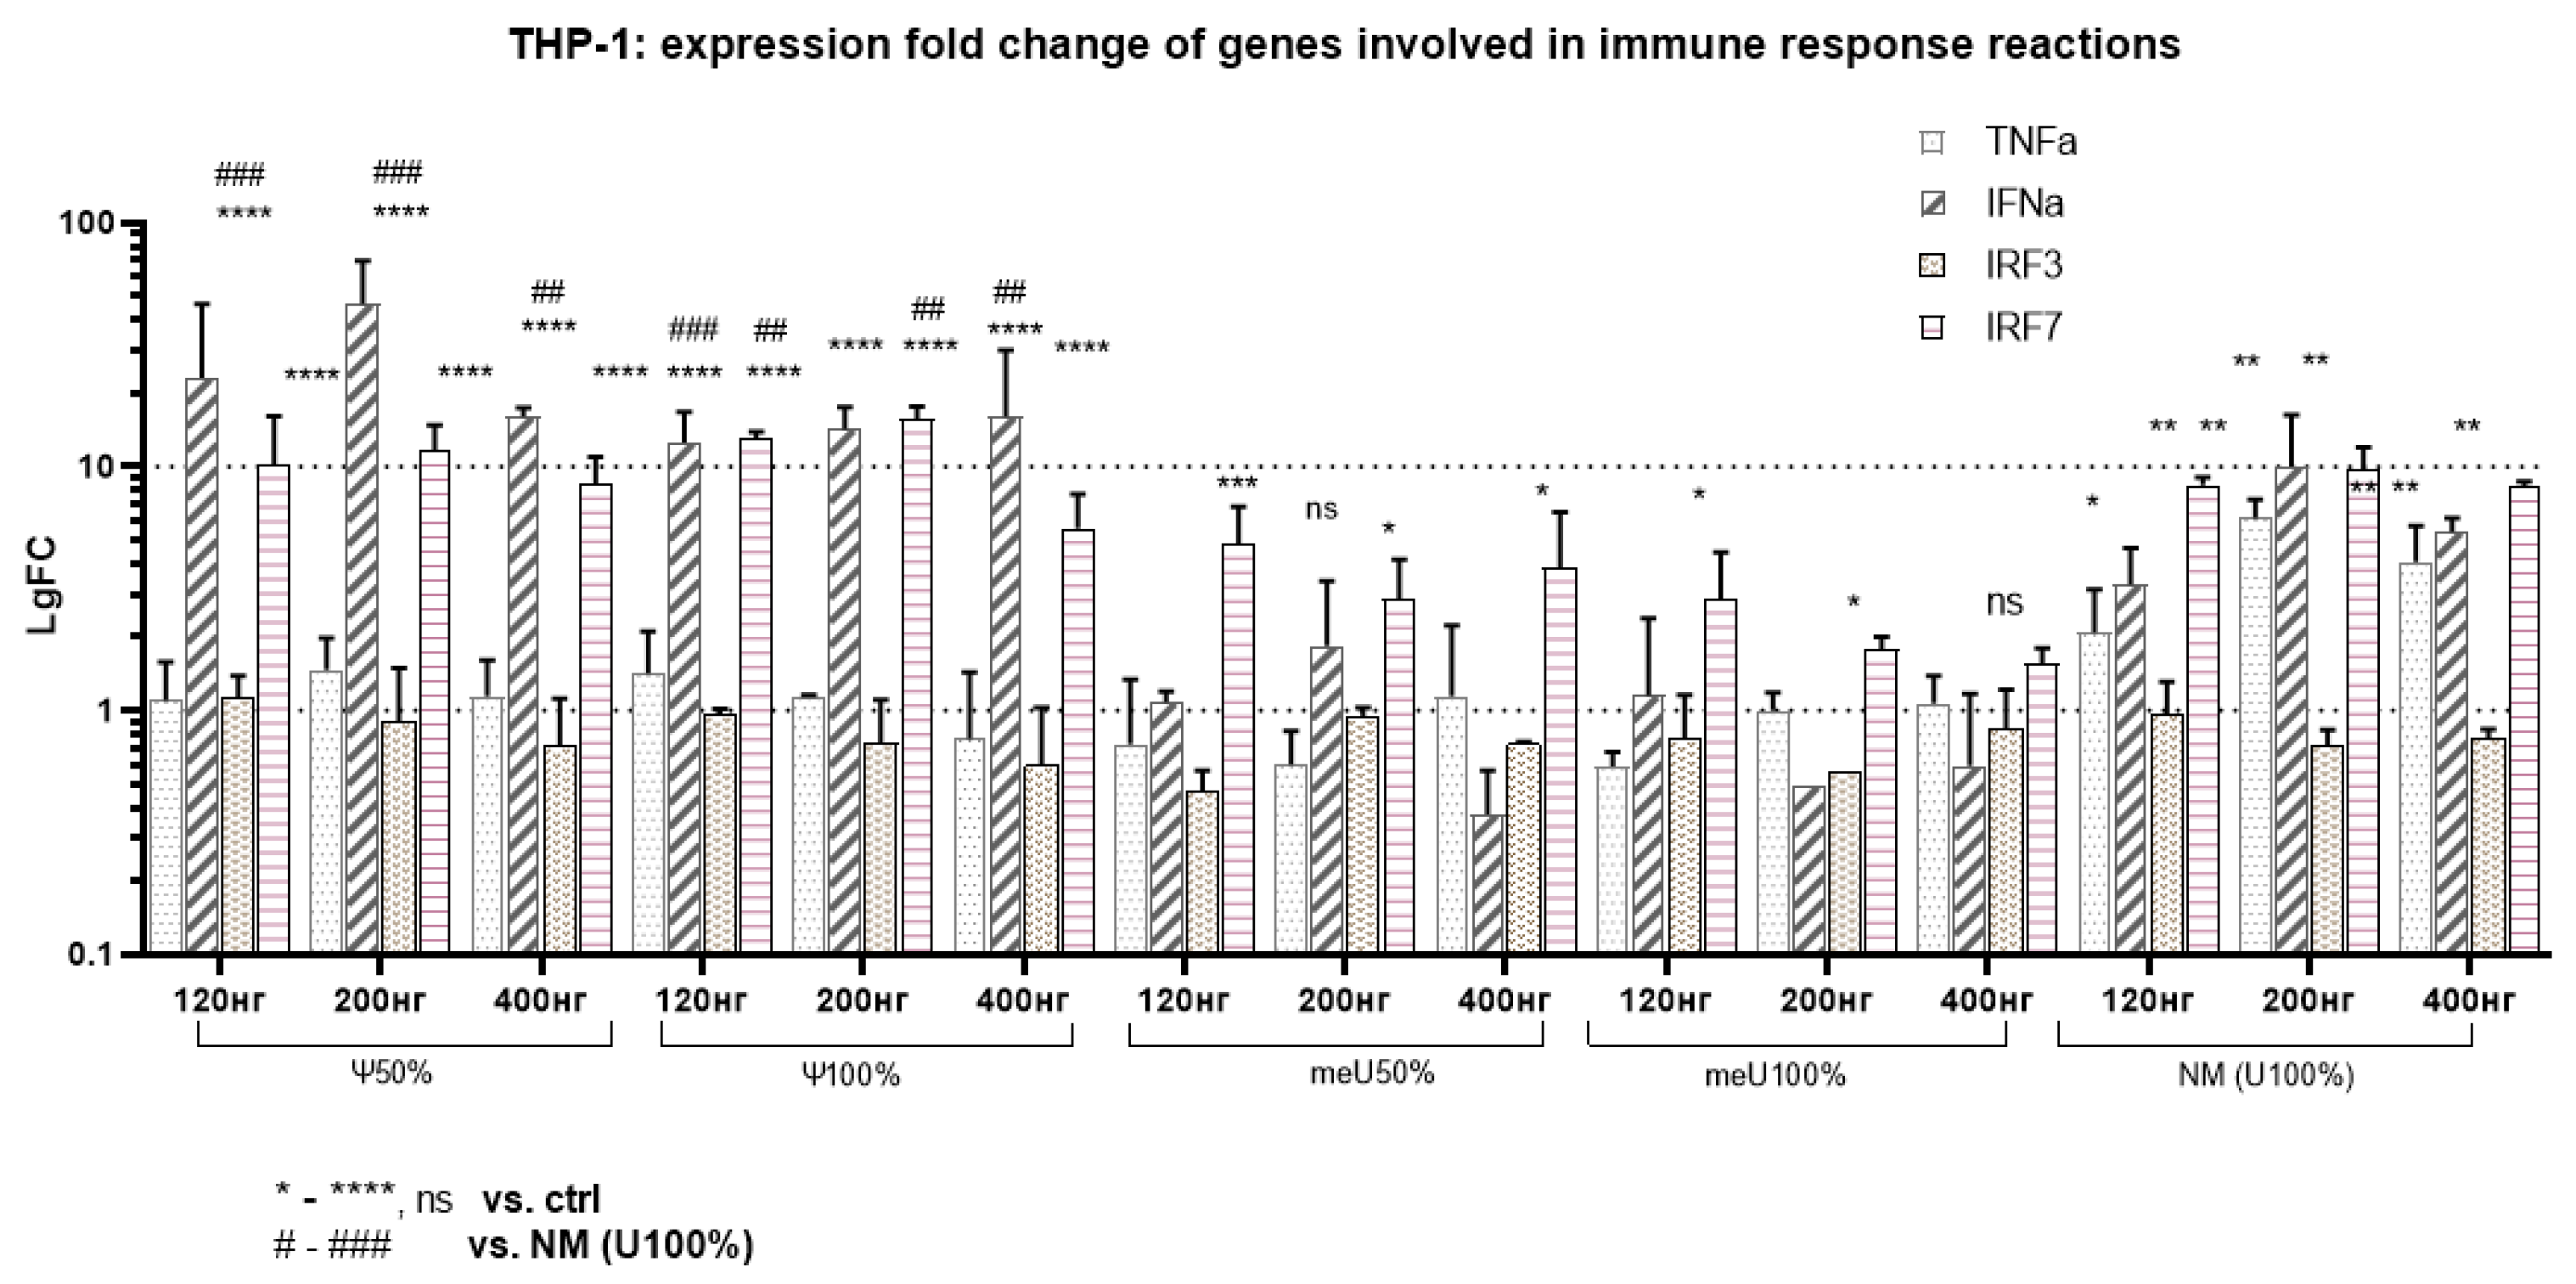
Figure 7.
Multiplex analysis of the cytokine panel after treatment of THP-1 with mRNA preparations. TNF α, IL-1 α, MIP1α, MIP1β are markers of active inflammation; ↑ Il1Ra + ↑ IL-1 – strengthening of immunological tolerance and control of excessive inflammation, + ↑ CXCL10 – development of a prolonged inflammatory response. *p<0.05, ** p<0.005, ***p<0.0005.
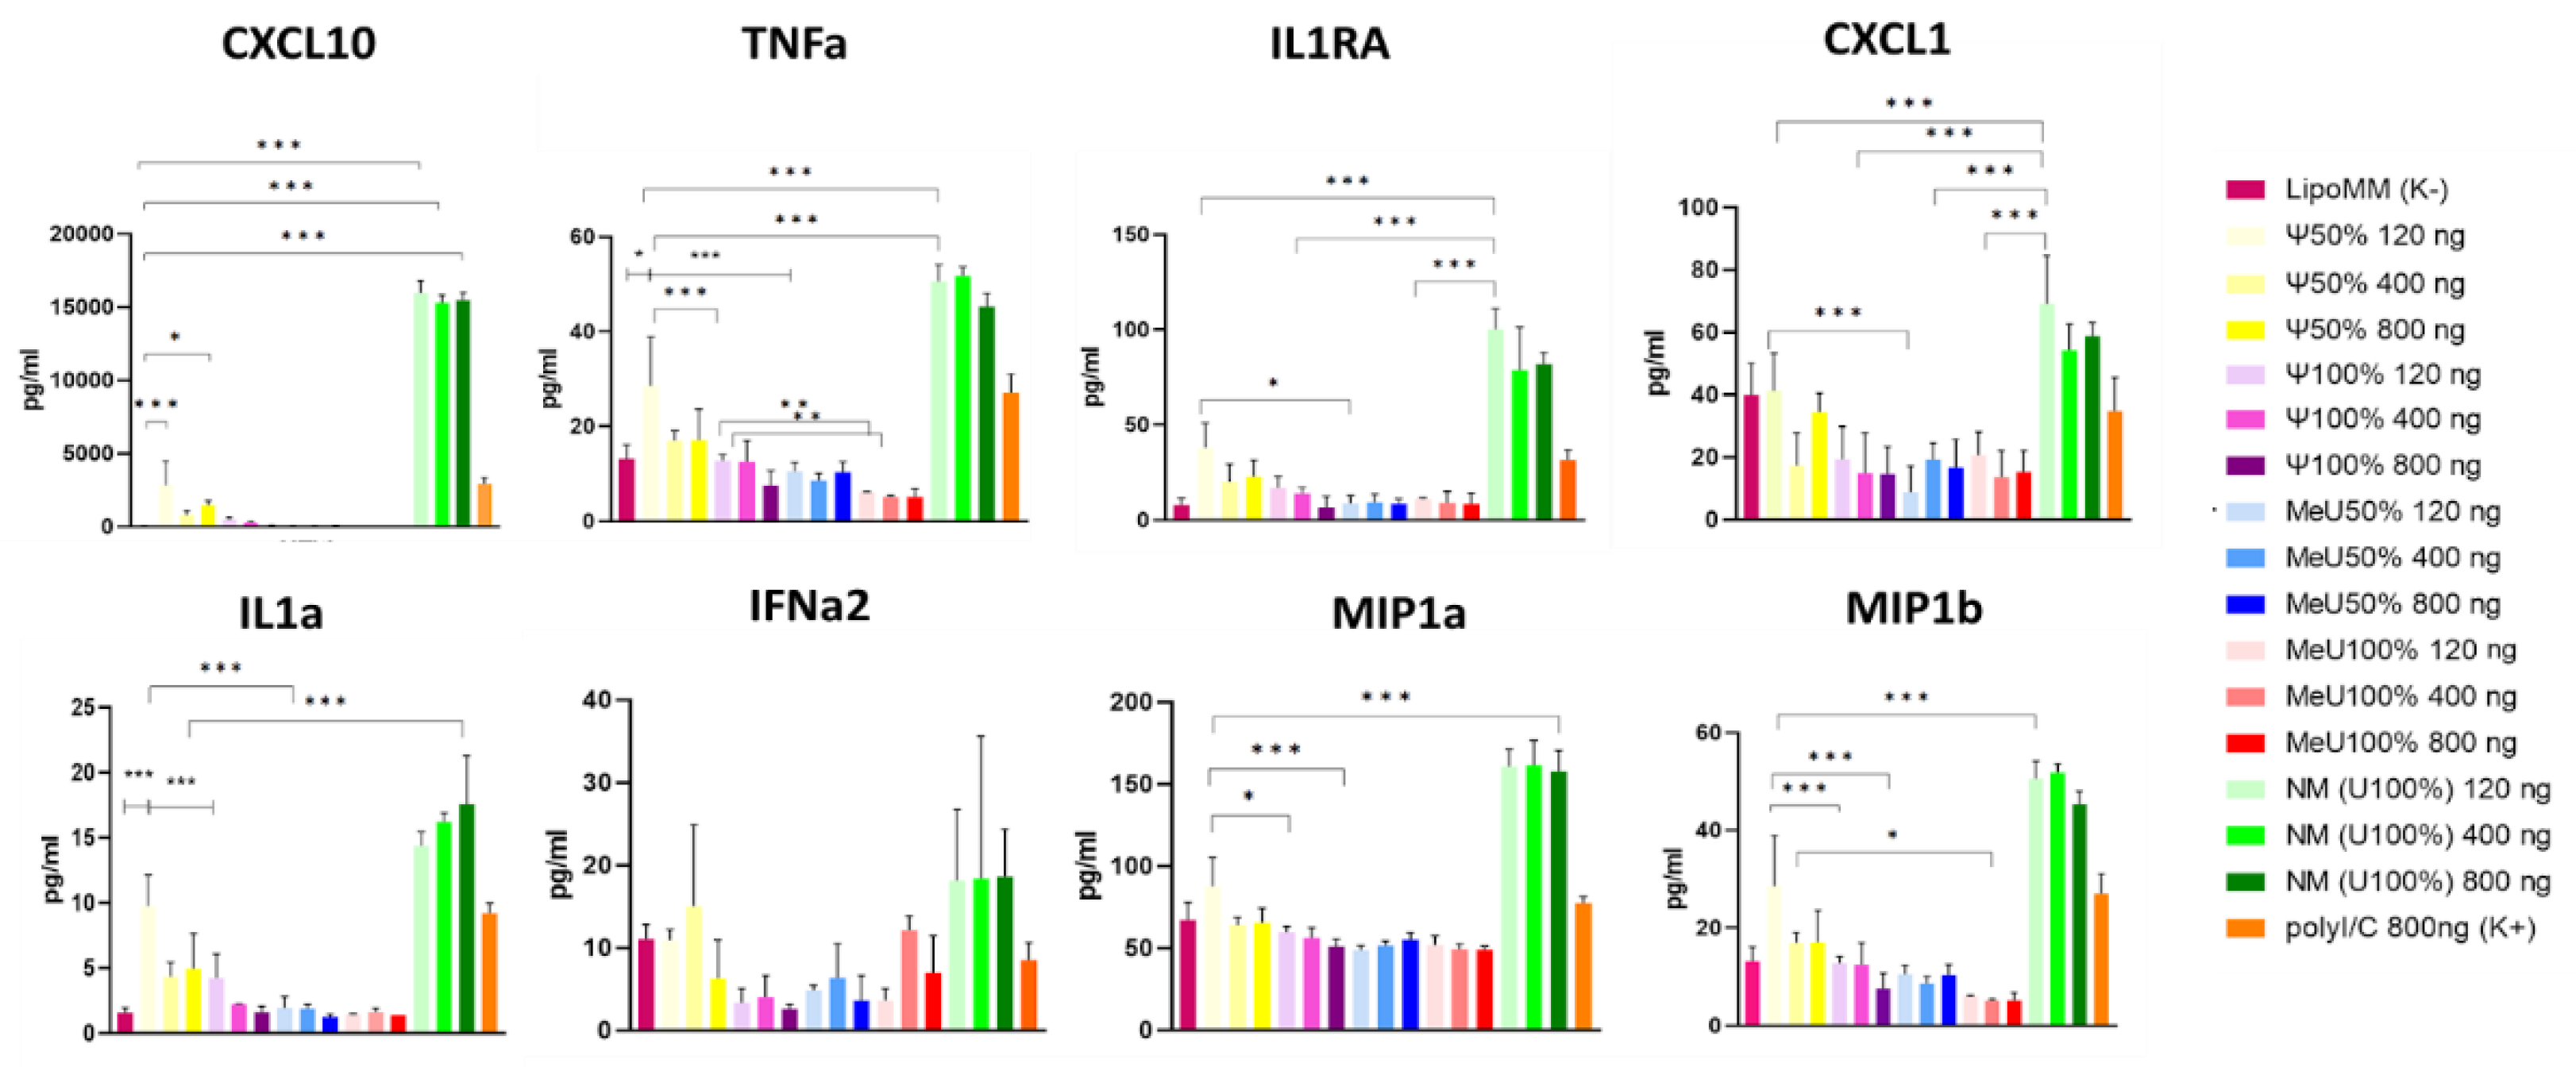

Table 1.
Primer sequences.
| Gene of interest | FW primer sequence (5′- 3′) | RV primer sequence (5′- 3′) |
|---|---|---|
| ActB | CACCATTGGCAATGAGCGGTTC | AGGTCTTTGCGGATGTCCACGT |
| IRF7 | CCACGCTATACCATCTACCTGG | GCTGCTATCCAGGGAAGACACA |
| IRF3 | TCTGCCCTCAACCGCAAAGAAG | TACTGCCTCCACCATTGGTGTC |
| IFNa | TGGGCTGTGATCTGCCTCAAAC | CAGCCTTTTGGAACTGGTTGCC |
| TNFa | CTCTTCTGCCTGCTGCACTTTG | ATGGGCTACAGGCTTGTCACTC |
| GFP | TCAAGATCCGCCACAACATC | GTGCTCAGGTAGTGGTTGTC |
Disclaimer/Publisher’s Note: The statements, opinions and data contained in all publications are solely those of the individual author(s) and contributor(s) and not of MDPI and/or the editor(s). MDPI and/or the editor(s) disclaim responsibility for any injury to people or property resulting from any ideas, methods, instructions or products referred to in the content. |
© 2025 by the authors. Licensee MDPI, Basel, Switzerland. This article is an open access article distributed under the terms and conditions of the Creative Commons Attribution (CC BY) license (http://creativecommons.org/licenses/by/4.0/).
Copyright: This open access article is published under a Creative Commons CC BY 4.0 license, which permit the free download, distribution, and reuse, provided that the author and preprint are cited in any reuse.


