
Submitted:
12 December 2025
Posted:
17 December 2025
You are already at the latest version
Abstract
This paper describes the design and implementation of a laboratory system comprising customized hardware setups for each experiment and a dedicated software environment for interactive learning in the field of electronic devices. The hardware infrastructure is based on programmable equipment, including programmable power supplies and signal generators for input stimulus generation, programmable devices and circuits for signal routing, and data acquisition units for capturing output responses. The software framework is built using the LabVIEW graphical programming environment, enabling control of input signal generation, output signal acquisition, data processing, and result visualization in a user-friendly and comprehensible manner. All control functionalities are accessible via the virtual instrument’s front panel, allowing seamless remote operation through network-based control applications. By enabling remote control of physical equipment, the system provides access to laboratory resources without requiring the user’s physical presence at the laboratory site. The approach is demonstrated through experiments in analog electronics—such as plotting the static characteristics of diodes and transistors—as well as in digital electronics.
Keywords:
electronic devices
; programmable equipment
; LabVIEW
; remote control
1. Introduction
The decision to address this topic was driven by the following considerations:
- the COVID-19 pandemic situation, during which numerous activities shifted to an online environment;
- the extension of practical training periods beyond scheduled didactic activities or the inclusion of these activities in a hybrid format;
- the remote utilization of equipment located in external laboratories for scientific research endeavors;
- the development of an intelligent application featuring an intuitive and interactive interface, designed to facilitate the control of experiments both locally within the laboratory and remotely for study and research purposes.
The need to develop hardware structures and software applications that allow remote control of practical experiments in the field of electronics is imposed by two main directions, namely: the creation of practical training laboratories in electronics necessary for the training of specialists in this field and respectively the need to share experimental studies, through remote control, in scientific research of electronic devices [1].
Considering the first identified direction, it is well known that modern engineering education requires continuous adaptation to technological changes and to the increasingly diverse needs of students. In the field of electronics, practical training plays a crucial role in developing technical and applied skills. For this reason, the development of physical laboratories that enable remote control of real equipment constitutes an innovative and necessary solution, especially in the context of education digitalization and the expansion of hybrid or distance learning [2,3].
Considering the second identified direction, it is also well known that scientific research in the field of electronic devices involves conducting complex experiments based on precision measurements, parametric evaluations, and testing under diverse operating conditions. In recent years, a growing trend has been the sharing of experimental infrastructure among multiple users through the remote control of real equipment. This approach not only optimizes resource utilization but also contributes to expanding access to research infrastructure, increasing the efficiency of scientific collaboration, and accelerating the process of technological innovation.
The hardware–software architecture proposed in this work integrates a solution within the field of intelligent systems, aiming to combine the two approaches previously identified and described. The fundamental argument for including the proposed solution in the domain of intelligent systems—specifically regarding the remote control of experimental studies—lies in the processing of acquired data through numerical interpolation techniques and graphical generation for identifying the operational behavior of electronic devices. The proposed solution is conceived as an intelligent tool made available to the user for software-assisted analysis of electronic components.
The article is structured into three main sections. The first section provides an overview of existing achievements in the field of remote-controlled instruction and research supported by intelligent systems, presented in Chapter 2: Literature Review. Subsequently, the theoretical foundations underlying the study of diodes and bipolar junction transistors are introduced in Chapter 3: Experimental Setup Structures. This second chapter defines the variables considered in the analysis of diodes and transistors and describes the electronic circuits developed for the study.
The second section details the software application, presenting both the user interface (front panel) and the underlying program logic (block diagram), included in Chapter 4: Software Framework. Additionally, this section comprises the Results chapter, where the obtained results are presented and discussed.
The third section offers an analysis of existing remote desktop applications and identifies the solution deemed most suitable for the present use case, presented in Chapter Remote Desktop Applications Study.
The final part of the article is dedicated to Discussions and Conclusions.
Regarding the graphical content, all figures are either original creations of the author or based on screenshots captured during software execution.
In summary, the primary objective of the research underlying this article is the experimental plotting of the static characteristics of the semiconductor devices under study, enabling users to determine the potential application domains of these electronic components. The second objective consists in developing the experimental procedure for studying the static operating regime of semiconductor devices by enabling intelligent remote control of all required operations, commands, and adjustments. By accomplishing these two main objectives, we aimed to ensure that the entire experimental procedure would not be affected by measurement or data-processing errors resulting from the performance of the internet connection between the host computer in the laboratory and the client computer used by the operator.
2. Literature Review
Remote control of physical equipment allows students to access laboratory resources without requiring their physical presence on-site. Through web interfaces, microcontrollers, and switching systems, students can connect real circuits, adjust parameters, and monitor the behavior of electronic systems in real time. This access model reduces logistical barriers and provides flexible learning opportunities beyond the conventional timetable ensuring extended access and flexible learning [4,5].
Unlike software simulations, remotely controlled physical laboratories maintain the advantage of interacting with real-world phenomena, such as component behavior under varying conditions, the influence of noise, or undesired effects caused by incorrect connections. This ensures an authentic learning experience that more accurately reflects the technical situations encountered in industry due to training on real equipment activities [6].
Recent experiences in education, such as the global health crisis generated by the COVID-19 pandemic, have highlighted the need for alternative methods to continue practical training. Remotely controlled laboratories offer a resilient solution, enabling experimental activities even under conditions that restrict physical access ensuring adaptability to special contexts [7,8].
The use of remote-control systems involves integrating technologies such as IoT networks, embedded platforms (e.g., Raspberry Pi, Arduino), serial communications, and industrial control protocols. Thus, students develop not only fundamental technical skills in electronics but also the digital and interdisciplinary competencies required in the context of Industry 4.0 [9,10,11]. A remotely accessible physical laboratory can be shared by multiple users, with access organized through automated scheduling systems. This approach optimizes the use of resources and allows for rapid expansion of access to a large number of students, even from different locations or partner institutions, thus ensuring the efficiency and scalability of the practical training process [12].
So the remotely controlled physical laboratories offer a powerful and viable alternative to traditional methods of practical electronics training. They address the need for flexibility, accessibility, and efficiency without compromising the hands-on nature of learning on real equipment. Integrating such solutions into technical education represents an important step toward modernizing educational infrastructure and enhancing the quality of engineering training [13].
Physical laboratories for electronic device testing are typically costly, requiring spe-cialized equipment such as high-speed oscilloscopes, spectrum analyzers, precision sig-nal generators, climate chambers, or automated testing stations. Given the limitations of infrastructure investment, controlled sharing of these resources has become a strategic solution for research environments, particularly within university networks and interna-tional consortia [14].
By integrating remote-control platforms, researchers can access equipment in shared mode, upload custom configurations, monitor real-time measurements, and collect relevant data for ongoing projects. Access is secured through authentication and scheduling mechanisms, enabling efficient organization and simultaneous or sequential resource utilization [15,16].
Sharing experimental studies among multiple users significantly reduces equipment downtime. Devices can be accessed 24/7 according to user schedules, eliminating idle periods and maximizing the return on investment in research infrastructure [17]. Remote-access laboratories facilitate real-time interdisciplinary and even international collaboration between teams located in different geographical areas. In European projects or international consortia, this approach supports the synchronization of experimental activities, data exchange, and the replication of tests under controlled conditions, regardless of the researchers’ locations.
Remote control, combined with automated parameter logging and experimental data archiving, ensures a high degree of test reproducibility. Testing scenarios, hardware configurations, command sequences, and environmental conditions can be stored—essential aspects for the scientific validation of results through reproducibility and traceability [18].
Shared access to experimental resources allows researchers from universities or centers with limited facilities to participate in cutting-edge projects without the need for physical relocation or on-site equipment. This democratizes research and fosters the development of human resources in applied sciences [19].
Remote operation and control of traditional laboratory equipment allow both students and researchers to conduct experiments from a distance, using internet-connected computers to interact with physical equipment. This approach, often facilitated by LabVIEW or similar software, enables real-time control and monitoring of experiments, offering flexibility in terms of location and time. [20].
Despite its multiple advantages, remote-control sharing also poses certain challenges, including:
– the need for secure and stable IT infrastructure;
– management of usage conflicts (e.g., overlapping access requests);
– equipment maintenance under high-intensity operation.
Nevertheless, the rapid advancement of communication technologies, the development of cloud solutions, and the integration of industrial control protocols into secure networks (VPN, tunneling) support the expansion of this paradigm into an increasing number of research centers [21,22].
The sharing of experimental studies via remote control in electronic device research represents a sustainable, efficient, and collaboration-oriented model. This approach promotes optimal infrastructure utilization, broad access to high-performance resources, and the stimulation of scientific cooperation. In a globalized research landscape, this type of laboratory is becoming essential for accelerating innovation and increasing the impact of research in advanced electronics [23].
Based on this literature review succinctly presented here and providing the information gathered by AI-type applications, a comparison, organized by several themes, between traditional laboratories and those with remote control is presented in Table 1.
Regarding the application presented in this article, I did not find more similar in the literature review to be able to present a comparison between other achievements and the one presented here. Similar to the solution described in this article are those presented in [24,25], but these are based on web technology and do not offer an intuitive and interactive user interface, like this application, for performing the experiment regarding the study of semiconductor devices.
3. Experimental Setup Structures
For the study of electronic device operation, plotting the static characteristic plays a very important role. Based on this characteristic, the behavior of the device can be analyzed, and its operating conditions can be determined for application implementation.
For many devices, the static characteristic, also referred to as the current–voltage characteristic, is represented by the dependence I=f(V) within certain variation ranges or at the device’s operating points. In this work, from the field of analog electronics, we exemplify the analysis of the static regime for semiconductor diodes (rectifier and Zener) as well as for the bipolar junction transistor.
To achieve this solution for the study of semiconductor devices based on the static characteristic, the following objectives were pursued:
-
Design and implementation of auxiliary electronic circuits with:
- 1.1
- Implementation of a software-controlled solution for diode biasing;
- 1.2
- Implementation of a voltage-to-current converter for software-controlled current generation in the base.
-
Design of the user interface through:
- 2.1
- Establishing all elements required for control signal generation;
- 2.2
- Establishing the method for data processing and representation.
-
Design and construction of the software application through:
- 3.1
- Identification and inclusion of necessary drivers within the block diagram
- 3.1
- Ensuring methodological flexibility in the application of interpolation techniques to measurement data points in order to produce accurate graphical representations.
3.1. Brief Theoretical Considerations on Semiconductor Diodes
It is well known that for the study of the rectifier diode, the I–V characteristic in the first quadrant is of interest, obtained for forward biasing, along with the verification of its operation under reverse bias, when the diode is practically blocked. For the Zener diode, the I–V characteristic in the third quadrant is of interest, obtained for reverse biasing, where the voltage stabilization effect is manifested, while under forward bias its behavior is similar to that of a rectifier diode. From these results the necessity of offering users the possibility to modify both the value and the polarity of the bias voltage [26].
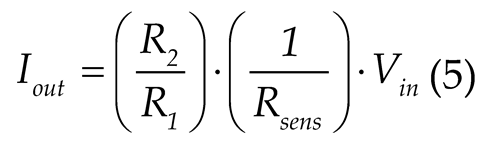
To determine the static characteristic of the rectifier diode, the circuit shown in Figure 1.a is considered, in which the diode D may be forward or reverse biased depending on the polarity of the supply voltage. Forward bias corresponds to connecting the anode of the diode to the positive pole (+) of the supply voltage Vsup, while reverse bias corresponds to connecting the anode of the diode to the negative pole (–) of this voltage. By varying the supply voltage Vsup and measuring the pairs of values (ID,VD) in both biasing conditions, the experimental static characteristic is obtained, representing the dependence ID=f(VD), as illustrated in Figure 1.b.
On the characteristic curve, the following regions can be identified:
- Forward region (forward bias): When the anode is at a higher potential than the cathode, the diode conducts current after exceeding the threshold voltage (≈0.7 V for Si, ≈0.3 V for Ge). The current increases exponentially with the applied voltage.
The representative part of the static characteristic is in the forward polarization region, where it can also be represented analytically by the static characteristic equation. The equation of the static characteristic, representing the theoretical characteristic, derived by considering the density and mobility of the charge carriers, is:
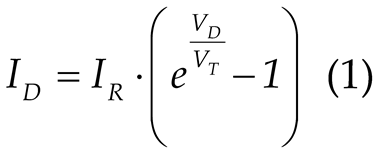
where, in addition to the two quantities UD and ID defined above, the following terms are involved:
- IR – the reverse current through the diode, which is the current that appears in the case of reverse biasing of the diode and has a very small value;
- VT – referred to as the thermal potential, which is a voltage-like quantity determined by the temperature T [oK] of the diode body, by the value of Boltzmann’s constant k (=1.38·10−23 J/K), and by the elementary electron charge q (=1.6·10−19 C), according to the relation:
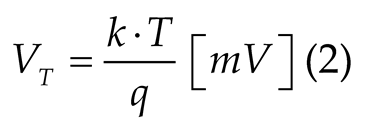
Thus, for T = 300 °K, the thermal potential is VT ≅ 26 mV:
- 2.
- Reverse region (reverse bias): If the anode is at a lower potential than the cathode, the diode does not conduct, and the current remains very small (reverse saturation current, in the order of μA or nA).
- 3.
- Breakdown region (over breakdown voltage VBR): At a high reverse voltage, the diode enters the breakdown regime, where the reverse current increases sharply and may destroy the device if not properly limited.
The Zener diode is a pn semiconductor specifically designed to operate in reverse bias mode. Unlike conventional diodes, which do not allow current to flow in this region, the Zener diode is constructed to function in the avalanche or Zener breakdown region, at a specific voltage value called the Zener voltage (Vz).
The fundamental characteristic of the Zener diode is its ability to maintain an almost constant voltage across its terminals, even when the current through the diode varies (within the specified design limits).
On the I–V characteristic, also represented by the dependence IZ=f(VZ) in Figure 1.c, two main regions can be identified, corresponding to the two operating modes:
Forward bias, where the Zener diode behaves like a normal pn diode, with conduction starting after exceeding the threshold voltage (≈ 0.7 V for silicon).
Reverse bias, where for voltages lower than the Zener voltage VZ, (VD<VZ), only a small reverse saturation current flows through the diode (on the order of microamperes). When the Zener voltage VZ is reached, the diode enters a controlled reverse conduction regime. In this region, an increase in current causes only an extremely small variation in voltage, allowing the diode to maintain an almost constant voltage across its terminals, regardless of the current flowing through it [27,28].
3.2. Architecture of the Proposed System for Diode Experimental Study
Based on the aspects presented above, in the implementation of the experimental setup, the following working conditions must be ensured:
- The possibility, via software, to select either forward biasing or reverse biasing of the diode under test;
- The possibility of software control of the supply voltage Vsup (Figure 1);
- Measurement, using data acquisition, of the current values — forward current ID, reverse current Ir, as well as the diode voltage VD.
To draw the static characteristics based on those presented above, the block diagram of the entire experimental system, shown in Figure 2, includes the following components:
- The programmable power supply GPD-4303S, which provides programming capabilities both from the front panel and via software through the USB port and available drivers.;
- The 2-channel relay module enables users to create a connection diagram that controls the polarity of the power supply outputs;
- The NI myDAQ module, used both for controlling the relay module (and thus the polarity of the voltage applied to the diode under test) and for measuring the current through the diode, taking advantage of its built-in measurement instrument features.
Through the standard USB interface, the power supply can be connected to a PC, and with the included drivers, all three output channels can be controlled via software applications. The output magnitudes can be adjusted with a resolution of 1 mV and 1 mA, either through the digital controls on the front panel or by means of remote control software applications.
The 2-channel relay module which allows the user to build the connection diagram to control the polarity of the power supply outputs. The NC contact from one relay and respectively the NO contact from the other relay are used to apply the output voltage (+V and -V) of the power supply, as shown in Figure 3. By generating the logical combinations 01 or 10 at the control inputs IN1 IN2 of the module, between the COM contacts of the two relays, the two polarities of the output voltage +Vout1 and -Vout2 or -Vout1 and +Vout2 are obtained.
The NI myDAQ module, a product of National Instruments, is employed for controlling the polarity of the supply voltage as well as for acquiring and processing the values of the electrical signals required for plotting the static characteristic of the tested device. This module was chosen due to its capability of direct current measurement in the circuit using the built-in DMM function, while one of the differential analog inputs is employed for measuring the voltage drop across the diode [29].
3.3. Brief Theoretical Considerations on Bipolar Junction Transistors
The bipolar junction transistor (BJT) is one of the most widely used semiconductor devices in electronics, being essential in amplification and switching circuits. Static characteristics define the behavior of the device under direct current (DC) conditions, allowing proper design and analysis of electronic circuits.
The static characteristics of the bipolar transistor are:
- Input characteristics are determined by applying a voltage between the base and emitter (UBE) and measuring the base current (IB) for different values of the collector-emitter voltage (UCE). These characteristics are similar to those of a semiconductor diode, since the base-emitter junction is forward biased.
Output characteristics are determined by measuring the collector current (IC) as a function of the collector-emitter voltage (UCE) for different values of the base current (IB). They are defined by the relation:
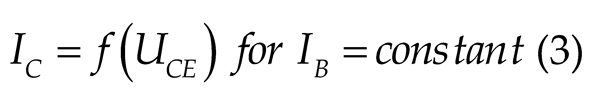
where β (or hFE) is the current gain of the transistor.
Transfer characteristics represent the dependence between the collector current (IC) and the base current (IB) under constant collector-emitter voltage (UCE). They are defined by the relation:
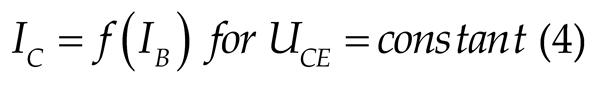
These characteristics highlight the linearity of the transistor in the active region and the value of the current gain β.
Among these, the output and transfer characteristics of the BJT represent ones of the most important methods of static description of its behavior. They reflect the variation of the collector current (IC) as a function of the collector-emitter voltage (UCE) for different values of the base current (IB), highlighting the operating regions of the transistor. These curves are fundamental for the design of amplification and switching circuits [30,31,32].
To determine the output characteristics, the following procedure is applied:
- A constant base current (IB) is applied at the input.
- The collector-emitter voltage (UCE) is varied and the collector current (IC) is measured.
- The experiment is repeated for several values of base current (IB1, IB2, IB3…).
The result is a set of characteristic curves describing the operating regimes of the transistor. So, the operating regions identified on the output characteristics are:
- Cut-off Region. This region occurs when the base current IB = 0 or has a very low value. As a result, the collector current is approximately IC = ICB0, representing a residual leakage current. In this state, the transistor is effectively “closed” to current flow, behaving like an open switch. The primary application of the transistor in this region is within digital circuits, where it generates a logical level “0”.
- Active Region (Forward-Active Mode). This region is defined by a forward-biased base-emitter (B–E) junction and a reverse-biased collector-base (C–B) junction. The transistor operates according to the relation (3). The output characteristics in this region are nearly parallel and approximately linear for moderate values of collector-emitter voltage UCE. In this mode, the transistor functions as a signal amplifier.
- Saturation Region. This region is reached when the collector-emitter voltage UCE becomes very low (typically around 0.2–0.3 V for silicon transistors), such that further increases in base current no longer result in proportional increases in collector current IC. In this region, the transistor behaves like a closed switch due to the minimal collector voltage. It is used to generate a logical level “1” in digital circuits and is also employed in power switching applications.
- Avalanche Region (Undesired Mode) This region may occur at high collector-emitter voltages UCE > U(BR)CE0, where breakdown phenomena take place. The collector current increases abruptly and becomes independent of the base current IB. This operating mode is avoided during normal use, as it can lead to permanent damage of the transistor.
The output characteristics of the bipolar junction transistor provide essential information for understanding and designing electronic circuits. Based on this, the BJT can be exploited as both an amplifier and a switch, while ensuring safe and efficient operation.
3.4. Hardware Structure of the Bipolar Transistor Experimental System
Based on the aspects presented above, in the implementation of the experimental setup, the following working conditions must be ensured:
- Proper biasing of the transistor to operate in the active region of its characteristic;
- The possibility of software setting of a constant base current, IB;
- The possibility of software control of the collector–emitter voltage, UCE;
- Measurement, using data acquisition, of the values of the base current IB, the collector current IC, and the voltage UCE, for the subsequent plotting of the output characteristic according to relation (3).
To meet these conditions, Figure 4 presents the block diagram of the experimental setup, which includes the following components:
- Programmable power supply GPD–4303S, providing the required voltages;
- Voltage-to-current converter, serving as a constant current source for setting the base current IB;
- NI MyDAQ module, used for acquiring the values of IB, IC, and UCE.
From the GPD–4303S source, two of the four available power supply channels are used. Thus:
- Channel CH1 is employed to provide the input voltage to the V–I converter, required for generating the constant base current IB;
- Channel CH2 is employed to supply the variable values of the collector–emitter voltage UCE, serving as the independent variable in the plotting of the characteristic.
The NI MyDAQ module is employed in this application for both software-based control of the experimental setup and data acquisition, which is required to evaluate the static characteristics. Two analog input channels are utilized: AI1 for measuring the collector-emitter voltage (UCE) and AI0 for measuring the base current (IB), the latter being obtained through a current-to-voltage conversion implemented by means of the resistor RB. Its DMM input is used to acquire the values of the current IC, during the experiment, along with the corresponding values of the voltage UCE. This module also provides the +15V and -15V voltages required for the V-I converter.
The programmable current source, designed to maintain a constant base current (IB) value throughout the acquisition of a characteristic curve, is controlled by the voltage provided by the GPD–4303S power supply. This functionality is achieved through the implementation of a voltage-to-current (V–I) converter, which ensures a stable and accurate conversion mechanism. By employing this approach, the experimental setup enables precise adjustment and long-term stability of the biasing conditions, which are essential for reliable measurement and characterization of the device under test.
The V–I converter is implemented by the Howland converter build with the LT1022 operational amplifier (Figure 4).
The Howland converter (also referred to as the Howland current pump or Howland current source) is a transconductance circuit (voltage-to-current) designed to generate an output current proportional to an input voltage, largely independent of load variations. This type of current source is particularly valuable in applications that demand current stability, linearity, and bidirectionality.
The LT1022 chip is a precision operational amplifier with J-FET inputs, whose characteristics make it well suited for implementing a high-performance Howland converter: low offset voltage, low drift, extremely low bias currents, and a moderate gain-bandwidth product [33].
A classical Howland converter used consists of an operational amplifier with a feedback loop and a balanced resistive bridge formed by resistors R1, R2, R3, R4, and a current-sensing resistor (Rsens) that converts the output current into an internal voltage reintroduced into the feedback loop. This configuration enables the output current to be proportional to the input voltage, based a relation:
In order to achieve high performance, specific resistor ratios must be precisely maintained (e.g., R1 = R3 and R2 = R4). Deviations due to tolerance or thermal drift directly affect the output impedance, linearity, and stability.
In the circuit design, the values R1=R3=100 kΩ and R2=R4=100 kΩ (a 1:1 ratio) were established. By choosing the resistance Rsens=100 kΩ, based on (5) we obtain:
Thus, with Vin = 10V, Iout ≈ 100 µA is obtained, representing a corresponding range of variation of the base current IB.
Using the LTC-1022 in a Howland converter is suitable for static and dynamic characterization of semiconductor devices, where constant current is required in a variable load, as is the case in this application. The Howland converter implemented with the LTC-1022 provides a well-balanced compromise between precision, stability, and performance (in terms of frequency bandwidth and low offset).
An initial verification of the scheme’s operation was carried out through simulation, and the results are presented in Figure 5.
4. Software Framework
The software required for both the control of the presented hardware structure and the acquisition of data for the study of electronic devices through their static characteristics has been developed within the LabVIEW graphical programming environment.
LabVIEW (Laboratory Virtual Instrumentation Engineering Workbench) is a development environment and a graphical (visual) programming language developed by National Instruments. It is specifically designed to facilitate data acquisition, instrument control, industrial automation, signal processing, and related tasks [34].
The programming paradigm used by LabVIEW is dataflow, which means the program execution is determined by the flow of data through nodes and wires, rather than by a sequential textual instruction stream. A node executes when all its input data becomes available. Graphical programs in LabVIEW are organized as Virtual Instruments (VIs), each comprising a front panel (user interface with controls and indicators) and a block diagram (graphical depiction of code: functions, structures, wires) [35].
The choice of this programming language was made based on its features and capabilities, such as:
- Hardware Integration: LabVIEW offers extensive support for interfacing with measurement hardware (DAQ modules, sensors, communication buses such as USB, GPIB, serial, etc.).
- Real-time operation and integration: It is suitable for many real-time data acquisition tasks and supports integration of hardware and external libraries/dlls/etc., which enable optimization when needed.
- Parallelism and Multithreading: Because of its dataflow model, many operations can proceed in parallel without explicit threading code from the programmer, whenever data dependencies allow. This makes it suitable for real-time and high-throughput applications.
- Modularity and Reuse: VIs can call other VIs, similarly to subroutines. LabVIEW supports modular design, making reuse and abstraction possible.
- Rich Library Support: It provides a large set of built-in libraries for tasks such as signal processing, filtering, analysis, graphical display, communication protocols, and instrument driver integration.
Defining, based on systems theory, an experimental setup as a specific arrangement of variables, materials, and conditions used to test a hypothesis, involving the configuration of instruments, the manipulation of independent variables, the measurement of dependent variables, and the control of extraneous factors, it can be identified that the necessary variables are:
- Independent variable(s) represented by the factors that the experimenter intentionally changes or manipulates to observe their effect.
- Dependent variable(s) represented by the factors that are measured to see how they are affected by the independent variable.
- Controlled variables represented by the factors that are kept constant throughout the experiment to ensure that only the independent variable is affecting the dependent variable.
These variables, customized for each application, will be further used for the software implementation of the working algorithms.
The applications presented in this paper are part of a package of practical experiments with remote control, called InteractiveLAB, designed for assisted training in the field of electronics. The experiment is selected from the main menu, whose front panel is shown in Figure 6.
Selecting an experiment requires the presence of the corresponding electronic circuit connected to the computer, along with the necessary power supply and signal sources, as well as the control and data acquisition system. Once initiated, the experiment runs independently of the other experiments.
4.1. Presentation of the Virtual Instrument (VI_diode) Developed for the Study of Semiconductor Diodes
As previously presented, the program developed for the experimental study of semiconductor diodes, implemented in LabVIEW and referred to as a virtual instrument, consists of two interrelated components: the front panel and the block diagram.
4.1.1. Front Panel of the VI_Diode Software
The front panel represents the user interface and comprises both the set of input elements required for introducing commands and data (referred to as controls), as well as the set of output elements necessary for extracting and visualizing the obtained results (referred to as indicators).
The description of the elements on the front panel is similar for both applications presented in this study; therefore, it will not be repeated in the case of the second experiment.
The front panel of this application includes two windows: one dedicated to the configuration and execution of the experiment, and the other to displaying the acquired data and plotting the requested graphs.
In the configuration and execution window of the program, two tabs are employed, both illustrated in Figure 7, corresponding to the two mentioned operations, as follows:
- In the first tab, the following controls are used:
- USB Port Selection: for choosing the communication port between the computer and the programmable experimental devices.
- Polarity: for setting the polarity of the diode under test, either Forward or Reverse.
- Measurement Number: for defining the number of measured values, which determines both the size of the data representation array and the number of points employed in plotting the characteristics.
- Measurement Points Sets: for assigning, according to the previously defined number of points, the values of the independent variable, which in this case is the diode voltage drop (VD or VR).
- Measurement Precision: for setting the limits of the value range around the predefined diode voltage levels at which the measurement is performed. This measurement method is required due to the practical impossibility of selecting a fixed value. Once the value of the independent variable is identified within this range, the program automatically performs the measurement of both the independent variable itself and the dependent variable: either the diode current (ID in forward bias or IR in reverse bias), or the supply voltage (Vsup), depending on the selected characteristic.
- Next, a button witch is provided to move to the following tab.
- 2.
- In the second tab, the following controls and indicators are employed:
- Fine Tuning of the Measurement Accuracy: a control that allows the user to adjust the limits previously defined by the Measurement Precision control, thereby specifying the effective search range.
- Voltage Supply Tuning: a slider-type control used to modify the value of the supply voltage (Vsup) until the diode voltage (VD or VR, depending on the chosen polarity) falls within the previously defined search range. The voltage value is also displayed in a numerical format.
- Search Limits: an indicator showing the boundary values of the search range for each measurement point.
- Measured Values: indicators displaying the acquired values of the diode voltage (Voltage) and the corresponding current (Current) obtained when the independent variable (VD or VR) is identified within the search range.
- Measurement Ended: a pop-up type indicator that becomes visible whenever the target value of the independent variable is identified within the search range. The activation of this indicator occurs simultaneously with the recording of the measured data pairs in a corresponding table, which is automatically dimensioned according to the number of measurement points.
- Return: a button that enables the user to restart the experiment by clearing all previously set states and measured values. Once all the values corresponding to the predefined measurement points have been acquired, the user can proceed to the analysis of the obtained data.
The second window also includes two tabs, both illustrated in Figure 8, through which the user can access the acquired data either in tabular form or as a graphical representation.
- 1.
- The first tab is dedicated to the tabular display of the measured data. The table automatically resizes, with the number of rows determined by the number of measurement points set during the configuration stage, while the number of columns is programmed according to the intended graphical representation. This tab also contains the following controls:
- Clear table data: a button for deleting the data and restarting the measurements for the same values of the independent variable, without modifying the experimental setup states.
- Graph selection: a ring menu for choosing the graphical representation, if such a selection is required. In this case, the options include the representation of the static characteristic ID = f(VD) or IZ = f(VZ), as well as the characteristic VD = f(Vsup) for highlighting the voltage limiting behavior.
- 2.
- The second tab includes the following front panel elements:
- Graphical indicator for visualizing the selected characteristic. Its coordinates are auto-scalable, and the labeling is programmed according to the chosen characteristic for representation. The indicator also provides tools for defining the visualization window. Data can be exported into an Excel file according to the information displayed on the graph.
- Interpolation type: a ring menu for selecting one of the following data interpolation methods: Linear, Polynomial, Spline, or Rational. The interpolation is implemented using the corresponding functions available in LabVIEW libraries.
- Interpolation factor: a slider-type control for adjusting the desired interpolation factor.
4.1.2. Block Diagram of the VI_Diode Software
The block diagram serves as the graphical representation of a program’s logic and functionality. It is an essential component of a virtual instrument, complementing the front panel by defining how inputs are processed and outputs are generated. The block diagram is composed of interconnected nodes, structures, functions, and terminals, which are linked through wires representing the flow of data.
Unlike traditional text-based programming, LabVIEW uses a dataflow paradigm, meaning that the execution of each node is determined by the availability of data at its input terminals. This approach naturally supports parallel execution, modularity, and intuitive visualization of complex processes. Furthermore, the block diagram encourages hierarchical program design by allowing the integration of subVIs, which encapsulate reusable code segments and enhance program scalability.
Due to its clarity and efficiency, LabVIEW, through its block diagram, is widely applied in engineering, research, and industry, particularly in areas such as automated data acquisition, instrument control, signal processing, and real-time system monitoring. Its graphical nature not only reduces development time but also makes debugging and documentation more straightforward, offering a practical advantage in both academic and professional contexts.
Figure 9 presents the complete block diagram that ensures both experiment control and data acquisition, designed for measuring the I–V characteristic of a rectifier diode. For the case of a Zener diode, the block diagram is similar, with the main differences being related to its reverse bias, which requires consideration of the signs of voltage and current, i.e., the electrical quantities specific to this characteristic. The choice between the two types of diodes is implemented using a Case structure, controlled through a Tab control.
The diagram is organized into frames implemented by Sequence structures, such that its components execute sequentially. The application first performs the initializations, then runs a supply voltage regulation module, acquires data via a DAQ Assistant function, and updates both lists and graphs (XY Graphs). Finally, nodes for reset/return/cleanup are executed.
The execution flow of the program consists of the following main actions:
- 1.
- Initialization — carried out by reading the component controls of the dedicated experimental configuration window on the front panel (Figure 7), such as USB port selection, sets of measurement points, and values of the independent variable. It also involves the configuration of the DAQ Assistant function to control the 2-channel relay module used for setting the polarity of the supply voltage, as well as the initialization of user interface elements (listbox, graphs). The DAQ Assistant is integrated in the LabVIEW graphical programming environment and is used for rapid and intuitive configuration of data acquisition (DAQ) applications. It acts as a wizard that allows users to select and configure acquisition parameters without additional coding. This step is performed in the first frame of the main Sequence structure.
- 2.
- Power supply configuration — this action selects the output channel of the GPD 4303 power supply and regulates its voltages according to the independent variable values, using the “Voltage supply tuning” control. This configuration is performed in the second frame of the main Sequence structure, along with the subsequent actions.
- 3.
- Measurement loop — implemented using a While structure, this process executes sequential steps (using an inner Sequence) for each measurement point: applying the voltage through the “Voltage supply tuning” control, reading and displaying the measured responses (Voltage and Current) across the diode using DAQ Assistant functions, converting the acquired data, and verifying whether the voltage values fall within the calculated limits (Search limits/Between limits). The verification process is implemented in a SubVI, whose block diagram is presented in Figure 10.
Fine-tuning mechanisms for measurement accuracy are also included. The user can define search limits, scaling factors, and tolerance thresholds to improve the precision of the results. An iterative algorithm optimizes these values, reducing measurement errors and increasing the stability of the acquired data.
- 4.
- Storage and display — the processed data for the three quantities (Voltage supply, Voltage, and Current) are retrieved using Property Nodes linked to their indicators and are stored point by point in a Multicolumn Listbox. The same data are also used to update the XY Graphs, using Shift Registers within the While loop. The experimental results, i.e., the current–voltage (I–V) dependencies for both the source and the diode, are displayed in an XY Graph. The user may select the interpolation method and scaling factor applied to the raw data, which facilitates comparative analysis and interpretation of the nonlinear characteristics of the tested device. By interpolating the measured points (according to the method chosen by the user), the graphical characteristic is generated and displayed within a dedicated sequence, via the SubVI named Graph.
- 5.
- Stop conditions — if the stop criteria are met (limit reached, Stop/Return button), the sequence exits and performs cleanup operations (DAQ shutdown, UI reset). An additional interactive feature is the reset button and measurement list control functions, which allow a quick return to initial conditions and the restarting of the experiment.
For efficient use, auxiliary functions such as resetting experimental parameters, error handling, and controlled shutdown of hardware resources have been implemented. These mechanisms improve the robustness of the application and ensure protection of the connected equipment.
4.2. Presentation of the Virtual Instrument (VI_transistor) Developed for the Study of the Static Regime of the Bipolar Transistor
Just like the program developed for the study of diodes, the program developed in LabVIEW for the study of the static regime of the transistor has the same two components, namely the front panel and the block diagram.
4.2.1. The Front Panel of the VI_Transistor Software
The front panel of the VI_transistor software application follows the same general structure as the VI_diode application. Accordingly, the window dedicated to experiment configuration and execution (Figure 11) contains identical user interface components, with the following specific differences:
- Transistor configuration. A Tab control replaces the Polarity button from the VI_diode application. This control enables the selection of one of the transistor configurations: common emitter, common collector, or common base. Each configuration requires specific adjustments to the external hardware, as the associated voltages and currents define the output characteristics. The Tab control selects the electrical quantities (voltages and currents) specific to each configuration and assigns the corresponding labels to data tables and graphs using a Case structure. In this study, the common-emitter configuration is considered, for which the output characteristic is defined by relation (3).
- Base current IB setting. An additional slider is introduced to set the base current. The current value, expressed in µA, is generated through the V–I converter according to the general relation (5), which is specified here by relation (6). The base current (0–100 µA), constant during one experiment, is provided by Output Channel 2 of the programmable voltage source GPD-4303S, where the output voltage can be adjusted within 0–10 V. This slider thus generates the independent variable IB values for the transfer characteristic described by relation (4).
- UCE voltage tuning. This slider replaces the Voltage supply tuning slider of the VI_diode application. It defines the values of the independent variable, which in the common-emitter configuration corresponds to the collector–emitter voltage UCE. For transfer characteristic measurements, it is used to fix UCE at constant values throughout a given experiment.
The second window is identical to that of the VI_diode application, except for the customized labels of the value table and the axes of the X–Y Graph, as shown in Figure 12.
4.2.2. Block Diagram of the VI_Transistor Software
Figure 13 presents the complete block diagram that ensures both the experiment control and the data acquisition, as well as the extraction of output and transfer characteristics defined by relations (3) and (4) for a transistor in a common-emitter configuration. The schematic will be further expanded in future configurations to include the other two transistor connections. The selection among these configurations will be implemented using a Case structure, controlled through a ring control.
Ring controls are numeric objects that associate numerical values with strings or images. They appear as drop-down menus allowing the user to navigate a predefined list to make selections.
The diagram is organized similarly to the VI_diode software, in frames implemented through Sequential Structures, which first perform initialization tasks. Then, a regulation module is executed for the two voltage sources used in this case as input quantities of the V–I converter—one for setting the base current (IB) and the other for varying the collector-emitter voltage (UCE). Subsequently, data are acquired through a DAQ Assistant function, which updates both the lists and the graphs (XY Graphs). Finally, nodes responsible for reset/return/cleanup operations are executed.
The program execution flow consists of the following main actions:
- Initialization — performed in a manner similar to the VI_diode software.
- Configuration of power supplies — this action selects two output channels of the GPD 4303 power source and adjusts their voltages using the controls “Set Base Current IB” (via Channel 1) and “UCE Voltage Tunning” (via Channel 2). This configuration is executed in the second frame of the main Sequence Structure.
- Measurement loop — implemented using a While Structure. In this application, the same sequential steps (via an internal sequence) are performed for each measurement point, similar to the VI_diode software.
- Data storage and display — the processed data for the three quantities (supply voltage, collector-emitter voltage UCE, and base current IB) are retrieved using Property Nodes linked to their indicators and stored point by point in a multicolumn list. The same data are also used for updating the XY Graphs, utilizing Shift Registers within the While loop. The experimental results—i.e., the dependence of the base current IB on the collector-emitter voltage UCE—are displayed in an XY graph. The user can also select the interpolation method and scaling factor applied to the raw data, as well as export the data to an Excel spreadsheet for further processing.
- Stop conditions — the stop criteria are also similar to those used in the VI_diode case.
5. Results
As presented thus far, the present work aims to explore the capabilities of virtual instrumentation by employing the LabVIEW platform to create and remotely control a measurement system. The experimental results obtained through the virtual instruments developed within the LabVIEW environment are detailed, demonstrating the successful implementation of remote measurement control. The resulting plots represent a synthesis of the data collected during the experimental sessions.
To exemplify the operation of the proposed hardware and software structures designed for the virtual instrumentation-based analysis of electronic devices, the graphs obtained for two diodes—one rectifier and one Zener diode—and for two NPN bipolar junction transistors are presented.
Figure 14 shows the screenshot of the front panel of the virtual instrument, which includes the data obtained from the experimental analysis of the 1N4148 rectifier diode under forward bias. Fifteen current–voltage dependency points were measured for diode voltage values ranging from 0 to 0.75 V.
In Figure 15, the current–voltage characteristic graphs of this diode are presented, plotted both on the front panel of the virtual instrument and through data export into an Excel file, followed by the insertion of the plotted chart.
It can be observed that the diode exhibits a voltage-limiting behavior under forward bias and that conduction begins when the voltage exceeds approximately 0.6 V, both being functional characteristics specific to this diode type.
Figure 16 presents the screenshot of the virtual instrument front panel containing the data obtained from the experimental investigation of the Zener diode BZX85C5V1, which functions as a voltage stabilizing element.
The characteristic curve of this diode was plotted in the third quadrant, corresponding to the reverse bias region, where its voltage regulation capability is manifested. Through the two-relay module (shown in Figure 3), the polarity of the supply voltage is reversed, so that the recorded voltage and current values across the diode are negative.
For this diode, two graphs are presented. The first one (Figure 17) illustrates the dependency between the diode voltage (V_diode) and the supply voltage (V_supply), highlighting the voltage regulation function.
Here, a stabilization effect can be observed around the value of 5 V for a variation of approximately 15 V in the supply voltage, obtained by including an appropriate series resistor in the circuit.
The second graph, representing the static characteristic, is plotted in the third quadrant, as shown in Figure 18, both on the virtual instrument’s front panel and through data export into an Excel file followed by chart insertion.
To obtain the complete characteristic, measurements were also performed in the first quadrant, corresponding to the forward-bias operation of the Zener diode. These results are presented in Figure 19, following the two aforementioned plotting methods.
By superimposing the two data sets obtained for both biasing types, an Excel chart was created to display the static characteristic of the Zener diode BZX85C5V1 in both quadrants (Figure 20). It can be observed that, in the third quadrant, the diode performs as a voltage stabilizer: for current variations exceeding 50 mA, the voltage variation remains minimal, around 5 V. Under forward bias, the diode exhibits behavior similar to that of the rectifier diode under identical operating conditions.
To exemplify the use of the developed application and to analyze the bipolar junction transistor (BJT), we selected two npn-type transistors, 2N2222A and BC337, for which the obtained results corresponding to the common-emitter configuration are graphically presented below.
The following figures illustrate screenshots of the virtual instrument’s front panel, obtained for three output characteristics of the 2N2222A transistor, under the conditions where the collector–emitter voltage varies within the interval , and the base current takes the following values: (in Figure 21), (in Figure 22), and (in Figure 23).
The three graphs were superimposed within the same coordinate system (Figure 24) by overlapping the measured data exported into an Excel file. This approach enables the observation of the well-known effect of base current variation on the transistor output characteristics.
The experiment was subsequently repeated under identical conditions for the BC337 transistor. In this case as well, the three graphs—derived from the measured data and exported to Excel—are presented in Figure 25.
It is evident that the number of characteristics can be defined by the user through the selection of the number of measurement sets performed for the chosen values of the base current.
Similarly, the transfer characteristics can be plotted, according to Equation (4), by varying the base current within predefined limits and at predetermined points, while simultaneously measuring the collector current. These characteristics are obtained under conditions where the base–emitter voltage is maintained constant.
6. Remote Desktop Applications Study
Remote desktop applications are software tools that allow remote access and control of a computing system via a communications network [36].
In the context of virtual instrumentation, these applications facilitate remote access to laboratory equipment such as that presented above, allowing the control and monitoring of experiments from a distance. In search of a useful application for this purpose, in this paper, the following applications are considered:
- TeamViewer which is a multi-platform application commonly used for technical support, online collaboration, IT administration, and remote work, allowing full access to a device located in another location. It has the advantage of an easy-to-use interface and a free version. However, frequent use in the free version may lead to restrictions, and commercial licenses can be expensive .
- AnyDesk which is an application highly regarded for its speed and efficiency, making it a popular choice for users seeking a simple and reliable solution for remote device control. It is commonly used for technical support, IT administration, or accessing files and applications remotely. It is also multi-platform, offering low latency and fast data transmission, which is particularly useful for real-time connections. AnyDesk provides free features for personal use, boasts high responsiveness even on slower connections, and offers flexible configuration options for individual users or companies.
- Microsoft Remote Desktop is a free application developed by Microsoft that allows users to access and control computers remotely. It is integrated into Windows operating systems and is best suited for users of Microsoft OS. It allows connecting to a Windows PC from anywhere, over a local network or the internet, providing support for fast connections and efficient resource management. It has the disadvantage of being limited mainly to Windows devices (the server must be Windows) as well as the interface and configurations can be less intuitive for beginners.
- RustDesk is a free and open-source remote desktop software designed to provide a secure, self-hosted alternative to commercial solutions like TeamViewer or AnyDesk. Built in the Rust programming language, RustDesk emphasizes performance, privacy, and full user control. Unlike many proprietary tools, RustDesk allows users to host their own servers, ensuring that no third-party servers handle your data. This is particularly valuable for individuals and organizations with strict data protection policies or those who need to comply with privacy regulations (e.g., GDPR). His key features include:
- Cross-platform support (Windows, macOS, Linux, iOS, Android)
- End-to-end encryption
- Clipboard synchronization
- File transfer capabilities
- No configuration required for NAT traversal (by default)
- Lightweight and fast interface
For an objective evaluation of remote desktop applications in the context of virtual instrumentation, Table 2 presents a comparative analysis based on the specific criteria of such applications:
In the context of remote control of applications via virtual instrumentation, specific evaluation criteria include:
- Latency and real-time response: RustDesk demonstrates high performance and speed, being comparable to AnyDesk in terms of the low latency required for real-time control of sequential circuits.
- Connection stability: TeamViewer offers the most stable connection for extended sessions, but AnyDesk presents frequent disconnection issues, a critical aspect for long-term experiments.
- Data transfer: For virtual instrumentation applications that require frequent transfer of experimental data, all analyzed applications support file transfer, except Chrome Remote Desktop which has limited functionality.
The choice of RustDesk for implementing the remote-control system of virtual instrumentation is based on several key factors specific to academic and research-oriented applications [37,38].
- Security and Privacy: End-to-end encryption ensures the confidentiality of transmitted data—critical in experiments involving sequential circuits where data may contain sensitive research information. The self-hosting capability eliminates the risks associated with centralized servers provided by commercial vendors.
- Transparency and Auditability: The open-source code allows for security auditing and adaptation to specific application requirements—an essential advantage in the academic environment where methodological transparency is fundamental.
- Real-Time Performance: Its modern architecture, built on Rust, ensures high performance and low latency—critical aspects for the real-time control of virtual instruments developed in LabVIEW.
- Connection Stability: The connection spread is more stable compared to AnyDesk, which frequently suffers from disconnection and video sync issues—detrimental for experiments that require continuous monitoring.
- Architectural Flexibility: The ability to configure a dedicated relay server offers complete autonomy over the communication infrastructure, eliminating dependency on third-party services and ensuring system availability for critical virtual instrumentation applications.
Figure 26 shows images of the laboratory experiment and one of the client computers used for remote control of the Zener diode study. A video camera is also used in the laboratory to capture real-time images of the measuring instruments, so that the user can watch the real instruments in addition to the virtual ones.
7. Discussion
The proposed hardware–software system demonstrates the feasibility of employing virtual instrumentation for the remote control of electronic experiments, providing a scalable and efficient alternative to conventional laboratory environments. By integrating programmable power supplies, NI MyDAQ modules, and switching elements, the platform enables the acquisition and interpretation of electrical parameters under conditions that closely resemble direct interaction with physical equipment.
A relevant aspect of this study is the preservation of the realistic nature of the experiments, which cannot be replicated through software simulations alone. Phenomena such as electrical noise, component tolerances, and temperature variations naturally manifested during the measurements, thereby validating the applicability of the platform in both educational and research contexts. The modular structure of the system facilitates extensions toward additional devices or more complex circuits without significant architectural modifications.
The software implementation in LabVIEW—relying on sequential structures, specialized subVIs, and dataflow control mechanisms—enabled the development of an ergonomic interface suitable for users with varying levels of experience. Precise control of independent and dependent variables, combined with interpolation and data export options, contributes to an in-depth analysis of the static characteristics of the tested devices.
Regarding remote control, the comparative assessment of Remote Desktop applications identifies RustDesk as the optimal solution for academic environments. Its key advantages include the absence of licensing costs, the high level of security ensured by end-to-end encryption, and the possibility of self-hosting—critical aspects for complying with institutional data protection policies.
Nevertheless, the study can be further extended by evaluating system performance in multi-user scenarios, assessing the impact of network latency on measurement accuracy, and implementing advanced mechanisms for concurrent access management. Additionally, integrating the platform within an e-learning framework may further strengthen its role in modern engineering education.
8. Limitations and Future Directions
In conducting remote-controlled experiments, it is necessary to install one of the remote-desktop applications mentioned above on both the host computer and the user computer. At first glance, this may appear to introduce a security concern, particularly for the host system; however, this issue can be mitigated by restricting control solely to the window corresponding to the front panel. Enforcing cursor-position constraints to the surface defined by the virtual instrument’s front panel requires the presence of a dedicated application on the host computer.
Although the response times observed during the use of this application across different types of networks are short and do not affect measurement results, they cannot be ignored in experiments involving a significantly larger number of variables or requiring substantially higher measurement precision. Consequently, a future development direction involves designing and evaluating web-based interfaces that enable access to the virtual instrument’s front panel on the host computer within the laboratory.
9. Conclusions
This work presents an integrated hardware and software laboratory platform for the remote study of electronic devices, integrating programmable hardware modules with a software environment developed in LabVIEW. The experimental results obtained for diodes and transistors confirm the system’s accuracy and stability, demonstrating its ability to reliably reproduce the static characteristics of semiconductor devices.
In relation to the previously established objectives, in Chapter 3. Experimental Setup Structures, the following observations can be made, representing some conclusions drawn from the research conducted in this context:
- The implemented circuits meet the required conditions for the deployment of the two software-controlled experiments both in the laboratory and via remote operation.
- The developed interface provides all necessary functionalities for the analysis of semiconductor devices based on their static characteristics.
- By selecting a solution that determines the acquisition moment for all data required in the analysis—through identifying the occurrence of the chosen independent variable within a predefined vicinity—the acquisition process gains increased flexibility.
- The same solution also compensates for delay times resulting from remote control, thus ensuring the required measurement accuracy, with all measurements being effectively carried out in the laboratory experiment.
- The values measured through virtual instrumentation and remote control are identical to those obtained in the laboratory using conventional measurement equipment.
- Defining a general operating procedure ensures that no significant differences exist between the study of diodes—using two variables for constructing static characteristics—and the study of bipolar junction transistors—using three variables for constructing static characteristics—a fact observable through the comparison of the block diagrams in Figure 9 and Figure 13.
- The interactive measurement of the coordinates of static points and the display of the obtained results conclude with the graphical plotting of the characteristics after completing the predetermined number of measurements.
- The capability to export measured data to Excel provides the user not only with data-logging functionality, but also with the possibility to compare the operation of the same device under different working conditions, or to compare multiple devices under identical operating conditions.
The proposed solution exhibits a high degree of flexibility, allowing straightforward adaptation to a wide range of experiments. Its modular hardware architecture supports expansion toward circuits of greater complexity, while the software interface ensures an intuitive process for configuration, acquisition, and visualization of data. Furthermore, the remote-control capability enabled through RustDesk optimizes access to experimental resources and supports activities conducted across geographically distributed locations.
Through its technical and pedagogical characteristics, the proposed system represents a viable solution for modernizing educational infrastructure and facilitating collaboration in applied research. The platform may serve as a foundation for future developments, including integration into e-learning frameworks, full automation of experimental procedures, and extension toward industrial measurement applications.
Acknowledgments
This work is part of the CNFIS-FDI-2023-0160 project, which develops an interactive laboratory for controlling the students’ practical training activities through virtual instrumentation.
Conflicts of Interest
The authors declare no conflicts of interest.
References
- Monzo, C.; Germán, C.; José, A. M.; Eugènia, S. Remote Laboratory for Online Engineering Education: The RLAB-UOC-FPGA Case Study. Electronics 2020, 10(9), 1072. [Google Scholar] [CrossRef]
- Feisel, L.; Rosa, A. The Role of the Laboratory in Undergraduate Engineering Education. J. Eng. Educ. 2005, 94, 121–130. [Google Scholar] [CrossRef]
- Sierra-Fernández, J. M.; Agüera-Pérez, A.; Palomares-Salas, J. C.; Espinosa-Gavira, M. J.; Florancias-Oliveros, O.; González de la Rosa, J. J. Web-based Remote Lab System for Instrumentation and Electronic Learning. Adv. Sci. Technol. Eng. Syst. J. 2021, 6(4), 100–109. [Google Scholar] [CrossRef]
- Tomeo-Reyes, I.; Musleh, S. A.; Wijenayake, C.; Yeoh, J. Z.; May, D.; Auer, E. M.; Kist, A. Online Laboratories in Modern Engineering Education: A Systematic Literature Review. In Online Laboratories in Engineering and Technology Education; corrected publication 2025; Springer Cham, Switzerland AG, 2024; pp. pp: 29207–29227. [Google Scholar]
- Poo, M.C.-P.; Lau, Y.-y.; Chen, Q. Are Virtual Laboratories and Remote Laboratories Enhancing the Quality of Sustainability Education. Educ. Sci. 2023, 13, 1110. [Google Scholar] [CrossRef]
- Terkaja, W.; Kleineb, K.; Kutsc, V. Virtual labs for higher education in industrial engineering. Proceedings of the Estonian Academy of Sciences 2024, 73(2), 142–149. [Google Scholar] [CrossRef]
- Kularatne, W.; Dissawa, L. H.; Ekanayake, T.; Ekanayake, J. B. Developing and Delivering a Remote Experiment Based on the Experiential Learning Framework During COVID-19 Pandemic. IJAE.j.asia.edu 2022, 3, 1–12. [Google Scholar] [CrossRef]
- Hayashi, V. T.; Reginaldo, A.; Edson, M.; Cugnasca, Paulo S.; Corrêa, Pedro L. Teaching Digital Electronics during the COVID-19 Pandemic via a Remote Lab. Sensors 2022, 22(18), 6944. [Google Scholar] [CrossRef]
- Cheung Lui, R.W.; Yi Zhang, A.W.; Yun Lee, P.T. A Secure and Scalable Virtual Lab Platform for Computing Education. IJIET 2024, Vol.14(1), 59–64. [Google Scholar] [CrossRef]
- UNESCO. Education: From Disruption to Recovery. 2020. Available online: https://en.unesco.org/covid19/educationresponse.
- Kara, A.; Aydin, E.; Efe Özbek, M.; Cagiltay, N. Design and Development of a Remote and Virtual Environment for Experimental Training in Electrical and Electronics Engineering. In Proceedings of the 9th International Conference on Information Technology Based Higher Education and Training (ITHET), April 2010; pp. 183–189. [Google Scholar]
- Rodríguez-Galán, J. A.; Santamaría, M.; Medina, J.; García, J. Easy Development of Industry 4.0 Remote Labs. Electronics 2023, 13(8), 1508. [Google Scholar] [CrossRef]
- Arshad, A. Remote Monitoring of Lab Experiments to Enhance Collaboration Between Universities. Informatica 2022, 46(2), 169–177. [Google Scholar] [CrossRef]
- Grodotzki, J.; Ortelt, R. T.; Tekkaya, A. E. Remote and Virtual Labs for Engineering Education 4.0: Achievements of the ELLI project at the TU Dortmund University. Procedia Manufacturing 2018, 26, pp: 1349–1360. [Google Scholar] [CrossRef]
- Malaoui, A. Empowering Flexible Learning: Embedded Systems for Remote Laboratories. IJEAP 2023, 3, 879–890. Available online: https://ijeap.org/ijeap/issue/view/11.
- Chacón, J.; Besada-Portas, E.; García-Pérez; López-Orozco, J. A. An integrated framework for the agile development and deployment of low cost remote laboratories. Multimed Tools Appl 2025, 84, 29207–29227. [Google Scholar] [CrossRef]
- Monzo, Carlos; Cobo, Germán; Morán, José A.; Santamaría, Eugènia. Remote Laboratory for Online Engineering Education: The RLAB-UOC-FPGA Case Study. Electronics 2020, no. 9 (10), 1072. [Google Scholar] [CrossRef]
- Garefalakis, M.; Kamarianakis, Z.; Panagiotakis, S. Towards a Supervised Remote Laboratory Platform for Teaching Microcontroller Programming. Information 2024, 15(4), 209. [Google Scholar] [CrossRef]
- Sierra-Fernández, J. M.; Palomares-Salas, J. C.; Agüera-Pérez, A. Web-Based Remote Laboratory System for Instrumentation and Electronic Learning. ASTESJ 2021, Vol. 6(Issue 4), 100–109. [Google Scholar] [CrossRef]
- Kolapo, S. A. A LabVIEW-based online DC servomechanism control experiments incorporating PID controller for students’ laboratory. IJEE 2023, 60(1), 3–22. [Google Scholar] [CrossRef]
- Tinashe, C.; Modran, H.; Ursuțiu, D.; Samoilă, C.; Hedeșiu, H. Cloud-Based, Expandable—Reconfigurable Remote Laboratory for Electronic Engineering Experiments. Electronics 2022, 11(20), 3292. [Google Scholar] [CrossRef]
- Drăgan, F.; Copindean, R. Remote Learning Laboratory using Surveillance cameras and VPN Solutions. ACTA ELECTROTEHNICA 2020, 61(4), 307–314. [Google Scholar]
- Fabregas, E.; Farias, G.; Dormido-Canto, S.; Esquembre, F. Developing a remote laboratory for engineering education. Comp & Ed 2011, 57(2), 1686–1697. [Google Scholar] [CrossRef]
- Ruo Roch, M.; Martina, M. VirtLAB: A Low-Cost Platform for Electronics Lab Experiments. Sensors 2022, 22, 4840. [Google Scholar] [CrossRef]
- Dutta, S.; Prakash, S.; David, E.; Pop, E. A Web Service and Interface for Remote Electronic Device Characterization. IEEE Trans on Educ 2011, 54(4). [Google Scholar] [CrossRef]
- Neamen, A. D. Semiconductor Physics and Devices. In Basic Principles, 4th ed.; McGraw-Hill: New York, 2012; pp. 241–330. [Google Scholar]
- Louis, Frenzel E. Contemporary Electronics: Fundamentals, Devices, Circuits, And Systems; McGraw-Hill: New York, 2014; pp. 486–522. [Google Scholar]
- Boylestad, L. R.; Nashelsky, L. Electronic Devices and Circuit Theory, 11th ed.; Person: New Jersey, 2013; pp. pp 1–129. [Google Scholar]
- myDAQ Specifications. Available online: https://www.ni.com/docs/en-US/bundle/mydaq-specs/page/specs.html (accessed on 20 October 2025).
- Neamen, A. D. Semiconductor Physics and Devices. In Basic Principles, 4th ed.; McGraw-Hill: New York, 2012; pp. 491–570. [Google Scholar]
- Louis, Frenzel E. Contemporary Electronics: Fundamentals, Devices, Circuits, And Systems; McGraw-Hill: New York, 2014; pp. 544–617. [Google Scholar]
- Boylestad, L. R.; Nashelsky, L. Electronic Devices and Circuit Theory, 11th ed.; Person: New Jersey, 2013; pp. pp 129–422. [Google Scholar]
- Linear Technology Corporation. Available online: https://www.analog.com/media/en/technical-documentation/data-sheets/lt1022fa.pdf (accessed on 20 October 2025).
- LabVIEW User Manual. Available online: https://docs-be.ni.com/bundle/labview/preprocessedpdf/enus (accessed on 20 October 2025).
- Toure, A.F.; Cotfas, P.A.; Cotfas, D.T.; Diourte, B. Study of the Electrical Characteristics of Electronic Components under the NI Labview Environment. In Proceedings of the 17th International Technology, Education and Development Conference, Valencia, Spain, March 2023. [Google Scholar] [CrossRef]
- Tittel, E.; Johnson, J. Remote access essentials; Sybex: Alameda, CA, 2002. [Google Scholar]
- XDA. Available online: https://www.xda-developers.com/reasons-rustdesk-is-the-best-team-viewer-alternative/ (accessed on 20 October 2025).
- StarWind. Available online: https://www.starwindsoftware.com/blog/open-source-and-cross-platform-alternative-to-teamviewer-called-rustdesk/ (accessed on 20 October 2025).
Figure 1.
I-V characteristic of the semiconductor diode. (a) Circuit for tracing the I-V characteristic; (b) Forward bias characteristic; (c) Revers bias characteristic.
Figure 1.
I-V characteristic of the semiconductor diode. (a) Circuit for tracing the I-V characteristic; (b) Forward bias characteristic; (c) Revers bias characteristic.
Figure 2.
Block diagram of the experimental system used for plotting the I-V characteristics of diodes.
Figure 2.
Block diagram of the experimental system used for plotting the I-V characteristics of diodes.
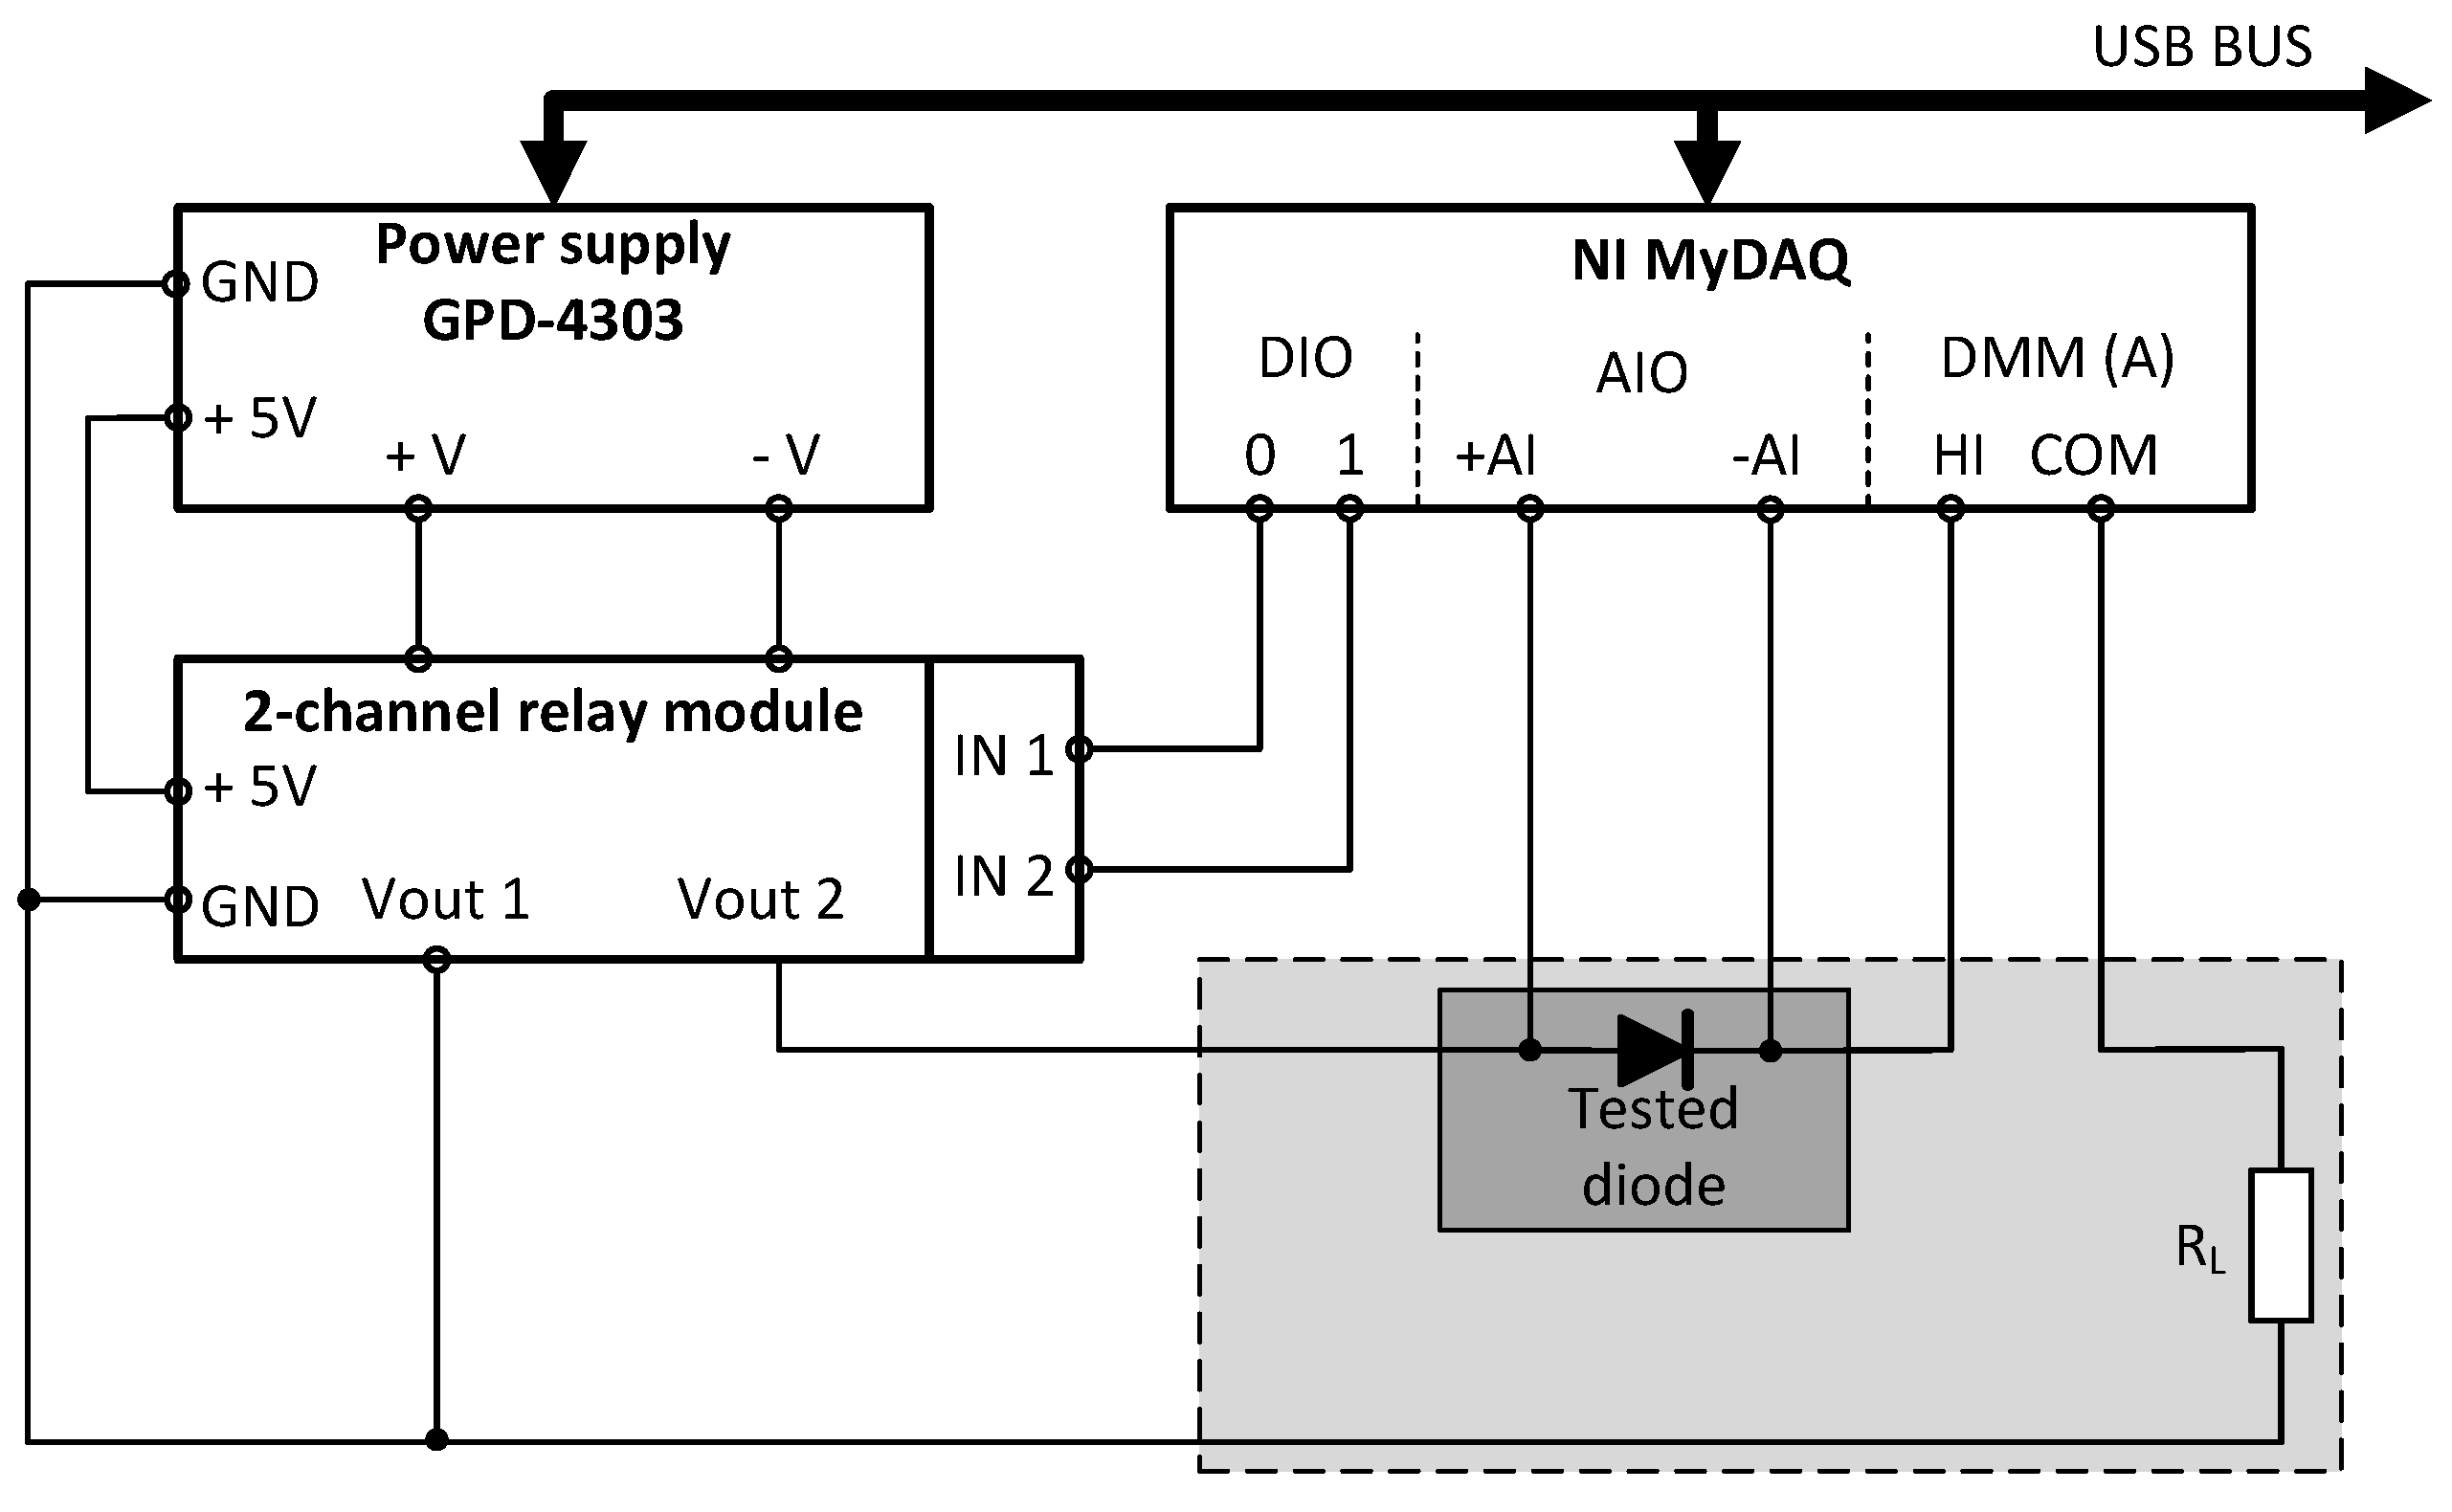
Figure 3.
The 2-channel relay module.
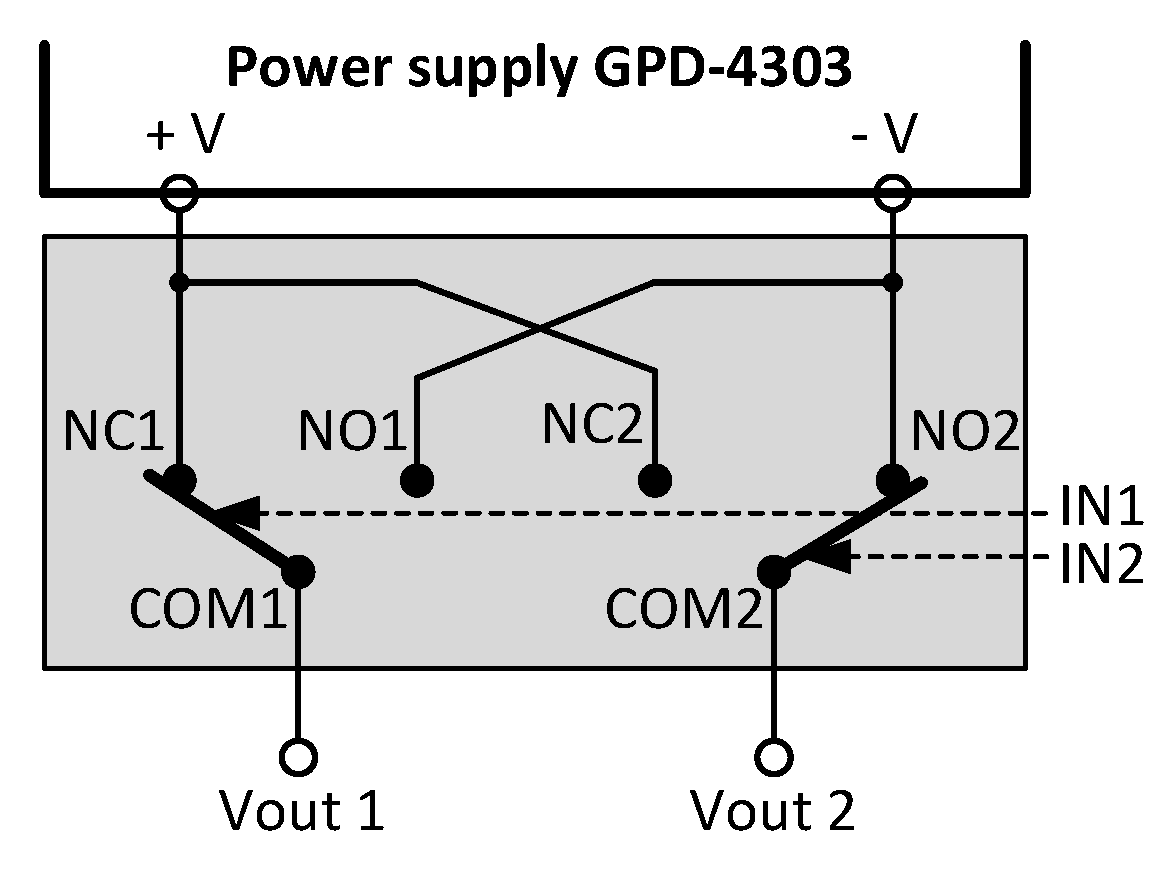
Figure 4.
Block diagram of the experimental system used for plotting bipolar transistors characteristics.
Figure 4.
Block diagram of the experimental system used for plotting bipolar transistors characteristics.
Figure 5.
Simulation results of the Howland converter.
Figure 6.
Main front panel of the InteractiveLAB application.
Figure 7.
Front panel of the VI_diode virtual instrument used for experiment configuration.
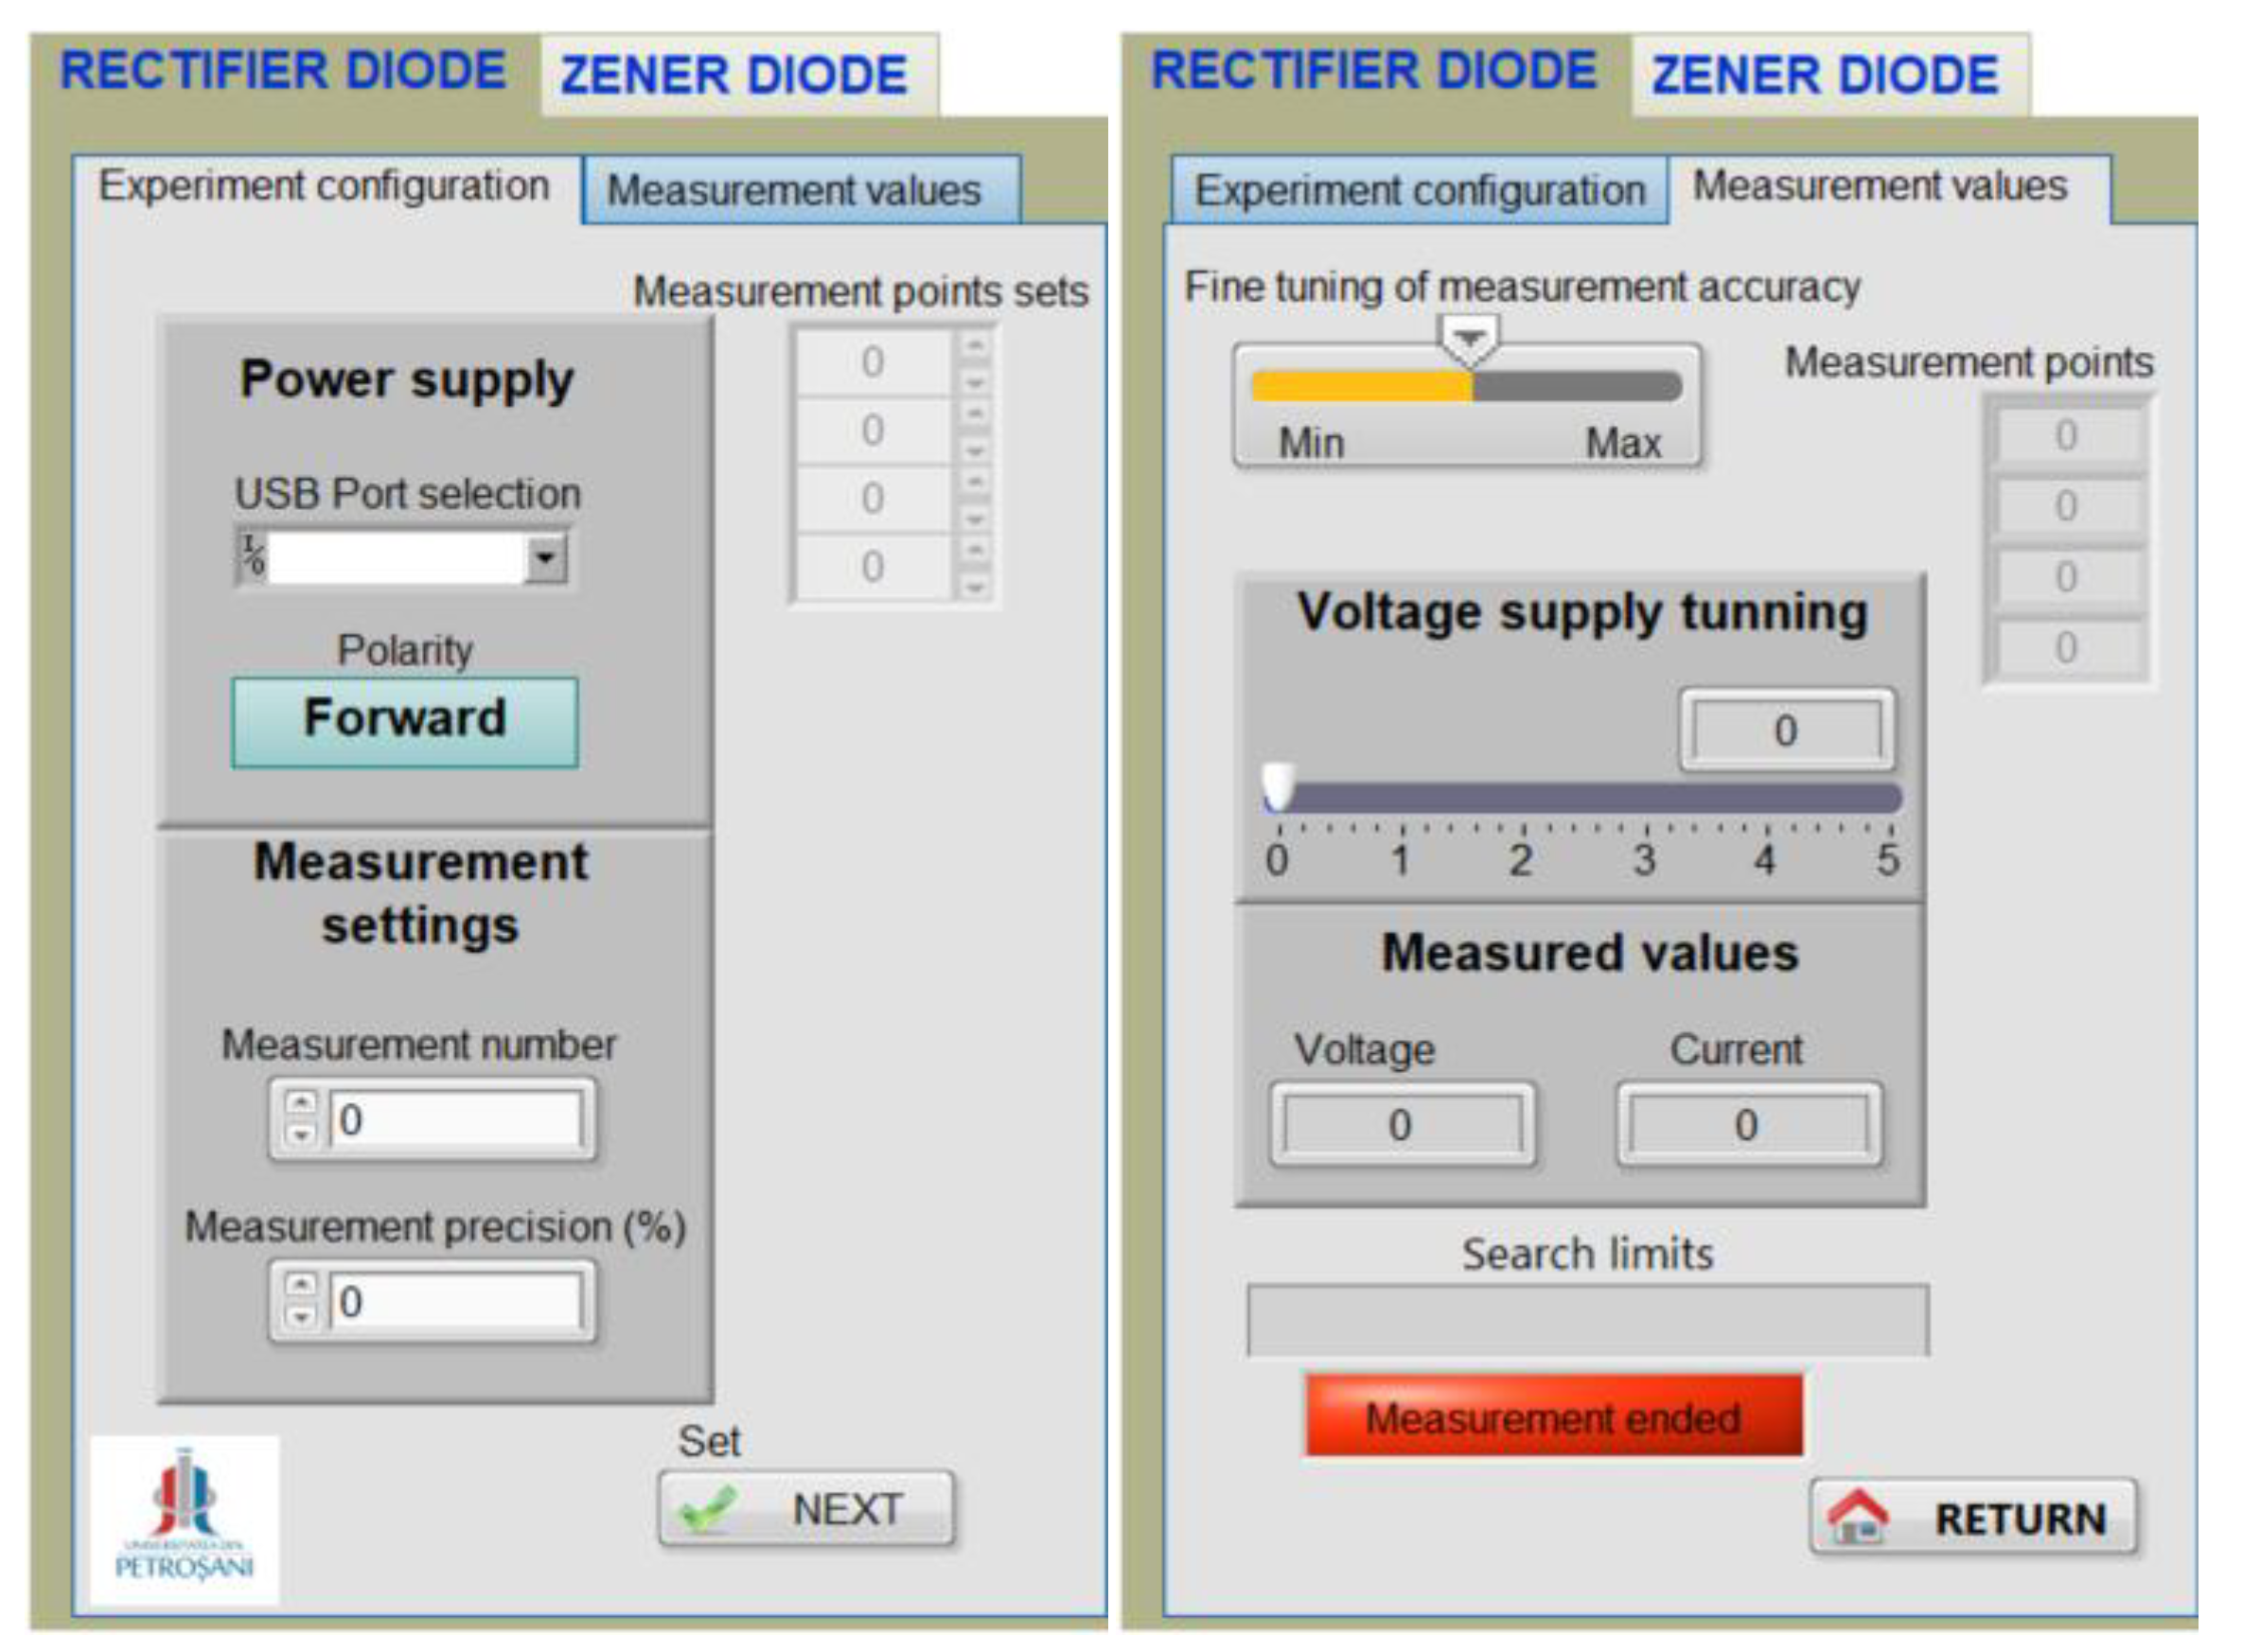
Figure 8.
Front panel of the VI_diode virtual instrument used for acquire and plotting data.
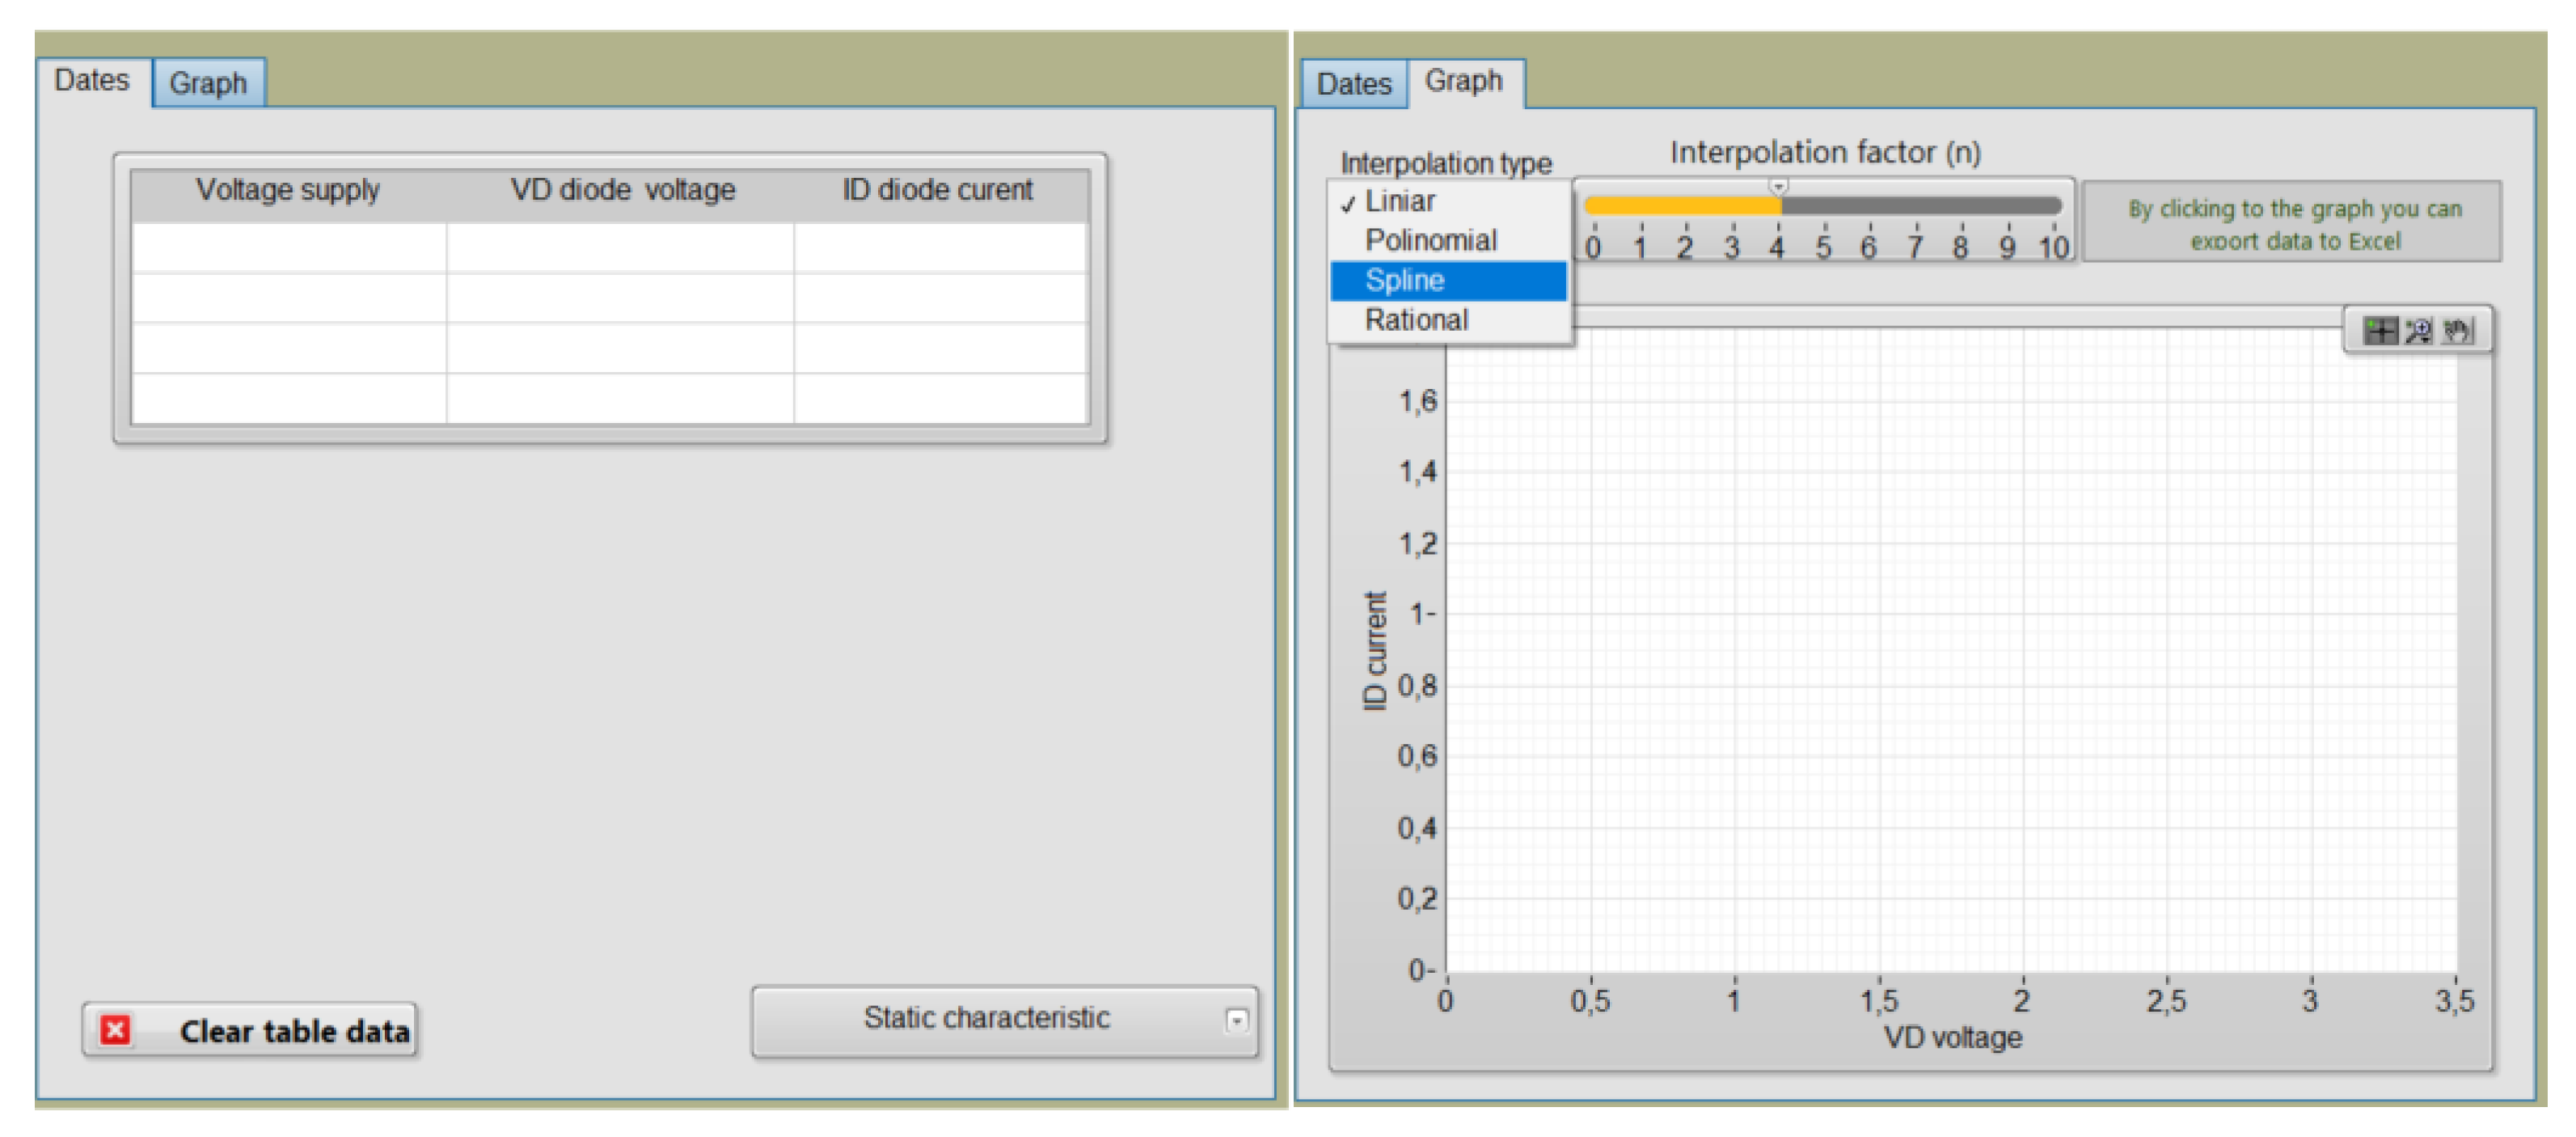
Figure 9.
Block Diagram of the VI_diode virtual instrument.
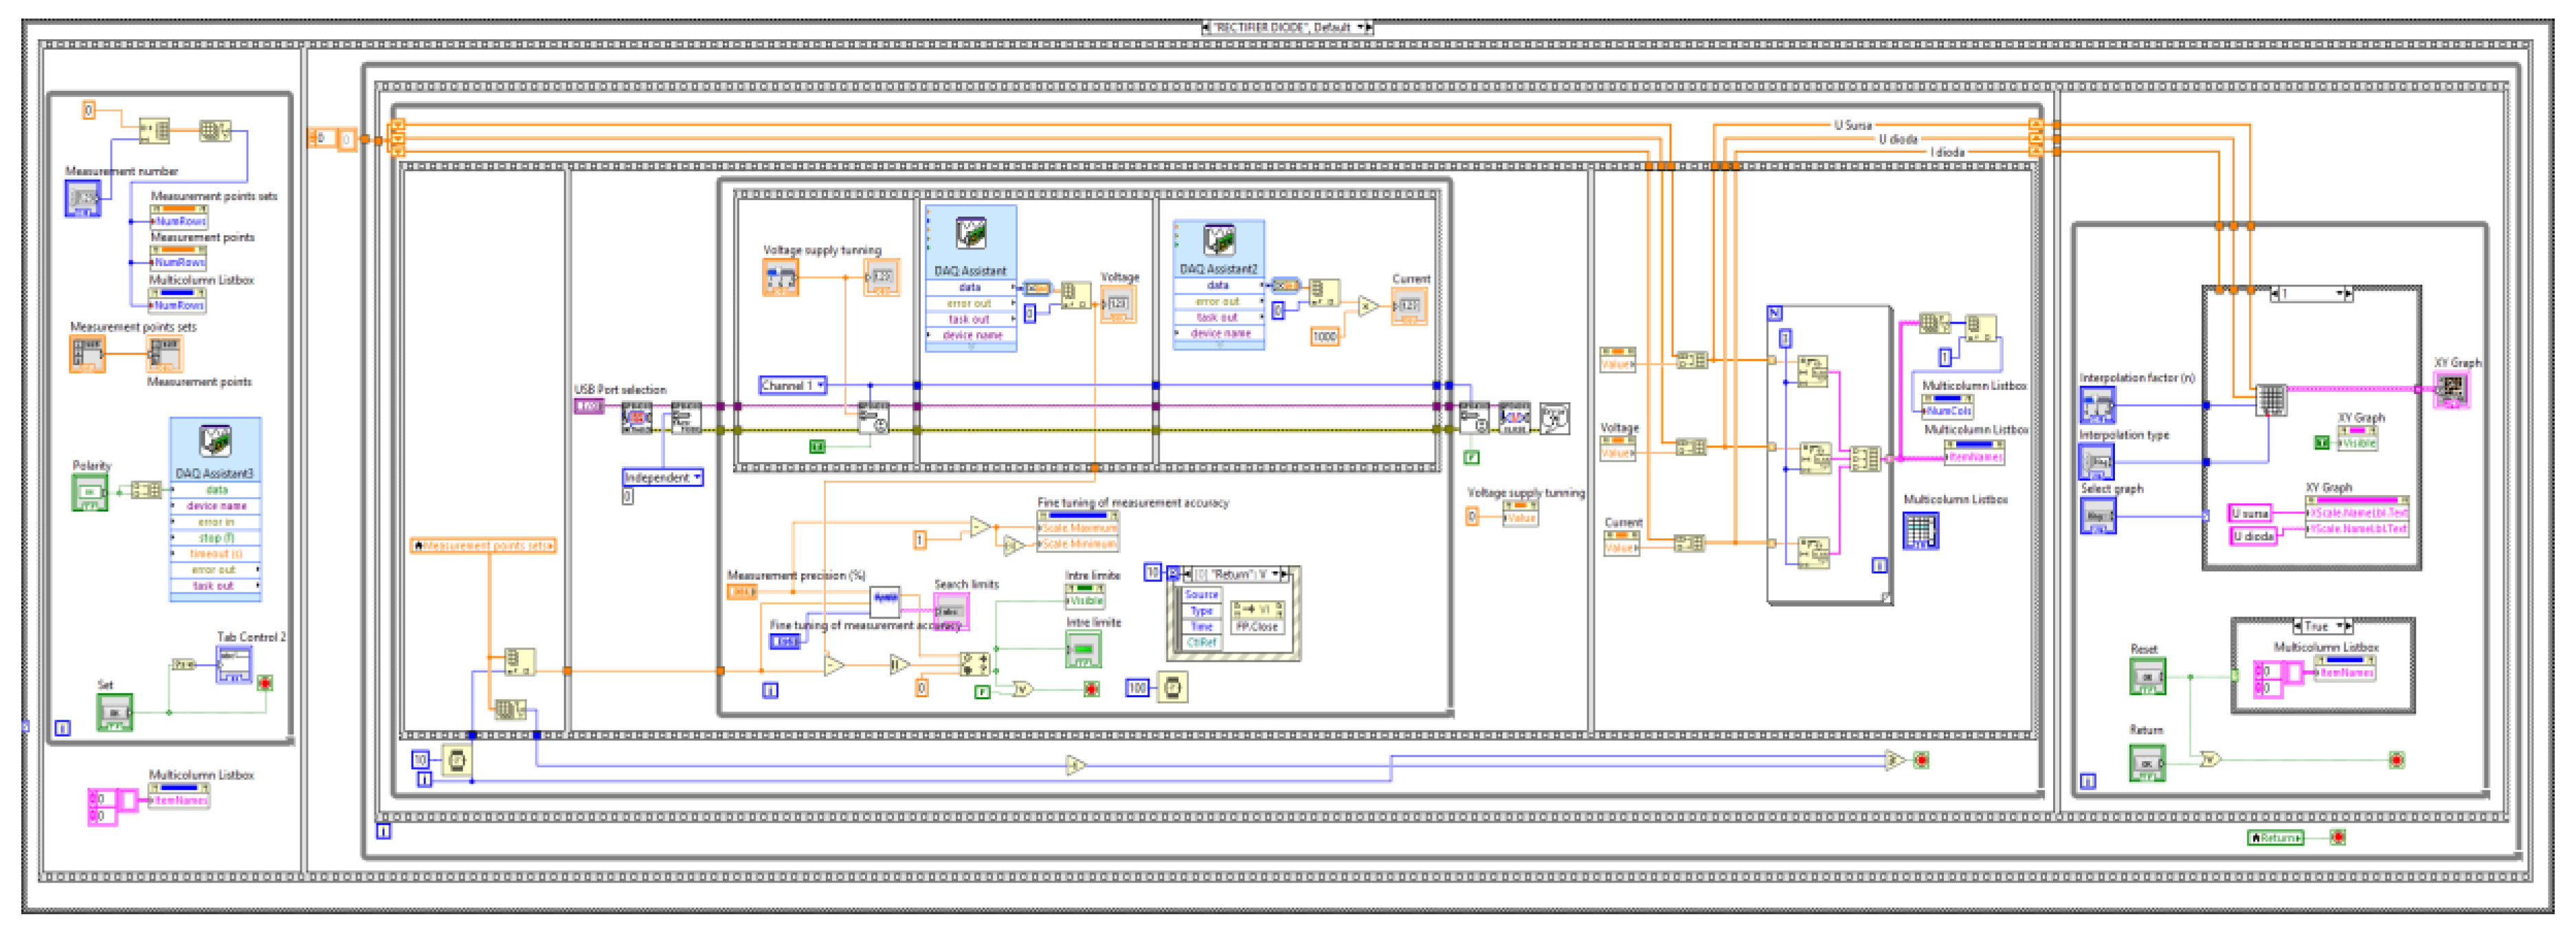
Figure 10.
Block diagram of the subVI used to fit measured values within established limits.
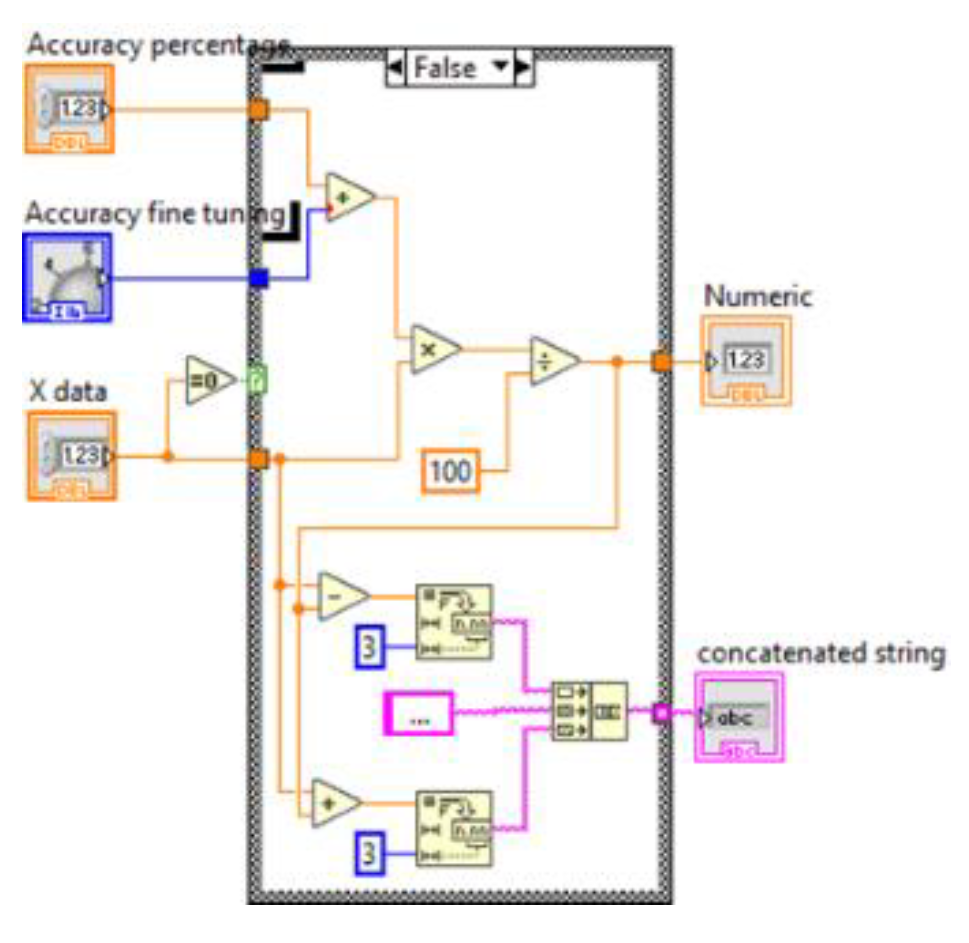
Figure 11.
Front panel of the VI_transisitor virtual instrument used for experiment configuration.
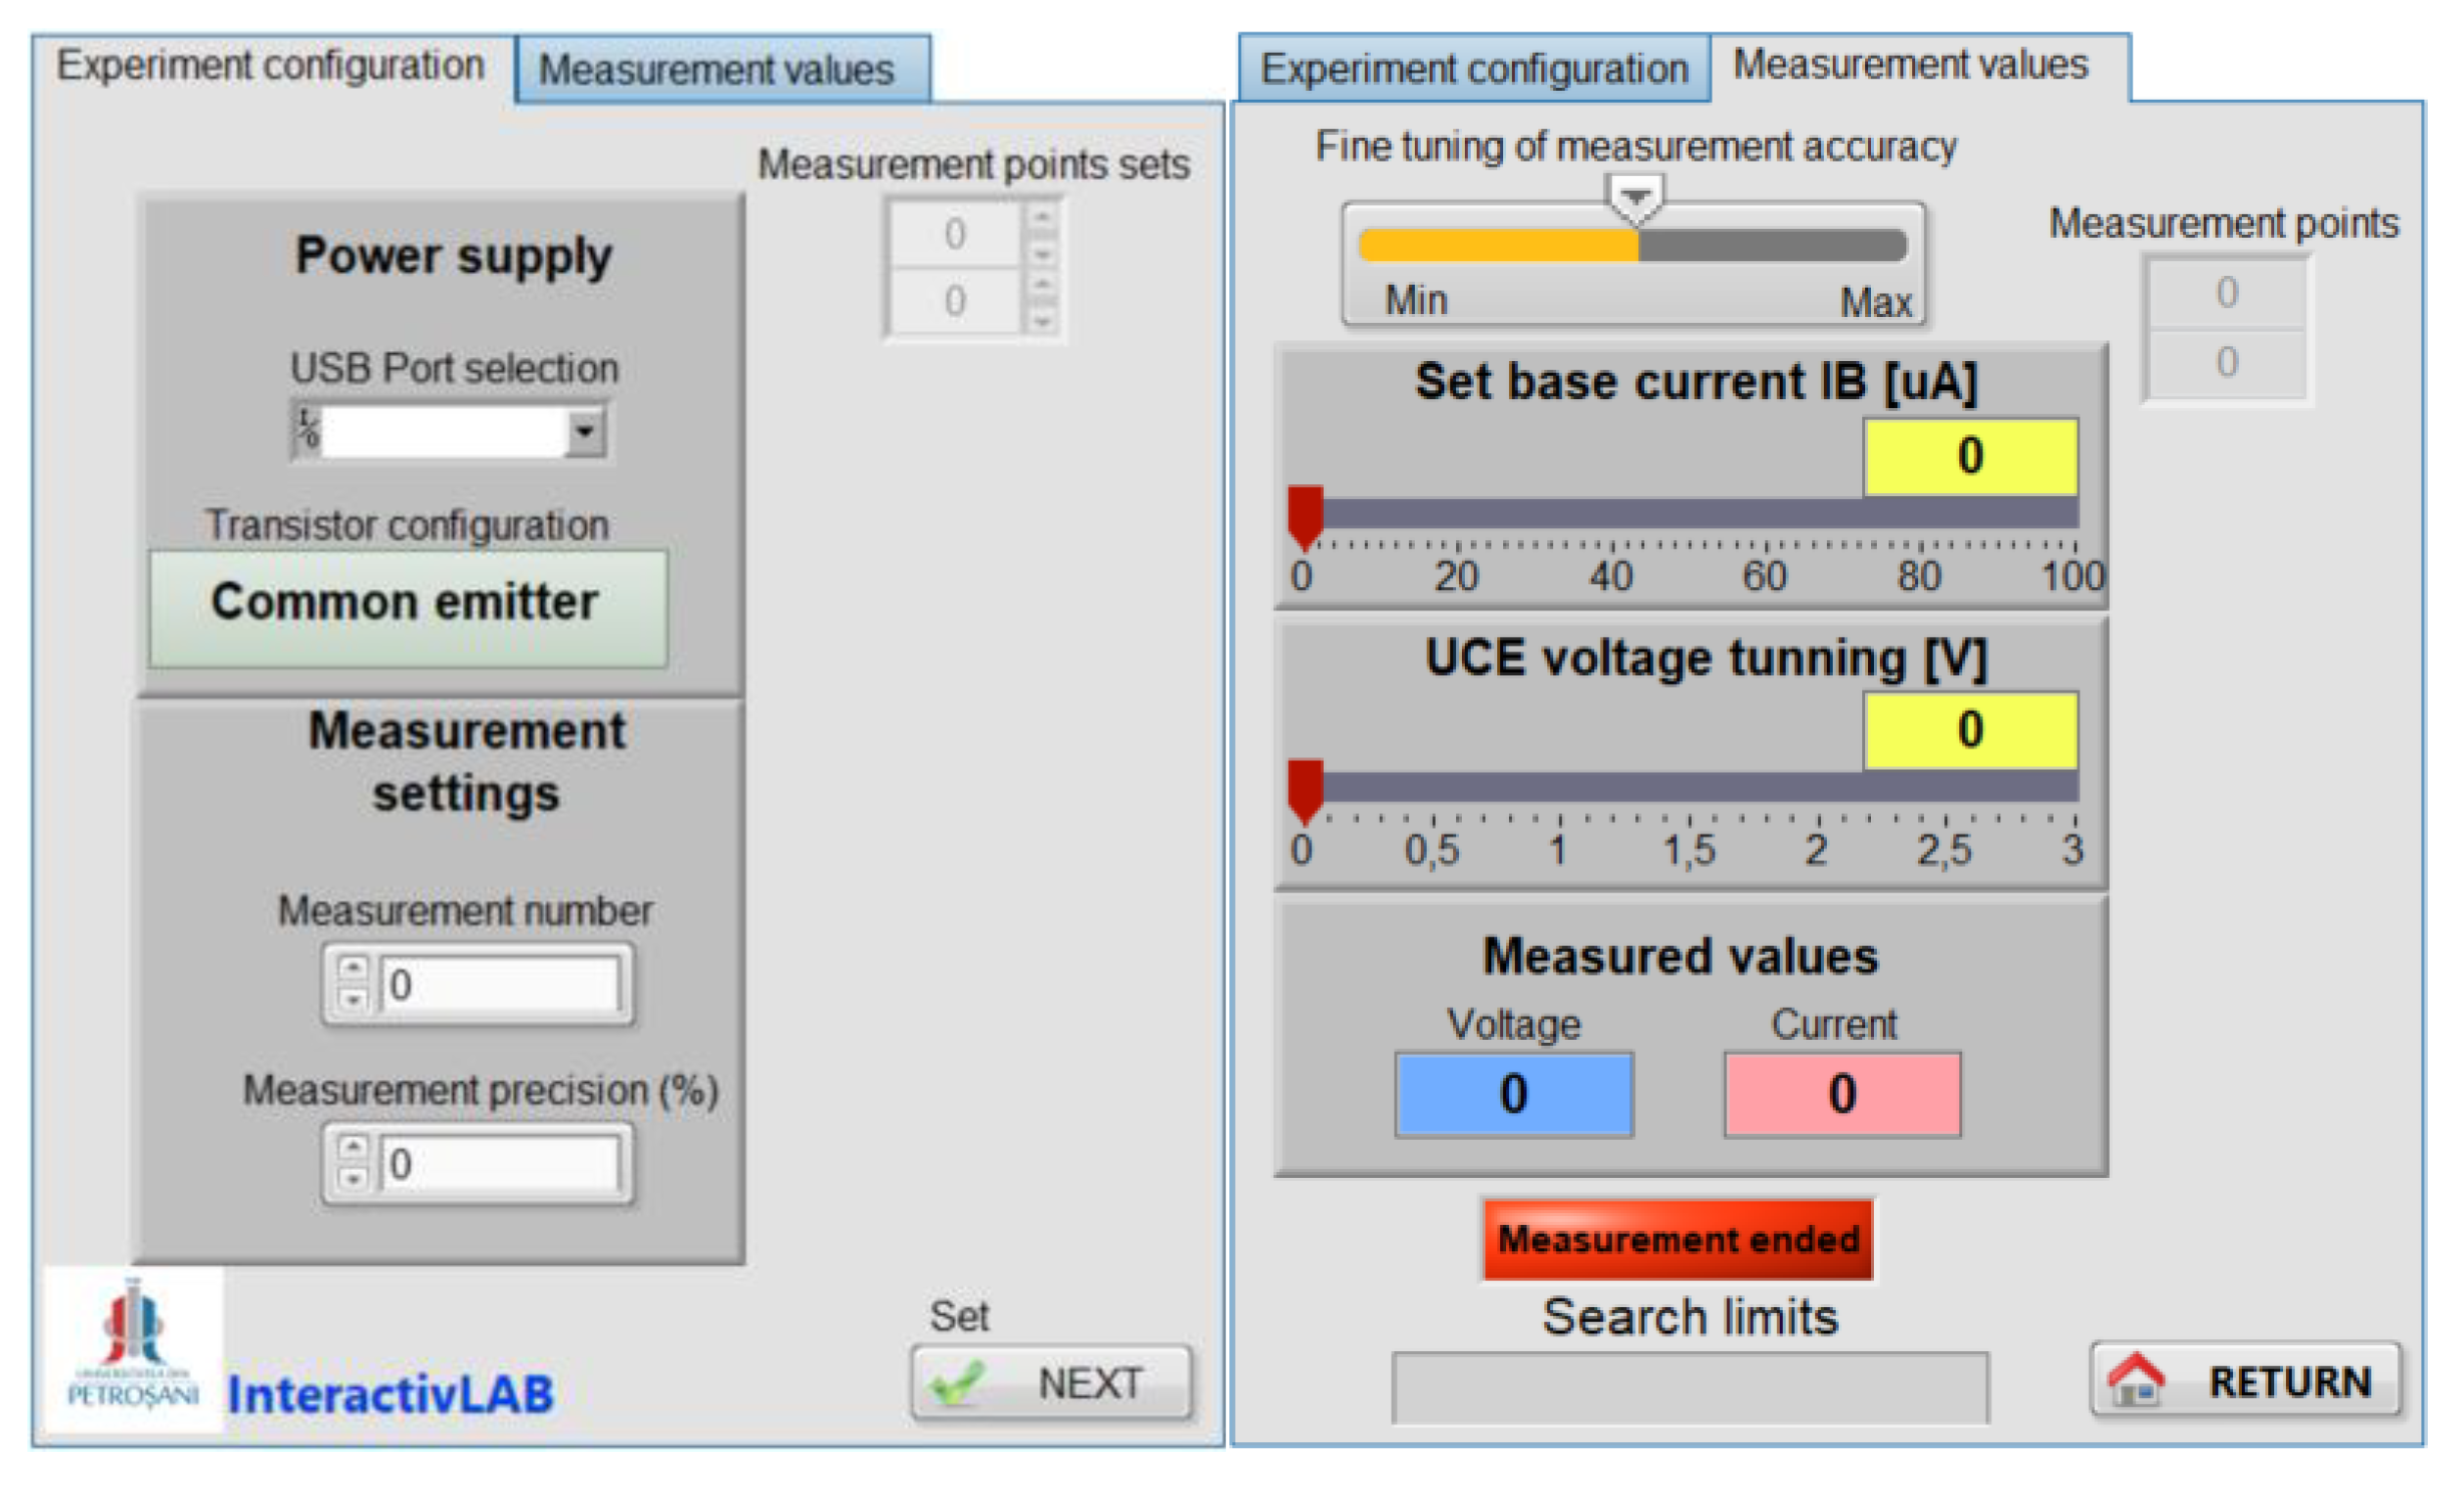
Figure 12.
Front panel of the VI_transistor virtual instrument used for acquire and plotting data.
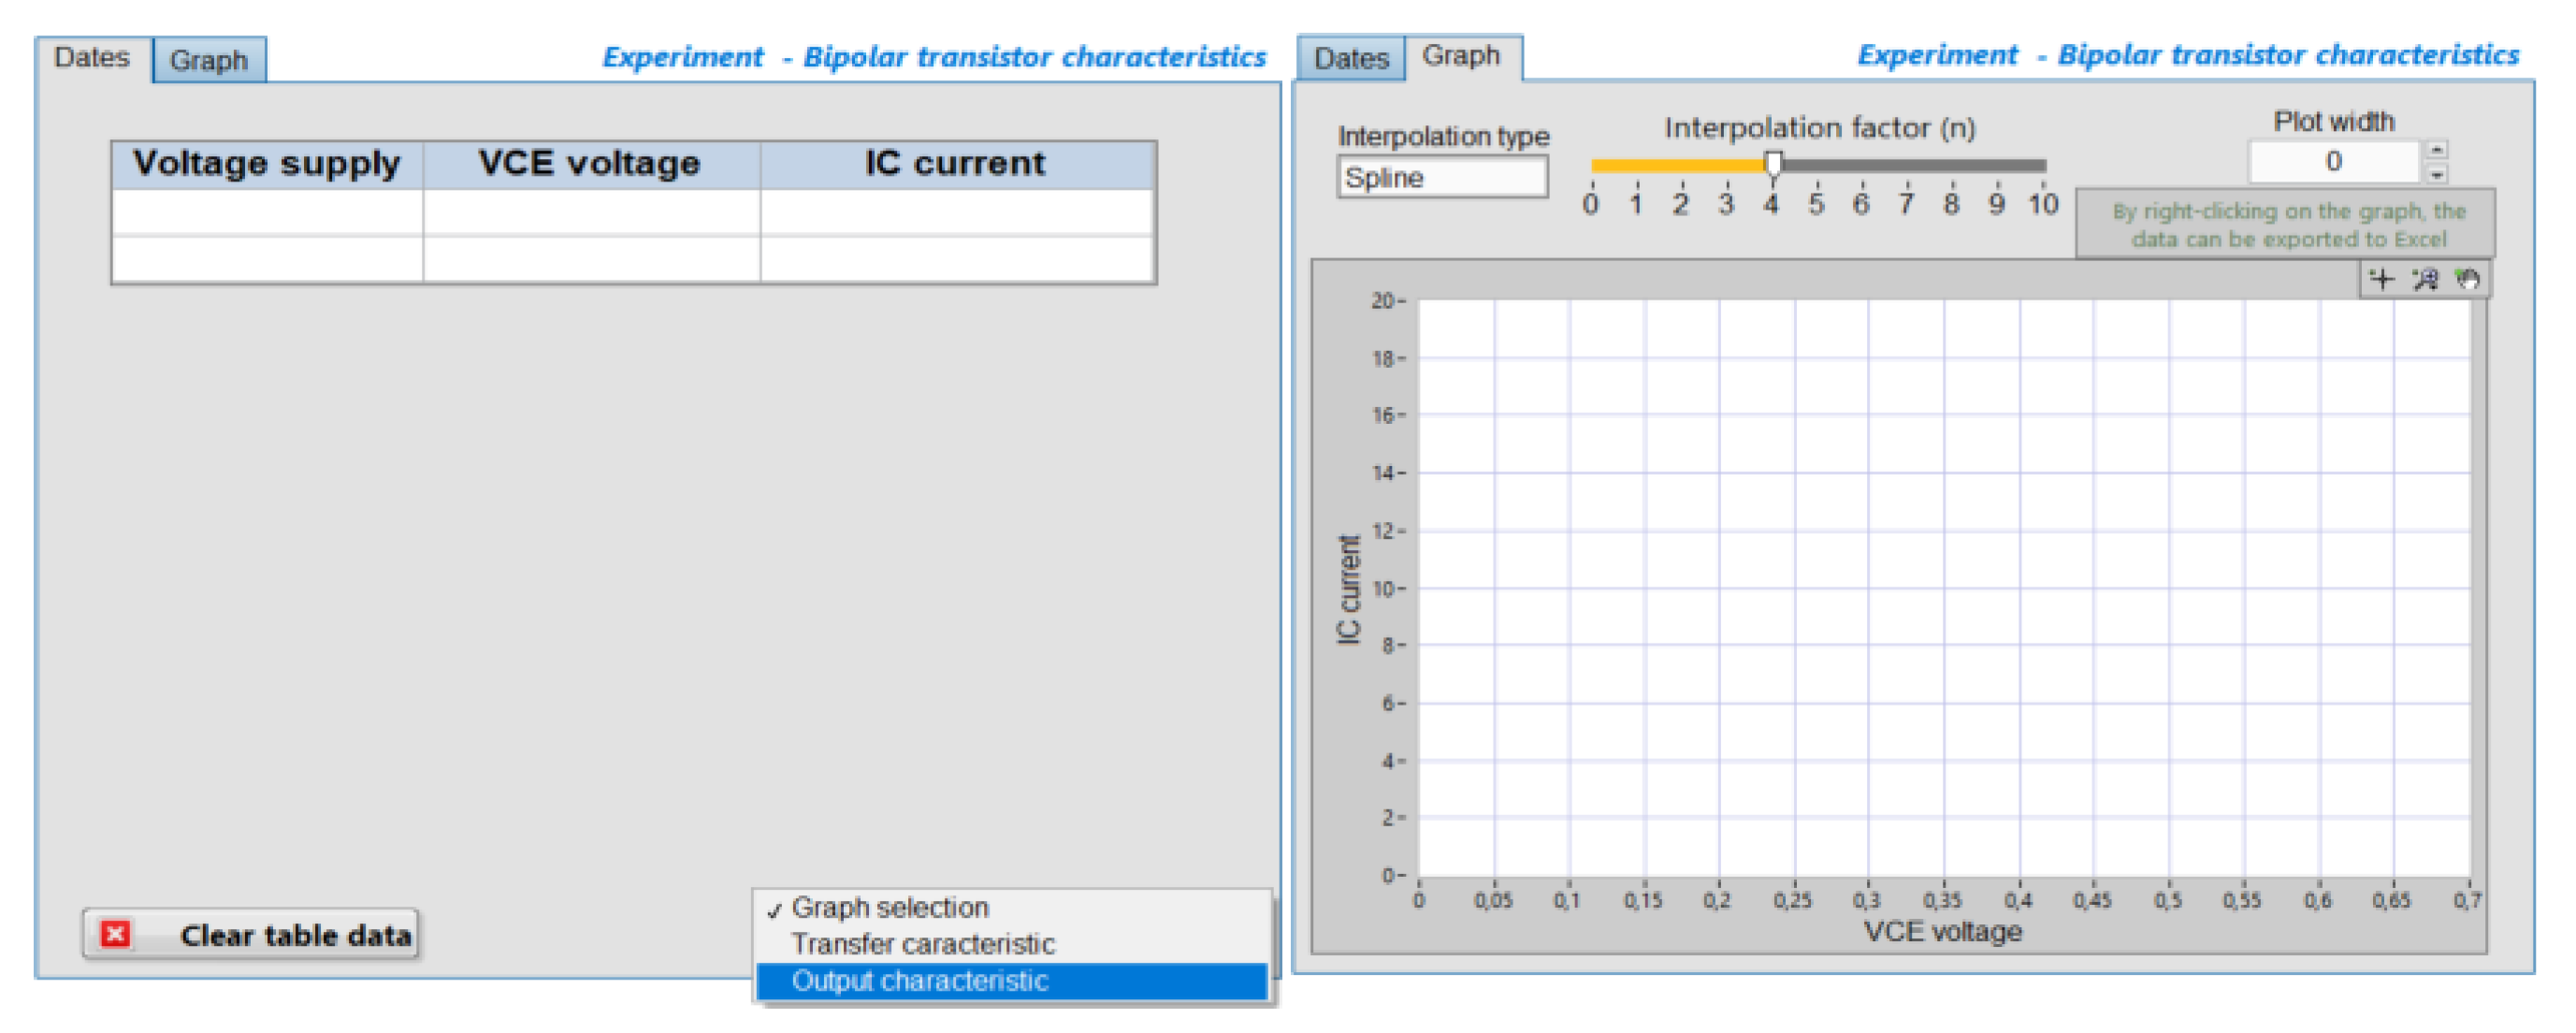
Figure 13.
Block Diagram of the VI_transistor virtual instrument.
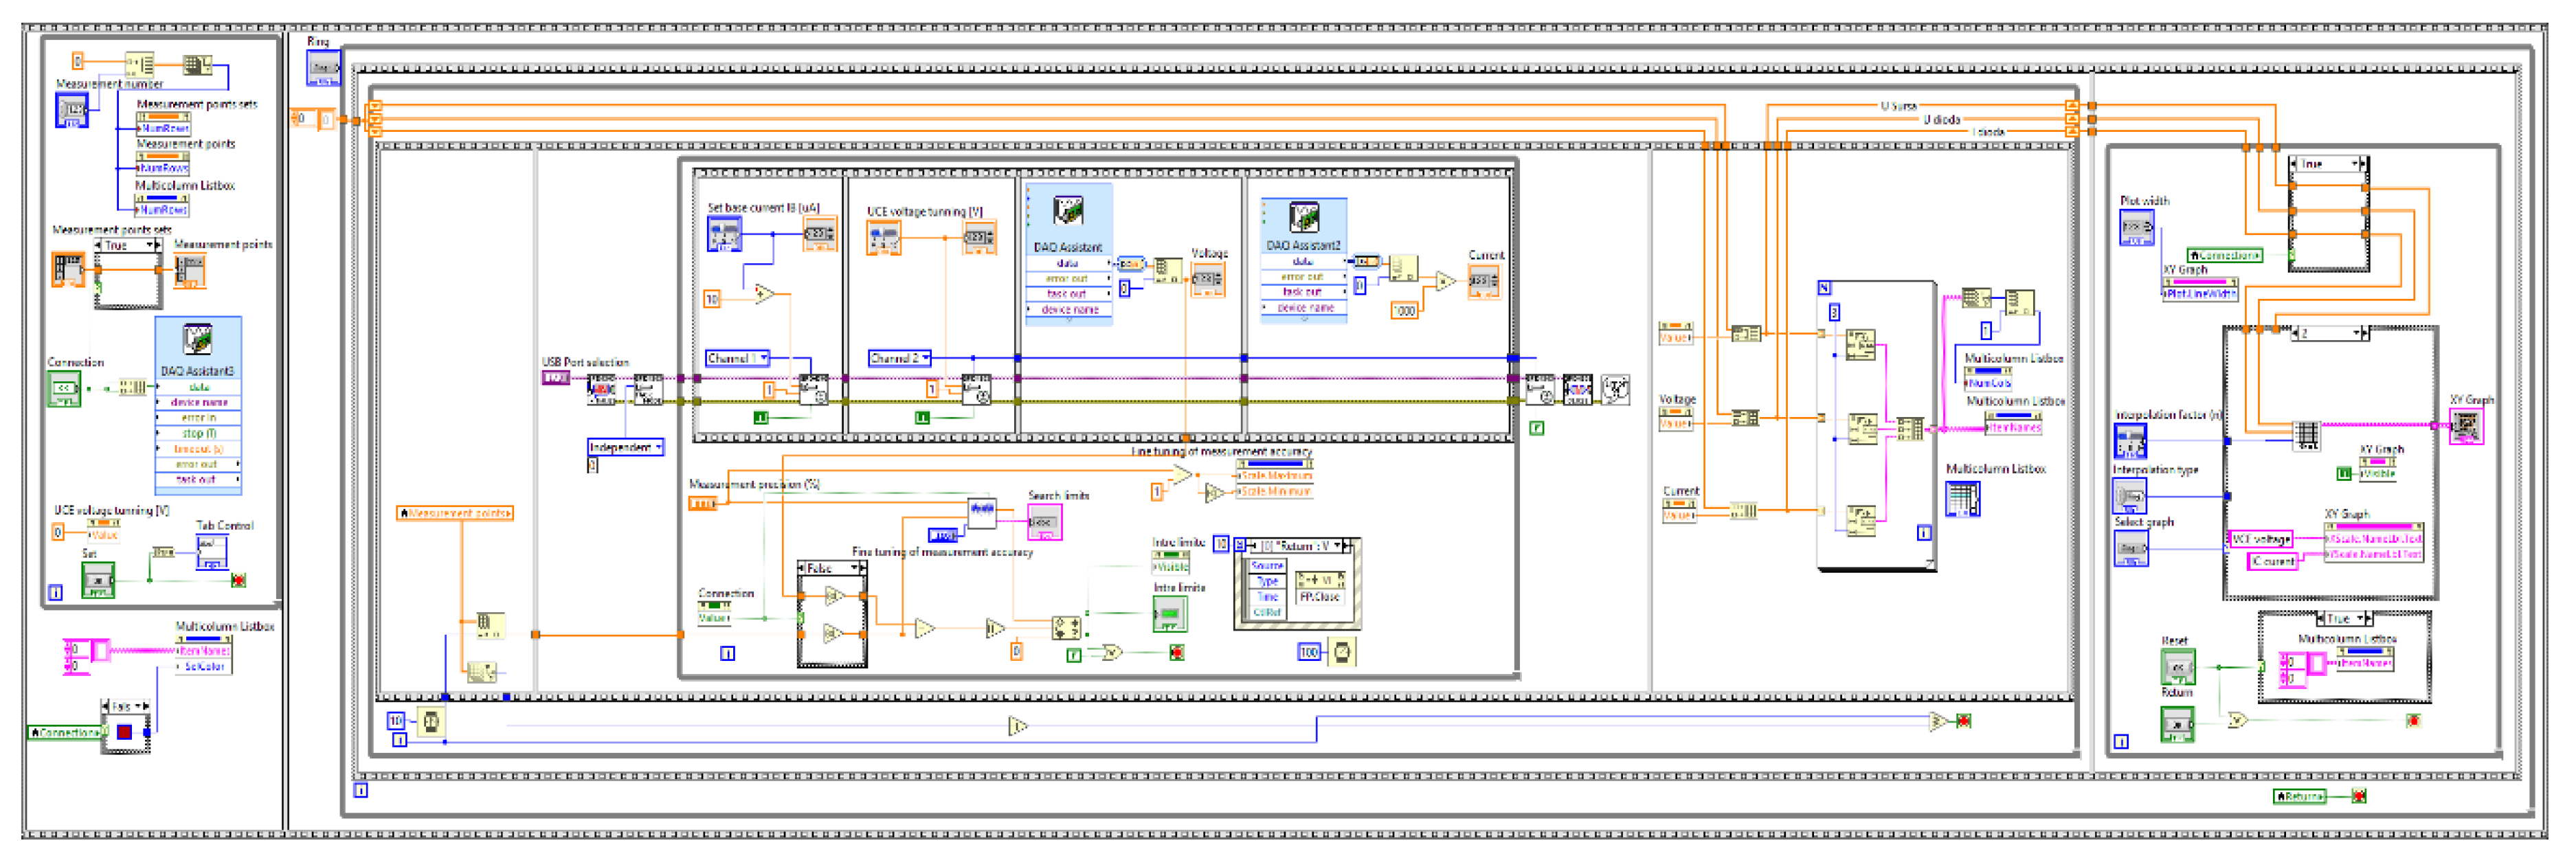
Figure 14.
Data acquired for the forward biased 1N4148 diode.
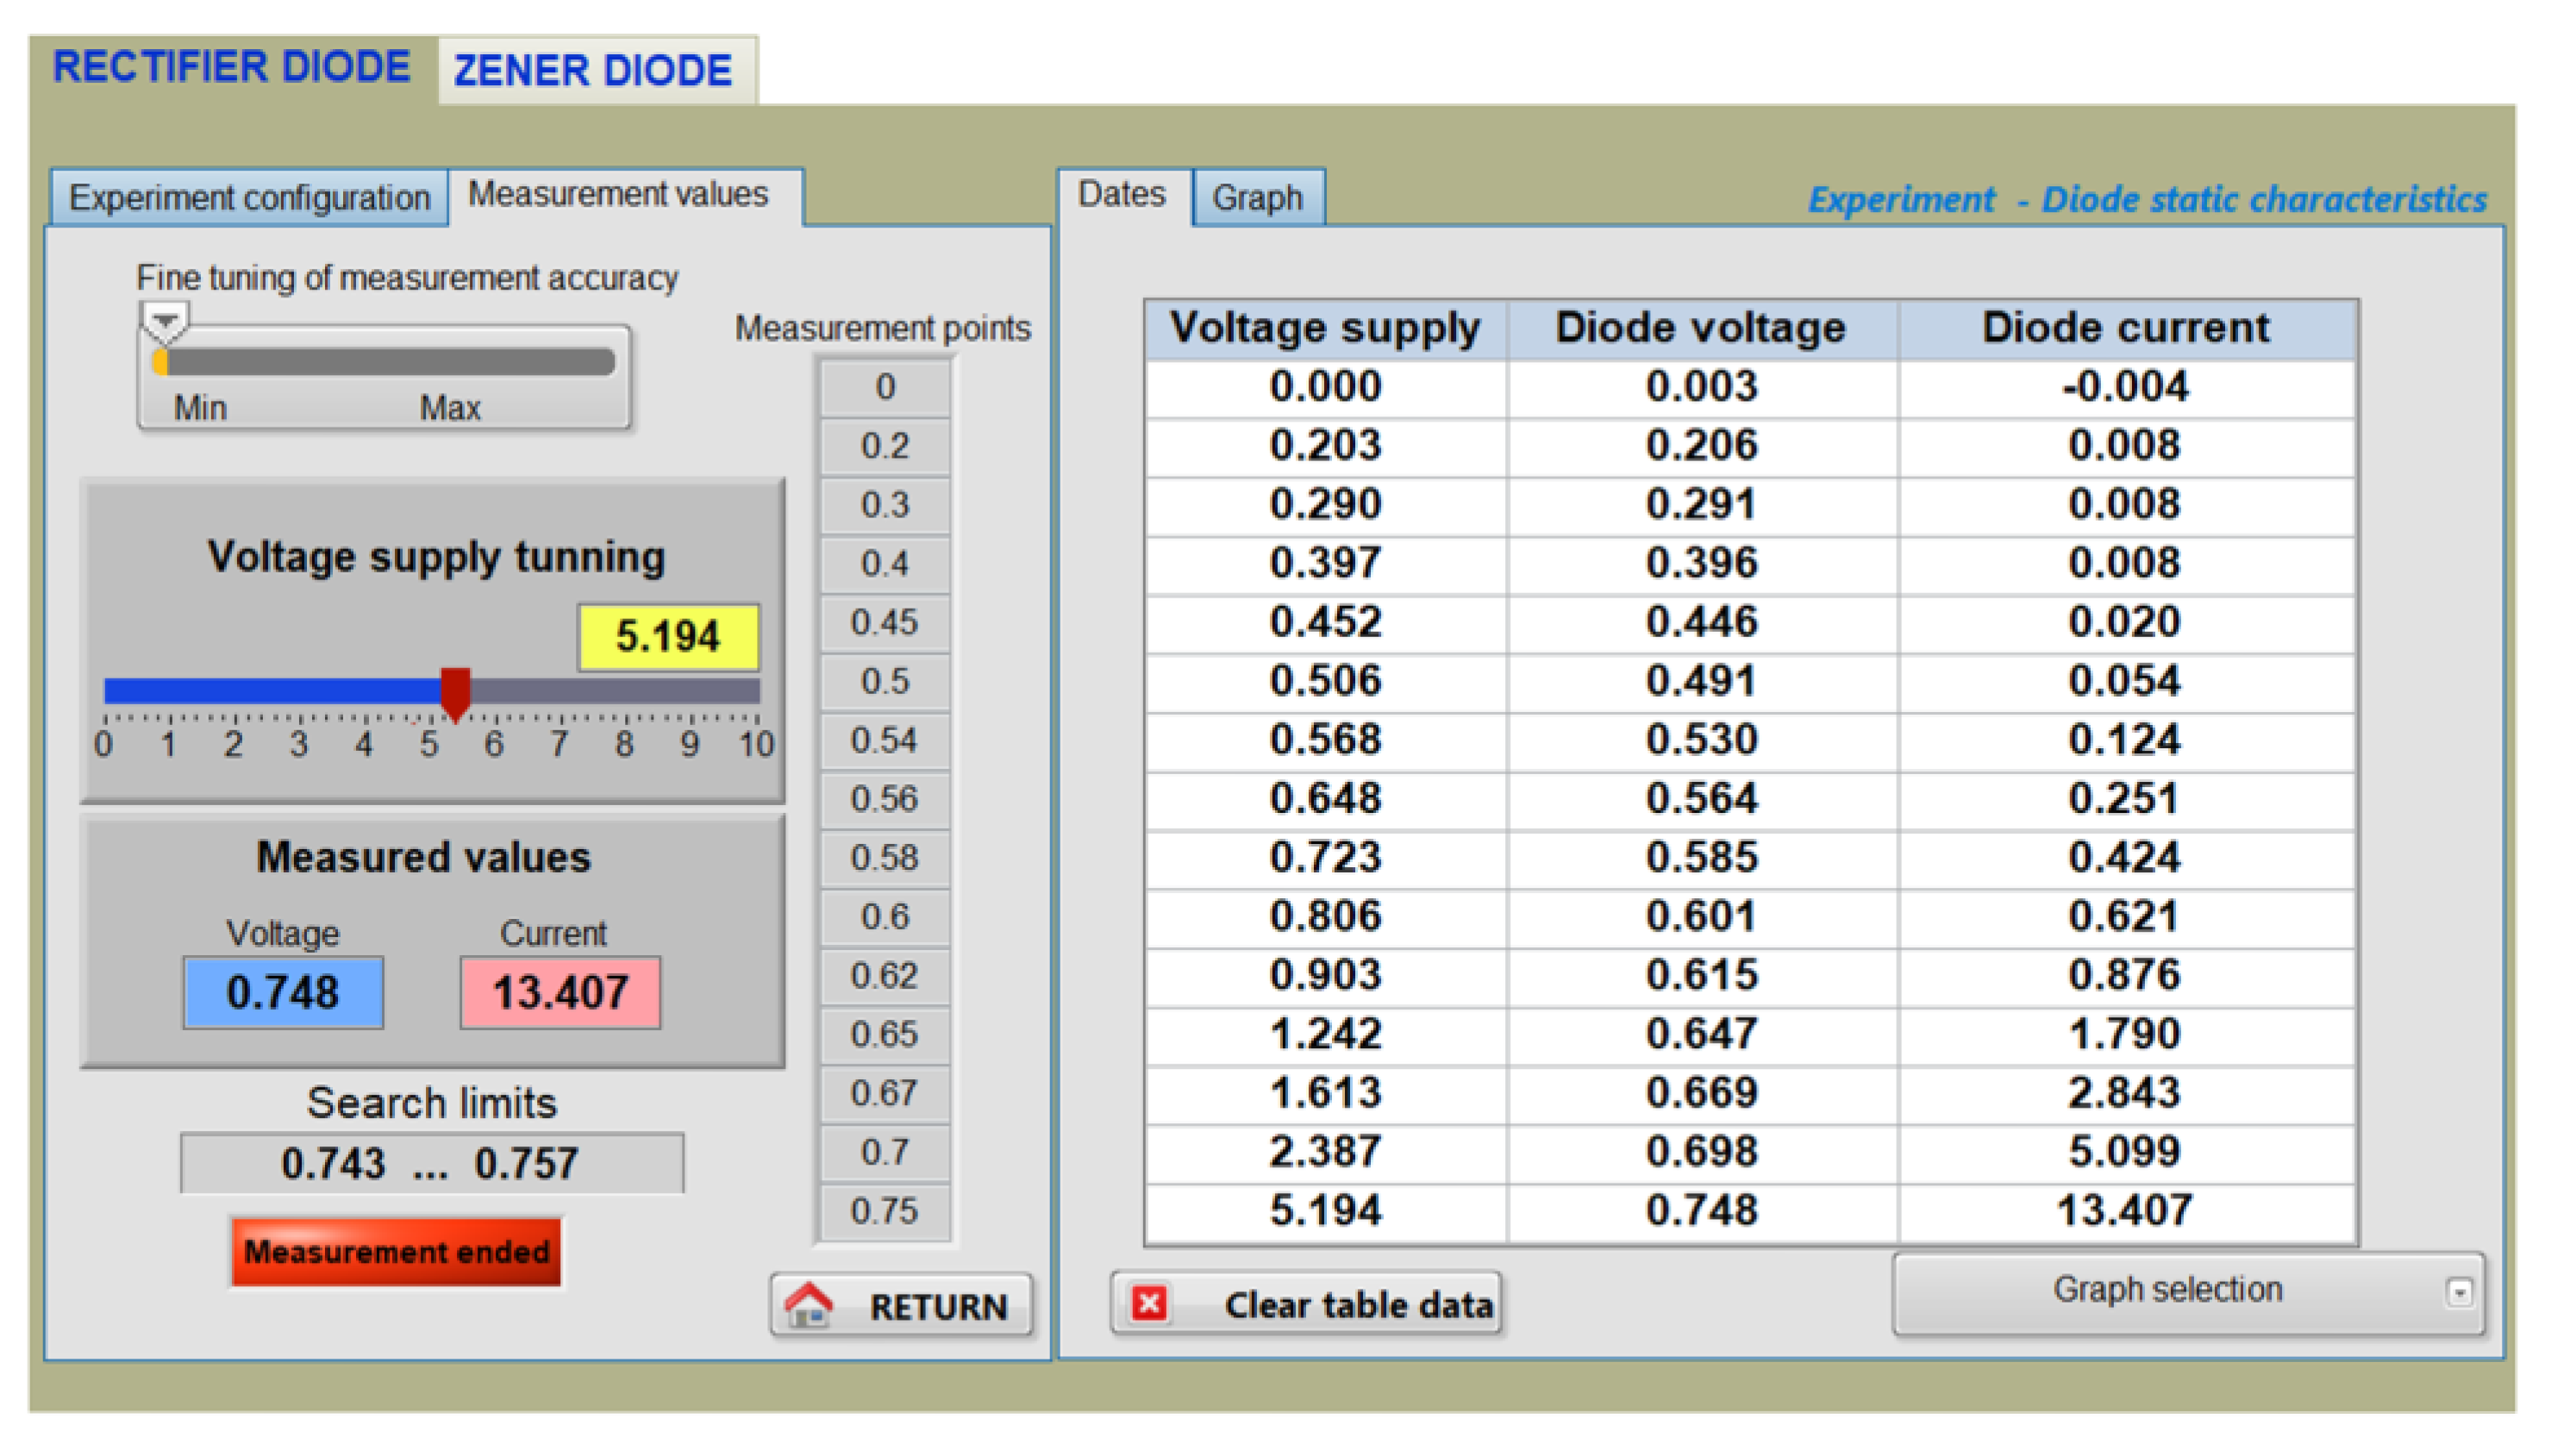
Figure 15.
I-V characteristic of the 1N4148 diode. (a) Obtained on the front panel. (b) Exported to Excel.
Figure 15.
I-V characteristic of the 1N4148 diode. (a) Obtained on the front panel. (b) Exported to Excel.
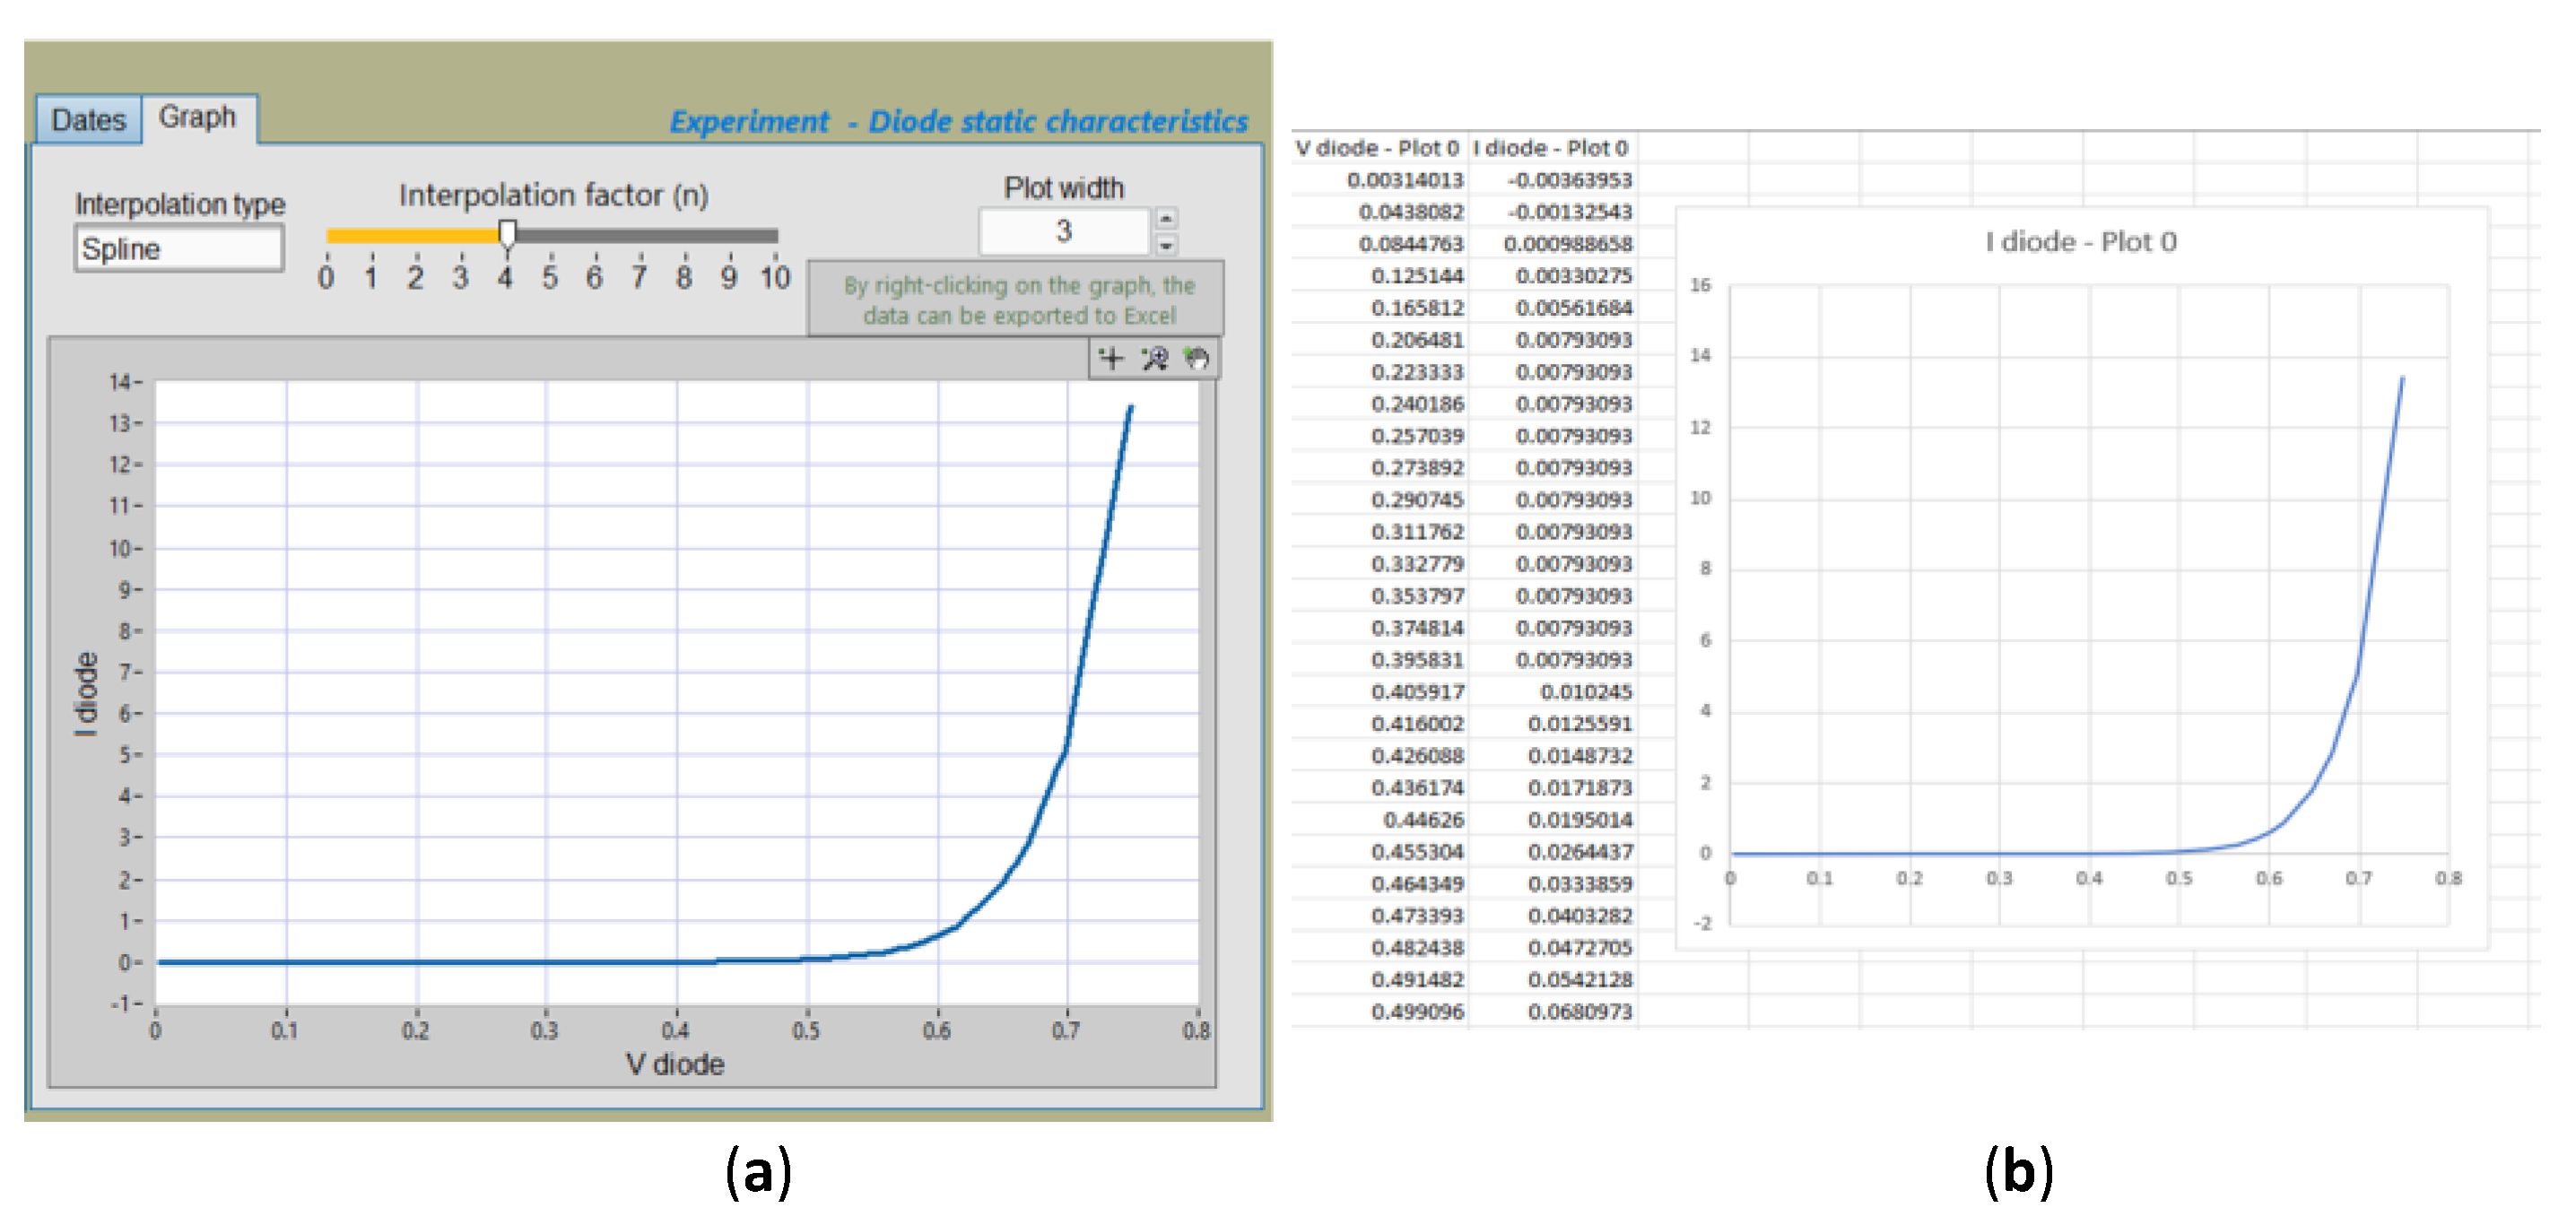
Figure 16.
Data acquired for the reverse biased BZX85C5V1 diode.
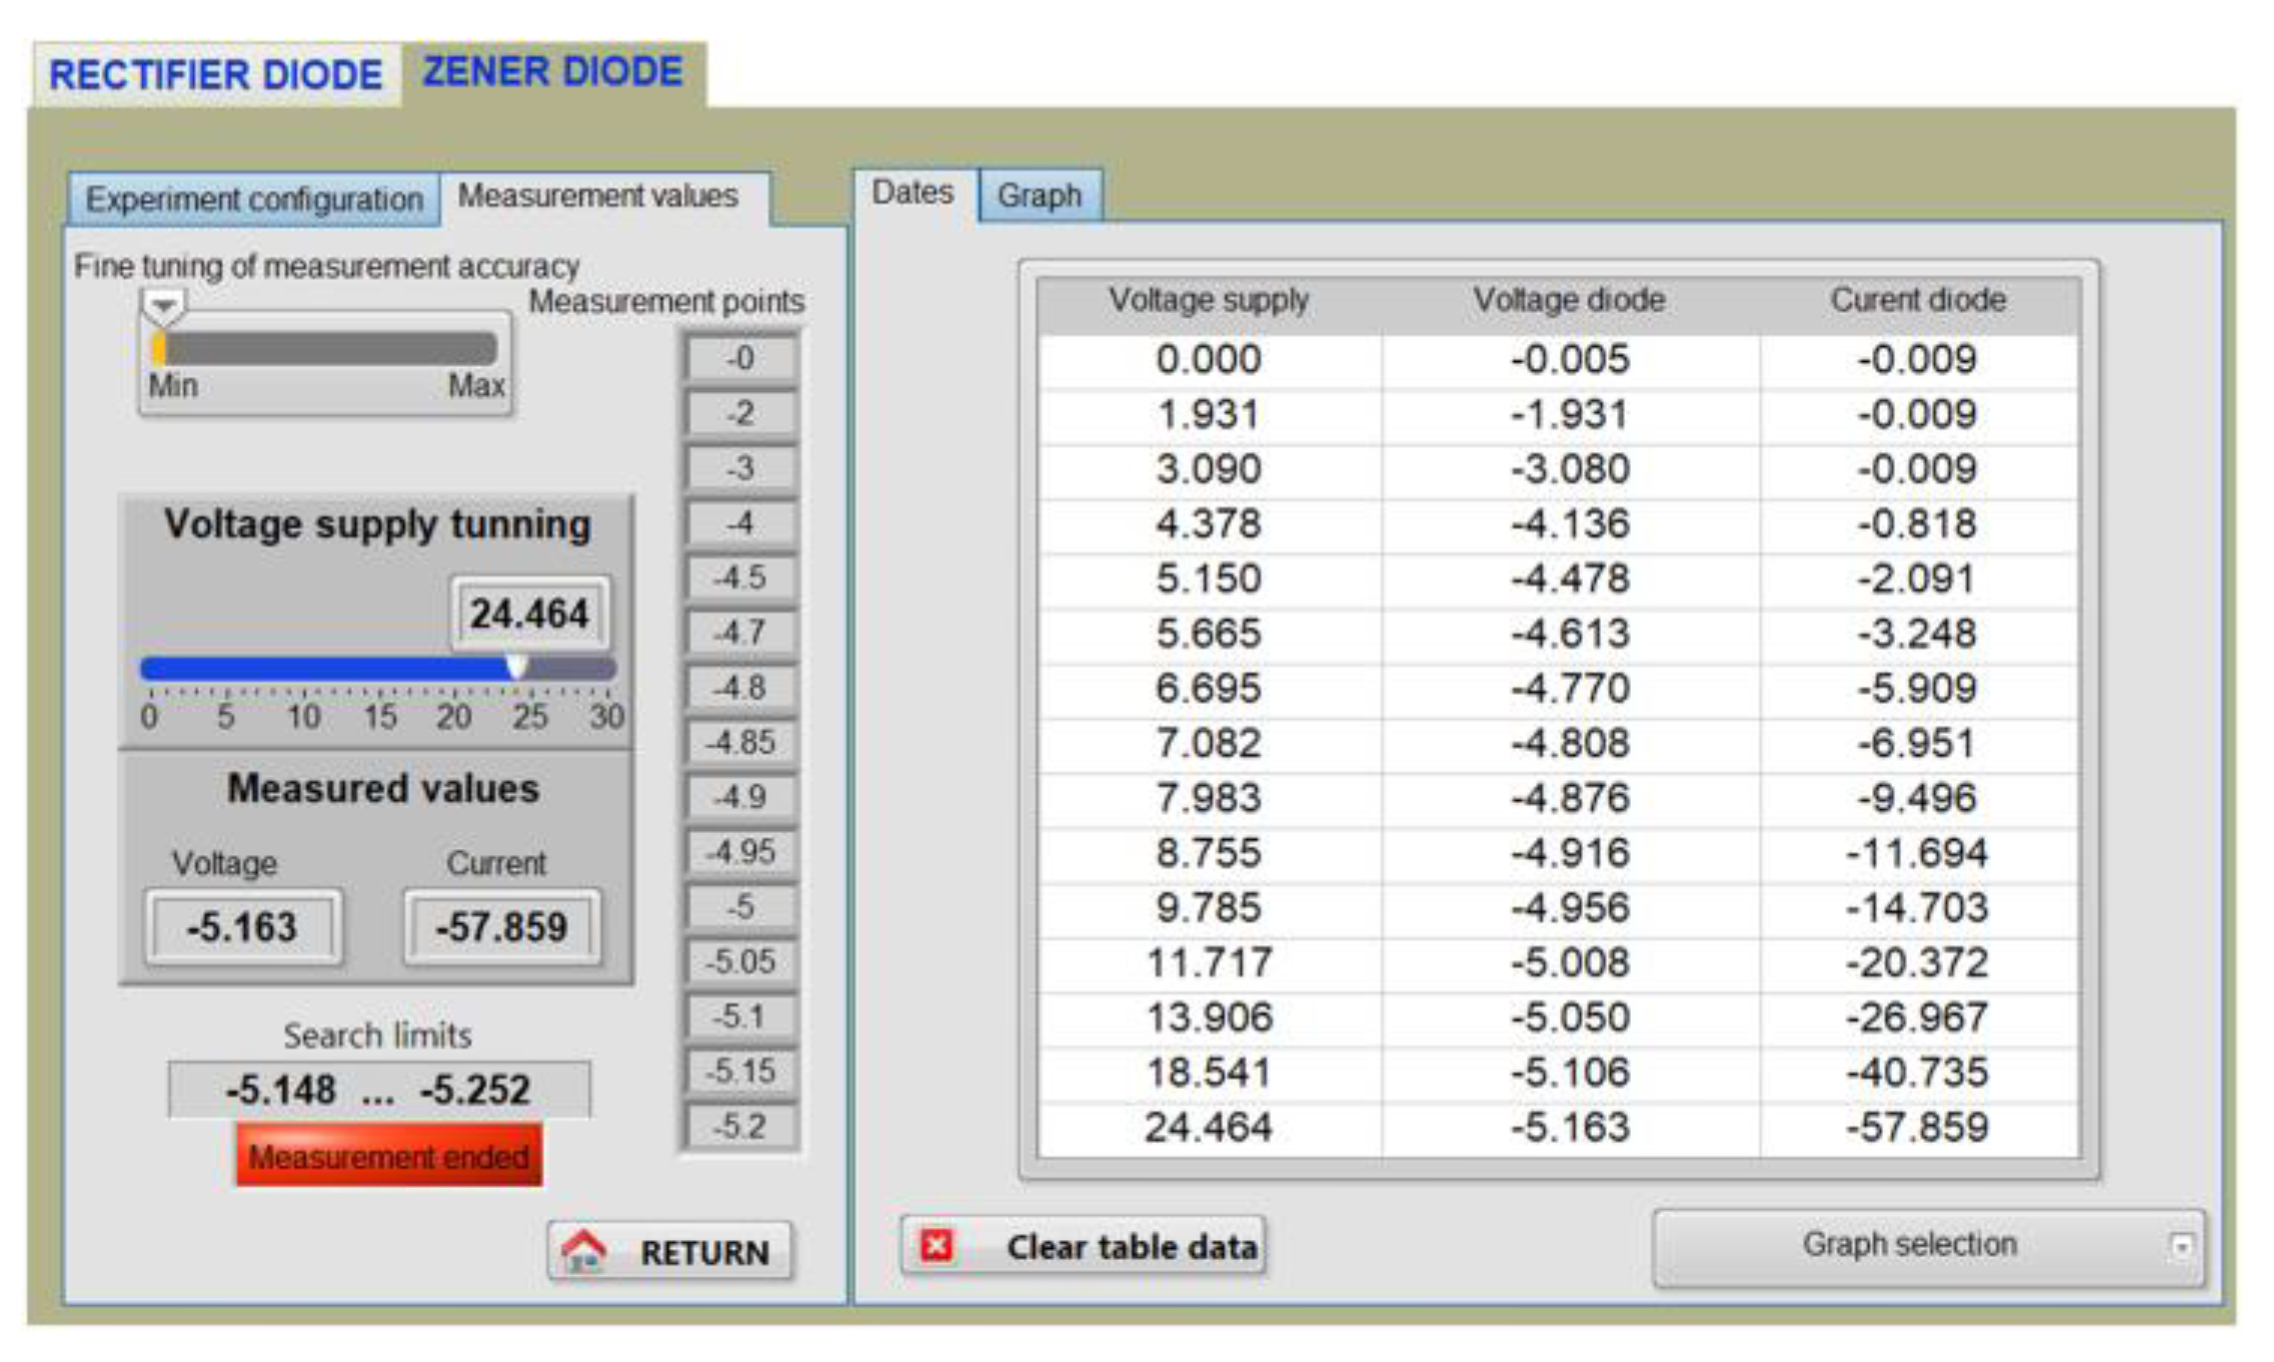
Figure 17.
Plot of the measured diode voltage (V_diode) as a function of the applied supply voltage (V_supply).
Figure 17.
Plot of the measured diode voltage (V_diode) as a function of the applied supply voltage (V_supply).
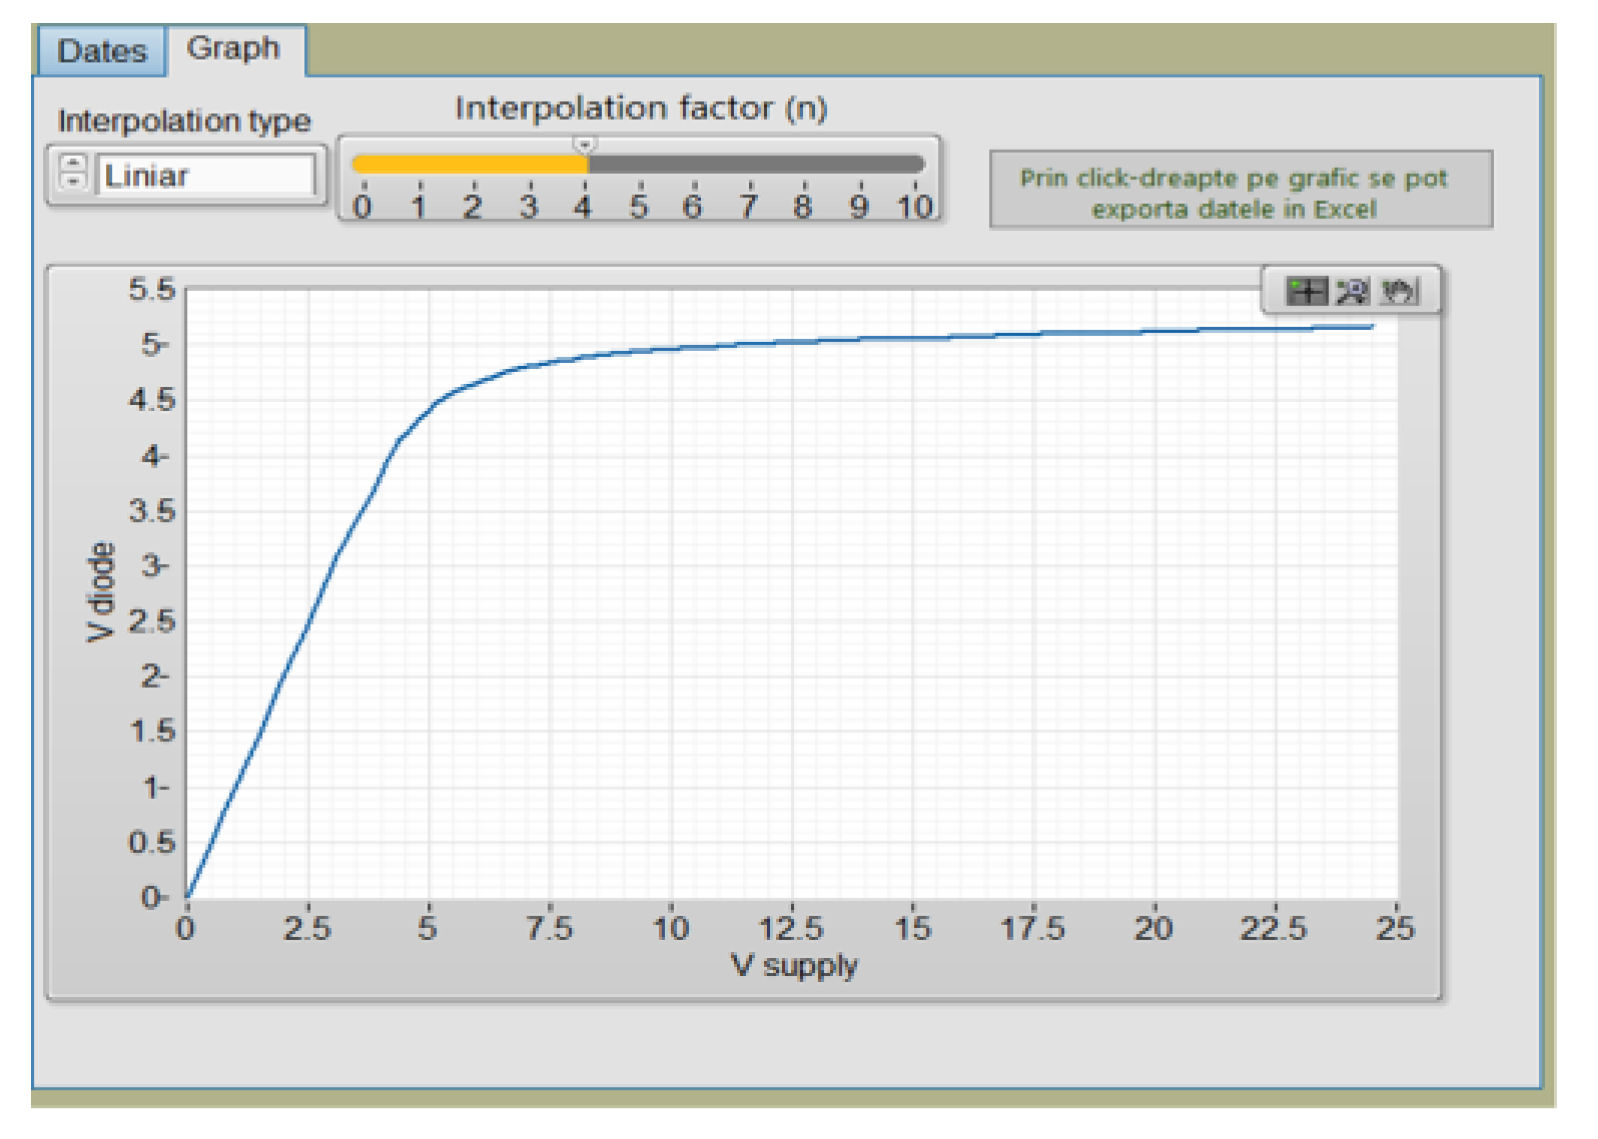
Figure 18.
I-V characteristic of the reverse biased BZX85C5V1 diode. (a) Obtained on the front panel. (b) Exported to Excel.
Figure 18.
I-V characteristic of the reverse biased BZX85C5V1 diode. (a) Obtained on the front panel. (b) Exported to Excel.
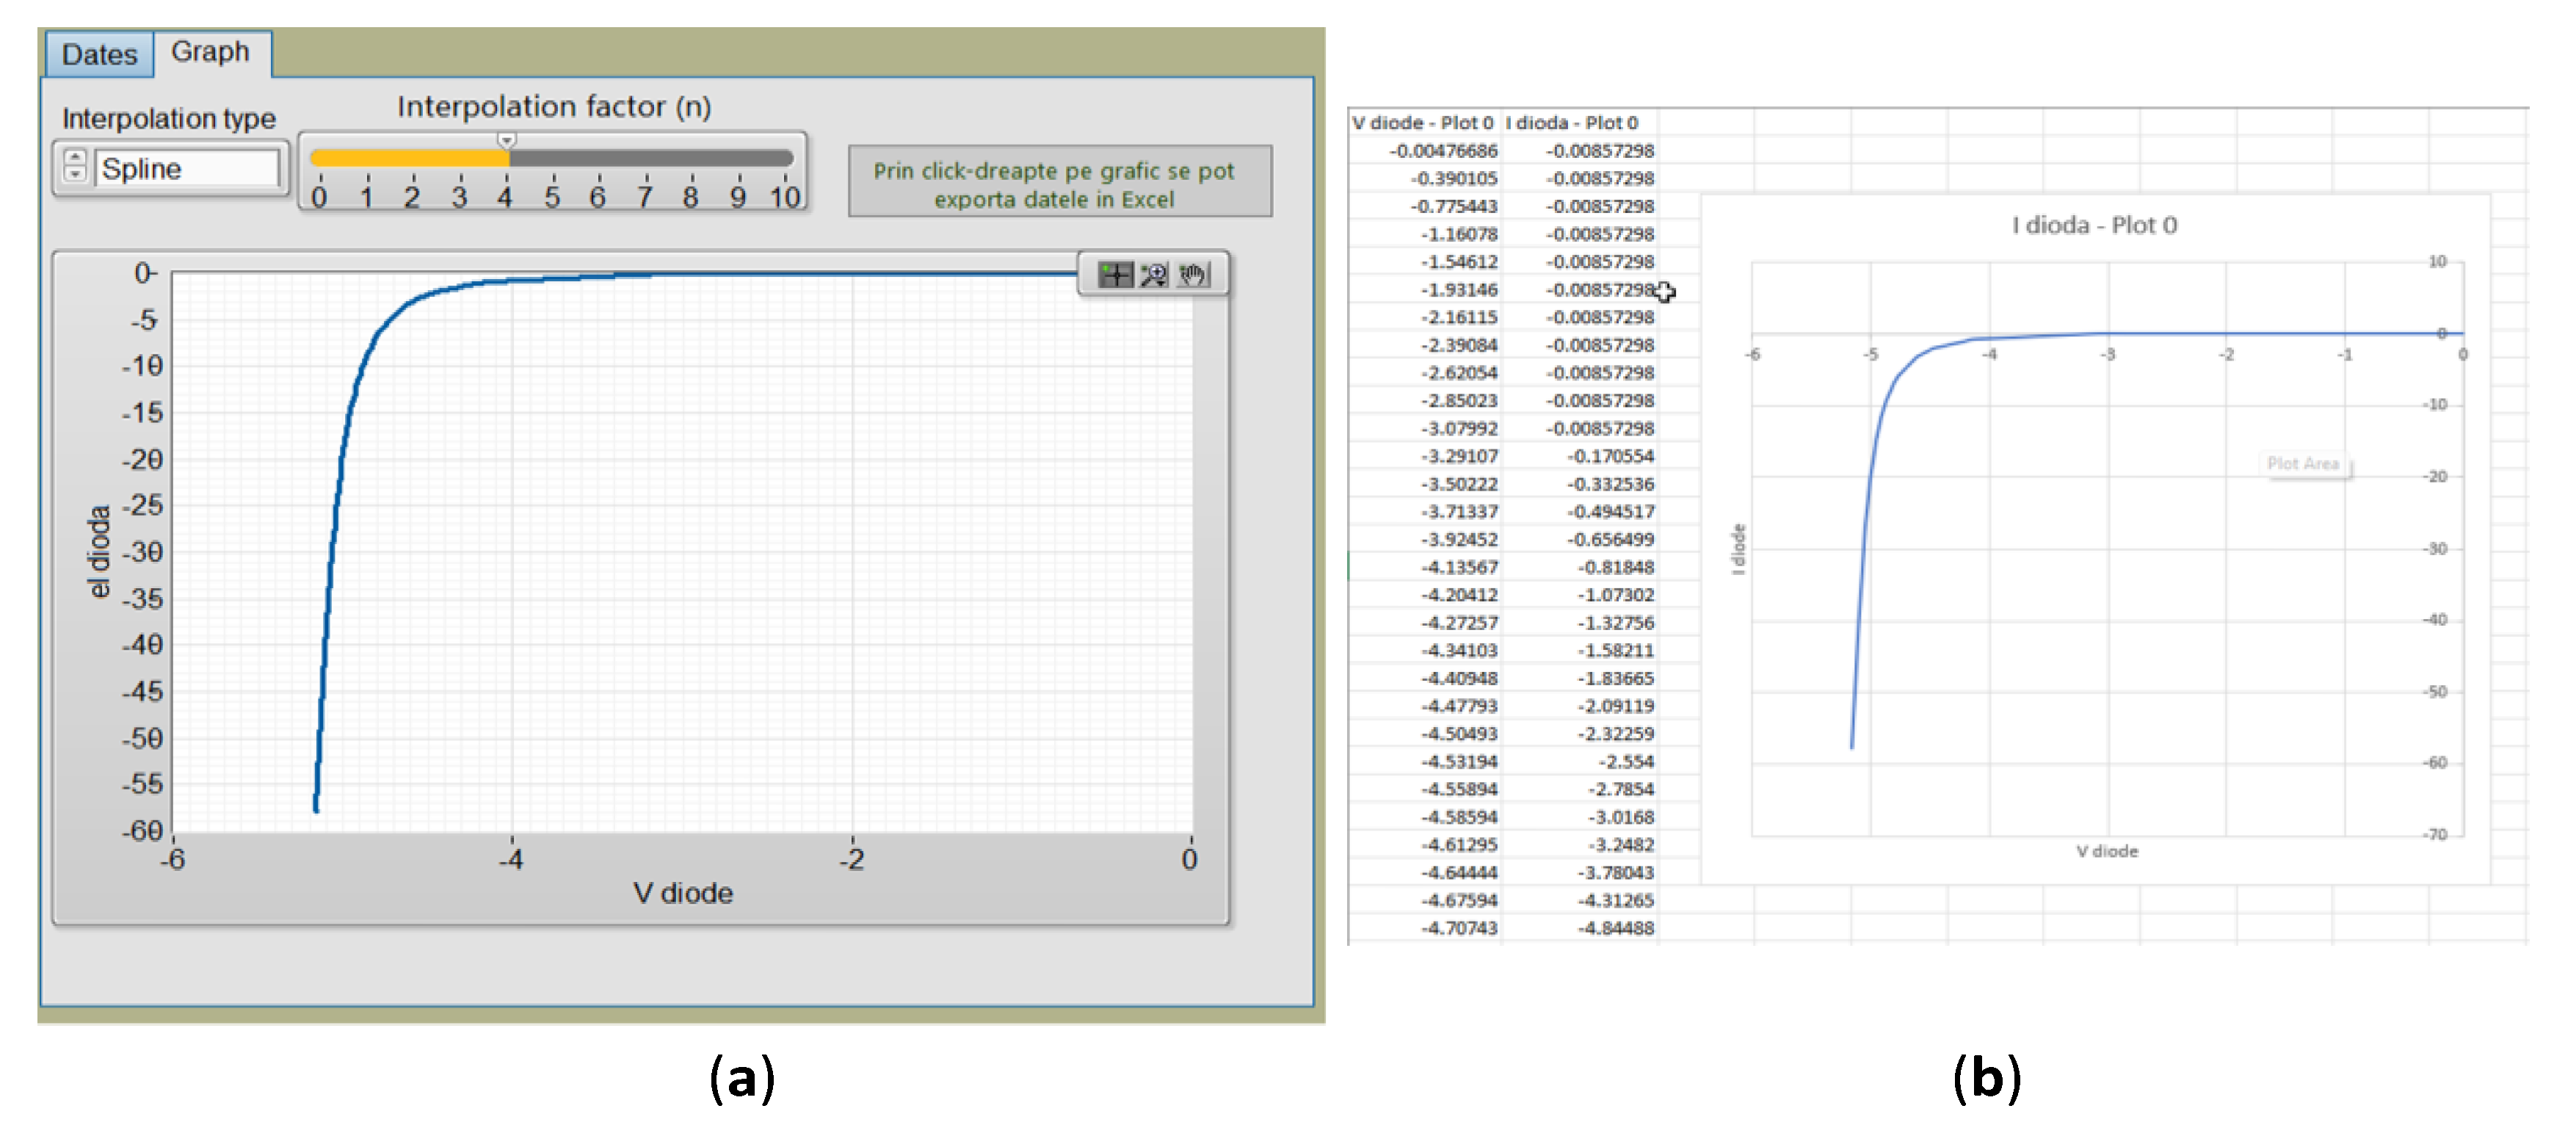
Figure 19.
I-V characteristic of the forward biased BZX85C5V1 diode. (a) Obtained on the front panel. (b) Exported to Excel.
Figure 19.
I-V characteristic of the forward biased BZX85C5V1 diode. (a) Obtained on the front panel. (b) Exported to Excel.
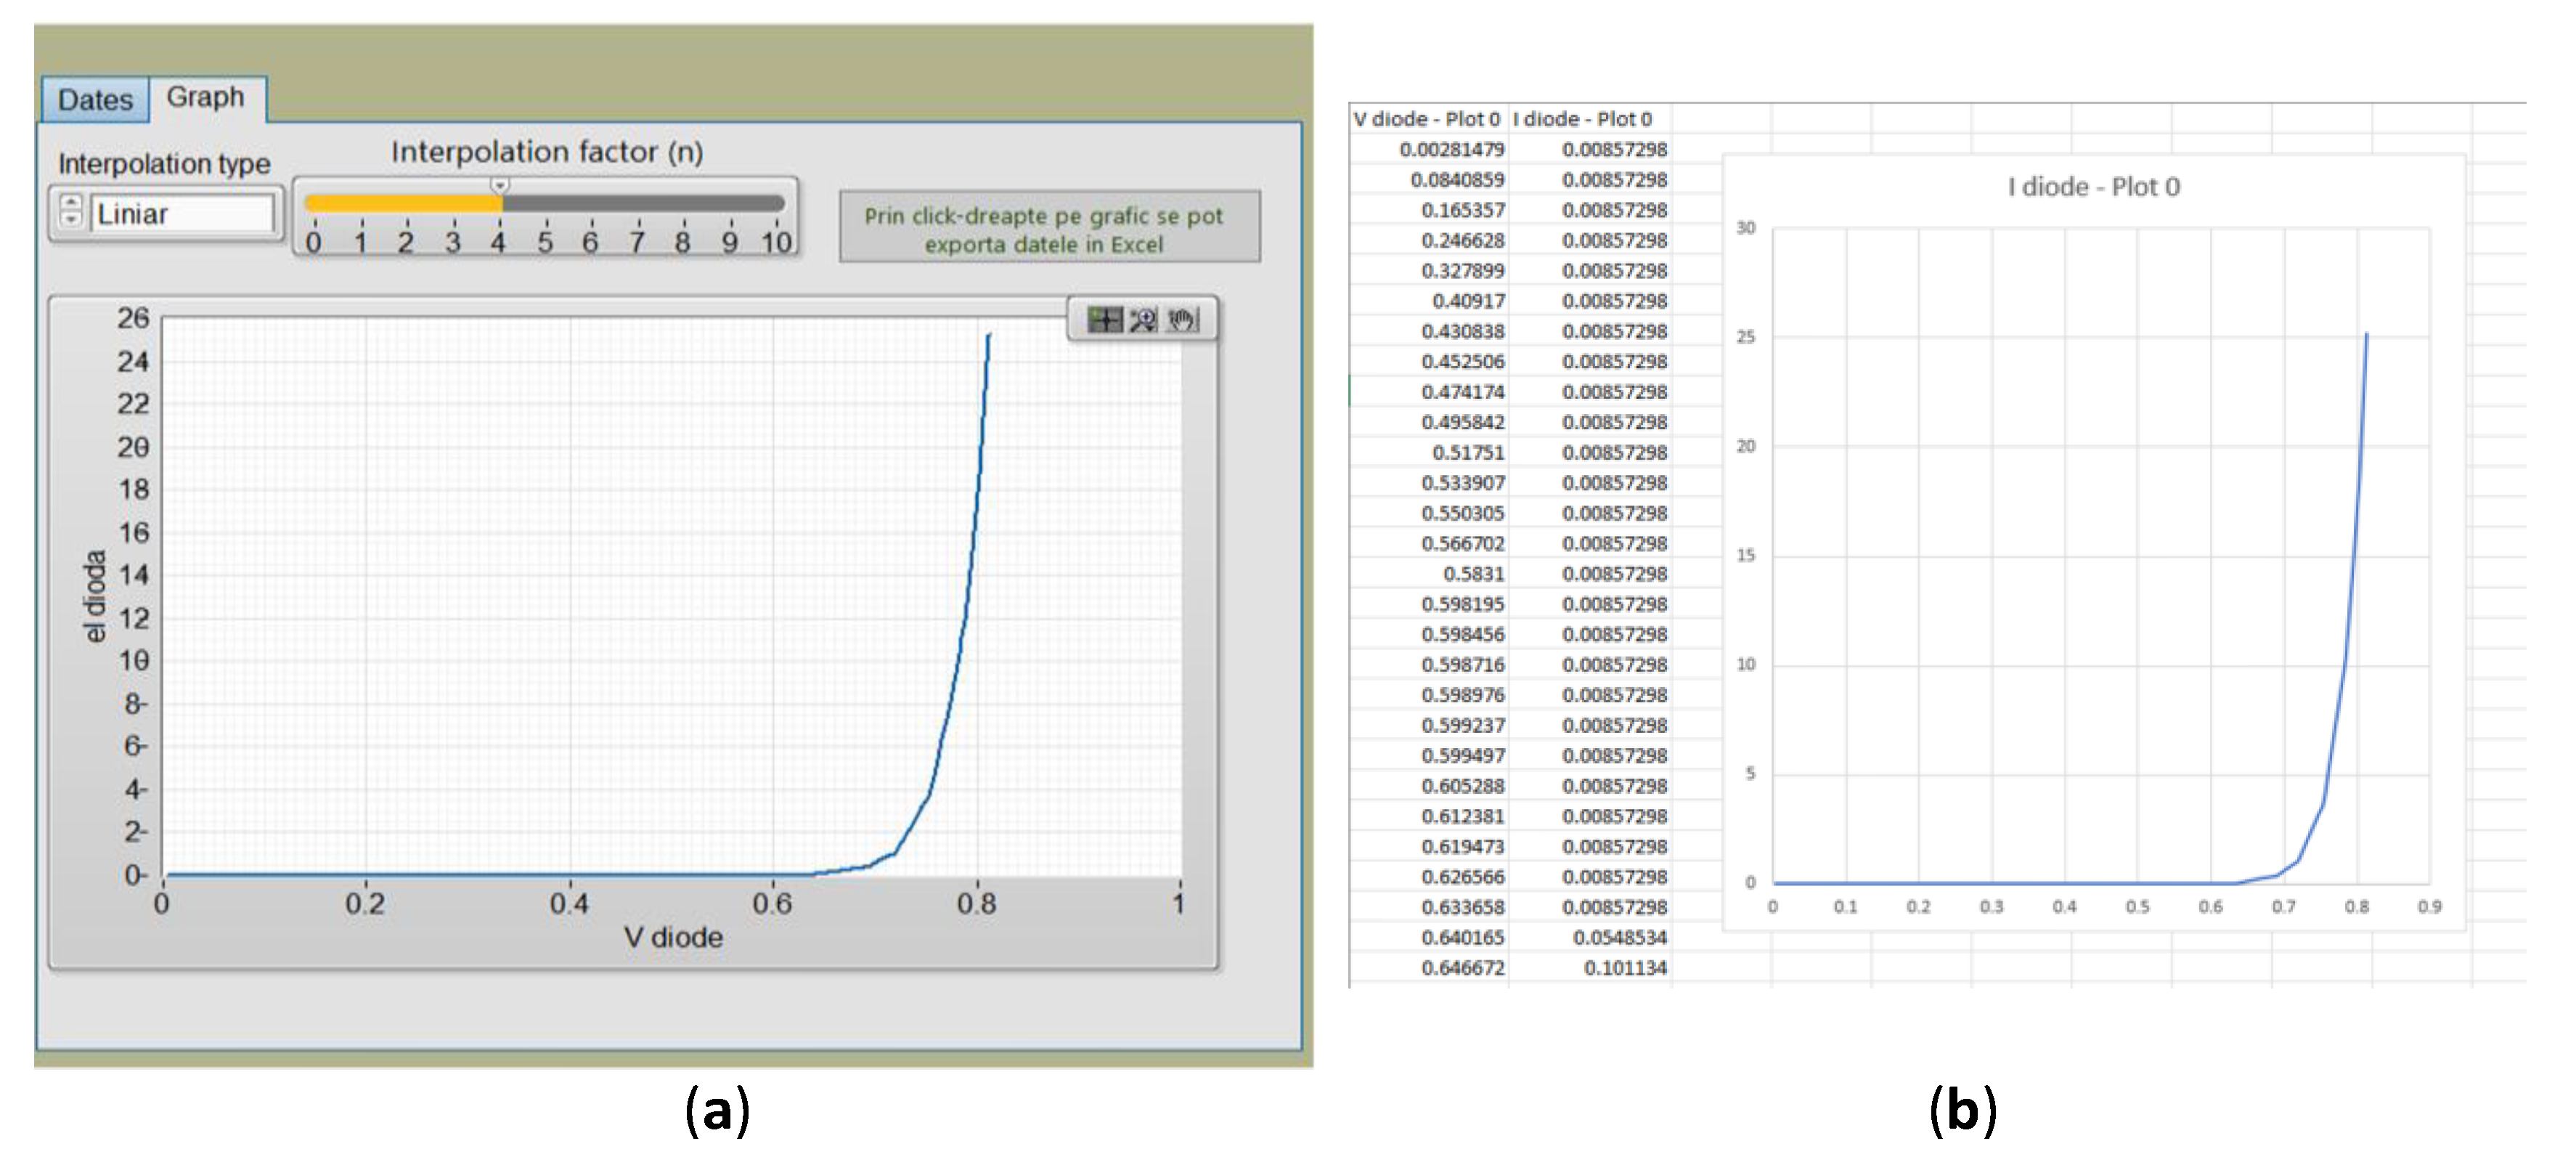
Figure 20.
Exported I-V characteristics of the BZX85C5V1 diode illustrating operation in the first and third quadrants.
Figure 20.
Exported I-V characteristics of the BZX85C5V1 diode illustrating operation in the first and third quadrants.
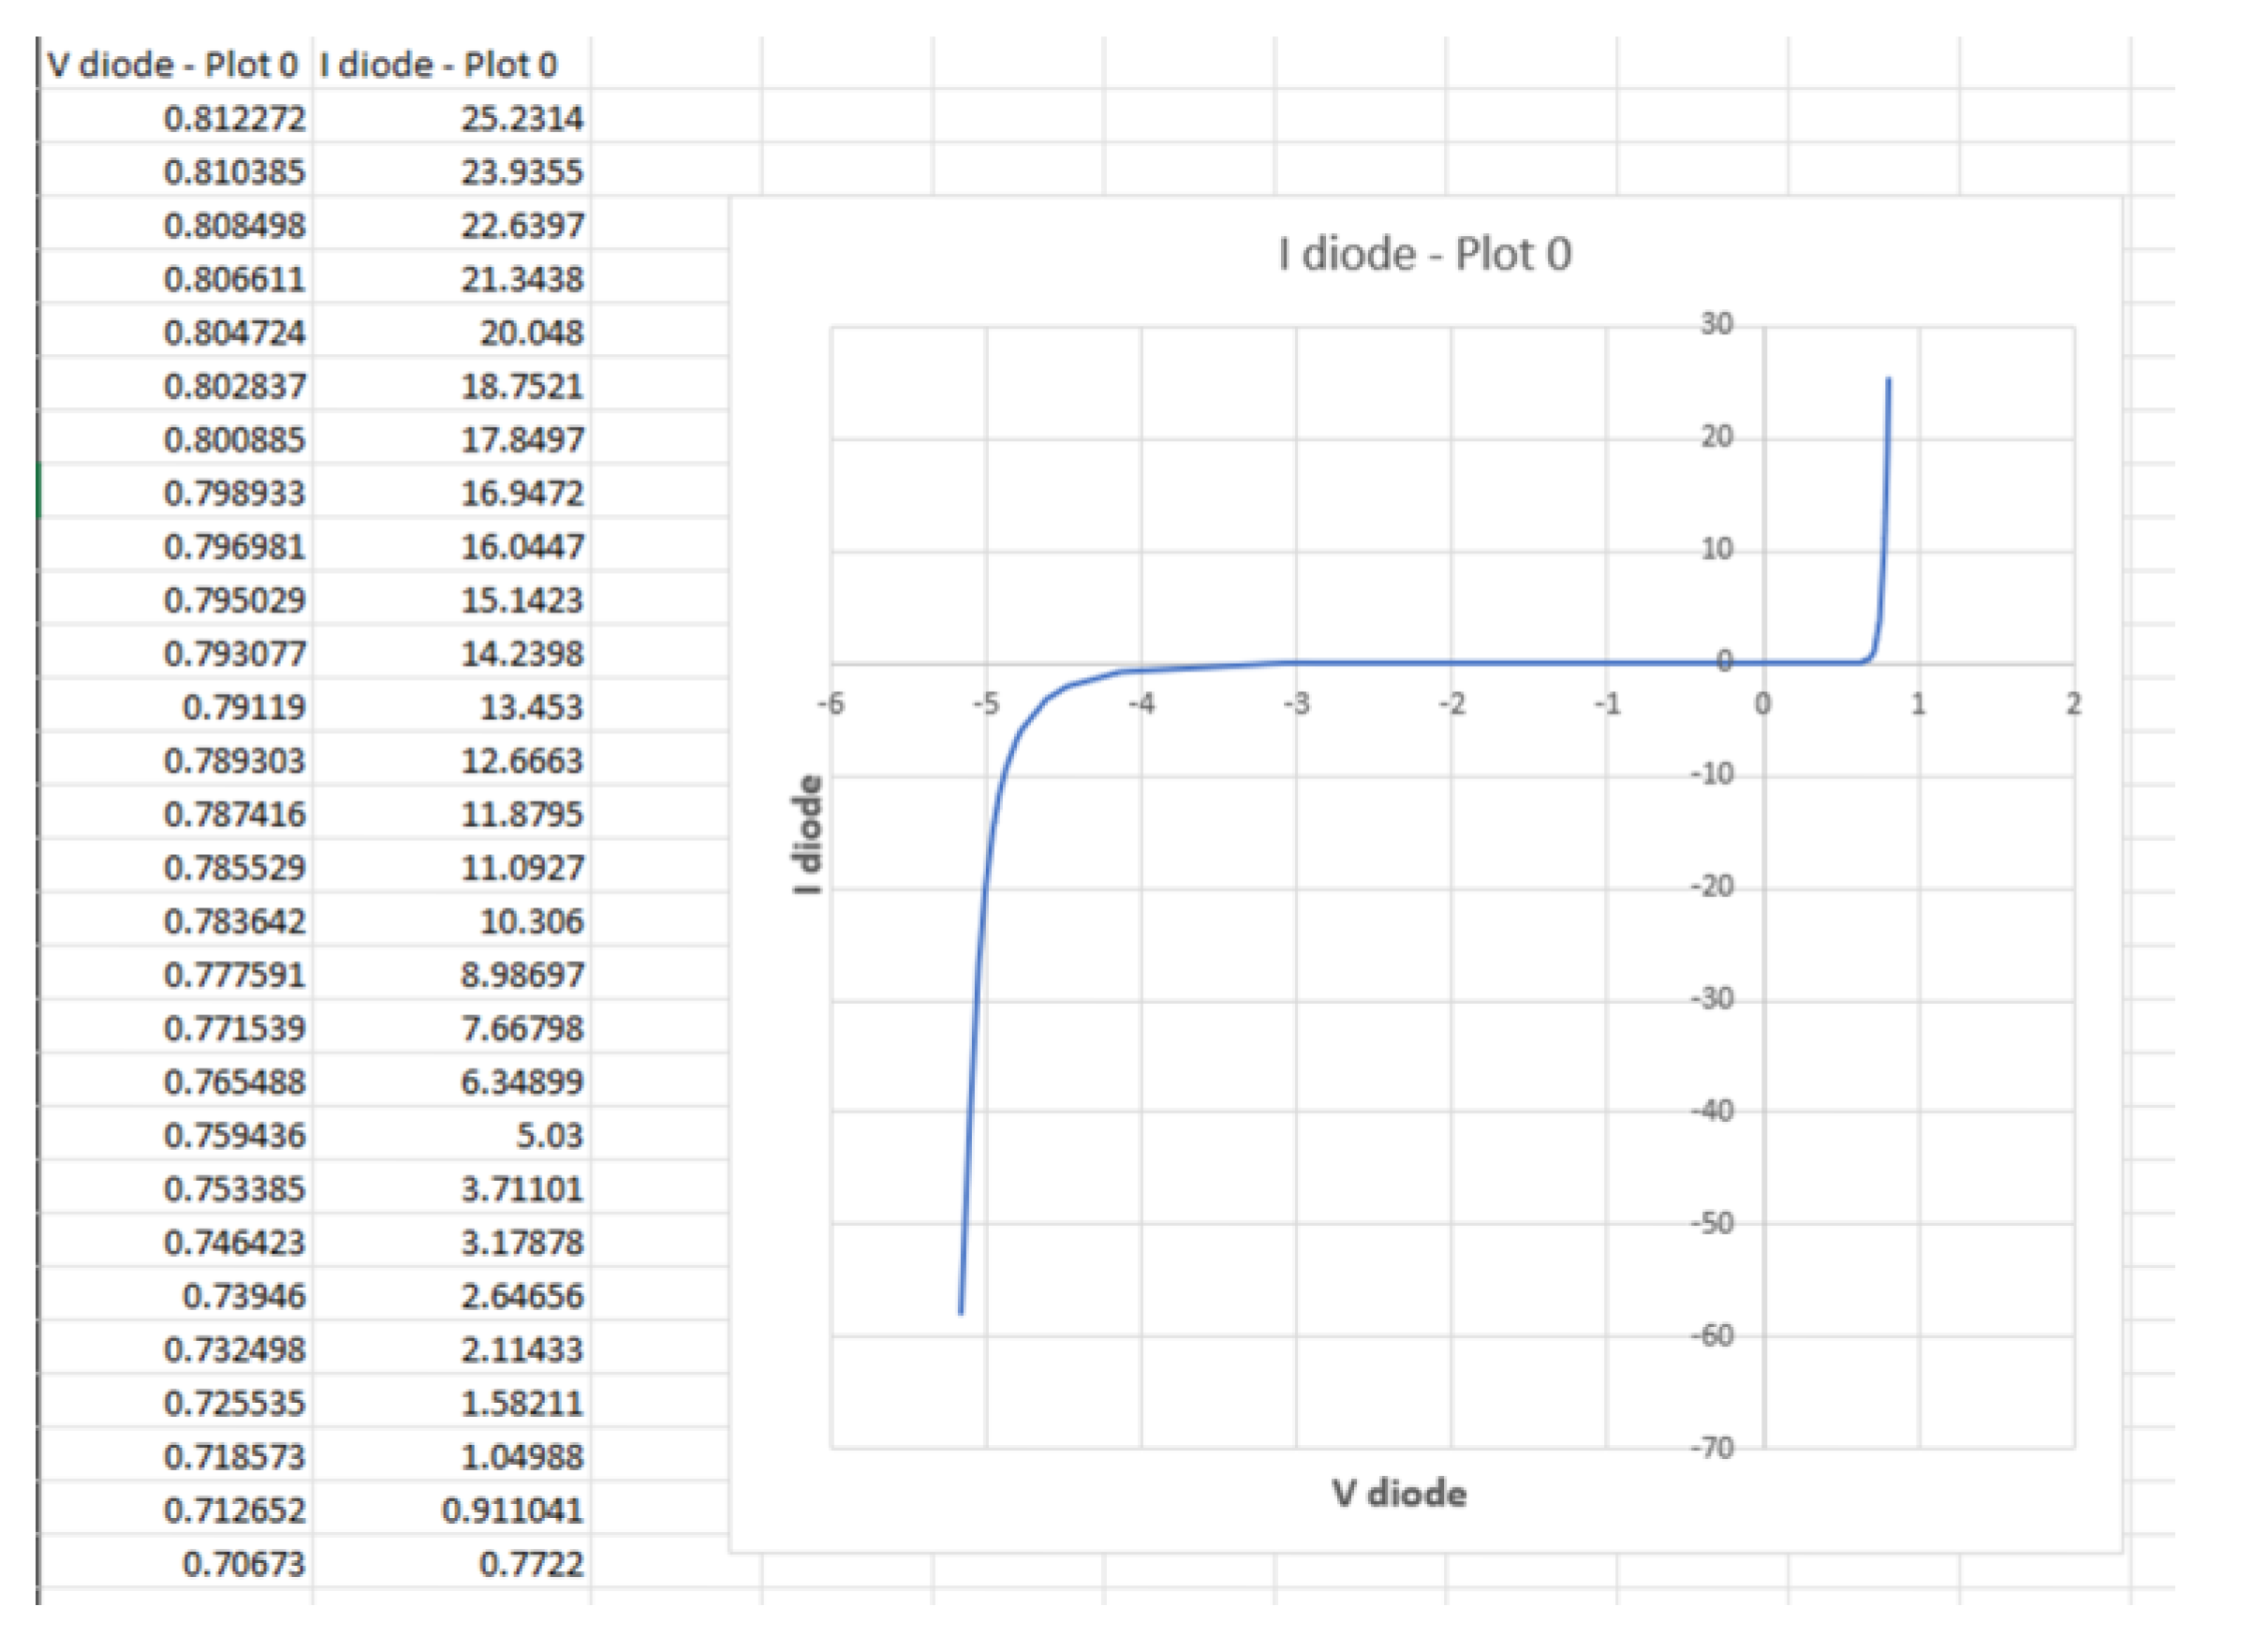
Figure 21.
The output characteristic ( for the 2N2222 BJT, obtained at .
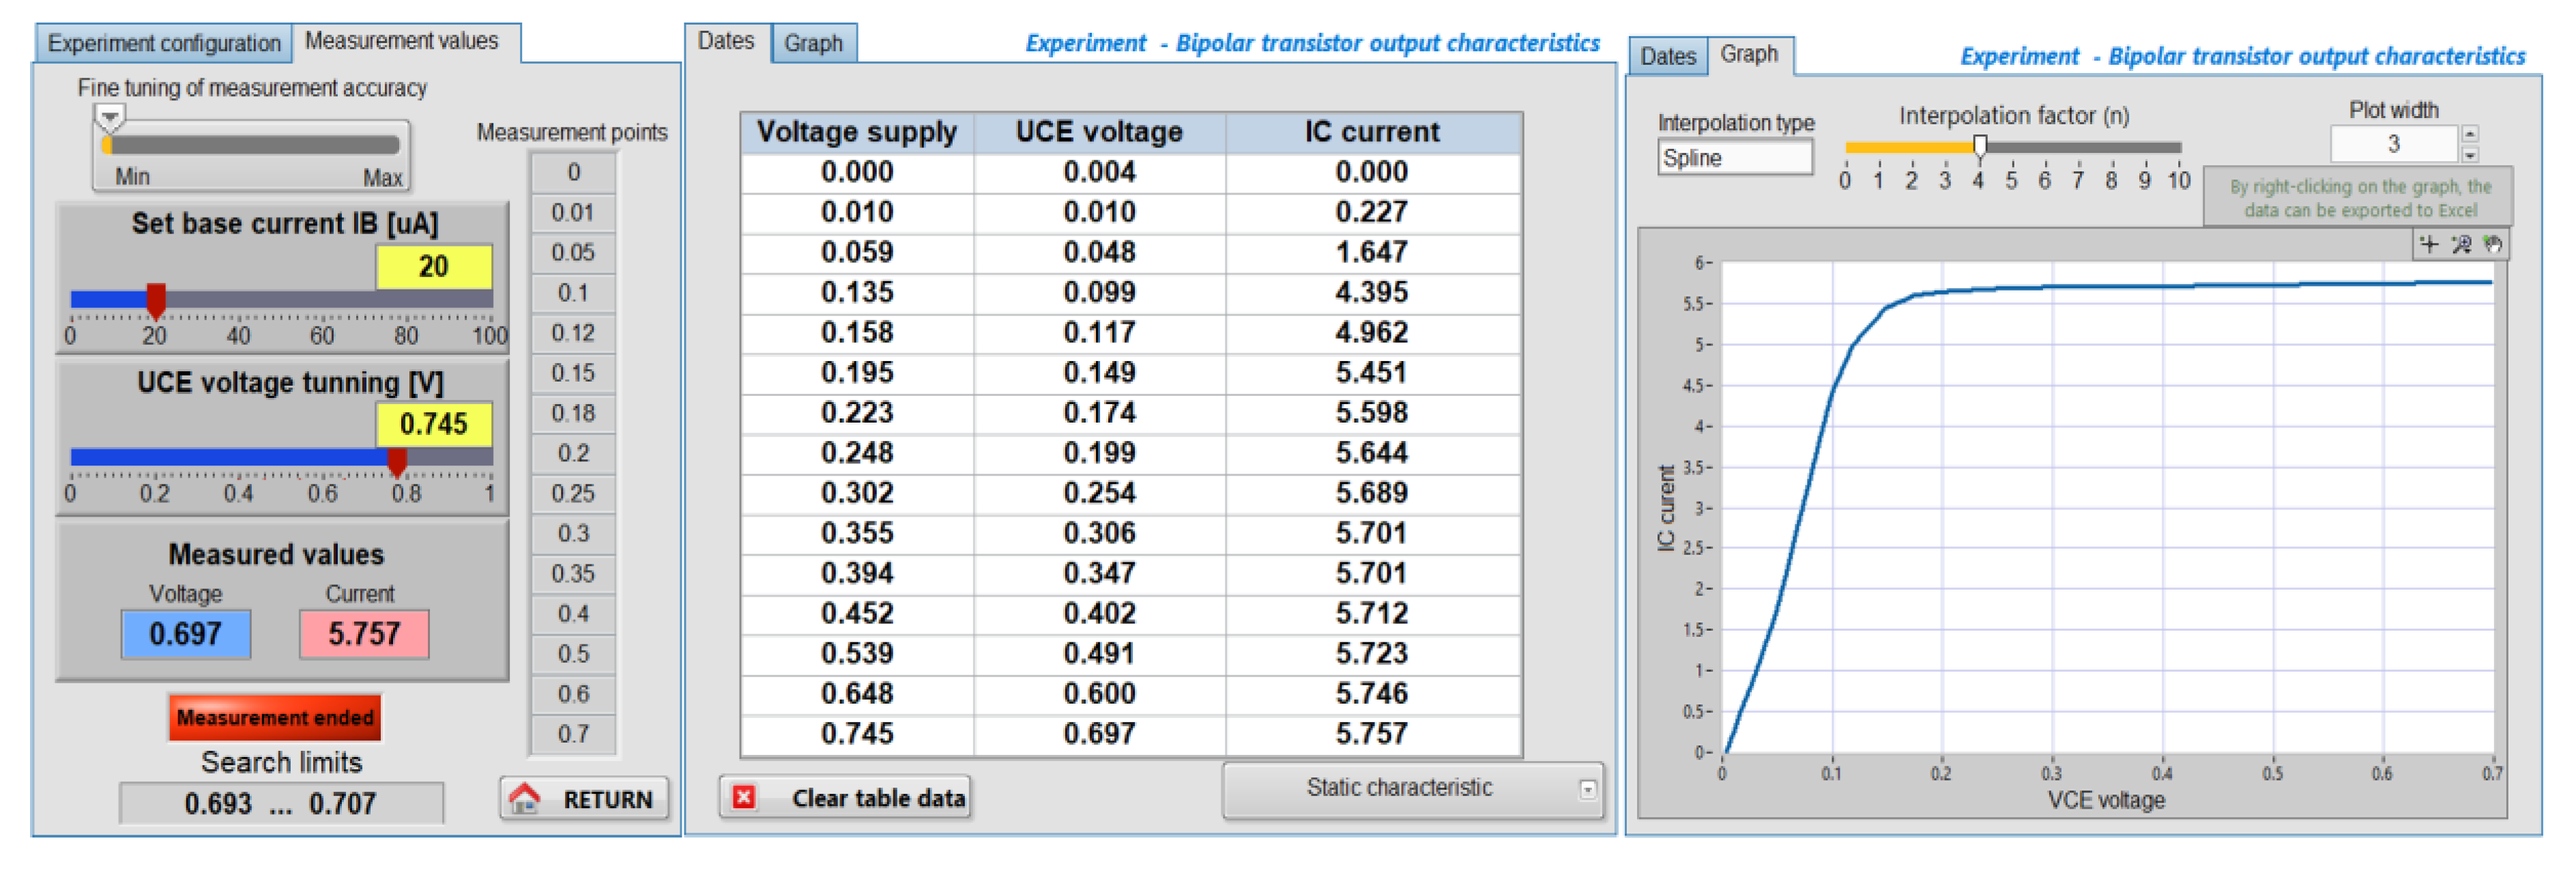
Figure 22.
The output characteristic ( for the 2N2222 BJT, obtained at .
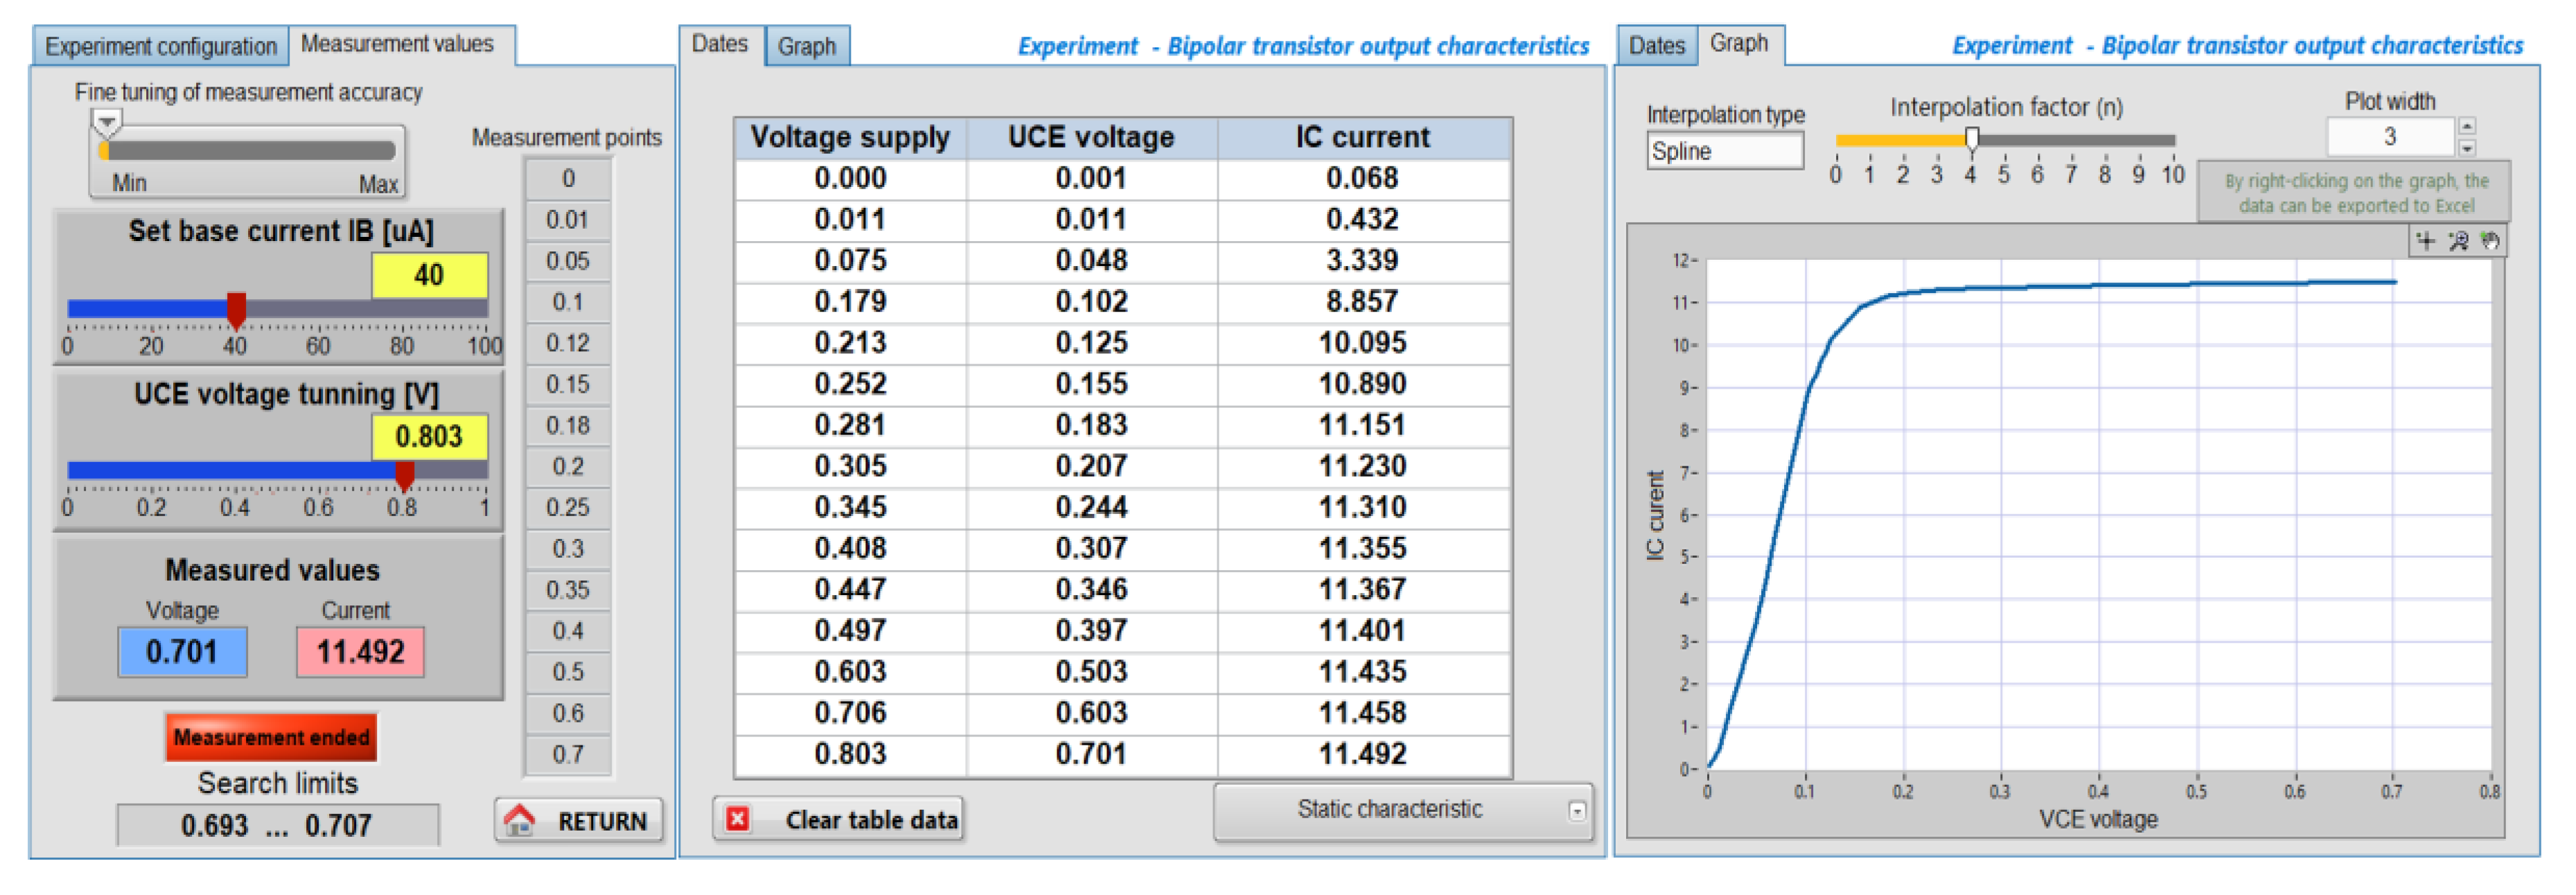
Figure 23.
The output characteristic ( for the 2N2222 BJT, obtained at .
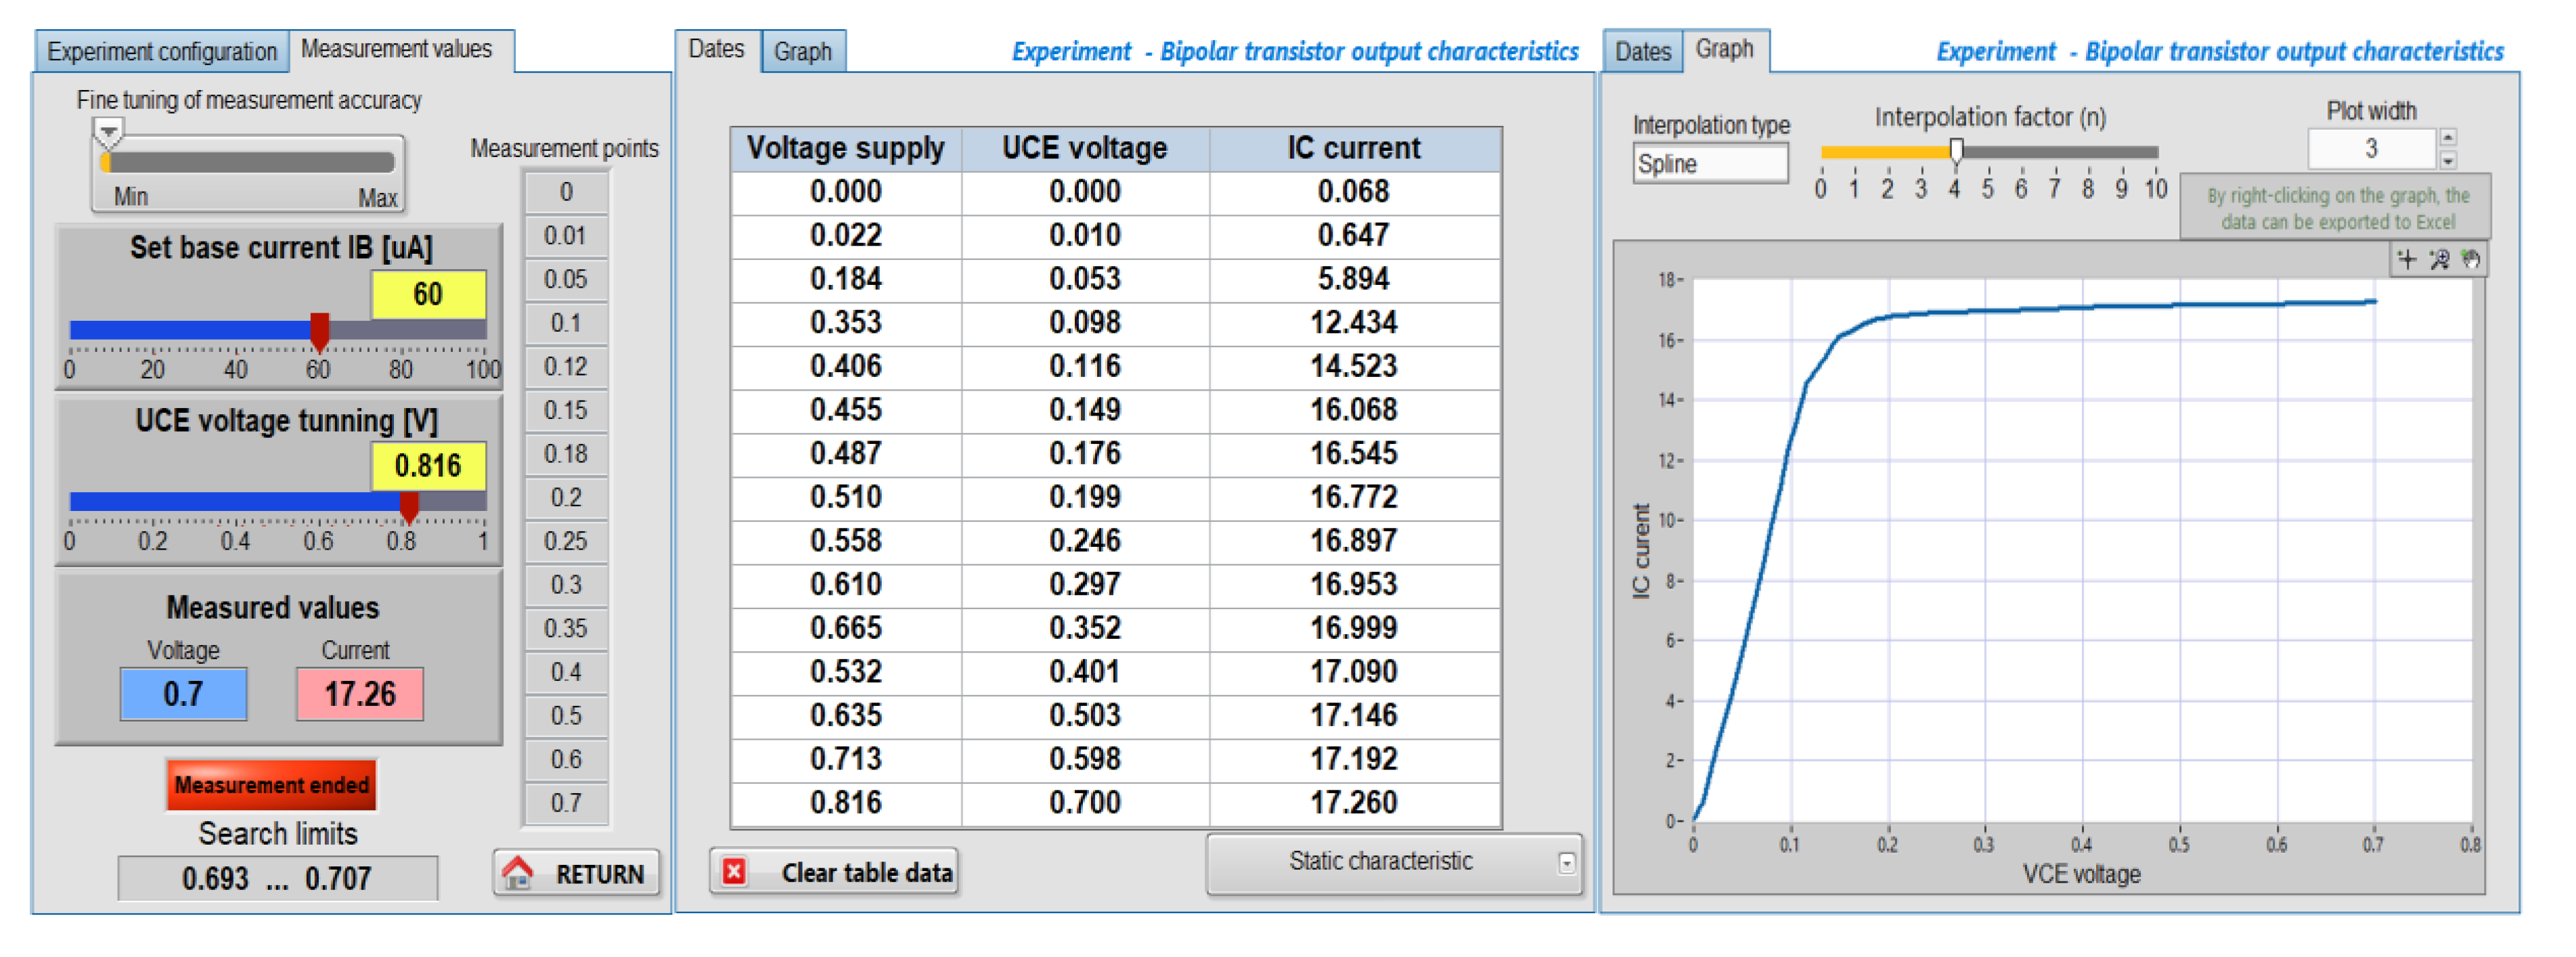
Figure 24.
Exporting the three characteristics for the 2N2222 transistor to Excel.
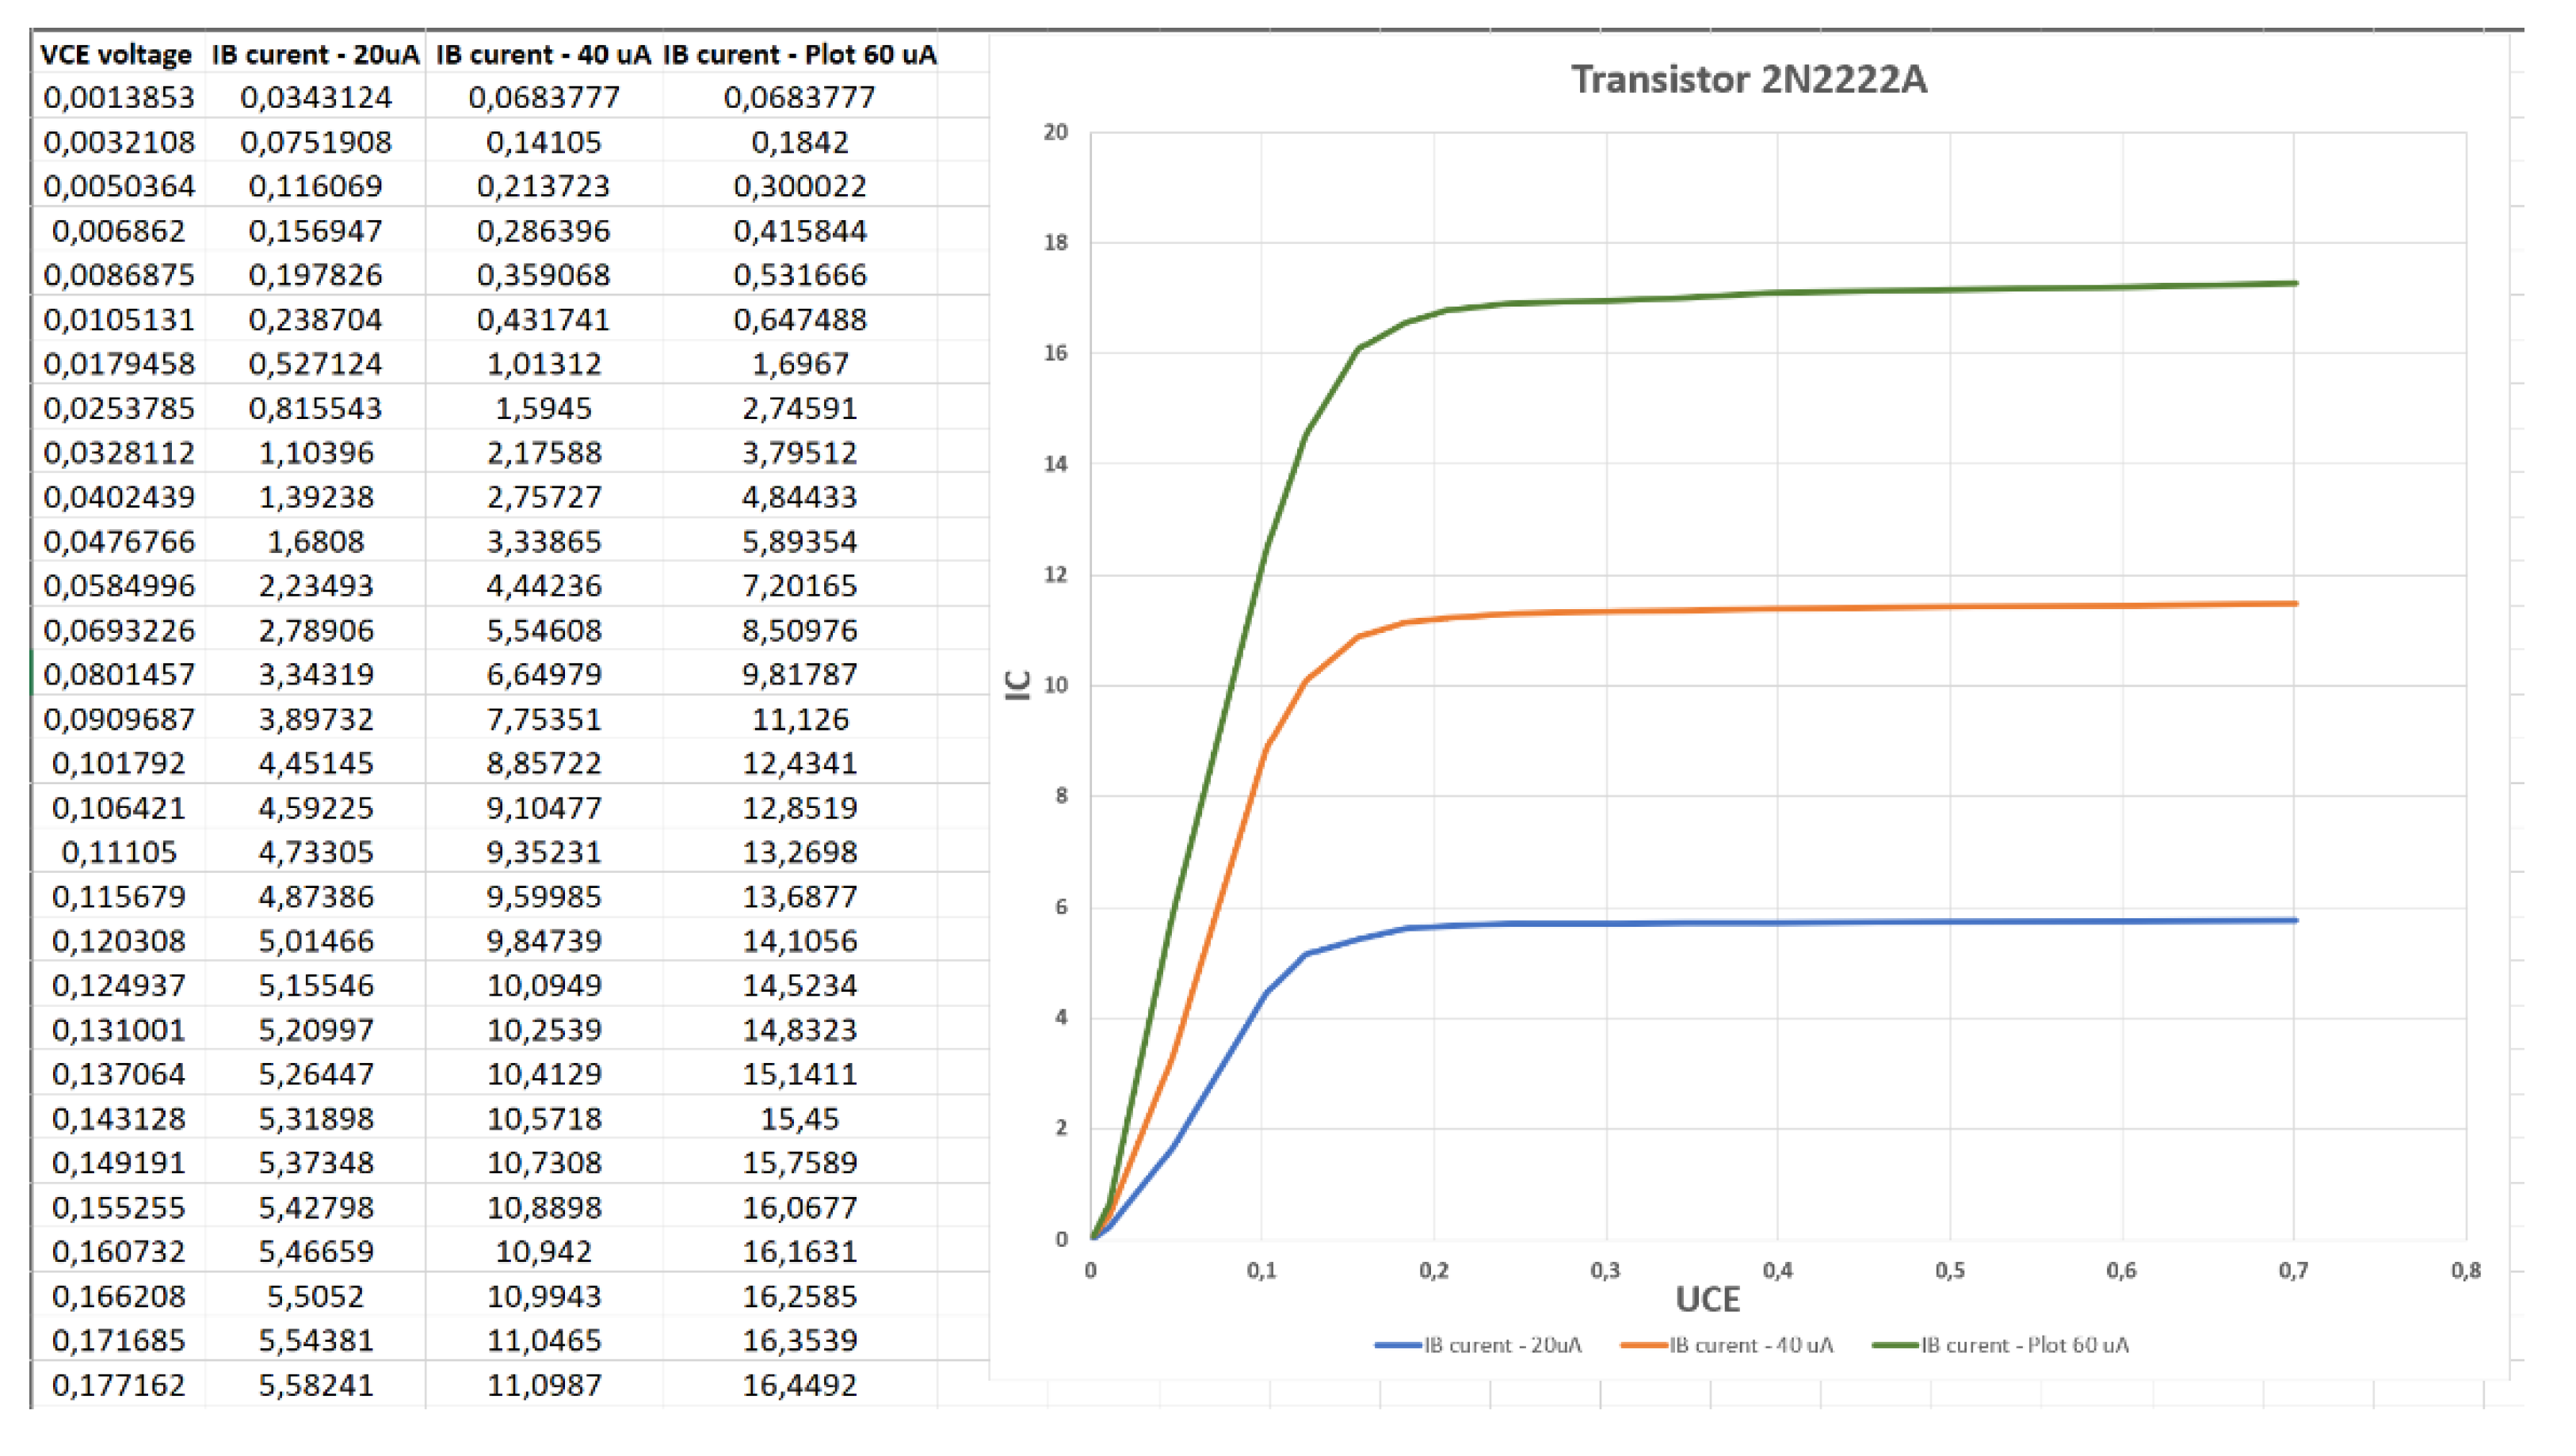
Figure 25.
Exporting the three characteristics for the BC337 transistor to Excel.
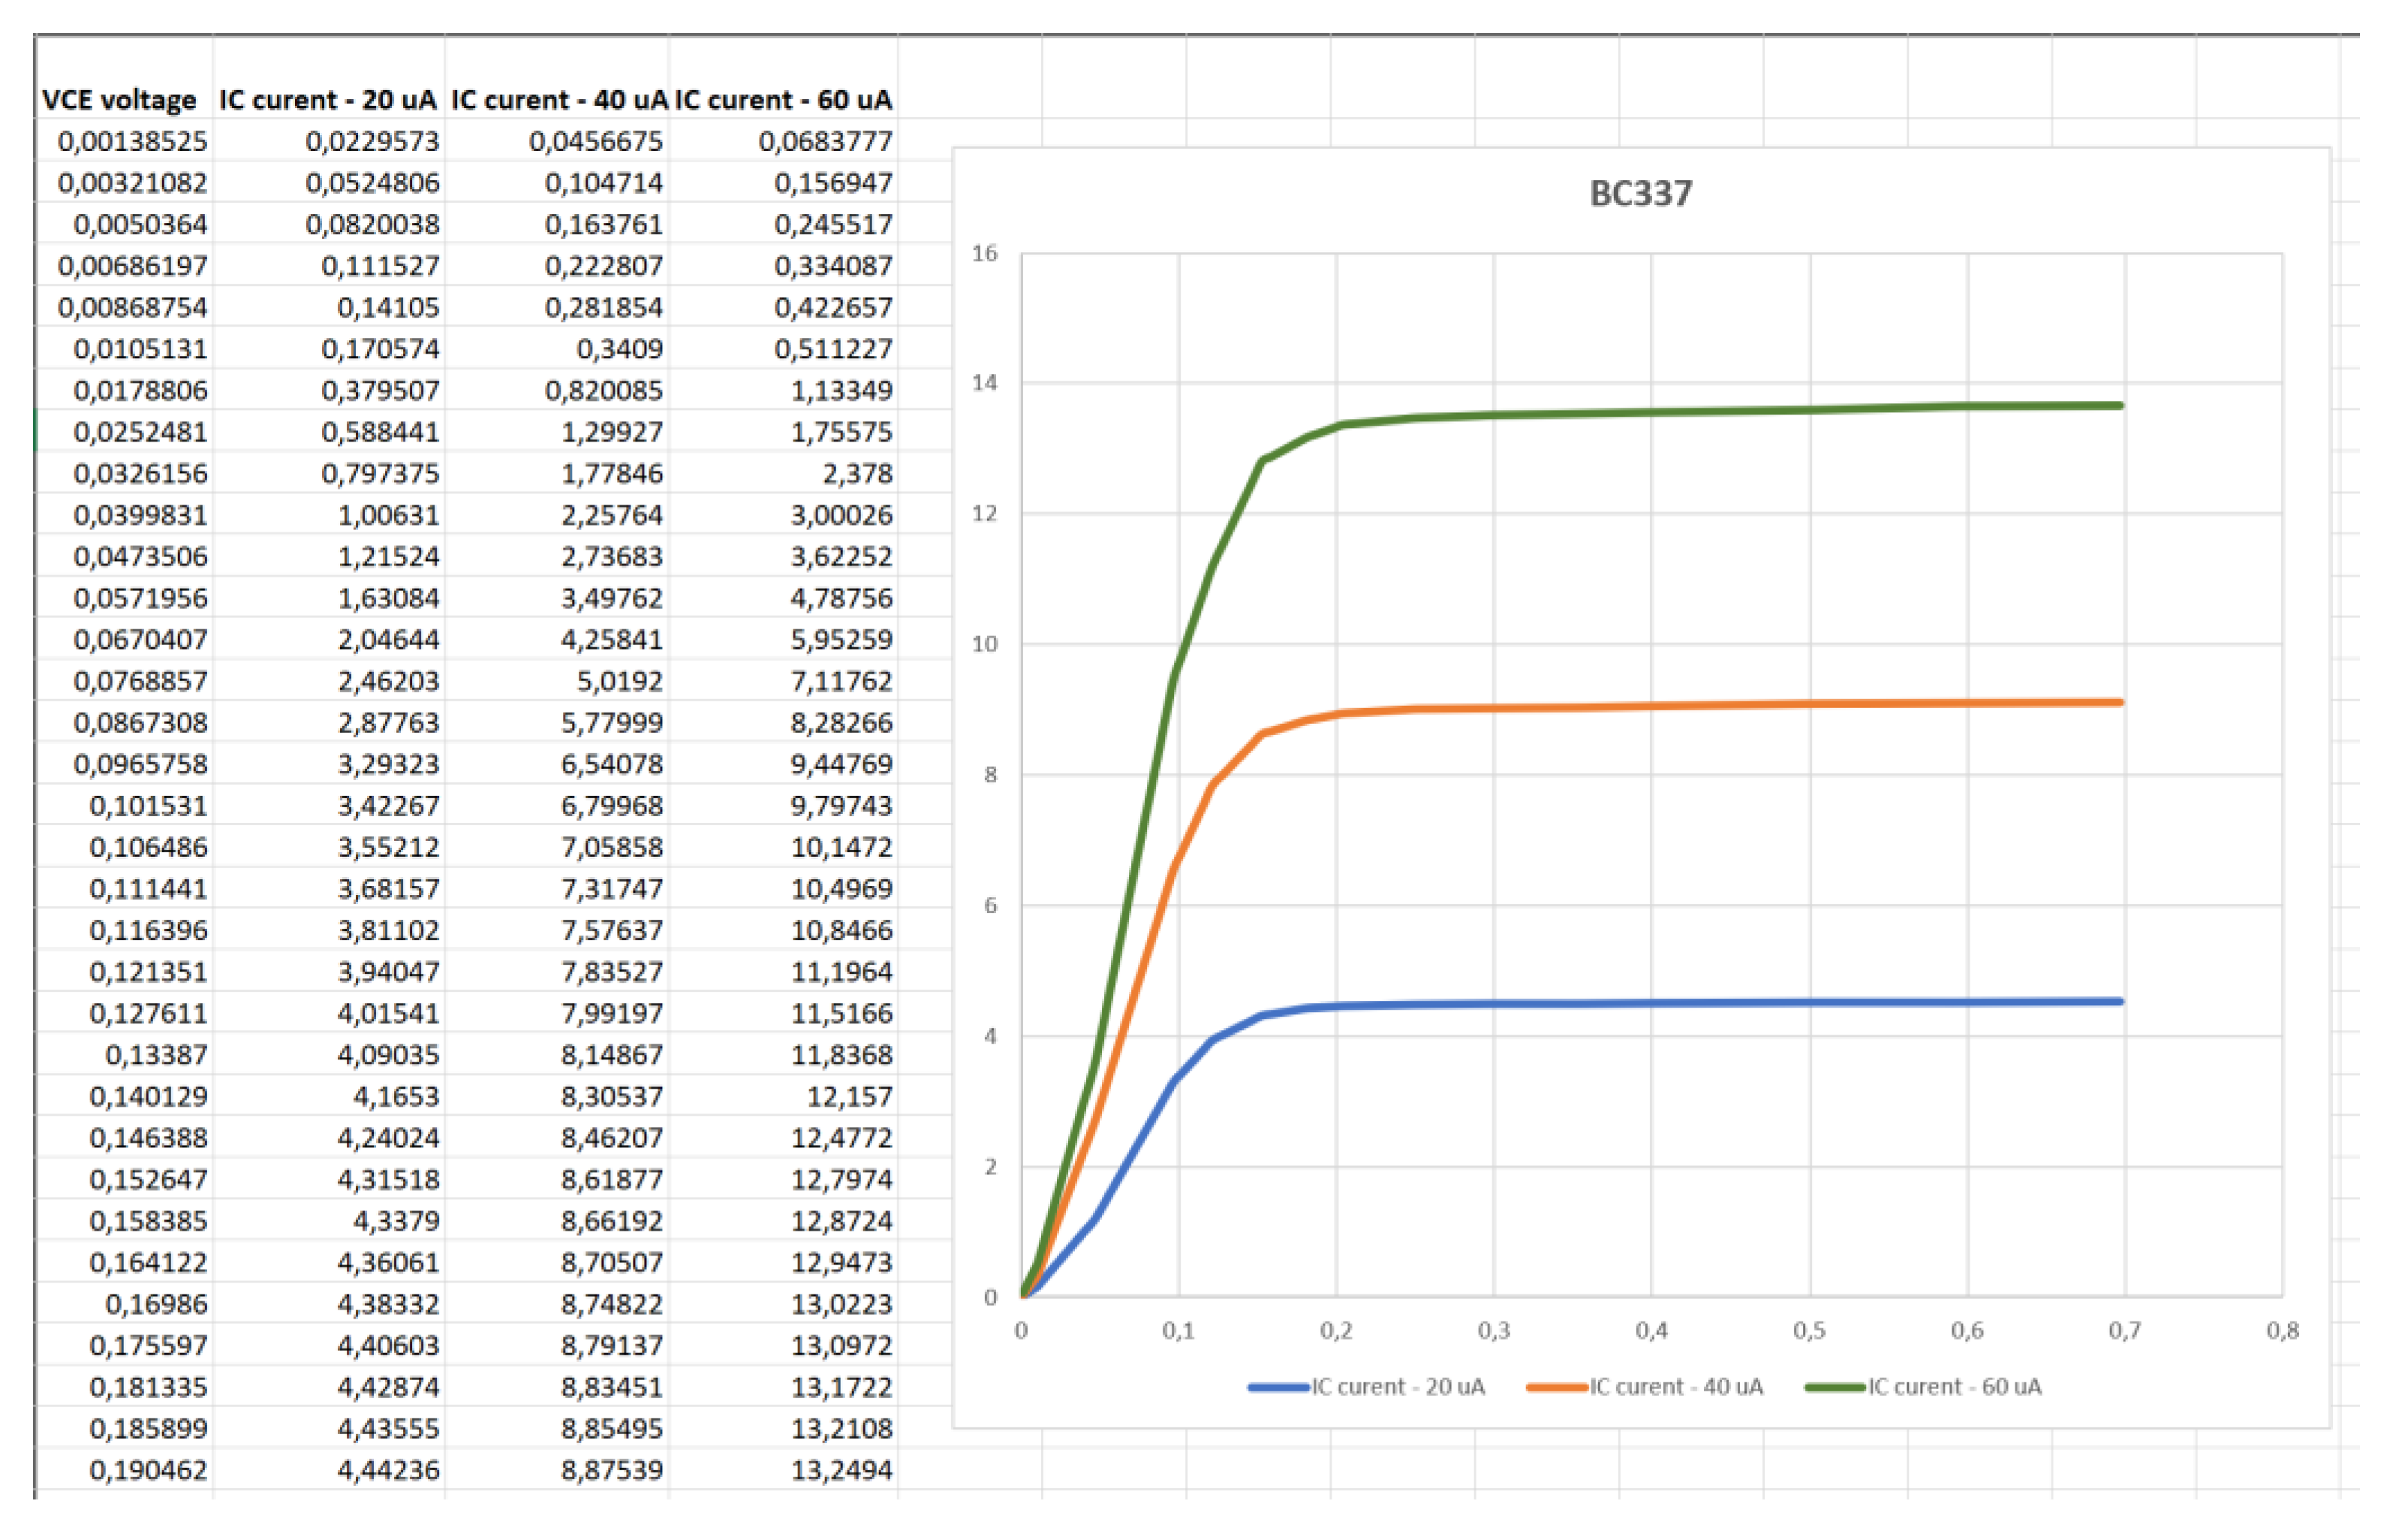
Figure 26.
Experimental setup used for the measurement of the BZX85C5V1 diode characteristics. (a) Overview of the entire workbench, including the hardware equipment and software on the host computer. (b) Detailed view of the client computer located in another network.
Figure 26.
Experimental setup used for the measurement of the BZX85C5V1 diode characteristics. (a) Overview of the entire workbench, including the hardware equipment and software on the host computer. (b) Detailed view of the client computer located in another network.
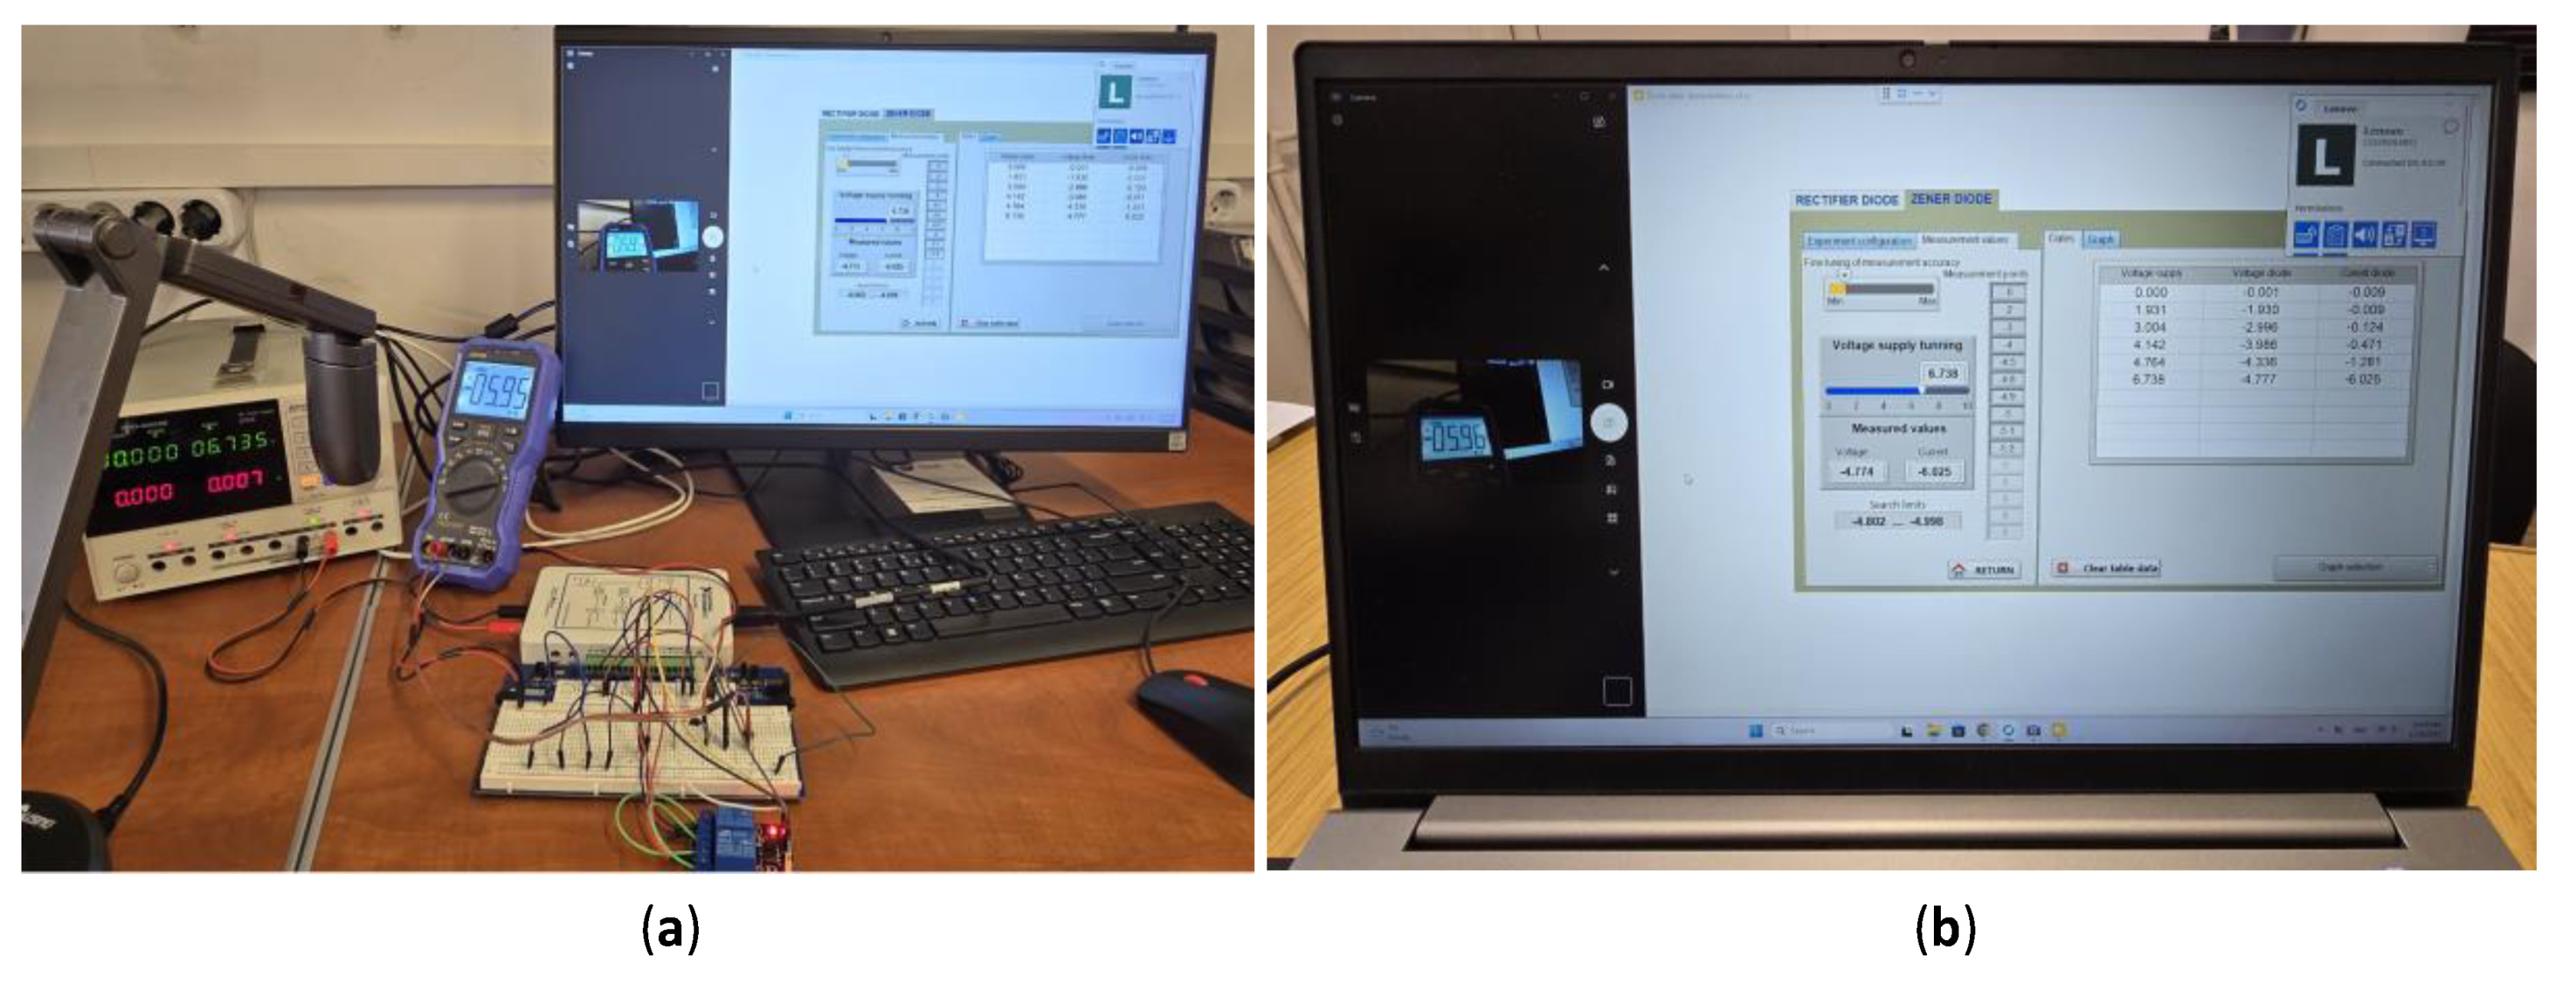

Table 1.
Comparative analysis between traditional laboratory and remote-control laboratory (generated through IA analysis).
Table 1.
Comparative analysis between traditional laboratory and remote-control laboratory (generated through IA analysis).
| Feature | Traditional Lab | Remote Lab |
| Location | On-site only | Access from anywhere |
| Availability | Limited hours | 24/7 (scheduled) |
| Equipment | Single-user / local use | Shared, multi-user |
| Cost | High per institution | Lower through sharing |
| Flexibility | Fixed schedule | Flexible access |
| Collaboration | Mostly local | Global collaboration |
| Data Handling | Manual | Automated logging |
| Accessibility | Limited | Wide access |
| Scalability | Low | High |
| Industry Readiness | Traditional skills | Industry 4.0 skills |
Table 2.
Comparative analysis for remote desktop applications.
| Criterion | RustDesk | AnyDesk | TeamViewer |
Chrome Remote Desktop |
| Cost | Free | Medium | Hight (commercial) | Free |
| Performance | Excellency | Verry Good | Good | Satisfactory |
| Security | Very high | High | High | Average |
| Cross-platform | Complete | Complete | Complete | Limited |
| Self-hosting | Yes | No | No | No |
| Hight Configurability | Hight | Average | Average | Very limited |
Disclaimer/Publisher’s Note: The statements, opinions and data contained in all publications are solely those of the individual author(s) and contributor(s) and not of MDPI and/or the editor(s). MDPI and/or the editor(s) disclaim responsibility for any injury to people or property resulting from any ideas, methods, instructions or products referred to in the content. |
© 2025 by the authors. Licensee MDPI, Basel, Switzerland. This article is an open access article distributed under the terms and conditions of the Creative Commons Attribution (CC BY) license (http://creativecommons.org/licenses/by/4.0/).
Copyright: This open access article is published under a Creative Commons CC BY 4.0 license, which permit the free download, distribution, and reuse, provided that the author and preprint are cited in any reuse.


