Submitted:
13 November 2024
Posted:
14 November 2024
You are already at the latest version
Abstract
Most experimental research is based on trials that need a measurement acquisition chain (acquisition unit, sensors, and IoT). The units of acquisition employed in research are becoming more accurate and complex. However, they do have other disadvantages: they are rather costly, They are expensive, lack an Ethernet connection, the drivers’ source codes are not modifiable, and are designed to work with very specific sensors, making them incompatible with other sensors on the market outside those proposed by the device manufacturer. This article introduces the DL2C datalogger, which combines a previously unique mix of open source codes and inexpensive computer hardware. The acquisition unit is self-contained, portable, easy to build, and connects to a wireless internet network with a very accurate data values collection. Its operation consists of a well-balanced mix of hardware (i.e., Arduino Nano, Arduino Uno, and Raspberry Pi) and software (i.e., C, Python, LabView). According to the state-of-the-art realized, the combination of an Arduino, a Raspberry Pi, and a LabView environment is very original. The Arduino Uno enables the collection and visualization of a wider variety of measurement ranges directly on the acquisition unit. The Arduino Nano regulates the power supply and assures the security of the DL2C’s electronic circuit. The Raspberry Pi facilitates the DL2C to function without the assistance of a computer. Finally, the LabView graphical interface is utilized to manipulate and visualize the central unit’s data remotely. The DL2C measures between [-5V; +5V] with an average absolute error of 0.02V for Volt signals and 4.98mV for milliVolt signals. An application example using the datalogger was presented and the DL2C subjected to a S.W.O.T study to identify the strengths, weaknesses and possible future improvements of the DL2C database acquisition.
Keywords:
Arduino
; Raspberry
; LabView
; Datalogger
; IoT
; Low-cost
; smart-sensors
1. Introduction
Experimental study necessitates the use of a variety of measurement instruments. These devices are connected to create the acquisition chain necessary to conduct these tests. This acquisition chain consists of measuring sensors, connections, acquisition units, and, on occasion, a wired or wireless internet connection terminal (i.e., via wifi). The datalogger guaranteed the piloting, the data collecting, and the management of this chain of acquisition. This material is critical for conducting experiments, although the difficulties experienced on these dataloggers are many and varied. As an example, the following issues may be brought up:
- The financial cost of high precision stations is too costly;
- The programming source code for the majority of these acquisition units is inaccessible;
- Some data collection devices on the market are incapable of providing the high accuracy of measurement required in experimental research;
- Some of these mobile and autonomous dataloggers have insufficient storage capacity;
- The majority of mobile dataloggers are not linked to the internet network;
- Experts remain skeptical about the Arduino’s performance and accuracy in regard to a scientific experimental investigation. For instance, there are few experimental research equipment using Arduinos materials;
- Finally, for business reasons, some data aquisition units are specific and can’t be use with any sensor. In other words, they are not universal.
The purpose of this article is to introduce a novel data collection system called () (DataLogger Low-Cost), which is based on an innovative utilization of hardware (Arduino Nano, Arduino Uno, Raspberry Pi) and software (C, Python, LabView).
The datalogger’s uniqueness stems from the very creative and hitherto unrealized connection of an Arduino Uno, a Raspberry Pi, and a LabView environment.The LabView environment was selected because it enables the creation of a graphical user interface for the real-time display of experiment-measured data. The Raspberry Pi enables the to operate independently of a computer. In contrast, the Arduino Uno enables visualization of a broader range of data and the usage of analog signals without the need for an extra electrical assembly. This new acquisition unit presenting numerous benefits such as its affordable price, and its high-precision (after some modificiation programming source code). Its also multifunctional, autonomous, open source, mobile, capable of storing a large amount of data, simple to manufacture, connected to the Internet, and capable of tracking the evolution of the collected signals in real time (compatible with any sensor emitting an electrical signal). The novelty of this study is that it was possible to construct this acquisition unit assembling an Arduino Uno, an Arduino Nano, a Rasberry Pi, and a LabView environment (i.e., the first acquisition unit based on this really novel hardware/software combo). The is configured as shown in Figure 1. The following section summarizes related work, followed by a presentation of the (both the hardware and software components) and some experiments, results, and discuted tests case findings. Finally, the SWOT analysis of the will be presented to ascertain its flaws, strengths, and potential modifications or adjustments.
It is feasible to combine the LabView graphical user interface with an Arduino Uno. On the other hand, LabView cannot function as a stand-alone device since it needs a CPU (i.e., a computer). On the other hand, the Raspberry Pi lacks analog inputs and accepts input/output voltages of no more than plus or minus three volts. However, some sensors send only analog signals with a voltage range of more than or equal to three volts. There are electrical circuits that can address this issue, but they are prohibitively costly. For all of these reasons, this study proposes an Arduino Uno as a complement to the Raspberry. Once the combination has been realized, it is essential to integrate the whole in a waterproof casing with a dedicated power supply to provide autonomy in a power outage. Five hundred lines of Linux commands and programming code are required to install the hardware. With the assistance of only three instructions commands, a Linux executable has been built to start and install (in a few hours) all these execution codes. This program (i.e., executable) will run the Python code for compilation. The data acquisition unit () is unique in its capacity to collect any signal from any sensor while being self-contained and network-accessible. Program the Arduino Uno to gather and show data from the sensors through a serial connection. LabView automatically processes, visualizes, and saves these data.
2. Related Work (i.e., State of Art)
According to scientific literature, the study’s fields using Arduino, Raspberry, and Labview were started in 2010 [1]. Since then, significant development of combination about this hardware and software has been seen, demonstrating the study theme’s popularity and utility. However, only 27 bibliographic papers have been published so far. The most recent is the one of Ansari and al. [2]. Josue Fuentes-Gonzalez and al. [3], who has published extensively on the Arduino hardware’s numerous applications. Antonio José Calderón and al. [4], who focused on the LabVIEW environment and showed its utility. Moreover, José Manuel Andjar Márquez and al. [5] performed research involving the connection of Arduino hardware and the LabVIEW environment. Joao Figueiredo and al. [6] mention electronics in their literature assessment on Open Platform Communications (OPC) in advanced industrial settings. LabView software is extensively used in the scientific literature for real-time processing and display of any measurement information (see [7,8,9,10]). Furthermore, this environment is capable of controlling devices such as data collection units and actuators (see [11,12,13]). It is also feasible to integrate a Raspberry Pi and an Arduino in the hardware realm (see [14,15,16]. In general, the Raspberry Pi and Arduino are used for low-cost economic applications such as robotics (see [17,18]) and data gathering (see [19,20]), as well as the creation of real-time control algorithms ([21,22]). However, due to the Raspberry Pi’s large storage capacity and, in most instances, the availability of its wi-fi connection, it may also be used as a server. This is why it is often used in combination with an Arduino to enable automated measurement collecting and storing (see [23,24]). Additionally, it is feasible to integrate hardware and software components, such as Python and Arduino [25], to gather data. LabVIEW may also be used in conjunction with a Raspberry Pi (see [26,27,28]) or an Arduino (see [29,30,31,32,33,34]) to manage or even gather data. Other setups are available, such as connecting the Xbee wireless module to the LabVIEW environment (see [35,36]). In 2018, González et al. [37] presents a low-cost Arduino-based data acquisition system for measuring vehicle dynamics, highlighting its affordability and flexibility in various scientific domains. In 2021, Bassous [38] study a cost-effective data acquisition system for short-term power forecasting in photovoltaic applications, aiming to enhance data accuracy and support energy grid integration in developing economies. In 2022, Caballero and al. presents a low-cost SHM system using a Wireless Sensor Network (WSN) and a base station to identify dynamic properties from measured structural response [39]. In 2023, [40] presents a hardware/software platform using commercial off-the-shelf elements to acquire and store digitized signals from imaging spectrometers. The system delivers similar performance to specialized hardware systems at a lower cost. Recently, Ozdemir [41] introduces two cost-effective, standalone, and open-source data acquisition devices, designed to enhance structural health monitoring (SHM) in infrastructure and transportation facilities. In the same year, Haizad and al. [42] presents a low-cost, open-source microcontroller-based DAQ system for process automation and control, built around Arduino Mega 2560, suitable for monitoring and control applications in the process industry.
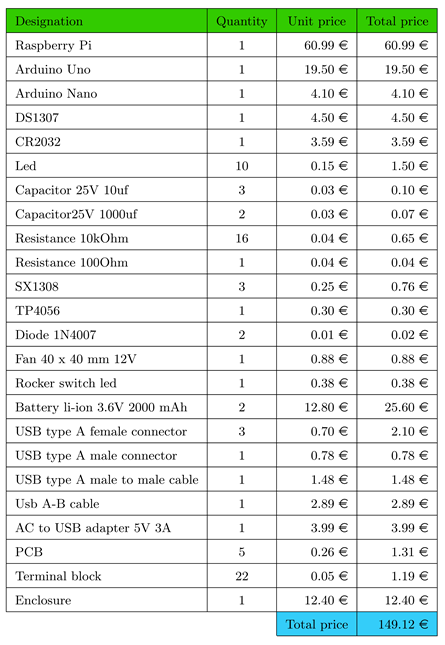
Despite this possibility, there is no specialized research data collection system that combines the LabVIEW and Python environments with the Raspberry Pi and Arduino hardware. The reason is presumably that the budgets of research labs in industrialized nations are much more significant. Therefore even though the cost of electronic equipment utilized remains high, it does not serve as a barrier to the growth of research in these laboratories. On the other hand, the situation is very different for research labs operating on a shoestring budget in developing economies. As a result, it is critical to provide these organizations with electronic research equipment that fulfills their budgetary requirements. Another critical point to make is that the acquisition unit is often the most costly equipment in a conventional acquisition chain. It was suggested in this study to develop a low-cost, high-precision acquisition unit for about 149.12 euros. The Figure 2 highlights the methods for combining software and hardware discussed before. The emphasis is on the difference between current combinations in the scientific literature today and the novel method of coupling hardware and software presented in this paper.
3. System Description
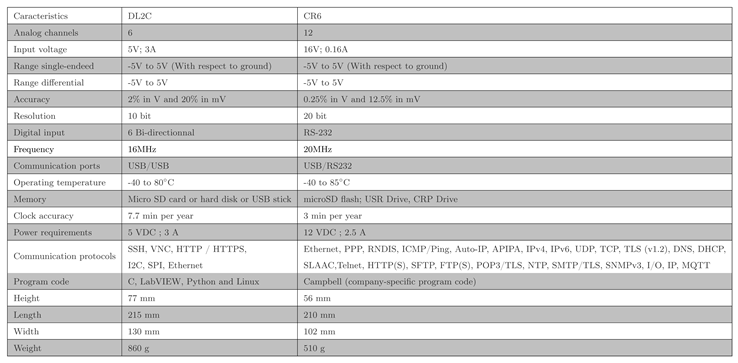
The ’s many components, and physical surroundings are summarized in Figure 3. The has some hardware and software characteristics that distinguish it as unique and distinctive (see the summary in Figure 4). The characteristics of the DL2C are presented in the datasheet (Table 2). The operating principale was described in Figure 5. The device is user-friendly and straightforward to use, even for those unfamiliar with electronics. Additionally, this acquisition unit enables network connectivity while being independent. Interestingly, t is feasible to expand its storage capacity at a reduced global economic cost of the system. Additionally, the is somewhat compatible with the majority of sensors now available on the market.

Table 1.
Datasheet of the and the CR6.
The hardware, software, and various data storage mechanisms of the will be discussed in depth in this paragraph.
3.1. Hardware
3.1.1. Components Description and Operating Principle
The is priced at about 149.12in total. On average, an entry-level acquisition unit costs approximately the Almemo 2890-9 (https://www.inds.co.uk/product/almemo-2890-9/) 1700.00, while the Campbell CR6 (https://www.radwell.co.uk/en-GB/Buy/CAMPBELL%20SCIENTIFIC%20INC/CAMPBELL%20SCIENTIFIC%20INC/CR6) costs 3275.83. These are pricing and do not include the cost of the sensors. These devices have a limited amount of internal storage. The Almemo 2890-9 features 512 kilobytes of internal memory (this barely allows to take about 100 000 measurements values). The Campbell CR6 has an internal memory capacity of 2990 KB (about 580 582 measurements values), while the has a minimum extendable memory capacity of 12 300 000 KB (this represents about 2 388 349 514 stored measurement values). The ’s components and related expenses are listed in Table 2. The characteristics comparison between CR6 and DL2C is given in the Table 1. For more information about CR6 datasheet see https://s.campbellsci.com/documents/au/product-brochures/s_cr6.pdf.
Table 2.
Price of the components.
3.1.2. Electronic Schema of the
The electronic circuit of the is shown in Figure 6.
There are two kinds of power sources available for the :
- A direct power supply from a 220V power adapter is comprised of an SX1308 module that increases the voltage through a potentiometer, followed by a 1N4007 diode. This power supply is accomplished through a 5V USB connection with a nominal current of 4A.
- A power source from the acquisition unit’s internal battery. the battery power section is fitted with a TP4056 module that controls and protects the 4Ah lithium-ion battery. When the battery voltage hits 2.9V, the TP4056 module shuts off power to the battery, although it is always capable of charging the battery and providing current if power is provided. The charging is stopped when the battery hits 4.2V. The SX1308 module subsequently boosts the voltage at the TP4056 module’s output, and the current is then sent via a 1N4007 diode.
The 1N4007 diodes are used to minimize voltage feedback in one of the power supply components and favor direct current. To be privileged, the voltage of the direct supply portion must be greater than the voltage of the battery supply part by 0.7V. The central acquisition unit is equipped with an on/off switch and an LED that indicates the power supply’s status. The acquisition unit’s power supply voltage is then smoothed using two capacitors rated at 25V and 1000F each one, followed by a relay rated at 5V operated by the Arduino Nano. A female USB connection enables the Raspberry Pi to be powered. The Arduino Uno’s analog input terminals can read only positive values between 0V and 5V. To enable reading negative voltages between -5V and 5V, two changes to the circuit and computer code were made:
- A voltage divider bridge has been constructed to split the voltage in half while also supplying a reference value of 5V to the Arduino Uno’s ADC. The impedance associated with the measured voltage must be at least ten times that of the divider bridge’s resistors.
- The Arduino code has been changed to link the voltage ranges -5V à 0V with the numerical values 0 to 511 and 0V à 5V with the numerical values 511 to 1023. 1023 is the highest ten-bit numerical number that the Arduino can give.
The most measuring sensors operate within the -5V et 5V range. It is possible to read higher voltages by making additional modifications in the , e.g., adding a second ADC to avoid reducing the accuracy of reading the values or modifying the Arduino program and the voltage divider bridge. The whole system is cooled through airflow produced by a port and a pair of 12V fans mounted on each side of the case (see Figure 3). In addition, an SX1308 module has been added to convert the central unit’s power supply voltage (i.e., 5V) to the usable 10V required to operate the fan. This procedure enables the fan to run at its maximum efficiency while saving two volts. The Arduino UNO is powered through a USB connection from the Raspberry Pi. The same USB connection is used to transfer data between the Arduino UNO and the Raspberry Pi. The Arduino Nano regulates the whole power supply and safeguards the acquisition unit’s electronics. When the battery is less than or equal to 2.9V, the TP4056 module placed in the central acquisition unit stops the battery’s recharging. When this voltage is included between 2.9V and 3.2V, the SX1308’s output voltage may be less than 5V. This voltage is insufficient to power the Raspberry Pi and Arduino Uno. The Arduino Nano will then deactivate the ’s power supply via a mechanical relay until the SX1308 module’s output voltage is between 5V and 5.5V. This component will prevent the Raspberry Pi from booting endlessly and thus avoiding damage to the acquisition unit’s electrical equipment. On the other hand, avoid using the system at voltages less than 5V.
Three female USB ports are located on the central unit ():
- Two of them are reserved for peripherals, such as a USB keyboard, mouse, or keys;
- The third is for the power adapter’s connection.
The terminal block situated outside of the is utilized to link the sensors to the central controller in Figure 7. This external terminal block enables the avoidance of connection failures during the central controller’s wiring to the sensors.
3.2. Software
Algorithms have been created to drive and control the Arduino Nano (see Figure 8), the Arduino UNO (see Figure 9), the Raspberry Pi (see Figure 10), and the ’s internal clock. The LabView environment has been developed to track the measurements in real-time (see Figure 11 for the code and Figure 12 for the graphical interface).
The control unit’s drivers may be installed automatically (see Figure 13), as well as the measurement data gathered by the latter shared via a network, using Python (as used in the Raspberry Pi) and C programming languages (used in the Arduino).
Each microprocessor performs the following tasks in detail:
-
Concerning the Arduino Nano:
- -
- It enables the management of the power supply and alarm systems (state of the battery and the electric sector). The latter constantly reads the analog ports A0 (voltage at the ’s input), A1 (battery voltage), A2 (voltage before the relay), and A3 (voltage after the relay) in volts, while ensuring that the specified thresholds for each electrical component are not exceeded. If the circuit’s voltage falls below 5V, the Arduino Nano disables the system’s power source by opening the mechanical relay to avoid damaging the components. Additionally, the Arduino Nano has status LEDs that flash. When the voltages fall below the thresholds, the red LEDs illuminate; when the voltages rise over the thresholds, the LEDs flash in various colors,
- -
- The analog reading precision is about 10 bits or between 100 and 300mV.
- The sensors are linked to the Arduino Uno through the USB cable. The collection of signals and the reading and transfer of data to the serial port are shown in Figure 9;
-
With regards to the Raspberry Pi:
- -
- Python is the programming language that is used on raspberry Pi;
- -
- The Arduino Uno’s database is obtained using the Python code shown in Figure 10 and then saved in multiple CSV files (Comma-Separated Values);
- -
- The Raspberry Pi’s serial port is configured as follows: /dev/ttyACM0 is the port name; the baud rate is 115200, and the decoding is UTF8;
- -
- In the background, Python code is run. It is started immediately upon the Raspberry Pi’s starting. Crontab allows users of Linux systems to schedule the execution of scripts, commands, or programs. Additionally, this application (i.e., Crontab) provides for executing a bash file (i.e., Bourne-Again shell, a script-type command-line interpreter) capable of starting the Python code according to a specified cycle;
- -
- When a problem happens during the Python code’s initialization, a full explanation of the issue is written to the "logs.txt" file. This file will be created in the directory /home/pi/log;
- -
- Because the Raspberry Pi lacks an internal clock, the date and time are not saved in memory. As a result, an external hardware clock is necessary. For resolve the problem, an external hardware clock in a DS1307 RTC (Real Time Clock) module is added. After installing and synchronizing the DS1307 module, the date and time are saved in memory. Each time the Raspberry Pi boots, the date and time are received via the DS1307 module. This module communicates through the I2C protocol when connected to the SDA (GPIO2) and SCL (GPIO3) ports and powered via the VCC and GND ports (see electrical schematic in Figure 6). In addition, the DS1307 enables the central unit to retain and update the clock settings specified even after the device is turned off or restarted. Apart from the DS1307 module, the Raspberry Pi’s date and time may be synchronized through an Internet connection to an NTP (Network Time Protocol) server;
- -
- An executable has been developed to facilitate and expedite the installation of Raspberry Pi Linux applications. The procedure is accomplished by launching just three instructions rather than 500 lines of commands and codes. This program is named "Raspberry Pi Configuration.sh" and is shown in Figure 13. It is a bash file. Then, it is necessary to transfer the bash file to the Raspberry Pi, convert the characters (the file was generated in a text editor on a Windows PC; the characters on a Linux system are different), and run it. The software begins by requesting the date and time, followed by the hostname (of the Raspberry Pi) and then the password. The installation procedure is automated for many hours (LabView, Python, Arduino, SSH, VNC, codes, and clock), and the Python code is generated.
- -
- One of the ’s unique features is its network connectivity through the VNC and SSH communication protocols, as well as the LabView environment installed on the Raspberry Pi. These communication protocols provide remote access to the without the need for a screen, keyboard, or mouse.
The Figure 11 illustrates the LabView programming code. It is the depiction of a microclimate’s relative humidity (in percent) and temperature (in Celsius) (see the visualization results in Figure 12).
This graphical user interface is simple to use. Indeed, configuring software using a graphical interface is more enjoyable and intuitive. The development environments for the software and the related synchronization components are summarized in Table 3.
3.3. Data Storage
At the level, two kinds of storage are used:
- ’s memory: The data collection system is fitted with a sixteen-gigabyte micro SD memory card that serves as internal memory. This internal memory space is used by both the operating system, which requires about two gigabytes, and CSV files.
- External storage’s: CSV files are saved on a network server to guarantee high file availability and prevent overloading the ’s internal memory.
The produces four CSV files that are saved in the previously specified memory. These include the following:
- Two "LabView Data.csv" files. The first file, "Data for LabView.csv," is saved in the datalogger and includes one month’s worth of data. The second file, "Data for LabView.csv," operates similarly to the first, except that it is saved on the network server to provide a secondary backup in the event of failure or data loss. These files are compatible with LabView;
- On the network server, a yearly file named "Overall Backup.csv" is kept. Each month, the "Data for LabView.csv" file’s contents are copied to the "Overall Backup.csv" file. After all data has been transferred to this yearly file, the "Data for LabView.csv" files will be emptied to make room for fresh data;
- On the Raspberry Pi, a temporary file named "Monthly Backup.csv" is generated. If the "Overall Backup.csv" file is not available, the data will be saved in this temporary file, which will enable the "Data for LabView.csv" file to be emptied without interruption or data loss. After transferring the pending data in this temporary file to the "Data for LabView.csv" file, the "Monthly Backup.csv" file is deleted.
When one of the CSV files is open, the Python function cannot run. A "test" function is utilized to validate and produce an error notice in this instance and to help to address this issue. This "test" function verifies the CSV files’ accessibility. When a CSV file is opened, the contents of the file are stored in a temporary list. The Python function picks up where it left off when the file is closed, sending data to the CSV file. Finally, every minute, LabView gets and analyzes the data, which means it accesses the file "Data for LabView.csv" for one minute. The Python code saves the awaiting data in a temporary file during this period. The Python function continues writing to the temporary file from where it left off when the "Data for LabView.csv" file is closed.
4. Experiments
The paragraph presents two experimental cases: one that demonstrates the DL2C’s capacity to appropriately collect the signal from a sensor, and another that shows the data collection unit’s practical use on an experimental device in the laboratory.
4.1. Reliability Test, Results and Discussions
We conducted signal testing (voltage) sended to the DL2C acquisition device. The gathered signal values were then compared to those of the original signals (from a reference signal generator) to validate the function of the acquisition unit.
4.1.1. The Reference Generator Signal Test
The Arduino Uno has a resolution of 10 bits ( = 1024 values) and a maximum reading voltage of 5Volts, corresponding to a resolution of = 0,0048828125V. A reliability test is conducted to evaluate the acquisition’s reliability. This reliability test involves the measurement of signals and their comparison to a reference (standard). A calibrated Rigol DG1022 (see the datasheet of the generator in the following link: https://www.rigol-uk.co.uk/product/rigol-dg1022-20mhz-function-arbitrary-waveform-generator/) voltage generator was used to send a signal to the , and the signal was compared to the reference generator signal.
4.1.2. Comparisons Results and Discussions
Figure 14 and Figure 15 illustrate the contrast between the signal sent by the Rigol DG1022 voltage generator and the signal measured (i.e, in millivolt and volt respectively) by the .
The findings indicate that the has an average absolute error of 0.02V when measuring in Volt and 4.98mV when measuring milliVolt. This error is due in part to cable losses and the Arduino Uno’s precision. A dedicated research unit, such as the Data Translation DT9834 (https://www.mccdaq.com/Products/Multifunction-DAQ/DT9834), produces errors of up to 20mV (https://www.mccdaq.com/PDFs/anpdf/DT-Application-Notes/Choosing-DAQ-Boards.pdf), in the voltage range between -10 and 10 volts. Referee to the Table 1 for more explanation about the DL2C datasheet (i.e., all the reliability test, characterization, and comparison of the DL2C with another research datalogger system).
4.2. Application Example
This paragraph proposes an application of the DL2C in a chain of acquisition that includes a wind turbine, a central unit (laptop), a wind tunnel, and the acquisition unit in issue.
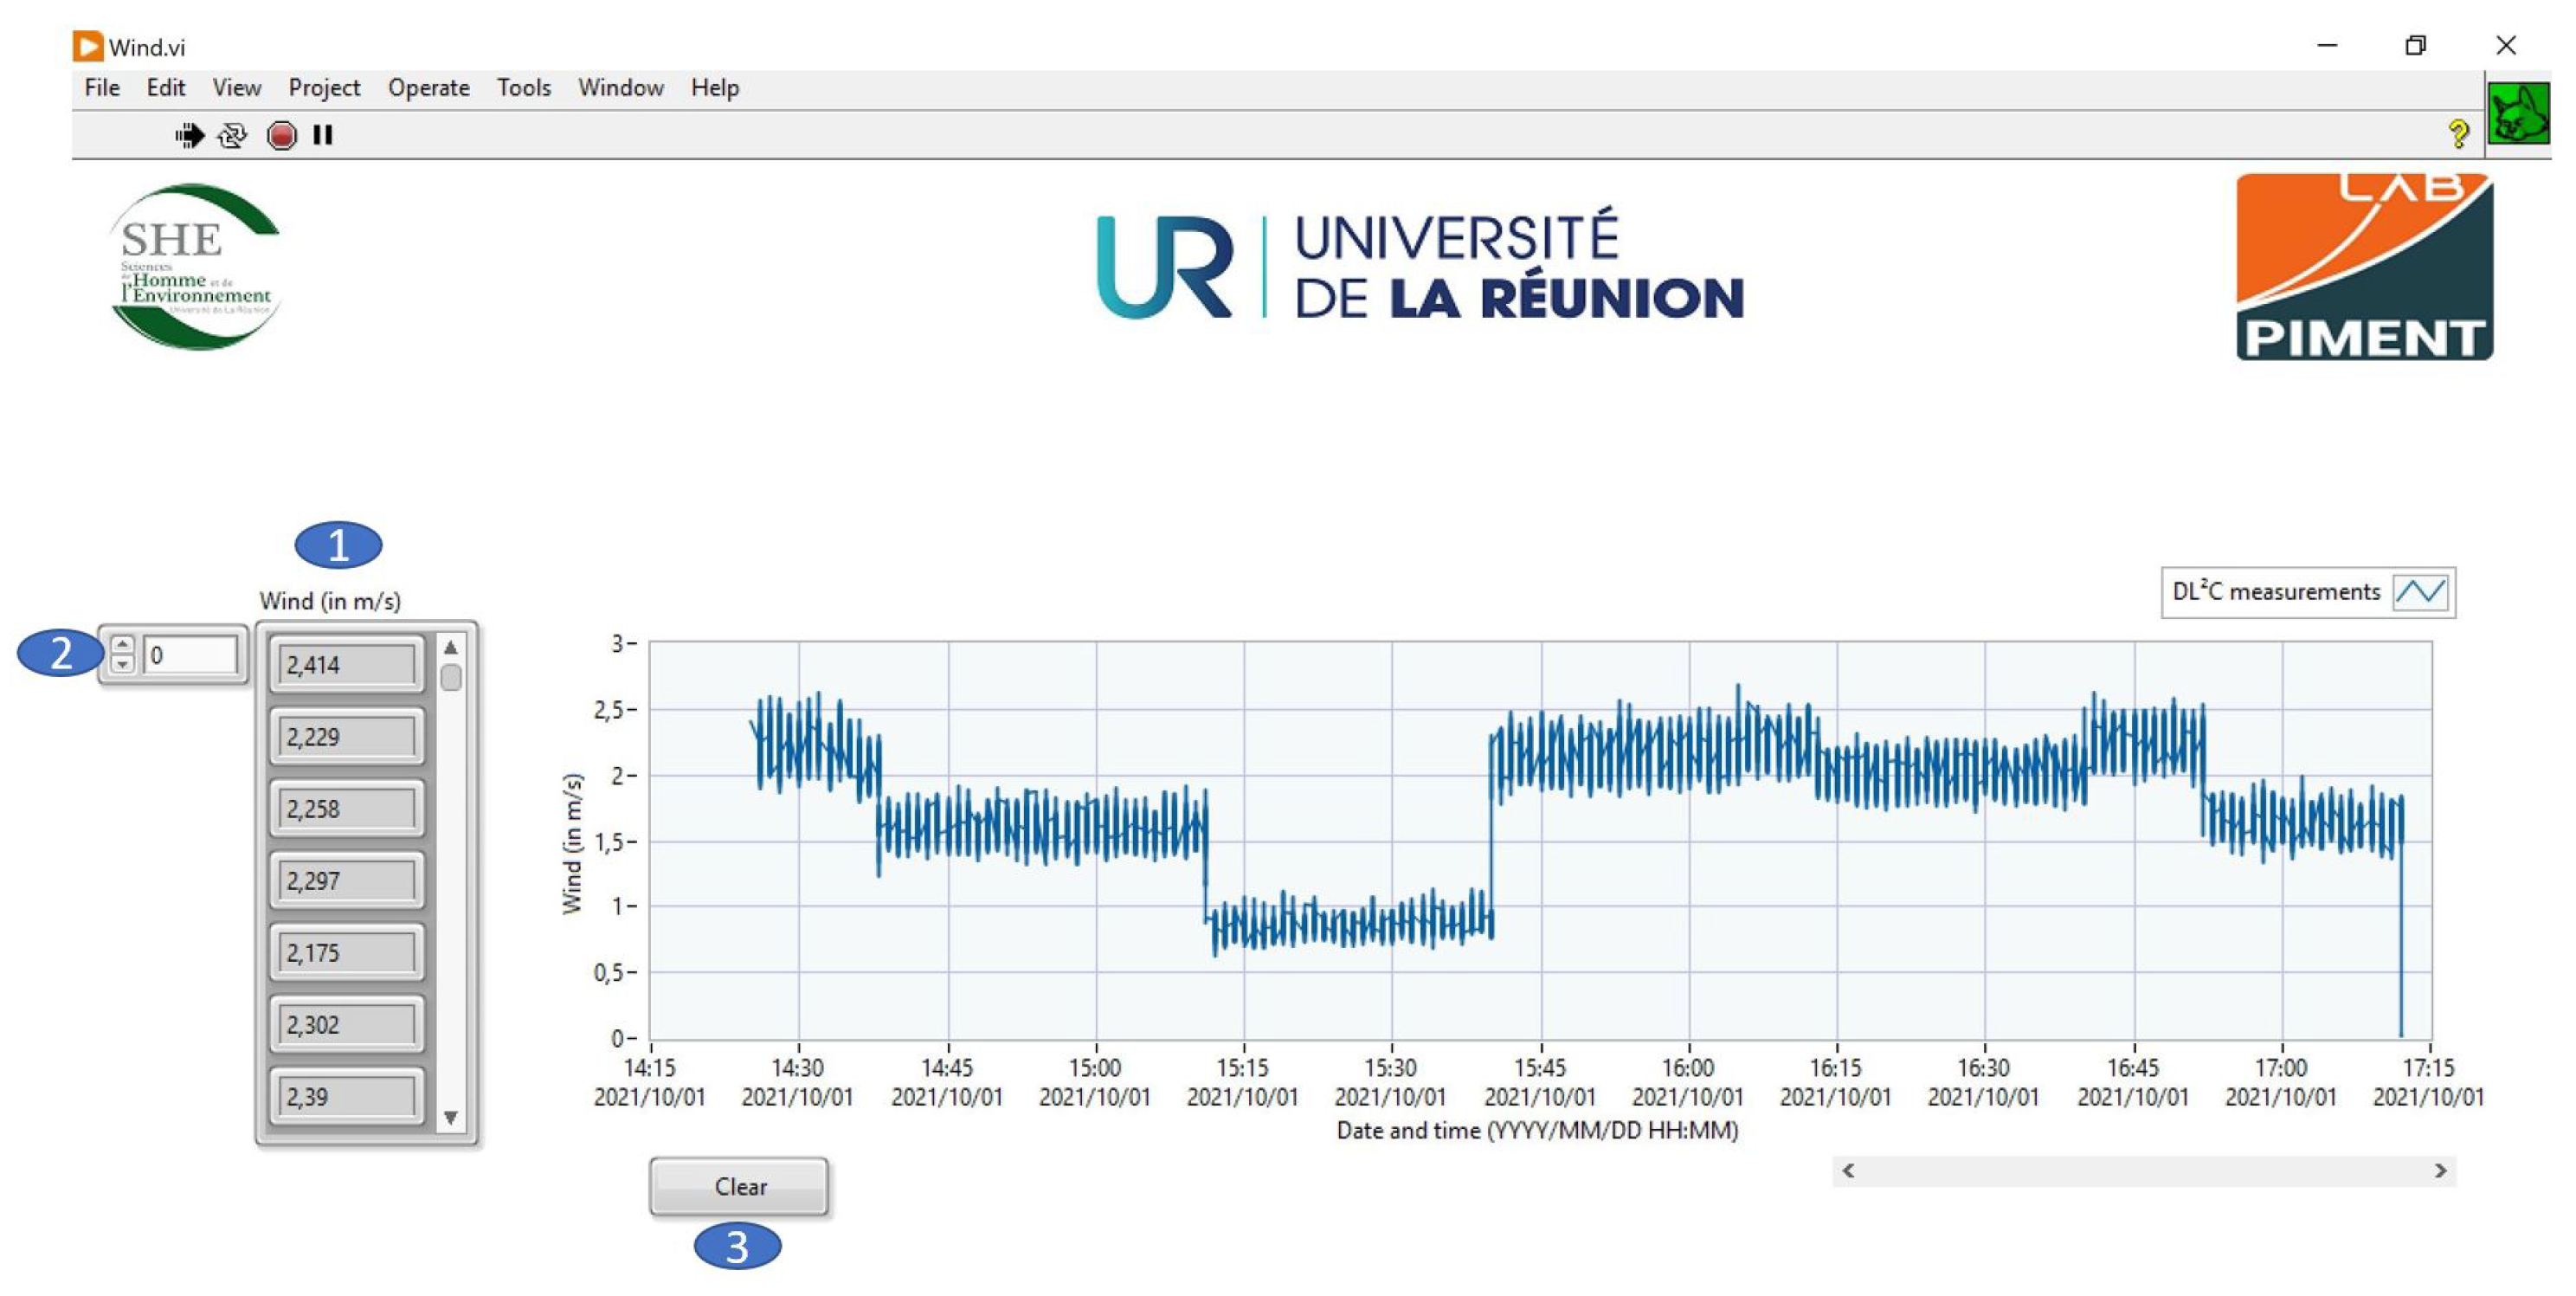
4.2.1. Description of the Experimentation
The goal of this experiment is to measure and visualize the real-time variability in air speed caused by a wind tunnel (see Figure 16). This speed was determined using a wind turbine as the sensor. The device (i.e., wind turbine) was connected to the DL2C to collect the voltages generated by the system when the propellers are in motion, and then a formula that takes into account the wind turbine’s characteristics (dimensions, maximum power output, etc.) was integrated into the LabView calculations to allow for the measurement and visualization of this air speed.
The following steps constitute the measurement protocol:
- Connect the DL2C to the wind turbine’s analog ports A0 to A5 to read the voltages given by the device.The positive terminal of the wind turbine is connected to the analog port A0, while the negative terminal is connected to the common ground GND of the data collecting center;
- The Arduino Uno must then be configured to intercept this signal through the serial port chosen;
- The next step is to turned on the DL2C;
4.2.2. Synology and Visualization
Figure 18.
Presentation of the server used in the application.
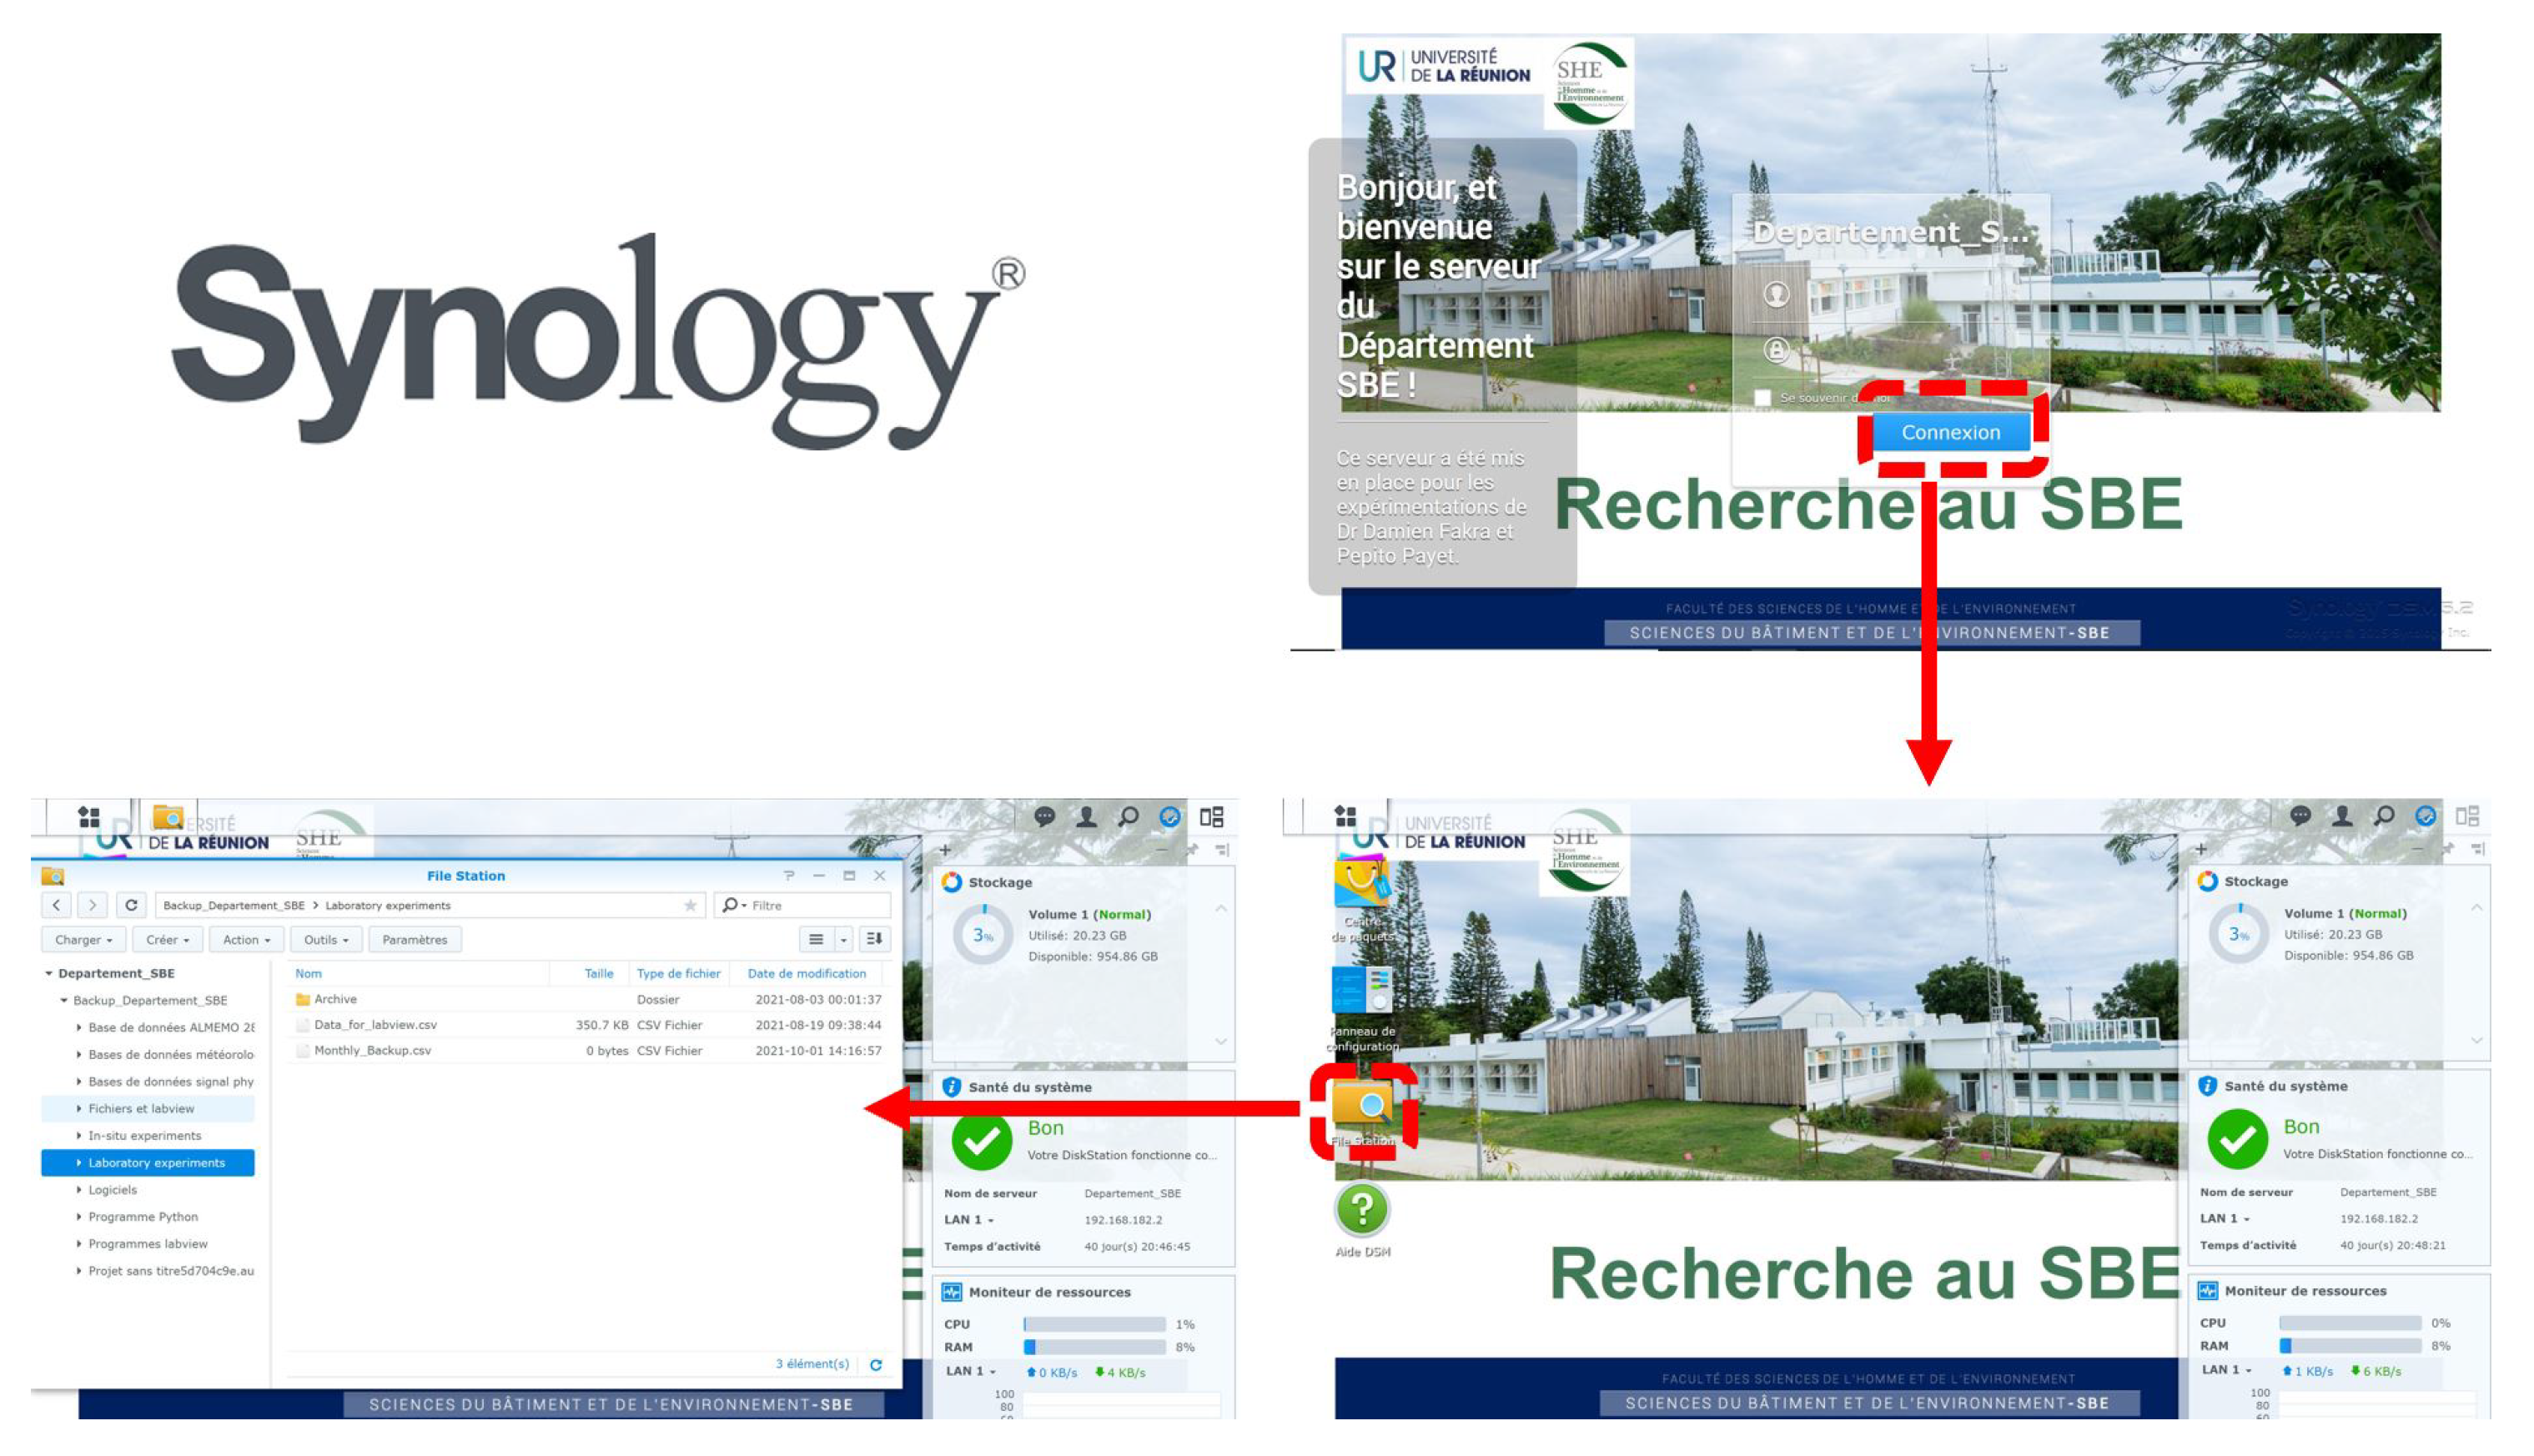
Figure 19.
Display example of an experimental wind power project.
5. Conclusion
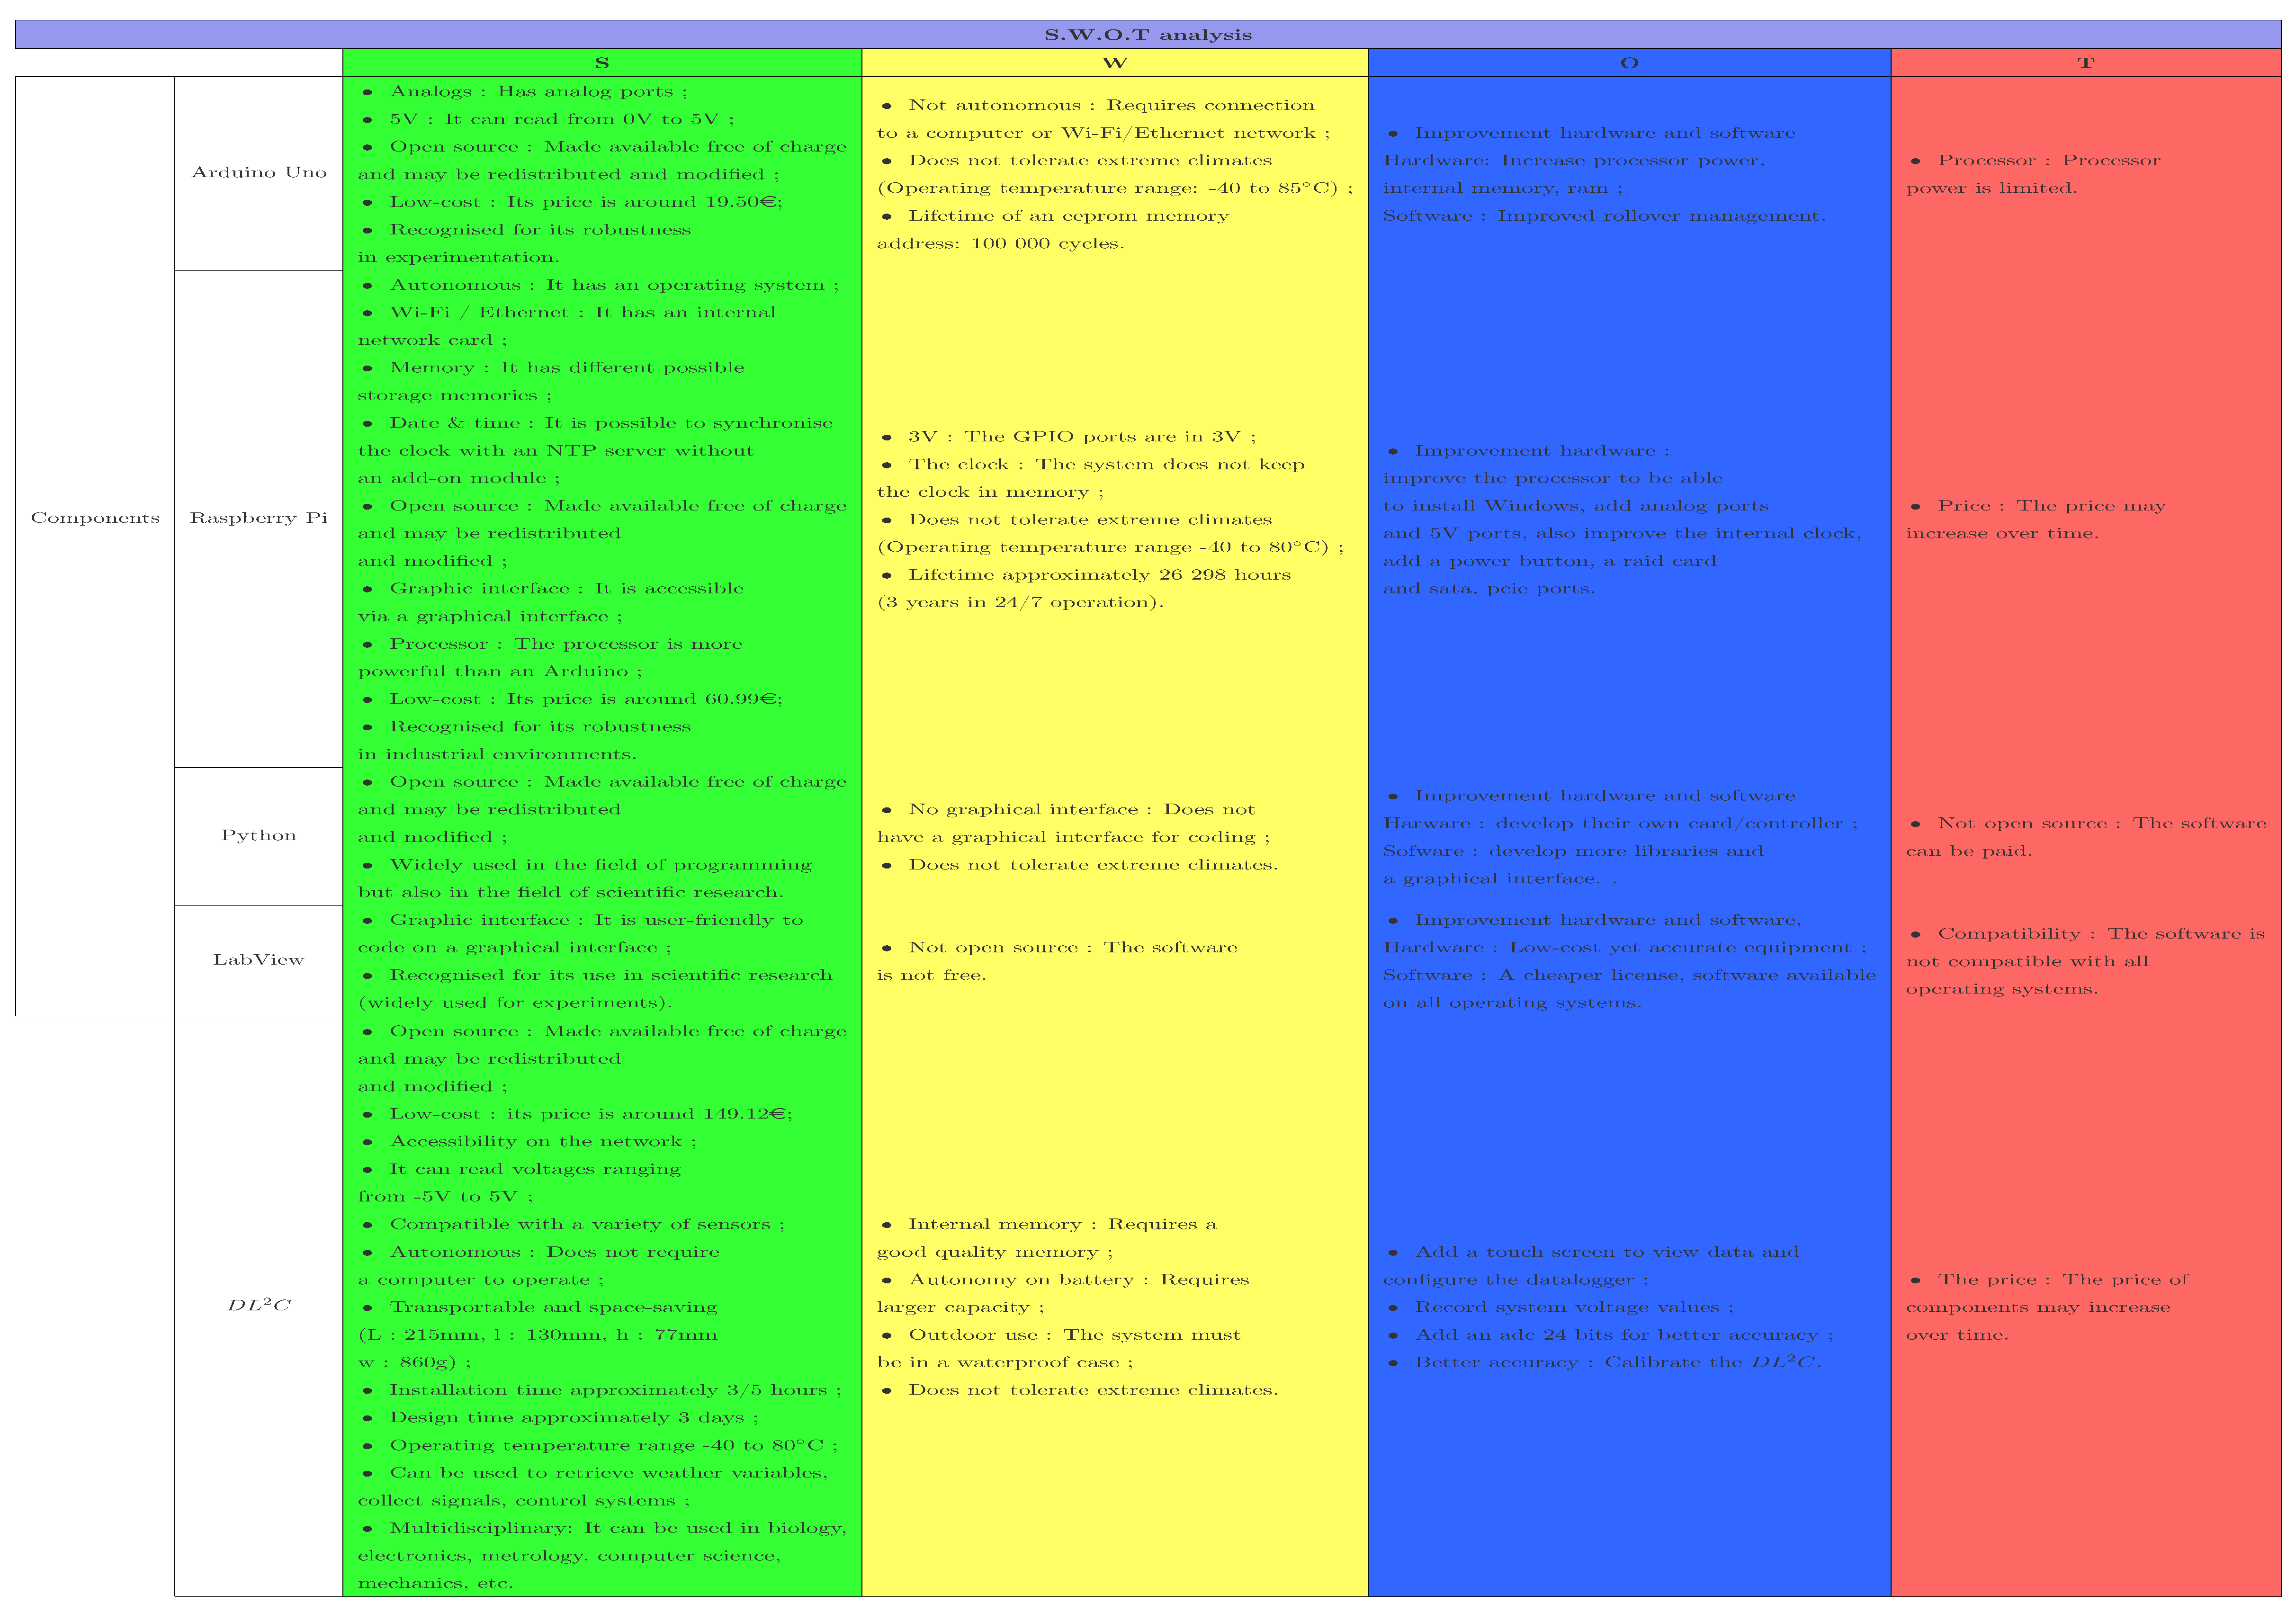
This article describes a novel data collection system . Its advantages include its low cost, suitability for monitoring, and the collection of precise measurement data in practical research. The system is straightforward to construct. In other words, it is ideal for research labs seeking to perform high-precision experiments on a shoestring budget. Effectively, the coupling of software running under the Python, C, and LabView environments, as well as hardware such as the Arduino Uno, Arduino Nano, and Raspberry Pi, enabled the system to become more autonomous, complete (for example, real-time monitoring of measurements via LabView or the possibility of storing data in a variety of different ways), and adaptable to any sensors of measurements as well as a broader range of measurements. These novel combinations of hardware and software have never been tried before and enable the control unit’s various functions. A SWOT analysis was performed to get a better understanding of the ’s functioning. Table 4 highlights the device’s strengths, application areas, limits, and potential future enhancements.
The tests were not conducted in microVolts since the bulk of the sensors utilized had their own ADC or AOP (Operational Amplifier). If these sensors are not equipped with this technology, It is possible to include these components into the acquisition chain between the sensors and the acquisition unit.
References
- Fisher, D.K.; Kebede, H. A low-cost microcontroller-based system to monitor crop temperature and water status. Computers and electronics in agriculture 2010, 74, 168–173.
- Ansari, S.; Ayob, A.; Lipu, M.S.H.; Saad, M.H.M.; Hussain, A. A Review of Monitoring Technologies for Solar PV Systems Using Data Processing Modules and Transmission Protocols: Progress, Challenges and Prospects. Sustainability 2021, 13. [CrossRef]
- Fuentes-Gonzalez, J.; Infante-Alarcón, A.; Asanza, V.; Loayza, F.R. A 3D-Printed EEG based Prosthetic Arm. 2020 IEEE International Conference on E-health Networking, Application Services (HEALTHCOM), 2021, pp. 1–5. [CrossRef]
- Calderón, A.J.; González, I.; Calderón, M.; Segura, F.; Andújar, J.M. A New, Scalable and Low Cost Multi-Channel Monitoring System for Polymer Electrolyte Fuel Cells. Sensors 2016, 16. [CrossRef]
- Liang, R.; Guo, Y.; Zhao, L.; Gao, Y. Real-time monitoring implementation of PV/T façade system based on IoT. Journal of Building Engineering 2021, 41, 102451. [CrossRef]
- González, I.; Calderón, A.J.; Figueiredo, J.; Sousa, J.M.C. A Literature Survey on Open Platform Communications (OPC) Applied to Advanced Industrial Environments. Electronics 2019, 8. [CrossRef]
- Wang, C.J.; Wang, T.Z. Design of Temperature Control System Based on LabVIEW. Advances in Manufacturing Technology. Trans Tech Publications Ltd, 2012, Vol. 220, Applied Mechanics and Materials, pp. 808–811. [CrossRef]
- Mokhtar, Mukhlis, Ghazali, Abu Bakar, and Taat, Muhammad Zahidee. Development of Baby-EBM Interface System, 2010.
- Cenușă, M.; Poienar, M.; Milici, L.D.; Pața, S.D. Monitoring System for the EmotionalStates. International Conference on Advancements of Medicine and Health Care through Technology; 12th - 15th October 2016, Cluj-Napoca, Romania; Vlad, S.; Roman, N.M., Eds.; Springer International Publishing: Cham, 2017; pp. 85–88.
- Stój, J.; Smołka, I.; Maćkowski, M. Determining the Usability of Embedded Devices Based on Raspberry Pi and Programmed with CODESYS as Nodes in Networked Control Systems. Computer Networks; Gaj, P.; Sawicki, M.; Suchacka, G.; Kwiecień, A., Eds.; Springer International Publishing: Cham, 2018; pp. 193–205.
- Mansour, N.A.; El-Bab, A.M.R.F.; Abdellatif, M. Shape characterization of a multi-modal tactile display device for biomedical applications. 2012 First International Conference on Innovative Engineering Systems, 2012, pp. 7–12. [CrossRef]
- R. E. Rossel, Programming of the Wavelength Stabilization for a Titanium:Sapphire Laser using LabVIEW and Implementation into the CERN ISOLDE RILIS Measurement System, presented 15 Feb 2012 (Dec 2011). URL https://cds.cern.ch/record/1523721.
- Dixit, S.A.; Jain, A. Implementation of PPC-SSR as final control element and interfacing of PLC with LabVIEW using Modbus in two tank non interacting level control system. 2016 IEEE 1st International Conference on Power Electronics, Intelligent Control and Energy Systems (ICPEICES), 2016, pp. 1–6. [CrossRef]
- Bell, C. Beginning Sensor Networks with Arduino and Raspberry Pi; Apress, Berkeley, CA, 2013. [CrossRef]
- Krauss, R. Combining Raspberry Pi and Arduino to form a low-cost, real-time autonomous vehicle platform. 2016 American Control Conference (ACC), 2016, pp. 6628–6633. [CrossRef]
- Real-Time Interfacing Using the Arduino. In Exploring Raspberry Pi; John Wiley & Sons, Ltd, 2016; chapter 11, pp. 453–480, [https://onlinelibrary.wiley.com/doi/pdf/10.1002/9781119211051.ch11]. [CrossRef]
- Chen, M.H.; Fu, Y.T.; Ou, K.S.; Gu, D.; Pi, C.H.; Chen, K.S. On the development of autonomously manipulation of group mobile robots for smart living and biomimetic applications. 2012 IEEE International Conference on Computer Science and Automation Engineering (CSAE), 2012, Vol. 2, pp. 259–263. [CrossRef]
- Soriano, A.; Marín, L.; Vallés, M.; Valera, A.; Albertos, P. Low Cost Platform for Automatic Control Education Based on Open Hardware. IFAC Proceedings Volumes 2014, 47, 9044–9050. 19th IFAC World Congress, . [CrossRef]
- Mabbott, G.A. Teaching Electronics and Laboratory Automation Using Microcontroller Boards. Journal of Chemical Education 2014, 91, 1458–1463, . [CrossRef]
- Martínez-Santos, J.C.; Acevedo-Patino, O.; Contreras-Ortiz, S.H. Influence of Arduino on the Development of Advanced Microcontrollers Courses. IEEE Revista Iberoamericana de Tecnologias del Aprendizaje 2017, 12, 208–217. [CrossRef]
- Sobota, J.; PiŜl, R.; Balda, P.; Schlegel, M. Raspberry Pi and Arduino boards in control education. IFAC Proceedings Volumes 2013, 46, 7–12. 10th IFAC Symposium Advances in Control Education, . [CrossRef]
- James, A.E.; Chao, K.M.; Li, W.; Matei, A.; Nanos, A.G.; Stan, S.D.; Figliolini, G.; Rea, P.; Bouzgarrou, C.B.; Bratanov, D.; Cooper, J.; Wenzel, A.; Capelle, J.V.; Struckmeier, K. An Ecosystem for E-Learning in Mechatronics: The CLEM Project. 2013 IEEE 10th International Conference on e-Business Engineering, 2013, pp. 62–69. [CrossRef]
- Maiti, A.; Kist, A.A.; Maxwell, A.D. Real-Time Remote Access Laboratory With Distributed and Modular Design. IEEE Transactions on Industrial Electronics 2015, 62, 3607–3618. [CrossRef]
- Blackstock, M.; Lea, R. Toward a Distributed Data Flow Platform for the Web of Things (Distributed Node-RED); Association for Computing Machinery: New York, NY, USA, 2014; WoT ’14, p. 34–39. [CrossRef]
- Teikari, P.; Najjar, R.P.; Malkki, H.; Knoblauch, K.; Dumortier, D.; Gronfier, C.; Cooper, H.M. An inexpensive Arduino-based LED stimulator system for vision research. Journal of Neuroscience Methods 2012, 211, 227–236. [CrossRef]
- Ursutiu, D.; Samoila, C.; Jinga, V. Creative developments in LabVIEW student training: (Creativity laboratory — LabVIEW academy). 2017 4th Experiment@International Conference (exp.at’17), 2017, pp. 309–312. [CrossRef]
- Ursutiu, D., Samoila, C., Jinga, V., Altoe, F.. The future of hardware – software reconfigurable labview compiler to raspberry PI. Auer M.E.,Uhomoibhi J.,Guralnick D. [CrossRef]
- Buele, J.; Espinoza, J.; Pilatásig, M.; Silva, F.; Chuquitarco, A.; Tigse, J.; Espinosa, J.; Guerrero, L. Interactive System for Monitoring and Control of a Flow Station Using LabVIEW. Proceedings of the International Conference on Information Technology & Systems (ICITS 2018); Rocha, Á.; Guarda, T., Eds.; Springer International Publishing: Cham, 2018; pp. 583–592.
- Abdullah, A.; Ismael, A.; Rashid, A.; Abou-Elnour, A.; Tarique, M. Real Time Wireless Health Monitoring Application Using Mobile Devices. International journal of Computer Networks & Communications 2015, 7, 13–30. [CrossRef]
- Schwartz, M.; Manickum, O. Programming Arduino with LabVIEW; Community experience distilled, Packt Publishing, 2015.
- Tehami, S.; Khan, M.A.; Mazhar, O. Hardware and software designing of USB based plug n play data acquisition device with C and LabView compatibility. 2015 IEEE 21st International Symposium for Design and Technology in Electronic Packaging (SIITME), 2015, pp. 143–146. [CrossRef]
- Tong-on, A.; Saphet, P.; Thepnurat, M. Simple Harmonics Motion experiment based on LabVIEW interface for Arduino. Journal of Physics: Conference Series 2017, 901, 012114. [CrossRef]
- Al-Arga, A.S.D. Liquid Level Control System with arduino Uno and Labview. Journal of Alasmarya University 2017, 2, 57–68.
- Mohanraj, K.; Balaji, N.; Chithrakkannan, R. IoT BASED PATIENT MONITORING SYSTEM USING RASPBERRY PI 3 and LabVIEW. 2017.
- Touati, F.; Al-Hitmi, M.; Chowdhury, N.A.; Hamad, J.A.; San Pedro Gonzales, A.J. Investigation of solar PV performance under Doha weather using a customized measurement and monitoring system. Renewable Energy 2016, 89, 564–577. [CrossRef]
- Rajkumar, R.; Alexander, T.; Subramoniam, M. Arduino Based Wireless Datalogger For Nuclear Power Plant Using Processing Software. 2017 IEEE International Conference on Computational Intelligence and Computing Research (ICCIC), 2017, pp. 1–4. [CrossRef]
- González, A.; Olazagoitia, J.L.; Vinolas, J. A low-cost data acquisition system for automobile dynamics applications. Sensors 2018, 18, 366.
- Bassous, G.F.; Calili, R.F.; Barbosa, C.H. Development of a low-cost data acquisition system for very short-term photovoltaic power forecasting. Energies 2021, 14, 6075.
- Caballero-Russi, D.; Ortiz, A.R.; Guzmán, A.; Canchila, C. Design and Validation of a Low-Cost Structural Health Monitoring System for Dynamic Characterization of Structures. Applied Sciences 2022, 12, 2807.
- Fernández-Conde, J. A Low-Cost Hardware/Software Platform for Lossless Real-Time Data Acquisition from Imaging Spectrometers. Sensors 2023, 23, 4349.
- Özdemir, K.; Kömeç Mutlu, A. Cost-effective data acquisition systems for advanced structural health monitoring. Sensors 2024, 24, 4269.
- Haizad, M.; Ibrahim, R.; Adnan, A.; Chung, T.D.; Hassan, S.M. Development of low-cost real-time data acquisition system for process automation and control. 2016 2nd IEEE International Symposium on Robotics and Manufacturing Automation (ROMA). IEEE, 2016, pp. 1–5.
Figure 1.
Global view of the software and hardware using in the study (Prototyping).
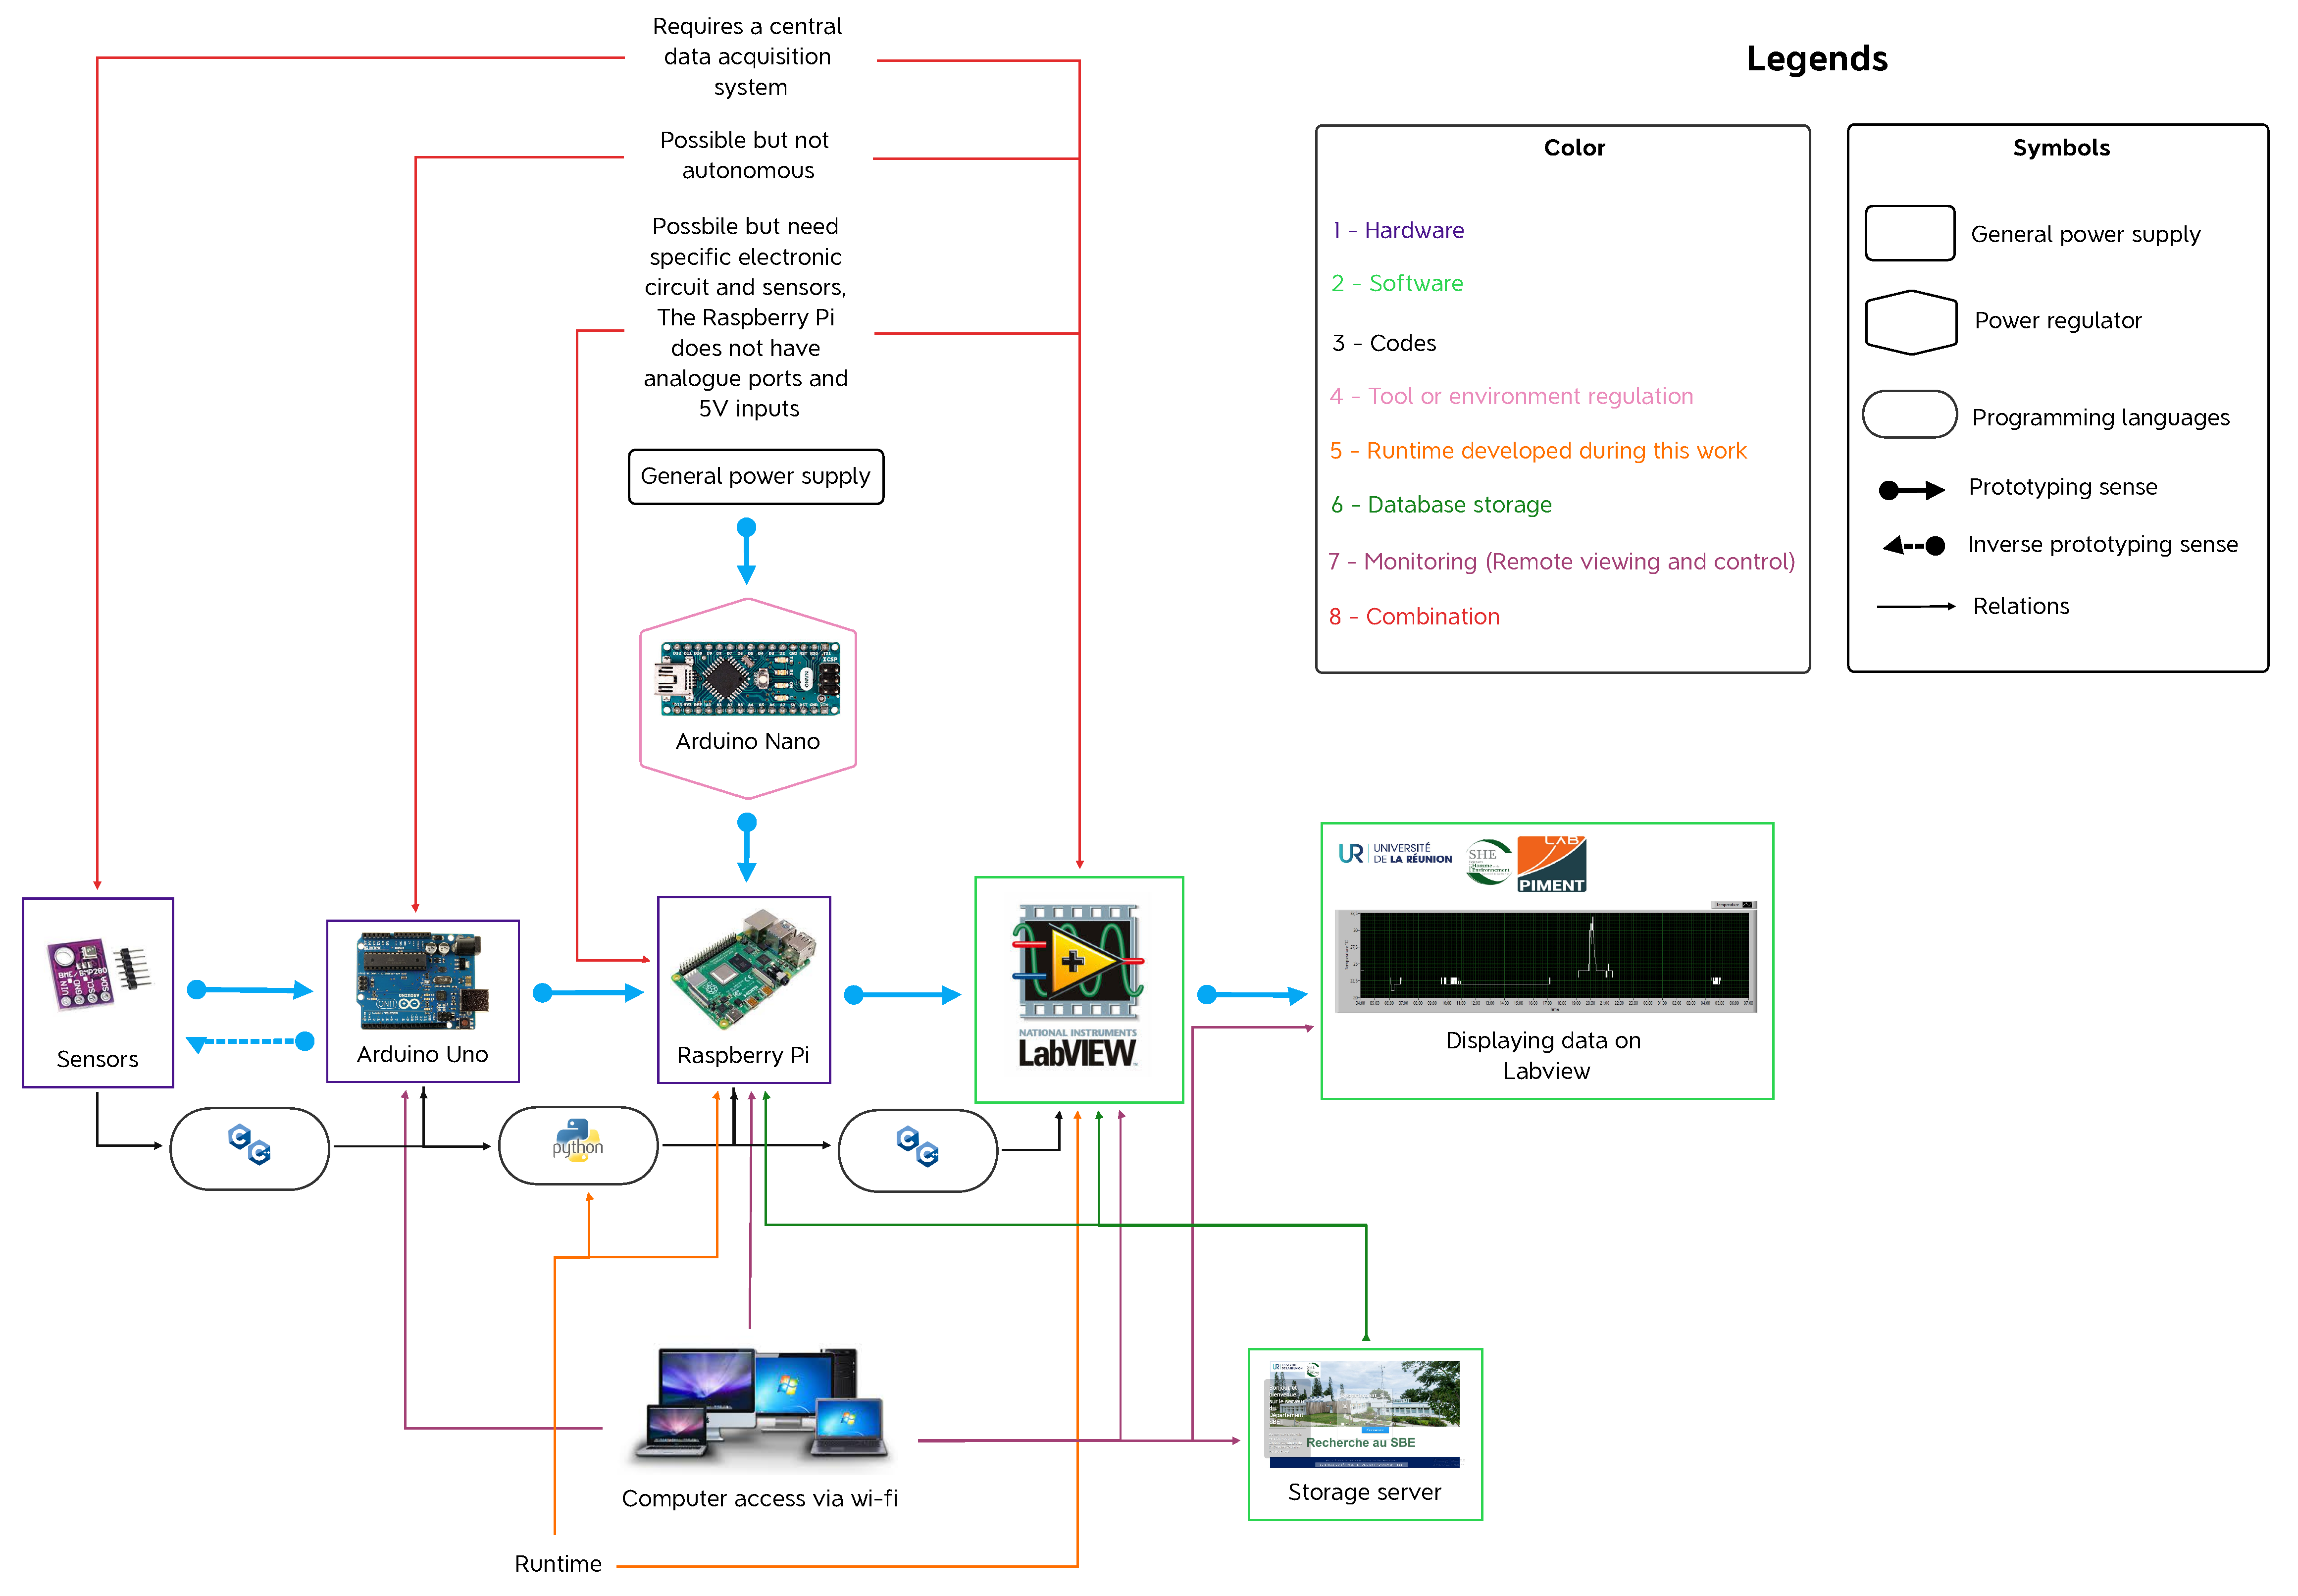
Figure 2.
Combinations of hardware and software.
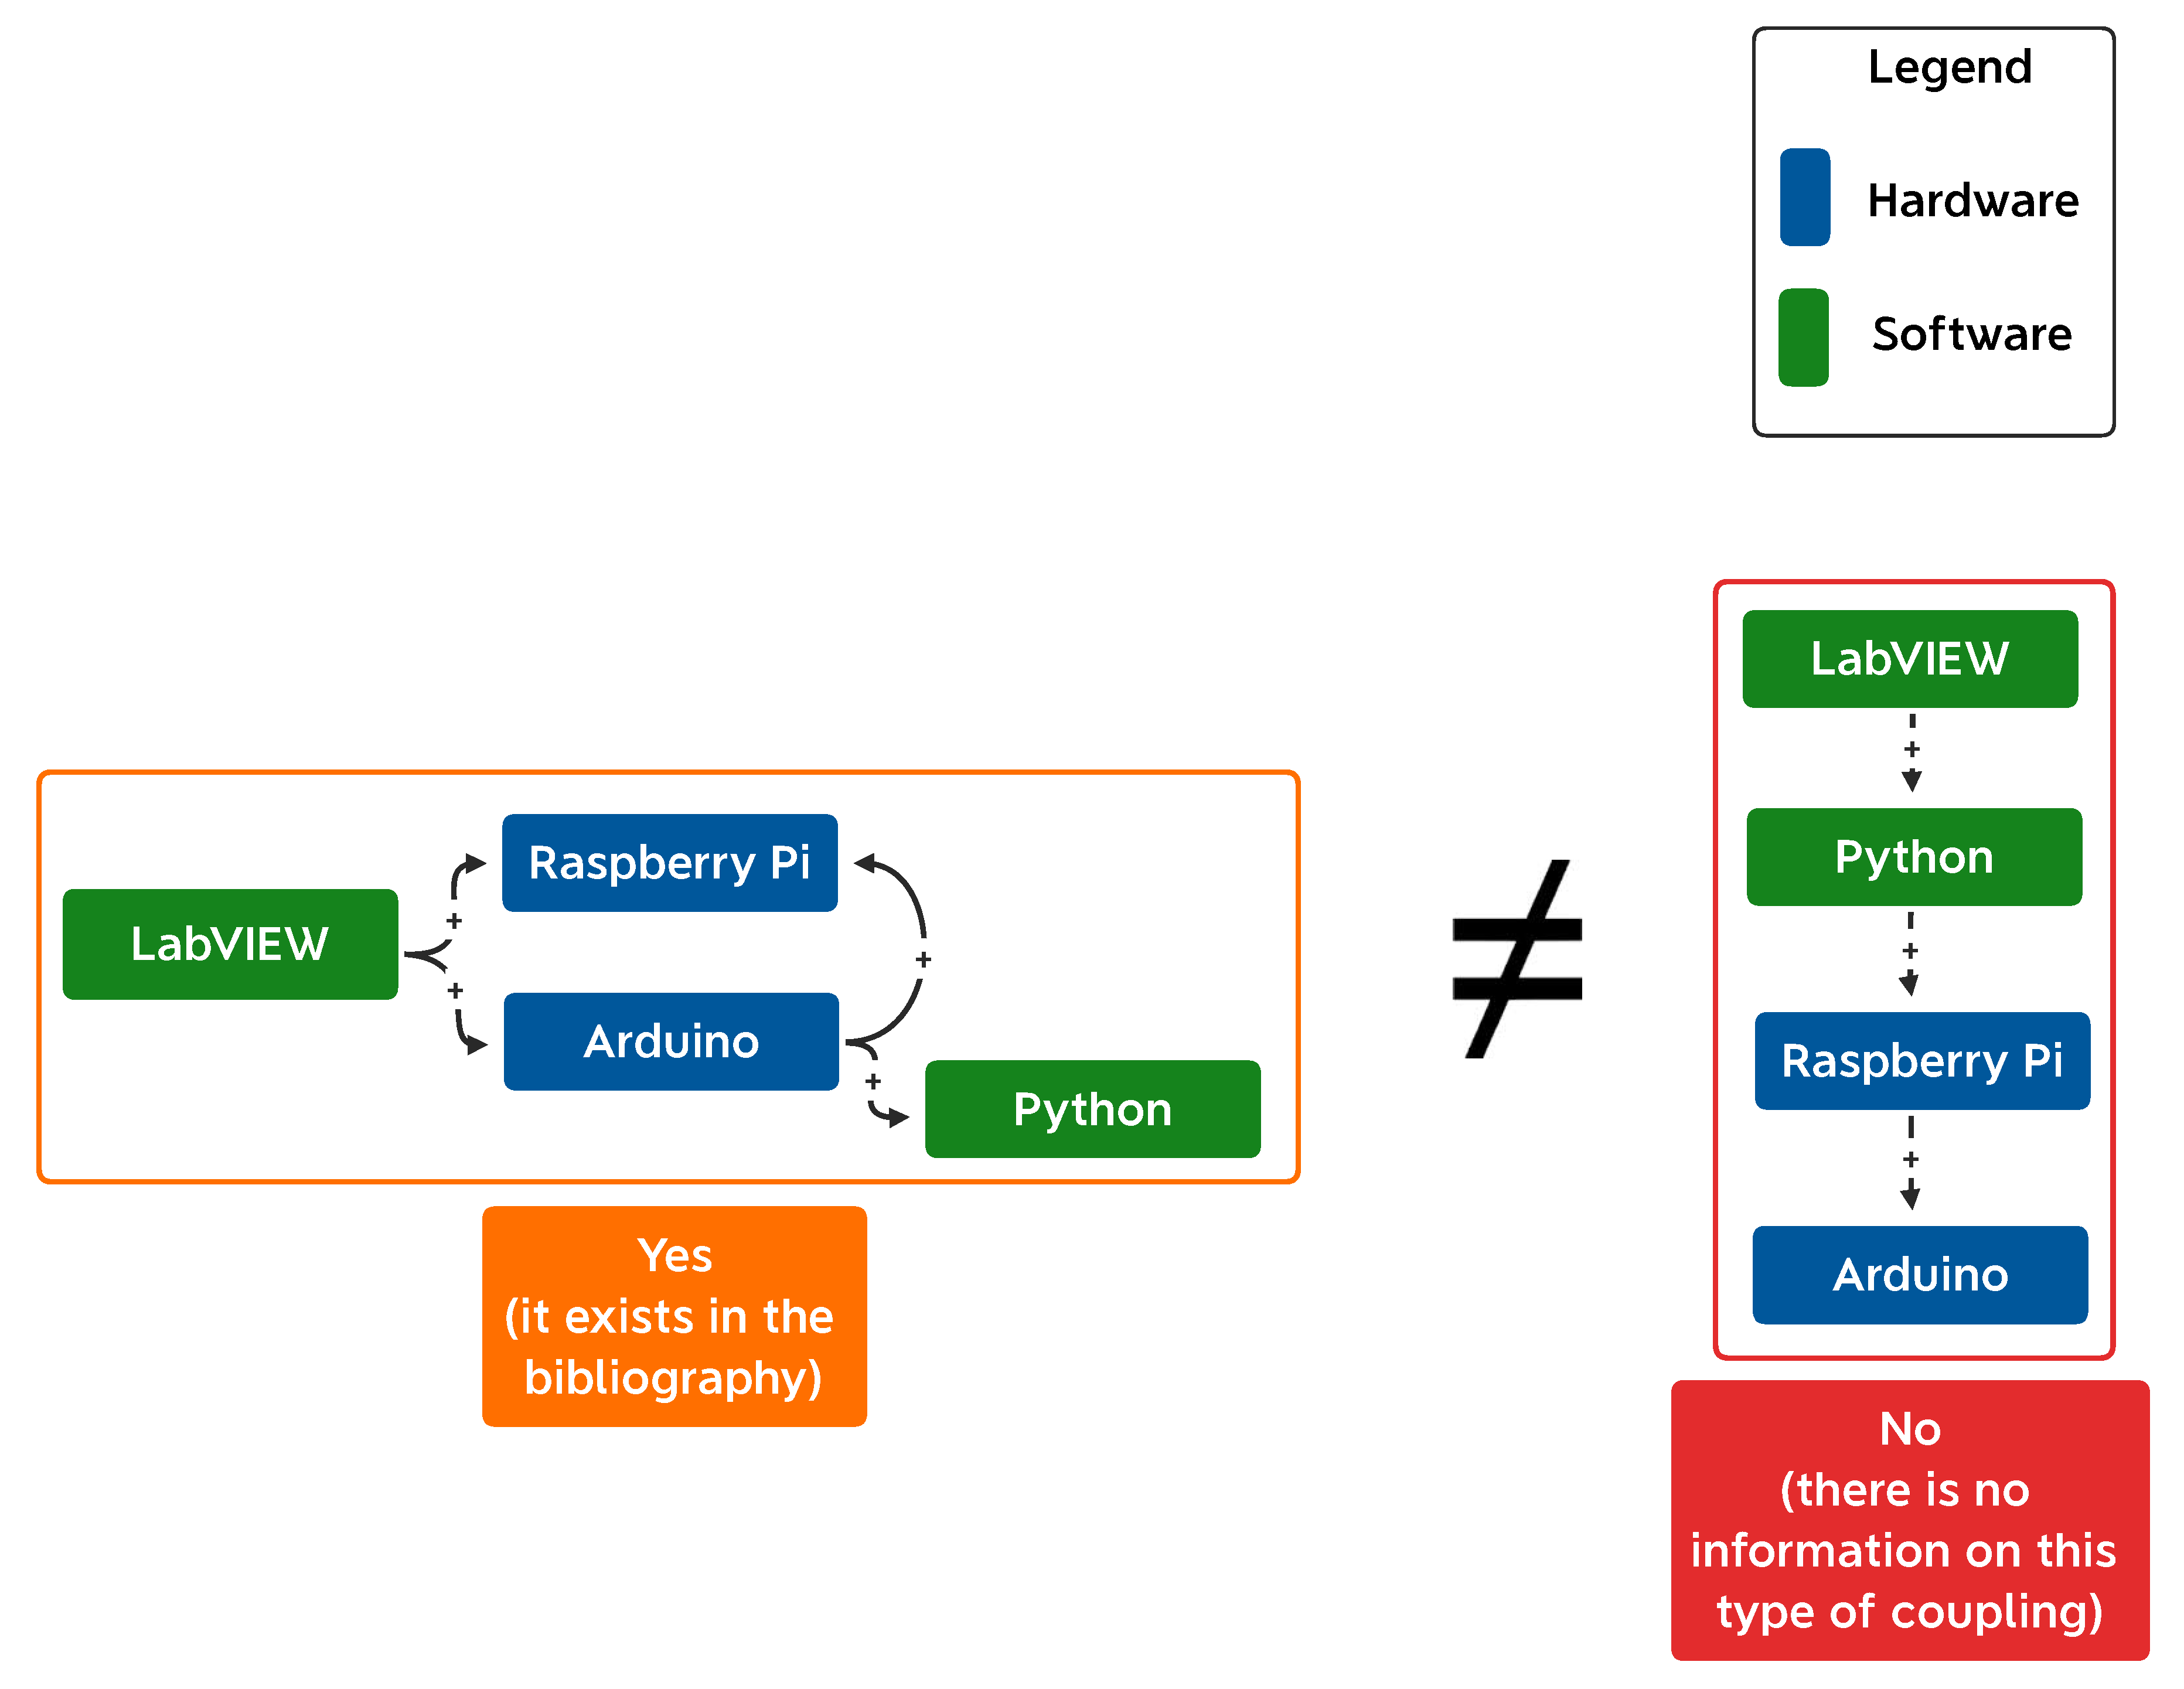
Figure 3.
and ADC physical environments description.
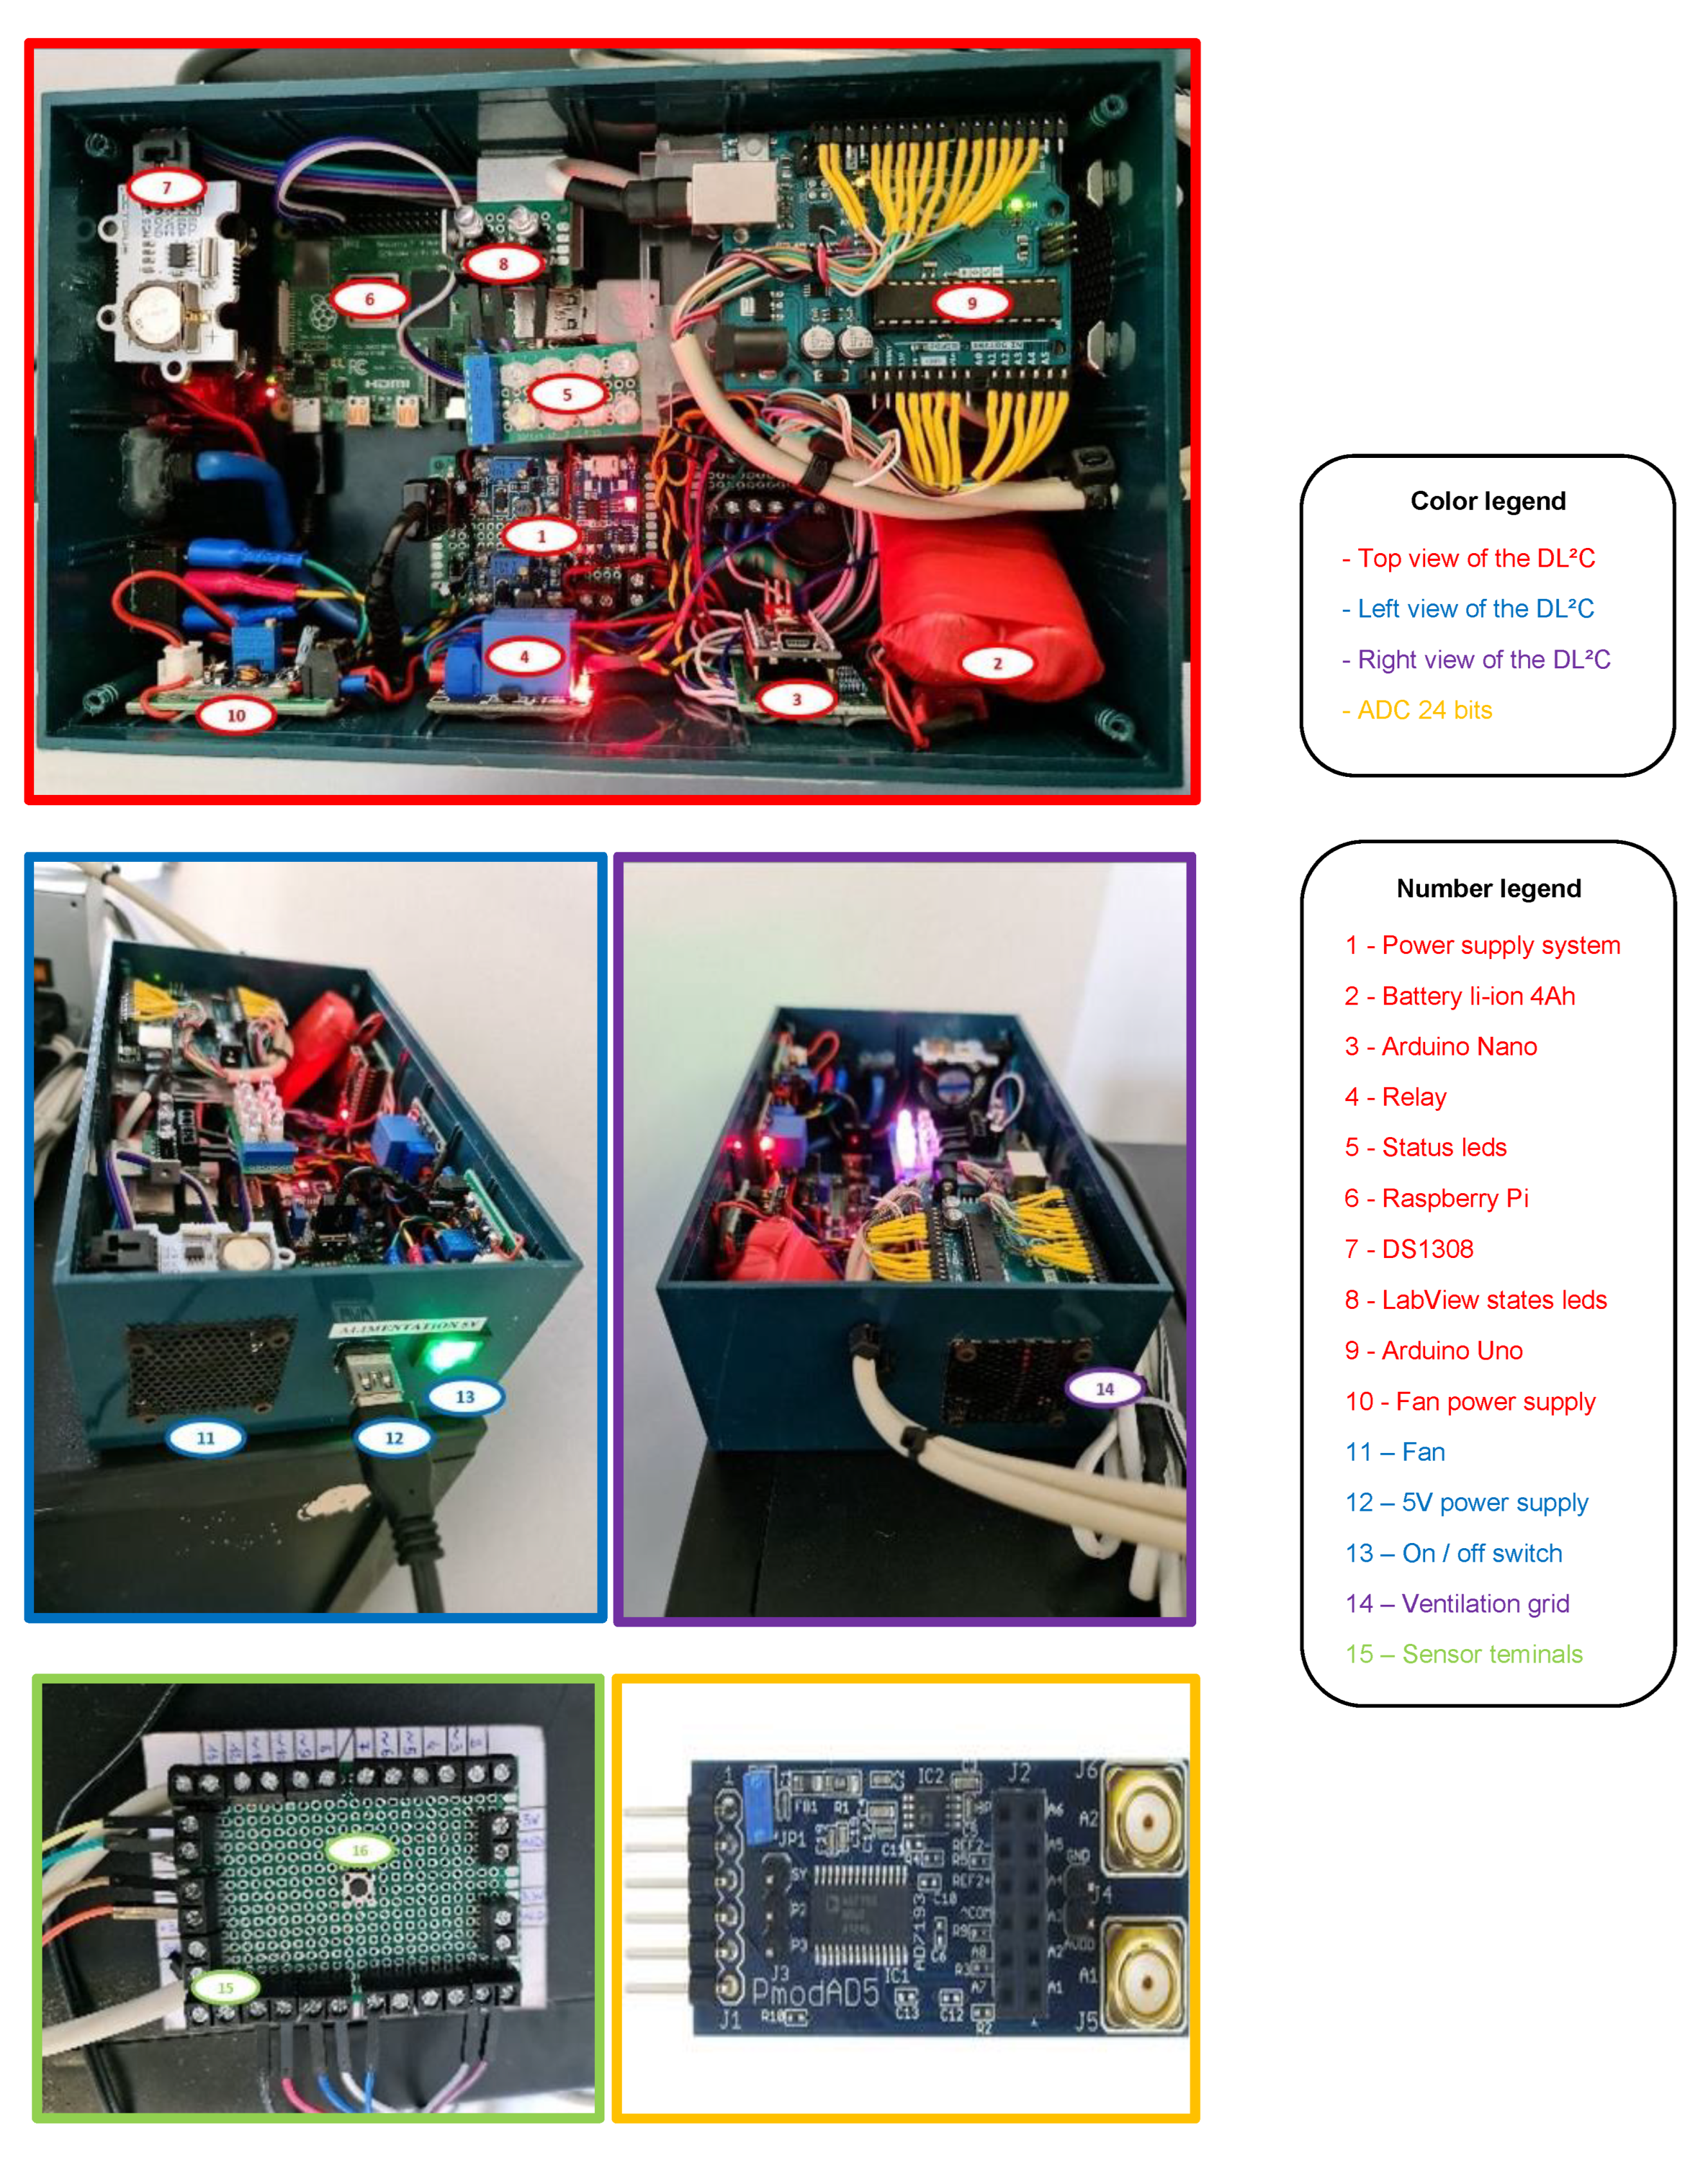
Figure 4.
Presentation of the software and hardware parts of the .
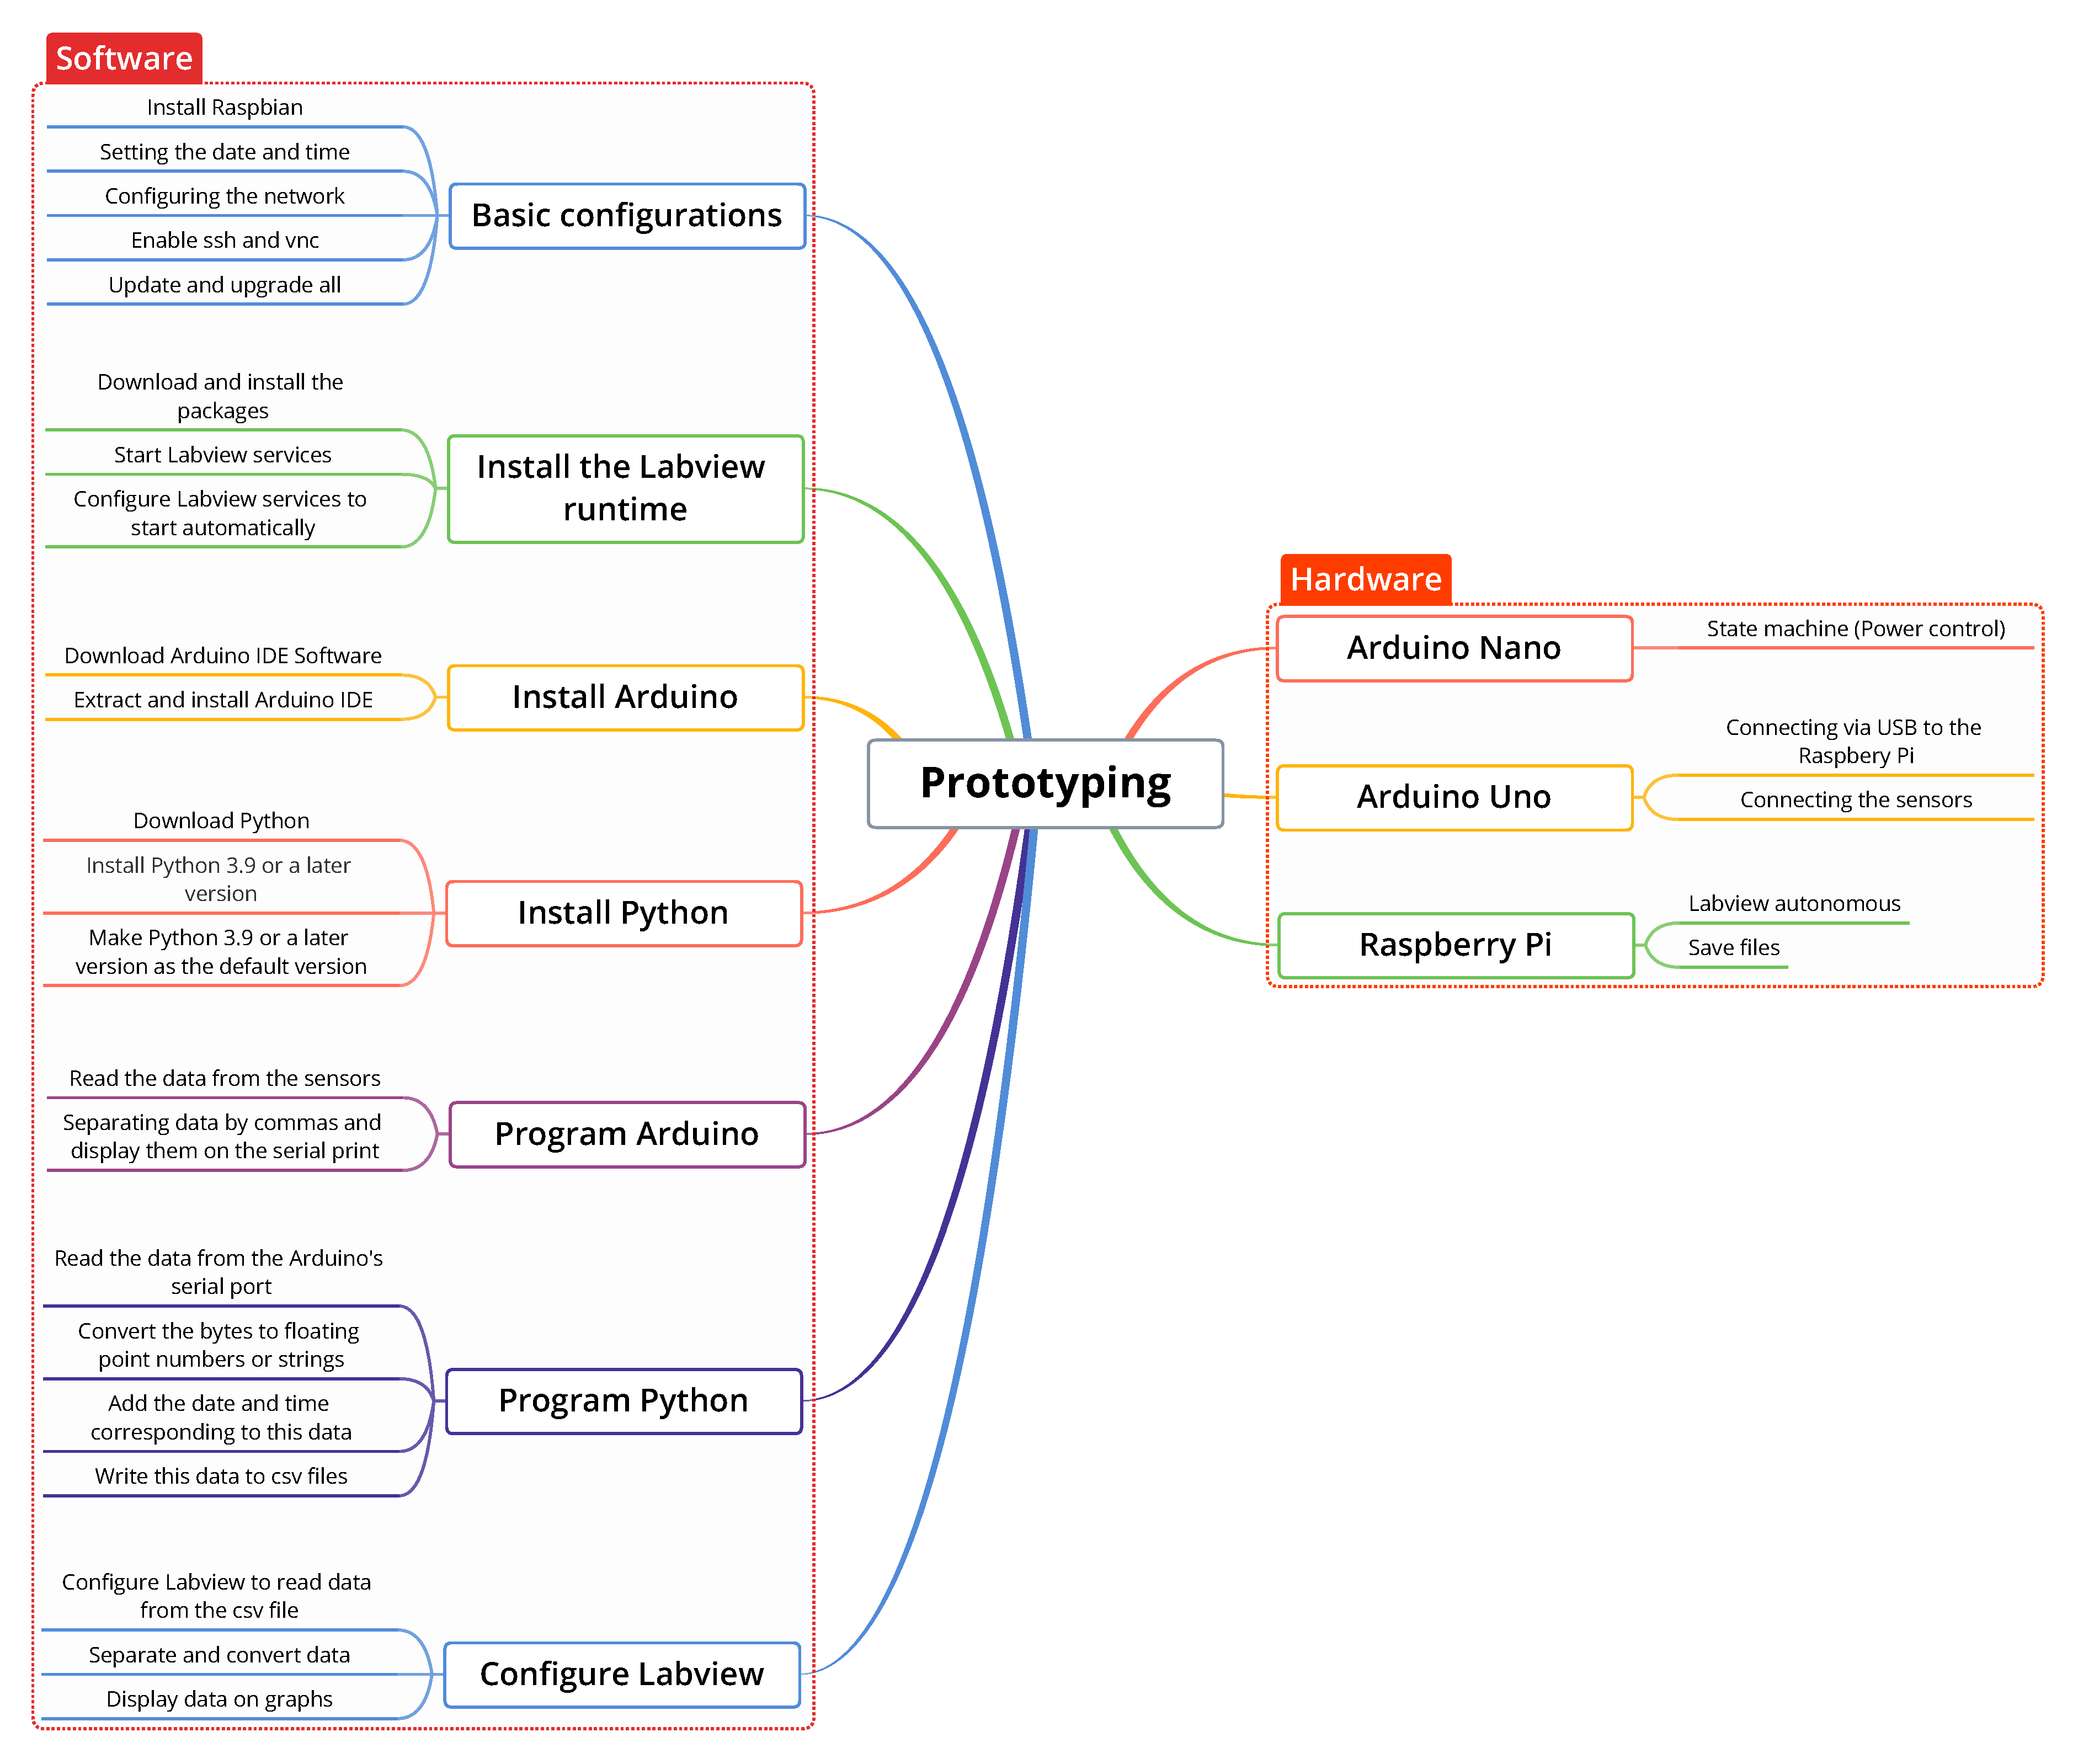
Figure 5.
Diagram of the initialization process.
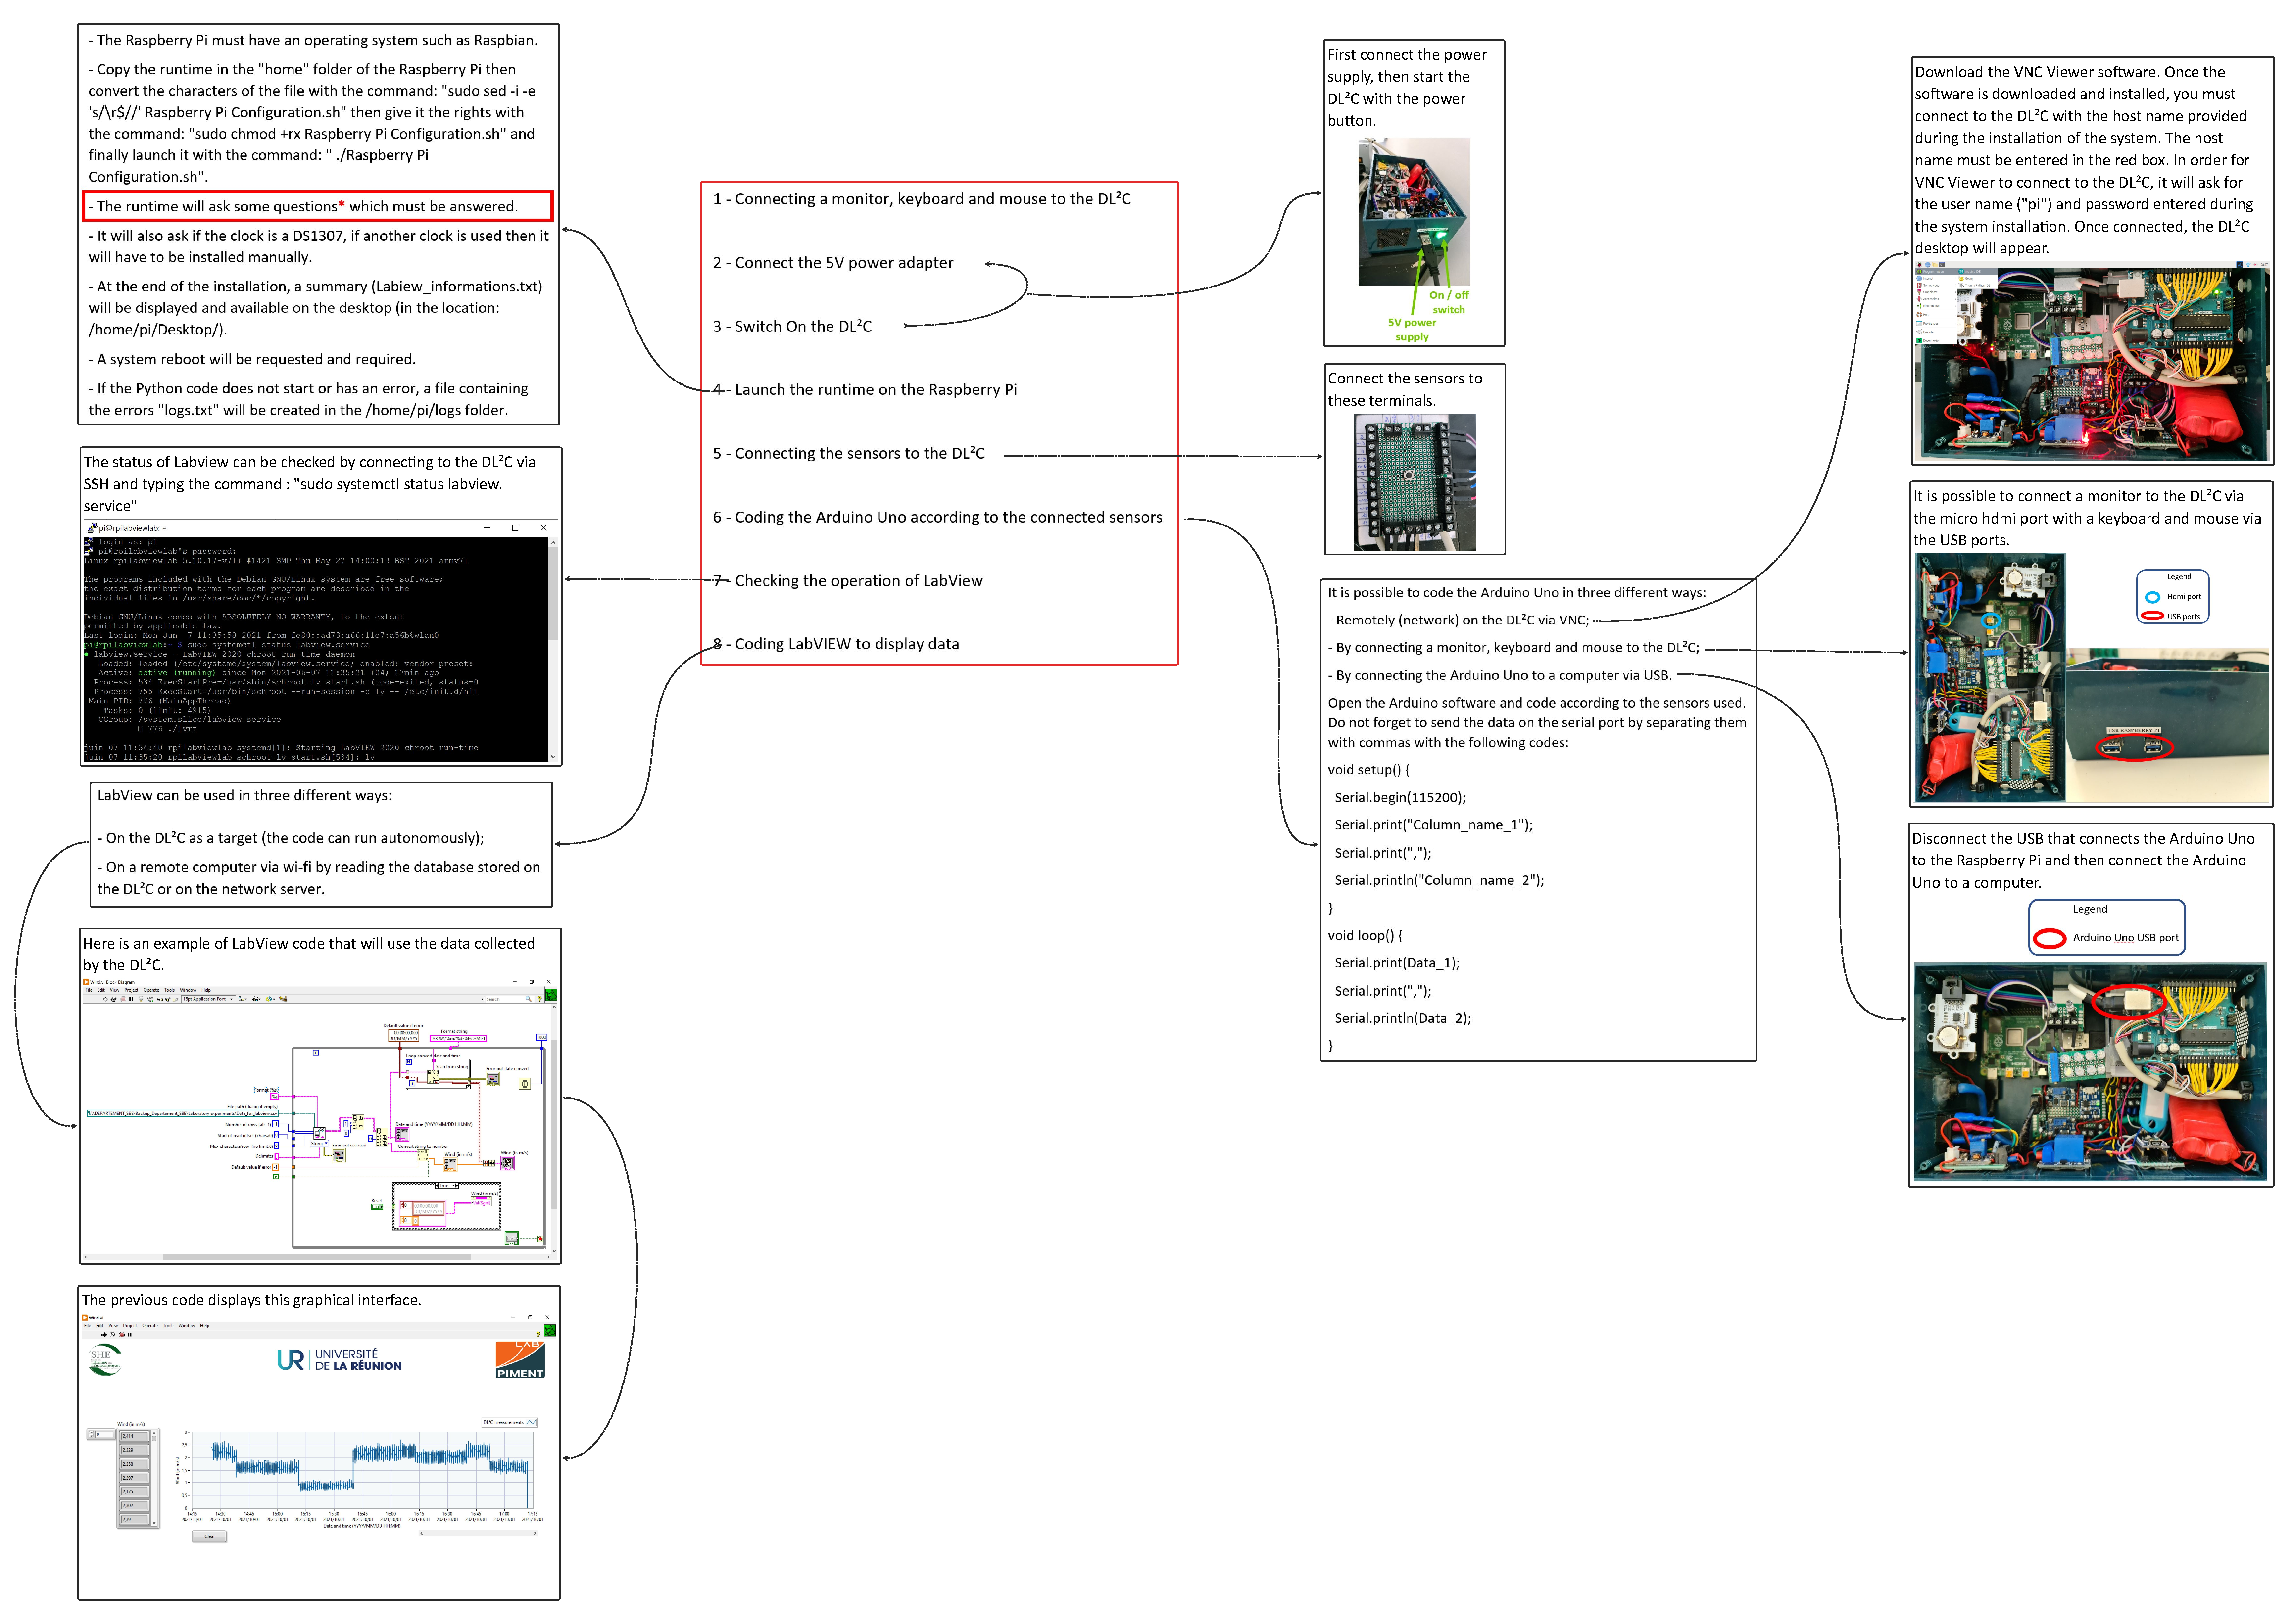
Figure 6.
Electronic diagram of the .
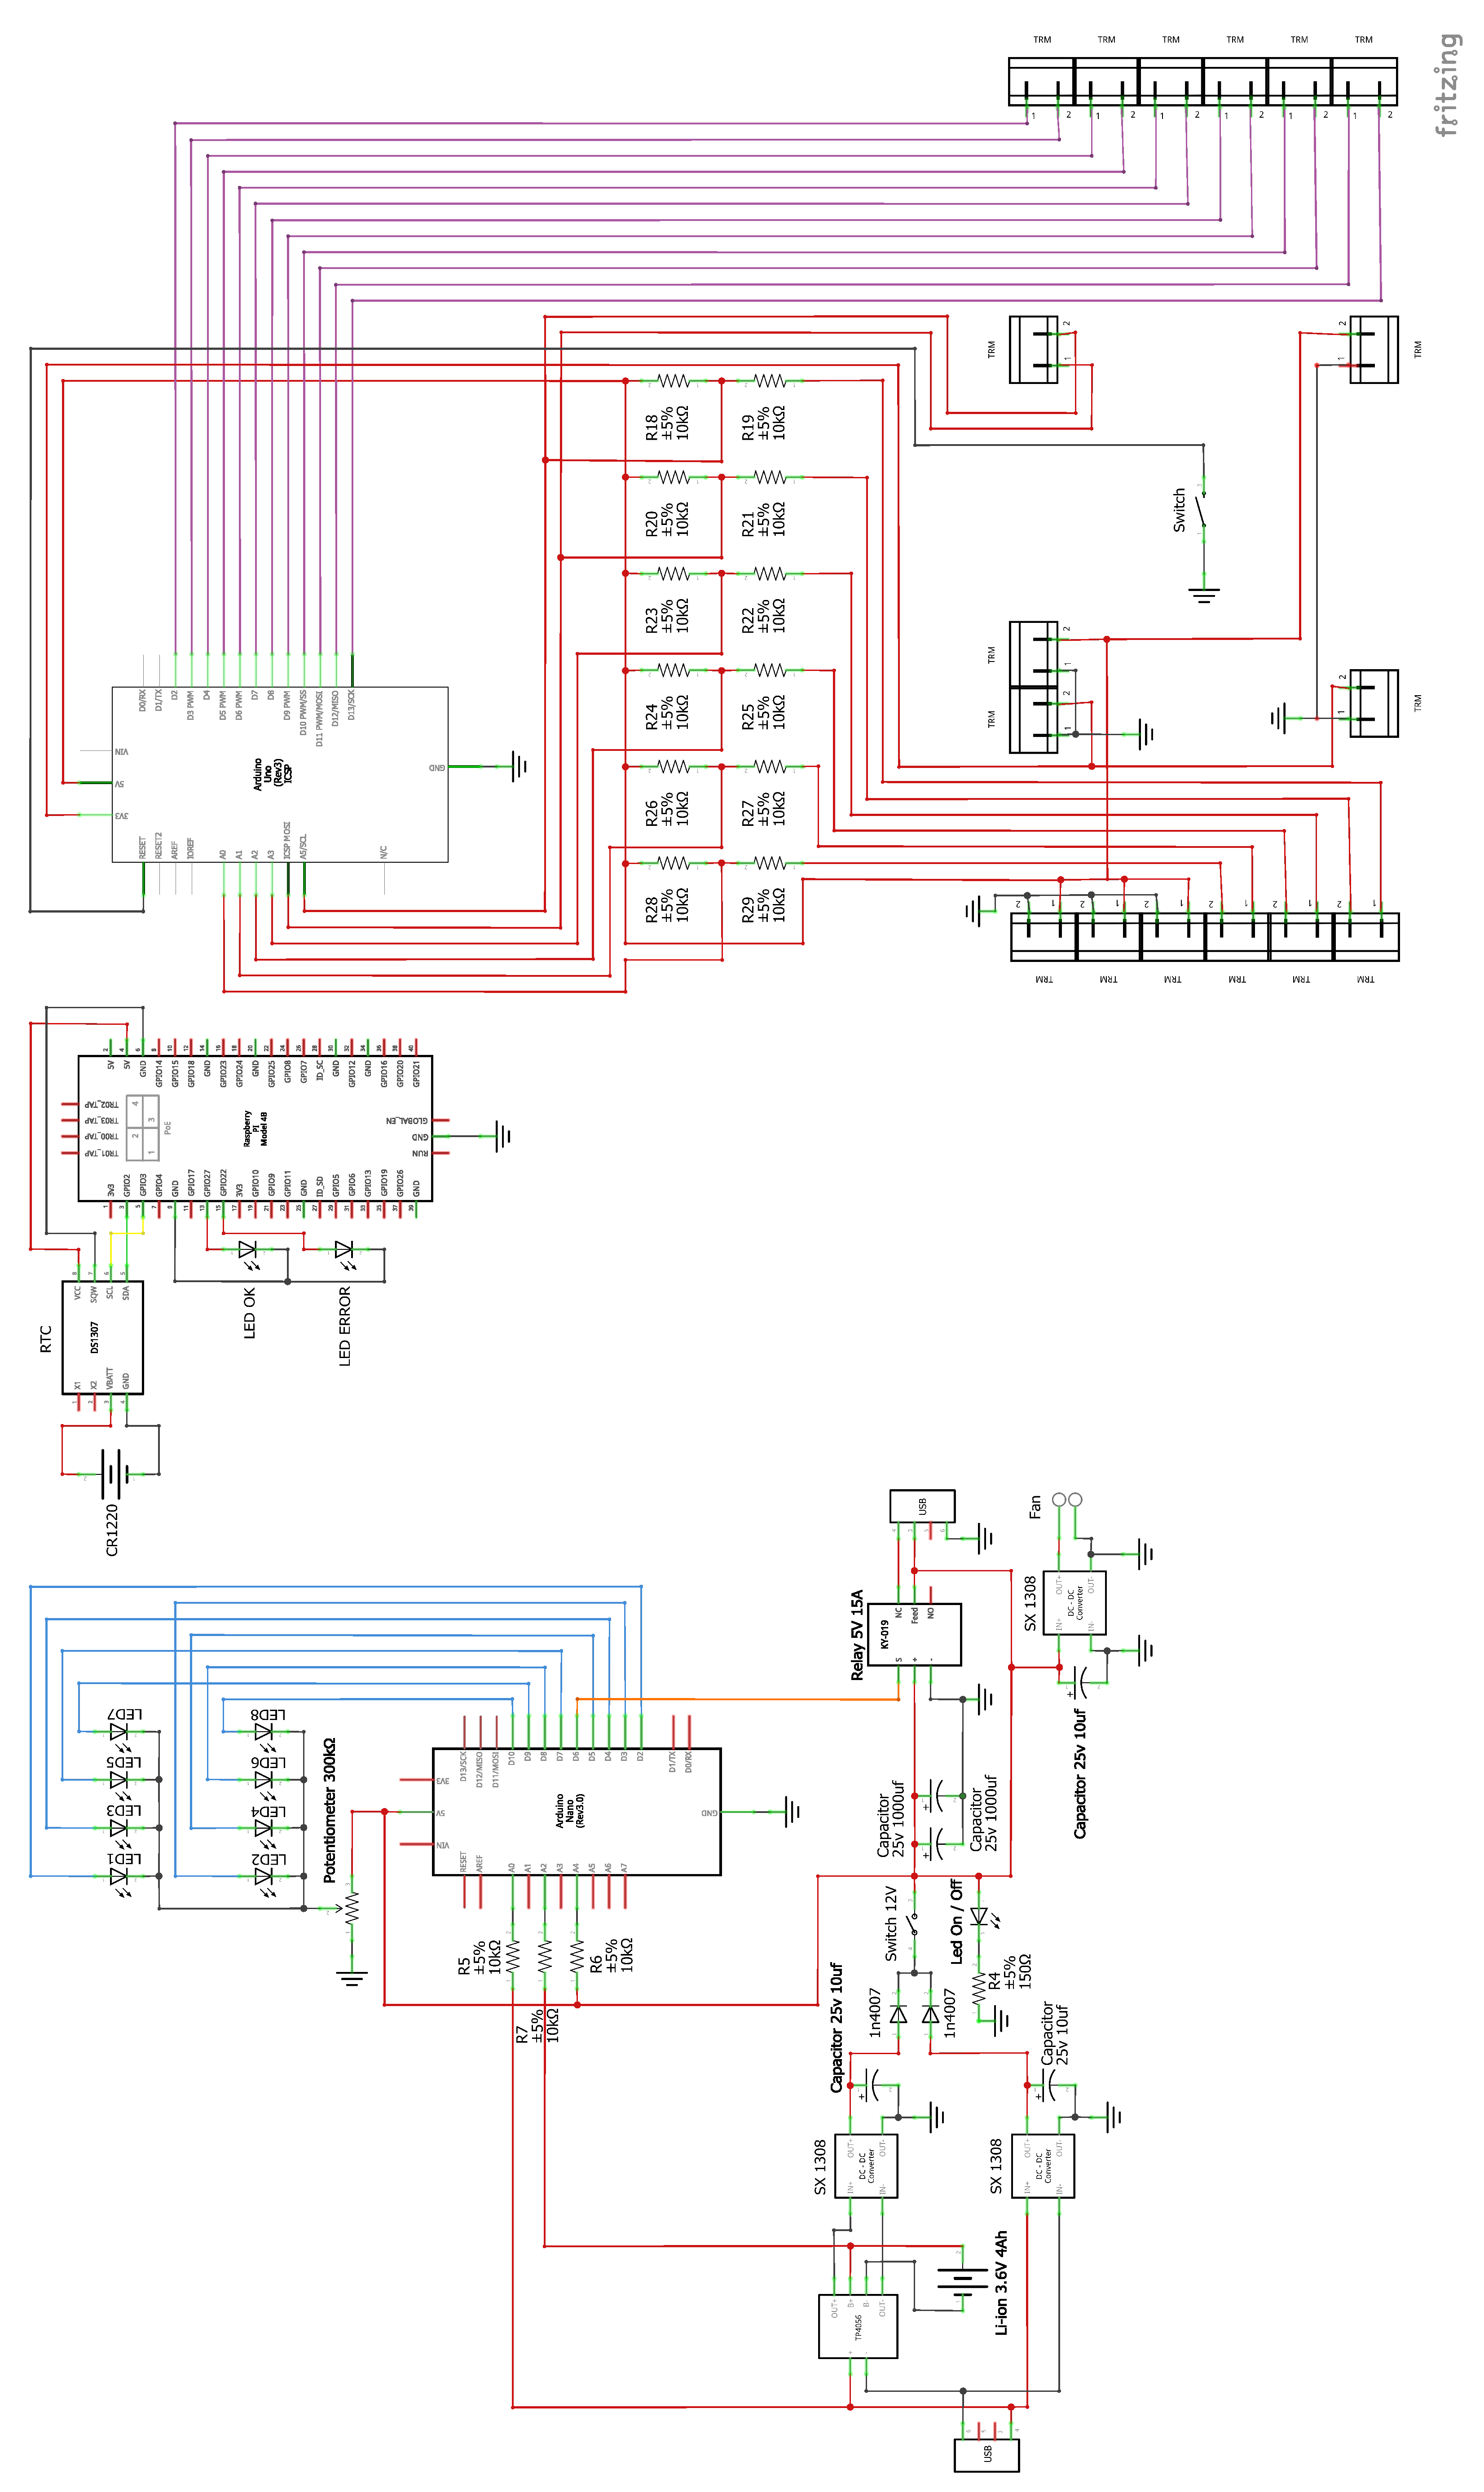
Figure 7.
Sensor connection terminals.
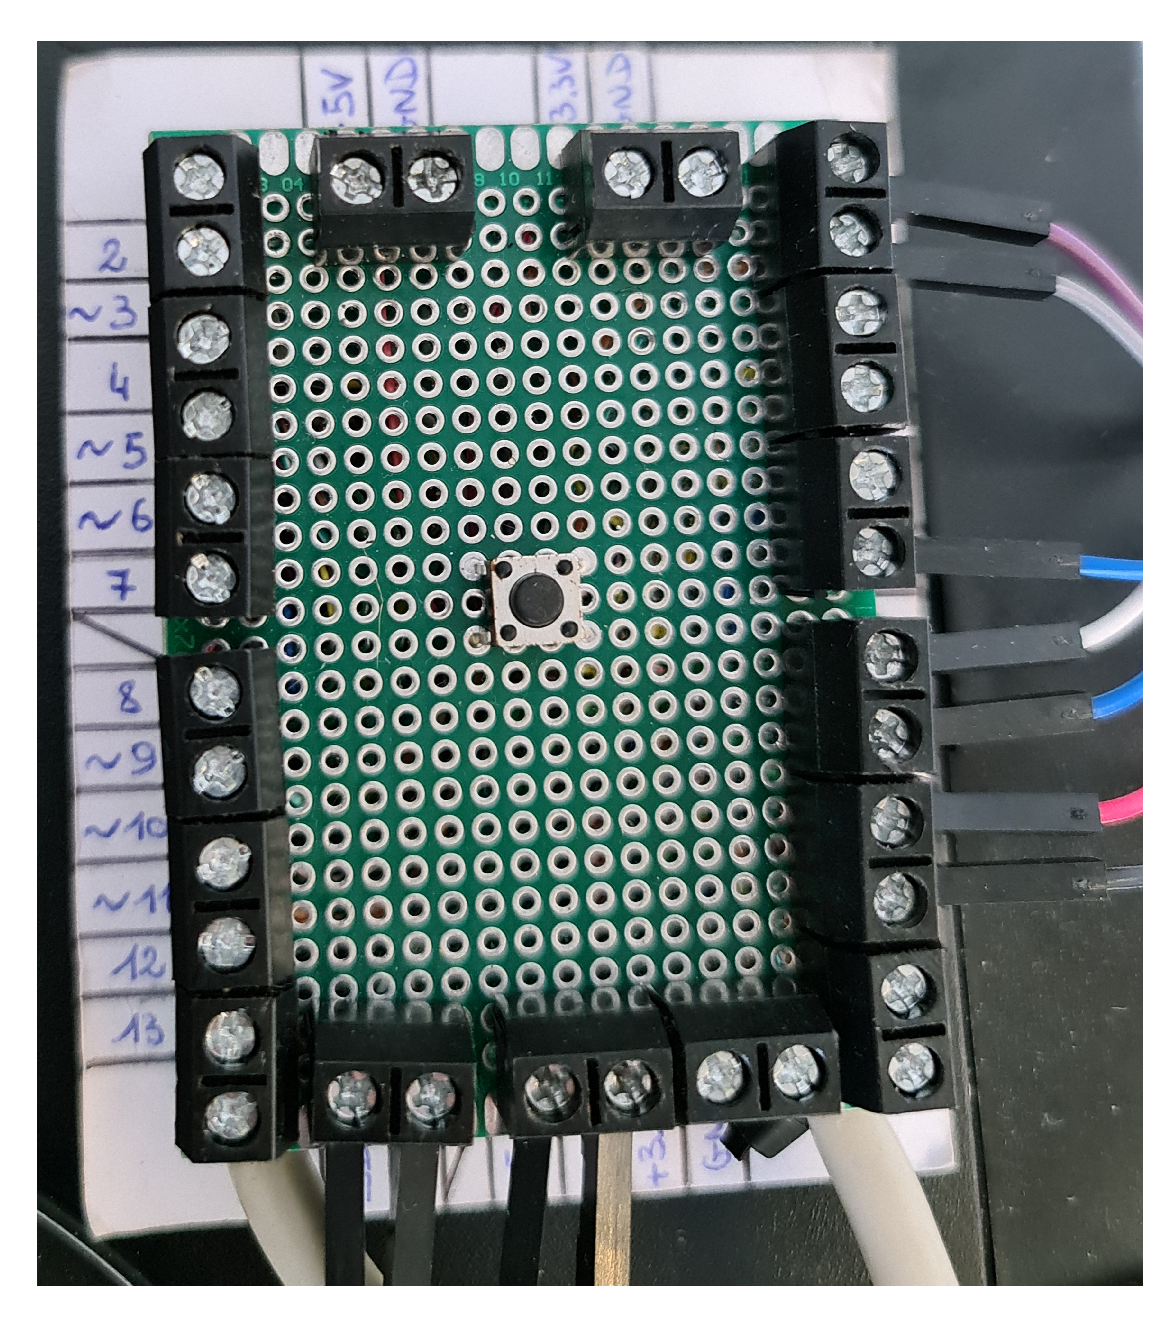
Figure 8.
Algorithm 1 (Algorithm for power management using the Arduino Nano).
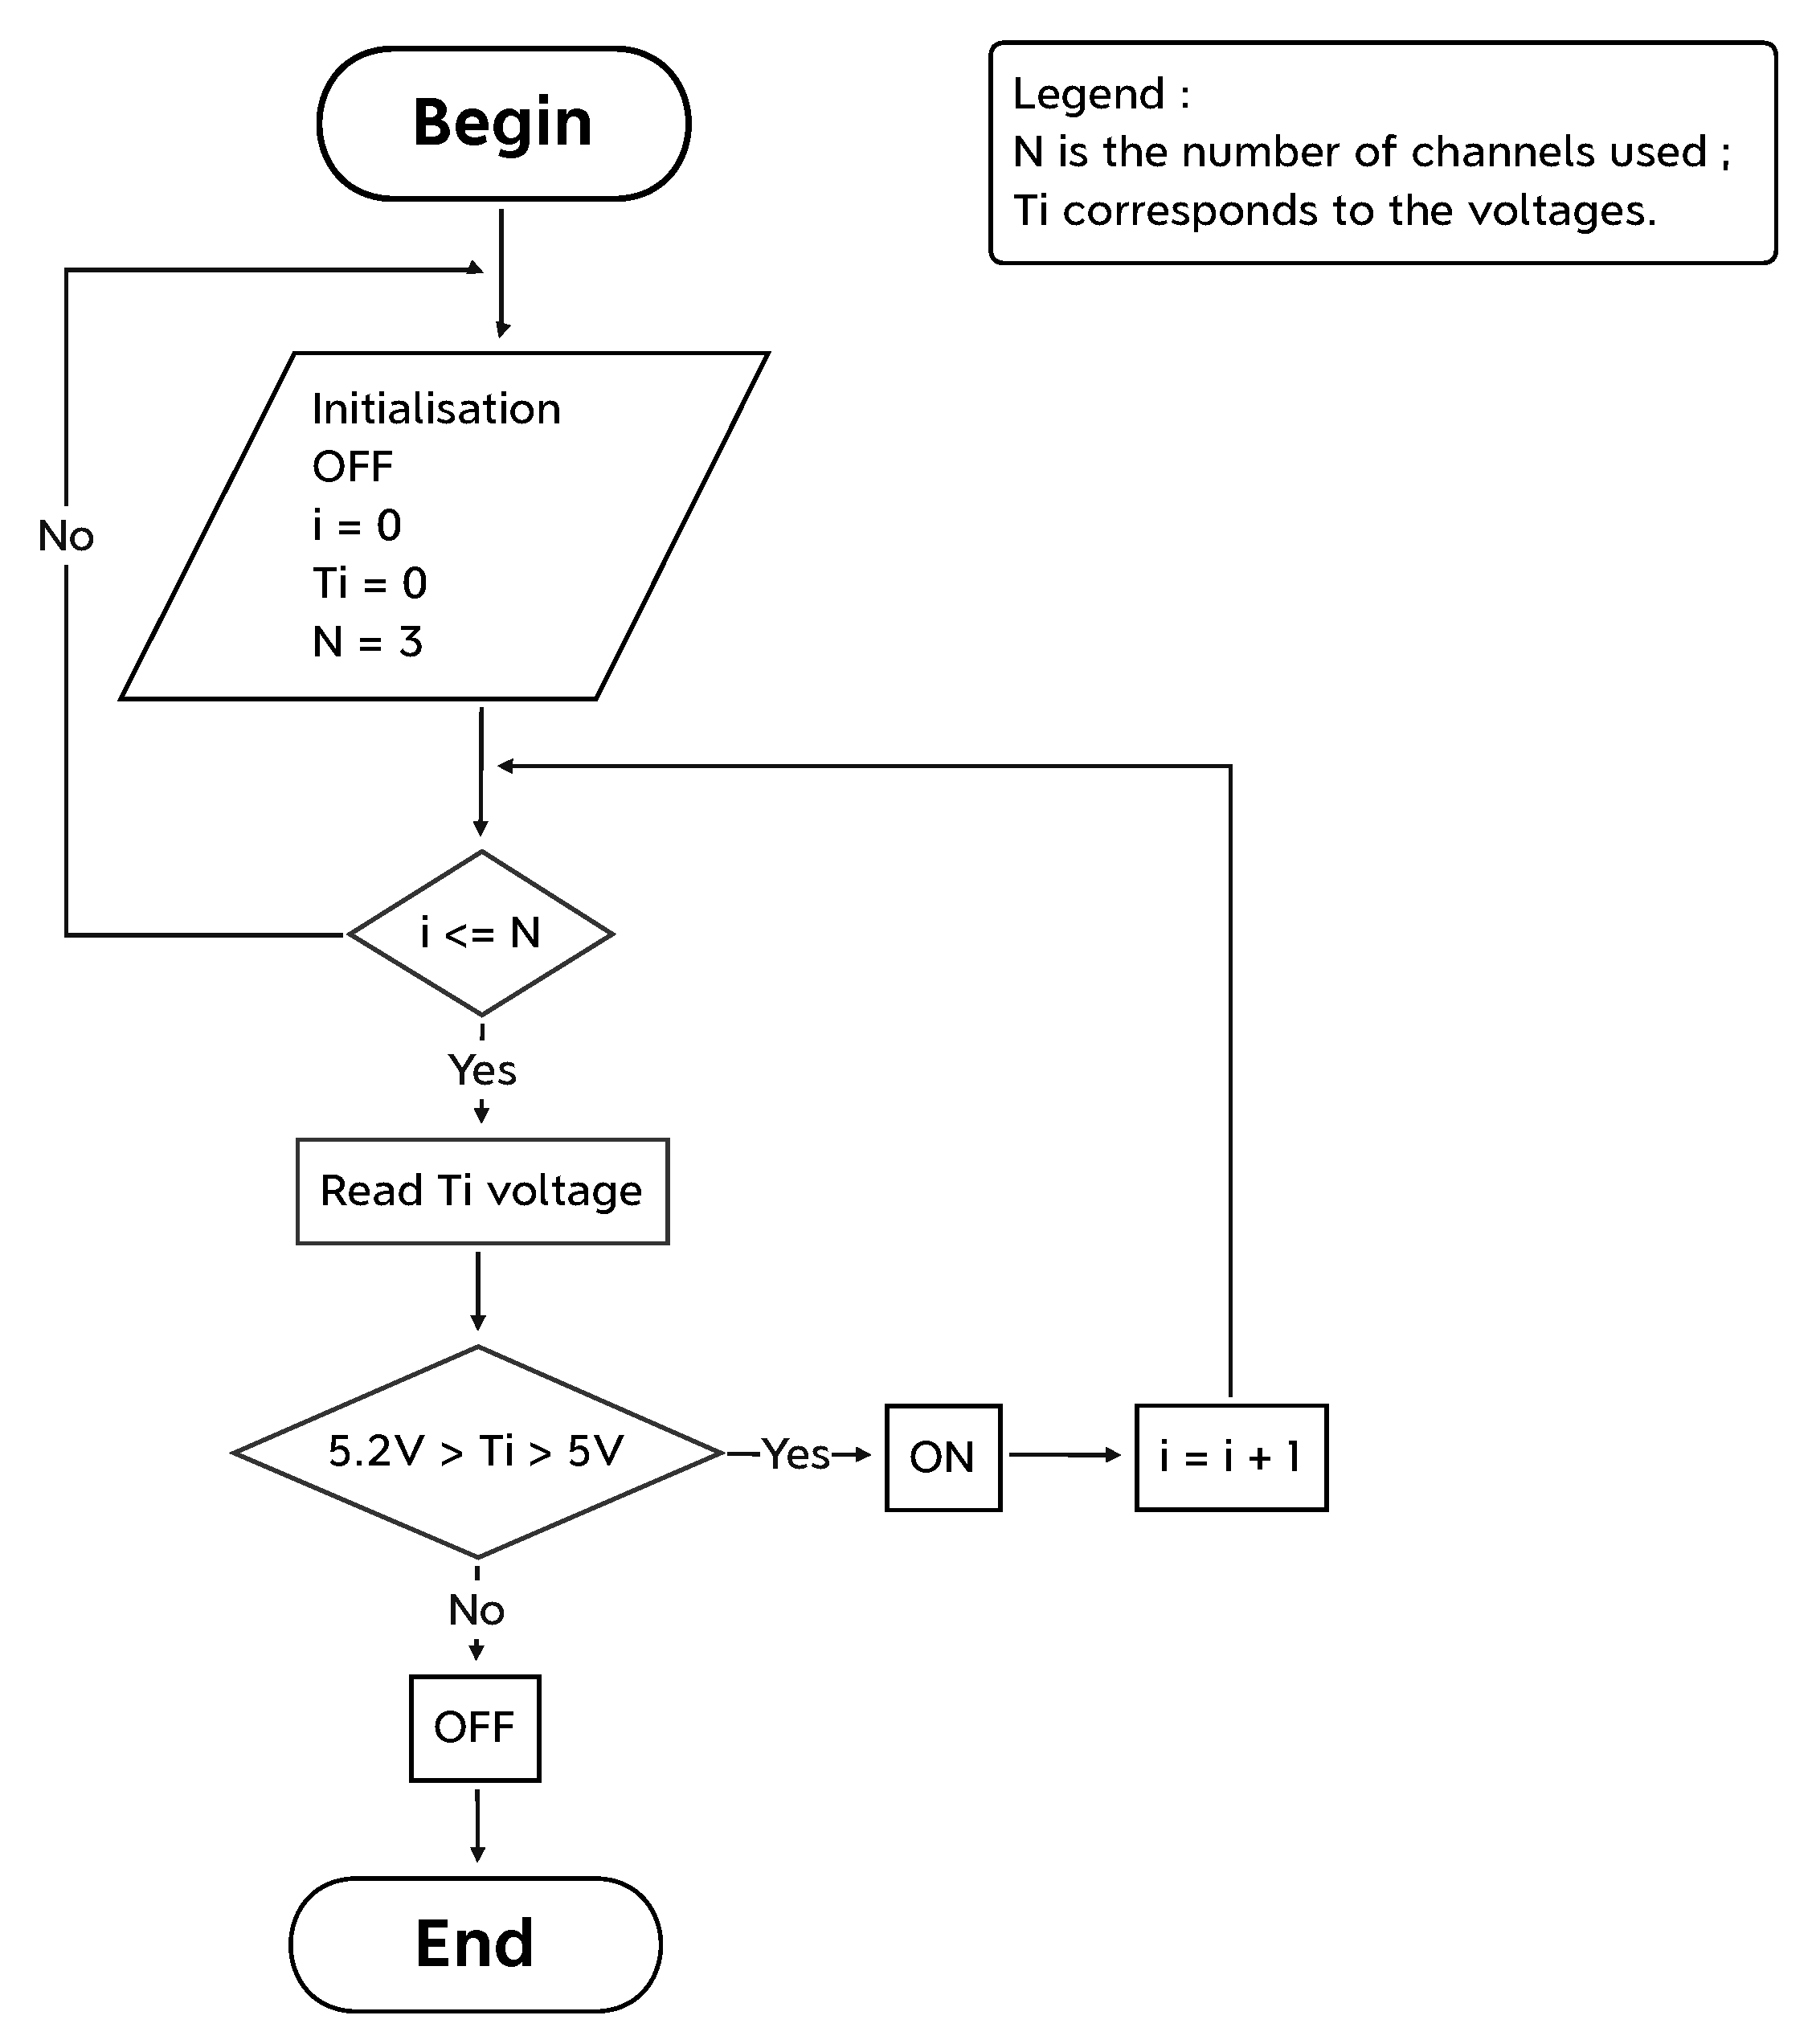
Figure 9.
Algorithm 2 (Arduino Uno).
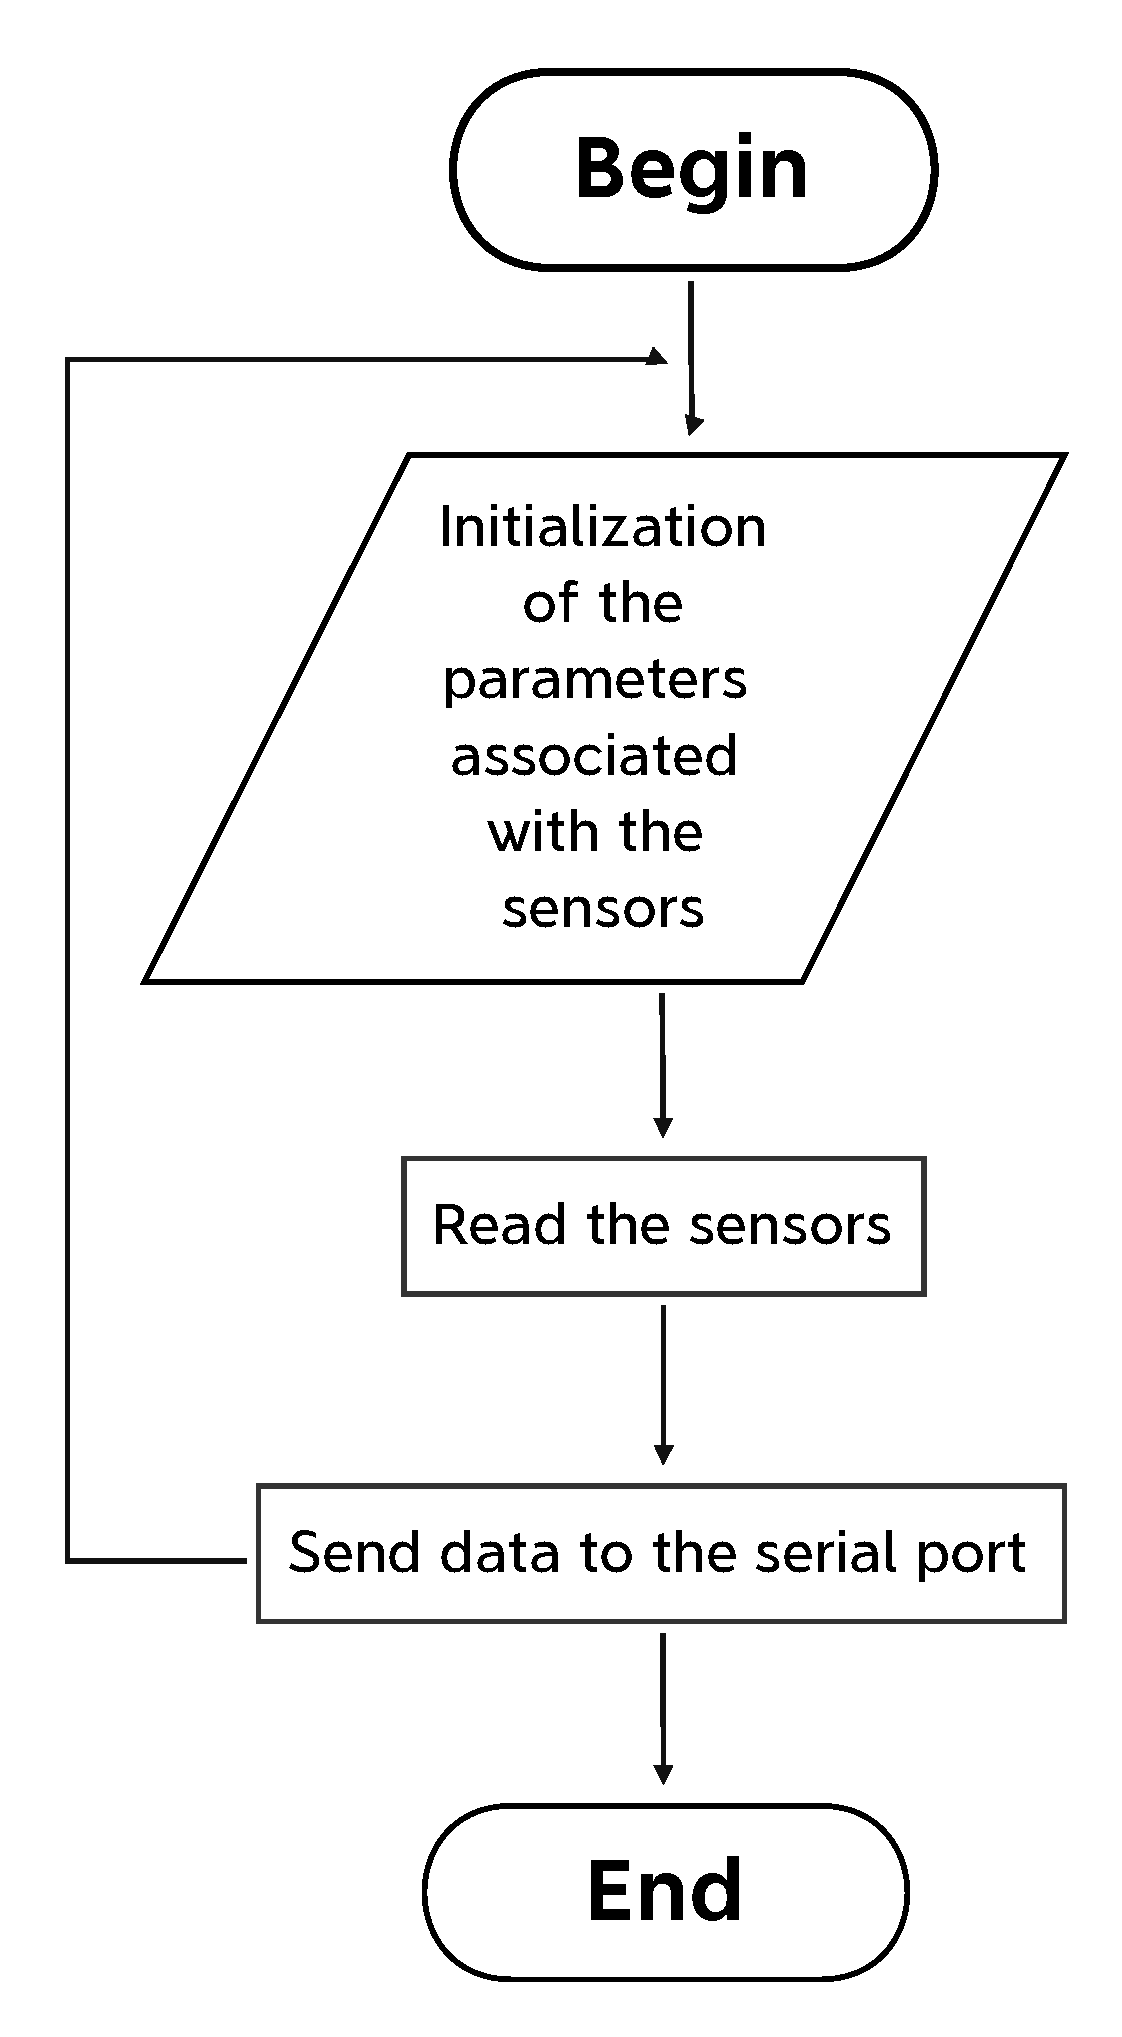
Figure 10.
Algorithm 3 (Algorithm in Python code).
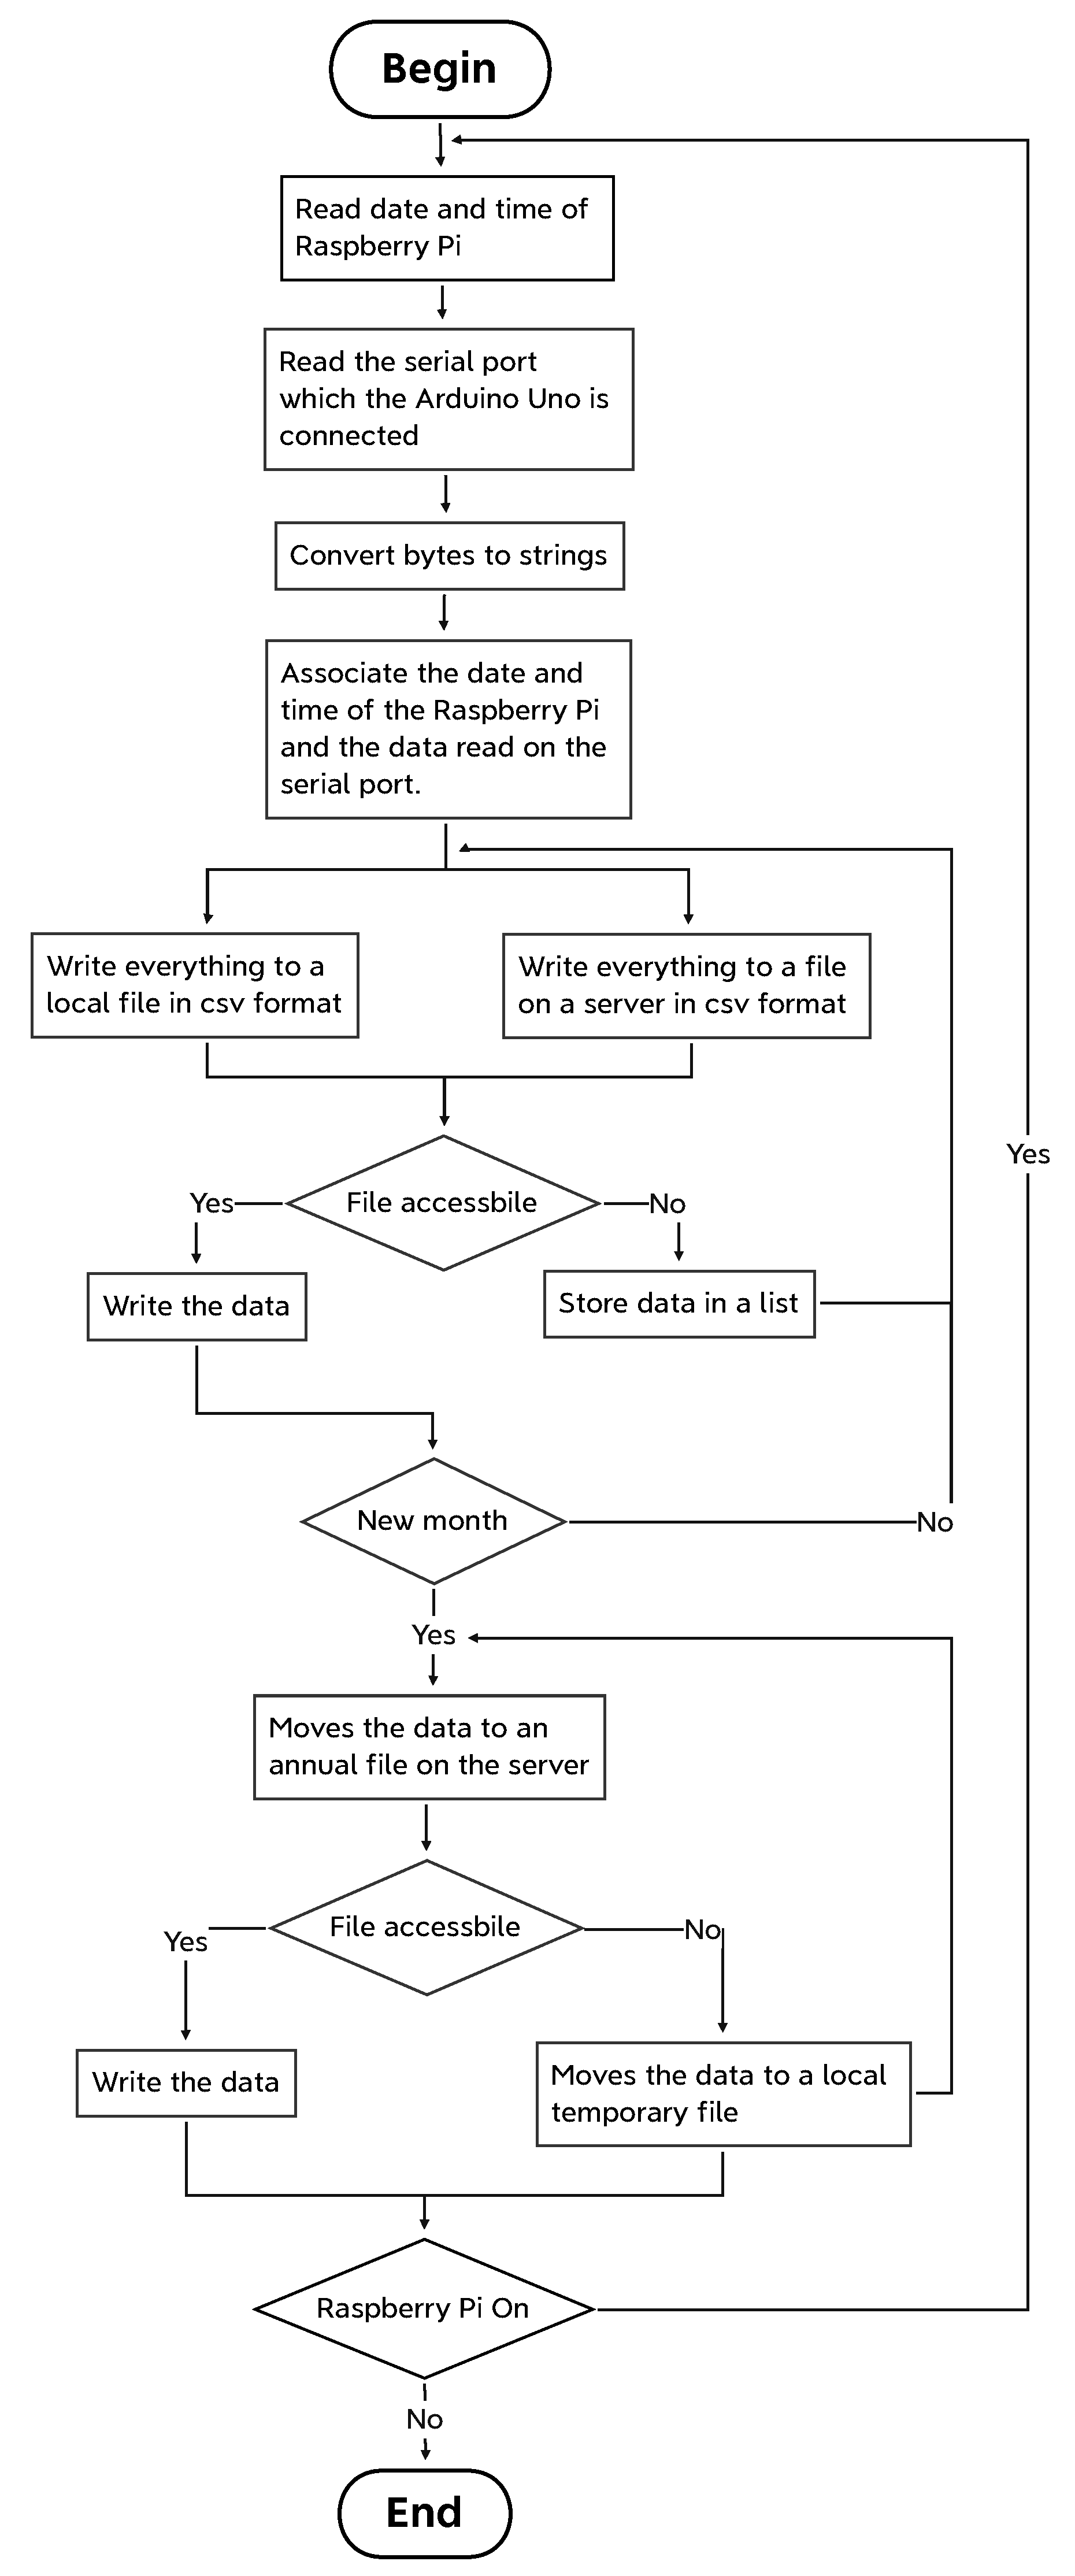
Figure 11.
Example of LabView code.
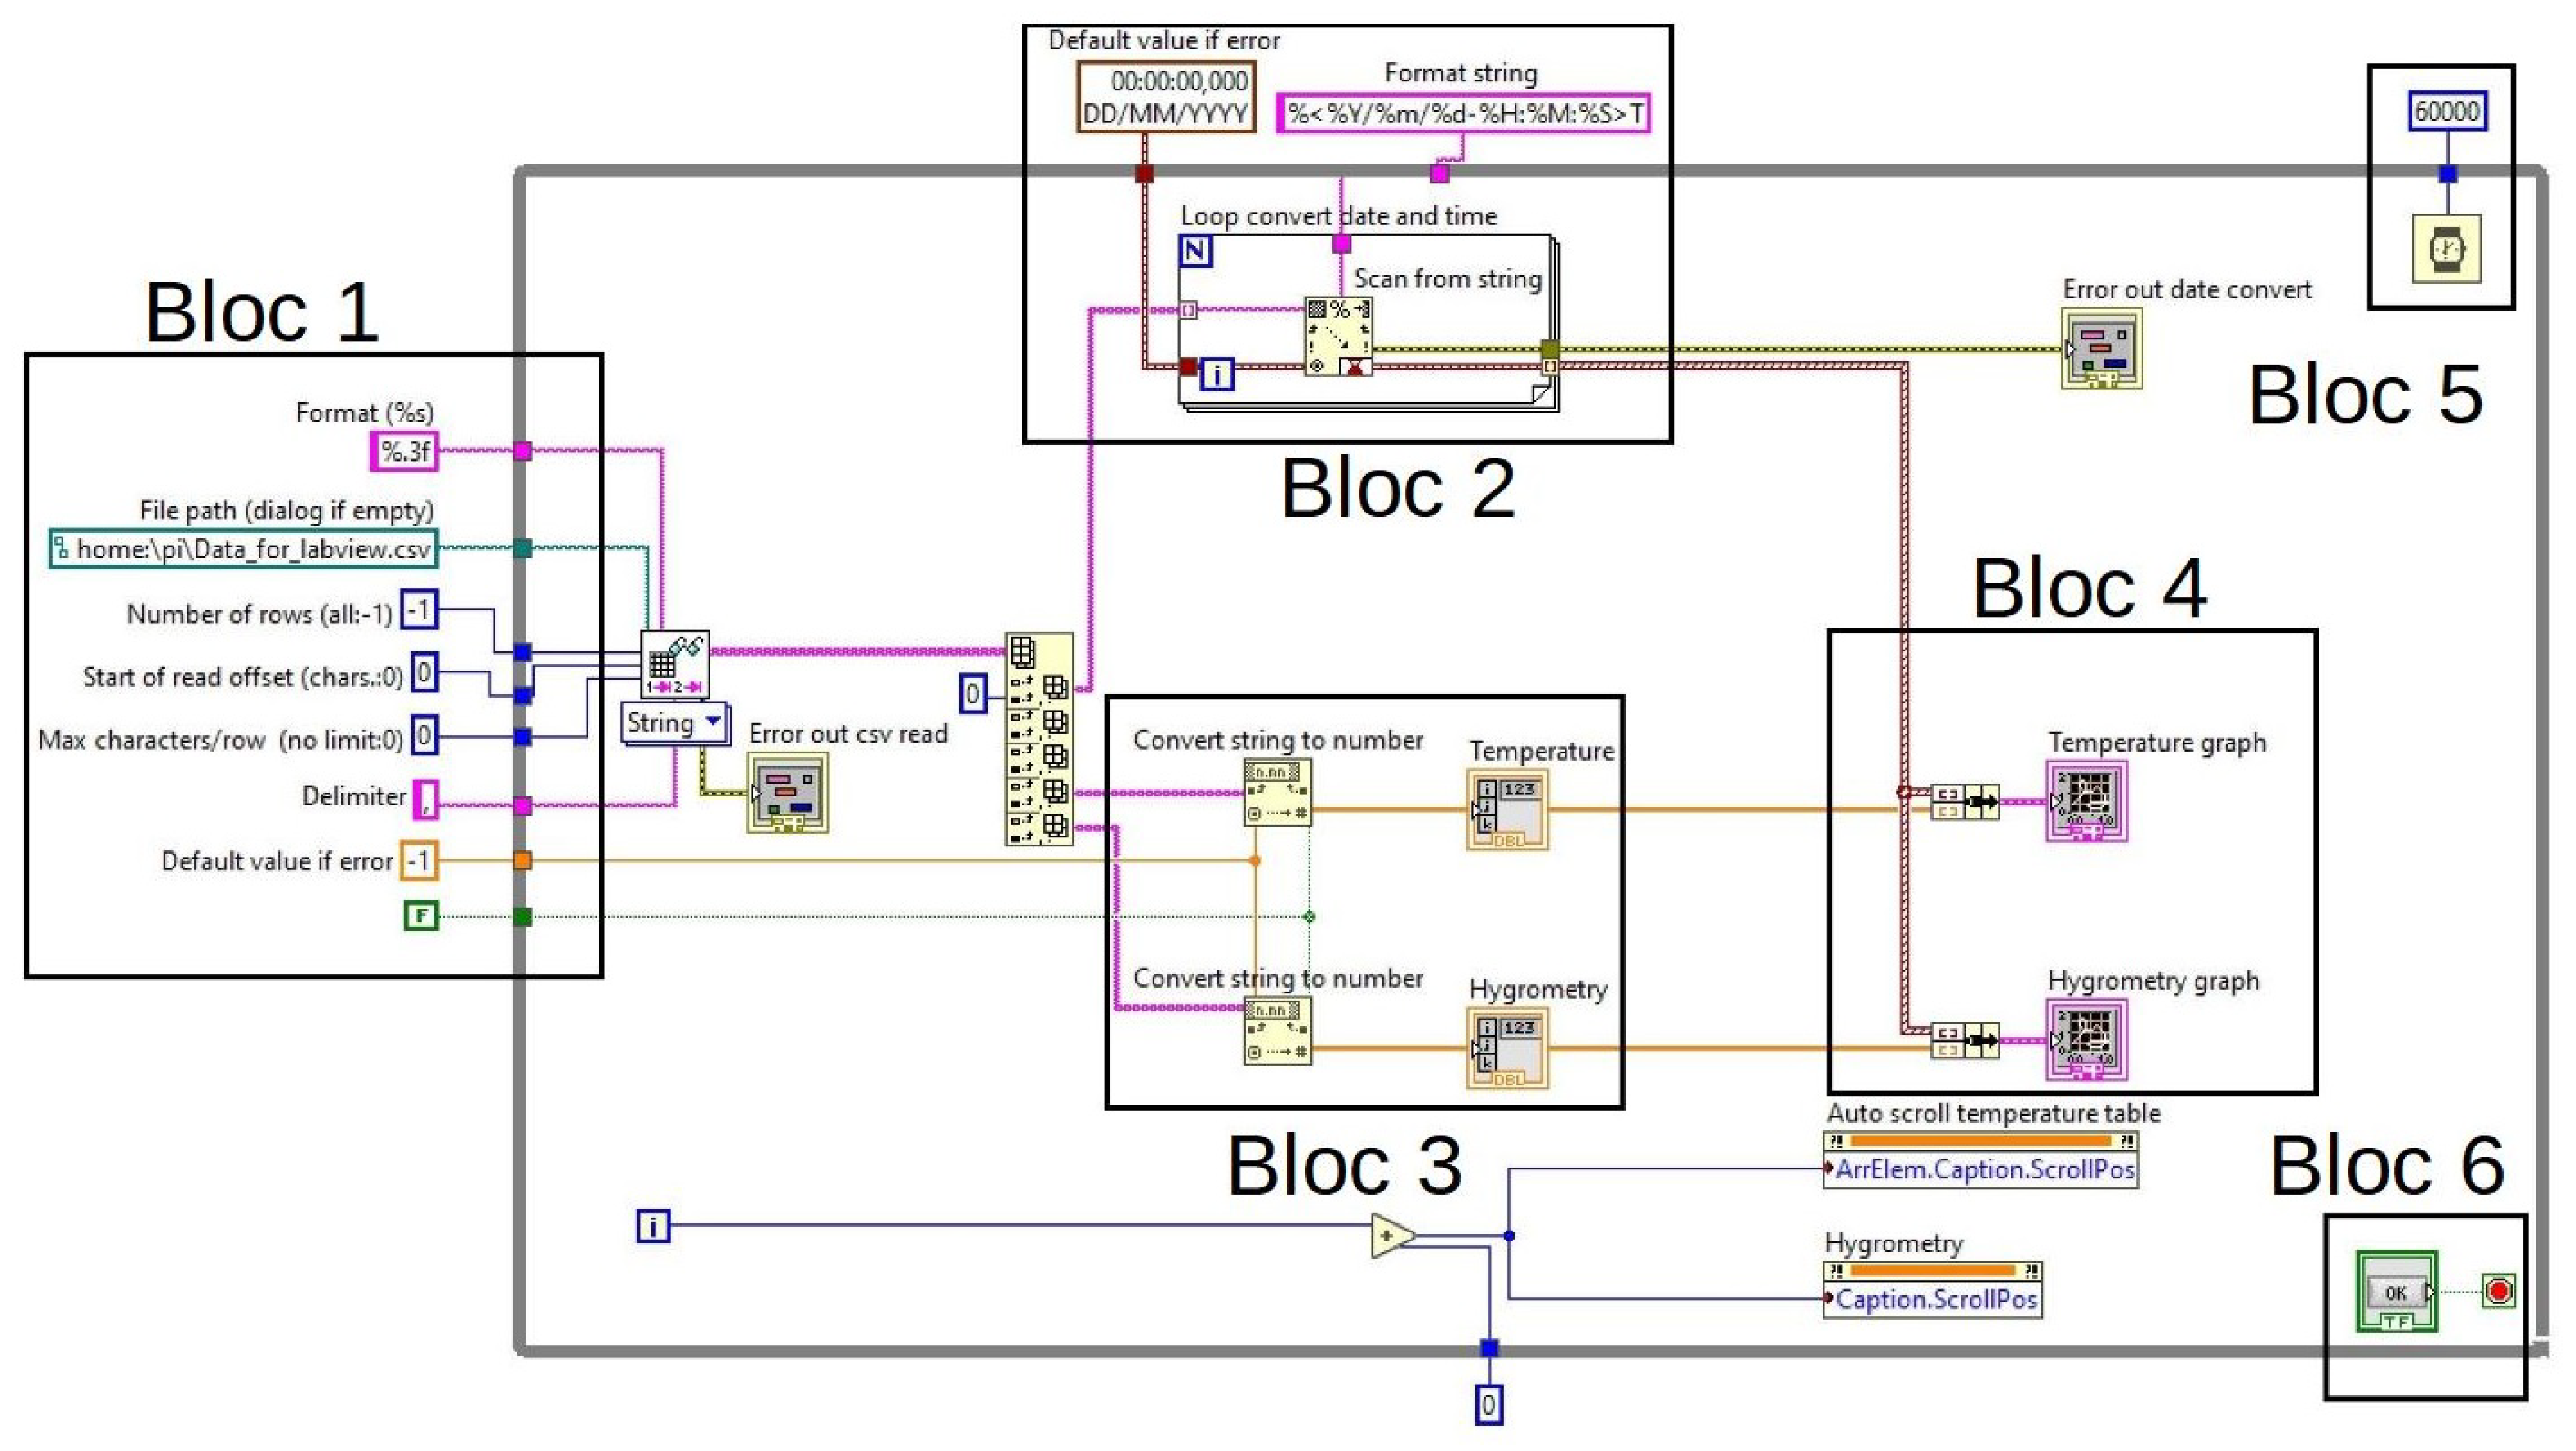
Figure 12.
Example of a LabView display.
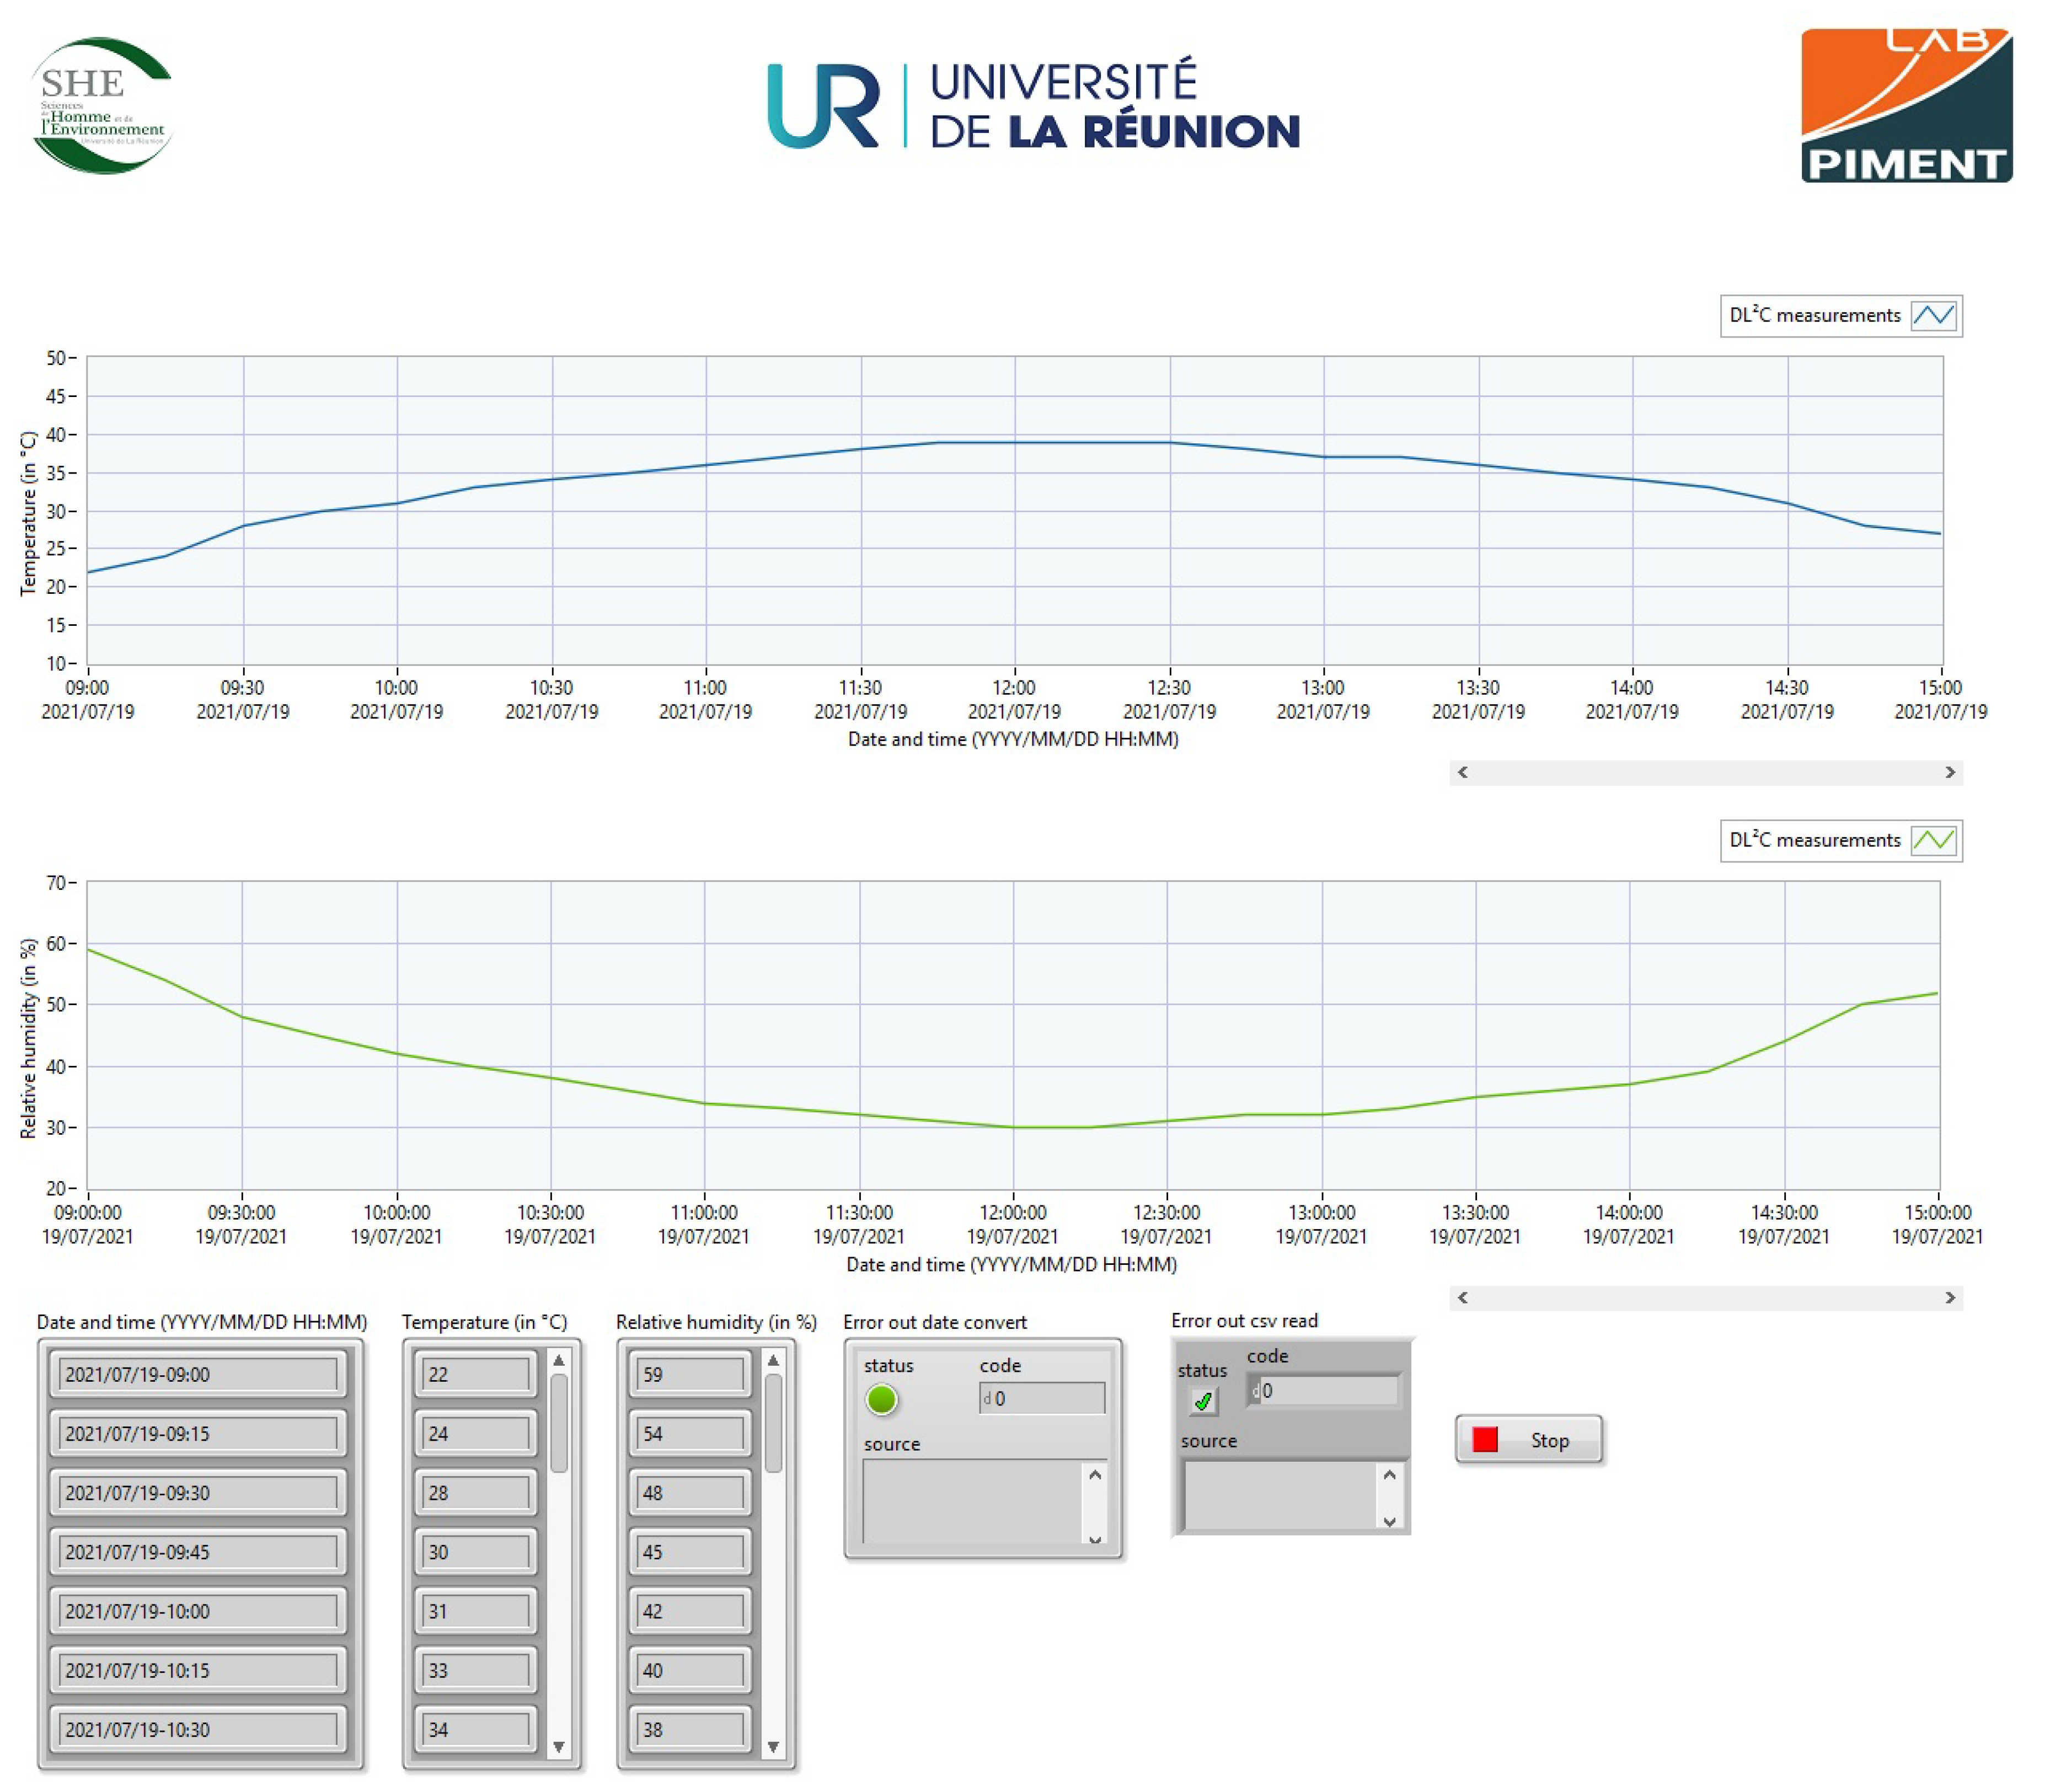
Figure 13.
Algorithm 4 (Runtime).
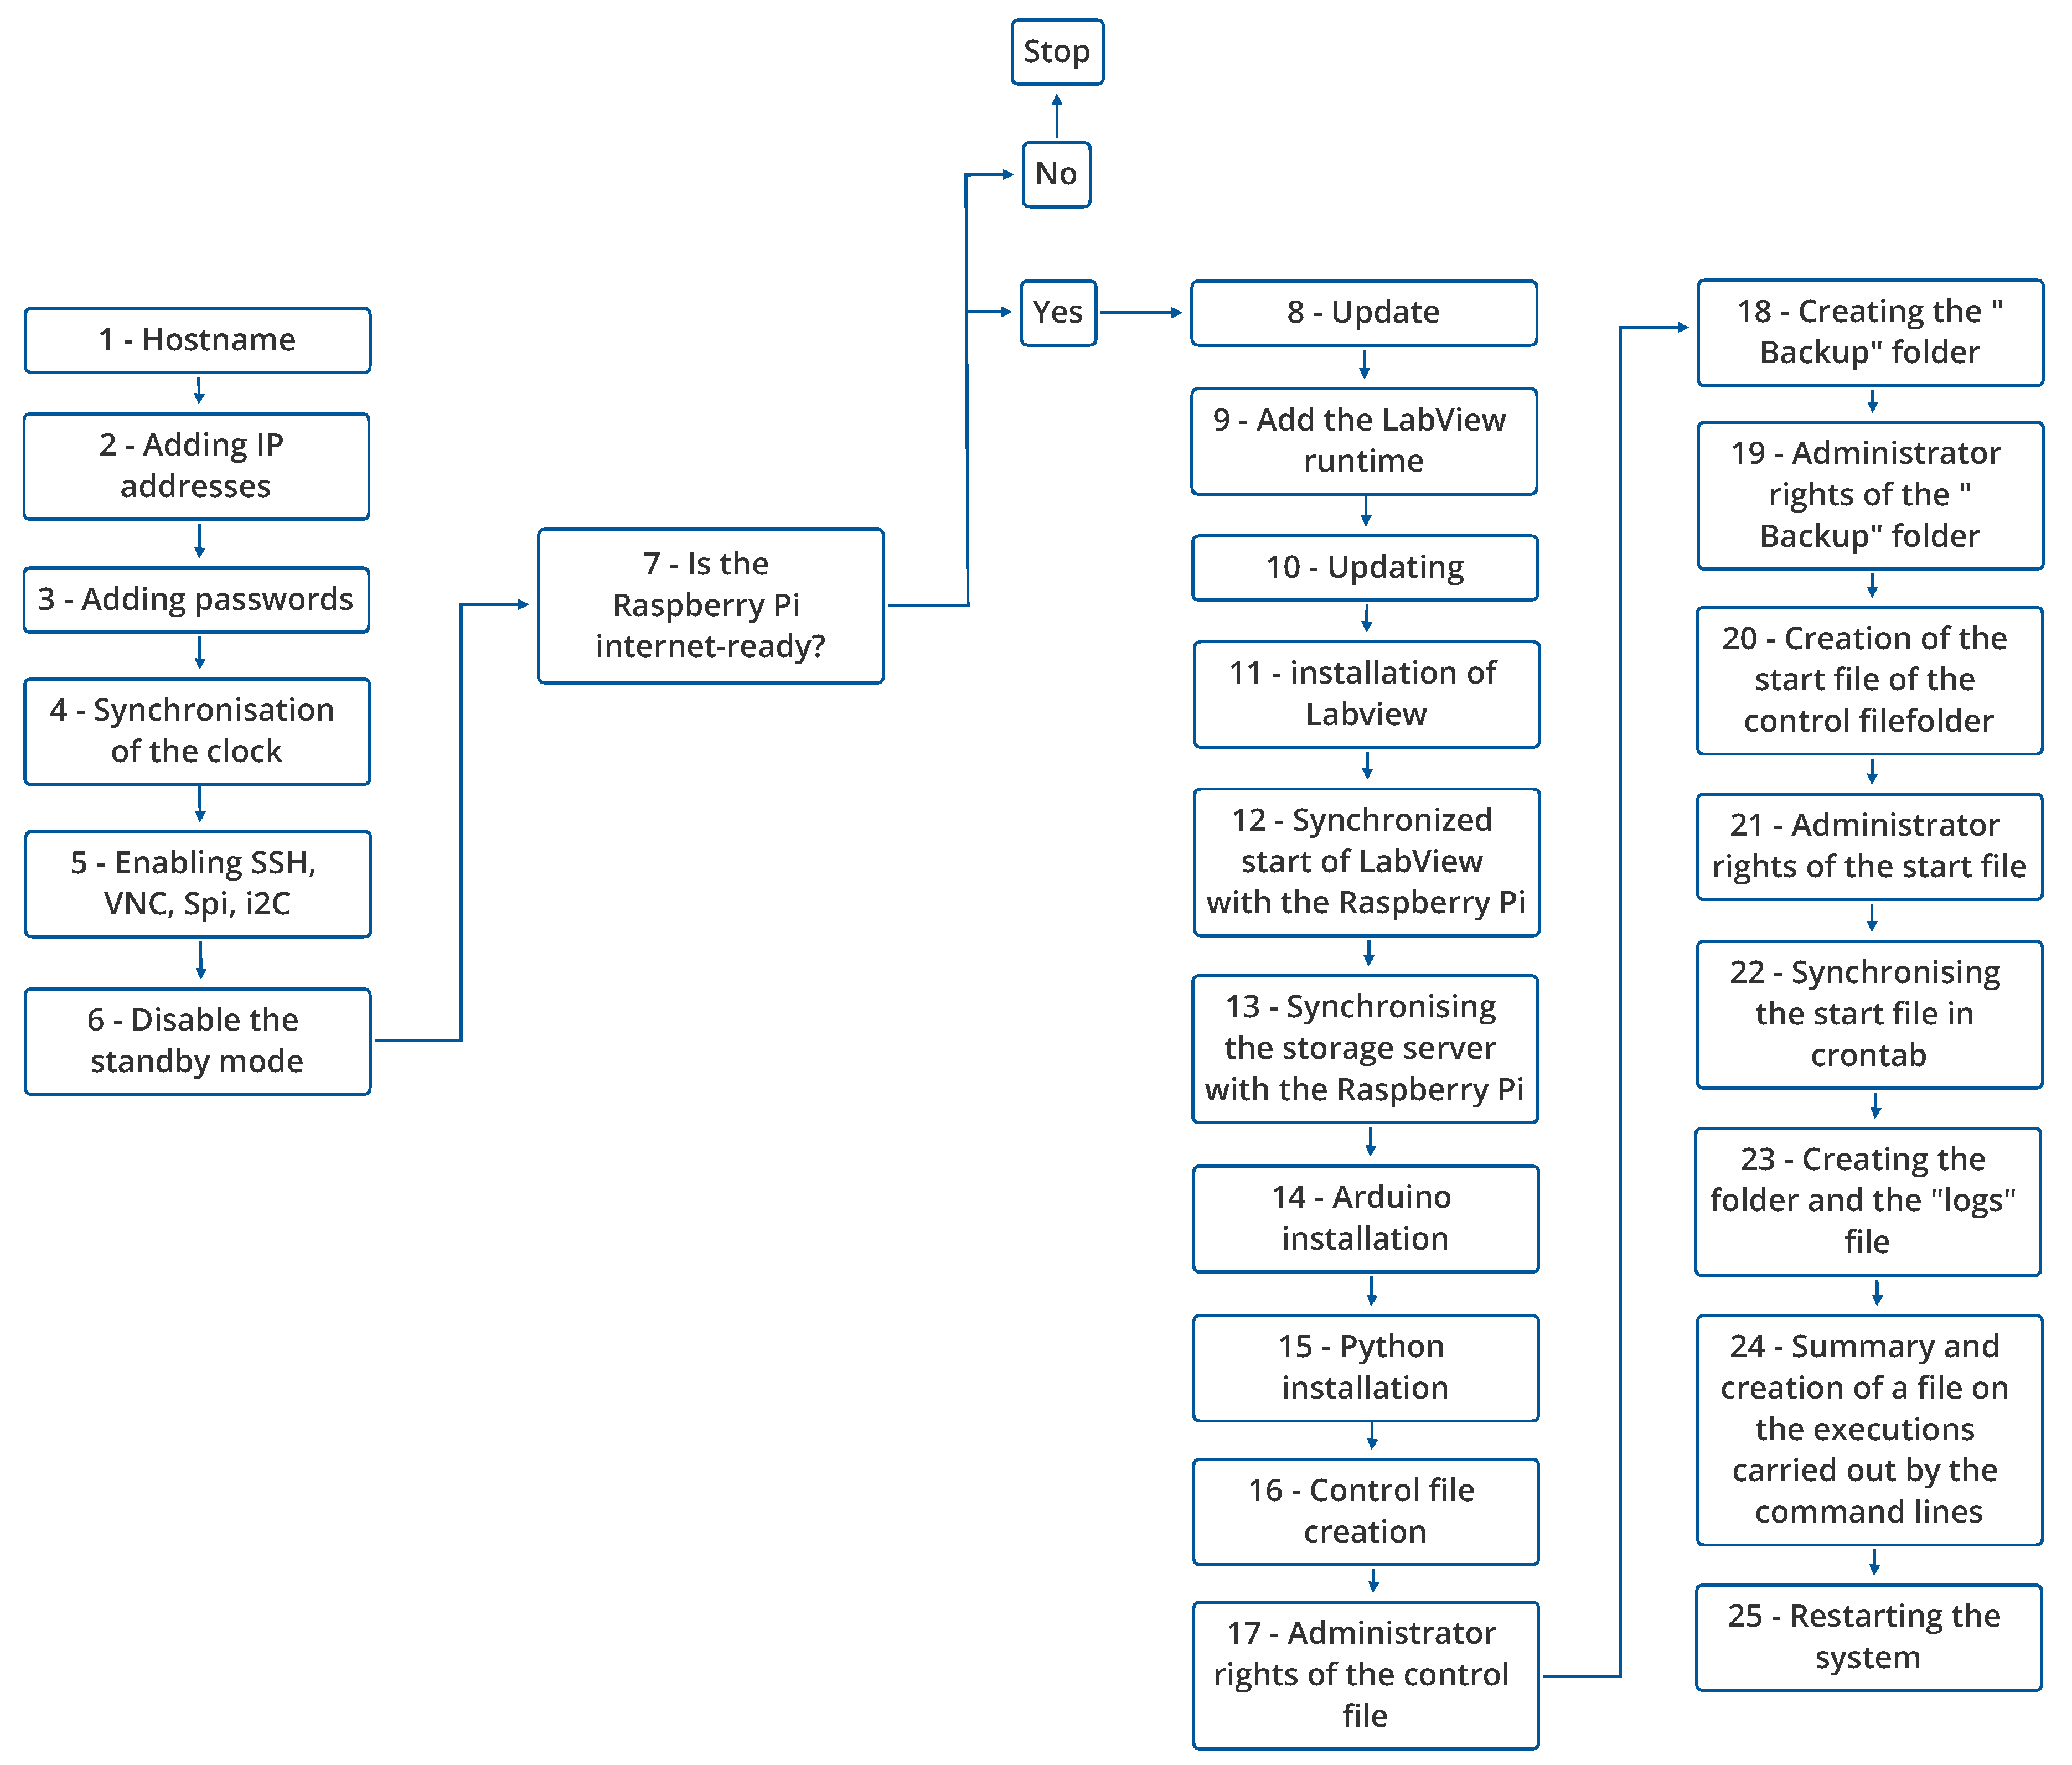
Figure 14.
Reliability test in mV of the .
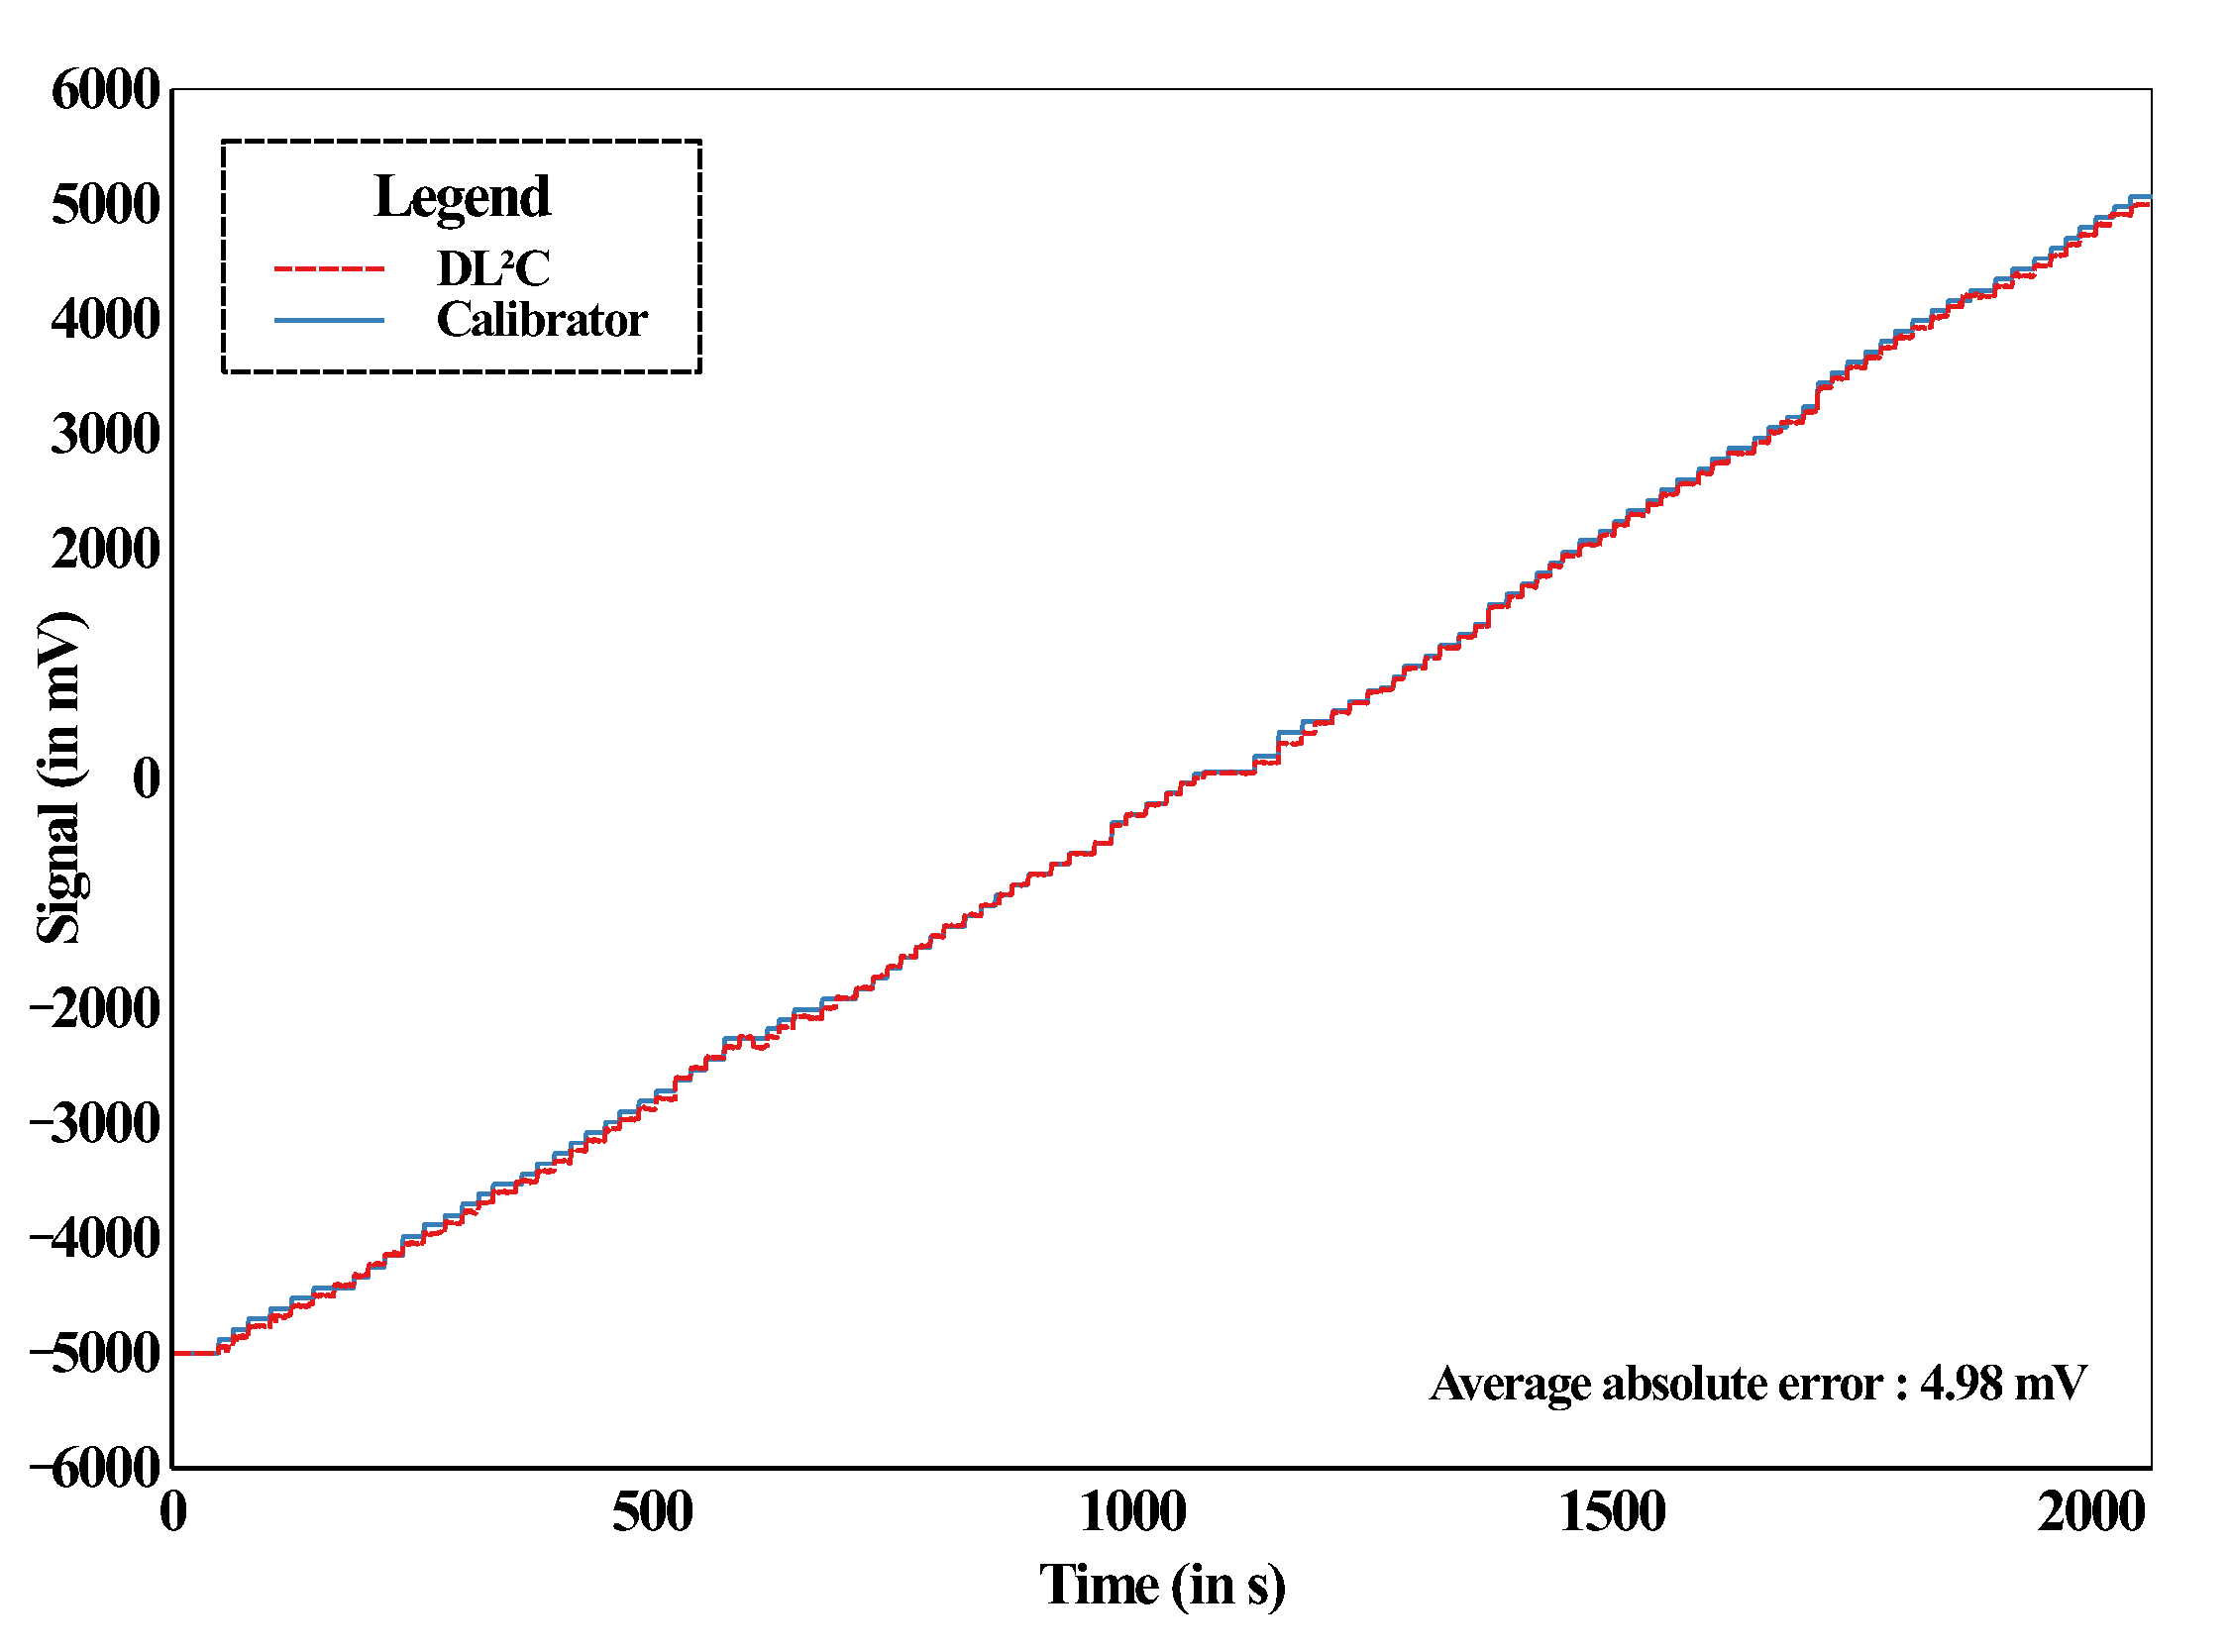
Figure 15.
Reliability test in V of the .
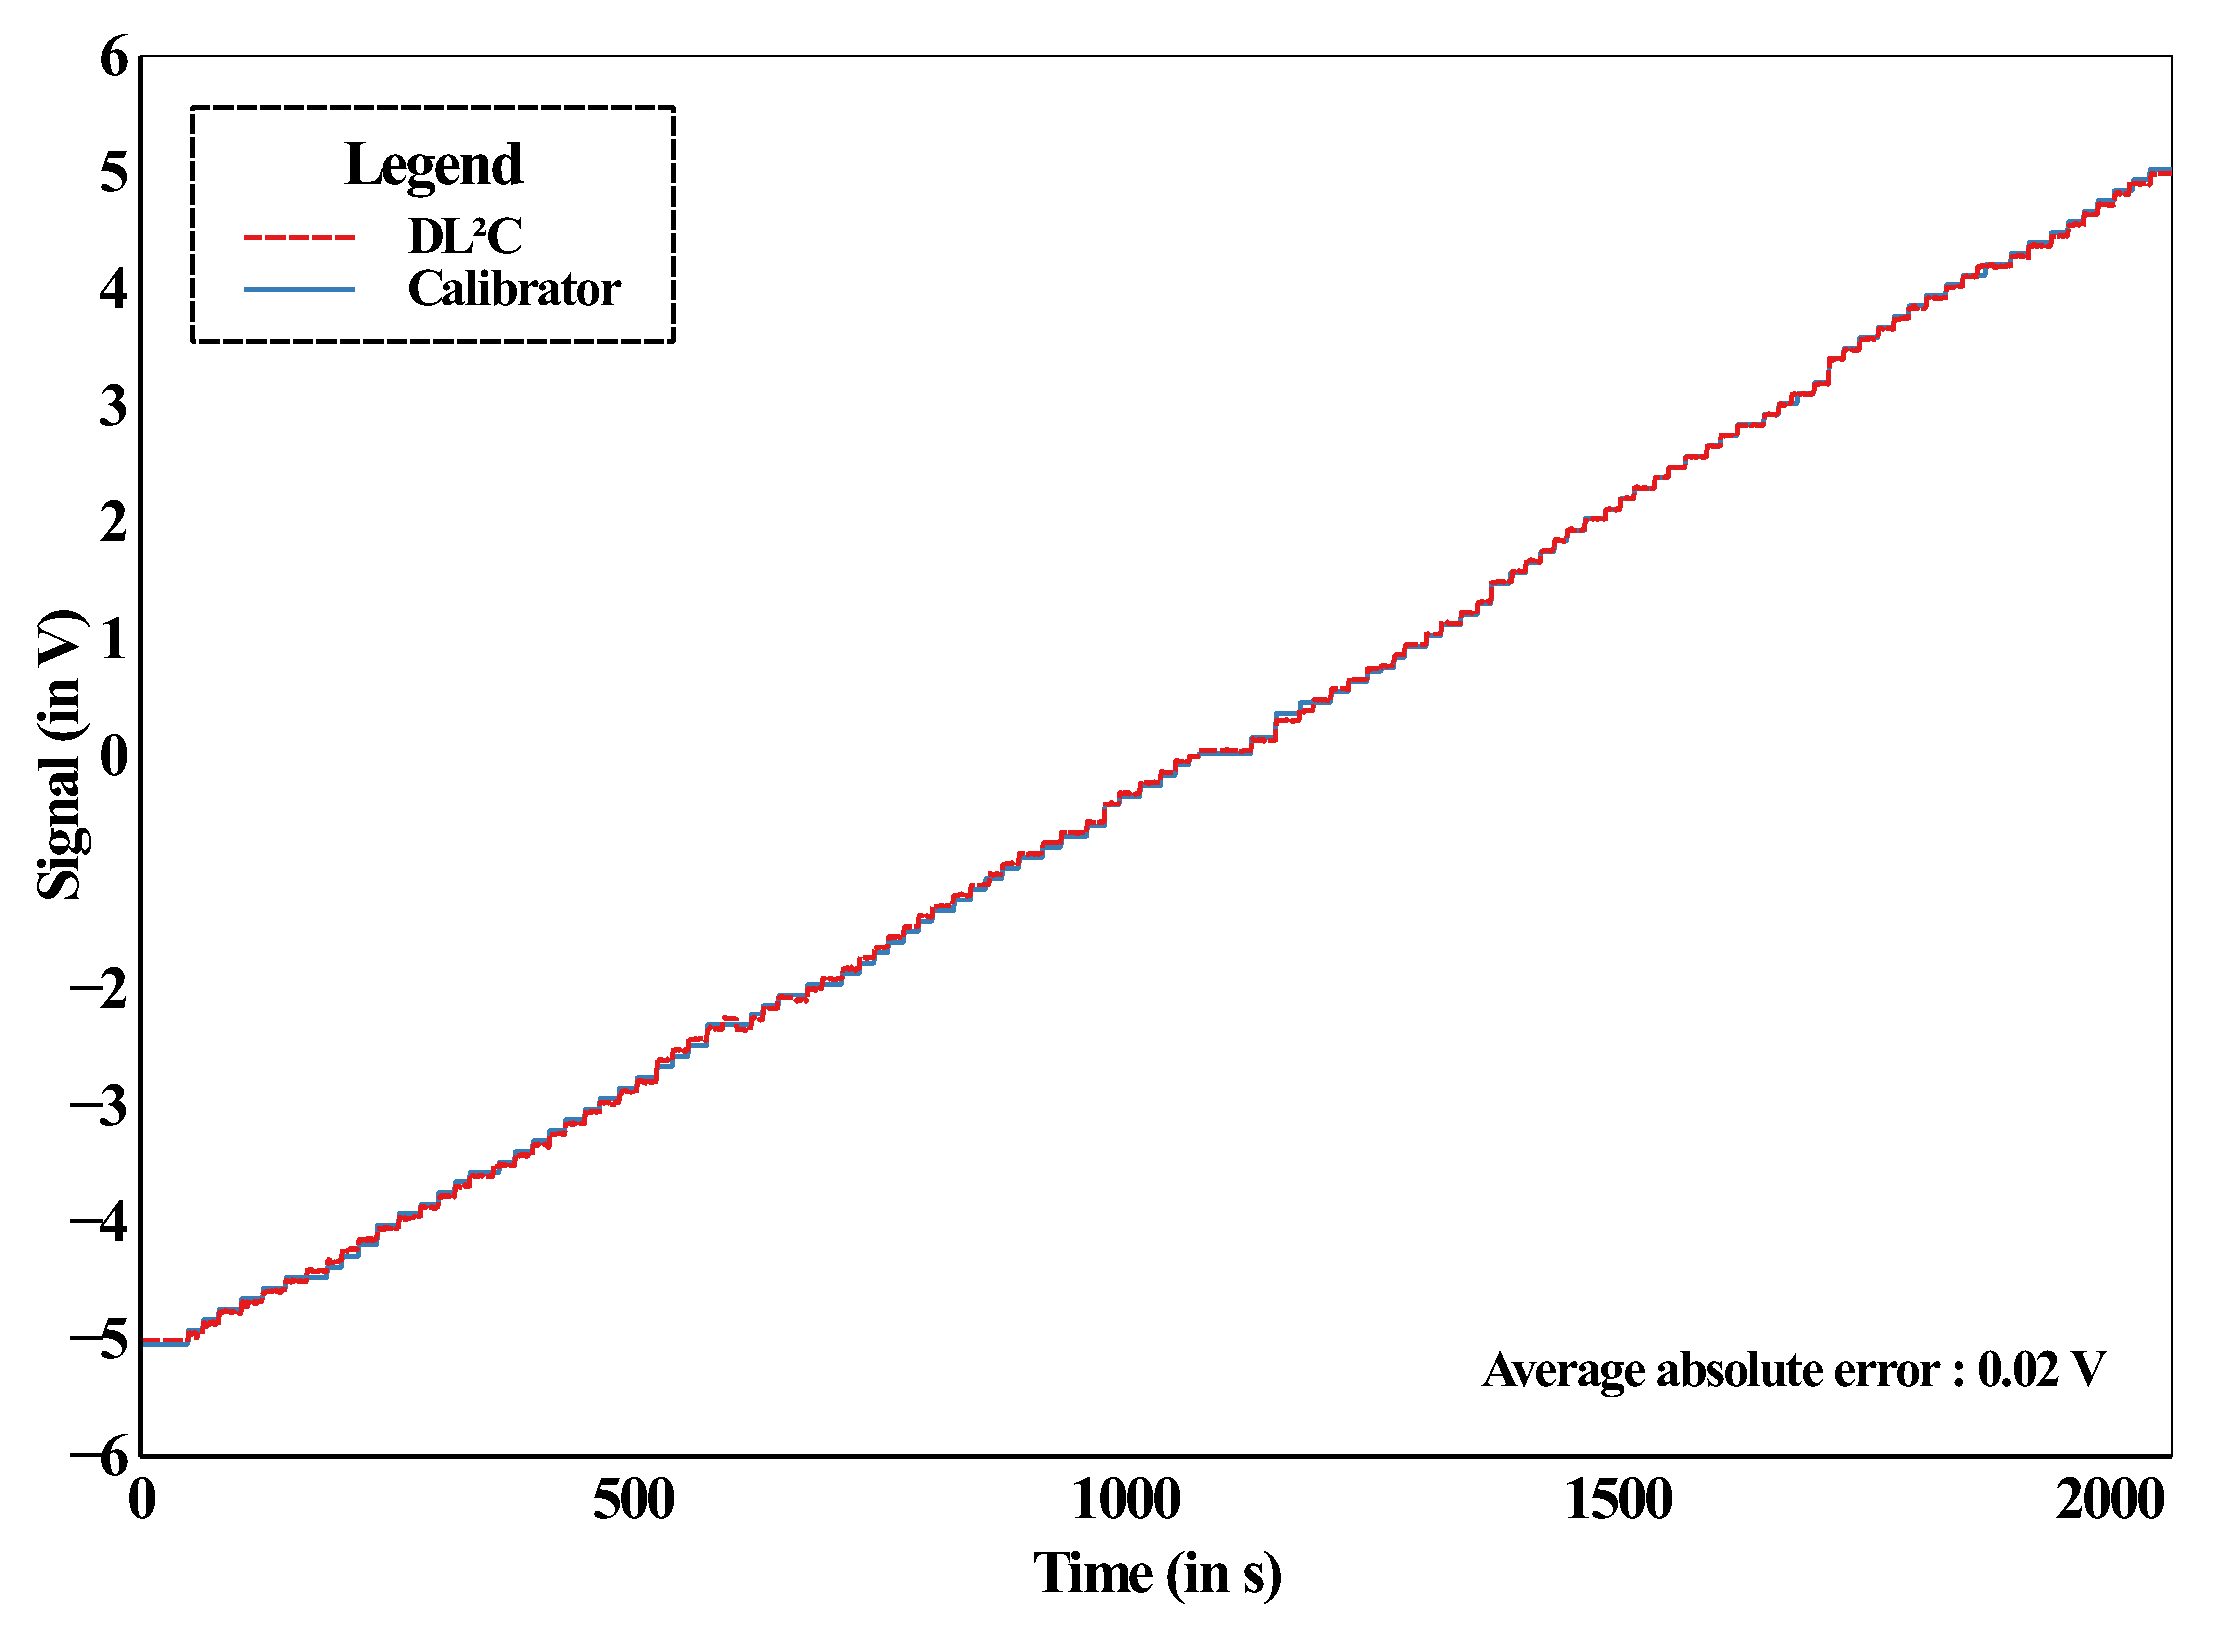
Figure 16.
Presentation of the : (a) : ; (b): Terminal blocks of the ; (c): Experimental wind turbine ; (d): Computer connected from wi-fi to the datalogger; (e): Blower.
Figure 16.
Presentation of the : (a) : ; (b): Terminal blocks of the ; (c): Experimental wind turbine ; (d): Computer connected from wi-fi to the datalogger; (e): Blower.
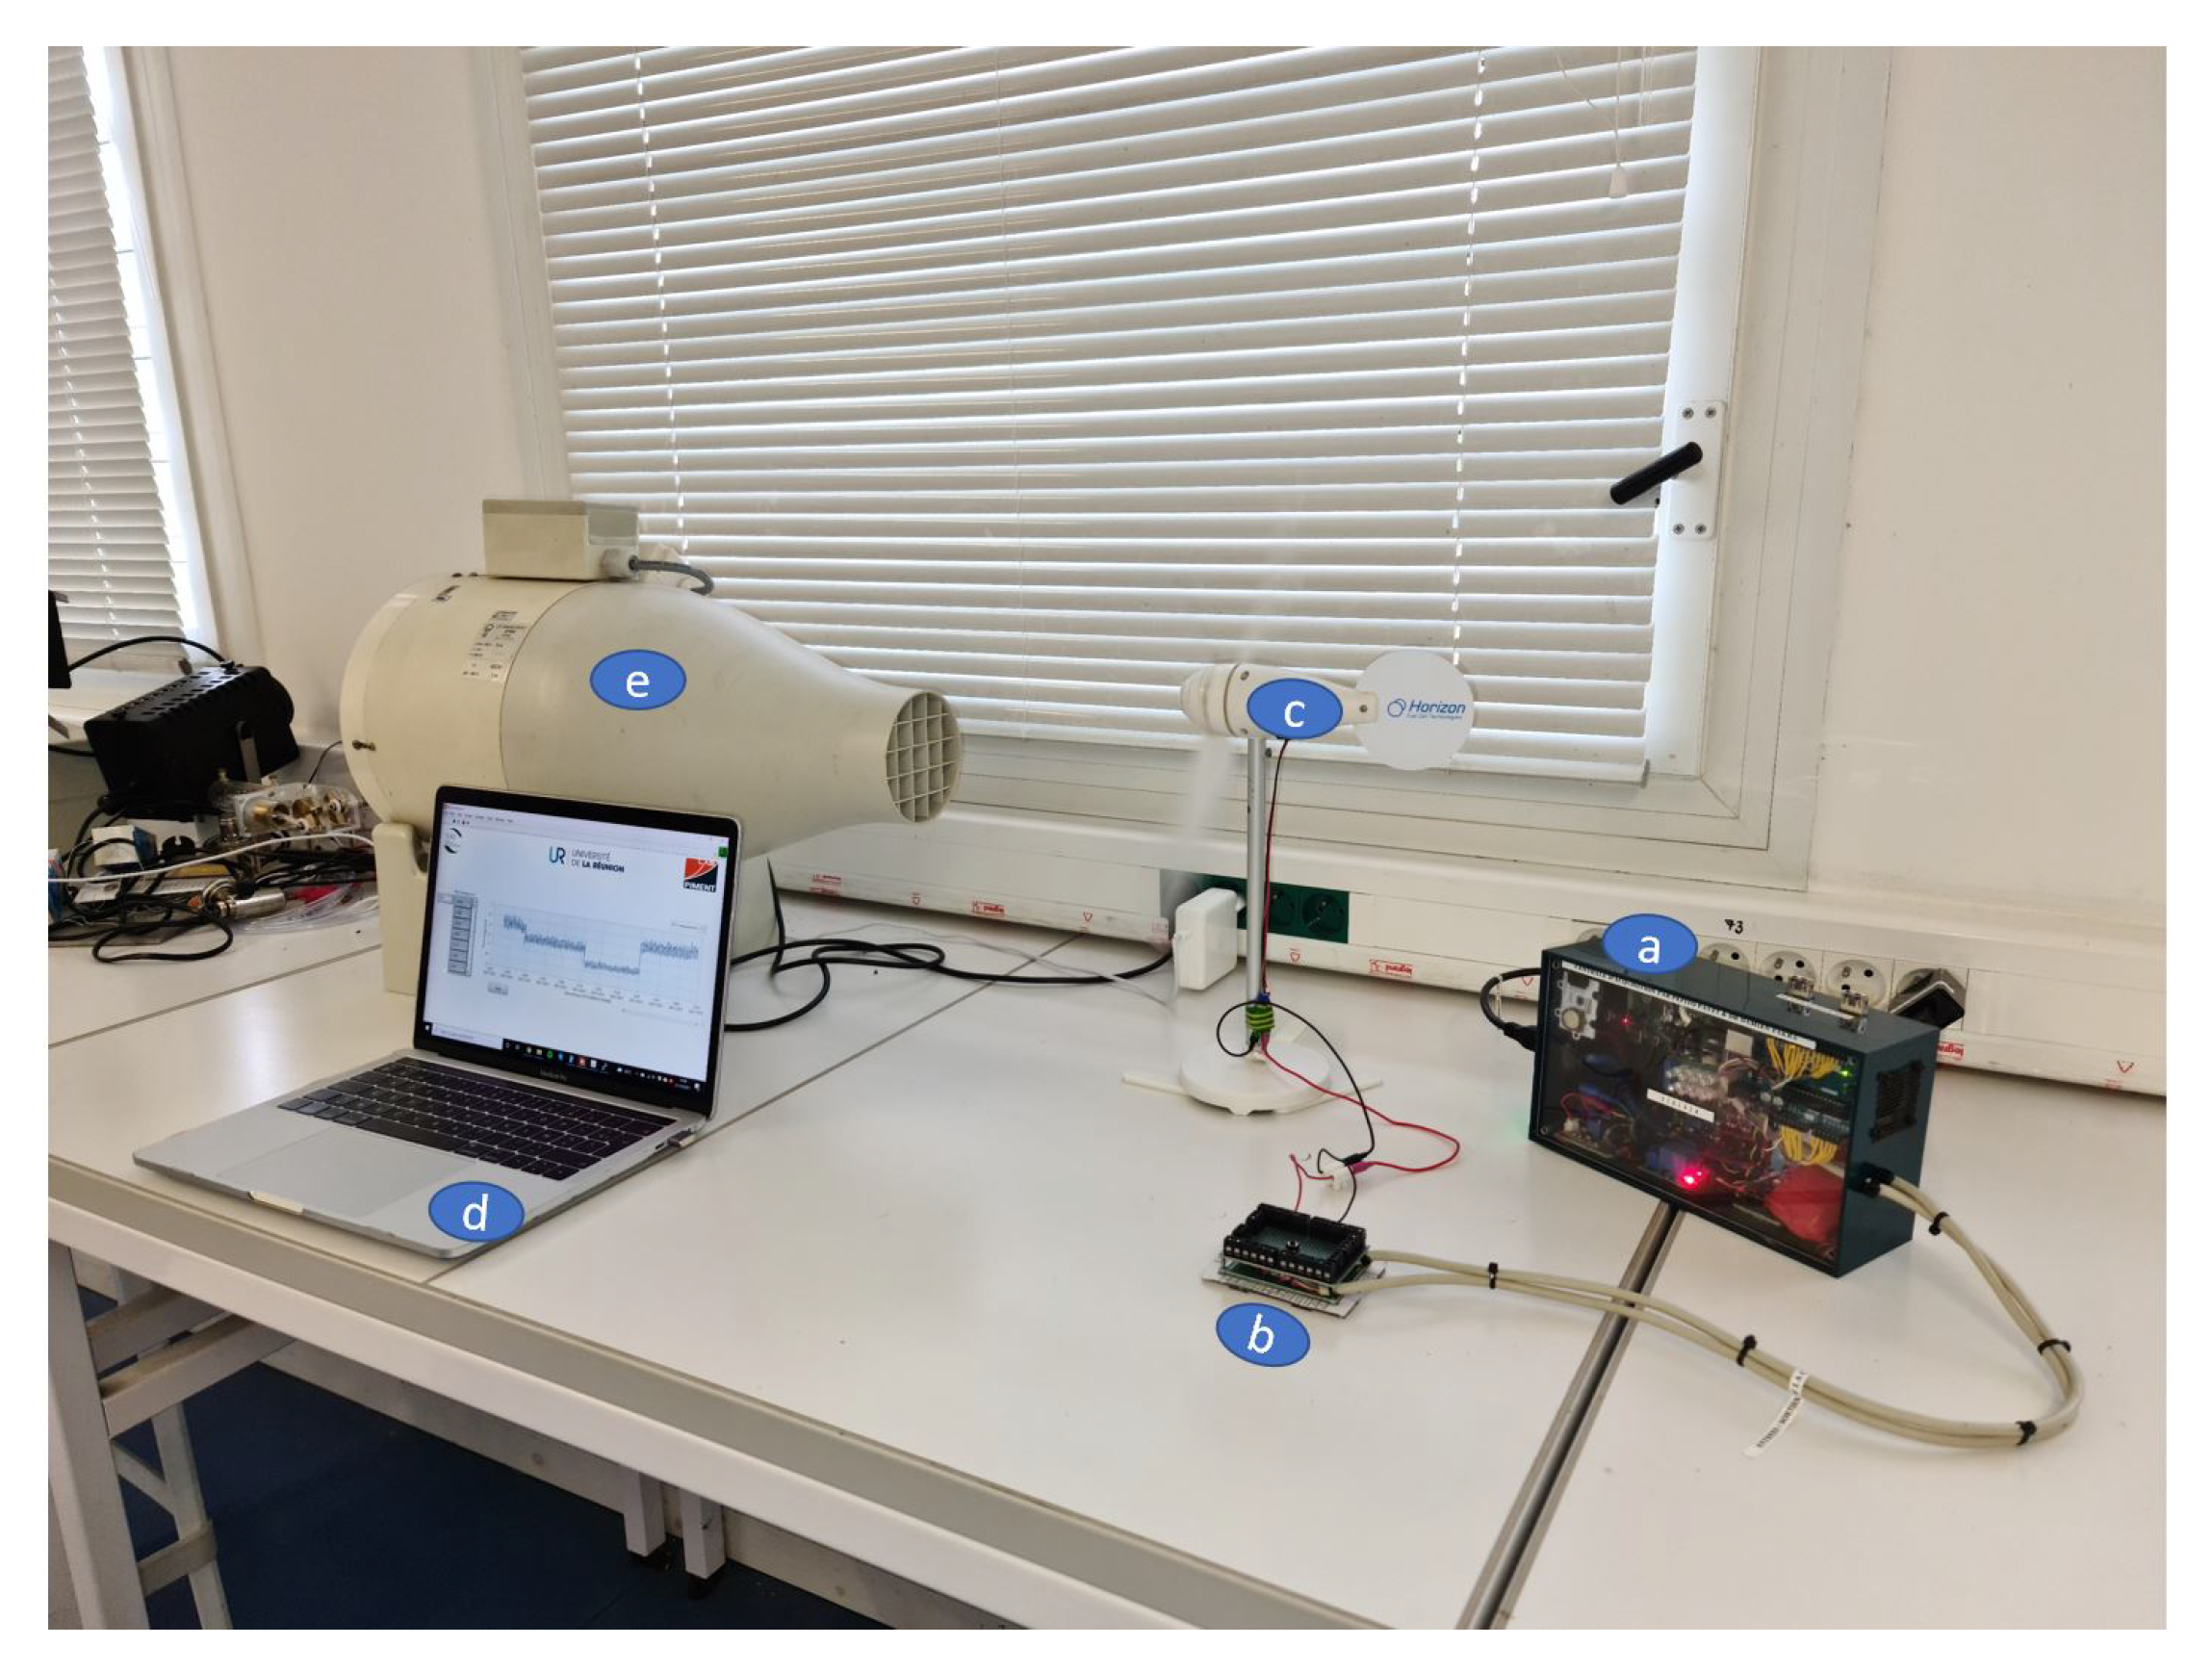
Figure 17.
Example of LabView code to display experimental wind data.
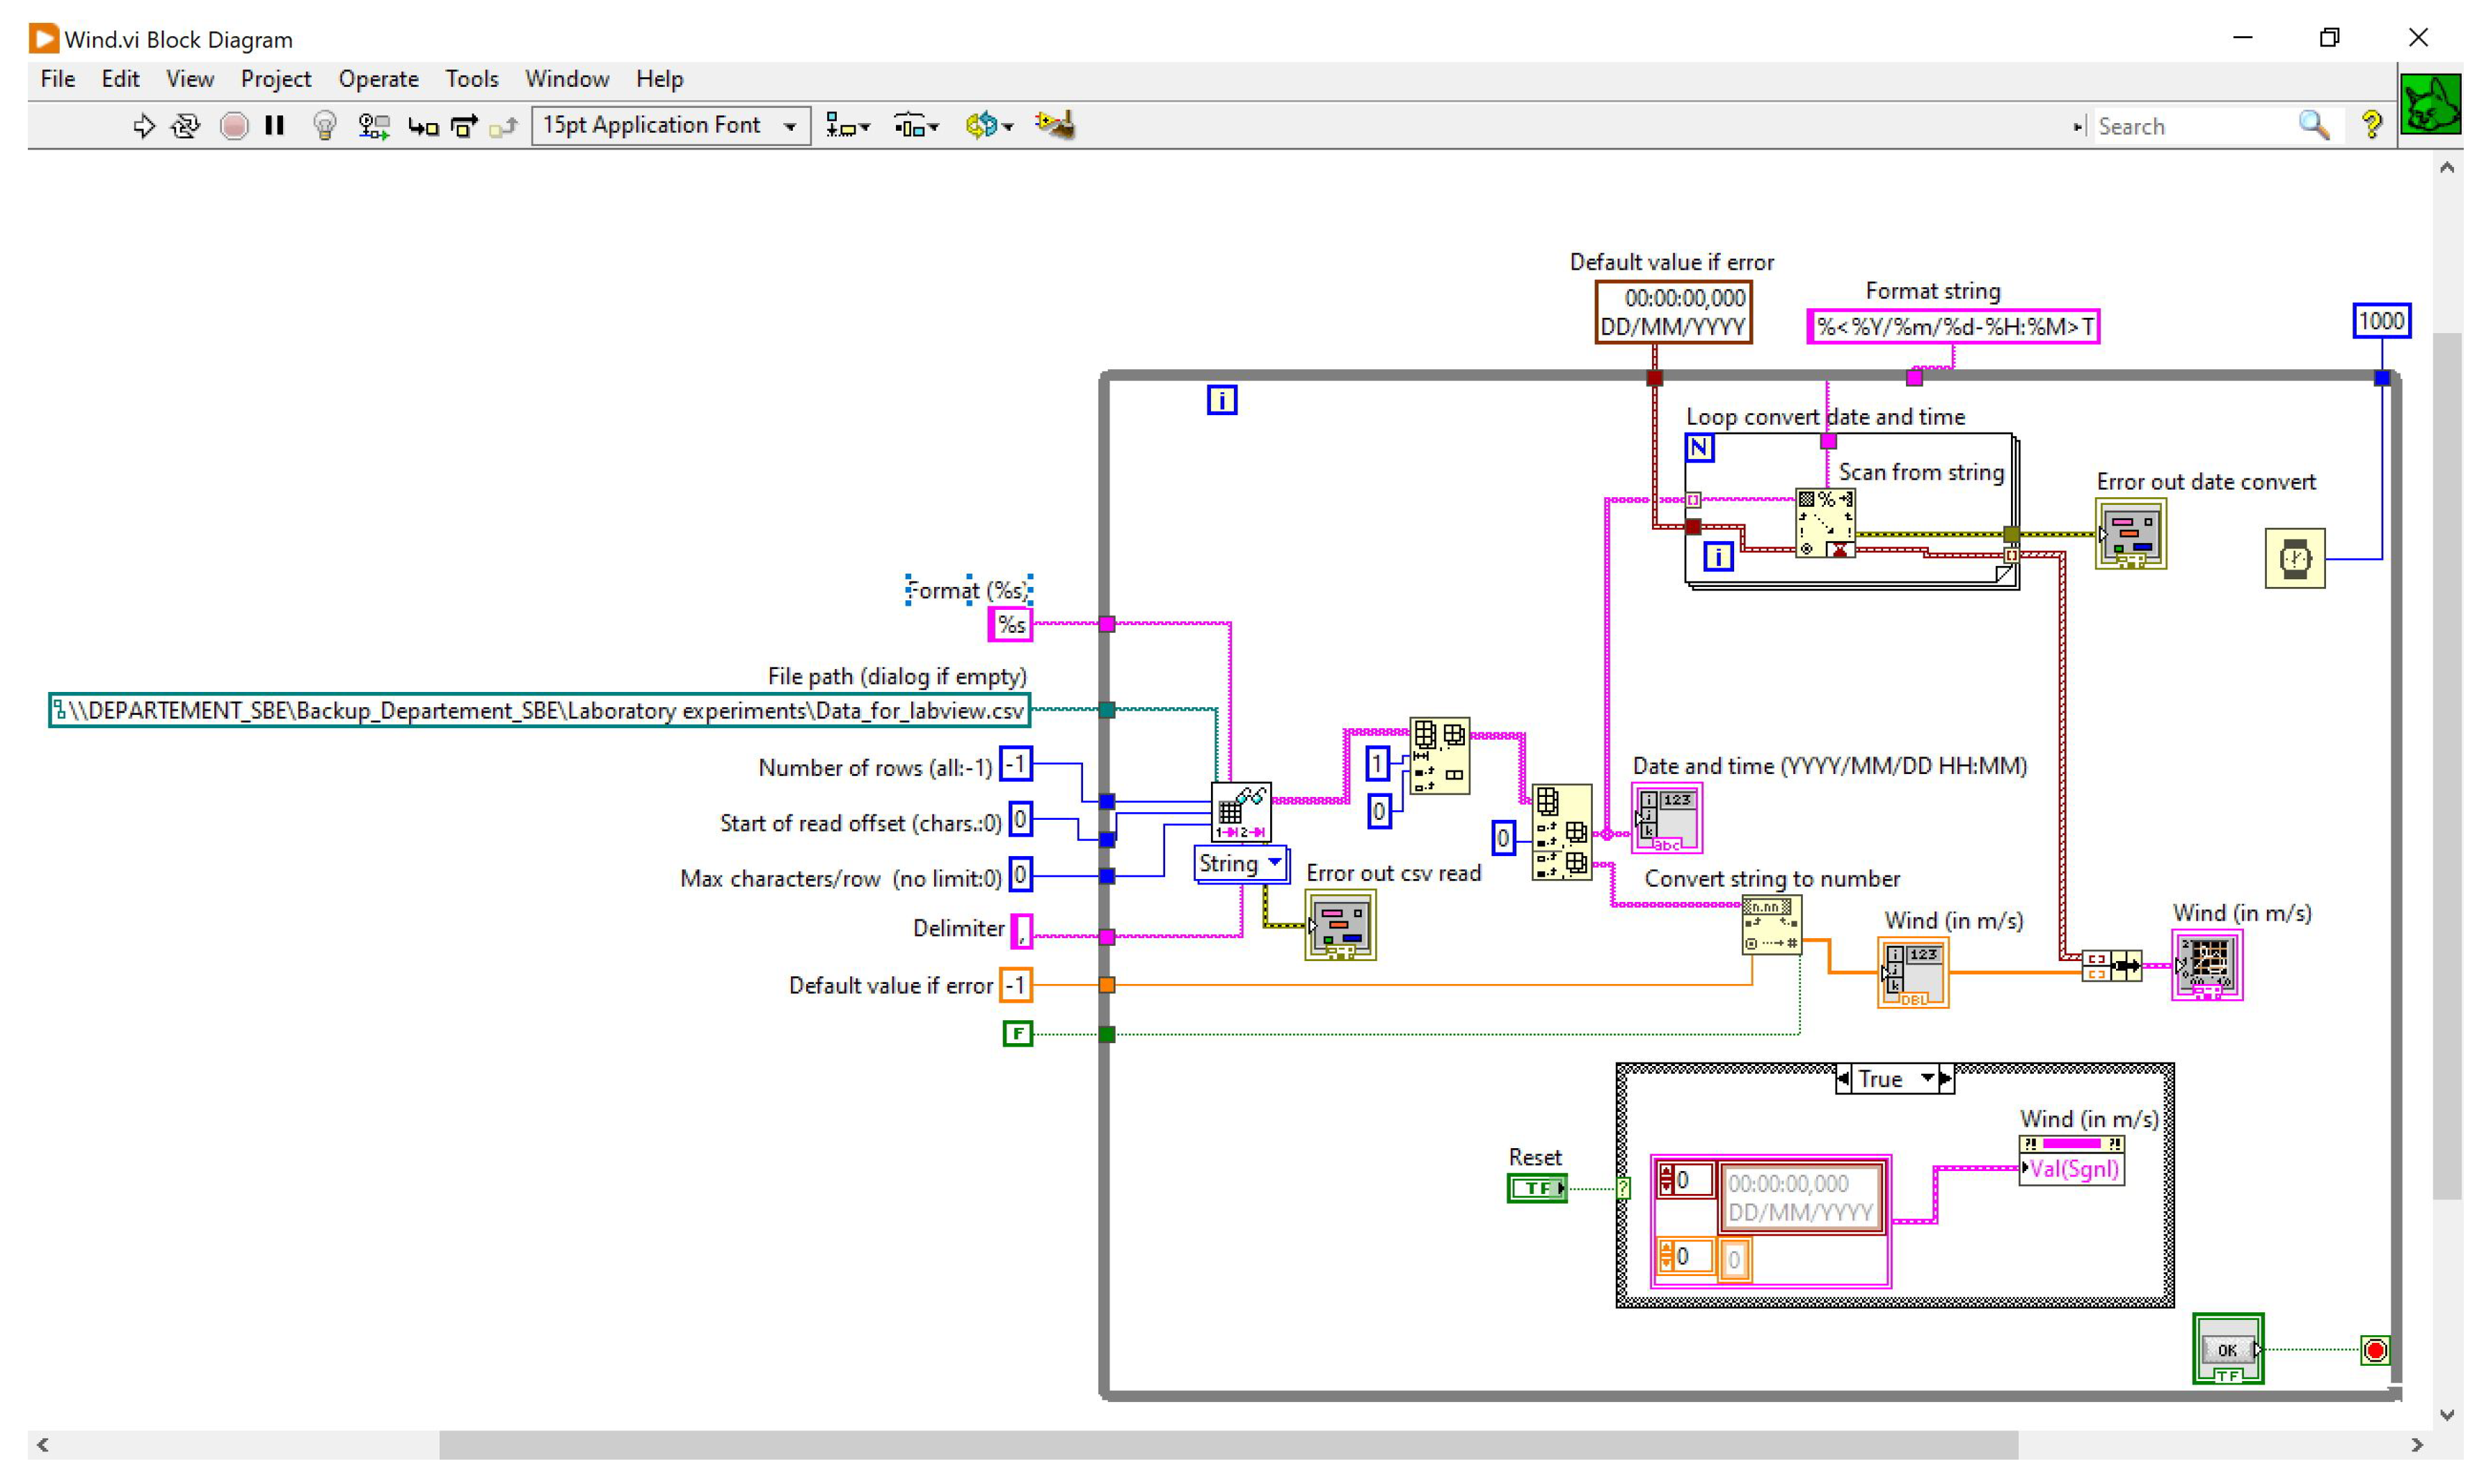
Table 3.
Summary table of the software part of the .
| Designation | Programming environment | Associated components |
|---|---|---|
| Algorithm 1 (Figure 8) | C | Arduino Nano |
| Algorithm 2 (Figure 9) | C | Arduino Uno |
| Algorithm 3 (Figure 10) | Python | Raspberry Pi |
| Algorithm 4 (Figure 13) | Linux | Raspberry Pi |
| Clock | Linux | DS1307 |
| Network | LabView ; SSH ; VNC . |
Raspberry Pi |
Table 4.
S.W.O.T analysis of the .
Disclaimer/Publisher’s Note: The statements, opinions and data contained in all publications are solely those of the individual author(s) and contributor(s) and not of MDPI and/or the editor(s). MDPI and/or the editor(s) disclaim responsibility for any injury to people or property resulting from any ideas, methods, instructions or products referred to in the content. |
© 2024 by the authors. Licensee MDPI, Basel, Switzerland. This article is an open access article distributed under the terms and conditions of the Creative Commons Attribution (CC BY) license (http://creativecommons.org/licenses/by/4.0/).
Copyright: This open access article is published under a Creative Commons CC BY 4.0 license, which permit the free download, distribution, and reuse, provided that the author and preprint are cited in any reuse.


