Submitted:
14 December 2025
Posted:
16 December 2025
Read the latest preprint version here
Abstract
Multiphoton endomicroscopy (MPEM) has recently become a key development in optical biomedical diagnostics, providing histologically relevant in vivo images that are eliminating both the need for tissue damage during biopsy sampling and the need for dye injections. Due to its ability to visualize structures at the epithelial, extracellular matrix, and subcellular levels, MPEM offers a promising diagnostic method for precancerous conditions and early forms of gastrointestinal (GI) cancer. The high specificity of multiphoton signals — the two-photon fluorescence response of endogenous fluorophores (NADH, FAD), the second-harmonic generation signal from collagen, and others — makes this method a promising alternative to both traditional histology and confocal endoscopy, enabling real-time assessment of metabolic status, intestinal epithelial cell status, and stromal remodeling. Despite the promising prospects of multiphoton microscopy, its practical implementation is progressing extremely slowly. The main factors here include the difficulty of delivering ultrashort pulses with high peak power, which is necessary for multiphoton excitation, and obtaining these pulses at the required wavelengths to activate the autofluorescence mechanism. One of the most promising solutions is the use of specialized multimode optical fibers that can both induce the beam self-cleaning (BSC), which allows for the formation of a stable beam profile close to the fundamental mode, and significantly broaden the optical spectrum, which can ultimately cover the entire region of interest. This review presents the biophysical foundations of multiphoton microscopy of GI tissue, existing endoscopic architectures for MPE, and analyzes the potential for using novel nonlinear effects in multimode optical fibers, such as the BSC effect and supercontinuum generation. It is concluded that the use of optical fibers in which the listed effects are realized in the tracts of multiphoton endomicroscopes can become a key step in the creation of a new generation of high-resolution instruments for the early detection of malignant neoplasms of the GI tract.
Keywords:
inflammatory bowel disease
; colorectal cancer
; nonlinear imaging
; multiphoton endomicroscopy
; multimode fibers
; numerical simulations
; artificial intelligence
1. Introduction
Gastrointestinal tract (GI) diseases are very common, with millions of people worldwide seeking medical care for symptoms such as abdominal pain, nausea, and diarrhea. These conditions contribute significantly to overall morbidity and healthcare burden, with a large number of surgical procedures related to the GI. Factors such as infections, lifestyle, and genetic predisposition can trigger GI disorders, which range from functional issues such as Irritable Bowel Syndrome to Inflammatory bowel disease (IBD) and cancers. Currently, IBD is diagnosed in approximately 7 million people worldwide [1,2,3]. Patients with IBD have been shown to have an increased risk of developing colorectal cancer (CRC) [4,5,6]. IBD includes a spectrum of chronic inflammatory GI pathologies, two major subtypes of which are ulcerative colitis and Crohn’s disease with the highest risks of cancer progression [7]. Ulcerative colitis affects the colon and rectum primarily and is characterized by mucosal damage, which is followed by cryptitis and crypt abscesses. Crohn’s disease is characterized by transmural inflammation, noncaseating granulomas, and a thickened submucosa in the small and large intestine, and may also affect the mouth, esophagus, stomach, and anus [1]. IBD remains a chronic relapsing disorder with complex etiology. The known risk factors for IBD include genetic predisposition, environmental stress, diet, and intestinal microbiota composition [8,9]. The impact of heritable factors was identified in human studies, in which first-degree relatives of IBD patients were predisposed to intestinal inflammation at a higher rate than in the general population [9,10,11]. More than 200 genetic loci were identified as IBD-linked, including major inflammatory genes that might promote exaggerated immune response in the intestine [12]. However, the onset of the disease, its characteristics and severity can be modulated by additional risk factors like Western diet or smoking and alcohol abuse [13,14]. Despite significant progress in understanding the etiology and risk factors for IBD and CRC as well as great improvement in therapeutic strategies, 40–70% of patients need surgery [15].
The human intestinal epithelium with its main metabolic and digestive functions represents approximately 400 m2 of the rapidly proliferating monolayer with a complete turnover of 24 to 96 h [16]. The proliferative compartment of the epithelium is localized at the bottom of an intestinal crypt followed by a gradient of increasingly differentiated epithelial cells along the vertical axis [17]. Another of the main intestinal epithelium functions is to coordinate appropriate immune responses, including tolerance and pathogen specific immunity by innate and adaptive immune systems [18]. A healthy intestinal epithelium layer provides an efficient physical, chemical and electrical barrier against luminal microbial community and chemical factors. The intestinal epithelial barrier includes three key levels: pre-epithelial, epithelial and post-epithelial defense, the latter being represented by the lamina propria [19]. The pre-epithelial barrier is composed of the mucus glycoproteins associated with other proteins and lipids, and a bicarbonate-rich compound of the mucus, maintaining a neutralizing pH at the epithelial surface. Once the inflammatory response in the intestine has started in IBD, Tumor necrosis factor alpha (TNF-α), Interleukin one beta (IL-1β) and other inflammatory factors amplify the immune reaction leading to further damage of the intestinal mucosa [20]. Following the inflammation the integrity of the epithelium being lost, luminal antigens, including pathobionts, invade the subepithelial compartment, thus activating and/or sustaining deregulated inflammatory immune responses [21,22]. One of the prominent features of IBD is the recurrent inflammation [19], that can not be resolved by the innate anti-inflammatory and wound-healing mechanisms. Long-term inflammation finally develops into a chronic form and results in tissue remodeling and substantial modifications in cell physiology and metabolism, increasing rick of CRC development [23,24]. Precise diagnosis of these GI diseases is still difficult and time-consuming, although early and accurate diagnostics, especially regarding oncological cases, is ultimately needed for timely and successful cure. The non-invasive diagnostic methods could eliminate the need for physical biopsy and provide improved diagnostic accuracy for a range of GI disorders. Despite the accessibility of imaging techniques that are exploited in combination with standard WLE (white light endoscopy) in clinical practice, such as narrow band imaging (NBI) [25], autofluorescence imaging (AFI) [26] and confocal endomicroscopy (CLE) [27,28], there is lack in accurate method for detecting precancerous lesions of the GI tract. Moreover, there is currently no accessible in vivo technology that can reliably indicate if a biopsy should not be performed. Despite the use of advanced imaging techniques, multiple biopsies are still required in most cases to confirm or refute an endoscopic diagnosis up to date.
The development of optical technologies has made a significant contribution to the expansion of the capabilities of endoscopic analysis and has given rise to the use of new generations of instruments for the endoscopy and examination of GI biopsies. The spectra of the current endoscopic image enhancement techniques include Narrow Band Imaging (NBI), Compound Band Imaging (CBI), i-SCAN Optical Enhancement, Linked Color Imaging (LCI), Flexible Spectral Imaging Color Enhancement (FICE), Hemoglobin Enhancement (HbE), Red Dichromatic Imaging (RDI), Blue Light Imaging (BLI) [29,30]. Other techniques in various phases of development include autofluorescence imaging, endocytoscopy, confocal laser endomicroscopy, optical coherence tomography, multiphoton microscopy, and Raman spectroscopy [31]. Confocal microscopy techniques for GI biopsies over the last decades have advanced from laboratory tools to "optical biopsy" methods called confocal laser endomicroscopy (CLE), which also provide real-time, in vivo cellular visualization during endoscopy [29,32]. These technologies, including both endoscope-based and probe-based systems, usually use fluorescent labeling and contrast agents to achieve high-resolution images, assess tissue structures, and identify lesions, and only partially substitute the clinical use of traditional biopsies and WLE [33]. Besides the limited availability of certain laser wavelengths and the need for tissue staining procedures in biopsy or contrast agents infusion, CLE limitations include a high energy load on tissue.
Multiphoton microscopy (MPM) offers undoubted advantages over other optical microscopic imaging techniques in terms of penetration depth and reduced photobleaching, which has allowed it to gain widespread use over the past 30 years [34] for the in-depth study of neurons, tumors, cancer, and other types of biological tissue [35,36]. This method utilizes excitation by the absorption of two or more photons in a single quantum event. Since photon energy is inversely proportional to its wavelength, photons with twice the wavelength are required. Generating a significant number of multiphoton excitation events requires a well-focused laser beam. As a result, fluorophore excitation occurs only in a small volume in the focal plane, significantly reducing photobleaching and UV-induced light damage in live-cell imaging and enabling three-dimensional imaging of tissue structure [37]. Multiphoton imaging technology also provides deeper light penetration (more than 700 µm) and lower background signal. Excitation light sources for such spectroscopy typically operate at wavelengths from 650 nm to 1064 nm, but using water transparency windows near 1300 nm or 1700 nm, it is possible to obtain a signal and construct deeper nonlinear images for the two-photon and three-photon cases, respectively [38]. Furthermore, high-energy (tens of nJ) femtosecond or picosecond pulses with a relatively high repetition rate are required to achieve sufficient imaging speed. The optimal value is approximately 10 MHz. At higher frequencies (approximately 100 MHz), the average radiation power becomes extremely high, leading to sample overheating, while low frequencies (100 kHz) proportionally (by two orders of magnitude) reduce the scanning time.
The real challenge of recent years is to move from an expensive standard bulky multi-photon microscopy setup into endoscopic format, which will allow an intravital and clinical patient imaging [39,40,41]. Special optical fibers play a crucial role for this technology. Such fibers can act both as a waveguide of intensive ultrashort laser pulses [42,43], which are necessary for the multiphoton fluorescence excitation, and as a nonlinear element, significantly broadening the spectrum of the initial radiation [44,45] and allowing the implementation of such approaches as multiplexed coherent anti-Stokes Raman scattering (M-CARS) [46,47] and optical coherence hyperspectral [48] microscopy.
In this review we are looking through the fundamental optical properties of live tissues in the context of demarcating tumor regions from healthy ones and present different evolution stages of both optical biopsy and invasive technologies. We attempt to find out the possible requirements for a MPEM that utilizes novel nonlinear effects in optical fibers like Kerr self-cleaning and supercontinuum generation to improve delivery of ultrashort laser pulses. By approaching this problem comprehensively — from the perspective of the physics of nonlinear processes in multimode and special fibers, engineering limitations of optical system miniaturization, clinical application scenarios, fluorescence properties of a tissue, and biological criteria for the early diagnosis of gastrointestinal disease — we aim to outline the parameters that determine the practical feasibility and biomedical value of the next generation of MPEM systems. This kind of interdisciplinary analysis allows us to identify the key conditions necessary for integrating complex nonlinear phenomena in optical fibers into clinically oriented MPEM.
2. Optical Properties of Healthy and Diseased GI Tissues and Detection Methods
Absorption and scattering properties of the biological tissue are the key parameters involved in any optical based methods and approaches for medical diagnostics and treatment including CRC detection. On the one hand, these parameters define interaction and scattering of light incident on the tissue, so the knowledge of their values is vital for the development of direct laser based approaches for medical treatment and diagnostics. Moreover, the knowledge of these parameters is necessary for the development of synthetic phantoms of biological tissue with close values of the absorption and scattering parameters. Such phantoms would have a similar response to incident radiation that is necessary for testing various medical devices and in scientific research. On the other hand, these parameters themselves can be used for CRC detection, enabling non-invasive tissue identification and tumor delineation in real time.
Specifically, when light illuminates multi-layered bowel tissue (see Figure. 1a), it is partially reflected at the surface and interfaces with refractive index mismatches and penetrates into the tissue, where processes of scattering and absorption may occur. Through multiple scattering events, a fraction of this light eventually re-emerges and can be measured for various diagnostics techniques. Moreover, some molecules may also exhibit autofluorescence, which will be described in the following chapters. To characterize light absorption in tissues where it significantly dominates over scattering, the Bouguer-Beer-Lambert law provides an accurate model for light attenuation [50]:
where is an incident light intensity, d is the sample thickness, is the spectral dependent absorption coefficient that can be calculated from the measured total transmittance and total reflectance spectra from a sample as: . The absorption coefficient of key specific molecules such as oxygenated (HbO2) and deoxygenated (Hb) hemoglobin, lipids, bilirubin and water are presented in Figure 1b, revealing the predominance of hemoglobin and bilirubin in the visible spectral range, where water absorption is negligible. In contrast, in the near-IR spectral region, water has a higher absorption coefficient along with lipids. The total absorption coefficient of the biological tissue represents a sum of the values of this coefficient for distinct biomolecules , taking into account their concentrations as follows: .
The scattering-based tissue parameters include the reduced scattering amplitude , Mie scattering power , and the percentage contribution of Rayleigh scattering , that along with the anisotropy factor of g define the scattering coefficient and the reduced scattering coefficient as follows [51]:
The scattering curve presented in Figure 1b, based on typical bowel tissue values reveals that scattering decreases at longer wavelengths. The scattering properties of tissue are determined by its microstructure, arising from extra- and intra-cellular inhomogeneities. These include variations in particle size and refractive index mismatches at multiple scales, from specific molecules like collagen fibers to organelles like mitochondria and cell membranes. The following are the most common methods for measuring the optical properties of biological tissues.
Conventional spectral measurements (see Figure 2a-b) provide an ex vivo approach for characterizing the optical properties of colorectal tissues. In this approach, a light source with a broad wavelength range, covering the visible and near-infrared spectrum, is used in conjunction with a spectrophotometer. Key optical parameters such as total transmittance , total reflectance and collimated transmittance are collected by an integrating sphere [52] for diffuse light or using a collimated transmittance setup [53]. These experimental spectral measurements serve as the input for analytical models of light propagation in turbid media. Techniques (e. g. the inverse adding-doubling method [54], the inverse Monte Carlo method [55] etc.) are employed to extract optical parameters, including , and . Once calculated, these parameters enable quantitative comparisons between healthy and diseased tissues and facilitate the development of accurate tissue-simulating phantoms for biophotonic applications.
Hyperspectral analysis (see Figure 2c) enables ex vivo and in vivo characterization of tissue optical properties. It employs a xenon or halogen lamp as a light source and an hyperspectral camera that collects spectral information of each pixel of a captured image [56,57]. The hyperspectral camera can be integrated in the endoscopic observation module for real-time diagnostics of colorectal cancer. In this approach, a two-dimensional collected dataset, referred to as "hyperspectral data", is transformed from reflection spectra into absorption spectra. However, the presence of undulation on the human tissue surface results in hyperspectral data dependencies from the distance and angle of each measurement point that lead to the need to normalize the spectral data.
Diffuse Reflectance Spectroscopy (DRS) is another approach for non-invasive tissue diagnostics and optical parameters measurements based on illuminating a tissue sample with a light source in the visible or near-infrared range and analyzing the resulting diffuse reflectance of light propagating inside the tissue (as presented in Figure 2d). As it was mentioned above, the reflected spectrum is quantitatively related to the tissue’s optical properties, namely its absorption and scattering coefficients, which serve as biomarkers for its physiological and structural state. Fitting the measured diffuse reflectance spectra based on reflectance values obtained by different approaches (e.g. Monte Carlo simulations of light propagation in tissues) enables reconstruction of these optical parameters and therefore the tissue chromophore concentrations in the target tissues. The last can be used for medical diagnostics, including cancer detection, because mucosa and tumor tissues have different concentrations of these biomolecules. However, colorectal cancer detection using DRS techniques faces some constraints related to limited depth below the tissue surface for measurements, specific wavelength range for detection of certain biomolecules, large numbers or required spectra to be measured and limitations of analytical models in describing all cases.
As it was mentioned in the introduction part, chromophore concentrations (total hemoglobin, lipid, water, bile, met-hemoglobin) and tissue scattering parameters (Mie scattering power, scattering amplitude, percentage contribution of Rayleigh scattering) can be used for CRC detection, enabling non-invasive tissue identification and tumor delineation in real time.
In particular, it was found that tumors had larger concentrations of total hemoglobin, water, and smaller concentration of lipid, StO2 compared to normal mucosa [51]. In total, hemoglobin concentrations of mg/dl and mg/dl were measured for normal mucosa and adenomatous polyp, respectively [59]. The same dependence on increase of total hemoglobin concentrations was observed in [60], where total hemoglobin concentration increased from µM for normal tissue to µM for tumor.
Moreover, the scattering properties of tumors differ from normal tissue, showing lower fraction of Rayleigh scattering () and higher Mie scattering power () and amplitude of reduced scattering coefficient for tumor in comparison with normal mucosa [51]. Specifically, the Mie scattering power increases from for normal mucosa to for tumor, whereas amplitude of reduced scattering coefficient increases from for mucosa to for tumor tissue. Taking into account these differences and combination of the parameters enables an efficient classification of normal mucosa and cancer tissues with accuracy of .
3. The Use of Autofluorescence Approaches for the GI Diagnostics
Many of the modern endoscopic methods to obtain images of the GI tissues traditionally use special dyes, such as fluorescein (stains the intercellular space, surface epithelial cells, and the lamina of the mucous membrane), cresyl violet (predominantly stains the cytoplasm and negatively visualizes the nuclei. It is also used for staining nervous tissue, mast cells, and cartilage), and acriflavine (stains surface epithelial cells, nuclei, and, to a lesser extent, the cytoplasm). However, these dyes are quite often not harmless to the patient’s body, so recent, the autofluorescent properties of the body’s own molecules, such as certain coenzymes (e. g., NADH), stromal structural proteins (collagen, elastin), and endogenous porphyrins [61], have begun to be used for the diagnosis of GI diseases. Numerous intracellular molecules have autofluorescent properties, with identifiable excitation and emission spectra. Contributing natural fluorophores include the metabolic coenzymes nicotinamide adenine dinucleotide phosphate (NAD(P)H) and flavin adenine dinucleotide (FAD) [62,63], structural collagen family proteins, and heme proteins such cytochrome c and protoporphyrin IX, as well as a lysosomal product (pigment) — lipofuscin [64,65,66,67]. For most of these molecules, UV or visible light results in the greatest absorption of light and, consequently, the greatest fluorescence emission. It should be noted that mitochondria and lysosomes are the intracellular structures that produce the majority of autofluorescence in living tissue.
Spectral assessment of cellular autofluorescence is a powerful tool for identifying cell types and their status because endogenous fluorophores have unique spectral signatures — excitation and emission wavelengths (see Table 1), that reflect metabolic state, morphology, and health of the cells and tissues. Successful applications of autofluorescence assessment include tumor surgical margin determination [68,69,70], assessment of the effects of age and drug exposure on stem cells [71], and specific cell properties such as reactive oxygen species (ROS) levels and cell cycle stage [72,73,74].
Autofluorescence spectroscopy (AFS) is one of the new analytical methods based on the assessment of endogenous fluorophores in tissues and biological fluids for the diagnostics [83]. The major limitation in the use of autofluorescence for differentiating healthy and pathological tissue areas is that autofluorescence measuring is currently available only at the upper layers of cells. Cancer and other pathophysiological processes may alter the amount and distribution of endogenous fluorophores in tissue [84,85]. Such changes can be found by using autofluorescence microscopy. It shows that differences in the clinically measured autofluorescence spectra between normal and cancerous colonic tissue are mainly due to thickening of the tumor mucosa, resulting in a reduced submucosa fluorescence contribution, as well as an increased hemoglobin absorption in tumor tissue [85]. The advantage of using autofluorescence to demarcate cancerous areas is that there is no need for any exogenous substances for the endoscopy and no staining procedures for biopsy samples. Several studies have demonstrated the autofluorescence aptitude to distinguish between healthy and cancerous tissue in patients, in particular for CRC [86,87], oral neoplasms [88], skin cancer [89], and cervical lesions [90]. The results of these studies showed that autofluorescence signals between normal and cancerous tissue differ and can be used for non-invasive diagnosis and tumor margin detection. A number of previous studies focused on differences in autofluorescence emission spectra between healthy and diseased colonic tissue. These studies have demonstrated differences in a variety of tissue types, including: between normal tissue and adenomatous (i.e., neoplastic) polyps ex vivo [91,92]; between normal tissue and adenomas in vivo [93]; between normal tissue or hyperplastic polyps and adenomas [94]; between hyperplastic polyps and adenomas [95]; and between all three of the above tissue groups [96]. Cancers of the upper gastrointestinal tract (esophagus and stomach) were also investigated [97].
An important indicator of autofluorescence is the fluorescence lifetime [98], which differs in normal and diseased tissue. Coda et al. [99] demonstrated differences in fluorescence lifetimes between healthy and neoplastic tissue in ex vivo experiments. Furthermore, an increase in autofluorescence lifetime was found in IBD compared to healthy gut tissue [99]. In a recent study, Herrando et al. assessed the intravital autofluorescence properties of colorectal tissues [76]. Collagen types I-IV, NAD(P)H, and flavins (FAD), which are the dominant tissue fluorophores in the colorectal mucosa, were selected as endogenous fluorophores. The author’s results provide compelling evidence that multiparametric autofluorescence lifetime measurements can provide additional functional and structural characterization of the tumor and adjacent normal (healthy) areas, potentially aiding in clinical decision-making in both diagnosis and treatment.
4. Modern GI Histology and Ex Vivo Models
The modern endoscopy arsenal uses forefront optical methods, which have significantly improved the detailed assessment of neoplastic changes in the GI mucosa especially for biopsy related applications. However, performing both standard and multiple biopsies or endoscopic mucosal resection for extended biopsy is associated with the risk of complications (bleeding, perforation). Moreover, frequent false-negative results, along with the expensive, labor-intensive, and multi-stage process of histological analysis, lead to significant material and time costs. One of the important rapidly developing areas is the creation of ex vivo technologies, biobanking of biopsies, 3D culture, and organoids [100,101,102]. The ex vivo cultivation of biopsies has opened up the great possibilities of thorough microscopic examination of diseased tissue samples without the need for multiple interventions[103,104]. While these approaches significantly advanced the study of the molecular mechanisms of GI pathologies and also gave rise to achieving detailed data for the personalized therapies, they do not compensate for the need to examine the impaired areas of the GI mucosa in real time. Intravital microscopy (IVM) was initially developed to visualize biological processes in living organisms at a cellular level, overcoming the limitations of traditional microscopy that formally required fixed tissue biopsy samples. Modern IVM has advanced significantly with the integration of fluorescence microscopy, two-photon microscopy, and non-linear microscopy [105]. In the last decades IVM is aimed at developing the direct, realtime observation of tissues at cellular and subcellular resolution in a minimally invasive way and is especially oriented to be implemented in human clinical settings. The approaches referred to as optical biopsy cover the IVM scanning to examine tissues in vivo visualizing the fluorescently labeled molecular markers or use of natural fluorophores to examine the acute immune response activation, such as leukocyte extravasation, as far as chronic inflammation, tumor growth and metastasis, vascularization, and metabolic shift in cellular processes. The development of non-invasive and rapid diagnostics for GI diseases has been an extremely high-priority area of research.
Although the concept of confocal microscopy was developed by M. Minsky much earlier [106], it was only the emergence of high-speed computing systems in the late 1990s that made possible the creation of a new technology — confocal laser microscopy (see Figure 3 left). This was followed by the development of confocal laser endomicroscopy (CLE). CLE is a minimally invasive technique that uses a miniature confocal endomicroscope built into an endoscope to obtain high-resolution microscopic images of the GI mucosa in vivo. Such endomicroscopes typically use continuous-wave laser radiation with wavelengths ranging from 480 to 488 nm; less frequently, other wavelengths are also used, such as 568 nm and 633 nm. Two different CLE systems have been used in clinical endoscopy - endoscope-based CLE (eCLE) and probe-based CLE (pCLE).
With eCLE, the confocal probe is directly integrated into the tip of a conventional endoscope (Pentax EG-3870CIK and Pentax EC-3870CLICK, Japan) [108]. The eCLE systems combines conventional endoscopy with CLE, eliminating the need for a separate device for routine exams of the upper and lower GI tracts. The integrated eCLE system provides high magnification and is considered a powerful but expensive tool for detecting lesions in the esophagus, stomach, and colon. It uses low-power laser sources at different wavelengths to illuminate the tissue and detect the fluorescent light that bounces back from the cells. The "confocal" aspect ensures that only light from a specific focal plane passes through, creating a high-resolution image of the cellular structure. A fluorescent contrast agent, such as fluorescein sodium, is typically administered intravenously to highlight the tissue structures. Images are acquired from the surface of the lens down to a depth of about 250 microns. But, there are some disadvantages of the eCLE method: e. g. a big size of the eCLE endoscope can make intubation difficult, especially in the upper GI tract. Another disadvantage of eCLE is the high cost of such systems. Therefore, some eCLE systems are no longer commercially available [109].
With probe-based CLE (pCLE), a laser-scanning microscope is integrated into a slender probe that can be passed through the channel of a standard endoscope. The probe is placed on or in contact with the tissue of interest. A low-energy laser is transmitted through the probe, illuminating the tissue. The reflected light is sent back through the same probe, allowing the system to create an image at the cellular or even subcellular level. Fluorescent dyes, such as fluorescein, are often used to enhance contrast and visualize the cellular structures. The device can be delivered in different ways: (I) into the luminal gastrointestinal tract through the working channel of standard endoscopes; (II) into extraluminal cystic and solid parenchymal lesions through an endoscopic ultrasound (EUS) needle; or (III) into the biliary system through an endoscopic retrograde cholangiopancreatography (ERCP) accessory channel (Cellvizio, Mauna Kea Technologies, France) [110].
Key applications and benefits of pCLE are real-time diagnosis, that provides immediate microscopic information to help diagnose lesions and differentiate between benign and malignant tissues. Improved biopsy guidance allows clinicians to guide biopsies to the most relevant part of a lesion, increasing the yield and accuracy of the procedure, and reduced need for biopsies. In some cases, pCLE can provide enough diagnostic information to avoid the need for a traditional biopsy, saving time and reducing costs. Also, pCLE has a good versatility: different probes can be used depending on the procedure, such as specialized probes for the biliary tract (e. g., CholangioFlex) or the gastrointestinal tract (e. g., GastroFlex) [111].
Of course, pCLE has some limitations in comparison with eCLE, such as limited depth of the imaging, only single plane imaging and the resolution may be slightly lower than other methods like endomicroscopy performed with dedicated endoscopes.
5. Multiphoton Microscopy for In Vivo Imaging
In recent years, the MPM technology has become one of the indispensable imaging tools in tissue research with its submicron spatial resolution, millimeter-level imaging depth (versus 100 microns for confocal microscopy, see Figure 3 right), and three-dimensional tomography capabilities [112]. The most promising application of MPM is imaging of deep scattering tissues, especially in vivo. It allows to perform measurements with an extremely high-resolution and observes neuronal activity, pathological processes in tumors or cancer [113], and the metabolism of a living cell [114,115] in realtime. This enables researchers to address key problems in biology and biomedicine, uncover disease mechanisms, and develop new effective drugs and therapeutic approaches. The basic principles of multiphoton processes are depicted in Figure 4. From the left side (Figure 4a), it is shown schematically that the same fluorescence process can be excited by different wavelengths as a result of the absorption of one, two, or three photons. At the same time, pump radiation at one wavelength (e. g. 1064 nm) can activate a few nonlinear processes like harmonic generation, two- and three photon fluorescence (see Figure 4b) in the case if absorption spectra of the transitions matched well with the conditions of the corresponding processes.
Nonlinear imaging with ultrashort pulsed lasers has long been a subject of research for intraoperative endoscopy applications due to the lack of need for toxic specimen staining and their inherent optical sectioning (no need for specimen slicing), among other advantages. To date, a wide range of schemes have been demonstrated that allow single-mode imaging using two-photon [117] and multiphoton fluorescence [40], second and third harmonic generation, and CARS [118]. The scanning area and tissue penetration depth of the listed systems are limited by the mode field diameter and radiation intensity, respectively. In this regard, the use of multimode (MM) fibers in an endoscopic system is promising, since they have a larger mode size and support the propagation of radiation with higher intensity. However, the use of MM fibers for imaging was considered to be difficult due to random coupling of transverse modes, especially in the presence of mechanical stresses (e. g. bending). This coupling distorts the information as the pulse propagates, making high-resolution, real-time imaging impossible.
6. Advances and Challenges of Using Optical Fibers
6.1. Beam Self-Cleaning and Supercontinuum Generation
In recent years, the situation changed dramatically, and MM optical fibers are currently experiencing a tremendous growth of research interest. This is driven, on the one hand, by the development of sources and means for analyzing laser radiation, and, on the other hand, by the significant increase in transmitted signal power, at which standard single-mode fibers become inapplicable. In particular, ambitious tasks are being set again, such as transmitting images through such fibers [119,120]. To solve the problem, some scientific groups use spatial light modulators. In this approach, a preliminary deep learning process is required to determine the fiber transmission matrix that takes into account random intermode coupling [121,122,123,124]. But another solution also exists and it lies in using nonlinear imaging methods based on MM and Hollow-Core (HC) fibers. MM fibers take advantage of the virtually instantaneous effect of Kerr self-cleaning of the beam (also known as beam self cleaning, BSC) [125,126], eliminating the need for external modulation systems or training steps that would determine the fiber transfer matrix. HC fibers can just propagate high-power femtosecond pulses with minimal distortions and allows the use of different gases as a nonlinear medium [43]. Moreover, the double-clad design of HC fibers allows using the same fiber both for excitation of nonlinear processes and collection of fluorescent light. Some schemes have already demonstrated applicability of HC [127,128] and a combination of HC and MM gradient index (GRIN) fibers [129] for endoscopic systems where nonlinear visualization is achieved by means of CARS and second harmonic generation.
BSC is a nonlinear effect occurring at relatively high optical powers (1–10 kW), manifested as follows: The chaotic intensity distribution (speckle) at the fiber output in low-power mode is transformed into a Gaussian-like beam as the power increases [125] while the temporal reshaping also occurs (see Figure 5). This phenomenon ensures precise focusing on the sample, contributes to the efficiency of the entire system [126], and provides the high resolution required for tissue structure imaging using multiphoton microscopy [130,131]. This innovation significantly simplifies and speeds up the beam focusing process and reduces the cost of the device itself. The resulting improvement in beam brightness remains resistant to mechanical impact on the fiber, which is especially advantageous for endoscopic visualization systems.
The spatiotemporal characteristics of beam self-cleaning, combined with the accompanying increase in peak pulse power and supercontinuum generation (see Figure 5), open the way for important improvements in nonlinear imaging processes. These include the integration of multiphoton fluorescence with second and third-harmonics, as well as coherent Raman-based processes such as CARS or stimulated Raman scattering (SRS) [47,126,133]. The novel concept could be based on the nonlinear response of medium of the GRIN MM fiber to the propagation of high-peak-power optical pulses in combination with precise control of the input laser beam coupling conditions. Experiments performed by the teams of S. Wabnitz, V. Couderc, and M. Papi have shown that self-cleaning can lead to a significant improvement in the resolution of multispectral multiphoton fluorescence and multiplexed CARS (M-CARS) images. This improvement is observed in both microscopy and endoscopy when using GRIN MM fiber to deliver the laser beam to the specimen/sample [47,126,133]. To evaluate the advantages of the described imaging system, 2D and 3D spatial resolutions were determined. For example, a “clean” beam at 1064 nm wavelength provides a transverse and longitudinal resolution of 0.66 µm and 3.1 µm, respectively. This represents a significant improvement over the linear MM mode of operation, in which multiple focal points caused by the chaotic shape of the initial speckle beam significantly degrade spatial resolution beyond 1.5 µm.
The most important feature of this imaging system is the reliability of images obtained using "clean" beams compared to speckle beams. Thus, the central part of Figure 6 demonstrates the spatial correlation between numerous images obtained after exposure of the MM fiber to various external disturbances (for example, tension or bending). Images captured in self-cleaning mode remain stable and unaffected by environmental factors. In contrast, images obtained with speckle beams (i. e., beam powers below the self-cleaning threshold) exhibit high instability and are prone to blurring. Due to the advantages listed for the system, virtually all of the innovative in vivo research methods based on multiphoton microscopy that are currently being developed in dermatology will also become available for endoscopic research. In particular, most of the traditional histological procedures can be replaced by morphological and structural analysis of tissues [134]. This will enable visualization and quantification of drug delivery, cancer detection and investigation of collagen structural transitions.
6.2. Numerical Modeling
Numerical modeling is indispensable for understanding the nonlinear beam dynamics in multimode fibers, as it not only validates experimental observations but also provides a framework for optimizing system parameters and exploring regimes inaccessible in laboratory settings. Simulation provides insight into the complex interplay of modal dispersion, Kerr nonlinearity, and linear random coupling. In recent years, various mathematical models have been proposed to describe these processes, ranging from simplified approximations to full-scale numerical models.
A foundational tool for both beam self-cleaning and supercontinuum generation (SCG) studies is the generalized 3D nonlinear Schrödinger equation (GNLSE3D). This full spatiotemporal model captures transverse mode beating, Kerr nonlinearity, linear modal dispersion, and self-imaging in MM GRIN fibers. Using this framework, in [125], Kerr beam self-cleaning was reproduced, and it has been shown that the nonlinear energy flow leads to the dominance of the fundamental mode with reduced higher-order contributions. The same model has been applied to broadband SCG, where it reproduces geometric parametric instability, dispersive-wave emission, and octave-spanning spectra in both silica and non-silica GRIN fibers [135,136]. Although GNLSE3D is highly accurate, its computational cost scales unfavorably with the number of modes, prompting the development of reduced models.
One important class consists of effective 1+1D GNLSE models tailored for graded-index fibers. These models incorporate the transverse dynamics into a longitudinally periodic or averaged nonlinear Kerr coefficient. The resulting equations retain key features of modal self-imaging while enabling fast simulations. They have successfully reproduced geometric parametric instabilities and broadband dispersive-wave emission in GRIN fibers [137], and have been used to model multimode soliton dynamics, including formation, fission, and dispersive-wave shedding that seeds SCG [138]. Extensions including Raman response, higher-order dispersion, and self-steepening enable quantitative agreement with experiments on high-power, cascaded-Raman-pumped SC sources in GRIN fibers [139].
For a more explicit description of intermodal coupling, the multimode GNLSE (MM-GNLSE) has been developed. This formalism describes evolution of each guided mode and incorporates mode-dependent dispersion, Kerr and Raman nonlinearities, self-steepening, and wavelength-dependent intermodal coupling tensors [140]. The MM-GNLSE has been applied to SCG in step-index and graded-index MMFs [141], revealing how intermodal four-wave mixing and spatiotemporal oscillations shape the supercontinuum [142]. Reformulation into ordinary differential equations in the spectral domain [143] and the development of GPU-accelerated solvers [144,145] have efficiency, enabling simulations involving dozens of modes over long fiber spans. The same framework has also been used to model mode-selective SCG in few-mode liquid-core fibers, showing dual dispersive-wave generation and intermodal XPM-induced radiation in agreement with measurements [146].
When the number of modes becomes very large, full-field (3+1)D spatiotemporal simulations offer an alternative to modal decompositions. These models directly evolve the field in the transverse coordinates and propagation direction, bypassing mode expansion and outperforming modal models when hundreds of modes are excited. They have produced quantitative agreement with broadband SCG spectra in GRIN fibers [136], as well as in tellurite and chalcogenide multimode platforms, capturing both multimode soliton dynamics and high-order dispersive-wave emission [147].
In parallel, simplified coupled-mode models provide a complementary, physically transparent description of intermodal energy exchange. In [148], such a model was introduced to describe Kerr beam self-cleaning as a turbulence-like cascade involving both direct and inverse energy transfer among modes. Its main advantage is the ability to use large integration steps, making it practical for long-fiber simulations. This model was extended in [149] to incorporate random linear mode coupling arising from fiber imperfections, demonstrating numerically and experimentally that disorder can accelerate beam self-cleaning. A further generalization including Raman gain and intracavity filtering in a multimode fiber laser was developed in [150], explaining the formation of a nearly single-mode Stokes beam through the combined action of Raman gain competition and Kerr-induced modal condensation.
Despite the substantial progress across these modeling approaches, no existing framework fully captures all relevant processes—broadband dispersion, modal disorder, nonlinear gain, vectorial effects, and long-distance propagation—within a single computationally efficient model, leaving substantial room for future refinements.
6.3. Image Acquisition Scanning System
The use of laser beams obtained as a result of self-cleaning allows achieving the maximum resolution provided by the microscopic system (excluding the MM fiber for beam transport, see ref. [126]), which is 0.37 µm and 0.54 µm in the near infrared and infrared regions of the spectrum, respectively. However, there is a big challenge to miniaturize the bulky MPM optics into a compact and flexible probe applicable for endoscopic investigations. An analysis of modern developments in piezoelectric scanning multiphoton endomicroscopy, as presented in the review [151], shows that this field has achieved significant technological progress. Systems with various scanning schemes actuated by piezoelectric drives have been implemented: raster (up to 4.1 frames/s) [152], spiral (from 8 to 30 frames/s) [153,154], and Lissajous (up to 5 frames/s) [155]. The key element of these systems is a piezoelectric scanner operating based on the resonant oscillations of a system. Technical solutions vary from the use of piezoelectric tubes [156], bimorphs [152], and four-plate piezoelectric actuators [157] to complex systems with silicon counterweights for resonant frequency separation and reduction of mechanical cross-talk [155]. Typical characteristics of such endoscopes include high lateral resolution (0.7-–0.8 µm) and compact distal probe dimensions (diameter 2–-3.5 mm, length 30-–53 mm). It should be noted that the achievable scanning ranges (field-of-view) in the described systems vary from µm to µm, which covers the requirements for both cellular analysis and general visualization of tissue structures.
6.4. Artificial Intelligence-Assisted Post-Processing
Multiphoton microscopy methods, due to their extremely high spatial resolution and acquisition speed, allow the accumulation of an enormous volume of morphological and structural information about the tissues being studied. To analyze such a volume, machine learning algorithms are actively used, including the random forest method and the support vector machine. These algorithms have proven themselves well in classification tasks and, when applied in structural analysis, already allow for the rapid identification of disease stages in the tissues studied [158,159]. Thus, the first work presents the results of two-photon in vivo visualization of lymphedema tissue. The study involved 36 image samples from patients with stage II lymphedema and 42 image samples from healthy volunteers. The papillary layer of the skin was examined with a penetration depth of about 100 µm. During the study, both disorganization of the collagen network and an increase in the collagen/elastin ratio in lymphedema tissue were observed, characterizing the severity of fibrosis. Classification using ”ensemble learning” achieved 96% accuracy on the test set [158]. The second work focused on the structure of collagen [159], which is associated with the pathogenesis of many skin diseases. However, collagen also plays an important role in maintaining gut health. It helps restore mucous membrane of the stomach and intestines, which is important for good digestion and absorption of nutrients.
7. Conclusion
This review presents a potential to move optical biopsy from a concept to a widely used technique by introducing innovative technologies that improve image resolution, contrast, and tissue penetration. It describes modern approaches and achievements in identifying informative features in images of biological tissue collagen obtained by multi-photon microscopy, and on this basis, algorithms for computer classification of its structures are developed. What is noteworthy is that all of these developments became available only recently, and can be directly used to create an imaging system to classify gastrointestinal diseases in vivo and determine their stage. It is an extremely challenging task, as far as it requires a strong multidisciplinary background. We believe that this is the direction in which researchers will concentrate their efforts in the next decade.
Author Contributions
Writing—original draft, M.D.G., K.V.S., D.S.Kh., L.V.B., V.V.Sh., A.A.E., A.V.D., Zh.E.M., D.A.R., O.S.S., I.S.Ch. and K.S.R.; writing—review and editing, D.S.Kh., L.V.B., V.V.Sh., A.A.E., A.V.D. and O.S.S.; supervision and funding acquisition, S.W., D.S.Kh., L.V.B. and M.D.G. All authors have read and agreed to the published version of the manuscript.
Funding
This work was supported by Russian Science Foundation (RSF) grant 25-72-31018.
Data Availability Statement
No new data were created or analyzed in this study.
Conflicts of Interest
The authors declare no conflicts of interest.
References
- Hracs, L.; Windsor, J.W.; Gorospe, J.; Cummings, M.; Coward, S.; Buie, M.J.; Quan, J.; Goddard, Q.; Caplan, L.; Markovinović, A.; et al. Global evolution of inflammatory bowel disease across epidemiologic stages. Nature 2025, 1–9. [Google Scholar] [CrossRef] [PubMed]
- Alatab, S.; Sepanlou, S.G.; Ikuta, K.; Vahedi, H.; Bisignano, C.; Safiri, S.; Sadeghi, A.; Nixon, M.R.; Abdoli, A.; Abolhassani, H.; et al. The global, regional, and national burden of inflammatory bowel disease in 195 countries and territories, 1990–2017: a systematic analysis for the Global Burden of Disease Study 2017. The Lancet gastroenterology & hepatology 2020, 5, 17–30. [Google Scholar]
- Ng, S.C.; Shi, H.Y.; Hamidi, N.; Underwood, F.E.; Tang, W.; Benchimol, E.I.; Panaccione, R.; Ghosh, S.; Wu, J.C.; Chan, F.K.; et al. Worldwide incidence and prevalence of inflammatory bowel disease in the 21st century: a systematic review of population-based studies. The Lancet 2017, 390, 2769–2778. [Google Scholar] [CrossRef] [PubMed]
- Fanizza, J.; Bencardino, S.; Allocca, M.; Furfaro, F.; Zilli, A.; Parigi, T.L.; Fiorino, G.; Peyrin-Biroulet, L.; Danese, S.; D’Amico, F. Inflammatory bowel disease and colorectal cancer. Cancers 2024, 16, 2943. [Google Scholar] [CrossRef] [PubMed]
- Mak, W.Y.; Zhao, M.; Ng, S.C.; Burisch, J. The epidemiology of inflammatory bowel disease: East meets west. Journal of gastroenterology and hepatology 2020, 35, 380–389. [Google Scholar] [CrossRef]
- Eaden, J.; Abrams, K.; Mayberry, J. The risk of colorectal cancer in ulcerative colitis: a meta-analysis. Gut 2001, 48, 526–535. [Google Scholar] [CrossRef]
- Zhang, L.; Zhang, X.; Su, T.; Xiao, T.; Xu, H.; Zhao, S. Colorectal cancer risk in ulcerative colitis: an updated population-based systematic review and meta-analysis. EClinicalMedicine 2025, 84. [Google Scholar] [CrossRef]
- Scaldaferri, F.; Fiocchi, C. Inflammatory bowel disease: progress and current concepts of etiopathogenesis. Journal of digestive diseases 2007, 8, 171–178. [Google Scholar] [CrossRef]
- Santos, M.P.C.; Gomes, C.; Torres, J. Familial and ethnic risk in inflammatory bowel disease. Annals of gastroenterology 2017, 31, 14. [Google Scholar] [CrossRef]
- Park, J.B.; Yang, S.K.; Byeon, J.S.; Park, E.R.; Moon, G.; Myung, S.J.; Park, W.K.; Yoon, S.G.; Kim, H.S.; Lee, J.G.; et al. Familial occurrence of inflammatory bowel disease in Korea. Inflammatory bowel diseases 2006, 12, 1146–1151. [Google Scholar] [CrossRef]
- Kevans, D.; Silverberg, M.S.; Borowski, K.; Griffiths, A.; Xu, W.; Onay, V.; Paterson, A.D.; Knight, J.; Croitoru, K.; Project, G. IBD genetic risk profile in healthy first-degree relatives of Crohn’s disease patients. Journal of Crohn’s and Colitis 2016, 10, 209–215. [Google Scholar] [CrossRef] [PubMed]
- Liu, T.C.; Stappenbeck, T.S. Genetics and pathogenesis of inflammatory bowel disease. Annual Review of Pathology: Mechanisms of Disease 2016, 11, 127–148. [Google Scholar] [CrossRef] [PubMed]
- Sakamoto, N.; Kono, S.; Wakai, K.; Fukuda, Y.; Satomi, M.; Shimoyama, T.; Inaba, Y.; Miyake, Y.; Sasaki, S.; Okamoto, K.; et al. Dietary risk factors for inflammatory bowel disease A Multicenter Case-Control Study in Japan. Inflammatory bowel diseases 2005, 11, 154–163. [Google Scholar] [CrossRef] [PubMed]
- Bernstein, C.N.; Rawsthorne, P.; Cheang, M.; Blanchard, J.F. A population-based case control study of potential risk factors for IBD. Official journal of the American College of Gastroenterology| ACG 2006, 101, 993–1002. [Google Scholar] [CrossRef] [PubMed]
- Baker, D.; Folan, A.M.; Lee, M.; Jones, G.; Brown, S.; Lobo, A. A systematic review and meta-analysis of outcomes after elective surgery for ulcerative colitis. Colorectal Disease 2021, 23, 18–33. [Google Scholar] [CrossRef]
- Potten, C.S.; Kellett, M.; Rew, D.; Roberts, S.A. Proliferation in human gastrointestinal epithelium using bromodeoxyuridine in vivo: data for different sites, proximity to a tumour, and polyposis coli. Gut 1992, 33, 524. [Google Scholar] [CrossRef]
- Ritsma, L.; Ellenbroek, S.I.; Zomer, A.; Snippert, H.J.; De Sauvage, F.J.; Simons, B.D.; Clevers, H.; Van Rheenen, J. Intestinal crypt homeostasis revealed at single-stem-cell level by in vivo live imaging. Nature 2014, 507, 362–365. [Google Scholar] [CrossRef]
- Peterson, L.W.; Artis, D. Intestinal epithelial cells: regulators of barrier function and immune homeostasis. Nature reviews immunology 2014, 14, 141–153. [Google Scholar] [CrossRef]
- König, J.; Wells, J.; Cani, P.D.; García-Ródenas, C.L.; MacDonald, T.; Mercenier, A.; Whyte, J.; Troost, F.; Brummer, R.J. Human intestinal barrier function in health and disease. Clinical and translational gastroenterology 2016, 7, e196. [Google Scholar] [CrossRef]
- Kany, S.; Vollrath, J.T.; Relja, B. Cytokines in inflammatory disease. International journal of molecular sciences 2019, 20, 6008. [Google Scholar] [CrossRef]
- Johansson, M.E.; Gustafsson, J.K.; Holmén-Larsson, J.; Jabbar, K.S.; Xia, L.; Xu, H.; Ghishan, F.K.; Carvalho, F.A.; Gewirtz, A.T.; Sjövall, H.; et al. Bacteria penetrate the normally impenetrable inner colon mucus layer in both murine colitis models and patients with ulcerative colitis. Gut 2014, 63, 281–291. [Google Scholar] [CrossRef]
- Eri, R.; Chieppa, M. Messages from the inside. The dynamic environment that favors intestinal homeostasis. Frontiers in immunology 2013, 4, 323. [Google Scholar] [CrossRef] [PubMed]
- Greten, F.R.; Grivennikov, S.I. Inflammation and cancer: triggers, mechanisms, and consequences. Immunity 2019, 51, 27–41. [Google Scholar] [CrossRef] [PubMed]
- Li, Q.; Geng, S.; Luo, H.; Wang, W.; Mo, Y.Q.; Luo, Q.; Wang, L.; Song, G.B.; Sheng, J.P.; Xu, B. Signaling pathways involved in colorectal cancer: pathogenesis and targeted therapy. Signal Transduction and Targeted Therapy 2024, 9, 266. [Google Scholar] [CrossRef] [PubMed]
- Gono, K.; Obi, T.; Yamaguchi, M.; Ohyama, N.; Machida, H.; Sano, Y.; Yoshida, S.; Hamamoto, Y.; Endo, T. Appearance of enhanced tissue features in narrow-band endoscopic imaging. Journal of biomedical optics 2004, 9, 568–577. [Google Scholar] [CrossRef]
- Nakaniwa, N.; Namihisa, A.; Ogihara, T.; Ohkawa, A.; Abe, S.; Nagahara, A.; Kobayashi, O.; Sasaki, J.; Sato, N. Newly developed autofluorescence imaging videoscope system for the detection of colonic neoplasms. Digestive Endoscopy 2005, 17, 235–240. [Google Scholar] [CrossRef]
- Kiesslich, R.; Burg, J.; Vieth, M.; Gnaendiger, J.; Enders, M.; Delaney, P.; Polglase, A.; McLaren, W.; Janell, D.; Thomas, S.; et al. Confocal laser endoscopy for diagnosing intraepithelial neoplasias and colorectal cancer in vivo. Gastroenterology 2004, 127, 706–713. [Google Scholar] [CrossRef]
- Wang, T.D.; Friedland, S.; Sahbaie, P.; Soetikno, R.; Hsiung, P.L.; Liu, J.T.; Crawford, J.M.; Contag, C.H. Functional imaging of colonic mucosa with a fibered confocal microscope for real-time in vivo pathology. Clinical Gastroenterology and Hepatology 2007, 5, 1300–1305. [Google Scholar] [CrossRef]
- Tang, Y.; Anandasabapathy, S.; Richards-Kortum, R. Advances in optical gastrointestinal endoscopy: a technical review. Molecular Oncology 2021, 15, 2580–2599. [Google Scholar] [CrossRef]
- Fu, Y.; Zhang, S.; Ma, L.; Zhao, Z.; Liao, H.; Xie, T. Comprehensive advancement in endoscopy: optical design, algorithm enhancement, and clinical validation for merged WLI and CBI imaging. Biomedical Optics Express 2024, 15, 506–523. [Google Scholar] [CrossRef]
- Bidani, K.; Moond, V.; Nagar, M.; Broder, A.; Thosani, N. Optical Imaging Technologies and Clinical Applications in Gastrointestinal Endoscopy. Diagnostics 2025, 15, 2625. [Google Scholar] [CrossRef] [PubMed]
- Lee, S.K. Usefulness and future prospects of confocal laser endomicroscopy for gastric premalignant and malignant lesions. Clinical Endoscopy 2015, 48, 511–515. [Google Scholar] [CrossRef] [PubMed]
- Chiriac, S.; Sfarti, C.V.; Minea, H.; Stanciu, C.; Cojocariu, C.; Singeap, A.M.; Girleanu, I.; Cuciureanu, T.; Petrea, O.; Huiban, L.; et al. Impaired intestinal permeability assessed by confocal laser endomicroscopy—a new potential therapeutic target in inflammatory bowel disease. Diagnostics 2023, 13, 1230. [Google Scholar] [CrossRef] [PubMed]
- Denk, W.; Strickler, J.H.; Webb, W.W. Two-photon laser scanning fluorescence microscopy. Science 1990, 248, 73–76. [Google Scholar] [CrossRef] [PubMed]
- Ávila, F.J.; Gambín, A.; Artal, P.; Bueno, J.M. In vivo two-photon microscopy of the human eye. Sci. Rep. 2019, 9, 1–10. [Google Scholar] [CrossRef]
- Borile, G.; Sandrin, D.; Filippi, A.; Anderson, K.I.; Romanato, F. Label-free multiphoton microscopy: Much more than fancy images. Int. J. Mol. Sci. 2021, 22, 1–20. [Google Scholar] [CrossRef]
- Hoover, E.E.; Squier, J.A. Advances in multiphoton microscopy technology. Nat. Photonics 2013, 7, 93–101. [Google Scholar] [CrossRef]
- Xu, C.; Wise, F.W. Recent advances in fiber lasers for nonlinear microscopy. Nat. Photonics 2013, 7, 875–882. [Google Scholar] [CrossRef]
- Jung, J.C.; Schnitzer, M.J. Multiphoton endoscopy. Opt. Lett. 2003, 28, 902. [Google Scholar] [CrossRef]
- Akhoundi, F.; Qin, Y.; Peyghambarian, N.; Barton, J.K.; Kieu, K. Compact fiber-based multi-photon endoscope working at 1700 nm. Biomedical optics express 2018, 9, 2326–2335. [Google Scholar] [CrossRef]
- Kučikas, V.; Werner, M.P.; Schmitz-Rode, T.; Louradour, F.; van Zandvoort, M.A. Two-Photon Endoscopy: State of the Art and Perspectives. Mol. Imaging Biol. 2023, 25, 3–17. [Google Scholar] [CrossRef] [PubMed]
- Bufetov, I.A.; Kosolapov, A.F.; Pryamikov, A.D.; Gladyshev, A.V.; Kolyadin, A.N.; Krylov, A.A.; Yatsenko, Y.P.; Biriukov, A.S. Revolver hollow core optical fibers. Fibers 2018, 6. [Google Scholar] [CrossRef]
- Gladyshev, A.; Yatsenko, Y.; Kosolapov, A.; Myasnikov, D.; Bufetov, I. Propagation of megawatt subpicosecond light pulses with the minimum possible shape and spectrum distortion in an air- or argon-filled hollow-core revolver fibre. Quantum Electron. 2019, 49, 1100–1107. [Google Scholar] [CrossRef]
- Lopez-Galmiche, G.; Sanjabi Eznaveh, Z.; Eftekhar, M.A.; Antonio Lopez, J.; Wright, L.G.; Wise, F.; Christodoulides, D.; Amezcua Correa, R. Visible supercontinuum generation in a graded index multimode fiber pumped at 1064 nm. Opt. Lett. 2016, 41, 2553. [Google Scholar] [CrossRef] [PubMed]
- Sun, Y.; Zitelli, M.; Ferraro, M.; Mangini, F.; Parra-Rivas, P.; Wabnitz, S. Multimode soliton collisions in graded-index optical fibers. Opt. Express 2022, 30, 21710, [2202.09843. [Google Scholar] [CrossRef] [PubMed]
- Cheng, J.X.; Volkmer, A.; Book, L.D.; Xie, X.S. Multiplex coherent anti-stokes Raman scattering microspectroscopy and study of lipid vesicles. J. Phys. Chem. B 2002, 106, 8493–8498. [Google Scholar] [CrossRef]
- Wehbi, S.; Mansuryan, T.; Krupa, K.; Fabert, M.; Tonello, A.; Zitelli, M.; Ferraro, M.; Mangini, F.; Sun, Y.; Vergnole, S.; et al. Continuous spatial self-cleaning in GRIN multimode fiber for self-referenced multiplex CARS imaging. Optics Express 2022, 30, 16104–16114. [Google Scholar] [CrossRef]
- Chen, W.; Chen, Z.; Xing, D. Optical coherence hyperspectral microscopy with a single supercontinuum light source. J. Biophotonics 2021, 14, 1–9. [Google Scholar] [CrossRef]
- Clancy, N.T.; Jones, G.; Maier-Hein, L.; Elson, D.S.; Stoyanov, D. Surgical spectral imaging. Medical image analysis 2020, 63, 101699. [Google Scholar] [CrossRef]
- Gonçalves, T.M.; Martins, I.S.; Silva, H.F.; Tuchin, V.V.; Oliveira, L.M. Spectral optical properties of rabbit brain cortex between 200 and 1000 nm. Photochem 2021, 1, 190–208. [Google Scholar] [CrossRef]
- Nogueira, M.S.; Raju, M.; Gunther, J.; Maryam, S.; Amissah, M.; Lu, H.; Killeen, S.; O’Riordain, M.; Andersson-Engels, S. Tissue biomolecular and microstructure profiles in optical colorectal cancer delineation. Journal of Physics D: Applied Physics 2021, 54, 454002. [Google Scholar] [CrossRef]
- Krainov, A.; Mokeeva, A.; Sergeeva, E.; Agrba, P.; Kirillin, M.Y. Optical properties of mouse biotissues and their optical phantoms. Optics and Spectroscopy 2013, 115, 193–200. [Google Scholar] [CrossRef]
- Carneiro, I.; Carvalho, S.; Henrique, R.; Oliveira, L.; Tuchin, V.V. Kinetics of optical properties of colorectal muscle during optical clearing. IEEE Journal of Selected Topics in Quantum Electronics 2018, 25, 1–8. [Google Scholar] [CrossRef]
- Carvalho, S.; Gueiral, N.; Nogueira, E.; Henrique, R.; Oliveira, L.; Tuchin, V.V. Comparative study of the optical properties of colon mucosa and colon precancerous polyps between 400 and 1000 nm. Proceedings of the Dynamics and Fluctuations in Biomedical Photonics XIV. SPIE 2017, Vol. 10063, 218–233. [Google Scholar]
- Bashkatov, A.N.; Genina, E.; Kochubey, V.I.; Rubtsov, V.; Kolesnikova, E.A.; Tuchin, V.V. Optical properties of human colon tissues in the 350-2500 nm spectral range. Quantum Electronics 2014, 44, 779. [Google Scholar] [CrossRef]
- Kumashiro, R.; Konishi, K.; Chiba, T.; Akahoshi, T.; Nakamura, S.; Murata, M.; Tomikawa, M.; Matsumoto, T.; Maehara, Y.; Hashizume, M. Integrated endoscopic system based on optical imaging and hyperspectral data analysis for colorectal cancer detection. Anticancer research 2016, 36, 3925–3932. [Google Scholar]
- Yoon, J.; Joseph, J.; Waterhouse, D.J.; Luthman, A.S.; Gordon, G.S.; Di Pietro, M.; Januszewicz, W.; Fitzgerald, R.C.; Bohndiek, S.E. A clinically translatable hyperspectral endoscopy (HySE) system for imaging the gastrointestinal tract. Nature communications 2019, 10, 1902. [Google Scholar] [CrossRef]
- Shahin, A.; Bachir, W.; El-Daher, M.S. Optical investigation of bovine grey and white matters in visible and near-infrared ranges. Polish Journal of Medical Physics and Engineering 2021, 27, 99–107. [Google Scholar] [CrossRef]
- Zonios, G.; Perelman, L.T.; Backman, V.; Manoharan, R.; Fitzmaurice, M.; Van Dam, J.; Feld, M.S. Diffuse reflectance spectroscopy of human adenomatous colon polyps in vivo. Applied optics 1999, 38, 6628–6637. [Google Scholar] [CrossRef]
- Wang, H.W.; Jiang, J.K.; Lin, C.H.; Lin, J.K.; Huang, G.J.; Yu, J.S. Diffuse reflectance spectroscopy detects increased hemoglobin concentration and decreased oxygenation during colon carcinogenesis from normal to malignant tumors. Optics express 2009, 17, 2805–2817. [Google Scholar] [CrossRef]
- Croce, A.C.; Bottiroli, G. Autofluorescence spectroscopy and imaging: a tool for biomedical research and diagnosis. European journal of histochemistry: EJH 2014, 58, 2461. [Google Scholar] [CrossRef]
- Lukina, M.; Shirmanova, M.; Sergeeva, T.; Zagaynova, E. Metabolic Imaging in the Study of Oncological Processes (Review). Sovrem. Tehnol. v Med. 2016, 8, 113–126. [Google Scholar] [CrossRef]
- Potapova, E.V.; Dremin, V.V.; Shupletsov, V.V.; Kandurova, K.Y.; Dunaev, A.V. Optical percutaneous needle biopsy in oncology. Light Adv. Manuf. 2025, 6, 1. [Google Scholar] [CrossRef]
- Gosnell, M.E.; Anwer, A.G.; Mahbub, S.B.; Menon Perinchery, S.; Inglis, D.W.; Adhikary, P.P.; Jazayeri, J.A.; Cahill, M.A.; Saad, S.; Pollock, C.A.; et al. Quantitative non-invasive cell characterisation and discrimination based on multispectral autofluorescence features. Scientific reports 2016, 6, 23453. [Google Scholar] [CrossRef] [PubMed]
- Croce, A.C.; Ferrigno, A.; Bottiroli, G.; Vairetti, M. Autofluorescence-based optical biopsy: An effective diagnostic tool in hepatology. Liver International 2018, 38, 1160–1174. [Google Scholar] [CrossRef] [PubMed]
- Mahbub, S.B.; Guller, A.; Campbell, J.M.; Anwer, A.G.; Gosnell, M.E.; Vesey, G.; Goldys, E.M. Non-invasive monitoring of functional state of articular cartilage tissue with label-free unsupervised hyperspectral imaging. Scientific reports 2019, 9, 4398. [Google Scholar] [CrossRef]
- Campbell, J.M.; Walters, S.N.; Habibalahi, A.; Mahbub, S.B.; Anwer, A.G.; Handley, S.; Grey, S.T.; Goldys, E.M. Pancreatic islet viability assessment using hyperspectral imaging of autofluorescence. Cells 2023, 12, 2302. [Google Scholar] [CrossRef]
- Banerjee, B.; Renkoski, T.; Graves, L.R.; Rial, N.S.; Tsikitis, V.L.; Nfonsam, V.; Pugh, J.; Tiwari, P.; Gavini, H.; Utzinger, U. Tryptophan autofluorescence imaging of neoplasms of the human colon. Journal of Biomedical Optics 2012, 17, 016003–016003. [Google Scholar] [CrossRef]
- Banerjee, B.; Rial, N.S.; Renkoski, T.; Graves, L.R.; Reid, S.A.; Hu, C.; Tsikitis, V.L.; Nfonsom, V.; Pugh, J.; Utzinger, U. Enhanced visibility of colonic neoplasms using formulaic ratio imaging of native fluorescence. Lasers in surgery and medicine 2013, 45, 573–581. [Google Scholar] [CrossRef]
- Lin, L.; Yang, F.; Xie, S. Extracting autofluorescence spectral features for diagnosis of nasopharyngeal carcinoma. Laser Physics 2012, 22, 1431–1434. [Google Scholar] [CrossRef]
- Chandrasekara, C.M.; Gemikonakli, G.; Mach, J.; Sang, R.; Anwer, A.G.; Agha, A.; Goldys, E.M.; Hilmer, S.N.; Campbell, J.M. Ageing and Polypharmacy in Mesenchymal Stromal Cells: Metabolic Impact Assessed by Hyperspectral Imaging of Autofluorescence. International Journal of Molecular Sciences 2024, 25, 5830. [Google Scholar] [CrossRef] [PubMed]
- Campbell, J.M.; Habibalahi, A.; Mahbub, S.; Gosnell, M.; Anwer, A.G.; Paton, S.; Gronthos, S.; Goldys, E. Non-destructive, label free identification of cell cycle phase in cancer cells by multispectral microscopy of autofluorescence. BMC cancer 2019, 19, 1242. [Google Scholar] [CrossRef] [PubMed]
- Heaster, T.M.; Walsh, A.J.; Zhao, Y.; Hiebert, S.W.; Skala, M.C. Autofluorescence imaging identifies tumor cell-cycle status on a single-cell level. Journal of biophotonics 2018, 11, e201600276. [Google Scholar] [CrossRef] [PubMed]
- Habibalahi, A.; Moghari, M.D.; Campbell, J.M.; Anwer, A.G.; Mahbub, S.B.; Gosnell, M.; Saad, S.; Pollock, C.; Goldys, E.M. Non-invasive real-time imaging of reactive oxygen species (ROS) using auto-fluorescence multispectral imaging technique: A novel tool for redox biology. Redox biology 2020, 34, 101561. [Google Scholar] [CrossRef]
- Lagarto, J.L.; Dyer, B.T.; Talbot, C.B.; Peters, N.S.; French, P.M.; Lyon, A.R.; Dunsby, C. Characterization of NAD (P) H and FAD autofluorescence signatures in a Langendorff isolated-perfused rat heart model. Biomedical optics express 2018, 9, 4961–4978. [Google Scholar] [CrossRef]
- Herrando, A.I.; Fernandez, L.M.; Azevedo, J.; Vieira, P.; Domingos, H.; Galzerano, A.; Shcheslavskiy, V.; Heald, R.J.; Parvaiz, A.; da Silva, P.G.; et al. Detection and characterization of colorectal cancer by autofluorescence lifetime imaging on surgical specimens. Scientific Reports 2024, 14, 24575. [Google Scholar] [CrossRef]
- Kolenc, O.I.; Quinn, K.P. Evaluating cell metabolism through autofluorescence imaging of NAD (P) H and FAD. Antioxidants & redox signaling 2019, 30, 875–889. [Google Scholar]
- Larsen, A.K.; Simón-Santamaría, J.; Elvevold, K.; Ericzon, B.G.; Mortensen, K.E.; McCourt, P.; Smedsrød, B.; Sørensen, K.K. Autofluorescence in freshly isolated adult human liver sinusoidal cells. European Journal of Histochemistry: EJH 2021, 65, 3337. [Google Scholar] [CrossRef]
- Sparrow, J.R.; Duncker, T. Fundus autofluorescence and RPE lipofuscin in age-related macular degeneration. Journal of clinical medicine 2014, 3, 1302–1321. [Google Scholar] [CrossRef]
- Malak, M.; James, J.; Grantham, J.; Ericson, M.B. Contribution of autofluorescence from intracellular proteins in multiphoton fluorescence lifetime imaging. Scientific Reports 2022, 12, 16584. [Google Scholar] [CrossRef]
- Wan, W.; Zou, J.; Xie, T.; Zeng, L.; Liu, H.; Jiang, B.; Liao, Y.; Wu, Y.; Wu, G.; Zhang, G.; et al. Decreased green autofluorescence in cancerous tissues is a potential biomarker for diagnosis of renal cell carcinomas. Scientific Reports 2025, 15, 26798. [Google Scholar] [CrossRef] [PubMed]
- Ghosh, B.; Chatterjee, J.; Paul, R.R.; Acuña, S.; Lahiri, P.; Pal, M.; Mitra, P.; Agarwal, K. Molecular histopathology of matrix proteins through autofluorescence super-resolution microscopy. Scientific Reports 2024, 14, 10524. [Google Scholar] [CrossRef] [PubMed]
- Nazeer, S.S.; Saraswathy, A.; Shenoy, S.J.; Jayasree, R.S. Fluorescence spectroscopy as an efficient tool for staging the degree of liver fibrosis: an in vivo comparison with MRI. Scientific Reports 2018, 8, 10967. [Google Scholar] [CrossRef] [PubMed]
- Georgakoudi, I.; Jacobson, B.C.; Muller, M.G.; Sheets, E.E.; Badizadegan, K.; Carr-Locke, D.L.; Crum, C.P.; Boone, C.W.; Dasari, R.R.; Van Dam, J.; et al. NAD (P) H and collagen as in vivo quantitative fluorescent biomarkers of epithelial precancerous changes. Cancer research 2002, 62, 682–687. [Google Scholar] [PubMed]
- Huang, Z.; Zheng, W.; Xie, S.; Chen, R.; Zeng, H.; McLean, D.I.; Lui, H. Laser-induced autofluorescence microscopy of normal and tumor human colonic tissue. International journal of oncology 2004, 24, 59–63. [Google Scholar] [CrossRef] [PubMed]
- Shao, X.; Zheng, W.; Huang, Z. In vivo diagnosis of colonic precancer and cancer using near-infrared autofluorescence spectroscopy and biochemical modeling. Journal of biomedical optics 2011, 16, 067005–067005. [Google Scholar] [CrossRef]
- Shao, X.; Zheng, W.; Huang, Z. Near-infrared autofluorescence spectroscopy for in vivo identification of hyperplastic and adenomatous polyps in the colon. Biosensors and Bioelectronics 2011, 30, 118–122. [Google Scholar] [CrossRef]
- Jayanthi, J.L.; Subhash, N.; Stephen, M.; Philip, E.K.; Beena, V.T. Comparative evaluation of the diagnostic performance of autofluorescence and diffuse reflectance in oral cancer detection: a clinical study. Journal of biophotonics 2011, 4, 696–706. [Google Scholar] [CrossRef]
- Brancaleon, L.; Durkin, A.J.; Tu, J.H.; Menaker, G.; Fallon, J.D.; Kollias, N. In vivo fluorescence spectroscopy of nonmelanoma skin cancer¶. Photochemistry and Photobiology 2001, 73, 178–183. [Google Scholar] [CrossRef]
- Wu, T.; Qu, J.Y.; Cheung, T.H.; Lo, K.W.K.; Yu, M.Y. Preliminary study of detecting neoplastic growths in vivo with real time calibrated autofluorescence imaging. Optics express 2003, 11, 291–298. [Google Scholar] [CrossRef]
- Kapadia, C.R.; Cutruzzola, F.W.; O’Brien, K.M.; Stetz, M.L.; Enriquez, R.; Deckelbaum, L.I. Laser-induced fluorescence spectroscopy of human colonic mucosa: detection of adenomatous transformation. Gastroenterology 1990, 99, 150–157. [Google Scholar] [CrossRef] [PubMed]
- Yang, Y.; Tang, G.; Bessler, M.; Alfano, R. Fluorescence spectroscopy as a photonic pathology method for detecting colon cancer. Lasers in the Life Sciences 1995, 6, 259–276. [Google Scholar]
- Cothren, R.; Richards-Kortum, R.; Sivak, M., Jr.; Fitzmaurice, M.; Rava, R.; Boyce, G.; Doxtader, M.; Blackman, R.; Ivanc, T.; Hayes, G.; et al. Gastrointestinal tissue diagnosis by laser-induced fluorescence spectroscopy at endoscopy. Gastrointestinal endoscopy 1990, 36, 105–111. [Google Scholar] [CrossRef] [PubMed]
- Eker, C.; Montan, S.; Jaramillo, E.; Koizumi, K.; Rubio, C.; Andersson-Engels, S.; Svanberg, K.; Svanberg, S.; Slezak, P. Clinical spectral characterisation of colonic mucosal lesions using autofluorescence and aminolevulinic acid sensitisation. Gut 1999, 44, 511–518. [Google Scholar] [CrossRef] [PubMed]
- Schomacker, K.T.; Frisoli, J.K.; Compton, C.C.; Flotte, T.J.; Richter, J.M.; Deutsch, T.F.; Nishioka, N.S. Ultraviolet laser-induced fluorescence of colonic polyps. Gastroenterology 1992, 102, 1155–1160. [Google Scholar] [CrossRef]
- Cothren, R.M.; Sivak, M.V., Jr.; Van Dam, J.; Petras, R.E.; Fitzmaurice, M.; Crawford, J.M.; Wu, J.; Brennan, J.F.; Rava, R.P.; Manoharan, R.; et al. Detection of dysplasia at colonoscopy using laser-induced fluorescence: a blinded study. Gastrointestinal Endoscopy 1996, 44, 168–176. [Google Scholar] [CrossRef]
- Mayinger, B.; Jordan, M.; Horbach, T.; Horner, P.; Gerlach, C.; Mueller, S.; Hohenberger, W.; Hahn, E.G. Evaluation of in vivo endoscopic autofluorescence spectroscopy in gastric cancer. Gastrointestinal endoscopy 2004, 59, 191–198. [Google Scholar] [CrossRef]
- Ishikawa-Ankerhold, H.C.; Ankerhold, R.; Drummen, G.P. Advanced fluorescence microscopy techniques—Frap, Flip, Flap, Fret and flim. Molecules 2012, 17, 4047–4132. [Google Scholar] [CrossRef]
- Coda, S.; Thompson, A.J.; Kennedy, G.T.; Roche, K.L.; Ayaru, L.; Bansi, D.S.; Stamp, G.W.; Thillainayagam, A.V.; French, P.M.; Dunsby, C. Fluorescence lifetime spectroscopy of tissue autofluorescence in normal and diseased colon measured ex vivo using a fiber-optic probe. Biomedical optics express 2014, 5, 515–538. [Google Scholar] [CrossRef]
- Randall-Demllo, S.; Al-Qadami, G.; Raposo, A.E.; Ma, C.; Priebe, I.K.; Hor, M.; Singh, R.; Fung, K.Y. Ex Vivo Intestinal Organoid Models: Current State-of-the-Art and Challenges in Disease Modelling and Therapeutic Testing for Colorectal Cancer. Cancers 2024, 16, 3664. [Google Scholar] [CrossRef]
- Bergenheim, F.; Fregni, G.; Buchanan, C.F.; Riis, L.B.; Heulot, M.; Touati, J.; Seidelin, J.B.; Rizzi, S.C.; Nielsen, O.H. A fully defined 3D matrix for ex vivo expansion of human colonic organoids from biopsy tissue. Biomaterials 2020, 262, 120248. [Google Scholar] [CrossRef]
- Di Paola, F.J.; Calafato, G.; Piccaluga, P.P.; Tallini, G.; Rhoden, K.J. Patient-Derived Organoid Biobanks for Translational Research and Precision Medicine: Challenges and Future Perspectives. Journal of Personalized Medicine 2025, 15, 394. [Google Scholar] [CrossRef] [PubMed]
- Flood, P.; Hanrahan, N.; Nally, K.; Melgar, S. Human intestinal organoids: Modeling gastrointestinal physiology and immunopathology—current applications and limitations. European Journal of Immunology 2024, 54, 2250248. [Google Scholar] [CrossRef] [PubMed]
- Grieger, K.M.; Schröder, V.; Dehmel, S.; Neuhaus, V.; Schaudien, D.; Fuchs, M.; Linge, H.; Wagner, A.; Kulik, U.; Gundert, B.; et al. Ex Vivo Modeling and Pharmacological Modulation of Tissue Immune Responses in Inflammatory Bowel Disease Using Precision-Cut Intestinal Slices. European Journal of Immunology 2025, 55, e70013. [Google Scholar] [CrossRef] [PubMed]
- Van Dyck, K.; Vanhoffelen, E.; Yserbyt, J.; Van Dijck, P.; Erreni, M.; Hernot, S.; Vande Velde, G. Probe-based intravital microscopy: filling the gap between in vivo imaging and tissue sample microscopy in basic research and clinical applications. Journal of Physics: Photonics 2021, 3, 032003. [Google Scholar] [CrossRef]
- Minsky, M. Memoir on inventing the confocal scanning microscope. Scanning 1988, 10, 128–138. [Google Scholar] [CrossRef]
- Piston, D.W. When Two Is Better Than One: Elements of Intravital Microscopy. PLoS Biol. 2005, 3, e207. [Google Scholar] [CrossRef]
- Osdoit, A.; Genet, M.; Perchant, A.; Loiseau, S.; Abrat, B.; Lacombe, F. In vivo fibered confocal reflectance imaging: totally non-invasive morphological cellular imaging brought to the endoscopist. Proceedings of the Endoscopic Microscopy. SPIE 2006, Vol. 6082, 29–38. [Google Scholar]
- Pilonis, N.D.; Januszewicz, W.; di Pietro, M. Confocal laser endomicroscopy in gastro-intestinal endoscopy: technical aspects and clinical applications. Translational Gastroenterology and Hepatology 2022, 7, 7. [Google Scholar] [CrossRef]
- De Palma, G.D. Confocal laser endomicroscopy in the “in vivo” histological diagnosis of the gastrointestinal tract. World journal of gastroenterology: WJG 2009, 15, 5770. [Google Scholar] [CrossRef]
- Koda, H.; Hara, K.; Nozomi, O.; Kuwahara, T.; Nobumasa, M.; Haba, S.; Akira, M.; Hajime, I. High-resolution probe-based confocal laser endomicroscopy for diagnosing biliary diseases. Clinical Endoscopy 2021, 54, 924–929. [Google Scholar] [CrossRef] [PubMed]
- Yamada, M.; Lin, L.L.; Prow, T.W. Multiphoton Microscopy Applications in Biology. In Fluoresc. Microsc.; Elsevier, 2014; pp. 185–197. [CrossRef]
- Entenberg, D.; Oktay, M.H.; Condeelis, J.S. Intravital imaging to study cancer progression and metastasis. Nature Reviews Cancer 2023, 23, 25–42. [Google Scholar] [CrossRef] [PubMed]
- Gooz, M.; Maldonado, E.N. Fluorescence microscopy imaging of mitochondrial metabolism in cancer cells. Frontiers in oncology 2023, 13, 1152553. [Google Scholar] [CrossRef] [PubMed]
- Bower, A.J.; Renteria, C.; Li, J.; Marjanovic, M.; Barkalifa, R.; Boppart, S.A. High-speed label-free two-photon fluorescence microscopy of metabolic transients during neuronal activity. Applied Physics Letters 2021, 118. [Google Scholar] [CrossRef] [PubMed]
- Two-photon excitation microscopy. https://en.wikipedia.org/wiki/Two-photon_excitation_microscopy. Accessed: 2025-11-27.
- Liang, W.; Hall, G.; Messerschmidt, B.; Li, M.J.; Li, X. Nonlinear optical endomicroscopy for label-free functional histology in vivo. Light: Science & Applications 2017, 6, e17082–e17082. [Google Scholar] [CrossRef]
- Légaré, F.; Evans, C.L.; Ganikhanov, F.; Xie, X.S. Towards CARS endoscopy. Optics Express 2006, 14, 4427–4432. [Google Scholar] [CrossRef]
- Borhani, N.; Kakkava, E.; Moser, C.; Psaltis, D. Learning to see through multimode fibers. Optica 2018, 5, 960–966. [Google Scholar] [CrossRef]
- Caramazza, P.; Moran, O.; Murray-Smith, R.; Faccio, D. Transmission of natural scene images through a multimode fibre. Nature communications 2019, 10, 2029. [Google Scholar] [CrossRef]
- Marusarz, R.K.; Sayeh, M.R. Neural network-based multimode fiber-optic information transmission. Applied optics 2001, 40, 219–227. [Google Scholar] [CrossRef]
- Vellekoop, I.M.; Mosk, A.P. Focusing coherent light through opaque strongly scattering media. Optics letters 2007, 32, 2309–2311. [Google Scholar] [CrossRef]
- Aisawa, S.; Noguchi, K.; Matsumoto, T. Remote image classification through multimode optical fiber using a neural network. Optics letters 1991, 16, 645–647. [Google Scholar] [CrossRef] [PubMed]
- Popoff, S.M.; Lerosey, G.; Carminati, R.; Fink, M.; Boccara, A.C.; Gigan, S. Measuring the Transmission Matrix in Optics: An Approach to the Study and. Physical review letters 2010, 104, 100601. [Google Scholar] [CrossRef] [PubMed]
- Krupa, K.; Tonello, A.; Shalaby, B.M.; Fabert, M.; Barthélémy, A.; Millot, G.; Wabnitz, S.; Couderc, V. Spatial beam self-cleaning in multimode fibres. Nature photonics 2017, 11, 237–241. [Google Scholar] [CrossRef]
- Moussa, N.O.; Mansuryan, T.; Hage, C.H.; Fabert, M.; Krupa, K.; Tonello, A.; Ferraro, M.; Leggio, L.; Zitelli, M.; Mangini, F.; et al. Spatiotemporal beam self-cleaning for high-resolution nonlinear fluorescence imaging with multimode fiber. Scientific Reports 2021, 11, 18240. [Google Scholar] [CrossRef] [PubMed]
- Lombardini, A.; Mytskaniuk, V.; Sivankutty, S.; Andresen, E.R.; Chen, X.; Wenger, J.; Fabert, M.; Joly, N.; Louradour, F.; Kudlinski, A.; et al. High-resolution multimodal flexible coherent Raman endoscope. Light: Science & Applications 2018, 7, 10. [Google Scholar] [CrossRef] [PubMed]
- Wang, C.; Liu, H.; Ma, J.; Cui, H.; Li, Y.; Wu, D.; Hu, Y.; Wu, D.; Fu, Q.; Liang, L.; et al. Spiral scanning fiber-optic two-photon endomicroscopy with a double-cladding antiresonant fiber. Optics Express 2021, 29, 43124–43135. [Google Scholar] [CrossRef]
- Septier, D.; Mytskaniuk, V.; Habert, R.; Labat, D.; Baudelle, K.; Cassez, A.; Brévalle-Wasilewski, G.; Conforti, M.; Bouwmans, G.; Rigneault, H.; et al. Label-free highly multimodal nonlinear endoscope. Optics Express 2022, 30, 25020–25033. [Google Scholar] [CrossRef]
- Zipfel, W.R.; Williams, R.M.; Webb, W.W. Nonlinear magic: multiphoton microscopy in the biosciences. Nature biotechnology 2003, 21, 1369–1377. [Google Scholar] [CrossRef]
- Yamada, M.; Lin, L.L.; Prow, T.W. Multiphoton microscopy applications in biology. In Fluorescence microscopy; Elsevier, 2014; pp. 185–197.
- Cristiani, I.; Lacava, C.; Rademacher, G.; Puttnam, B.J.; Luìs, R.S.; Antonelli, C.; Mecozzi, A.; Shtaif, M.; Cozzolino, D.; Bacco, D.; et al. Roadmap on multimode photonics. J. Opt. 2022, 24, 083001. [Google Scholar] [CrossRef]
- Mansuryan, T.; Tabcheh, N.; Fabert, M.; Krupa, K.; Jauberteau, R.; Tonello, A.; Lefort, C.; Ferraro, M.; Mangini, F.; Zitelli, M.; et al. Large band multiphoton microendoscope with single-core standard graded-index multimode fiber based on spatial beam self-cleaning. Proceedings of the Endoscopic Microscopy XVIII. SPIE 2023, Vol. 12356, 67–71. [Google Scholar]
- Tsai, T.H.; Jee, S.H.; Dong, C.Y.; Lin, S.J. Multiphoton microscopy in dermatological imaging. Journal of dermatological science 2009, 56, 1–8. [Google Scholar] [CrossRef] [PubMed]
- Krupa, K.; Louot, C.; Couderc, V.; Fabert, M.; Guénard, R.; Shalaby, B.; Tonello, A.; Pagnoux, D.; Leproux, P.; Bendahmane, A.; et al. Spatiotemporal characterization of supercontinuum extending from the visible to the mid-infrared in a multimode graded-index optical fiber. Optics Letters 2016, 41, 5785–5788. [Google Scholar] [CrossRef] [PubMed]
- Eslami, Z.; Salmela, L.; Filipkowski, A.; Pysz, D.; Klimczak, M.; Buczynski, R.; Dudley, J.M.; Genty, G. Two octave supercontinuum generation in a non-silica graded-index multimode fiber. Nature Communications 2022, 13, 2126. [Google Scholar] [CrossRef] [PubMed]
- Conforti, M.; Mas Arabi, C.; Mussot, A.; Kudlinski, A. Fast and accurate modeling of nonlinear pulse propagation in graded-index multimode fibers. Optics Letters 2017, 42, 4004–4007. [Google Scholar] [CrossRef]
- Ahsan, A.S.; Agrawal, G.P. Graded-index solitons in multimode fibers. Optics letters 2018, 43, 3345–3348. [Google Scholar] [CrossRef]
- Teğin, U.; Ortaç, B. Cascaded Raman scattering based high power octave-spanning supercontinuum generation in graded-index multimode fibers. Scientific reports 2018, 8, 12470. [Google Scholar] [CrossRef]
- Poletti, F.; Horak, P. Description of ultrashort pulse propagation in multimode optical fibers. Journal of the Optical Society of America B 2008, 25, 1645–1654. [Google Scholar] [CrossRef]
- Poletti, F.; Horak, P. Dynamics of femtosecond supercontinuum generation in multimode fibers. Optics Express 2009, 17, 6134–6147. [Google Scholar] [CrossRef]
- Wright, L.G.; Wabnitz, S.; Christodoulides, D.N.; Wise, F.W. Ultrabroadband dispersive radiation by spatiotemporal oscillation of multimode waves. Physical review letters 2015, 115, 223902. [Google Scholar] [CrossRef]
- Khakimov, R.; Shavrin, I.; Novotny, S.; Kaivola, M.; Ludvigsen, H. Numerical solver for supercontinuum generation in multimode optical fibers. Optics express 2013, 21, 14388–14398. [Google Scholar] [CrossRef]
- Wright, L.G.; Ziegler, Z.M.; Lushnikov, P.M.; Zhu, Z.; Eftekhar, M.A.; Christodoulides, D.N.; Wise, F.W. Multimode nonlinear fiber optics: massively parallel numerical solver, tutorial, and outlook. IEEE Journal of Selected Topics in Quantum Electronics 2017, 24, 1–16. [Google Scholar] [CrossRef]
- Brehler, M.; Schirwon, M.; Krummrich, P.M.; Göddeke, D. Simulation of nonlinear signal propagation in multimode fibers on multi-GPU systems. Communications in Nonlinear Science and Numerical Simulation 2020, 84, 105150. [Google Scholar] [CrossRef]
- Scheibinger, R.; Lüpken, N.M.; Chemnitz, M.; Schaarschmidt, K.; Kobelke, J.; Fallnich, C.; Schmidt, M.A. Higher-order mode supercontinuum generation in dispersion-engineered liquid-core fibers. Scientific reports 2021, 11, 5270. [Google Scholar] [CrossRef] [PubMed]
- Krutova, E.; Salmela, L.; Eslami, Z.; Karpate, T.; Klimczak, M.; Buczynski, R.; Genty, G. Supercontinuum generation in a graded-index multimode tellurite fiber. Optics Letters 2024, 49, 2865–2868. [Google Scholar] [CrossRef] [PubMed]
- Podivilov, E.V.; Kharenko, D.S.; Gonta, V.; Krupa, K.; Sidelnikov, O.S.; Turitsyn, S.; Fedoruk, M.P.; Babin, S.A.; Wabnitz, S. Hydrodynamic 2D turbulence and spatial beam condensation in multimode optical fibers. Physical review letters 2019, 122, 103902. [Google Scholar] [CrossRef] [PubMed]
- Sidelnikov, O.S.; Podivilov, E.V.; Fedoruk, M.P.; Wabnitz, S. Random mode coupling assists Kerr beam self-cleaning in a graded-index multimode optical fiber. Optical Fiber Technology 2019, 53, 101994. [Google Scholar] [CrossRef]
- Babin, S.A.; Kuznetsov, A.G.; Sidelnikov, O.S.; Wolf, A.A.; Nemov, I.N.; Kablukov, S.I.; Podivilov, E.V.; Fedoruk, M.P.; Wabnitz, S. Spatio-spectral beam control in multimode diode-pumped Raman fibre lasers via intracavity filtering and Kerr cleaning. Scientific reports 2021, 11, 21994. [Google Scholar] [CrossRef]
- Wang, C.; Zhang, X.; Cui, H.; Ma, J.; Wu, R.; Liu, H.; Wang, A.; Feng, L. Research Advances in Piezoelectric Ceramic Scanning Two-Photon Endomicroscopy Technology. Chinese Journal of Lasers 2022, 49, 1907003. [Google Scholar]
- Rivera, D.R.; Brown, C.M.; Ouzounov, D.G.; Pavlova, I.; Kobat, D.; Webb, W.W.; Xu, C. Compact and flexible raster scanning multiphoton endoscope capable of imaging unstained tissue. Proceedings of the National Academy of Sciences 2011, 108, 17598–17603. [Google Scholar] [CrossRef]
- Ducourthial, G.; Leclerc, P.; Mansuryan, T.; Fabert, M.; Brevier, J.; Habert, R.; Braud, F.; Batrin, R.; Vever-Bizet, C.; Bourg-Heckly, G.; et al. Development of a real-time flexible multiphoton microendoscope for label-free imaging in a live animal. Scientific reports 2015, 5, 18303. [Google Scholar] [CrossRef]
- Vyas, K.; Hughes, M.; Rosa, B.G.; Yang, G.Z. Fiber bundle shifting endomicroscopy for high-resolution imaging. Biomedical optics express 2018, 9, 4649–4664. [Google Scholar] [CrossRef] [PubMed]
- Kim, D.Y.; Hwang, K.; Ahn, J.; Seo, Y.H.; Kim, J.B.; Lee, S.; Yoon, J.H.; Kong, E.; Jeong, Y.; Jon, S.; et al. Lissajous scanning two-photon endomicroscope for in vivo tissue imaging. Scientific reports 2019, 9, 3560. [Google Scholar] [CrossRef] [PubMed]
- Myaing, M.T.; MacDonald, D.J.; Li, X. Fiber-optic scanning two-photon fluorescence endoscope. Optics letters 2006, 31, 1076–1078. [Google Scholar] [CrossRef]
- Wang, Y.; Li, Z.; Liang, X.; Fu, L. Four-plate piezoelectric actuator driving a large-diameter special optical fiber for nonlinear optical microendoscopy. Optics Express 2016, 24, 19949–19960. [Google Scholar] [CrossRef]
- Kistenev, Y.V.; Nikolaev, V.V.; Kurochkina, O.S.; Borisov, A.V.; Vrazhnov, D.A.; Sandykova, E.A. Application of multiphoton imaging and machine learning to lymphedema tissue analysis. Biomedical optics express 2019, 10, 3353–3368. [Google Scholar] [CrossRef]
- Kistenev, Y.V.; Vrazhnov, D.; Nikolaev, V.; Sandykova, E.; Krivova, N. Analysis of collagen spatial structure using multiphoton microscopy and machine learning methods. Biochemistry (Moscow) 2019, 84, 108–123. [Google Scholar] [CrossRef]
Figure 1.
Scheme of the main physical processes at light-tissue interaction under optical based medical diagnostics and treatment (a). Optical properties (absorption and reduced scattering coefficient) of key specific molecules such as oxygenated (HbO2) and deoxygenated (Hb) hemoglobin, lipids, bilirubin and water (b) (from Clancy et al., used under CC-BY 4.0 license [49]).
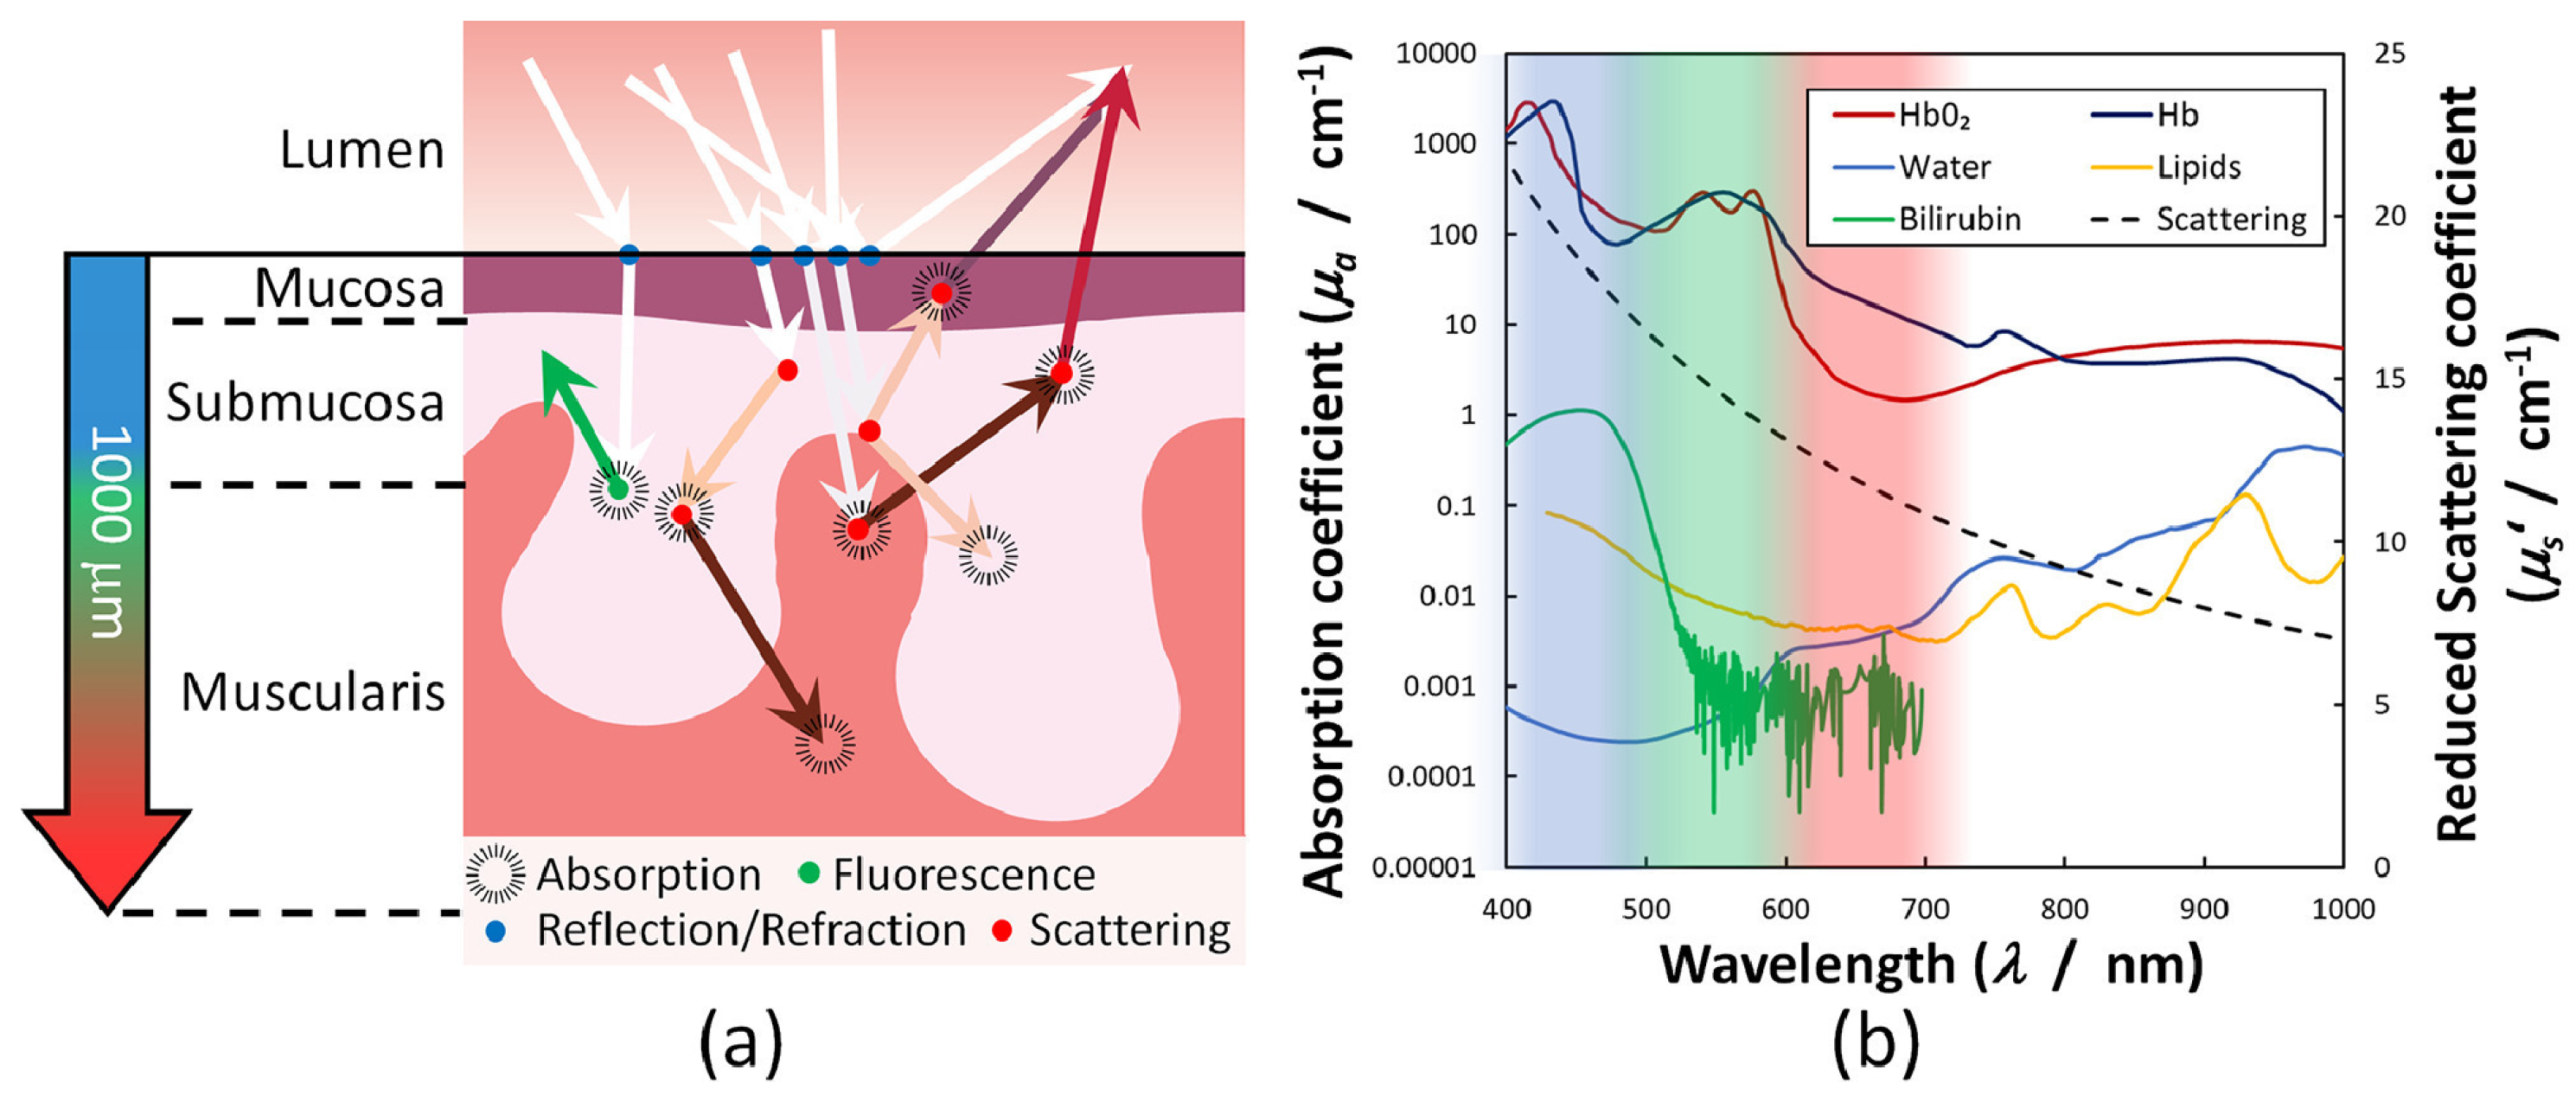
Figure 2.
(a) Collimated transmittance measurement setup (from Carneiro et al., used under CC-BY 4.0 license [53]). (b) Total transmittance setup based on an integrating sphere( from Shahin et al., used under CC-BY 4.0 license [58]). (c) Hyperspectral measurement setup and the principles of tissue’s optical properties characterization (from Yoon et al., used under CC-BY 4.0 license [57]). (d) Scheme of Diffuse Reflectance Spectroscopy and the principles of tissue’s optical properties characterization based on this technique (from Nogueira et al., used under CC-BY 4.0 license [51]).
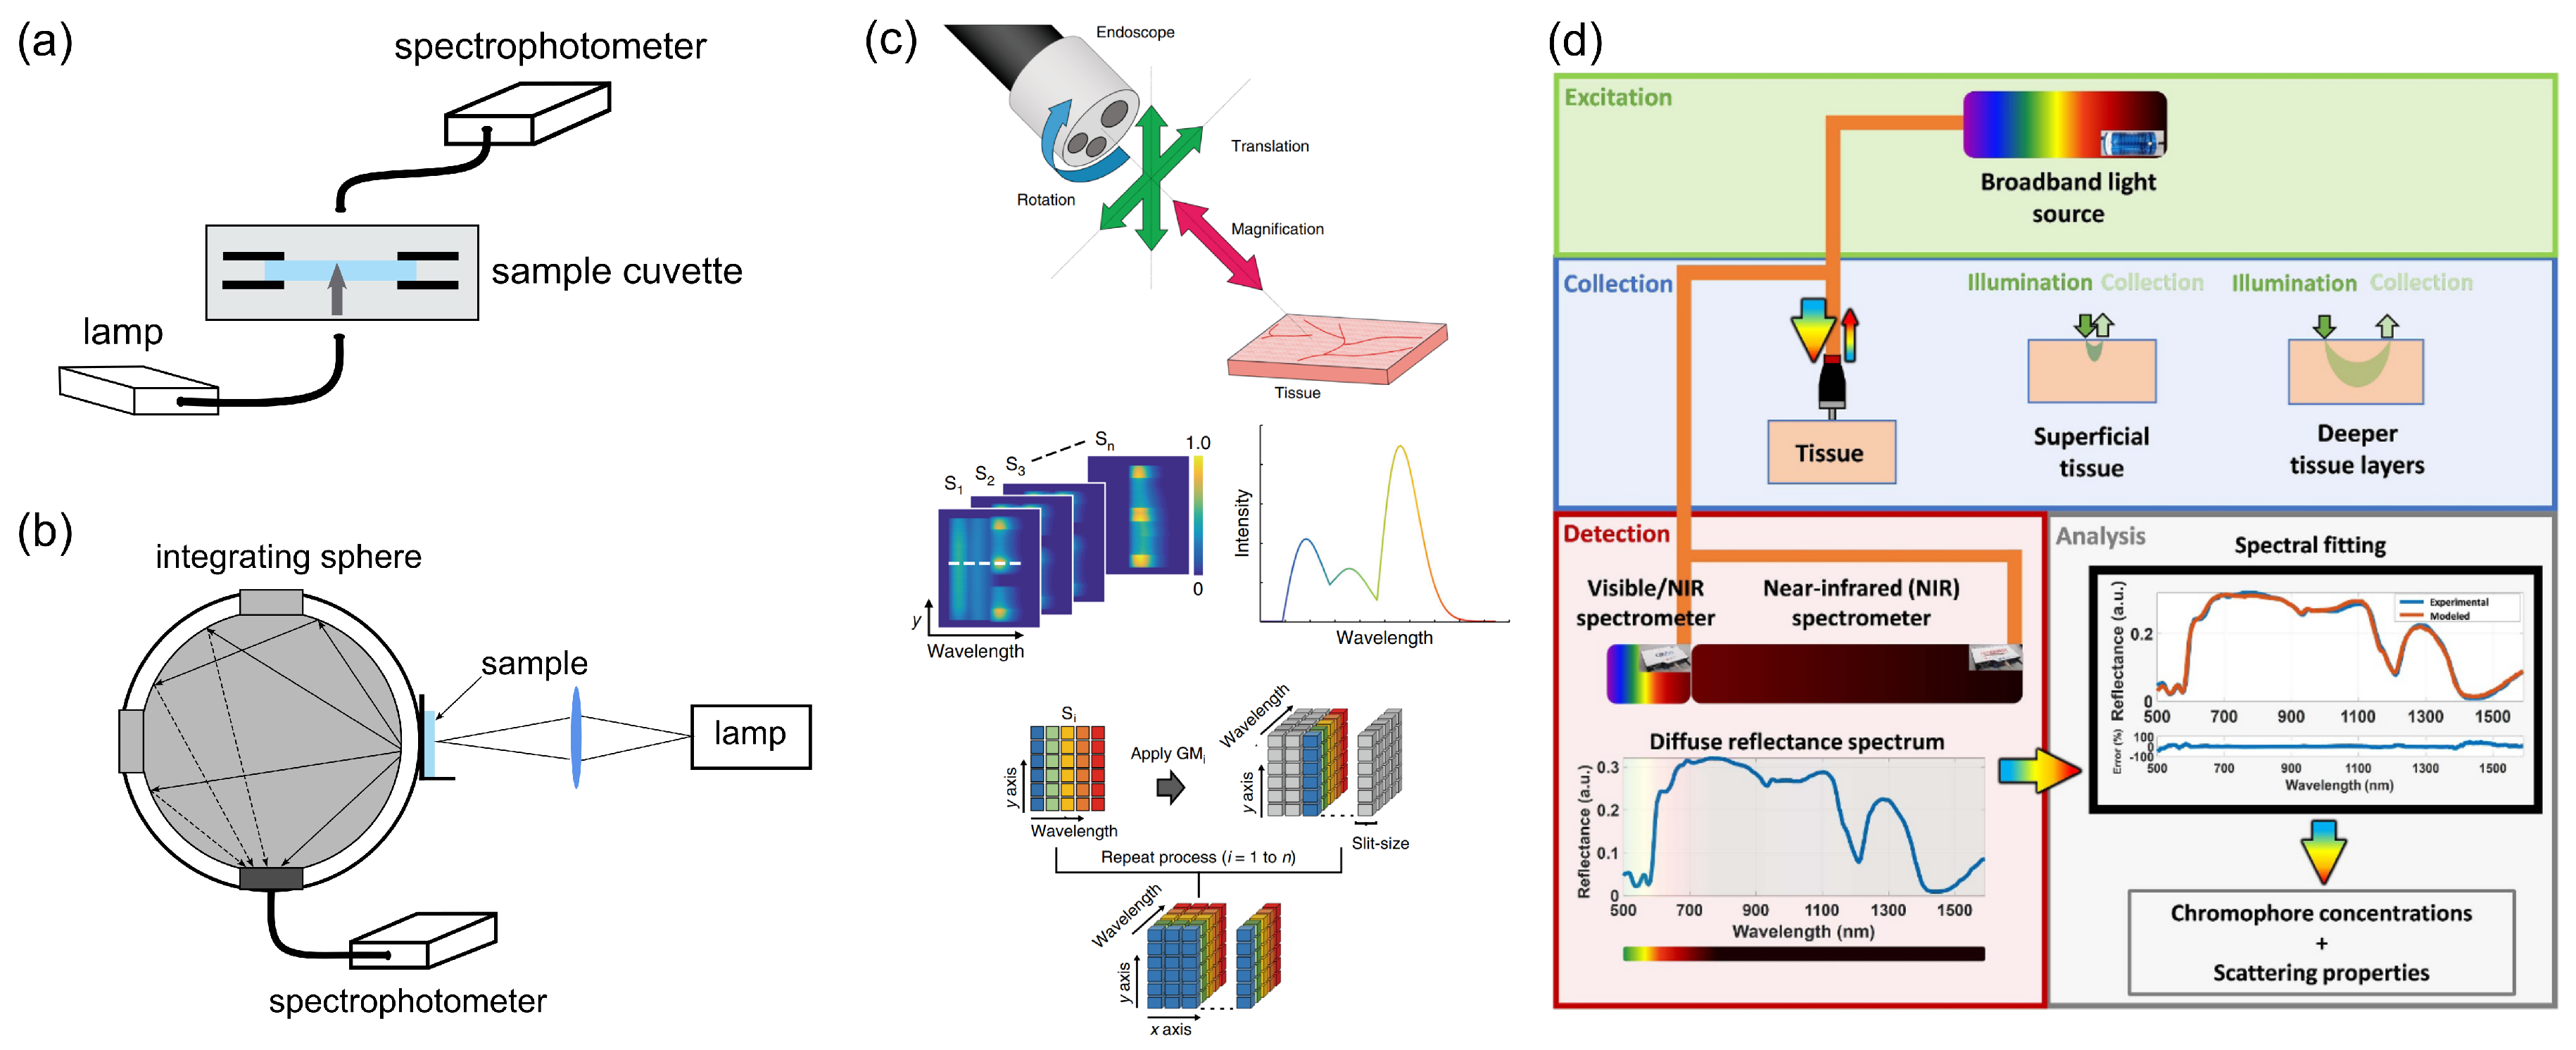
Figure 3.
Effect of Scattering in Confocal Microscopy (left) and Two-Photon Excitation Microscopy (right) (from D. W. Piston, used under CC-BY license [107]).
Figure 3.
Effect of Scattering in Confocal Microscopy (left) and Two-Photon Excitation Microscopy (right) (from D. W. Piston, used under CC-BY license [107]).
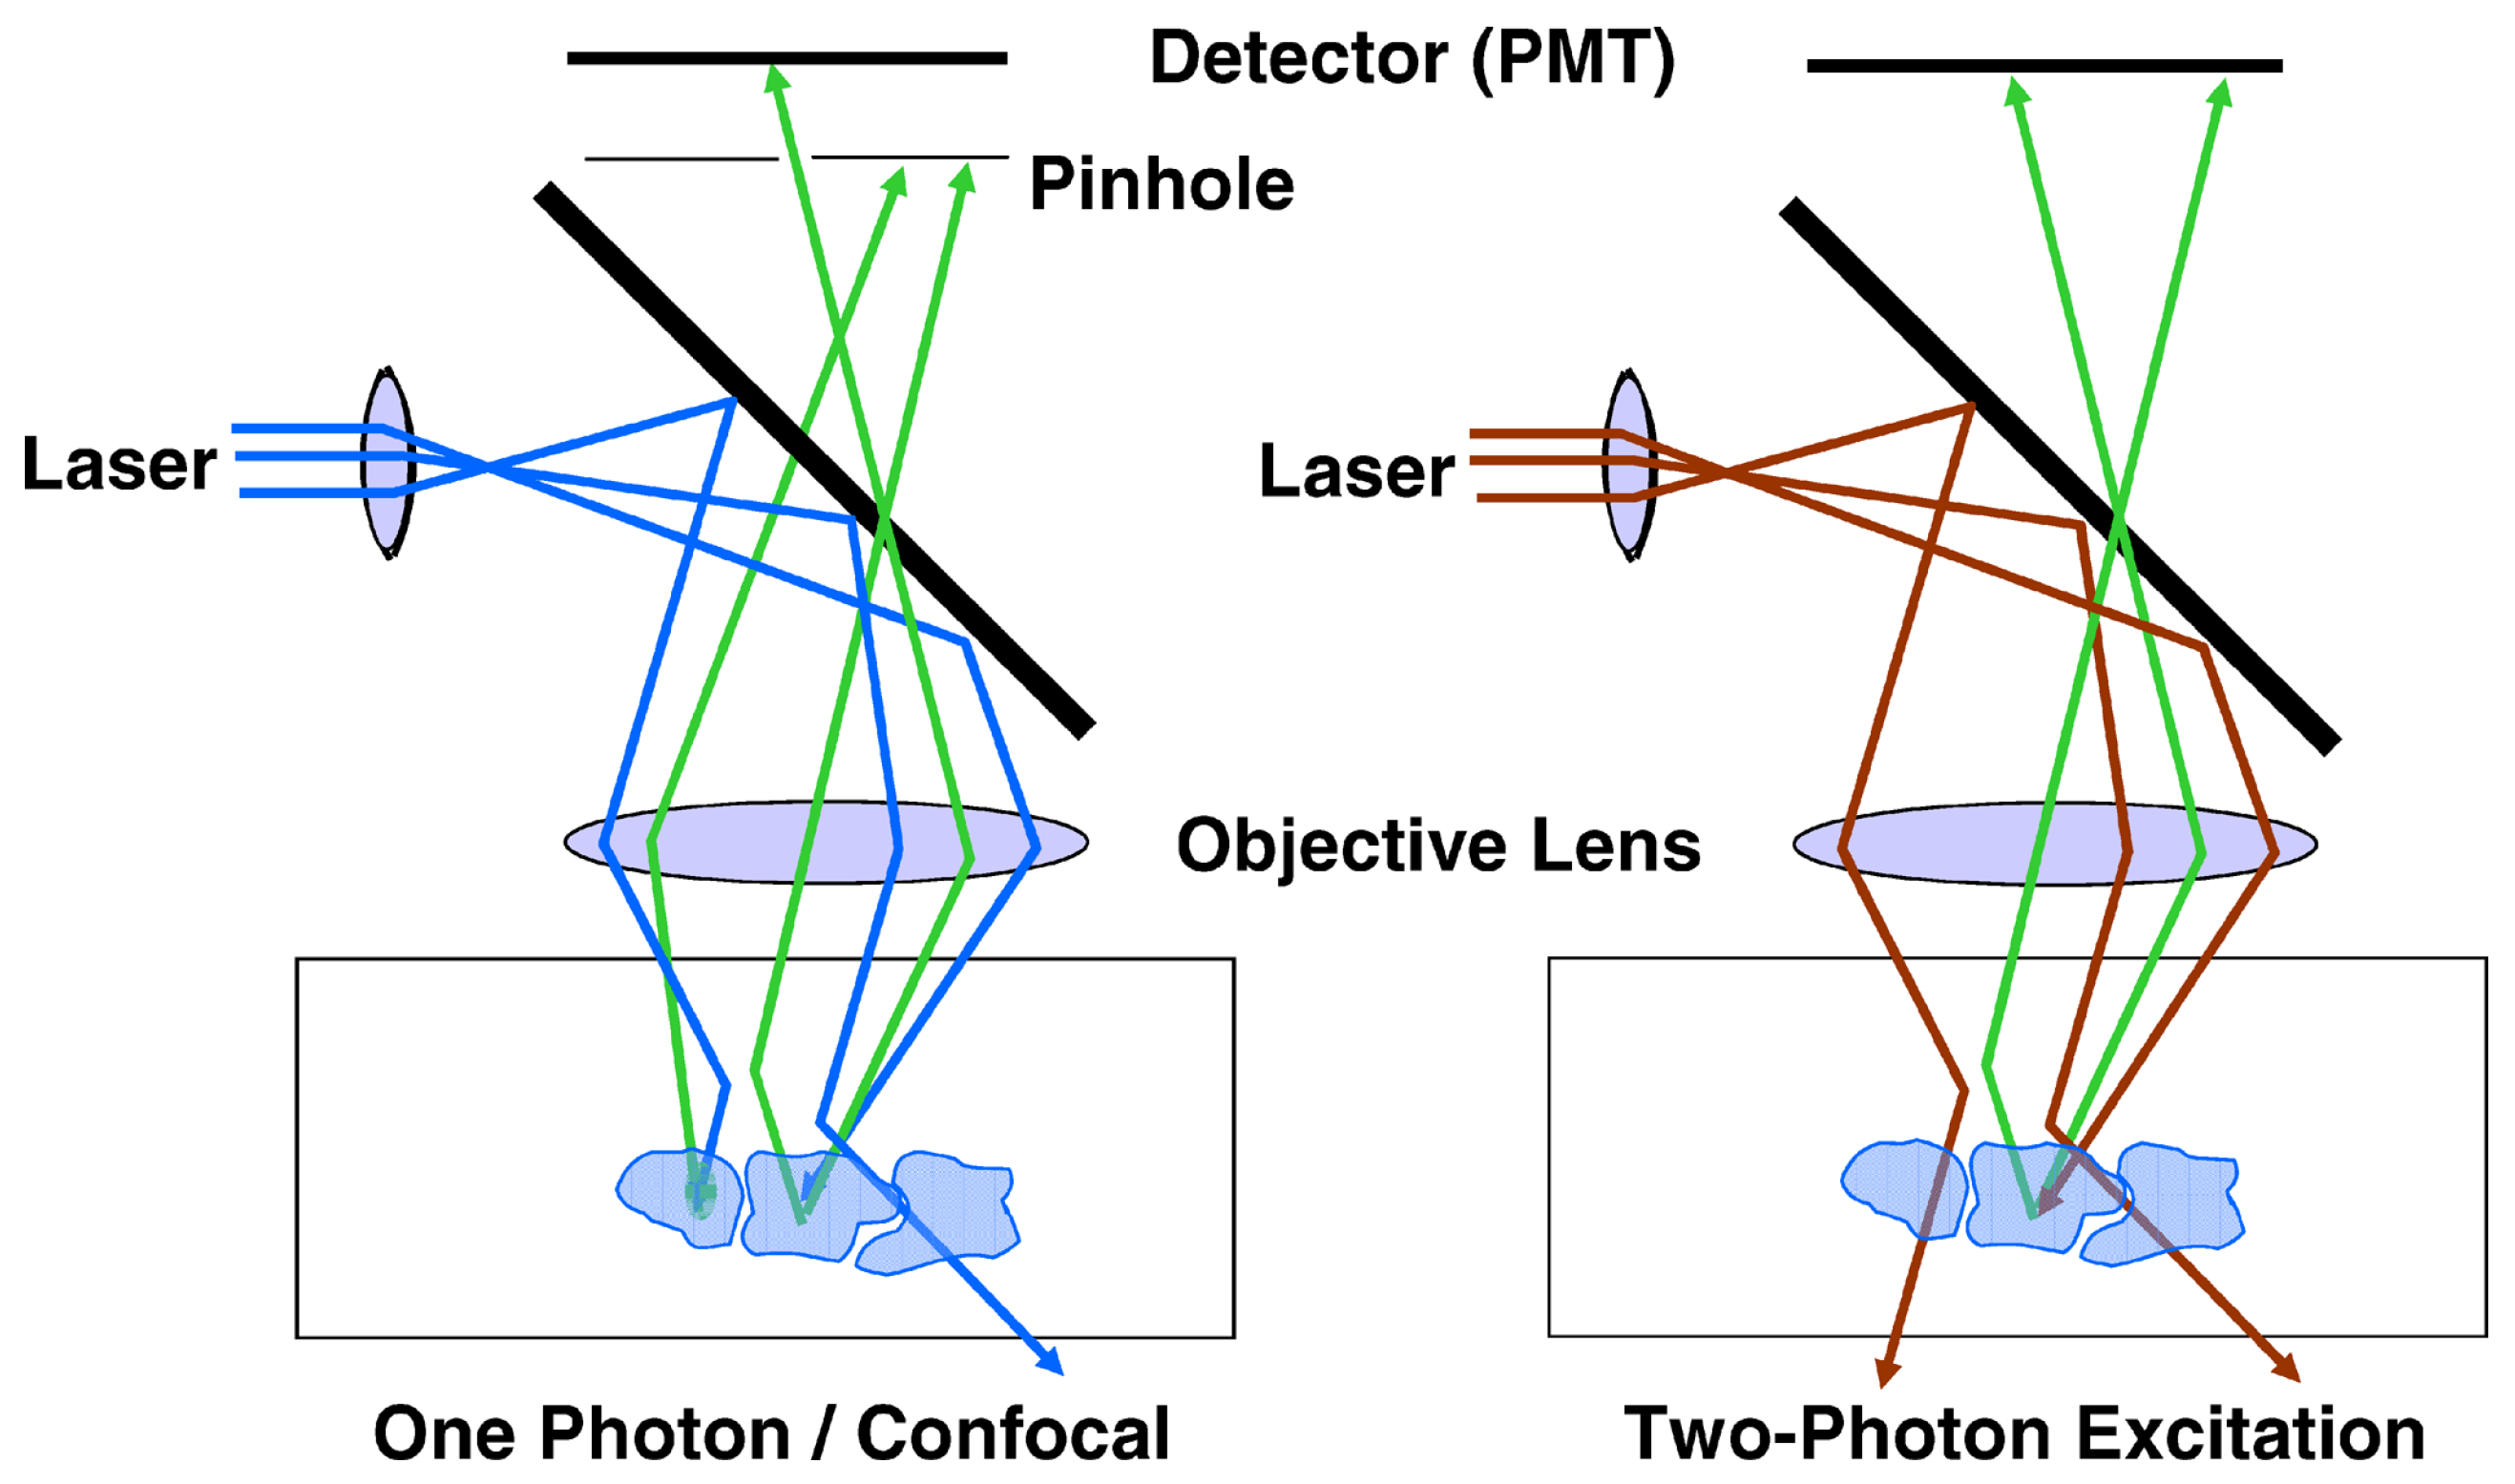
Figure 4.
Schematic representation of the energy levels of the fluorescence process, example of a fluorescent dye that emits light at 460 nm. One (purple), two (orange) or three (red) photons are absorbed to emit a photon of fluorescence (turquoise) (reworked from Wikipedia, redrawed under CC-BY license [116]). b) An example of different processes excited by one ultrashort pulse at 1064 nm: third (purple) and second (green) harmonic generation (THG and SHG respectively), three (3PF, turquoise) and two (2PF, orange) photon fluorescence.
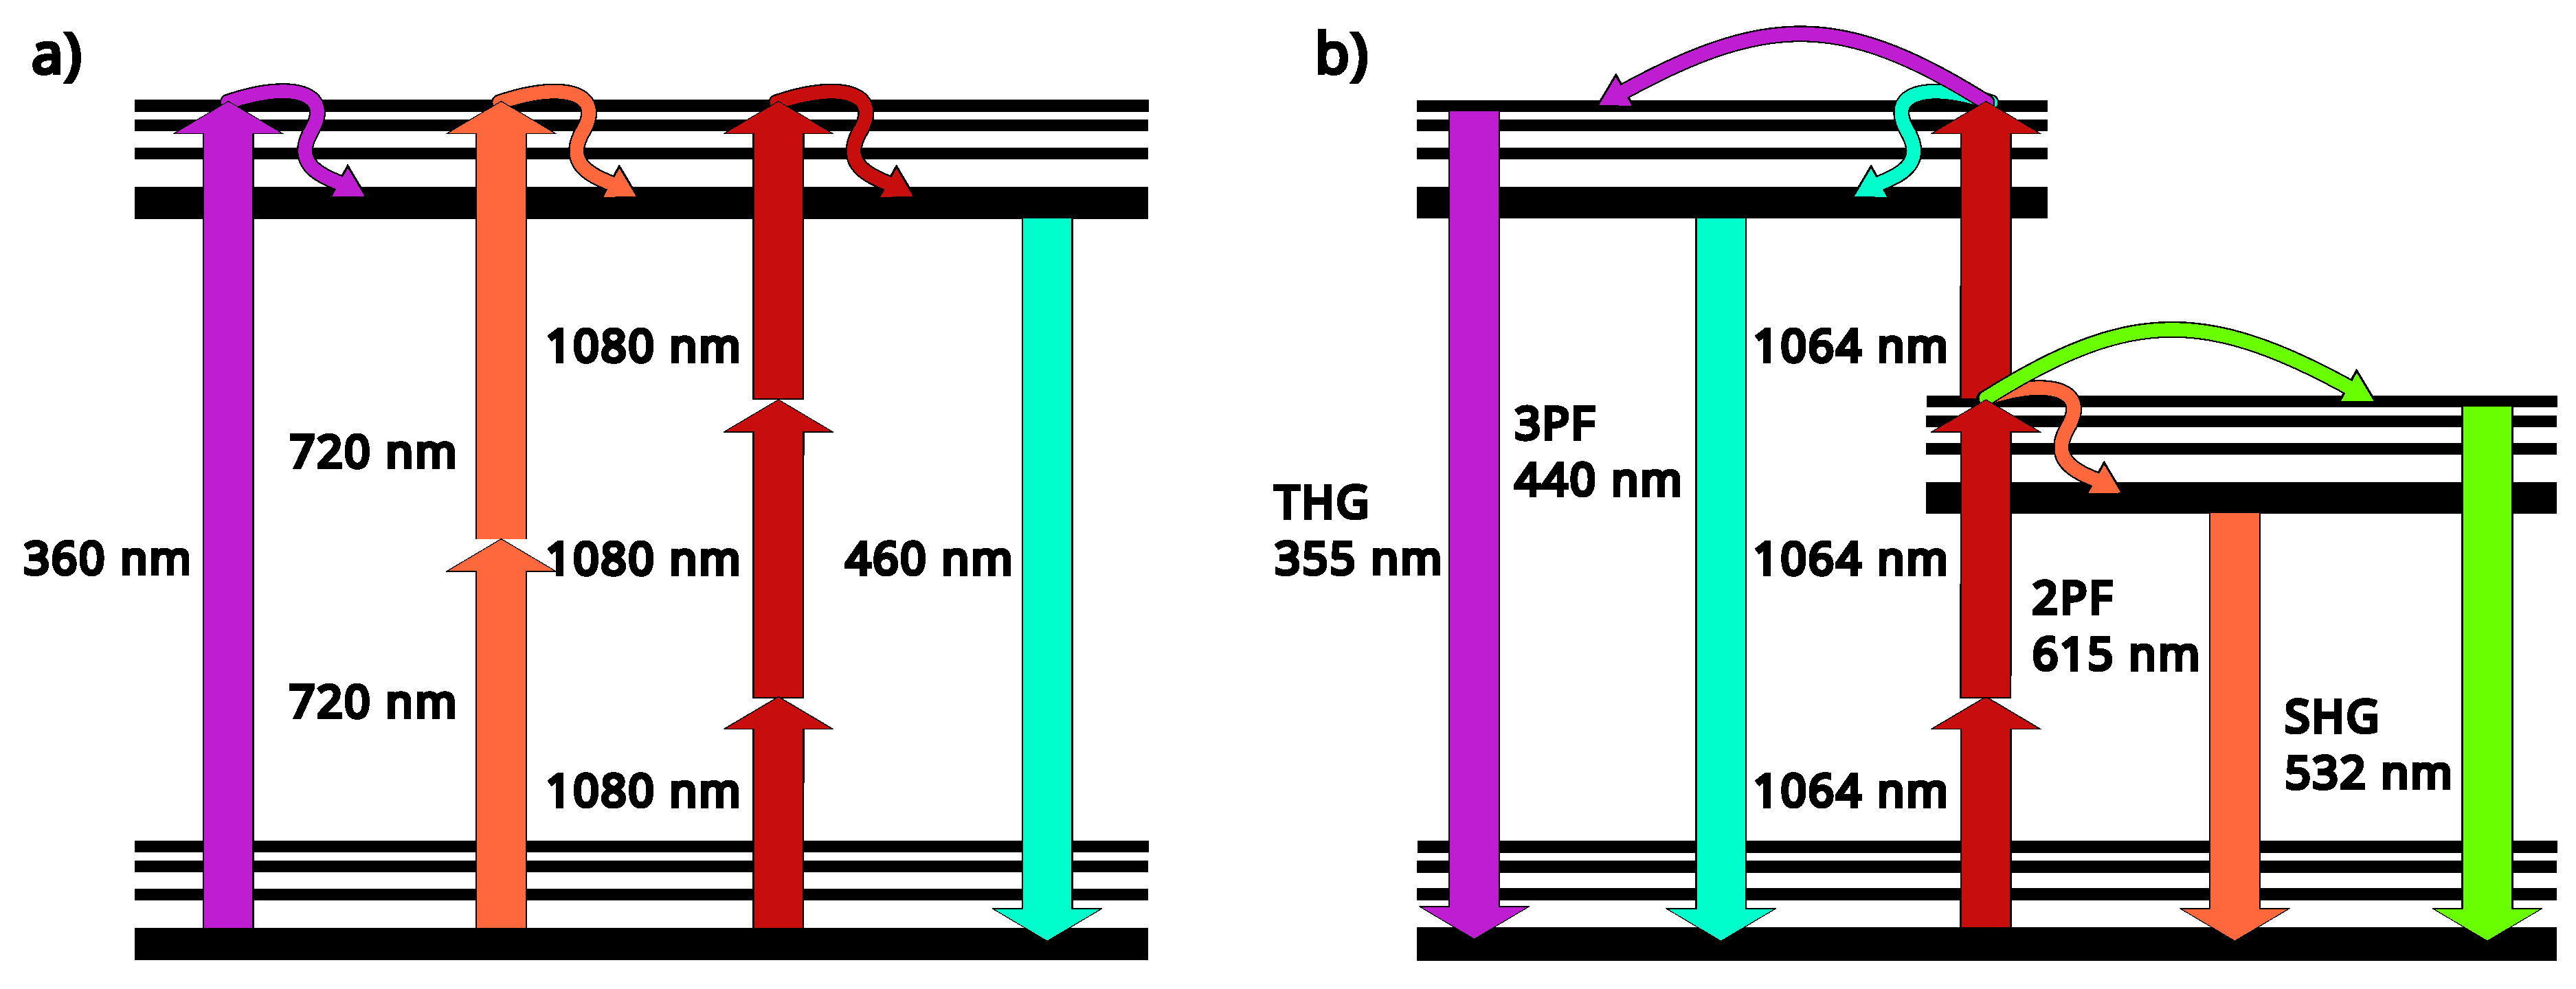
Figure 5.
Diversity of nonlinear effects in multimode fibers (adopted from Cristiani et al. and Moussa et al. under CC-BY 4.0 license [126,132]).
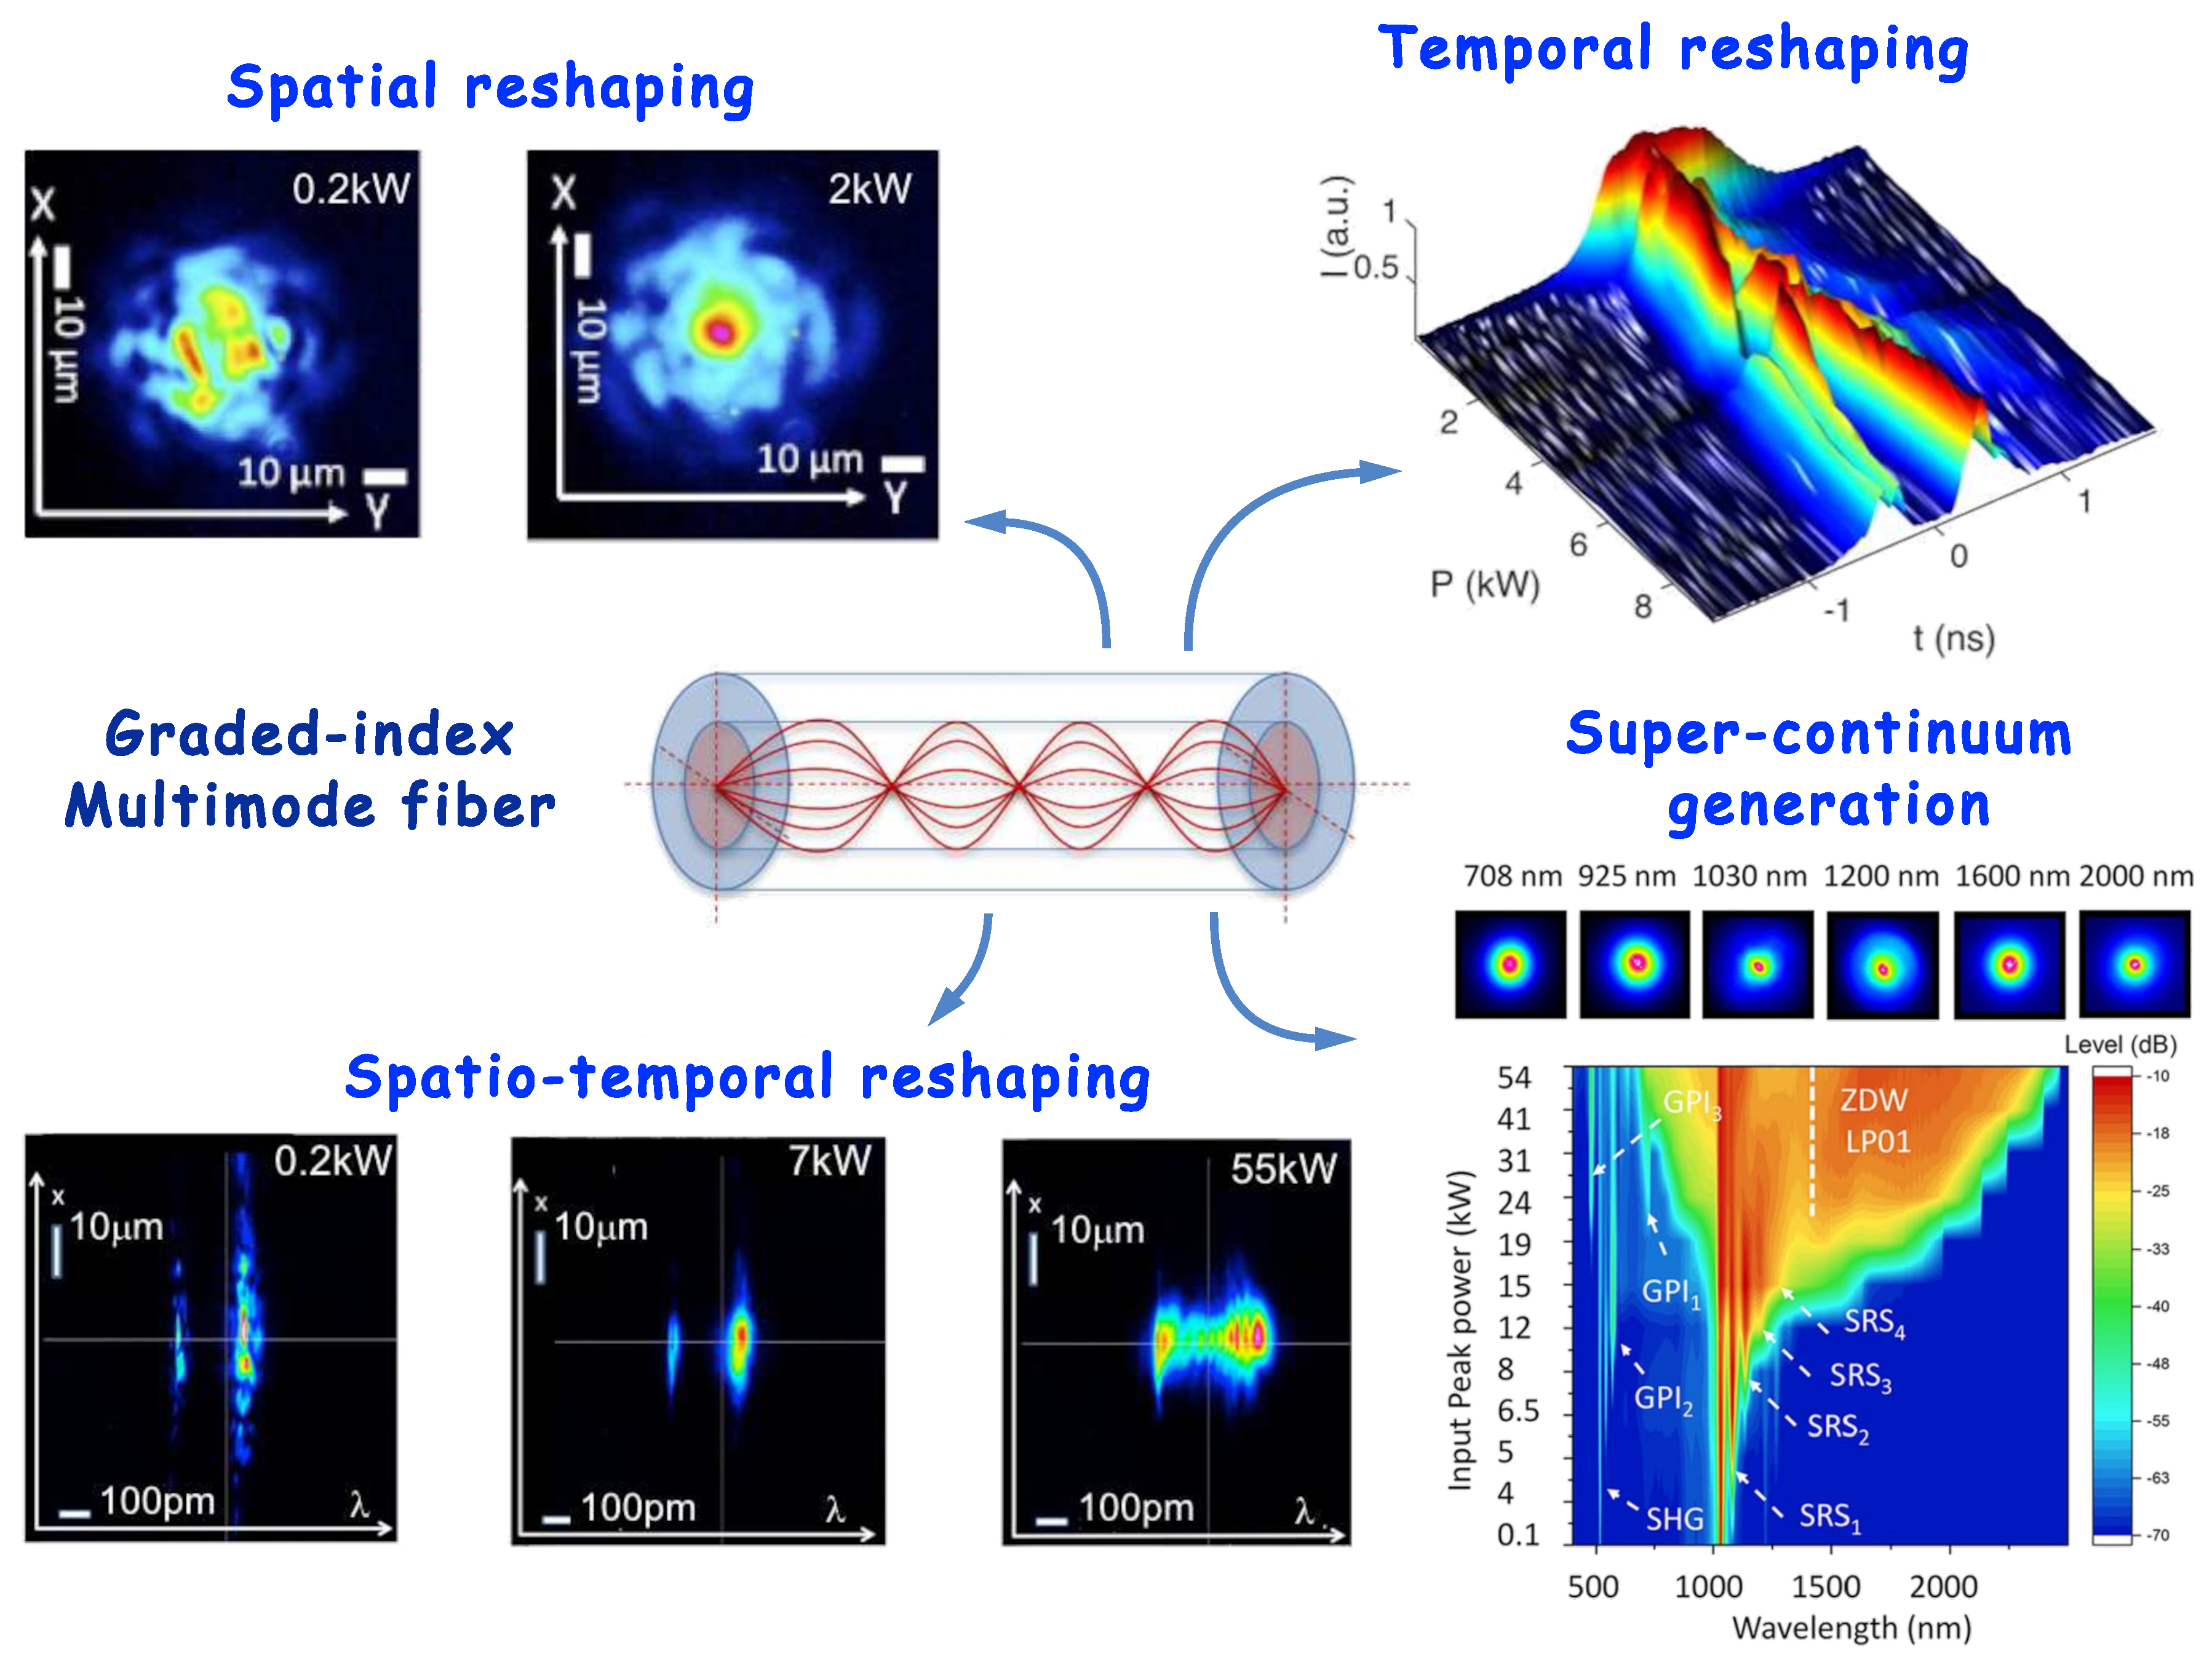
Figure 6.
Left panel — diagram of beam delivery to the image via multimode fiber; center panel — demonstration of stable imaging as a result of Kerr self-cleaning compared to a speckle beam at the exit of a gradient waveguide; Right panel — images of the kidney stained with Alexa 488, Alexa 568 and DAPI to highlight tubules, actin and nucleus respectively, and visualized with a multi-mode self-cleaned beam (adopted from Moussa et al. under CC-BY 4.0 license [126]).
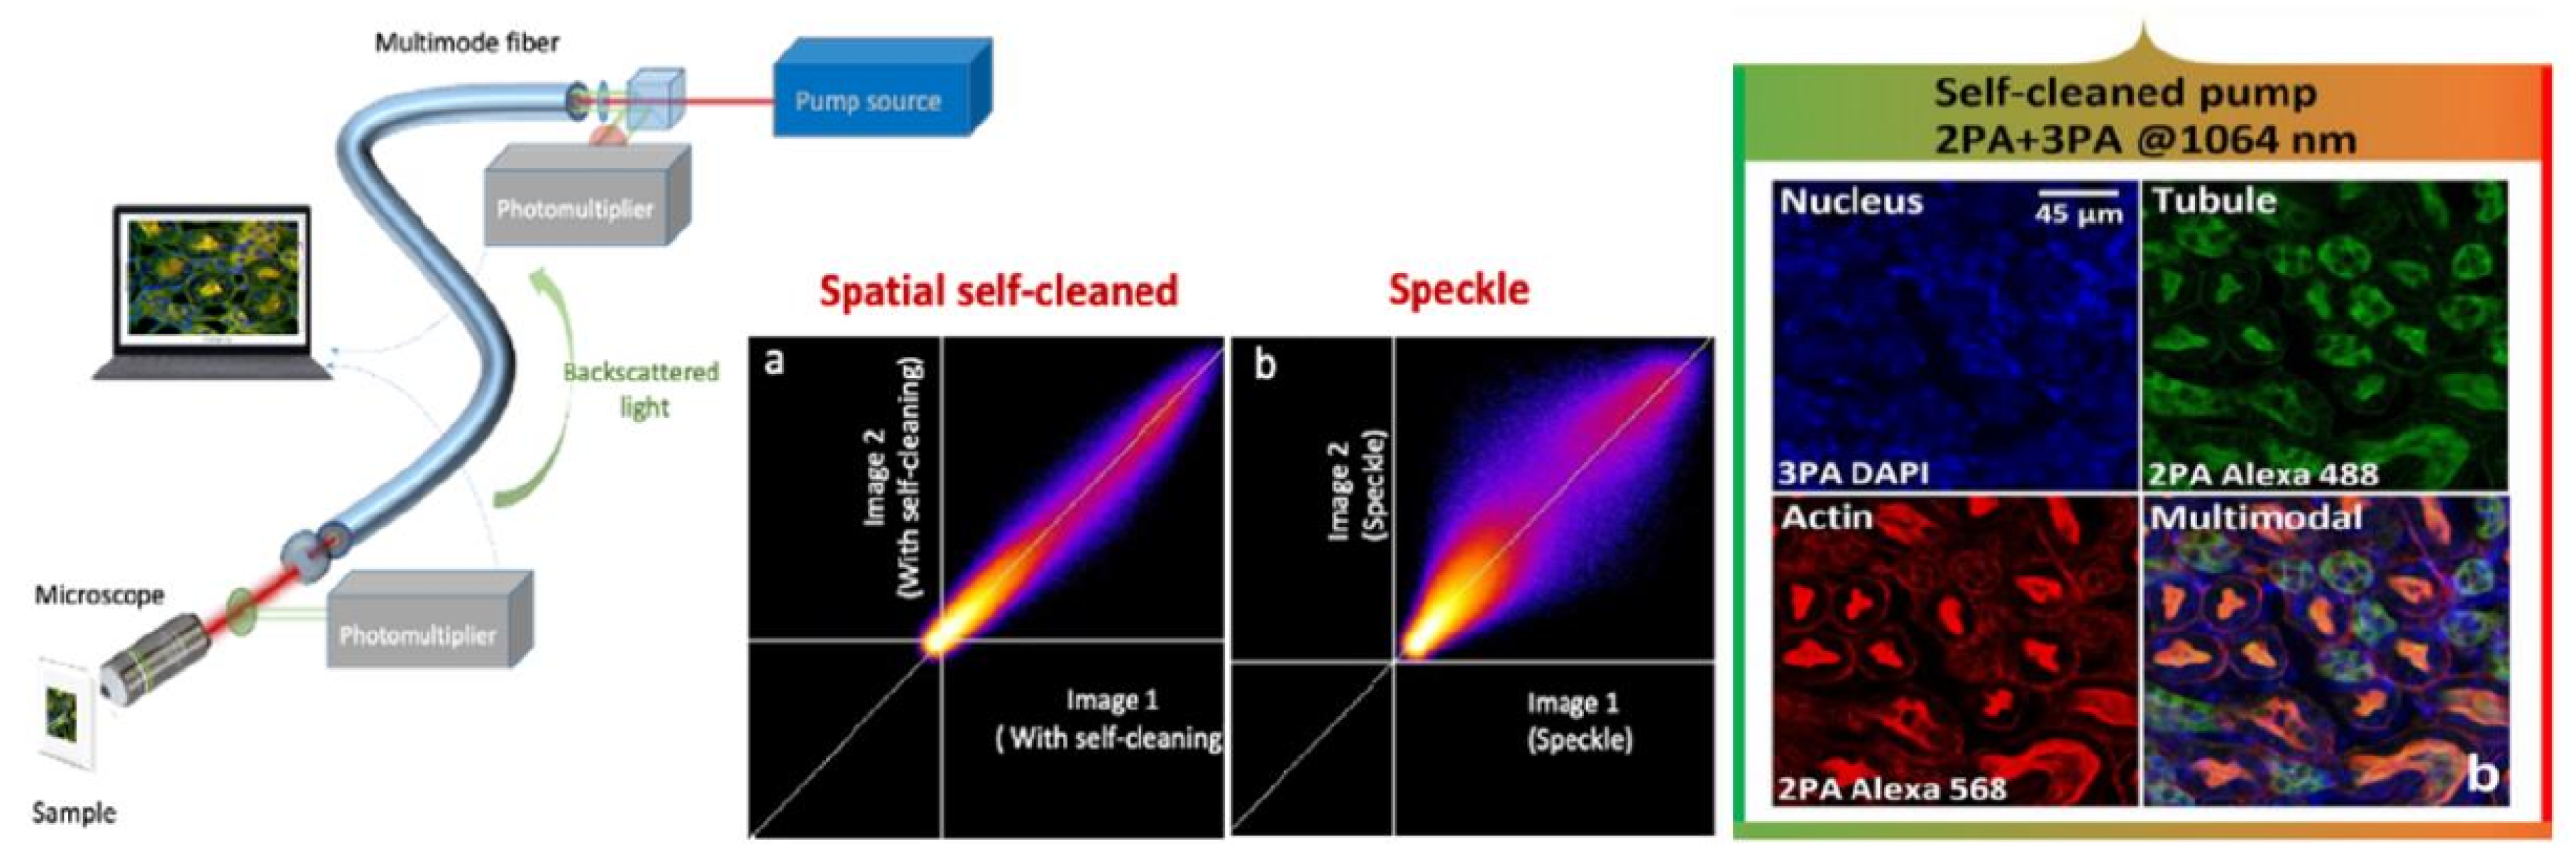

Table 1.
Spectral characteristics of endogenous fluorophores.
| Endogenous fluorophores | Autofluorescence excitation and emission ranges | |
|---|---|---|
| NAD(P)H |
372 nm 375 nm 330–380 nm 330–360 nm |
430–480 nm [75] 456–484 nm [76] 440–462 nm [61] 440–470 nm [77] |
| FAD |
438 nm 445 nm 360–465 nm |
500–550 nm [75] 456–484 nm [76] 520–530 nm [77] |
| Vitamin A | 370–380 nm | 490–510 nm [61,78] |
| Lipofuscin |
400–500 nm 450–490 nm |
480–700 nm [61] 400–700 nm [79] |
| Keratin |
280–325 nm 355–415 nm 488 nm |
495–525 nm [61] 400–520 nm [80] 500–550 nm [81] |
| Collagen |
320–410 nm 375 nm |
400–510 nm [82] 380–420 nm [76] |
Disclaimer/Publisher’s Note: The statements, opinions and data contained in all publications are solely those of the individual author(s) and contributor(s) and not of MDPI and/or the editor(s). MDPI and/or the editor(s) disclaim responsibility for any injury to people or property resulting from any ideas, methods, instructions or products referred to in the content. |
© 2025 by the authors. Licensee MDPI, Basel, Switzerland. This article is an open access article distributed under the terms and conditions of the Creative Commons Attribution (CC BY) license (http://creativecommons.org/licenses/by/4.0/).
Copyright: This open access article is published under a Creative Commons CC BY 4.0 license, which permit the free download, distribution, and reuse, provided that the author and preprint are cited in any reuse.


