
Submitted:
12 June 2025
Posted:
12 June 2025
You are already at the latest version
Abstract
Fluorescence-guided surgery is a significant advancement in medical imaging, particularly for distinguishing malignant from healthy tissue during cancer surgery. Recent advancements in endoscopy technology and fluorescence-lifetime (FLT) imaging can provide better insight into identifying abnormal tissues during surgery than white light endoscopy imaging. Current imaging systems used in fluorescence-guided surgery are primarily designed to provide surgeons with a combined view of natural color (RGB) images and fluorescence overlays. These systems typically rely on an RGB camera, incapable of FLT imaging. Our novel approach sequentially illuminates the scene with red, green, and blue light pulses and Near Infrared (NIR) pulses, captured selectively with a single fast time-gated camera. The camera is synchronized to the pulsed illumination and positions its gate windows to capture only one of the illumination pulses; afterwards, it overlays the NIR fluorescence lifetime image on the natural color image. The VUB-ETRO team developed the tauCAMTM camera based on Current-Assisted Photonic Sampler (CAPS) image sensor technology, which intends to offer real-time FLT imaging, particularly in the NIR area. This paper presents an LED-based time-multiplexing RGB + FLT endoscopy imaging with tauCAMTM, designed to enhance visualization in real-time surgical settings. By combining RGB and FLT imaging, surgeons could receive comprehensive insights into tissue characteristics, supporting precise interventions.
Keywords:
endoscopy
; fluorescence imaging
; fluorescence lifetime imaging
; gated camera
; CAPS
; convolutional neural networks
; sequential RGB
1. Introduction
Cancer surgery critically depends on the accurate differentiation between malignant and healthy tissues to ensure optimal surgical outcomes. The precise removal of cancerous tissue while preserving healthy tissue is essential for improving patient survival rates and enhancing quality of life post-surgery. Traditional imaging modalities, such as Magnetic Resonance Imaging (MRI) and Computed Tomography (CT), are typically employed pre-operatively to locate and outline tumors. However, these techniques cannot be used in an intraoperative setting, nor are they real-time, complicating the surgeon's ability to distinguish between malignant and healthy tissues during surgery. This limitation can lead to the removal of excessive healthy tissue or inadequate excision of malignant tissue, resulting in functional impairments or increased risk of cancer recurrence [1].
Real-time optical imaging holds promise for minimally invasive detection and characterization of tissues by utilizing non-ionizing radiation within the Visible (VIS) to Near-Infrared (NIR) spectrum (400-1100 nm). Despite these advantages, only a few optical imaging modalities have become routine in healthcare. Among these, fluorescence imaging has shown substantial promise, particularly in NIR, and offers a variety of (pre-) clinical applications thanks to its high tissue penetration (millimeters to centimeters) [2], high sensitivity for real-time imaging, low-cost [2,3,4] and reduced scattering, absorption, and autofluorescence [5,6]. Despite the potential benefits, the need for more approved contrast agents for these applications are holding further growth back. These agents are designed to target specific biological markers associated with malignancy. This can be exploited to create contrast, providing surgeons with more profound information during procedures. Such advancements could significantly improve surgical decision-making and outcomes by allowing for more precise delineation of tumor margins. Although several new compounds are under investigation [7], Indocyanine Green (ICG) [8], Cytalux [9], and Lumisight [10] are approved for clinical use.
Despite the advantages of fluorescence imaging, several limitations are associated with conventional intensity-based imaging techniques. Variations in fluorophore concentration or non-uniform illumination can lead to inconsistent fluorescence signals, complicating the interpretation of imaging results. Additionally, background interference from surrounding tissues and autofluorescence due to inherent absorption characteristics of biological tissues can further obscure the fluorescence signals, leading to challenges in accurately delineating tumor margins. These factors highlight the need for more reliable imaging techniques to provide consistent and informative data during surgery.
In contrast, Fluorescence Lifetime (FLT) imaging represents an advancement in overcoming the limitations of traditional fluorescence imaging. FLT is the rate at which fluorescence light decays over time, independent of the concentration of fluorophores and signal intensity [11]. Furthermore, since the lifetime can show a dependency on the environment [12,13,14,15], changes in lifetime can be exploited to create additional contrast between malignant and benign tissue. This characteristic allows FLT to provide more robust biochemical insights into the tissue microenvironment. This capability enhances the distinction of tissue properties, enabling more accurate identification of malignant tissues compared to conventional intensity-based imaging [16].
Recent advances in high-resolution endoscope technology and fluorescence imaging have significantly broadened medical applications. FLT endoscopy imaging provides extra contrast over conventional white light endoscopy imaging, enhances surgeons' ability to identify abnormal tissues, and reduces unnecessary biopsies, potentially improving cancer diagnosis during guided surgeries.
However, current endoscopic imaging systems used in e.g., Fluorescence-Guided Surgery (FGS) are primarily designed to provide surgeons with a combined view of natural color (RGB) images and fluorescence intensity overlays. The former includes structural information in natural tissue colors, aiding in the overall assessment of tissue morphology. In contrast, the latter provides additional information based on the localization of the contrast agent [17]. This gives the surgeon almost complete insight during the surgery to remove as much malignant tissue as possible while avoiding damaging healthy tissue. Therefore, when developing a Fluorescence Lifetime-Guided Surgery (FLGS) system, it is necessary to provide an additional RGB imaging system with accurate color reproduction. Combining the RGB and FLT endoscopy systems could offer significant advancements in medical imaging.
Various techniques could be adopted from conventional FGS to capture RGB images and integrate them with FLT imaging. A widely adopted solution is to pair an FLT camera with an RGB CMOS camera, utilizing a beam splitter to direct visible light to the RGB camera while transmitting NIR fluorescence to the FLT camera [17]. Another configuration uses three monochrome red, green, and blue sensors, an FLT camera, a trichroic prism, and a hot mirror filter [18]. However, these setups are more complex and bulkier, and aligning images can be difficult due to variations in sensor sizes and distinct light paths for each camera. Another approach based on one monochrome camera relies on a Bayer filter array that could be applied to a monochrome lifetime-capable sensor, simultaneously capturing RGB and fluorescence through a combination of red, green, blue, and NIR filters [18]. Nonetheless, this approach reduces the resolution, and although this can be mitigated with post-processing demosaicing, this still leads to a loss in spatial resolution [19].
Alternatively, time-multiplexing RGB imaging is proposed here to address some of the aforementioned issues, such as image alignment, and decreasing the system’s complexity by leveraging color filtering at the illumination stage rather than the imaging stage. A single monochrome time-gated sensor sequentially captures red, green, and blue images and incorporates NIR excitation for FLT imaging.
In Van den Dries et al. (2022), time-sequential RGB imaging was demonstrated using a supercontinuum laser and a high-speed time-gated camera based on CAPS sensor technology: the tauCAM [20]. Although it demonstrates the concept of time-multiplexed RGB imaging with the tauCAM, the configuration has some drawbacks. The setup is bulky, and placing the optical delay line in free space is impractical. Additionally, due to the spectral power distribution of the supercontinuum laser output, only one-third of the power falls within the relevant spectrum (400 - 1100nm), which is distributed non-uniformly through the spectrum, leading to insufficient power for optimal color reconstruction.
Therefore, in [21], we proposed a novel approach where pulsed red, green, and blue LEDs are used for sequential illumination and NIR excitation light for FLT imaging captured by the tauCAM. This was achieved by superimposing a controlled time-multiplexed RGB illumination on the pulsed fluorescence excitation source. RGB channel subframes were captured by gated detection of the reflected light with the gate window positioned in time where the fluorescence emission is maximally decayed. In contrast, time-resolved fluorescence frames were detected during the fluorescent decay, with the LEDs off. The principle was demonstrated, and combined RGB and NIR FLT images were constructed with acceptable color accuracy.
This work presents LED-based time-multiplexing and NIR illumination for time-multiplexed RGB NIR FLT endoscopy imaging with the tauCAM. The time-resolved fluorescence frames were processed into lifetime using a new deep learning-based model, called FLTCNN, presented in [22]. This system promises real-time RGB FLT endoscopy imaging.
2. Experimental Setup
Figure 1 illustrates the RGB FLT endoscopy system with the gated camera (tauCAM). The tauCAM is equipped with a telescopic rigid NIR/ICG endoscope (26003ARA, enlarged view, diameter 10 mm, length 31 cm, Hopkins Rubina, Karl Storz, Germany), a VIS-NIR camera lens (16 mm/F1.6, 67714, Edmund optics, United States), a blocking notch filter at 785nm/40nm (86-127, Edmund optics, United States) to block the fluorescence excitation light. The excitation light comes from a single-wavelength Katana HP 35-ps pulsed laser at 775 nm (NKT Photonics, Denmark).
The excitation pulse is transmitted via a fiber patch cable (numerical aperture = 0.39, core diameter 400 μm, Thorlabs, United States). The LED illuminator, consisting of RGB LEDs, is built in house. The RGB and the NIR excitation light are coupled via a customized adapter to the endoscope. As shown in Figure 1, the laser light arrives in the center of the PCB, and the LEDs are positioned around the laser collimator. The assembly is mechanically coupled and aligned to the illumination input port of the endoscope. The light propagates through the fiber bundle in an annular configuration around the relay system from the endoscope’s distal end onto the scene. The signal from the scene (reflected RGB and fluorescence) is transmitted through the imaging relay system, located in the center of the endoscope’s rigid structure. The used optical elements have been chosen with NIR coatings to minimize losses in the optical system, as the sensitivity of the endoscope depends on the efficiency of light transmission from the distal end, through the endoscope, via the eyepiece to the camera.
3. Design and Method
3.1. LED-Based Time-Domain Sequential RGB and NIR Laser-Based Illumination
Time-sequential RGB LED illumination was combined with a high-power, single-wavelength pulsed laser for FLT imaging. As shown in Figure 2, each camera frame is divided into red, green, blue, and NIR fluorescence subframes in this configuration. The tauCAM is synchronized with the pulsed laser for time-resolved fluorescence measurements. Multiple measurements can be scheduled in a multi-frame mode, each with its acquisition parameters (e.g. window offset, window width, and the number of excitation repetitions). Each subframe can also trigger control signals for external devices, enabling millisecond-scale LED control while acquiring the individual color channel subframes. While the NIR excitation laser illuminates the scene continuously, the gate window for these color subframes is positioned just before the excitation pulse, where the fluorescent emission is maximally decayed. The selected LED then provides a single color of illumination for the entire subframe, after which it is turned off to allow for capturing fluorescence decay subframes (D1 to Dn) for FLT imaging.
3.2. Image Processing Pipeline
Once an image of each color channel is acquired, several transformations must be applied to the raw data to reconstruct and display the color image. Figure 3 shows the block diagram of the post-processing pipeline to convert the raw measurements into RGB coordinates for display on a screen. The post-processing pipeline consists of white balancing, color, and gamma corrections, which are described in detail in [21]. Measurements can be made with background light present, by applying background subtraction using an additional dark frame. This is essential for widefield imaging in room light conditions. However, this can be omitted in an endoscopic context where ambient light is absent.
3.3. Fluorescence-Lifetime Processing
Fluorescence decay measurements are modeled as the convolution of the instrument response function (IRF) with the fluorescence decay, where the decay rate is defined by the fluorescence lifetime. Various techniques have been developed to extract lifetime information in the time domain, including re-convolution via curve fitting, rapid lifetime determination (RLD) [23], artificial neural networks (machine learning, deep learning) [24], and frequency-domain methods such as the phasor approach [25]. However, many of these methods require a substantial number of time points (gate windows) to determine the lifetime accurately, resulting in long acquisition and processing times, sometimes in the order of minutes per image, making them unsuitable for real-time FLT imaging. In [22], we introduced a novel lifetime processing method based on a Convolutional Neural Network (CNN) called FLTCNN. This method is designed for use with this endoscope to estimate the FLT using 6 time points, without using the system’s actual IRF. The architecture is trained based on synthetic data and evaluated on data recorded by the tauCAM. The architecture of FLTCNN is illustrated in Figure 4.
Six fluorescence subframes (time points) are scheduled from the peak value of fluorescence decay through the decay (evenly spaced) when all the RGB LEDs are off, and the acquired data is fed into FLTCNN to get the FLT image. Our latest publication explains the FLT endoscopy imaging with tauCAM and the deep learning method [22].
4. Results and Discussion
4.1. Color Correction and Evaluation
A color checker was employed as a color reference to evaluate the system's performance regarding color reconstruction. The color checker is an internationally recognized standard color card of 24 colors, including primary colors (RGB) and colors commonly seen in daily life, for instance, skin, sky, and grass colors, in addition to six different grays. The distribution of the 24 colors in the CIE 1976 chromaticity diagram is shown in Figure 5(b), which is almost uniformly distributed in u’-v’ space.
The color correction is performed with the first-order regression method described in [21]. The results before and after color correction with the first-order regression method are shown in Figure 6. In Figure 7, the same u’-v’ chromaticity diagram is displayed in which the blue points are the reference values of the standard color checker, and the measured points, shown in red, are the values captured by the tauCAM for these reference colors with a camera lens in a wide-field regime.
In an ideal scenario, each measured point would overlap perfectly with its corresponding reference point, meaning the camera captures each color with no error. However, the smaller the error, the better the camera can accurately replicate the reference colors. However, Figure 7 indicates some errors between the reference and measured colors.
For a more profound assessment, the CIELAB is utilized as a metric for quantifying error and color distances since it considers the human visual system’s higher sensitivity to some colors. Therefore, the colors were first transformed to the CIELAB coordinate color space, before taking the Euclidean distance as formulated in (1):
L* is brightness, a* is the green-red axis, and b* is the blue-yellow axis. The subscripts ‘r’ and ‘m’ refer to ‘reference’ and ‘measured’.
Several studies have been conducted to indicate the perceptibility threshold (PT) and the acceptability threshold (AT). In [30], the PT = 1 and AT = 3.7 are indicated, which means that any color differences beyond 3.7 are noticeable and might be unacceptable. Figure 8 shows that the Euclidean distance implies the mean of , showing noticeable average chromatic differences. Thus, color reconstruction may be adequate for most practical purposes; however, precise color reproduction is essential in medical imaging, where accurate color rendition is essential for quality and consistency.
Further evaluation is performed using non-linear regression for color correction described in (2):
where is a 3×1 column vector with the corresponding XYZ tristimulus values of the reference, and RGB is a 9 × 1 column vector with the corresponding XYZ tristimulus values of the recorded data of the reference with the camera, and the color correction is a 3 × 9 matrix.
Based on Euclidean distance error analysis, non-linear regression seems superior in color correction compared to the first-order regression method. However, when applied to a new image, visually, it performs inferiorly compared to the first-order regression color correction, as shown in Figure 9. Therefore, it suggests that the system might experience overfitting when the non-linear regression method is used for color correction. Thus, we evaluated each color-correction matrix using 4-fold cross-validation. Specifically, the dataset was split into four equally sized subsets. In each of the four iterations, three subsets were used to estimate the color-correction (i.e., to compute the matrix), and the remaining subset was held out for testing. After all four rotations, the color-difference errors across the held-out folds were averaged to produce a single-color correction matrix. The and cross-validation are summarized in Table 1, indicating that the first-order regression performs best on images not trained on, while the non-linear regression color correction matrix overfits.
4.2. Experimental Result
The potential of a time-multiplexing RGB FLT endoscopy system as the proof-of-concept is tested by employing a custom uniform ICG phantom, partially covered by paper with different colors. In this experiment, the scene is illuminated with the time-multiplexing RGB+NIR illumination. Figure 10a shows the white light (color) image constructed by the time-multiplexing RGB imaging. The fluorescence intensity and FLT images, which the FLTCNN calculates, are shown in Figures 10b and c, respectively. As expected, the FLT image is uniform, revealing an average lifetime of 1.1 ns (which can be confirmed by [22]). Finally, the FLT image is overlaid on top of the RGB images shown in Figure 10d.
5. Conclusion
This study used a time-gated camera to present a novel LED-based time-multiplexing RGB and FLT endoscopy system. The system integrates structural and biomedical imaging into a unified platform by leveraging time-sequential RGB illumination and NIR fluorescence excitation. The development of the tauCAM and its use in conjunction with FLTCNN, a deep learning-based fluorescence lifetime analysis model, promises the potential of an efficient and accurate imaging system suitable for real-time surgical applications.
Experimental results demonstrated the system's good accuracy in color reconstruction and its capability to generate uniform FLT data, even in challenging scenarios involving non-uniform fluorescence intensity. The proposed method addresses key limitations of existing approaches, such as bulkiness and alignment issues. This can represent advancements in fluorescence lifetime imaging systems, which rely on separate RGB and FLT cameras.
While the system shows promising results, future research should explore its clinical applicability, robustness under diverse surgical conditions, and compatibility with a broader range of fluorescence dyes. Further optimization, including modifying the illumination system by adding more LEDs (higher illumination power adds more wavelengths, such as yellow LEDs' spectral content) and reducing Gaussian illumination artifacts, could enhance its utility for minimally invasive procedures.
Overall, this integrated RGB FLT endoscopy imaging system represents a potential step forward in fluorescence-guided surgery by improving surgical precision and patient outcomes and providing the potential of real-time RGB FLT endoscopy imaging.
Author Contributions
Conceptualization J.C., methodology, validation, writing, P.I.; review and editing, W.N., T.L., T.V.d.D., S.S.; supervision, M.K., H.I., and V.A.J. All authors have read and agreed to the published version of the manuscript.
Funding
This work has been supported by Fonds voor Wetenschappelijk onderzoek (FWO), Project: “Single sensor methods for fluorescence-guided surgery”, FWO SBO Project “NLITE Surgery”, and by the EIC Pathfinder project 101047263, “CoDaFlight”.
Institutional Review Board Statement
Not applicable.
Informed Consent Statement
Not applicable.
Data Availability Statement
Data available on request due to restrictions.
Conflicts of Interest
Vrije Universiteit Brussel has registered tauCAMTM as a trademark and holds a patent on the CAPS image sensor technology (WO2018206606, EP3622561, US11081509).
References
- Bortot, B.; Mangogna, A.; Di Lorenzo, G.; Stabile, G.; Ricci, G.; Biffi, S. Image-Guided Cancer Surgery: A Narrative Review on Imaging Modalities and Emerging Nanotechnology Strategies. J Nanobiotechnology 2023, 21, 155. [Google Scholar] [CrossRef] [PubMed]
- Schaafsma, B.E.; Mieog, J.S.D.; Hutteman, M.; Van Der Vorst, J.R.; Kuppen, P.J.K.; Löwik, C.W.G.M.; Frangioni, J.V.; Van De Velde, C.J.H.; Vahrmeijer, A.L. The Clinical Use of Indocyanine Green as a Near-Infrared Fluorescent Contrast Agent for Image-Guided Oncologic Surgery. J Surg Oncol 2011, 104, 323–332. [Google Scholar] [CrossRef] [PubMed]
- Zhu, B.; Sevick-Muraca, E.M. A Review of Performance of Near-Infrared Fluorescence Imaging Devices Used in Clinical Studies. Br J Radiol 2015, 88, 20140547. [Google Scholar] [CrossRef] [PubMed]
- Frangioni, J. In Vivo Near-Infrared Fluorescence Imaging. Curr Opin Chem Biol 2003, 7, 626–634. [Google Scholar] [CrossRef] [PubMed]
- Weissleder, R.; Tung, C.-H.; Mahmood, U.; Bogdanov, A. In Vivo Imaging of Tumors with Protease-Activated near-Infrared Fluorescent Probes. Nat Biotechnol 1999, 17, 375–378. [Google Scholar] [CrossRef] [PubMed]
- Ntziachristos, V. FLUORESCENCE MOLECULAR IMAGING. Annu Rev Biomed Eng 2006, 8, 1–33. [Google Scholar] [CrossRef] [PubMed]
- Barth, C.W.; Gibbs, S. Fluorescence Image-Guided Surgery: A Perspective on Contrast Agent Development. In Proceedings of the Molecular-Guided Surgery: Molecules, Devices, and Applications VI.; SPIE, February 19 2020; Gibbs, S.L., Pogue, B.W., Gioux, S., Eds.; p. 18. [Google Scholar]
- Carr, J.A.; Franke, D.; Caram, J.R.; Perkinson, C.F.; Saif, M.; Askoxylakis, V.; Datta, M.; Fukumura, D.; Jain, R.K.; Bawendi, M.G.; et al. Shortwave Infrared Fluorescence Imaging with the Clinically Approved Near-Infrared Dye Indocyanine Green. Proceedings of the National Academy of Sciences 2018, 115, 4465–4470. [Google Scholar] [CrossRef]
- Lee, J.Y.K.; Cho, S.S.; Zeh, R.; Pierce, J.T.; Martinez-Lage, M.; Adappa, N.D.; Palmer, J.N.; Newman, J.G.; Learned, K.O.; White, C.; et al. Folate Receptor Overexpression Can Be Visualized in Real Time during Pituitary Adenoma Endoscopic Transsphenoidal Surgery with Near-Infrared Imaging. J Neurosurg 2018, 129, 390–403. [Google Scholar] [CrossRef]
- Whitley, M.J.; Cardona, D.M.; Lazarides, A.L.; Spasojevic, I.; Ferrer, J.M.; Cahill, J.; Lee, C.-L.; Snuderl, M.; Blazer, D.G.; Hwang, E.S.; et al. A Mouse-Human Phase 1 Co-Clinical Trial of a Protease-Activated Fluorescent Probe for Imaging Cancer. Sci Transl Med 2016, 8. [Google Scholar] [CrossRef] [PubMed]
- Principles of Fluorescence Spectroscopy; Springer US: Boston, MA, 2006; ISBN 978-0-387-31278-1.
- Petrášek, Z.; Krishnan, M.; Mönch, I.; Schwille, P. Simultaneous Two-Photon Fluorescence Correlation Spectroscopy and Lifetime Imaging of Dye Molecules in Submicrometer Fluidic Structures. In Proceedings of the Microscopy Research and Technique; Wiley-Liss Inc., 2007; Vol. 70; pp. 459–466. [Google Scholar]
- Akers, W.; Achilefu, S. In Vivo Resolution of Two Near-Infrared Fluorophores by Time-Domain Diffuse Optical Tomagraphy.; Achilefu, S., Bornhop, D.J., Raghavachari, R., Savitsky, A.P., Wachter, R.M., Eds.; 2007; p. 64490H. 8 February.
- Gannot, I.; Ron, I.; Hekmat, F.; Chernomordik, V.; Gandjbakhche, A. Functional Optical Detection Based on PH Dependent Fluorescence Lifetime. Lasers Surg Med 2004, 35, 342–348. [Google Scholar] [CrossRef] [PubMed]
- Nakache, G.; Yahav, G.; Siloni, G.H.; Barshack, I.; Alon, E.; Wolf, M.; Fixler, D. The Use of Fluorescence Lifetime Technology in Benign and Malignant Thyroid Tissues. J Laryngol Otol 2019, 133, 696–699. [Google Scholar] [CrossRef] [PubMed]
- Pal, R.; Hom, M.E.; van den Berg, N.S.; Lwin, T.M.; Lee, Y.-J.; Prilutskiy, A.; Faquin, W.; Yang, E.; Saladi, S.V.; Varvares, M.A.; et al. First Clinical Results of Fluorescence Lifetime-Enhanced Tumor Imaging Using Receptor-Targeted Fluorescent Probes. Clinical Cancer Research 2022, 28, 2373–2384. [Google Scholar] [CrossRef] [PubMed]
- DSouza, A.V.; Lin, H.; Henderson, E.R.; Samkoe, K.S.; Pogue, B.W. Review of Fluorescence Guided Surgery Systems: Identification of Key Performance Capabilities beyond Indocyanine Green Imaging. J Biomed Opt 2016, 21, 080901. [Google Scholar] [CrossRef] [PubMed]
- Chen, Z.; Zhu, N.; Pacheco, S.; Wang, X.; Liang, R. Single Camera Imaging System for Color and Near-Infrared Fluorescence Image Guided Surgery. Biomed Opt Express 2014, 5, 2791. [Google Scholar] [CrossRef] [PubMed]
- Teranaka, H.; Monno, Y.; Tanaka, M.; Ok, M. Single-Sensor RGB and NIR Image Acquisition: Toward Optimal Performance by Taking Account of CFA Pattern, Demosaicking, and Color Correction. Electronic Imaging 2016, 28, 1–6. [Google Scholar] [CrossRef]
- Van den Dries, T.; Lapauw, T.; Janssen, S.; Sahakian, S.; Lepoutte, T.; Stroet, M.; Hernot, S.; Kuijk, M.; Ingelberts, H. 64×64 Pixel Current-Assisted Photonic Sampler Image Sensor and Camera System for Real-Time Fluorescence Lifetime Imaging. IEEE Sens J 2024, 24, 23729–23737. [Google Scholar] [CrossRef]
- Iranian, P.; Nevens, W.W.; Lapauw, T.; Van den Dries, T.; Coosemans, J.; Sahakian, S.; Lepoutte, T.; Jacobs, V.A.; Ingelberts, H.; Kuijk, M. Novel Sequential RGB+NIR Fluorescence Lifetime Imaging with a Single Nanosecond Time-Gated CAPS Camera. In Proceedings of the Advanced Biomedical and Clinical Diagnostic and Surgical Guidance Systems XXII.; Boudoux, C., Tunnell, J.W., Eds.; SPIE, March 13 2024; p. 30. [Google Scholar]
- Iranian, P.; Lapauw, T.; Van den Dries, T.; Sahakian, S.; Wuts, J.; Jacobs, V.A.; Vandemeulebroucke, J.; Kuijk, M.; Ingelberts, H. Fluorescence Lifetime Endoscopy with a Nanosecond Time-Gated CAPS Camera with IRF-Free Deep Learning Method. Sensors 2025, 25, 450. [Google Scholar] [CrossRef] [PubMed]
- Ballew, R.M.; Demas, J.N. An Error Analysis of the Rapid Lifetime Determination Method for the Evaluation of Single Exponential Decays. Anal Chem 1989, 61, 30–33. [Google Scholar] [CrossRef]
- Xiao, D.; Chen, Y.; Li, D.D.-U. One-Dimensional Deep Learning Architecture for Fast Fluorescence Lifetime Imaging. IEEE Journal of Selected Topics in Quantum Electronics 2021, 27, 1–10. [Google Scholar] [CrossRef]
- Digman, M.A.; Caiolfa, V.R.; Zamai, M.; Gratton, E. The Phasor Approach to Fluorescence Lifetime Imaging Analysis. Biophys J 2008, 94, L14–L16. [Google Scholar] [CrossRef] [PubMed]
Figure 1.
Illustration of the LED-based time-multiplexing RGB FLT endoscopy imaging system.
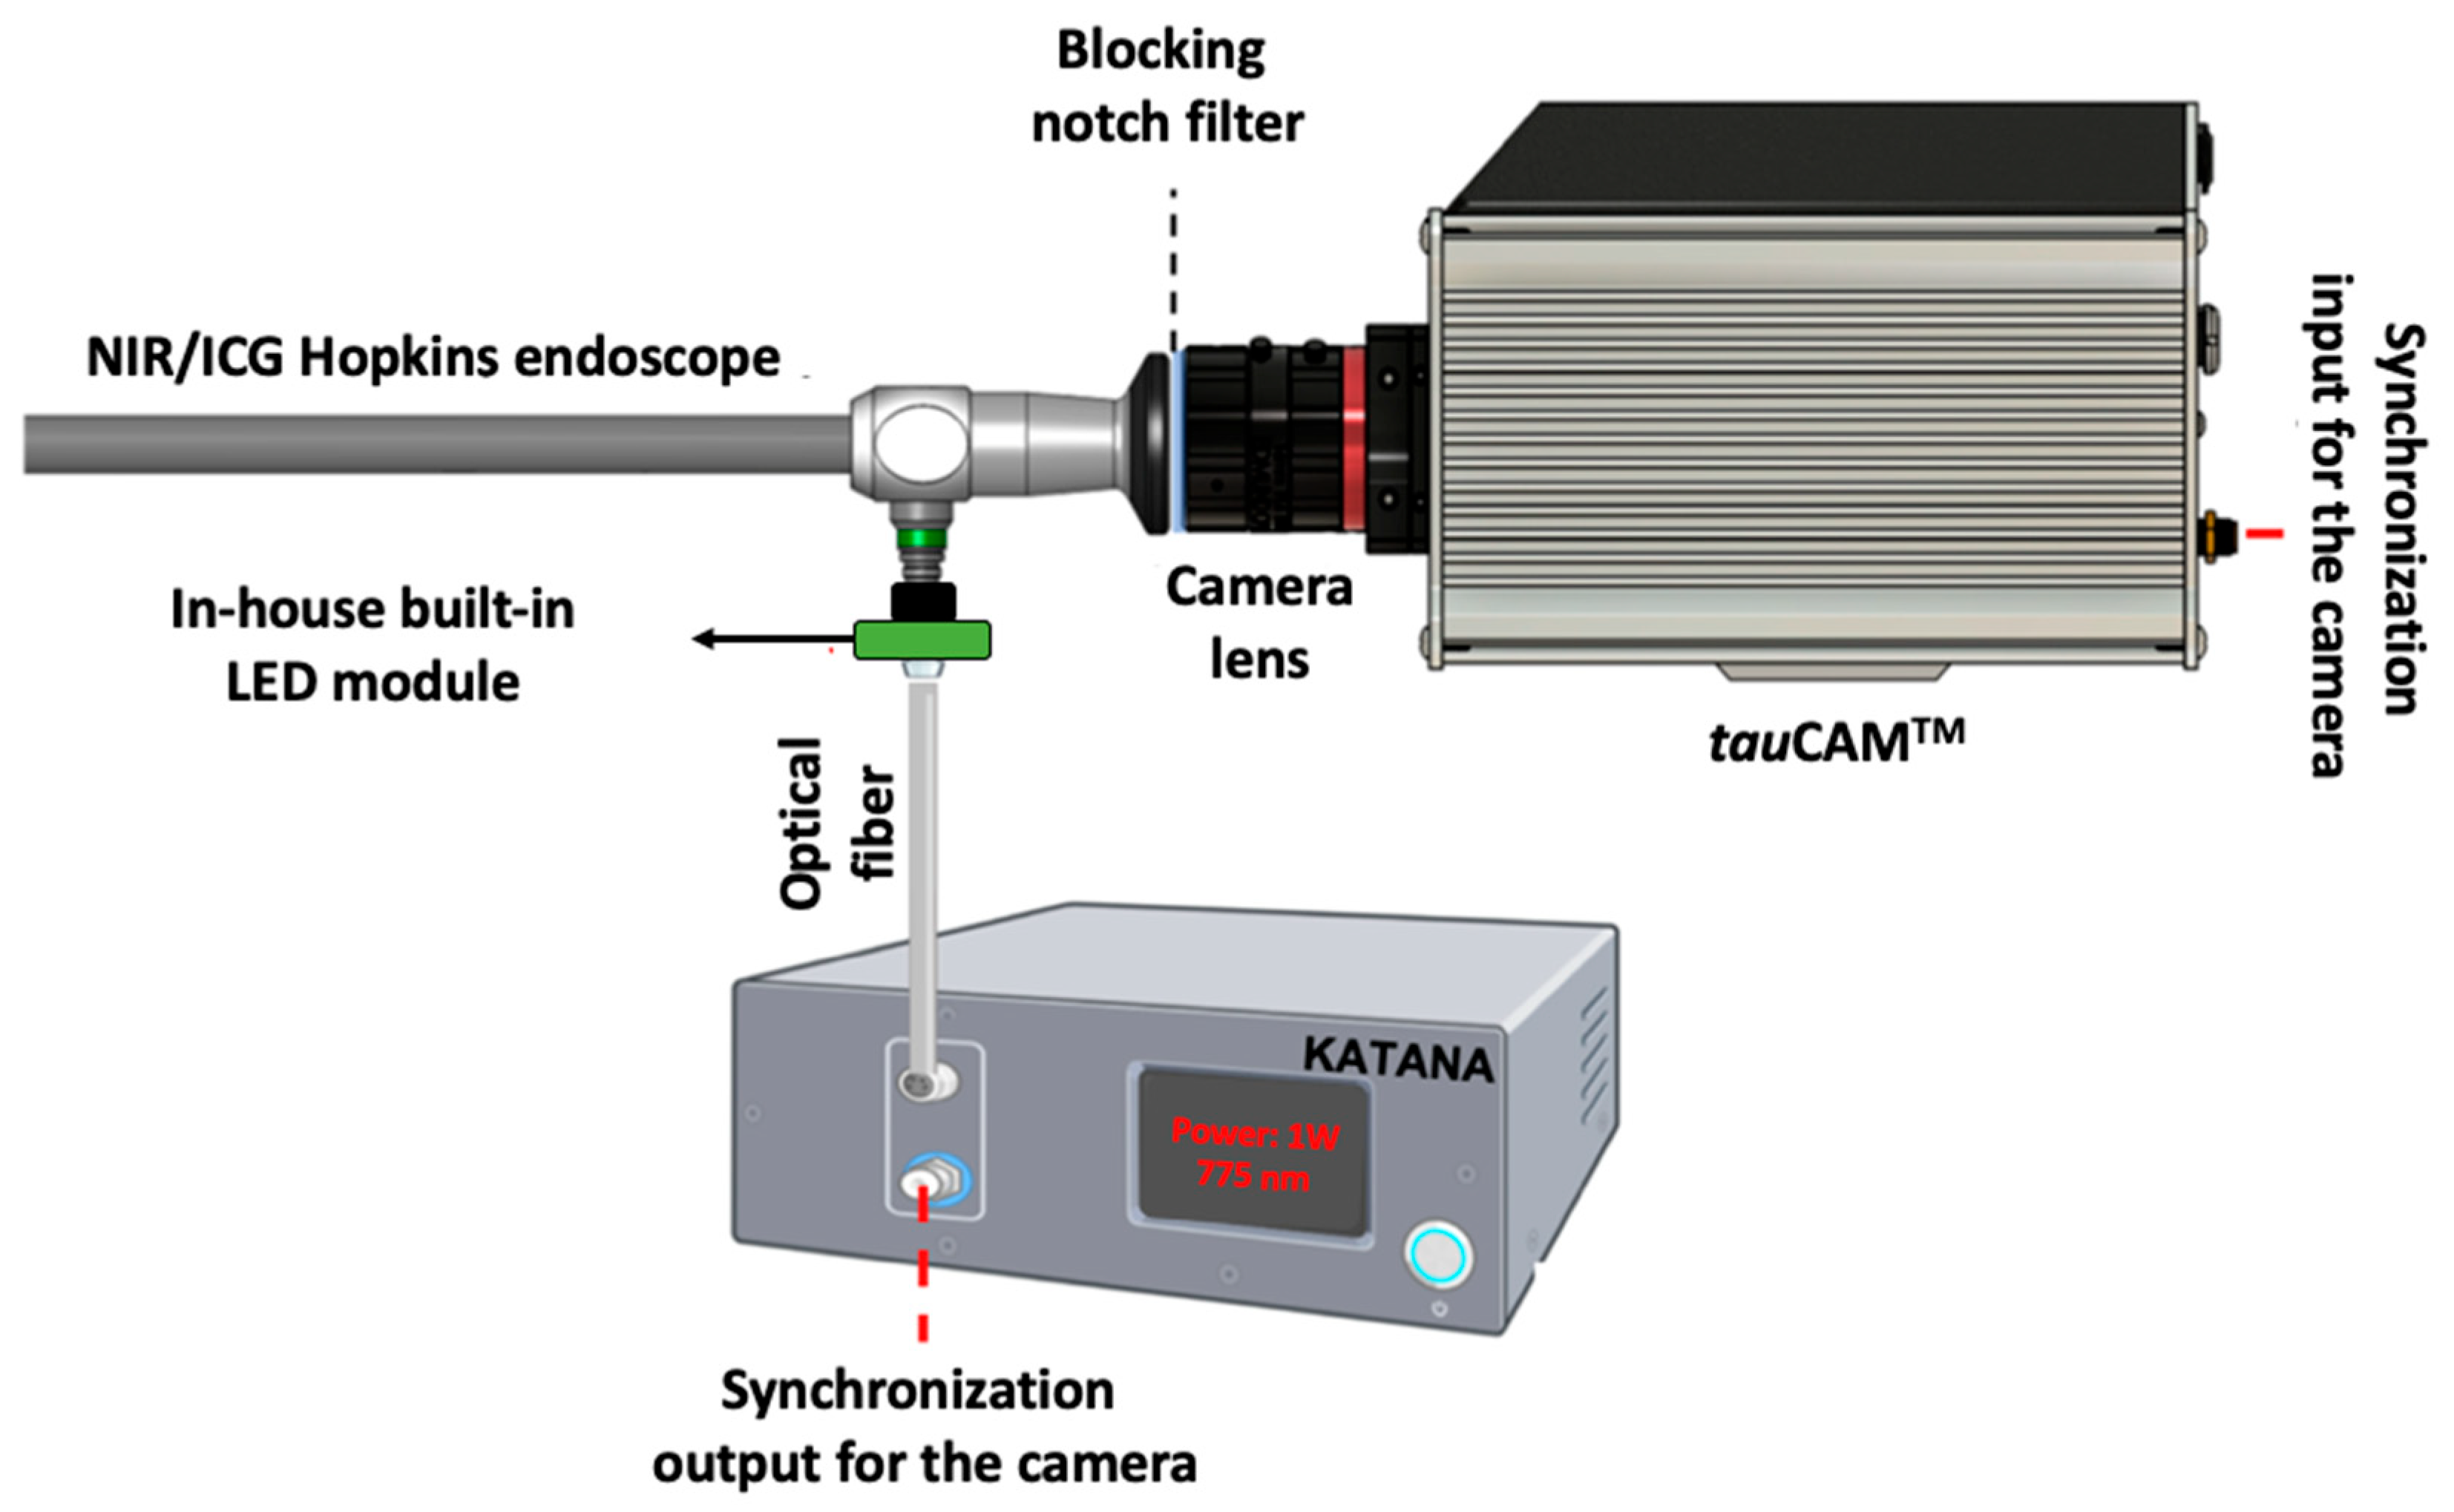
Figure 2.
Millisecond timescale illumination regime used with LEDs.
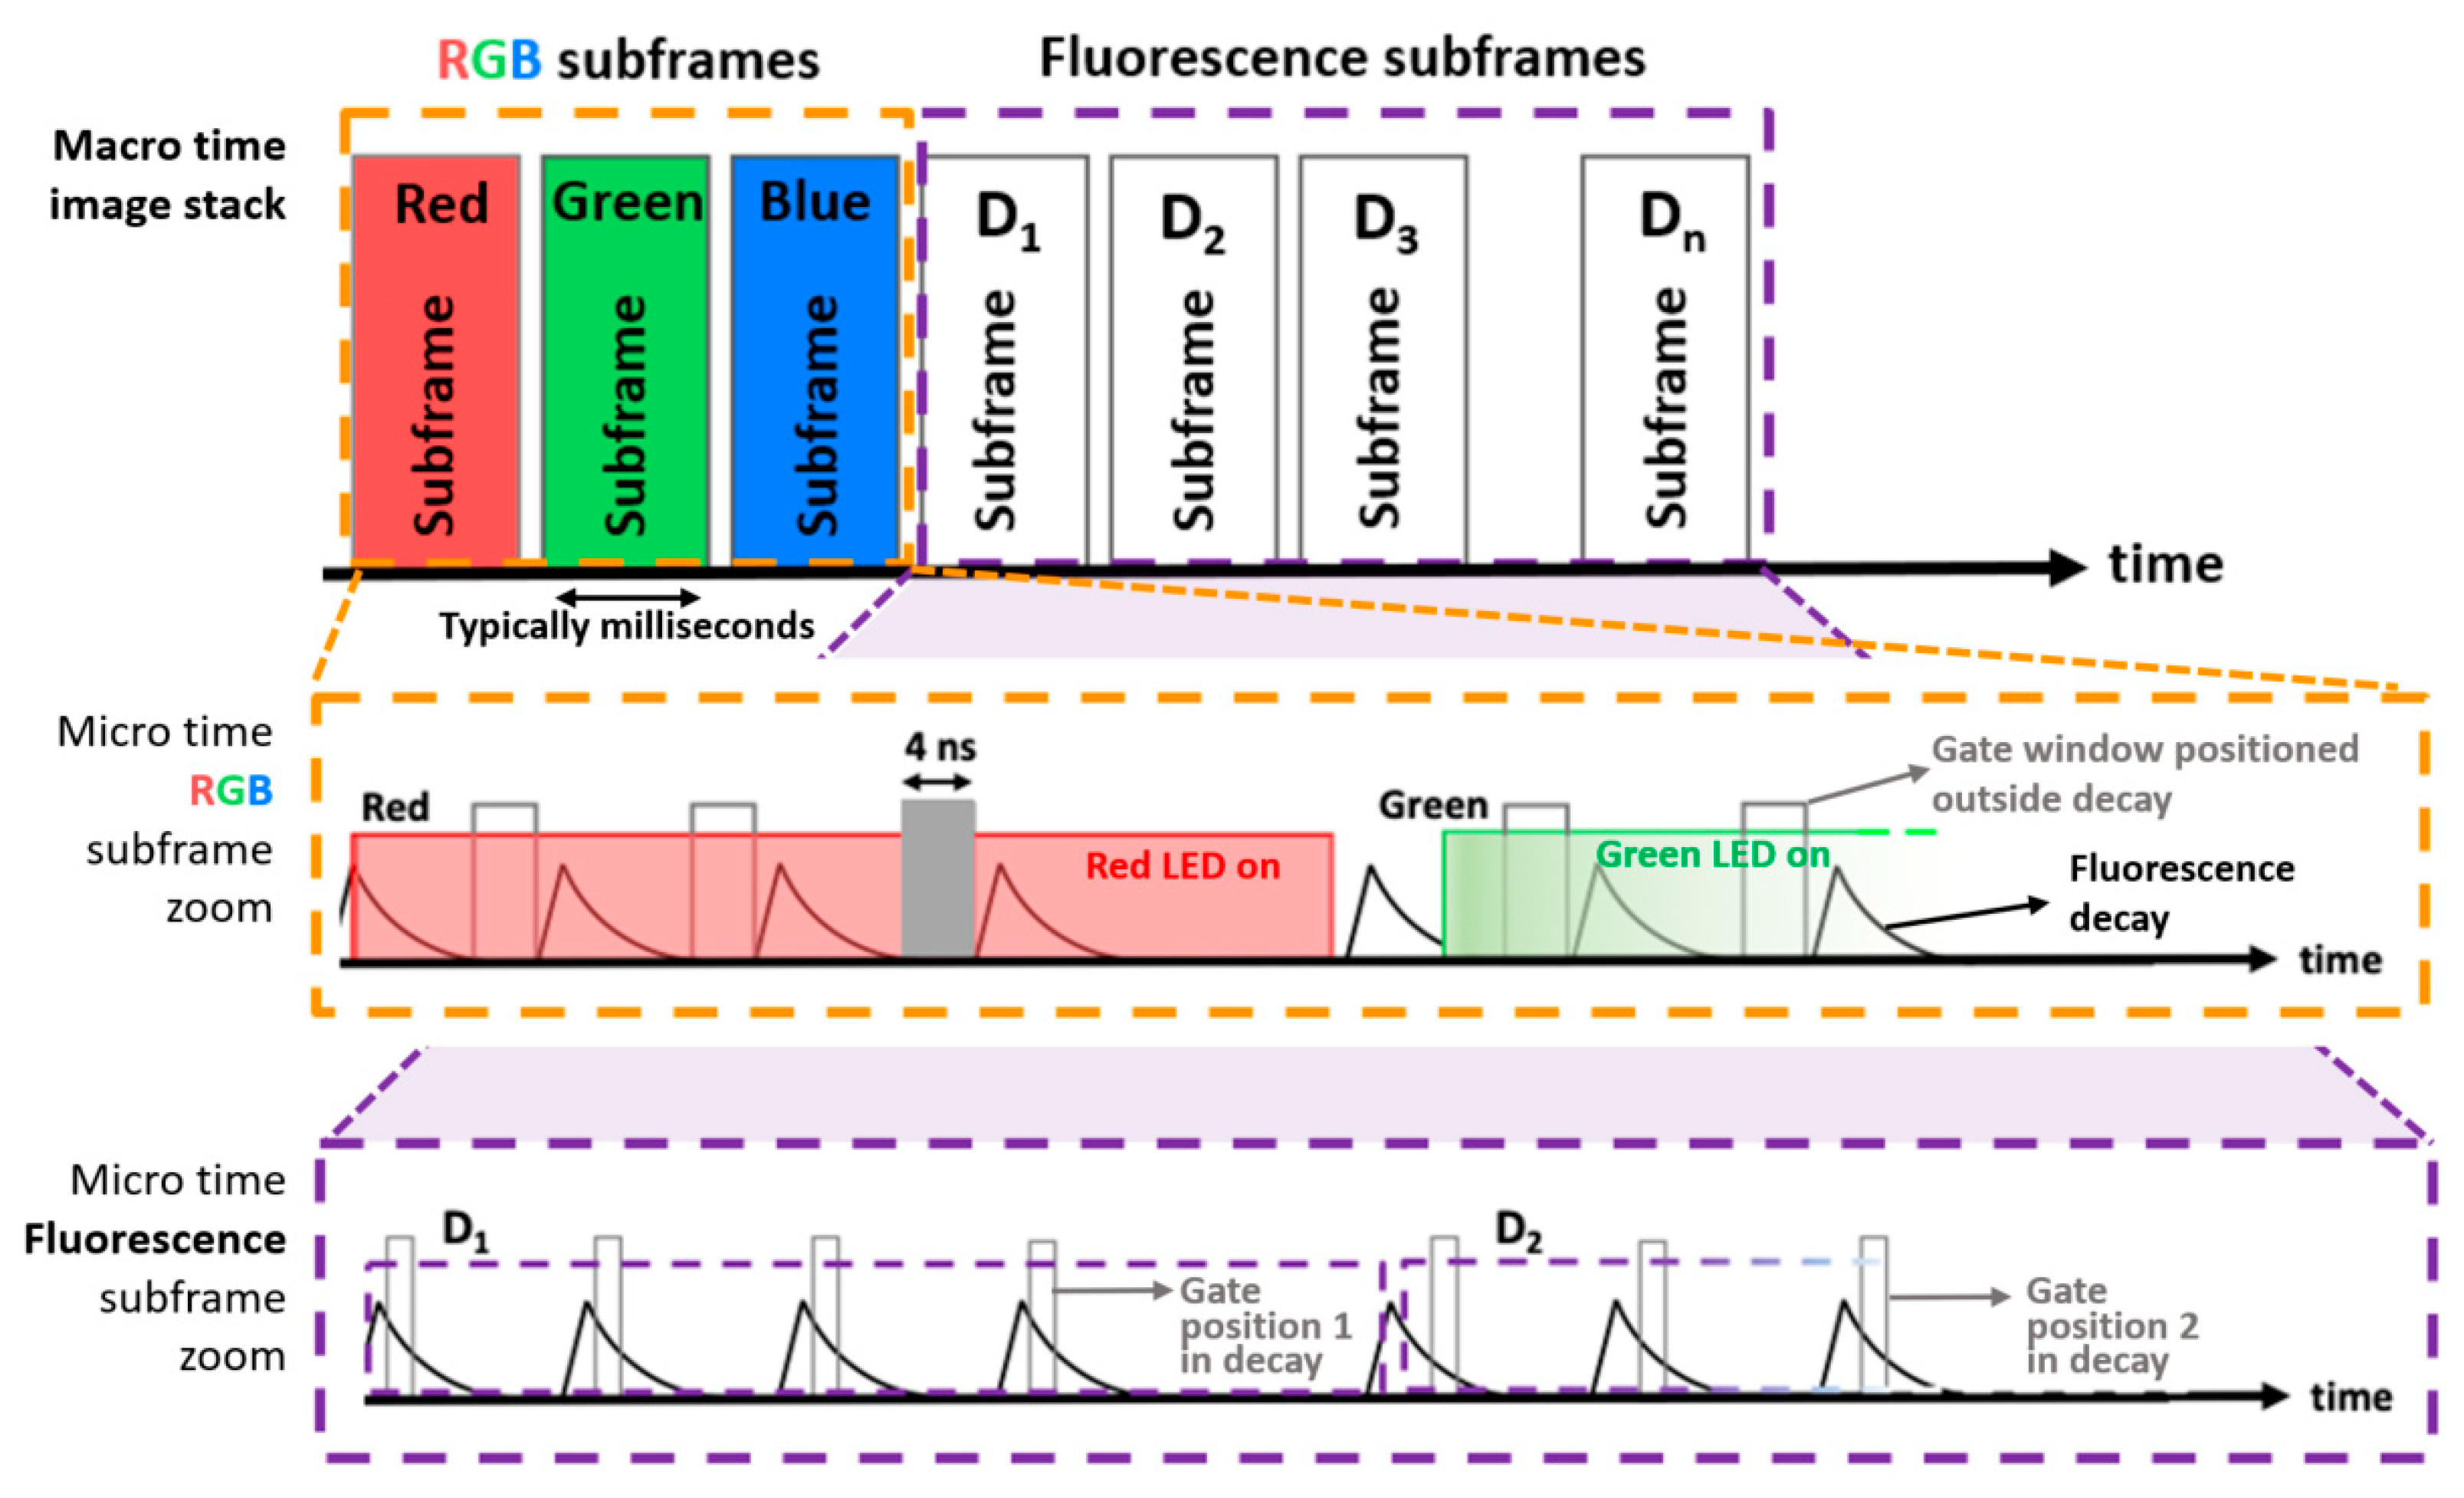
Figure 3.
Post-processing diagram for color reconstruction.
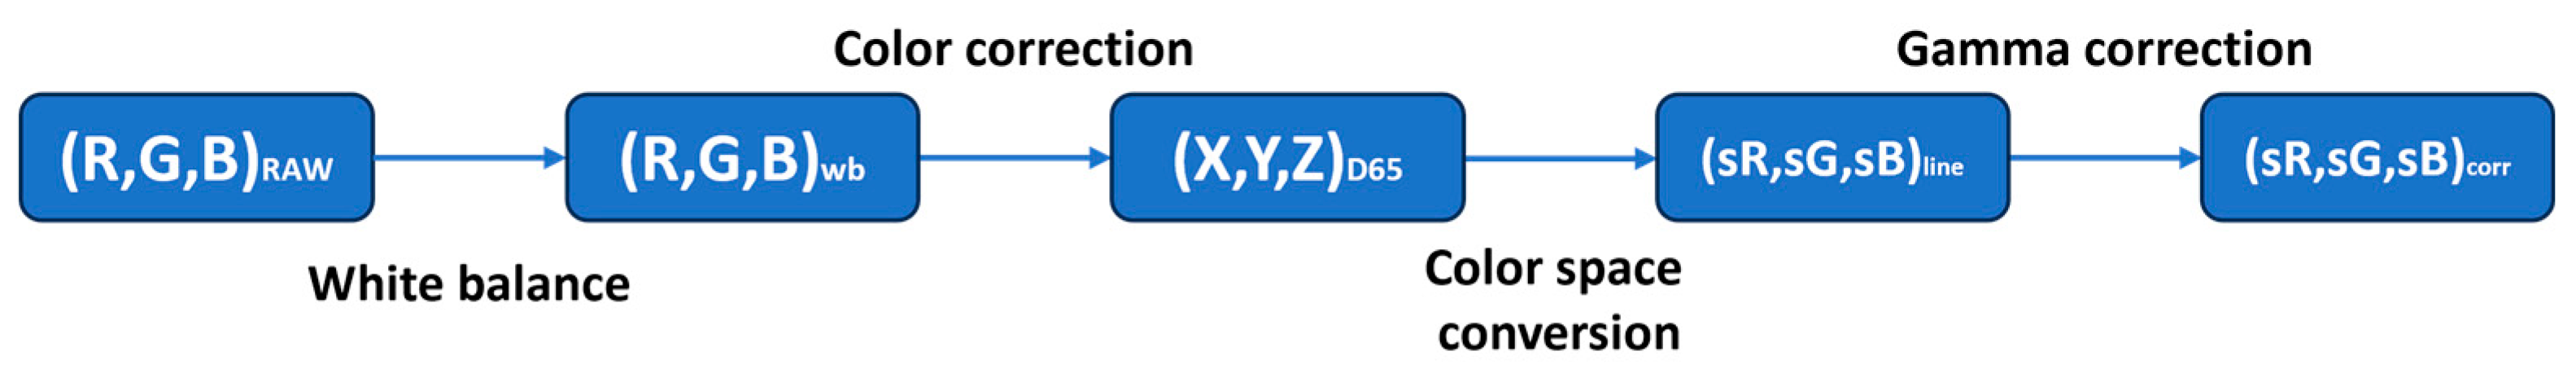
Figure 4.
Topology of FLTCNN to analyze mono-exponential fluorescence decays [22].
Figure 4.
Topology of FLTCNN to analyze mono-exponential fluorescence decays [22].
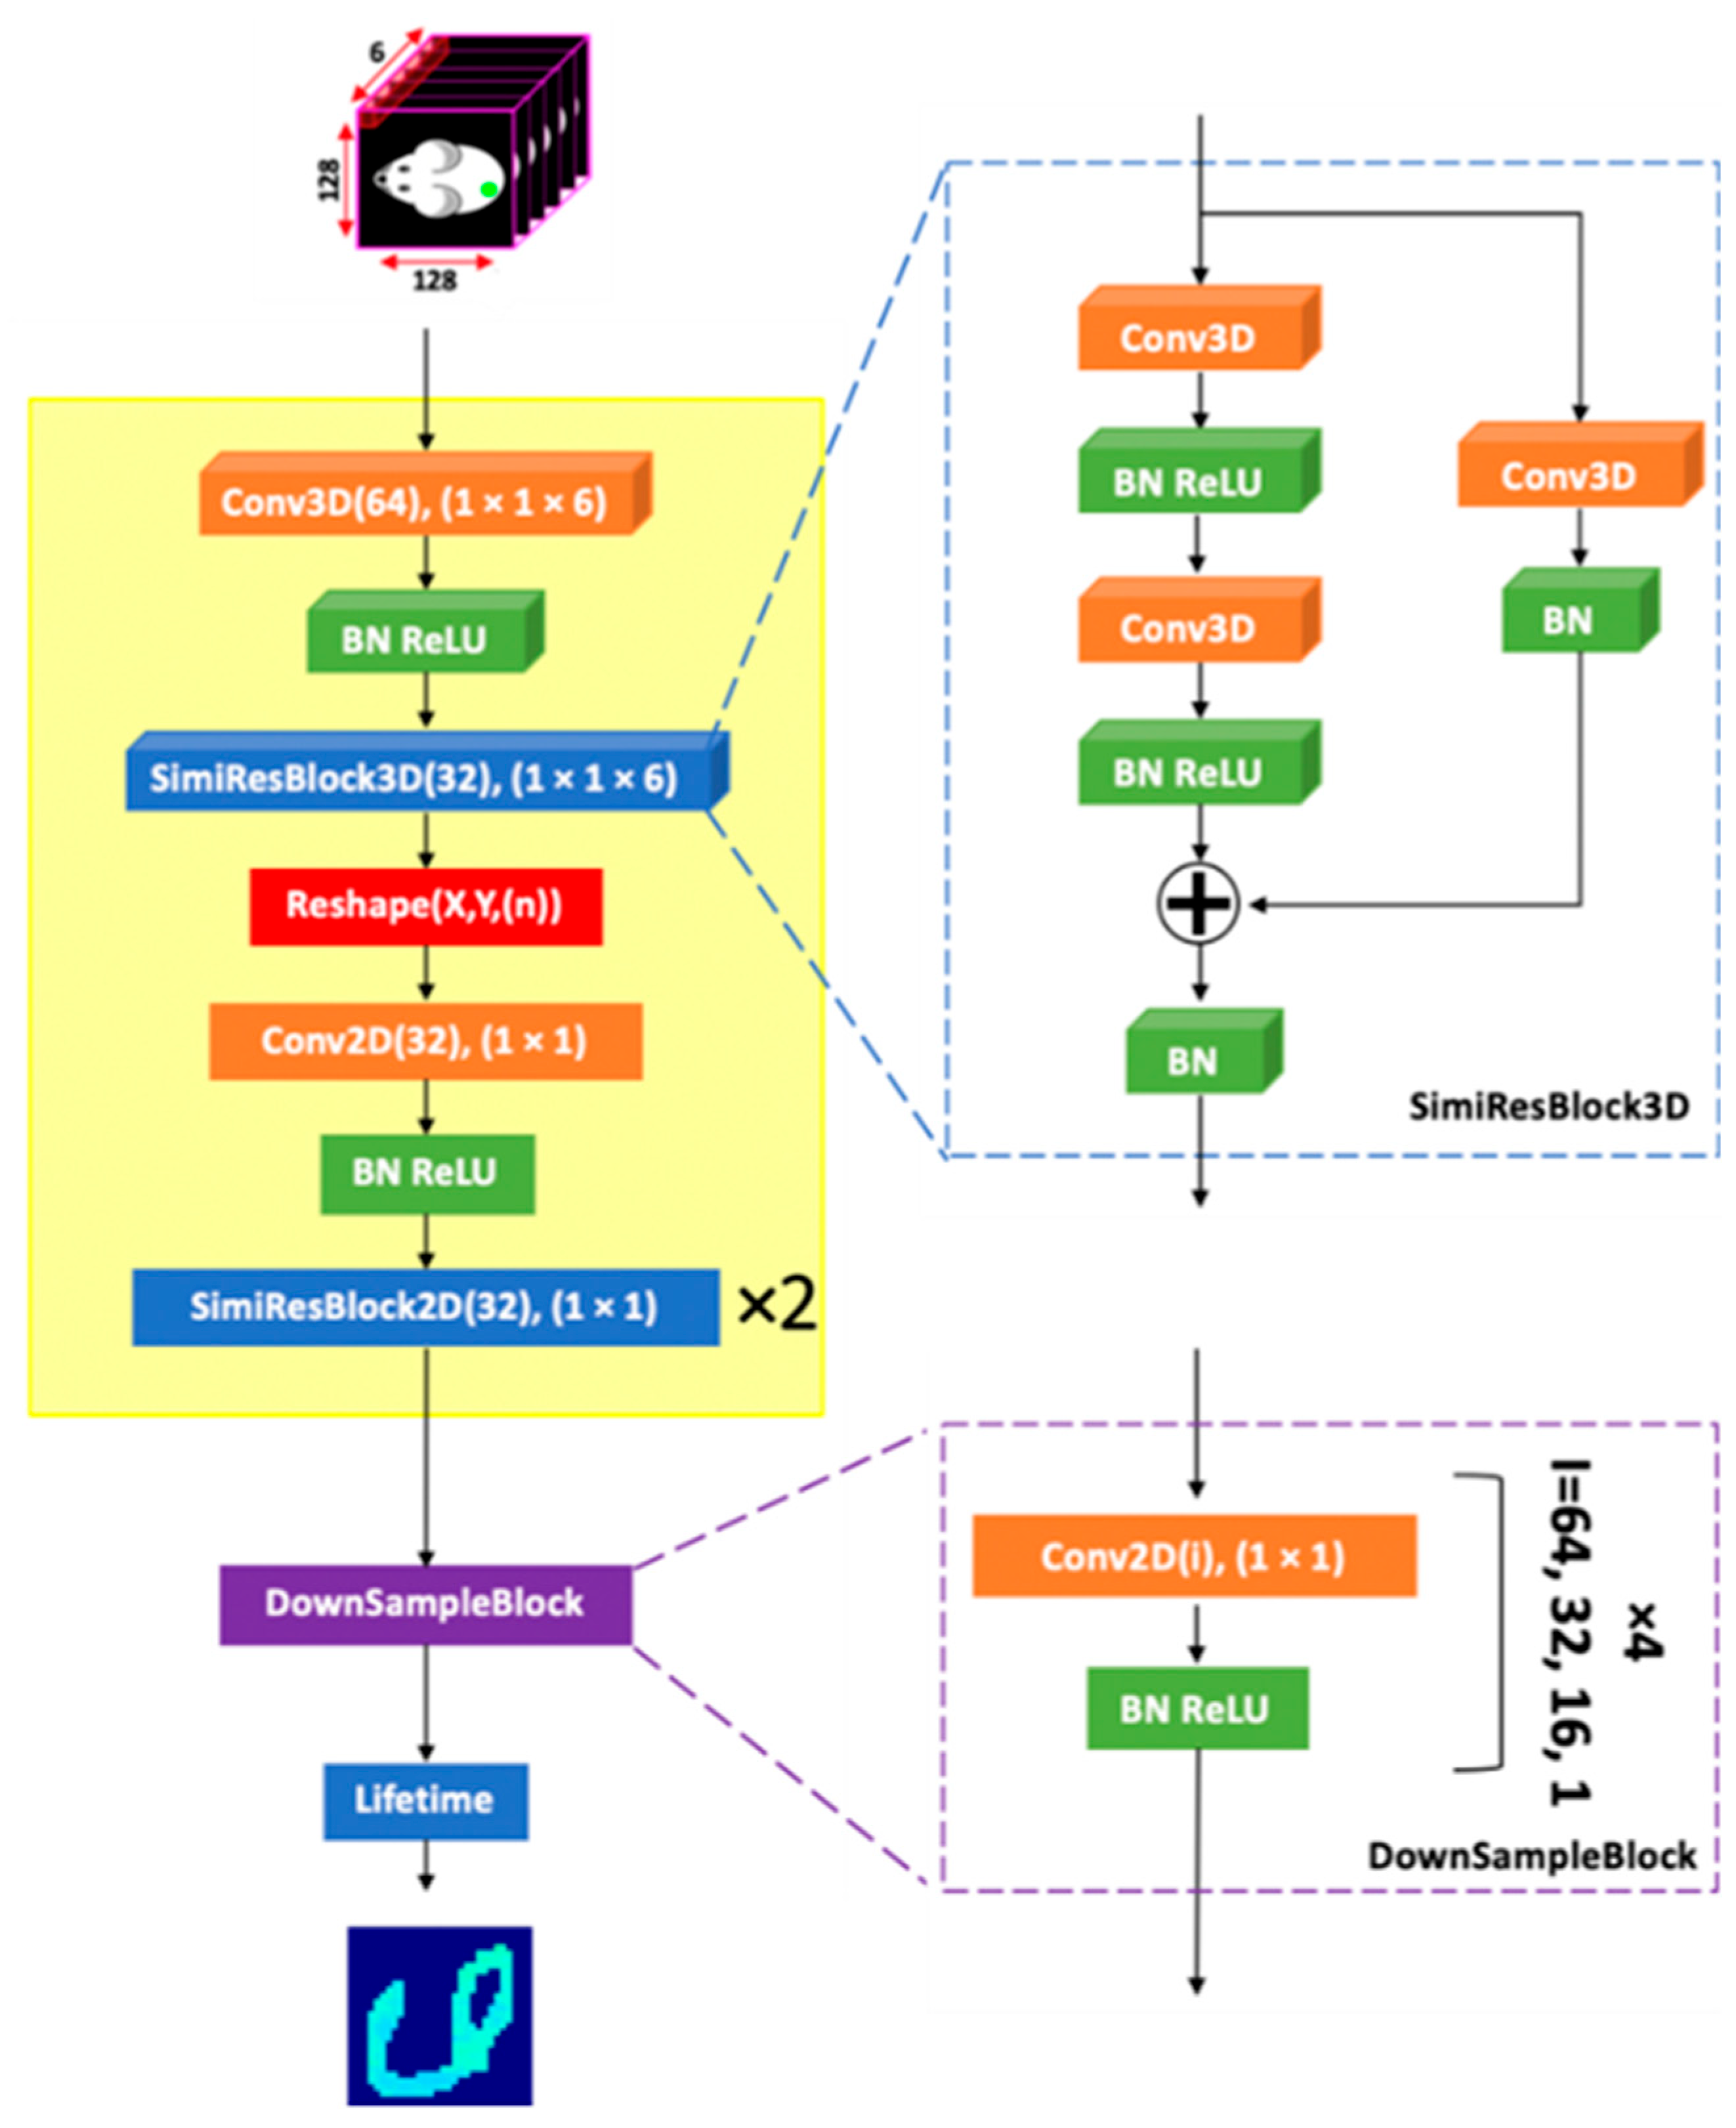
Figure 5.
(a) X-Rite color checker classic, (b) the distribution of the 24 colors in the CIE 1976 chromaticity diagram.
Figure 5.
(a) X-Rite color checker classic, (b) the distribution of the 24 colors in the CIE 1976 chromaticity diagram.
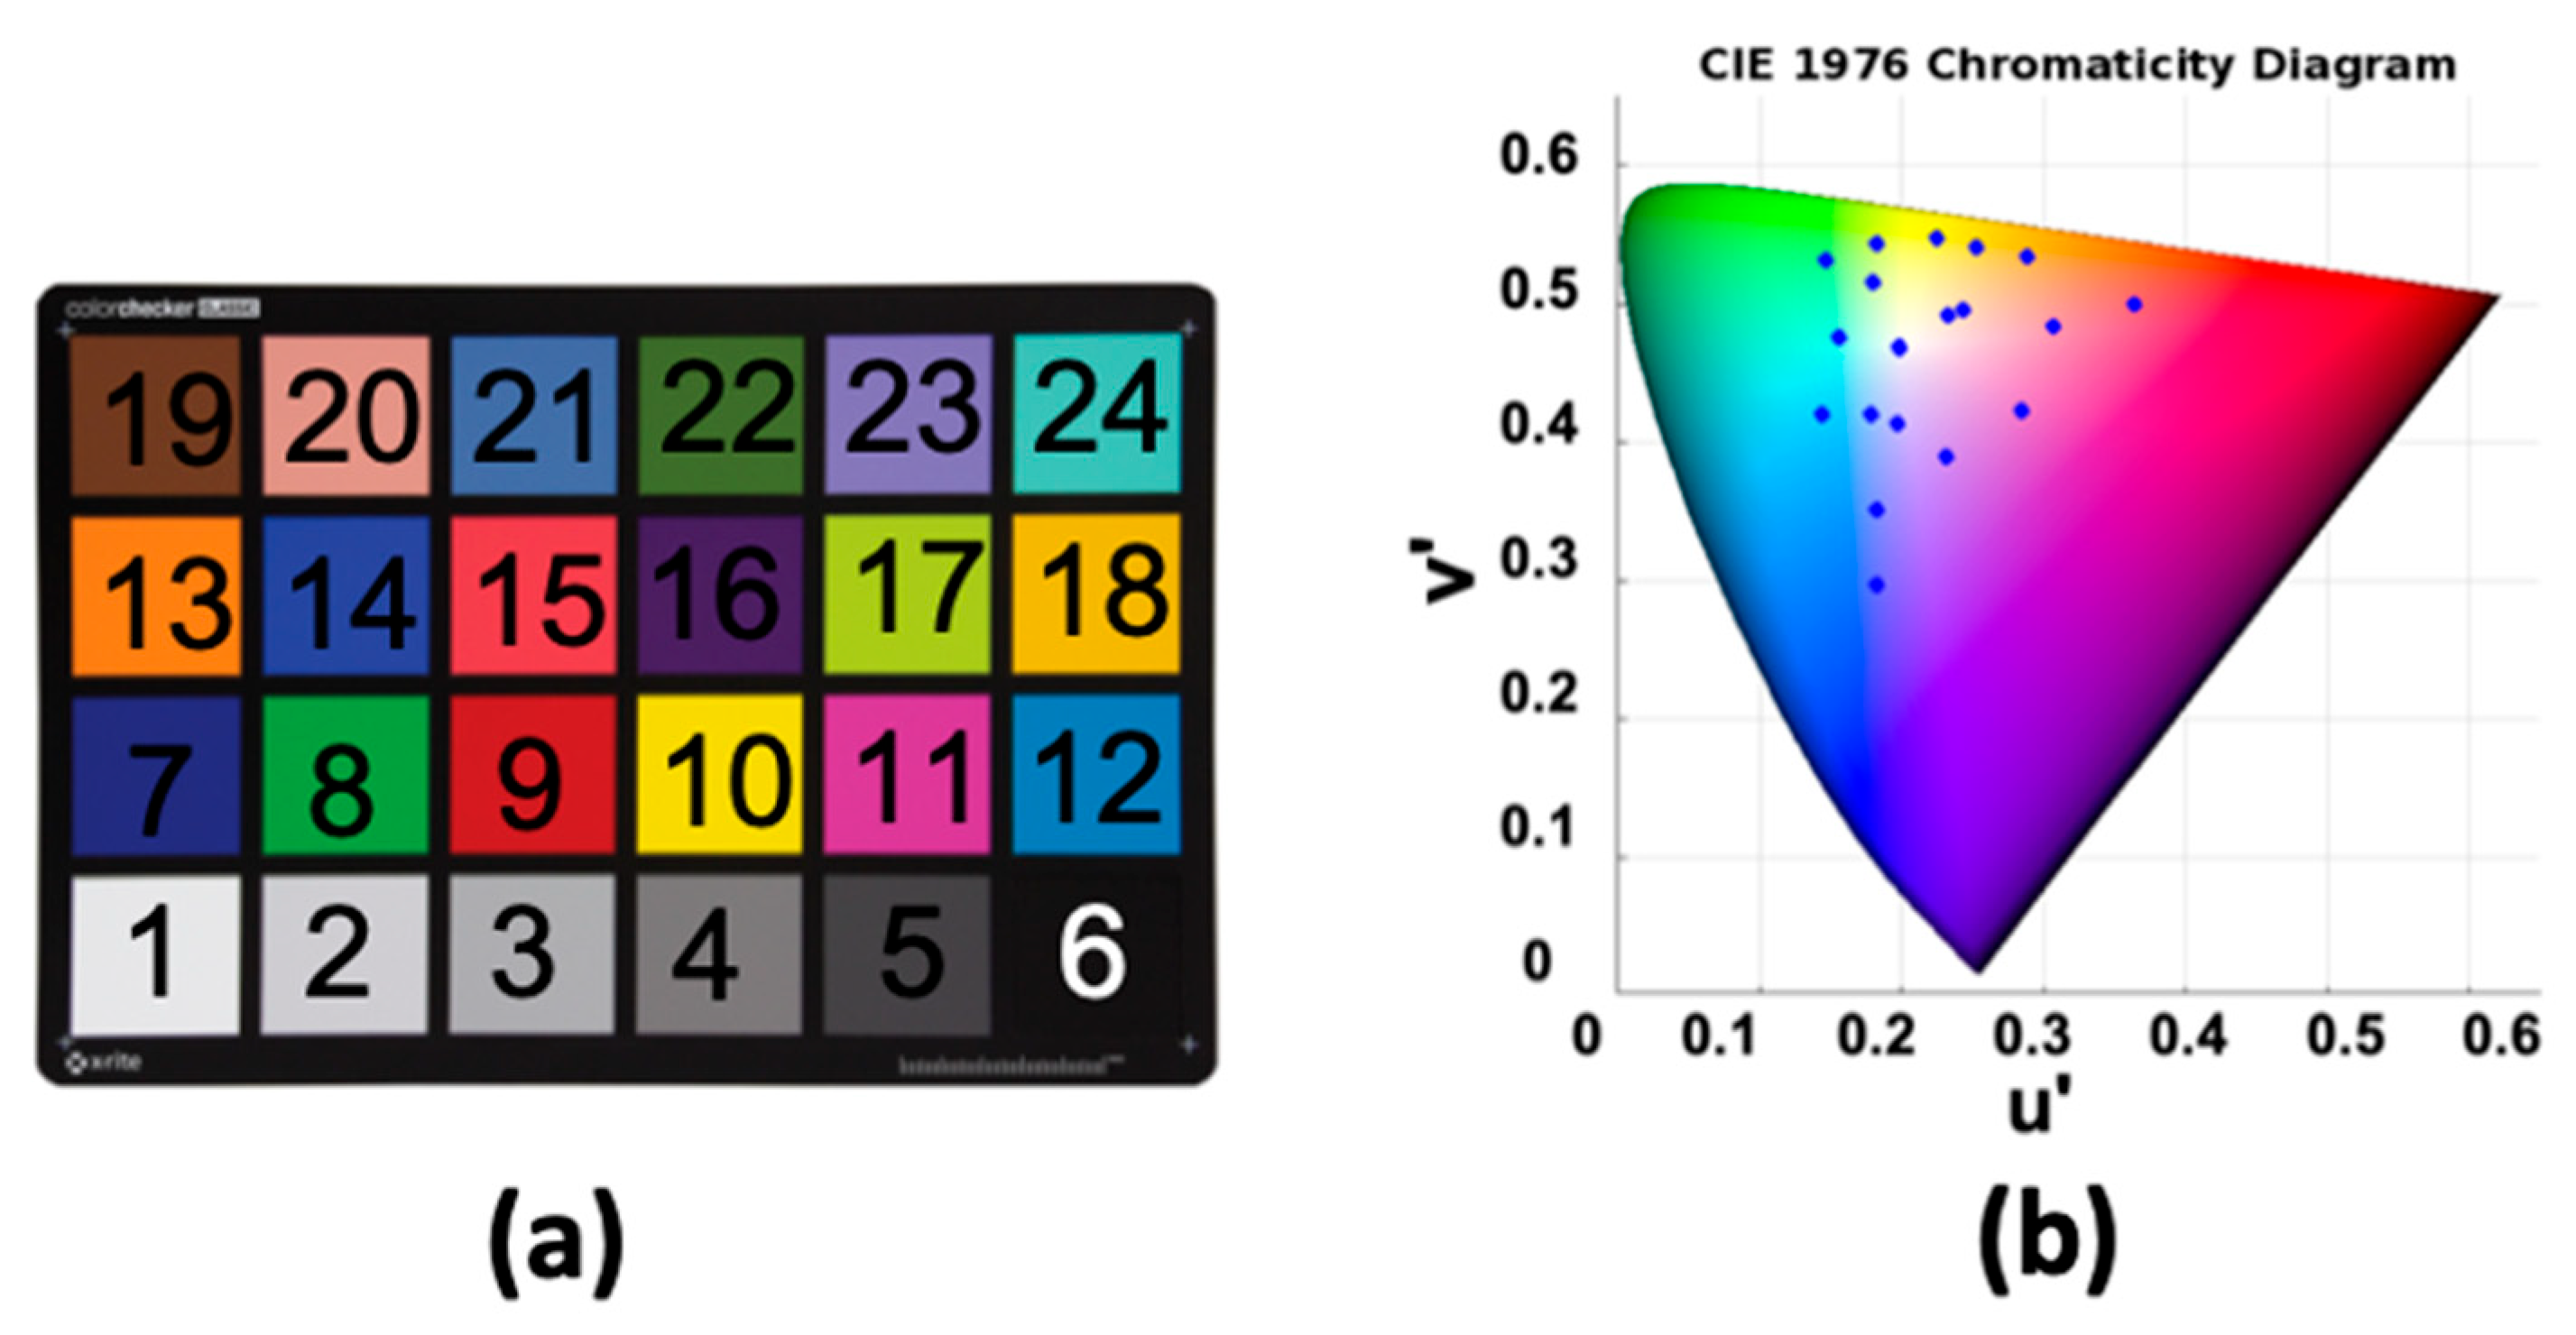
Figure 6.
(a) Before color correction, (b) after color correction with the first-order regression method.
Figure 6.
(a) Before color correction, (b) after color correction with the first-order regression method.
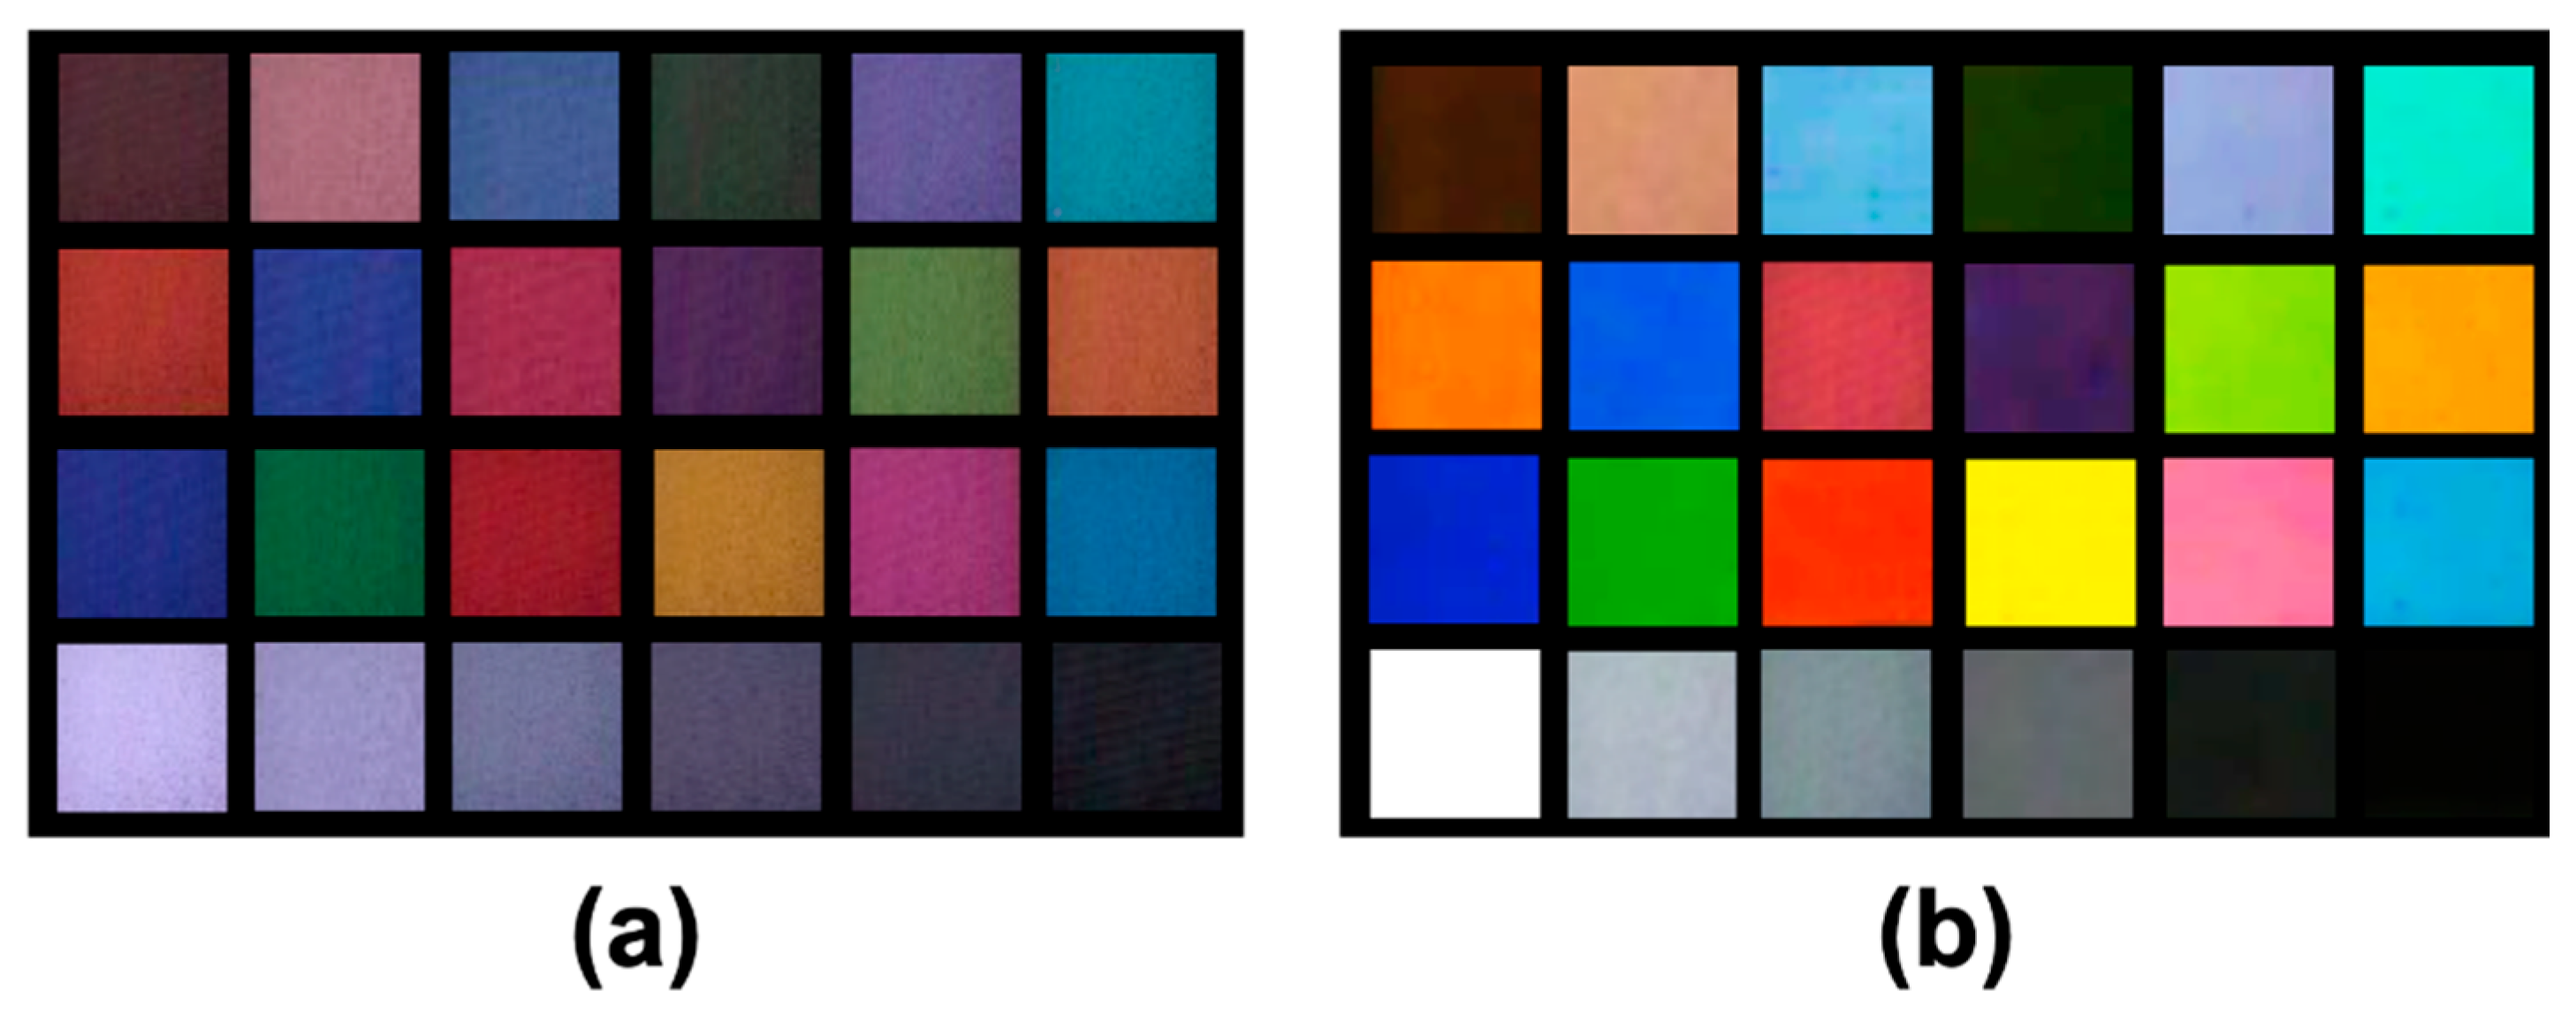
Figure 7.
CIE 1976 chromaticity diagram indicating the reference colors (blue points) and the measured colors recorded by the tauCAM (red points).
Figure 7.
CIE 1976 chromaticity diagram indicating the reference colors (blue points) and the measured colors recorded by the tauCAM (red points).
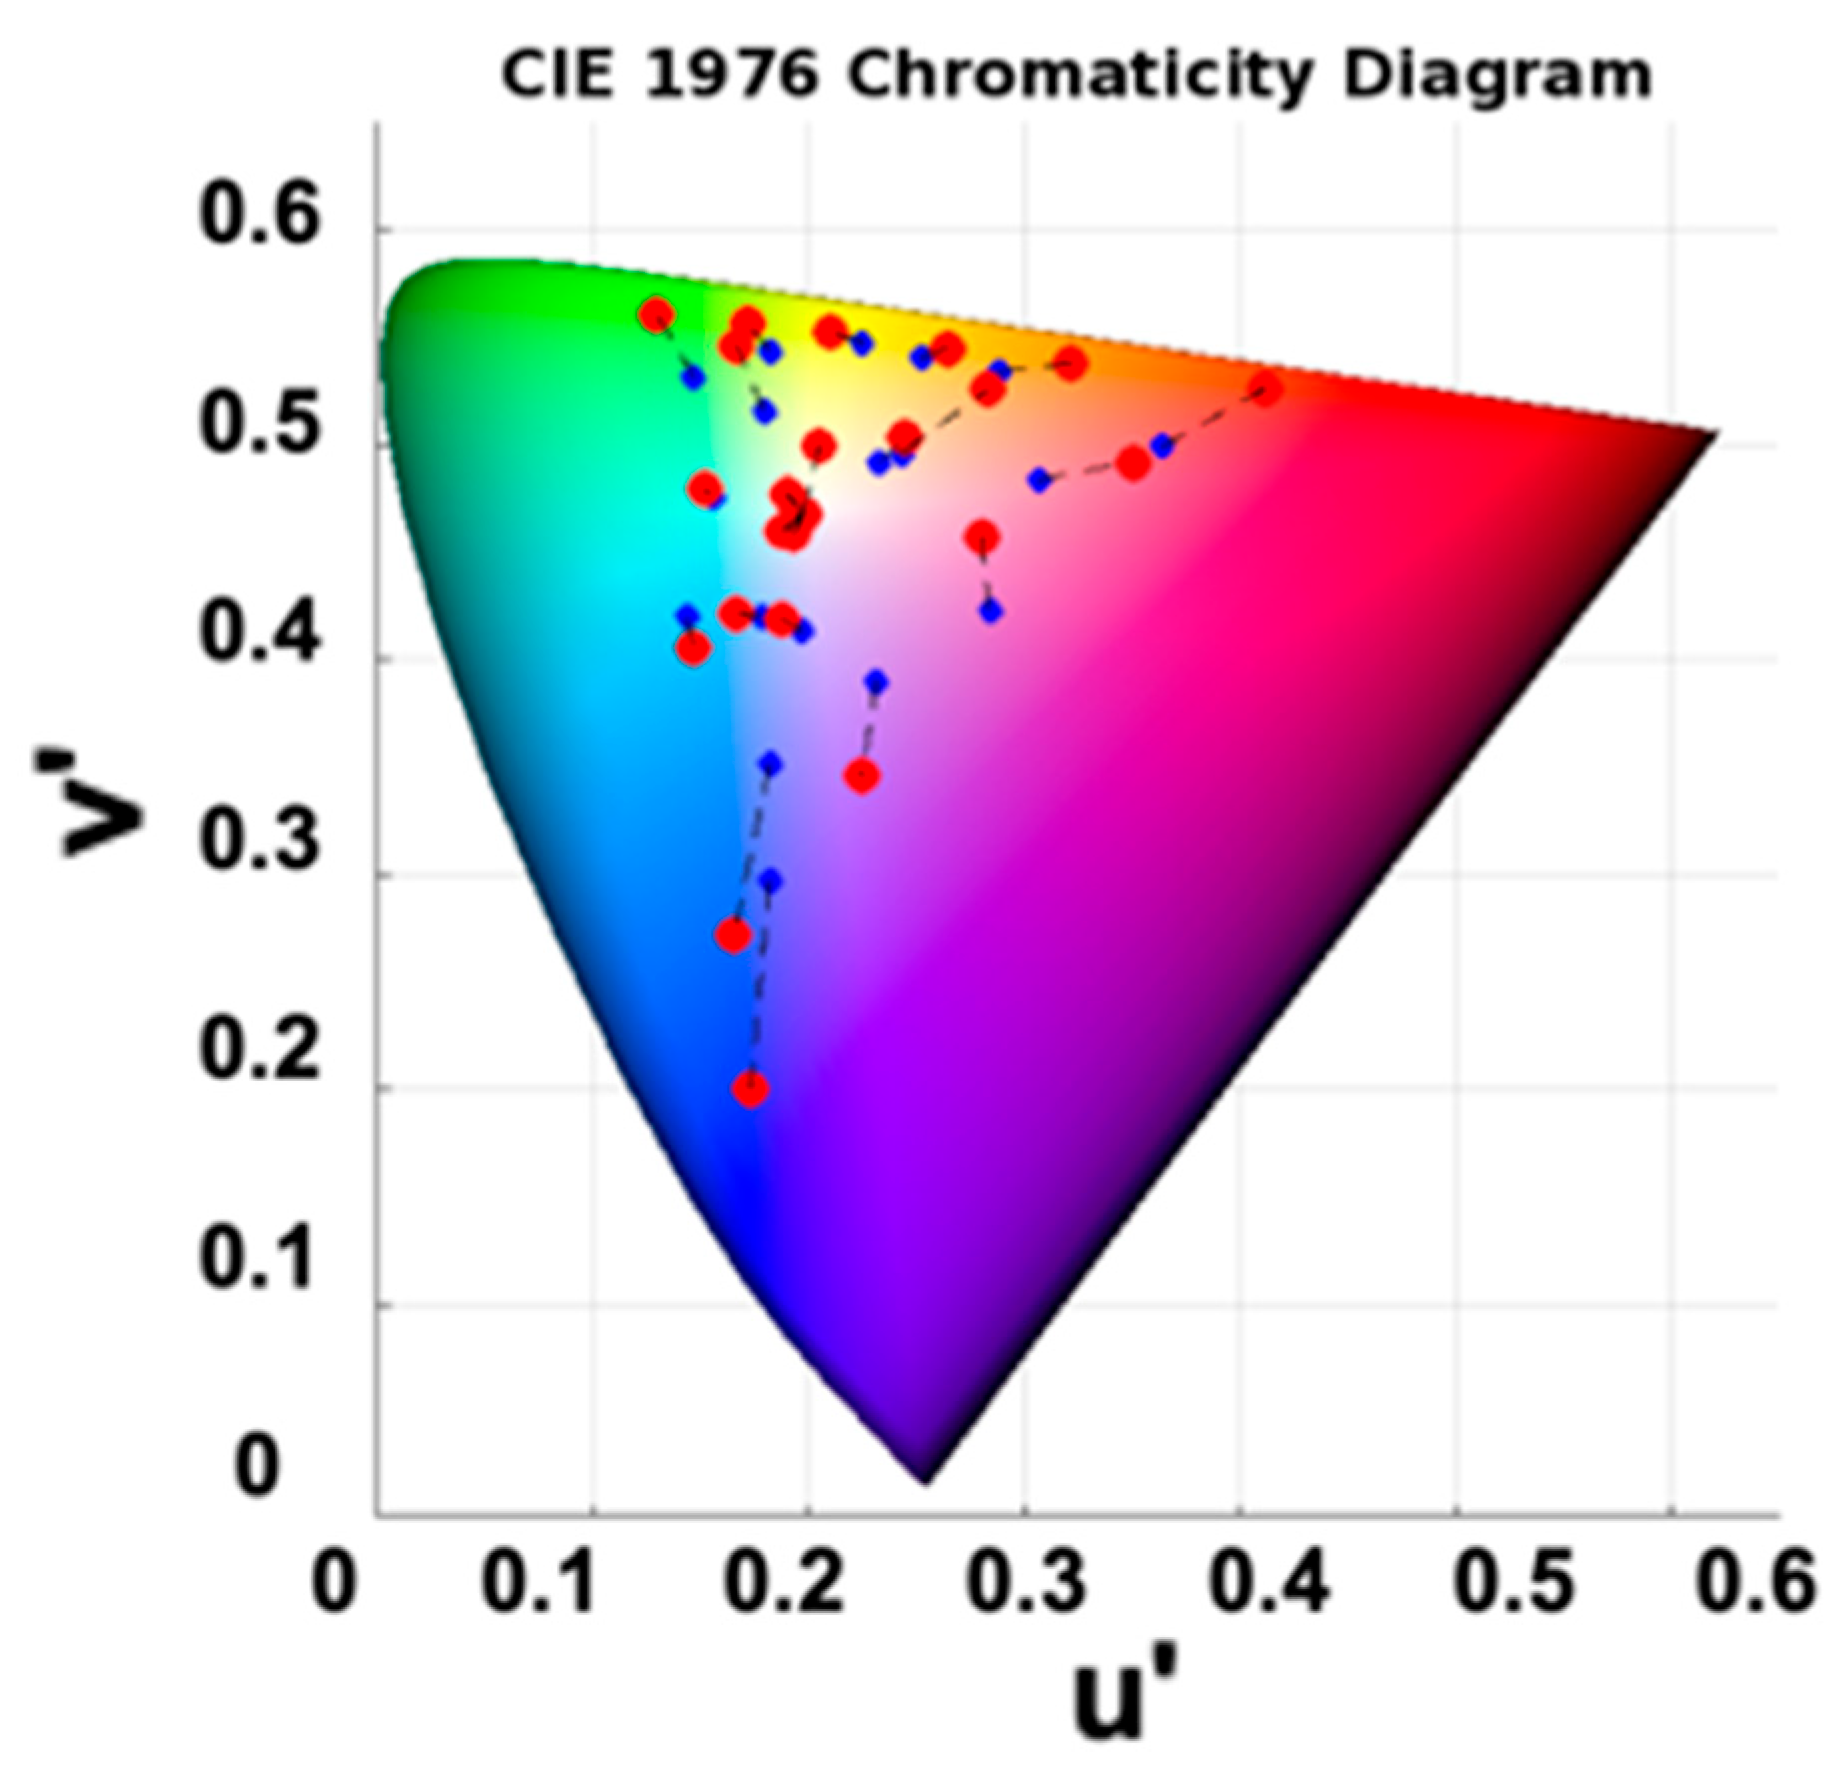
Figure 8.
Chromatic color differences () between measured and reference values for 24 color patches in the CIELAB space (after color correction). The black, red, and green dashed lines represent the perceptibility threshold (), acceptability threshold (), and the mean measured color difference (), respectively. Depending on the context of the application, points above the red line may be visually noticeable and considered unacceptable.
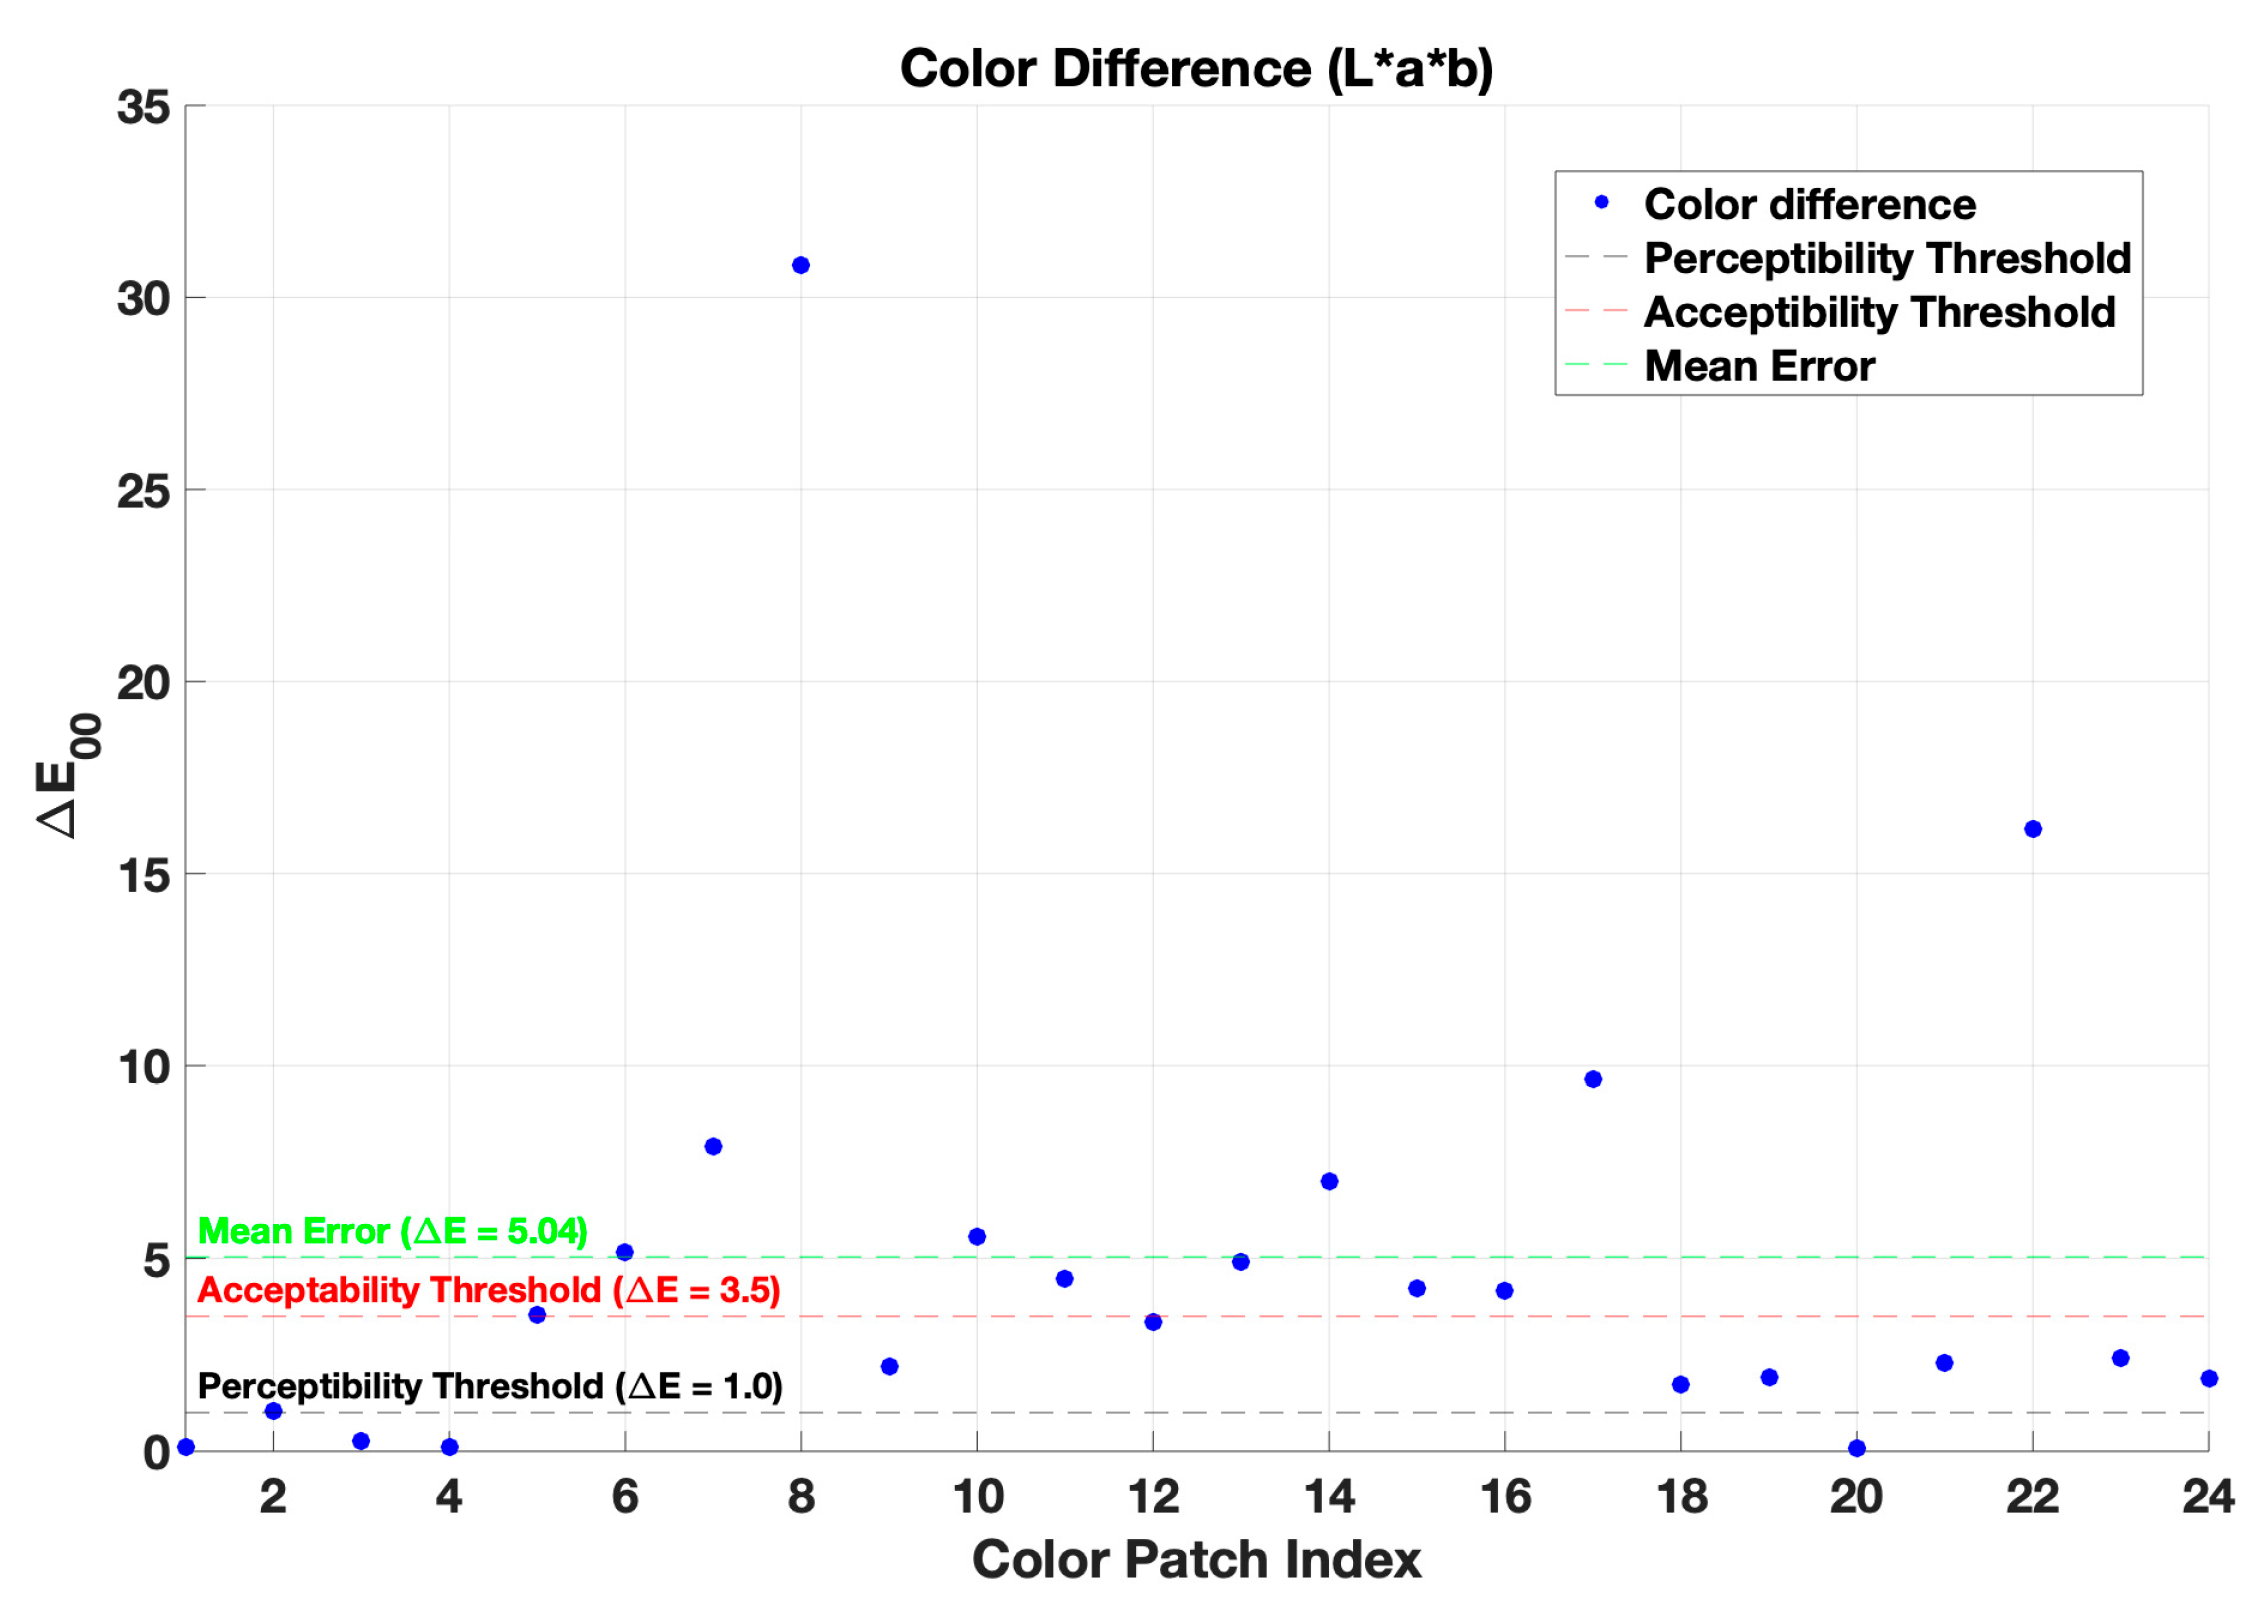
Figure 9.
A comparison of the recorded image by the tauCAM was made, and the color was corrected with (a) first-order regression and (b) non-linear regression.
Figure 9.
A comparison of the recorded image by the tauCAM was made, and the color was corrected with (a) first-order regression and (b) non-linear regression.
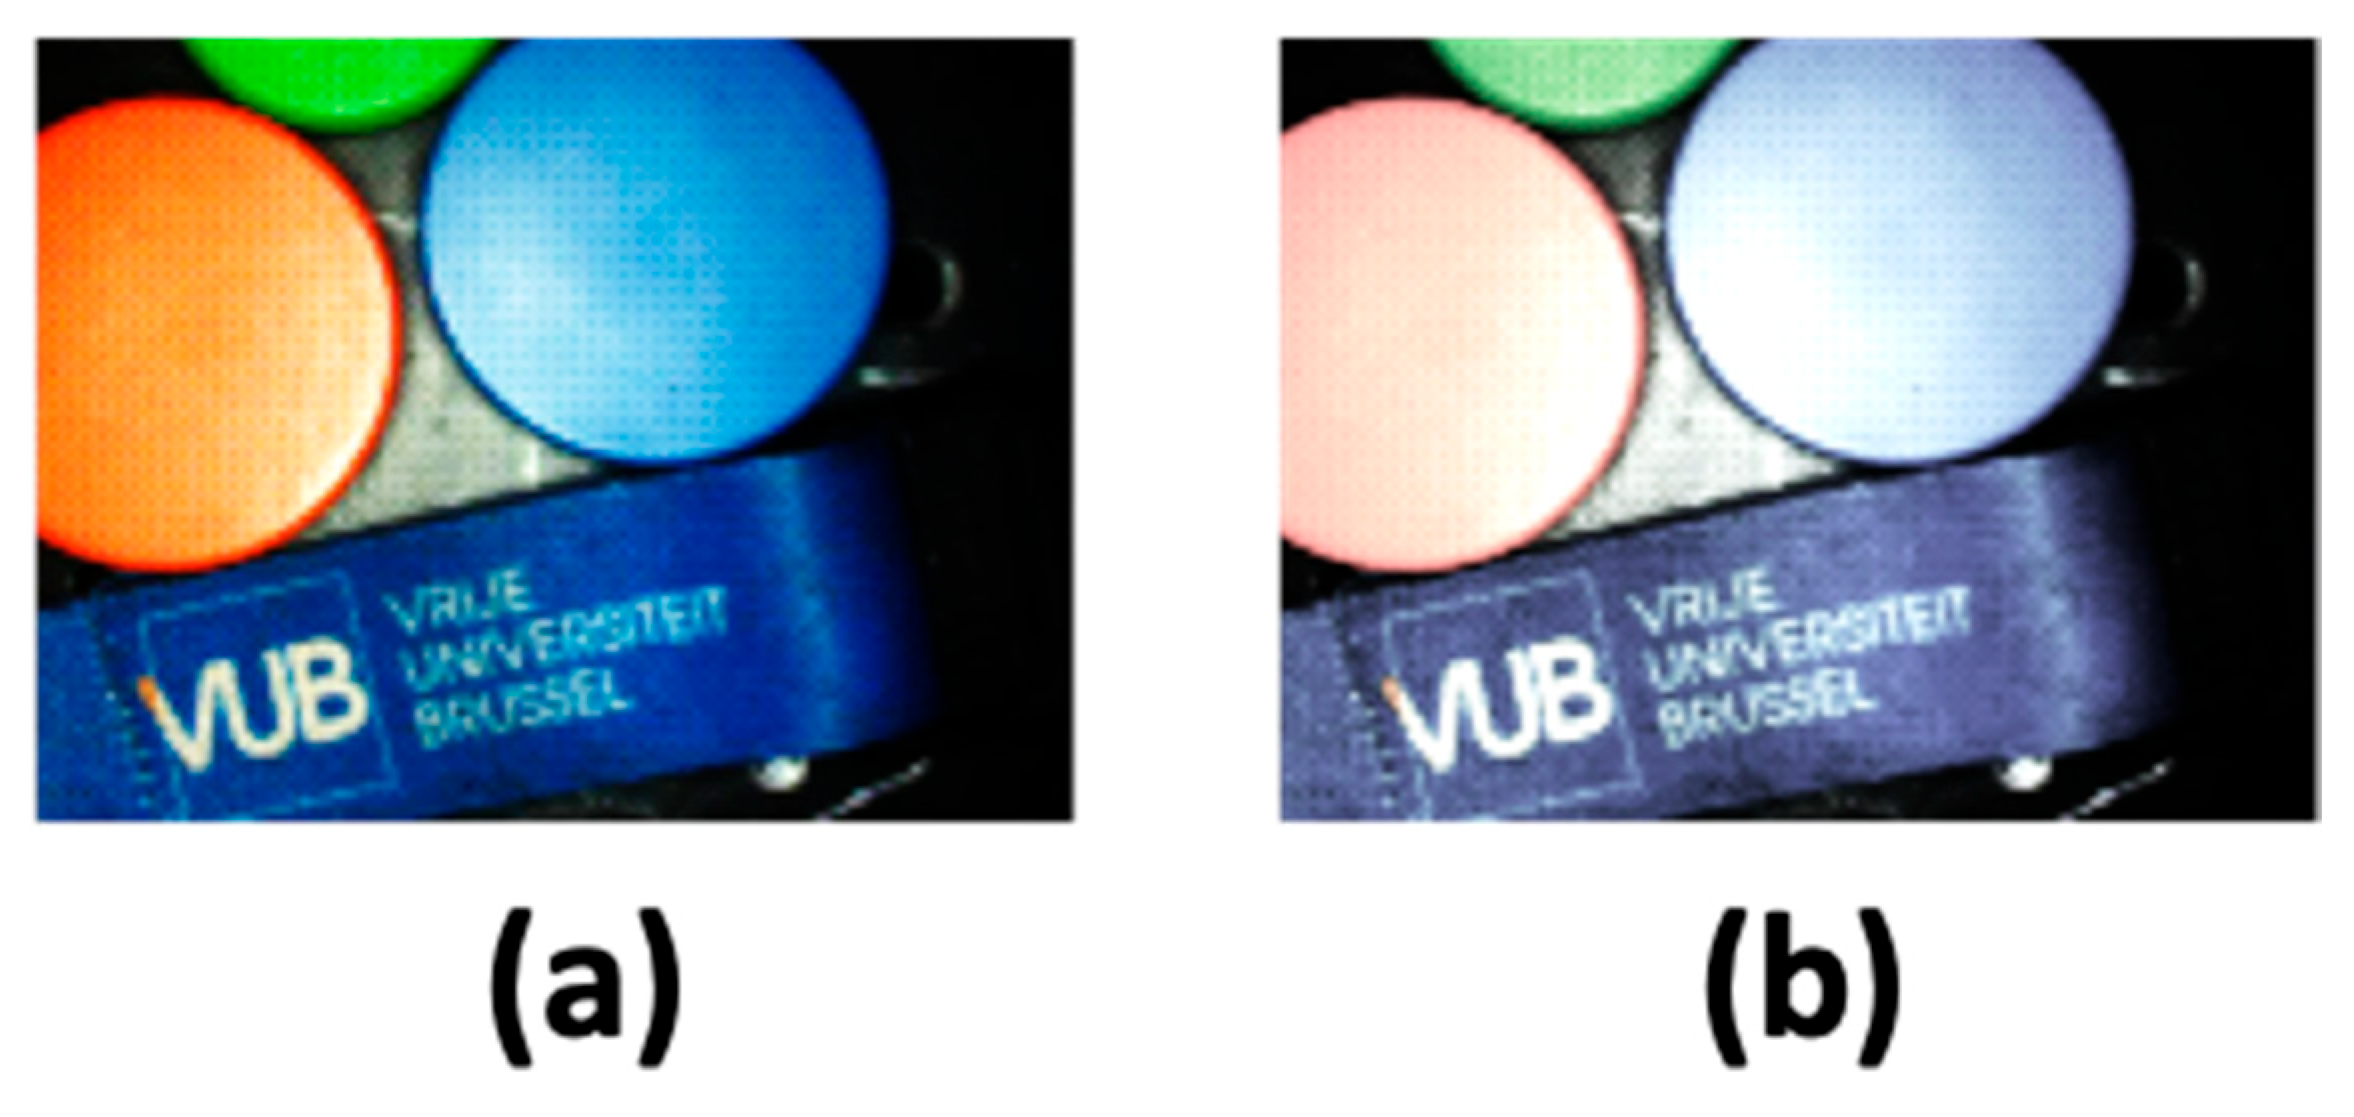
Figure 10.
The uniform ICG phantom is partially covered by colorful paper and illuminated with time-sequential RGB+NIR illumination, (a) white light image, (b) normalized fluorescence intensity image, (c) FLT image, and (d) the FTL image overlaid on top of the RGB image.
Figure 10.
The uniform ICG phantom is partially covered by colorful paper and illuminated with time-sequential RGB+NIR illumination, (a) white light image, (b) normalized fluorescence intensity image, (c) FLT image, and (d) the FTL image overlaid on top of the RGB image.
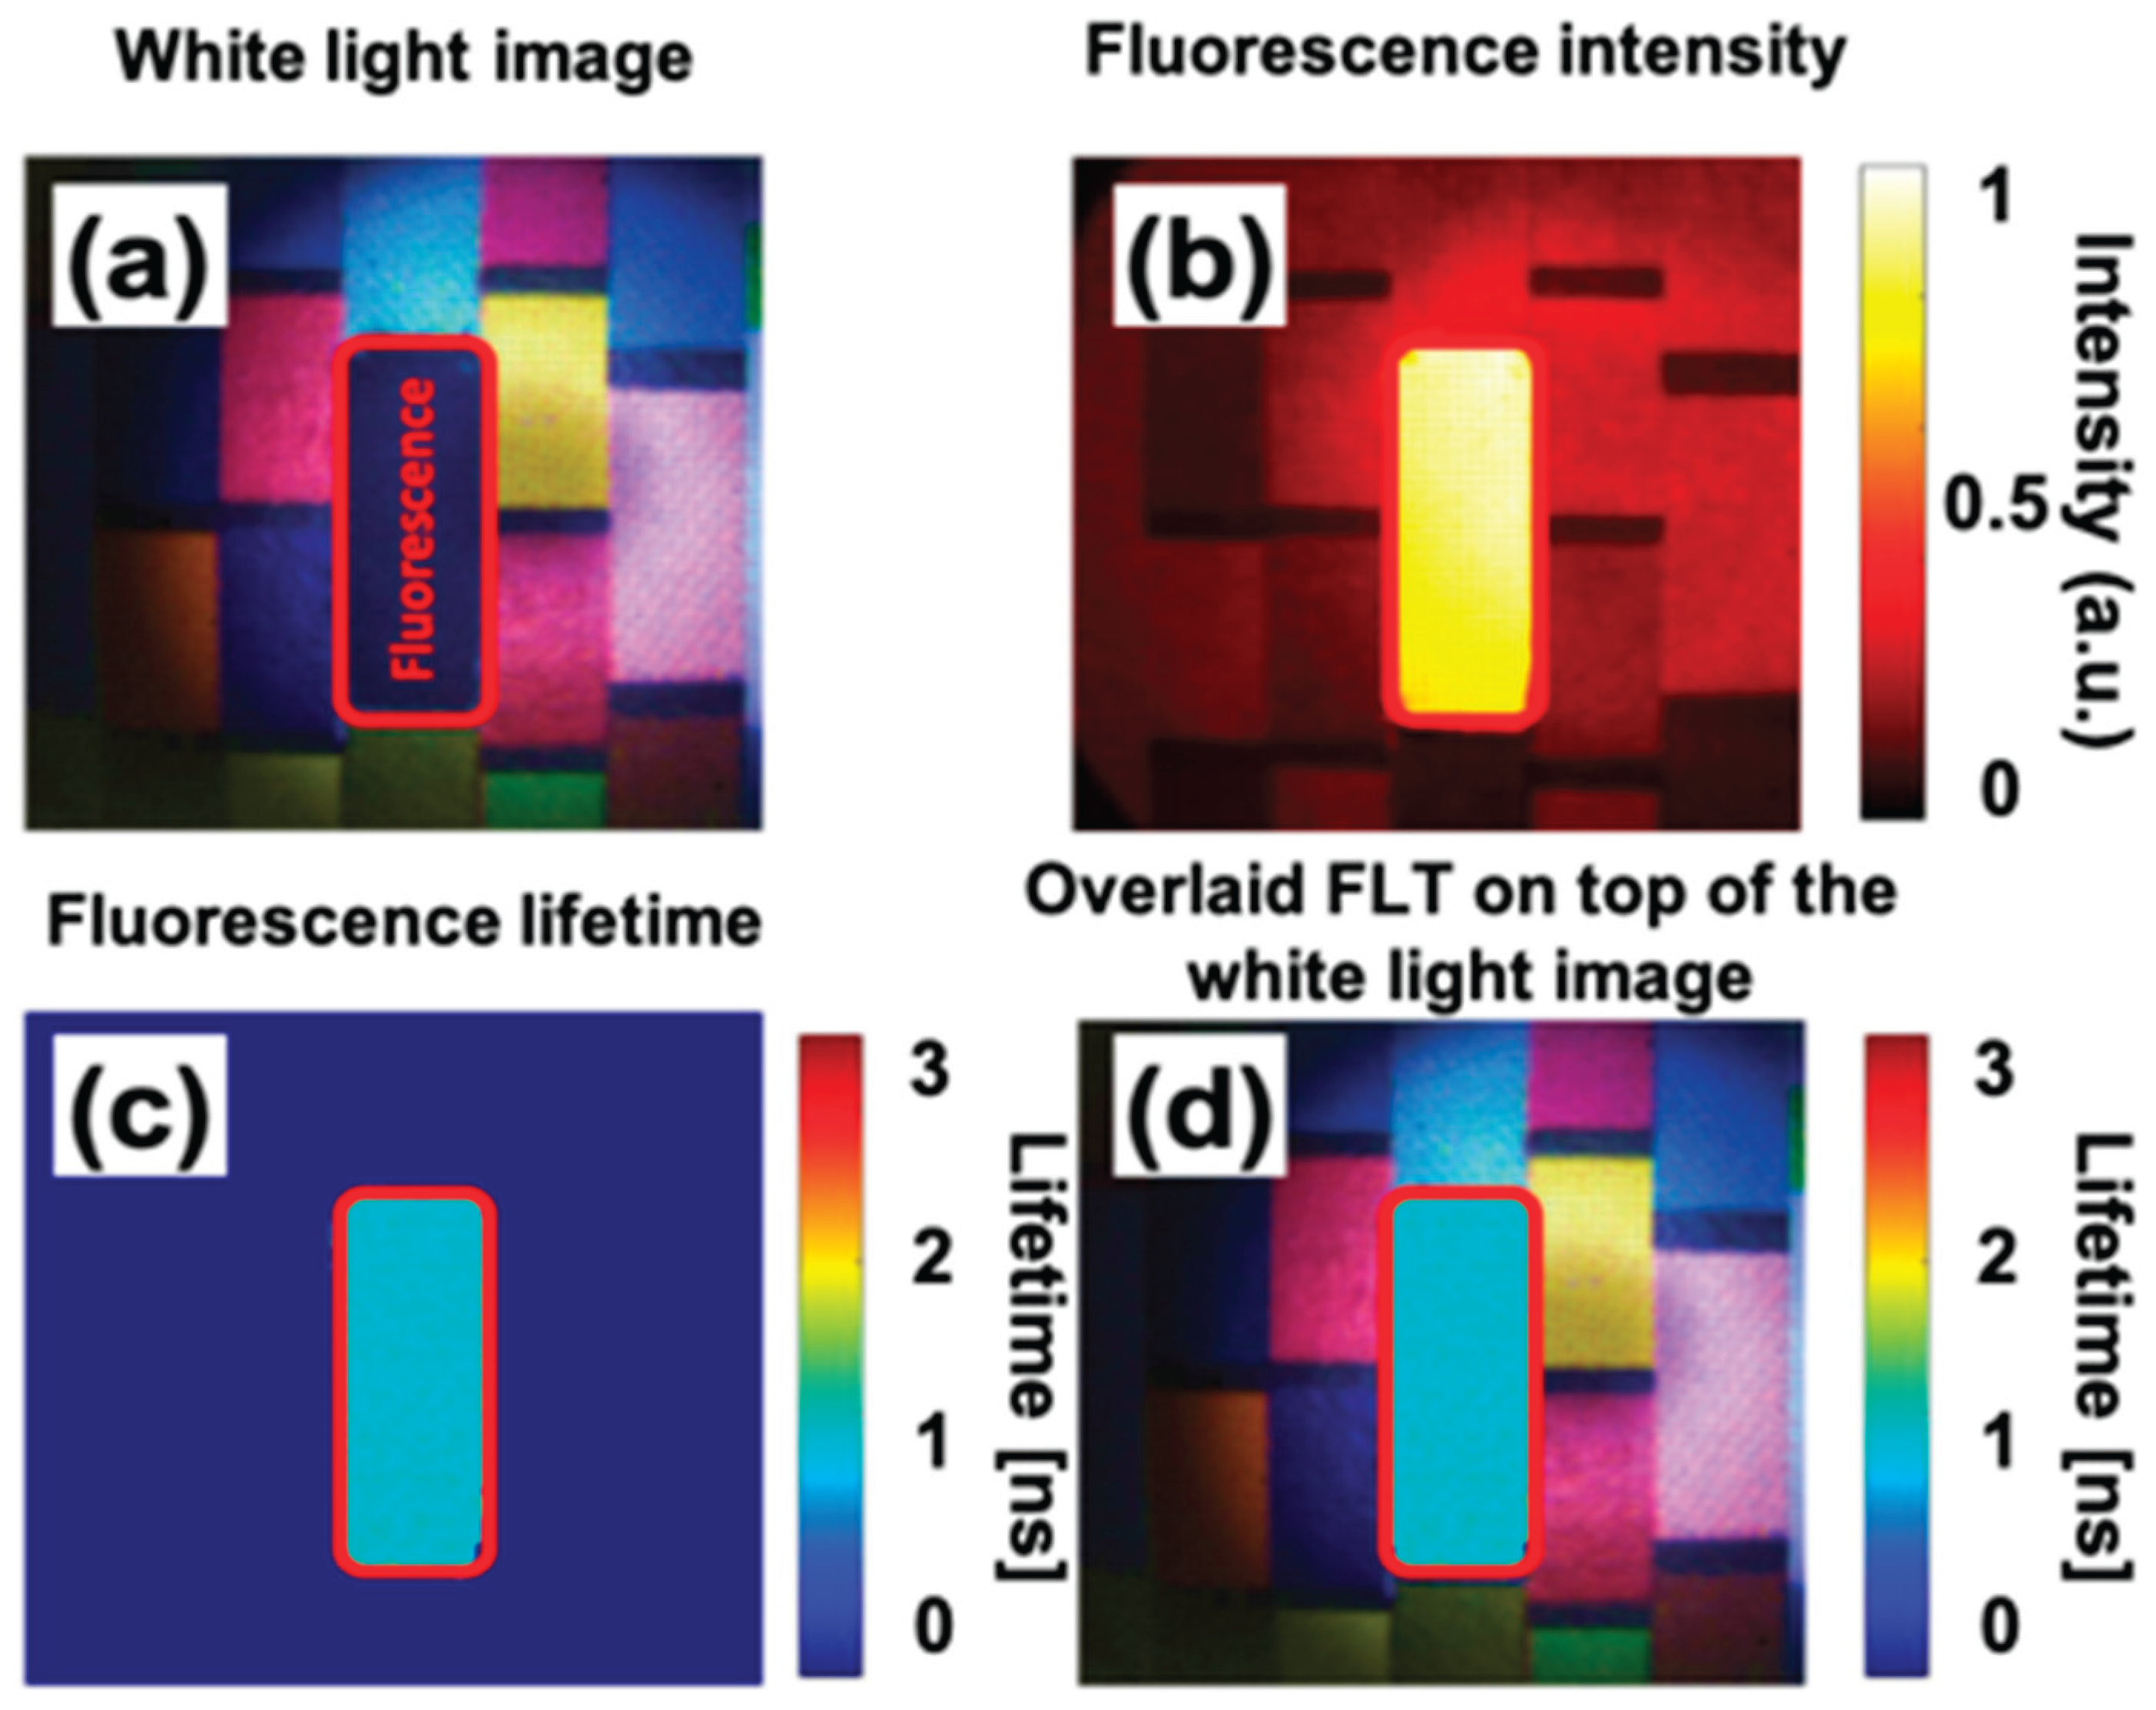

Table 1.
A comparison of the color accuracy of different color correction methods.
| Method | CIELAB ∆E00 |
Cross-validation CIELAB ∆E00 |
| Before color correction | 16.23 | --- |
| First-order regression | 5.04 | 7.26 |
| Non-linear regression | 2.12 | 9.71 |
Disclaimer/Publisher’s Note: The statements, opinions and data contained in all publications are solely those of the individual author(s) and contributor(s) and not of MDPI and/or the editor(s). MDPI and/or the editor(s) disclaim responsibility for any injury to people or property resulting from any ideas, methods, instructions or products referred to in the content. |
© 2025 by the authors. Licensee MDPI, Basel, Switzerland. This article is an open access article distributed under the terms and conditions of the Creative Commons Attribution (CC BY) license (https://creativecommons.org/licenses/by/4.0/).
Copyright: This open access article is published under a Creative Commons CC BY 4.0 license, which permit the free download, distribution, and reuse, provided that the author and preprint are cited in any reuse.


