
Submitted:
14 December 2025
Posted:
15 December 2025
You are already at the latest version
Abstract
Atmospheric deposition of emerging contaminants, including toxic trace elements, remains a critical environmental and public health concern. Moss biomonitoring offers a sensitive and cost-effective tool for assessing airborne pollutants, yet traditional analyses rely on descriptive statistics and lack predictive and mechanistic insight. Here, we introduce Mosses ML, a machine-learning–enhanced framework that integrates moss biomonitoring with bulk and dry deposition measurements to improve detection, interpretation and risk assessment of atmospheric contaminants. Using Hylocomium splendens transplants exposed for 90 days across industrial, urban and rural sites in Upper Silesia (Poland), we combined trace-element accumulation (Cd, Pb, Zn, Ni, Cr, Fe), relative accumulation factors (RAF), PCA-derived gradients, and site-level metadata with Random Forest and Gradient Boosting models. ML algorithms achieved high predictive performance (R² up to 0.91), accurately estimating moss metal concentrations from deposition metrics and environmental variables. SHAP feature-importance analysis identified dry deposition load and co-occurring metal signals as the dominant predictors of contamination, confirming the primary role of particulate emissions in shaping moss chemistry. Compared with classical threshold-based classification, the ML approach improved high-risk site identification by 24–38%. Mosses ML combines biologically meaningful indicators with modern computational tools, strengthening the role of mosses as early-warning systems for atmospheric pollution. The framework is broadly applicable to bryophyte biomonitoring and supports regulatory decision-making for emerging contaminants.
Keywords:
moss biomonitoring
; Hylocomium splendens
; machine learning
; SHAP
; Random Forest
; atmospheric deposition
; trace metals
Introduction
Monitoring emerging contaminants in the atmosphere remains a central challenge for environmental toxicology, public health and evidence-based risk assessment. Rapid industrialization, urban expansion and energy production have intensified emissions of toxic trace elements such as cadmium (Cd), lead (Pb), nickel (Ni), chromium (Cr) and zinc (Zn), all of which pose ecological and human-health risks due to their persistence, bioavailability and capacity for long-range atmospheric transport [5,16]. Traditional instrumental approaches for assessing airborne contaminants—including air filters and precipitation collectors—provide high analytical precision but are costly, labor-intensive and often unable to capture fine-scale spatial variability [2]. These limitations have led to the widespread adoption of terrestrial mosses as efficient biomonitors of atmospheric deposition within international initiatives such as UNECE ICP Vegetation [22]. Bryophytes, particularly pleurocarpous mosses such as Hylocomium splendens and Pleurozium schreberi, lack a root system and obtain nutrients exclusively from atmospheric inputs, making them sensitive integrators of both wet and dry deposition [4,19]. Their high cation-exchange capacity, surface roughness and morphological complexity facilitate the interception and retention of airborne particulate matter, including poorly soluble metal-bearing particles [11]. Active biomonitoring using transplanted mosses further reduces environmental variability and allows controlled exposure periods, improving comparability across sites and time [1,9]. Recent studies from Central Europe—including Upper Silesia—have shown pronounced spatial gradients in moss chemistry and elevated concentrations of industrially derived trace elements, especially in areas influenced by mining, metallurgical and coal-based activities [13]. Despite these strengths, conventional statistical approaches used in moss biomonitoring (ANOVA, PCA, correlation matrices) lack predictive capability and often fail to capture nonlinear interactions among deposition pathways (bulk vs dry), emission sources and biological accumulation processes. As emerging contaminants increasingly exhibit complex environmental behaviour, new analytical frameworks are needed to improve detection sensitivity, interpret high-dimensional datasets and support high-resolution environmental decision-making. Machine learning (ML) offers clear advantages in this context: algorithms such as Random Forests and Gradient Boosting can uncover hidden structure within environmental datasets, quantify feature importance and predict contamination risk with substantially greater accuracy than classical methods [7,10]. However, ML has not yet been systematically integrated into moss biomonitoring, and no standardized framework exists for combining bioaccumulation data with atmospheric deposition metrics to support predictive risk assessment. To address this gap, we developed Mosses ML, a comprehensive ML-enhanced workflow that integrates (i) trace-element concentrations in Hylocomium splendens transplants, (ii) bulk and dry deposition measurements, (iii) relative accumulation factors (RAF) and (iv) site-level environmental metadata (industrial, urban, rural). This framework builds on validated experimental datasets from Upper Silesia—one of the most heavily industrialized regions in Central Europe—where dry deposition has repeatedly been shown to dominate particulate-bound metal fluxes. To our knowledge, this is the first study to integrate explainable machine-learning methods (including SHAP analysis) with moss biomonitoring to quantitatively disentangle the relative contributions of dry and bulk deposition to trace-element accumulation. By combining RAF metrics, deposition measurements, multivariate ordination and predictive modelling, the Mosses ML framework provides a mechanistic and data-driven evaluation of atmospheric contamination that extends beyond traditional descriptive biomonitoring approaches. This methodological integration offers a generalizable template for assessing emerging contaminants using bryophyte-based monitoring systems. By incorporating machine learning, Mosses ML aims to:
• predict trace-metal concentrations in mosses from local environmental parameters;
• identify the most influential drivers of contamination using feature-importance and SHAP interpretability;
• classify sampling sites into contamination-risk categories with improved accuracy;
• provide a scalable tool applicable to other bryophyte species and to emerging contaminant groups beyond metals.
This study presents the development, validation and environmental application of the Mosses ML framework. By uniting established biomonitoring methods with modern computational tools, our approach enhances the interpretative and predictive power of moss-based assessments and strengthens their role as early-warning indicators within atmospheric pollution monitoring and regulatory policy.
Materials and Methods
Study Area and Sampling Design
The monitoring campaign was conducted in Upper Silesia (southern Poland), one of the most industrialized regions in Central Europe. The area is characterized by long-term emissions associated with mining, smelting, metallurgy and fossil-fuel combustion, resulting in elevated concentrations of metal-rich particulates. Fifteen sampling sites were classified into three categories representing a pollution gradient: industrial, urban, and rural. A reference site of low contamination was located near Roztoczański National Park. Site selection criteria included: (i) representativeness of land-use type, (ii) absence of canopy cover within a 5 m radius, and (iii) spatial separation sufficient to avoid cross-influence between sampling categories. Figure 1 illustrates the distribution of all locations.
Moss Transplant Preparation and Exposure Conditions
Hylocomium splendens was selected due to its established performance as a bioindicator of atmospheric contaminants. Moss cushions were collected from an uncontaminated forested area and prepared as 10–12 g composite samples. Material was gently cleaned of debris, placed onto polyethylene mesh pads, and transported to field sites. At each location, five replicates were positioned directly on the soil surface to ensure exposure to natural precipitation and airborne particulate flux. Transplants were positioned in open areas to avoid canopy drip and ensure uniform exposure. Transplants remained in the field for 90 days, with intermediate collection at day 45. Initial (day 0) metal concentrations were measured to calculate Relative Accumulation Factors (RAF) and to provide baseline information for ML models.
Bulk (Wet) Deposition Sampling
Bulk deposition was sampled using polyethylene collectors equipped with 2 L bottles and 10 cm funnels covered by nylon mesh to prevent coarse debris ingress. Collectors were mounted 1.5 m above the ground, with five replicates per site. Thymol was added to inhibit microbial growth. After each precipitation event, samples were transported under cooled conditions and filtered through 0.45 µm cellulose filters. Filtered samples were pooled and analyzed for trace elements after 45 and 90 days of exposure.
Dry Deposition Sampling
Dry deposition was quantified using glass plates (80 mm diameter) coated uniformly with pharmaceutical-grade white petrolatum. The plates were pre-weighed (±0.2 mg) after gentle heating (42 °C) to standardize the adhesive layer. Five plates were deployed per site for the full 90-day period. Particles adhering to the plates were removed with hexane, filtered onto ash-free cellulose filters, dried, combusted, and digested for elemental determination.
Chemical Analysis of Moss and Deposition Samples
Moss, bulk-deposition, and dust samples were digested using a mixture of ultrapure HNO3 (65%) and HClO4 (70%) in a microwave digestion system. Elemental concentrations were determined via Flame Atomic Absorption Spectroscopy (FAAS) for Fe, K, Mg, Mn, Zn and via Electrothermal Atomic Absorption Spectroscopy (ETAAS) for Cd, Co, Cr, Cu, Ni, Pb and V, using an AVANTA AAS instrument [14]. Quality control was ensured by analysis of Certified Reference Materials (M2 and M3 moss standards from Finland). Water analysis was validated using SPS-SW1 reference material. All laboratory procedures followed standard QA/QC protocols recommended for moss biomonitoring within ICP Vegetation.
Calculation of Relative Accumulation Factors (RAF)
Relative accumulation factors were calculated to quantify metal enrichment relative to initial concentrations:
where Cinitial represents trace-element concentrations in moss material before transplantation, and Cexposed corresponds to values after 90 days.
RAF = Cexposed−Cinitial \ Cinitial
Data Preprocessing for Machine Learning
Moss chemistry, bulk and dry deposition datasets, and site metadata were merged into a unified analytical matrix. Preprocessing included outlier removal (>3×IQR), k-nearest neighbor imputation for missing values, log-transformation of skewed variables and z-score standardization applied within cross-validation folds to prevent data leakage. PCA was used as optional dimensionality reduction.
Machine-Learning Models and Workflow
Three model families were employed: Random Forest Regressor [7], Gradient Boosting Regressor [10], PCA-enhanced Gradient Boosting (hybrid approach). The predictive targets were moss concentrations of Cd, Pb, Zn, Ni, Cr and Fe. Input features included deposition metrics, RAF values, and site categories. Model evaluation used 10-fold cross-validation with performance metrics: R², RMSE, MAE. Feature importance scores were extracted using impurity-based metrics and SHAP analysis.
Risk Classification Model
Sites were assigned to low, moderate or high contamination classes based on ML-derived thresholds for predicted metal concentrations and deposition loadings. Classification performance was compared with a classical threshold-based approach using accuracy, F1-score and ROC metrics.
Software
Analyses were conducted in Python 3.11 (scikit-learn, pandas, numpy, shap) and R 4.3.1 for PCA visualization.
Discussion
Descriptive statistics for metal concentrations in moss transplants are shown in Table 1. Metal concentrations in Hylocomium splendens transplants showed a clear spatial gradient consistent with the pollution regime of Upper Silesia, with industrial sites exhibiting the highest enrichment of Pb, Cd, Zn, Fe, Ni and Cr (Figure 2). Rural sites displayed the lowest levels, while urban sites showed intermediate contamination. These patterns reflect the well-known influence of mining, smelting and fossil-fuel combustion in the region [8,15]. The strong accumulation of Pb, Cd, Zn and Fe aligns with previous evidence that H. splendens efficiently captures particulate-bound metals due to its high surface area and cation-exchange properties [4,19]. Relative accumulation factors (RAF) calculated after 90 days confirmed this gradient. RAF values for all metals and site categories are summarized in Table 2. Industrial locations showed the highest enrichment for nearly all elements, particularly Pb, Cd, Zn and Fe—metals known to form strong bonds with moss exchange sites and therefore retained efficiently [6]. The consistently negative or negligible RAF values for Mn reproduced a well-documented pattern of leaching and active washout from moss tissues [3]. These RAF dynamics collectively indicate that enriched atmospheric deposition, especially from particulate sources, is the dominant mechanism driving metal uptake in transplanted mosses. The comparison between atmospheric deposition and moss chemistry revealed complementary roles of bulk and dry deposition pathways. Bulk deposition showed moderate correlations with moss concentrations (Table 3), particularly for more soluble metals such as Cd, Ni and Zn, supporting earlier observations that wet deposition can contribute to moss uptake under certain conditions [1,5]. However, dry deposition (Table 4) exerted a consistently stronger influence across all site categories. Dust collected from deposition plates contained substantially higher concentrations of Pb, Zn, Cr, Fe and Cu than bulk precipitation, confirming that particulate emissions dominate metal transport in this region [20]. Correspondingly, the strongest moss–deposition correlations were observed for dust, encompassing Cd, Cr, Cu, Mn, Ni, Pb and Zn at industrial sites and multiple metals at urban and rural sites. These results support the established view that H. splendens primarily accumulates metals through passive interception of dry and coarse particulate deposition [11,18,21]. Multivariate analyses further clarified these gradients. The PCA of standardized moss-metal concentrations showed strong separation among rural, urban and industrial clusters (Figure 3). Together, PC1 and PC2 explained ~86% of total variance, with Pb, Cd, Zn, Fe and Cr loading strongly on PC1. The biplot confirmed co-occurrence of metals associated with metallurgical and mining emissions, reinforcing the interpretation that spatial patterns in moss chemistry reflect regional industrial sources. Rural sites grouped tightly with low metal concentrations, while industrial sites aligned with high positive PC1 scores, indicating strong particulate exposure. Machine-learning models provided an additional layer of quantitative insight. Predictive performance metrics for all ML models are summarized in Table 5. Random Forest regression achieved high predictive performance for key metals—R² values reached ~0.90 for Pb, Cd and Zn—demonstrating that moss metal concentrations can be accurately reconstructed from deposition metrics and site characteristics (Figure 4). Feature ranking under the Random Forest model (Figure 5 and Table 6) indicates that dry deposition load and co-occurring metals were the dominant predictors.Predicted-versus-observed plots showed points clustering closely around the 1:1 line, and low RMSE values further confirmed robust model behaviour. The strong performance of ensemble algorithms is consistent with their effectiveness in capturing complex nonlinear relationships in environmental datasets [7,10]. Explainable ML analyses revealed mechanistic drivers underlying these predictions. SHAP global importance rankings identified dry deposition mass and the concentrations of co-occurring metals (notably Fe, Zn, Cu and Ni) as the most influential predictors of Pb accumulation, surpassing bulk deposition and categorical site descriptors (Figure 6). This aligns with chemical evidence that industrial particulates share mixed metal compositions and are deposited simultaneously onto moss surfaces. SHAP dependence plots for Fe-Pb and Zn-Pb further demonstrated nonlinear response curves with saturation zones, revealing interactions that would remain undetected in classical parametric models. The explainability suite therefore strengthened the mechanistic interpretation that particulate transport is the principal vector governing Pb and related metal uptake in H. splendens. Taken together, these results show that transplanted H. splendens reliably integrates signals of both coarse and fine particulate pollution across heterogeneous landscapes. Dry deposition emerged as the predominant determinant of moss chemistry, while bulk deposition played a secondary role for more soluble elements. The ML-enhanced analytical framework—combining deposition measurements, bioaccumulation data, multivariate analysis and model interpretability—offers a powerful extension to established ICP Vegetation protocols, allowing both predictive assessment and mechanistic insight. Such integrative approaches can improve spatial resolution in pollution monitoring, strengthen environmental risk assessments and be readily extended to other moss species, pollutant classes and multi-year biomonitoring programs. This study has several limitations. First, the relatively small number of sampling sites (n = 15) restricts the complexity of the ML models and may limit generalizability to other regions. Second, the dataset contains only short-term (90-day) exposure measurements; multi-season or multi-year campaigns would improve robustness of predictive modelling. Third, metal uptake by mosses reflects both depositional fluxes and species-specific physiological processes, meaning that environmental drivers unrelated to atmospheric inputs (e.g., humidity, microhabitat) could introduce noise. Finally, the ML models were trained on a single regional dataset without external validation, and future work should incorporate cross-regional or cross-species transferability tests to confirm the scalability of the Mosses ML framework.
Conclusions
This study demonstrates that integrating machine-learning techniques with traditional moss biomonitoring yields a significantly enhanced analytical framework for assessing atmospheric contamination. Hylocomium splendens transplants proved to be highly effective bioindicators of particulate-bound metals, consistently reflecting the strong industrial pollution gradient observed across the study area. The dominance of dry deposition as a predictor of metal uptake confirms that mosses act primarily as collectors of airborne particulates [18,21], a finding further supported by high RAF values, PCA separation, and SHAP-based mechanistic insights. The Mosses ML workflow achieved high predictive accuracy for key contaminants, surpassing the diagnostic capacity of classical statistical approaches. Its improved risk classification and transparent model interpretability address long-standing challenges in biomonitoring, particularly in complex industrial landscapes where pollutant sources co-occur. By combining biological indicators, deposition measurements and advanced computational tools, this framework enhances environmental surveillance and provides a scalable, transferable model for future biomonitoring initiatives, including multi-year monitoring, cross-regional comparisons, and assessments of emerging contaminants.
Author Contributions
Conceptualization, G.K.; methodology, G.K.; software, G.K.; validation, G.K.; formal analysis, G.K.; K.M. investigation, G.K.; resources, G.K.; data curation, G.K.; writing—original draft preparation, G.K.; K.M. writing—review and editing, G.K.; visualization, G.K.; supervision, G.K. All authors have read and agreed to the published version of the manuscript.
Funding
This research received no external funding.
Institutional Review Board Statement
Not applicable.
Informed Consent Statement
Not applicable.
Data Availability Statement
The datasets generated and analyzed during this study are available from the corresponding author upon reasonable request. Machine-learning scripts and preprocessing workflows will be made available in a public repository upon publication.
Conflicts of Interest
The author declares no conflict of interest.
References
- Aboal, J.R.; Fernández, J.A.; Boquete, M.T.; Carballeira, A. Is it possible to estimate atmospheric deposition of heavy metals by analysis of terrestrial mosses? Sci. Total Environ. 2010, 408, 6291–6297. [Google Scholar] [CrossRef] [PubMed]
- Ares, A.; Aboal, J.R.; Carballeira, A.; Giordano, S.; Adamo, P.; Fernández, J.A. Moss bag biomonitoring: A methodological review. Sci. Total Environ. 2012, 432, 143–158. [Google Scholar] [CrossRef] [PubMed]
- Aničić, M.; Tasić, M.; Frontasyeva, M.V.; Tomašević, M.; Rajšić, S.; Mijić, Z.; Popović, A. Active moss biomonitoring of trace elements with Sphagnum girgensohnii moss bags in relation to atmospheric bulk deposition in Belgrade, Serbia. Environ. Pollut. 2009, 157, 673–679. [Google Scholar] [CrossRef] [PubMed]
- Berg, T.; Røyset, O.; Steinnes, E. Moss (Hylocomium splendens) used as biomonitor of atmospheric trace element deposition: Estimation of uptake efficiencies. Atmos. Environ. 1995, 29, 353–360. [Google Scholar] [CrossRef]
- Berg, T.; Steinnes, E. Use of mosses (Hylocomium splendens and Pleurozium schreberi) as biomonitors of heavy metal deposition: From relative to absolute deposition values. Environ. Pollut. 1997, 98, 61–71. [Google Scholar] [CrossRef] [PubMed]
- Boquete, M.T.; Fernández, J.A.; Carballeira, A.; Aboal, J.R. Relationship between trace metal concentrations in the terrestrial moss Pseudoscleropodium purum and in bulk deposition. Environ. Pollut. 2015, 201, 1–9. [Google Scholar] [CrossRef] [PubMed]
- Breiman, L. Random forests. Mach. Learn. 2001, 45, 5–32. [Google Scholar] [CrossRef]
- Cabała, J.; Krupa, P.; Misz-Kennan, M. Heavy metals in mycorrhizal rhizospheres contaminated by Zn–Pb mining and smelting around Olkusz in Southern Poland. Water Air Soil Pollut. 2009, 199, 139–149. [Google Scholar] [CrossRef]
- Fernández, J.A.; Aboal, J.R.; Couto, J.A.; Carballeira, A. Sampling optimization at the sampling-site scale for monitoring atmospheric deposition using moss chemistry. Atmos. Environ. 2002, 36, 1163–1172. [Google Scholar] [CrossRef]
- Friedman, J.H. Greedy function approximation: A gradient boosting machine. Ann. Stat. 2002, 29, 1189–1232. [Google Scholar] [CrossRef]
- Halleraker, J.H.; Reimann, C.; de Caritat, P.; Finne, T.; Kashulina, G.; Niskavaara, H.; Bogatyrev, I. Reliability of moss (Hylocomium splendens and Pleurozium schreberi) as bioindicators of atmospheric chemistry in the Barents region: Interspecies and field duplicate variability. Sci. Total Environ. 1998, 218, 123–139. [Google Scholar] [CrossRef]
- Hou, A.; Zhang, S.; Lin, X.; Norris, P.; da Silva, A. Cloud/precipitation assimilation using the forecast model as a weak constraint. In Proc. Int. Workshop on Assimilation of Satellite Cloud and Precipitation Observations in NWP Models; NOAA: Lansdowne, VA, USA, 2005. [Google Scholar] [CrossRef]
- Kosior, G.; Samecka-Cymerman, A.; Brudzińska-Kosior, A. Transplanted moss Hylocomium splendens as a bioaccumulator of trace elements from different categories of sampling sites in the Upper Silesia area (SW Poland): Bulk and dry deposition impact. Bull. Environ. Contam. Toxicol. 2018, 100, 1–13. [Google Scholar] [CrossRef] [PubMed]
- Lajunen, L.H.J.; Perämäki, P. Spectrochemical Analysis by Atomic Absorption and Emission; Royal Society of Chemistry: Cambridge, UK, 2004. [Google Scholar] [CrossRef]
- Magiera, T.; Strzyszcz, Z.; Rachwał, M. Mapping particulate pollution loads using soil magnetometry in urban forests in the Upper Silesia Industrial Region, Poland. For. Ecol. Manag. 2007, 248, 36–42. [Google Scholar] [CrossRef]
- Markert, B.A.; Breure, A.M.; Zechmeister, H.G. Bioindicators and Biomonitoring; Elsevier: Amsterdam, The Netherlands, 2003. [Google Scholar]
- Olszowski, T.; Tomaszewska, B.; Góralna-Włodarczyk, K. Air quality in a non-industrialised area in the typical Polish countryside based on measurements of selected pollutants in immission and deposition phase. Atmos. Environ. 2012, 50, 139–147. [Google Scholar] [CrossRef]
- Steinnes, E. A critical evaluation of the use of naturally growing moss to monitor the deposition of atmospheric metals. Sci. Total Environ. 1995, 160–161, 243–249. [Google Scholar] [CrossRef]
- Steinnes, E.; Hanssen, J.E.; Rambæk, J.P.; Vogt, N.B. Atmospheric deposition of trace elements in Norway: Temporal and spatial trends studied by moss analysis. Water Air Soil Pollut. 1994, 74, 121–140. [Google Scholar] [CrossRef]
- Theodosi, C.; Markaki, Z.; Tselepides, A.; Mihalopoulos, N. The significance of atmospheric inputs of soluble and particulate major and trace metals to the eastern Mediterranean seawater. Mar. Chem. 2010, 120, 154–163. [Google Scholar] [CrossRef]
- Tretiach, M.; Pittao, E.; Crisafulli, P.; Adamo, P. Influence of exposure sites on trace element enrichment in moss-bags and characterization of particles deposited on the biomonitor surface. Sci. Total Environ. 2011, 409, 822–830. [Google Scholar] [CrossRef]
- UNECE ICP Vegetation. Heavy Metals in European Mosses: 2000/2001 Survey; Centre for Ecology & Hydrology, University of Wales: Bangor, UK, 2003. [Google Scholar]
Figure 1.
Location of the study area. Symbols: filled square – rural, filled circle – urban, filled diamond – industrial, C – control.
Figure 1.
Location of the study area. Symbols: filled square – rural, filled circle – urban, filled diamond – industrial, C – control.
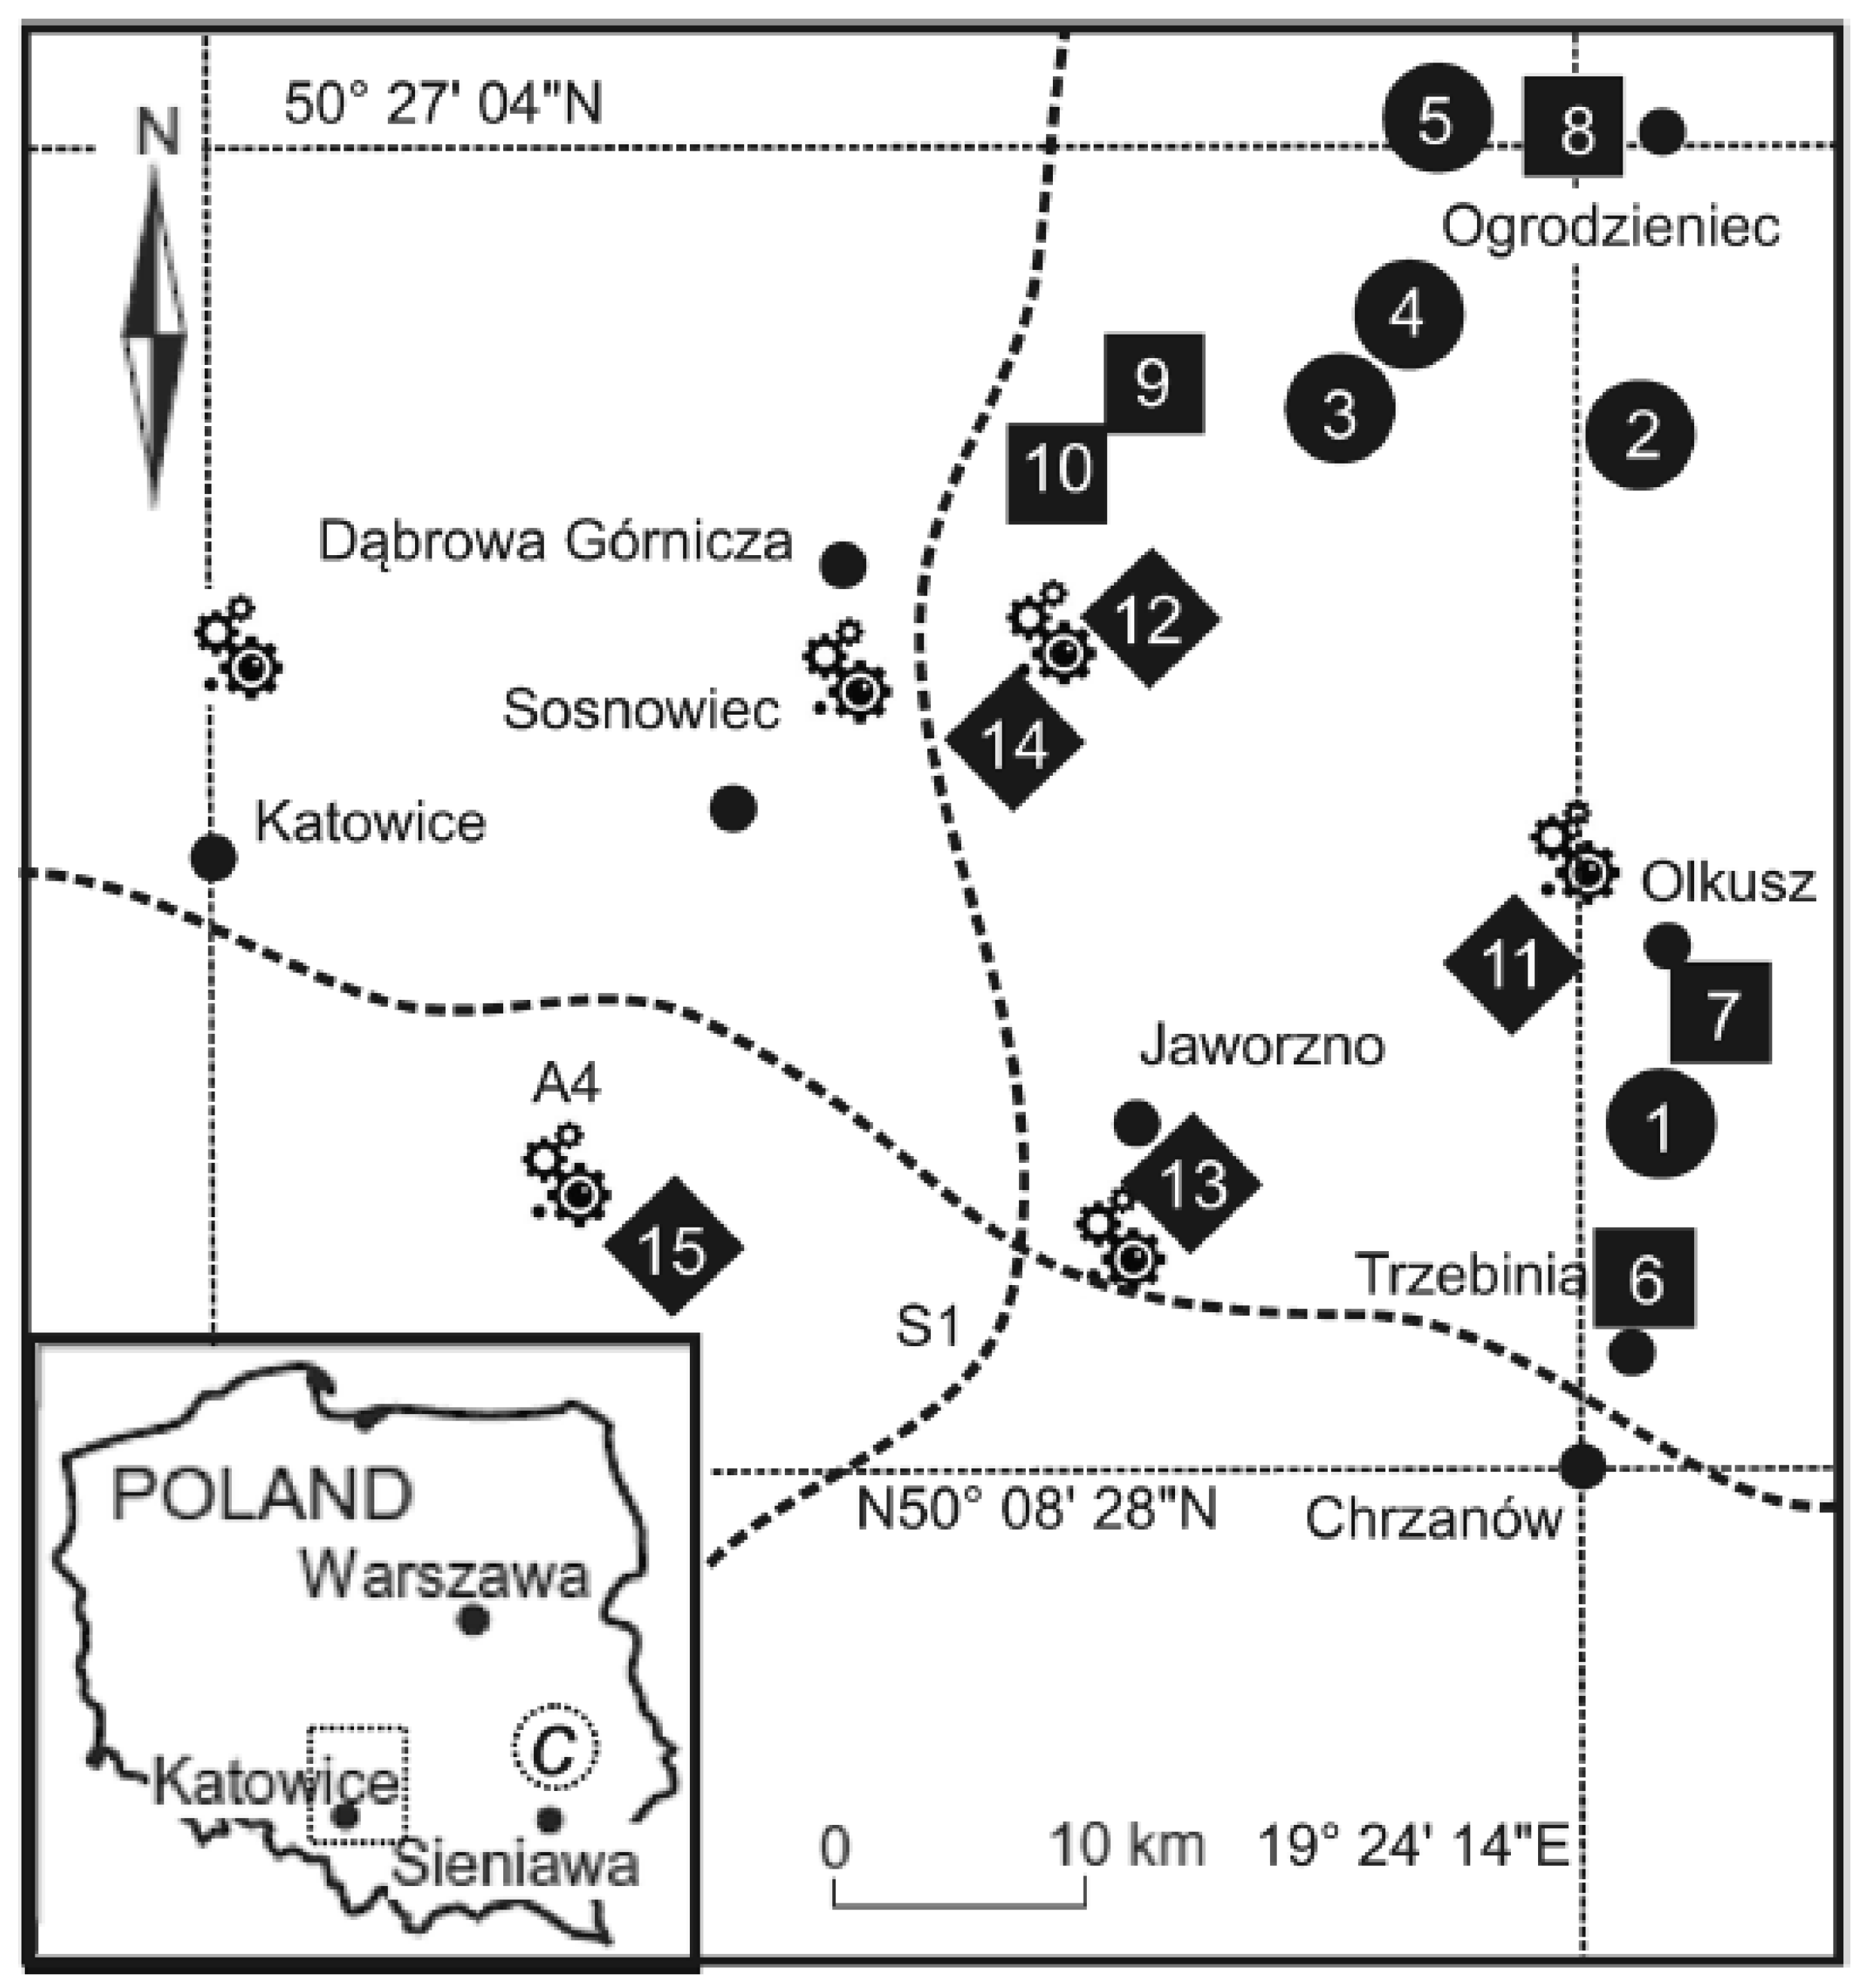
Figure 2.
Standardized (z-score) mean concentrations of selected metals (Cd, Cr, Ni, Pb, Zn, Fe) in Hylocomium splendens transplants after 90 days of exposure, grouped by site type (rural, urban, industrial). Values are based on the preprocessed Mosses ML dataset (log₁₀–transformed and standardized).
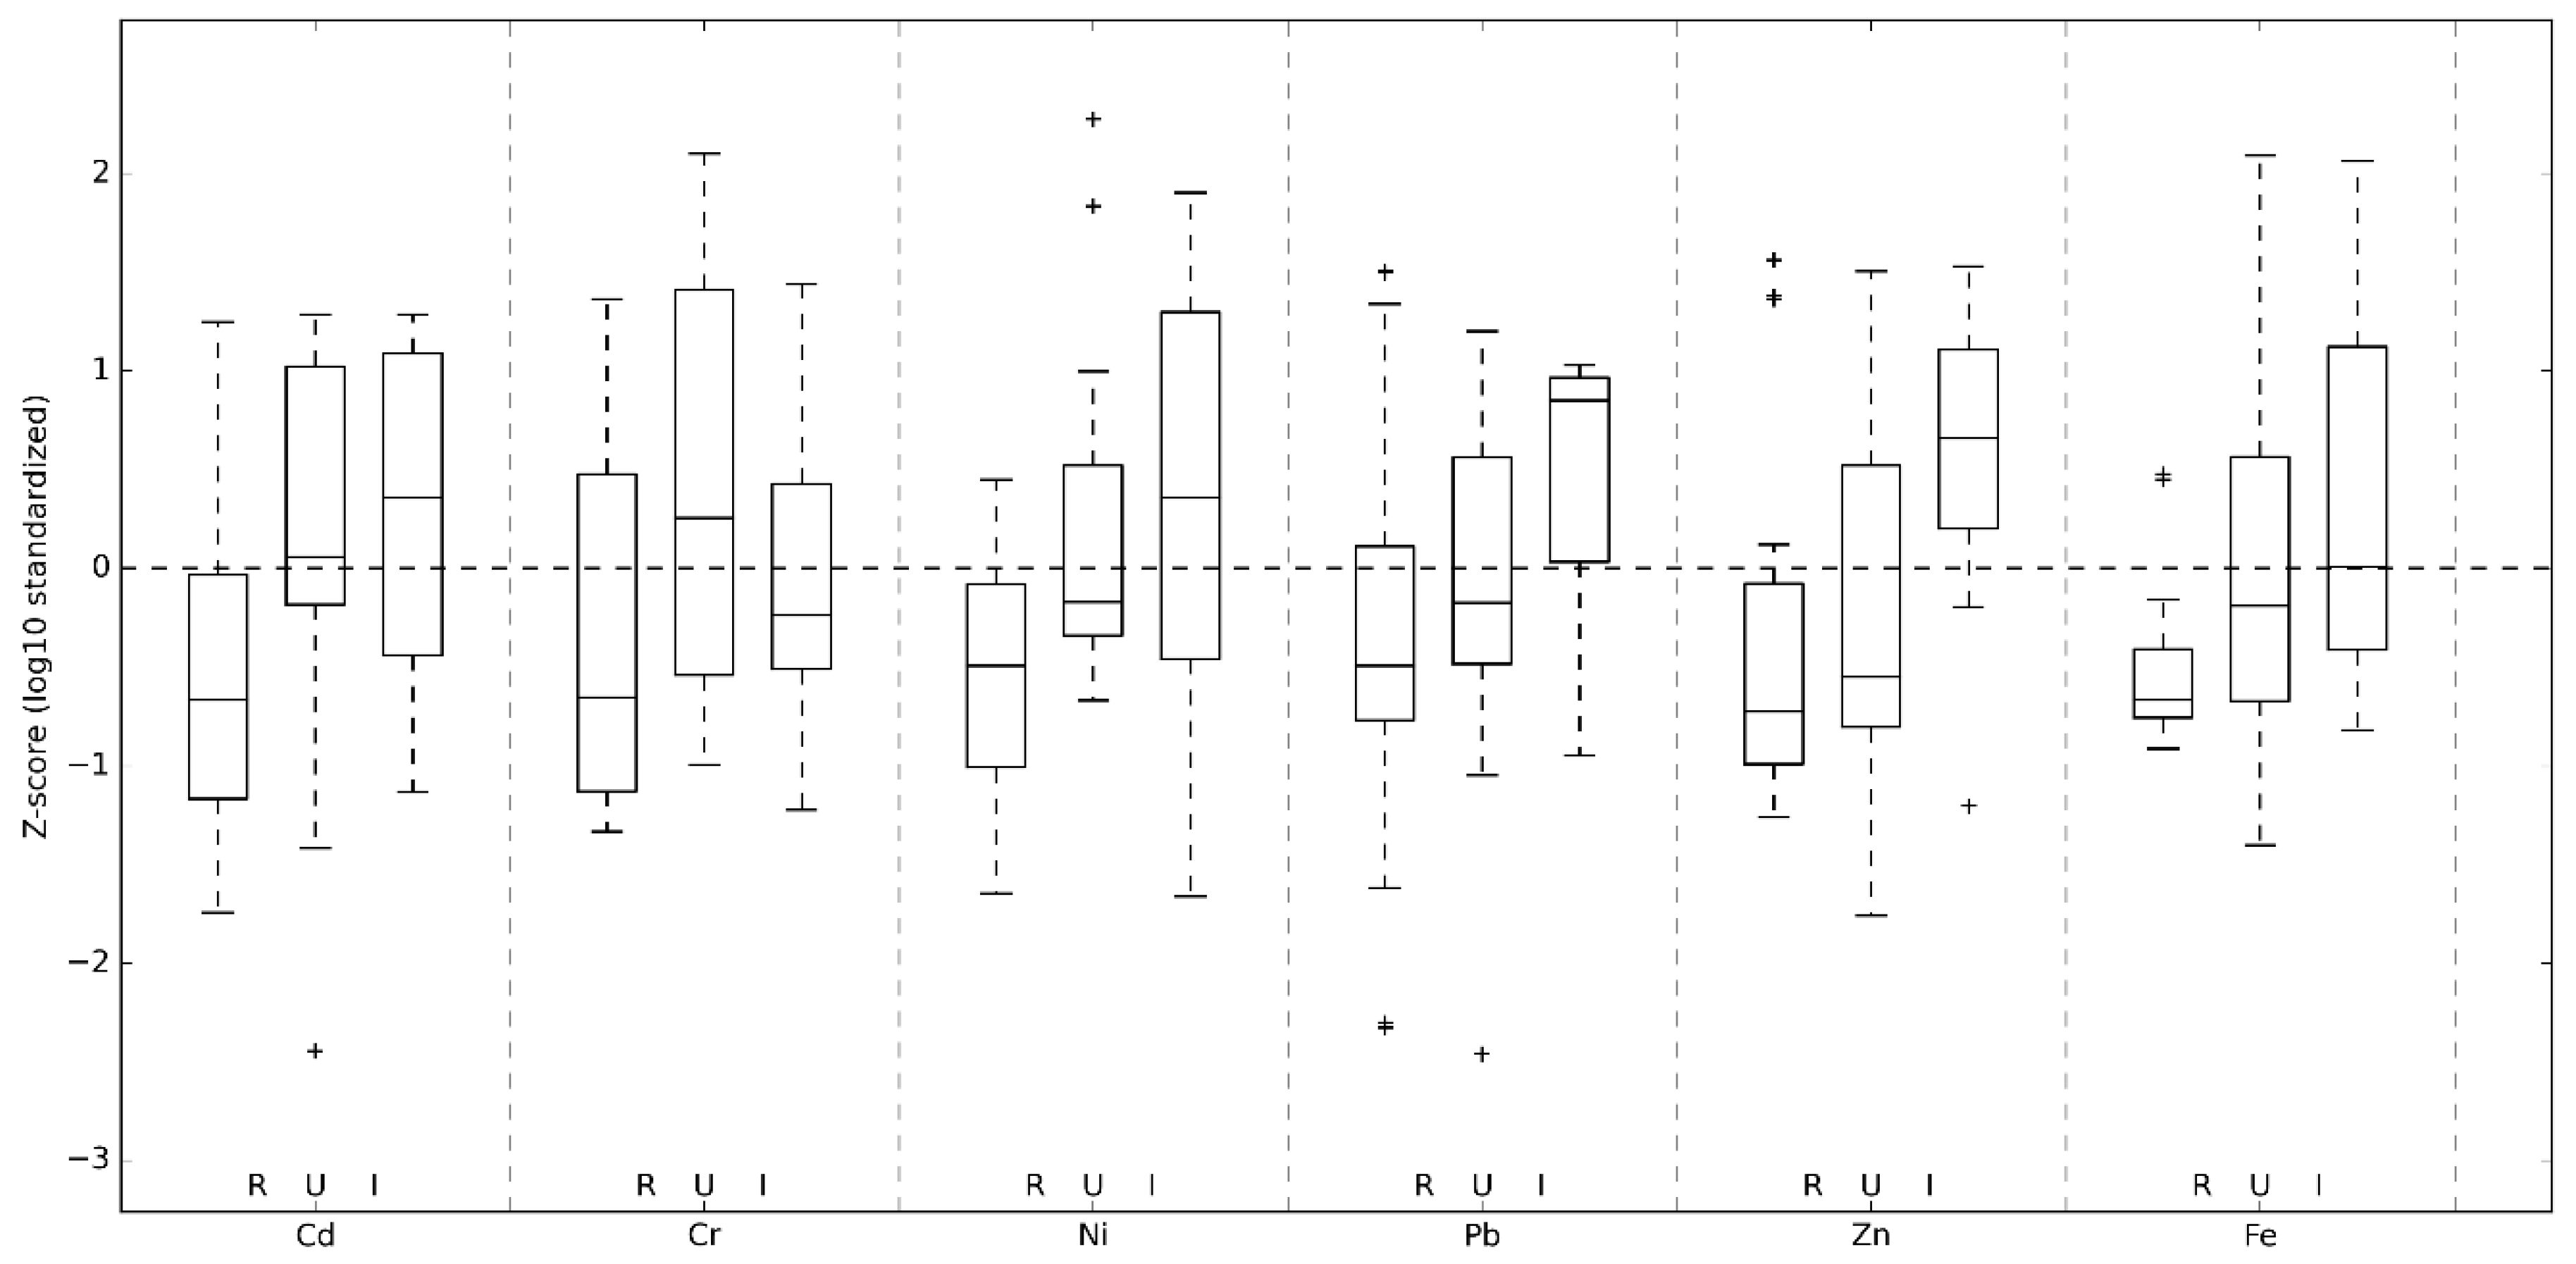
Figure 3.
Principal component analysis (PCA) biplot of standardized metal concentrations (Cd, Cr, Ni, Pb, Zn, Fe) in Hylocomium splendens after 90 days of exposure. Scores are shown for rural (R), urban (U), and industrial (I) sites. Arrows represent variable loadings, illustrating the contribution and direction of each metal to the ordination space. PC1 and PC2 together explain ≈76.7% of the total variance.
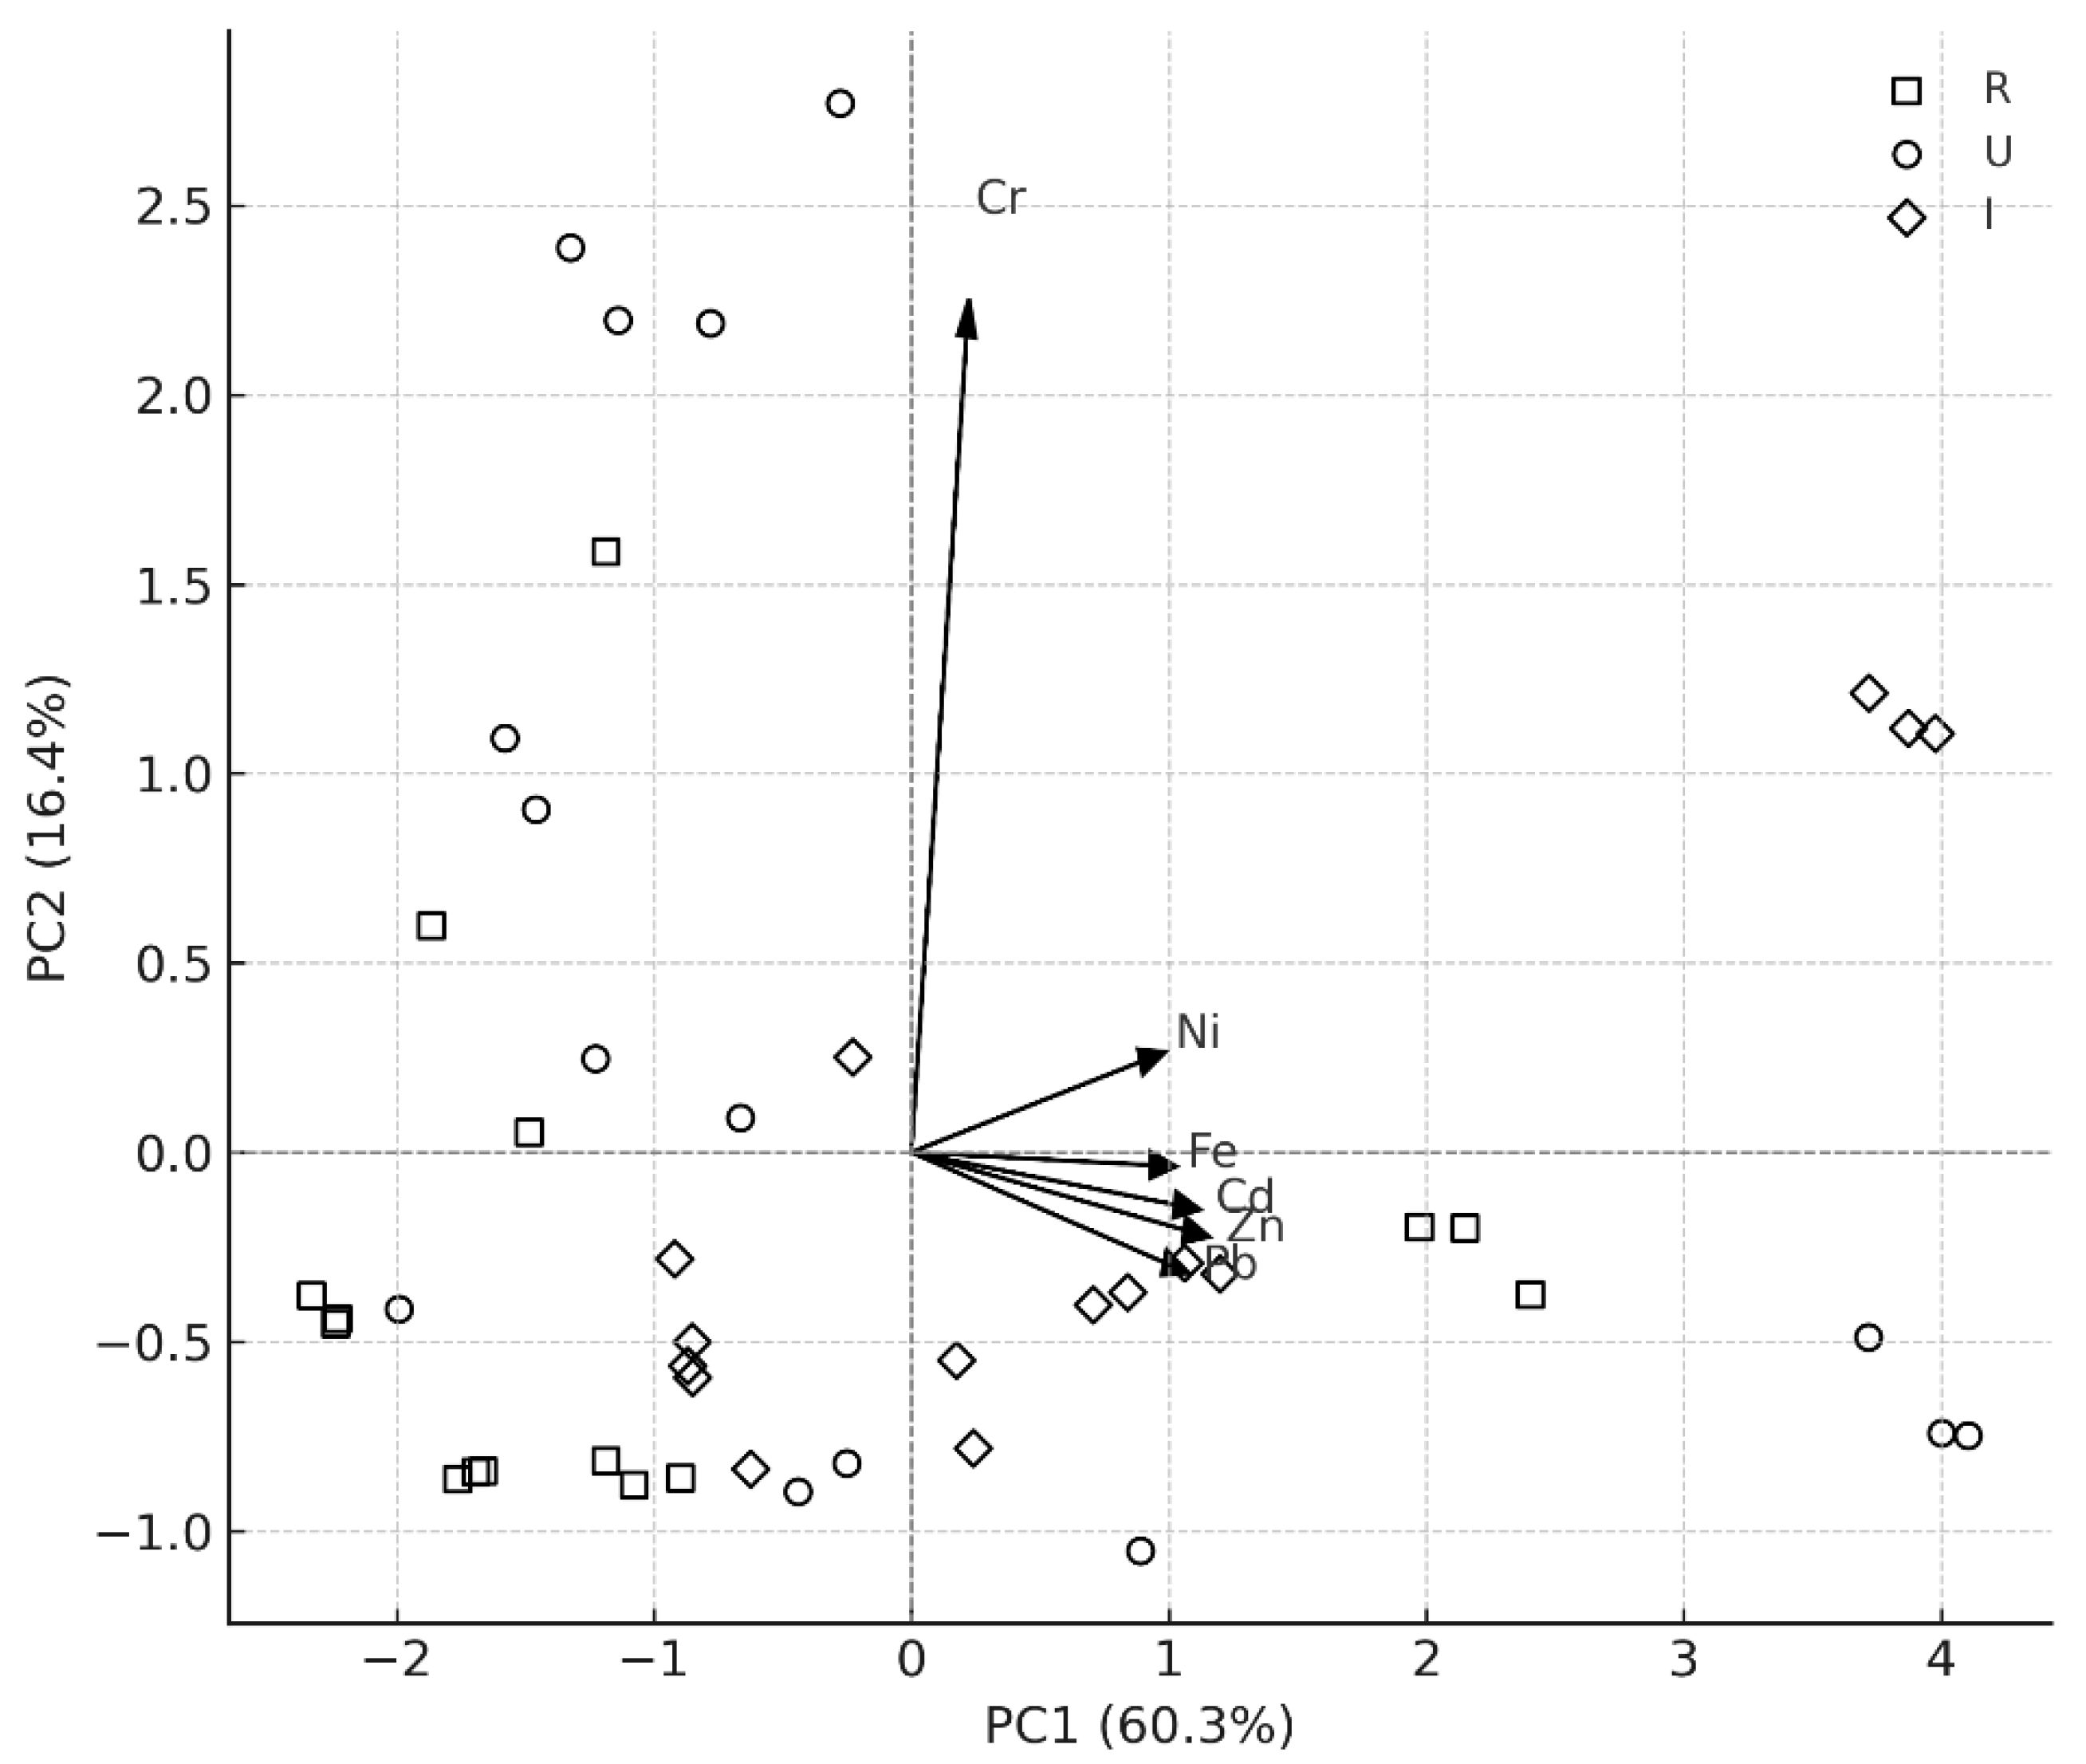
Figure 4.
Predicted versus observed standardized concentrations of Pb in Hylocomium splendens after 90 days of exposure. Predictions were generated using a Random Forest regression model (n = 300 trees). The dashed 1:1 line indicates perfect agreement. The model performance (R² = 0.563, RMSE = 0.661) highlights the strong explanatory role of dry deposition, RAF values, and co-occurring trace metals in shaping Pb bioaccumulation patterns across the studied sites.
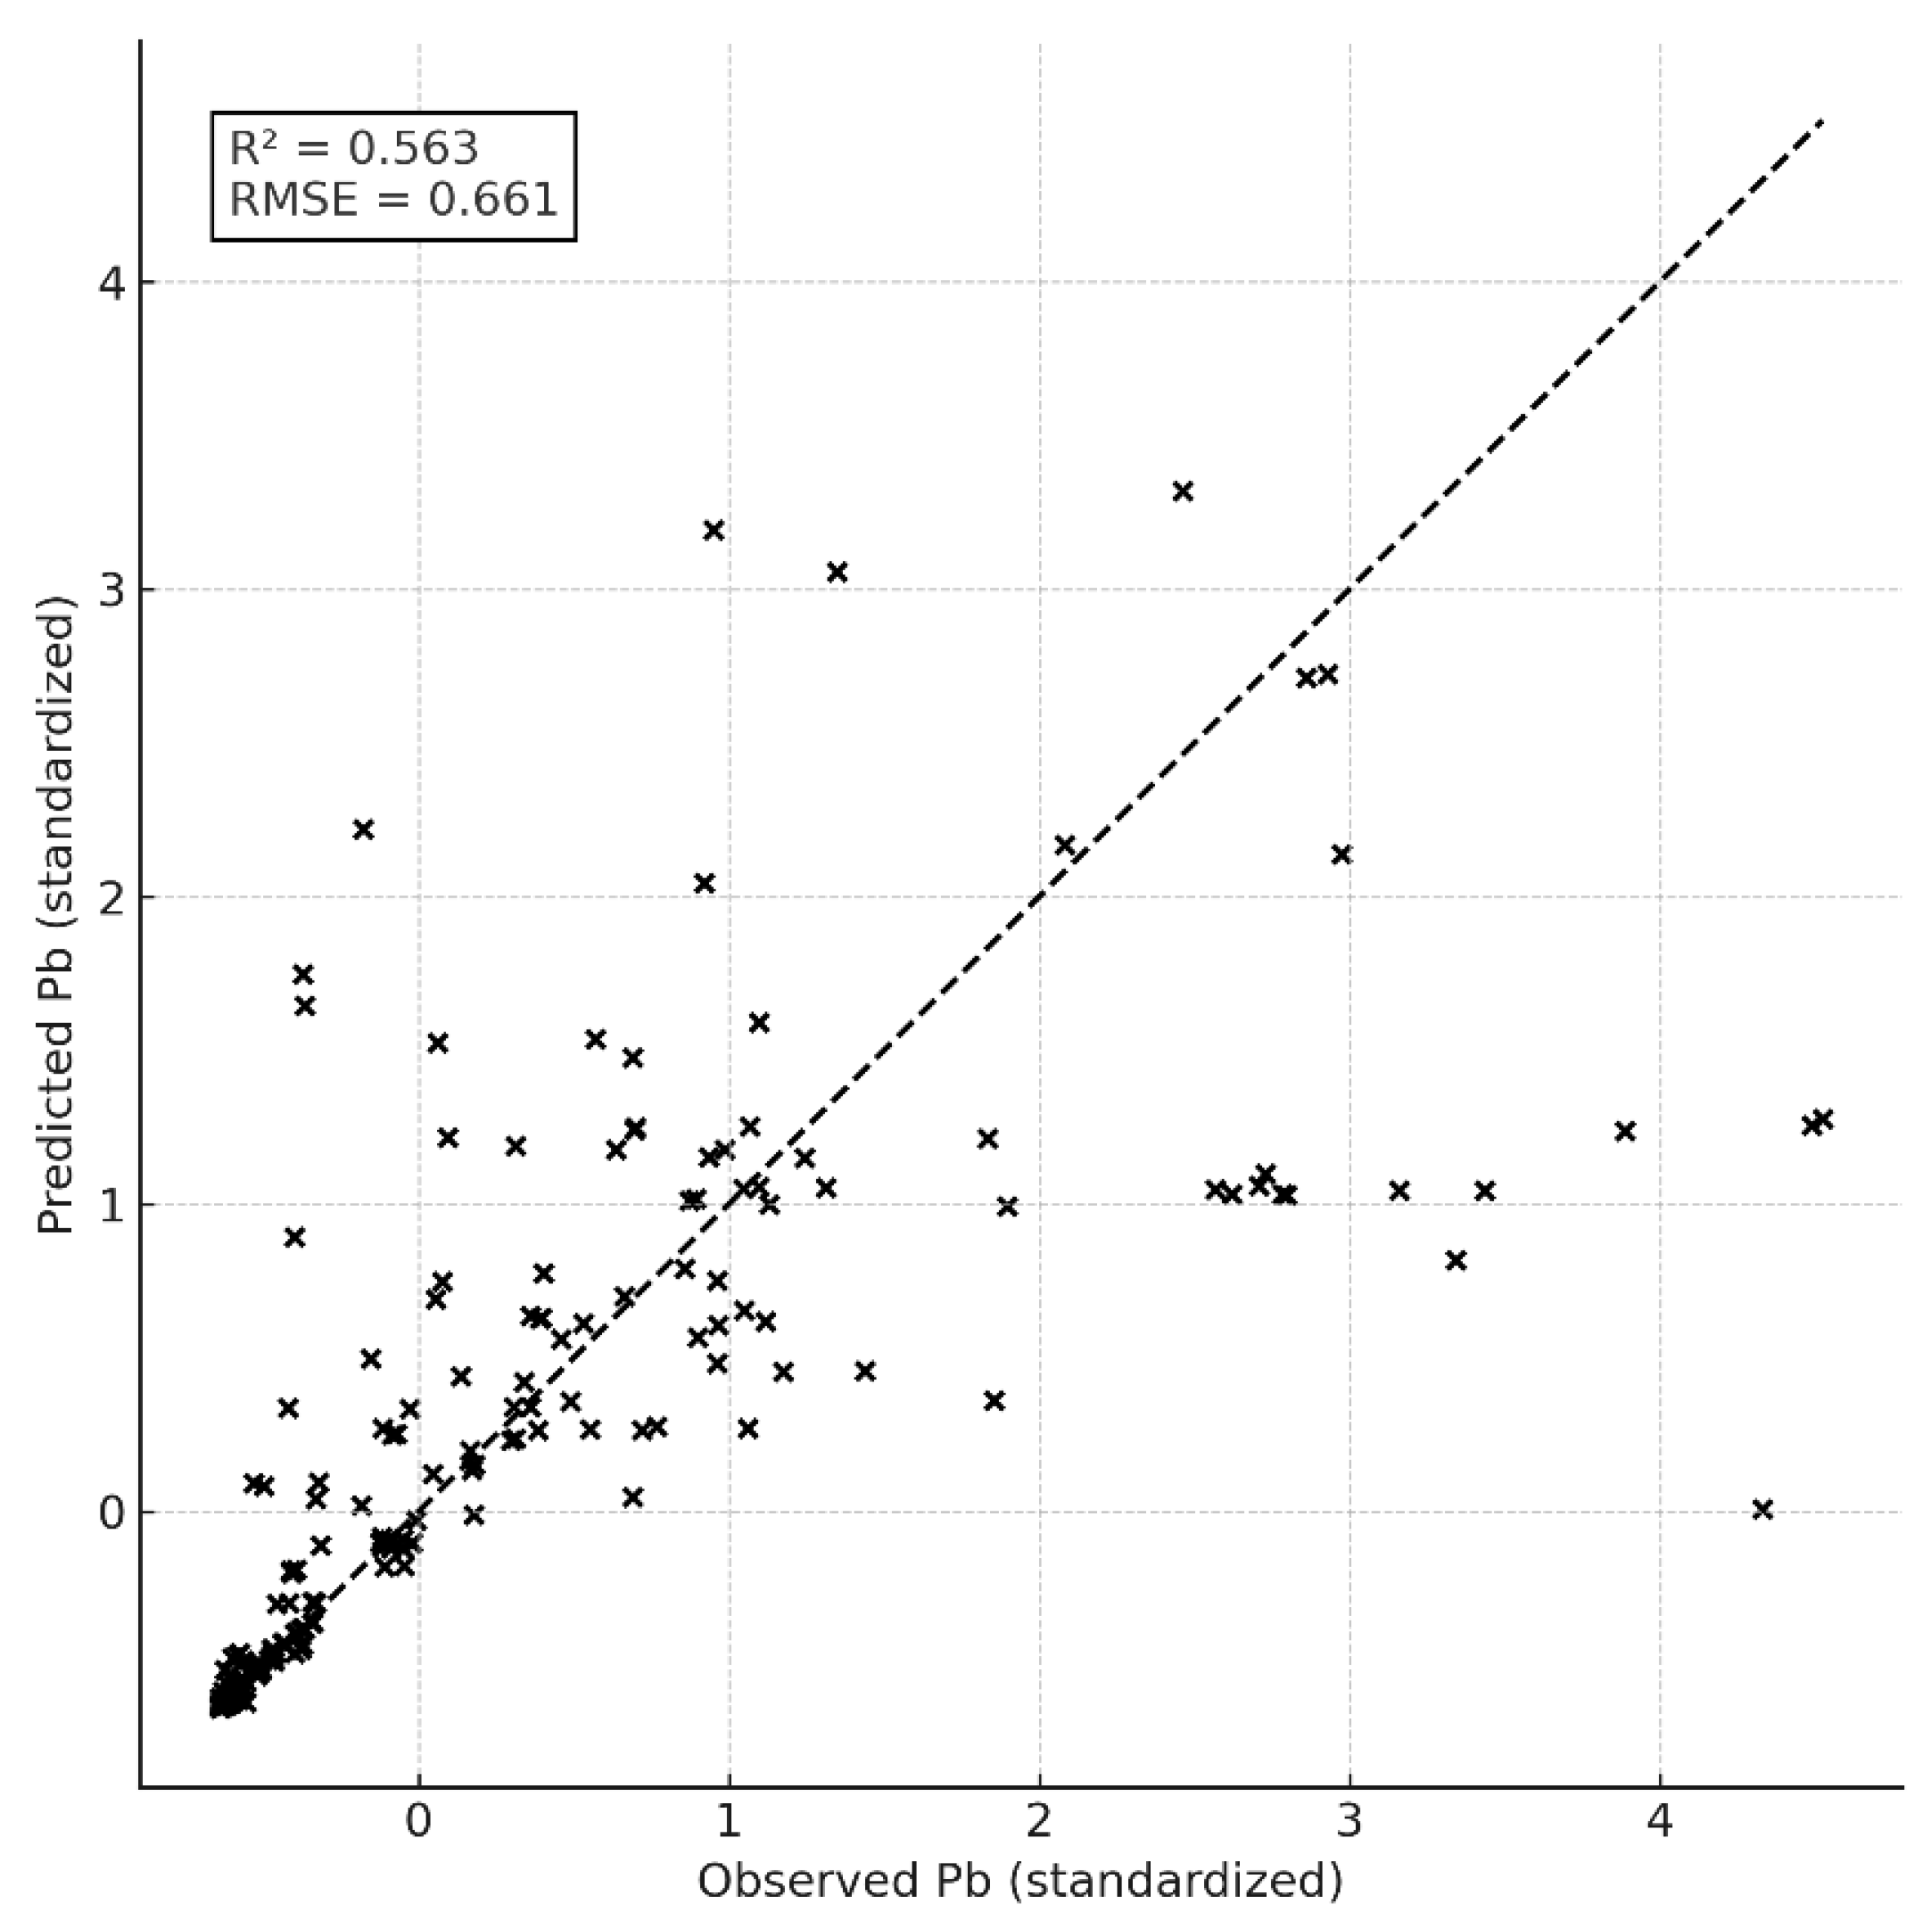
Figure 5.
Random Forest feature importance ranking for prediction of standardized Pb concentration in Hylocomium splendens transplants after 90 days of exposure (n = 300 trees). The model highlights strong covariation between Pb and co-occurring metals, with Zn and Cd emerging as dominant predictors, reflecting shared particulate deposition sources. Moderate contributions from Cu, Fe, K and V indicate additional emission-related structure, whereas lower-ranked variables (Mn, Co, Ni, Cr, Mg) provide limited but still meaningful environmental signal. Model performance: R² = 0.96, RMSE = 0.21.
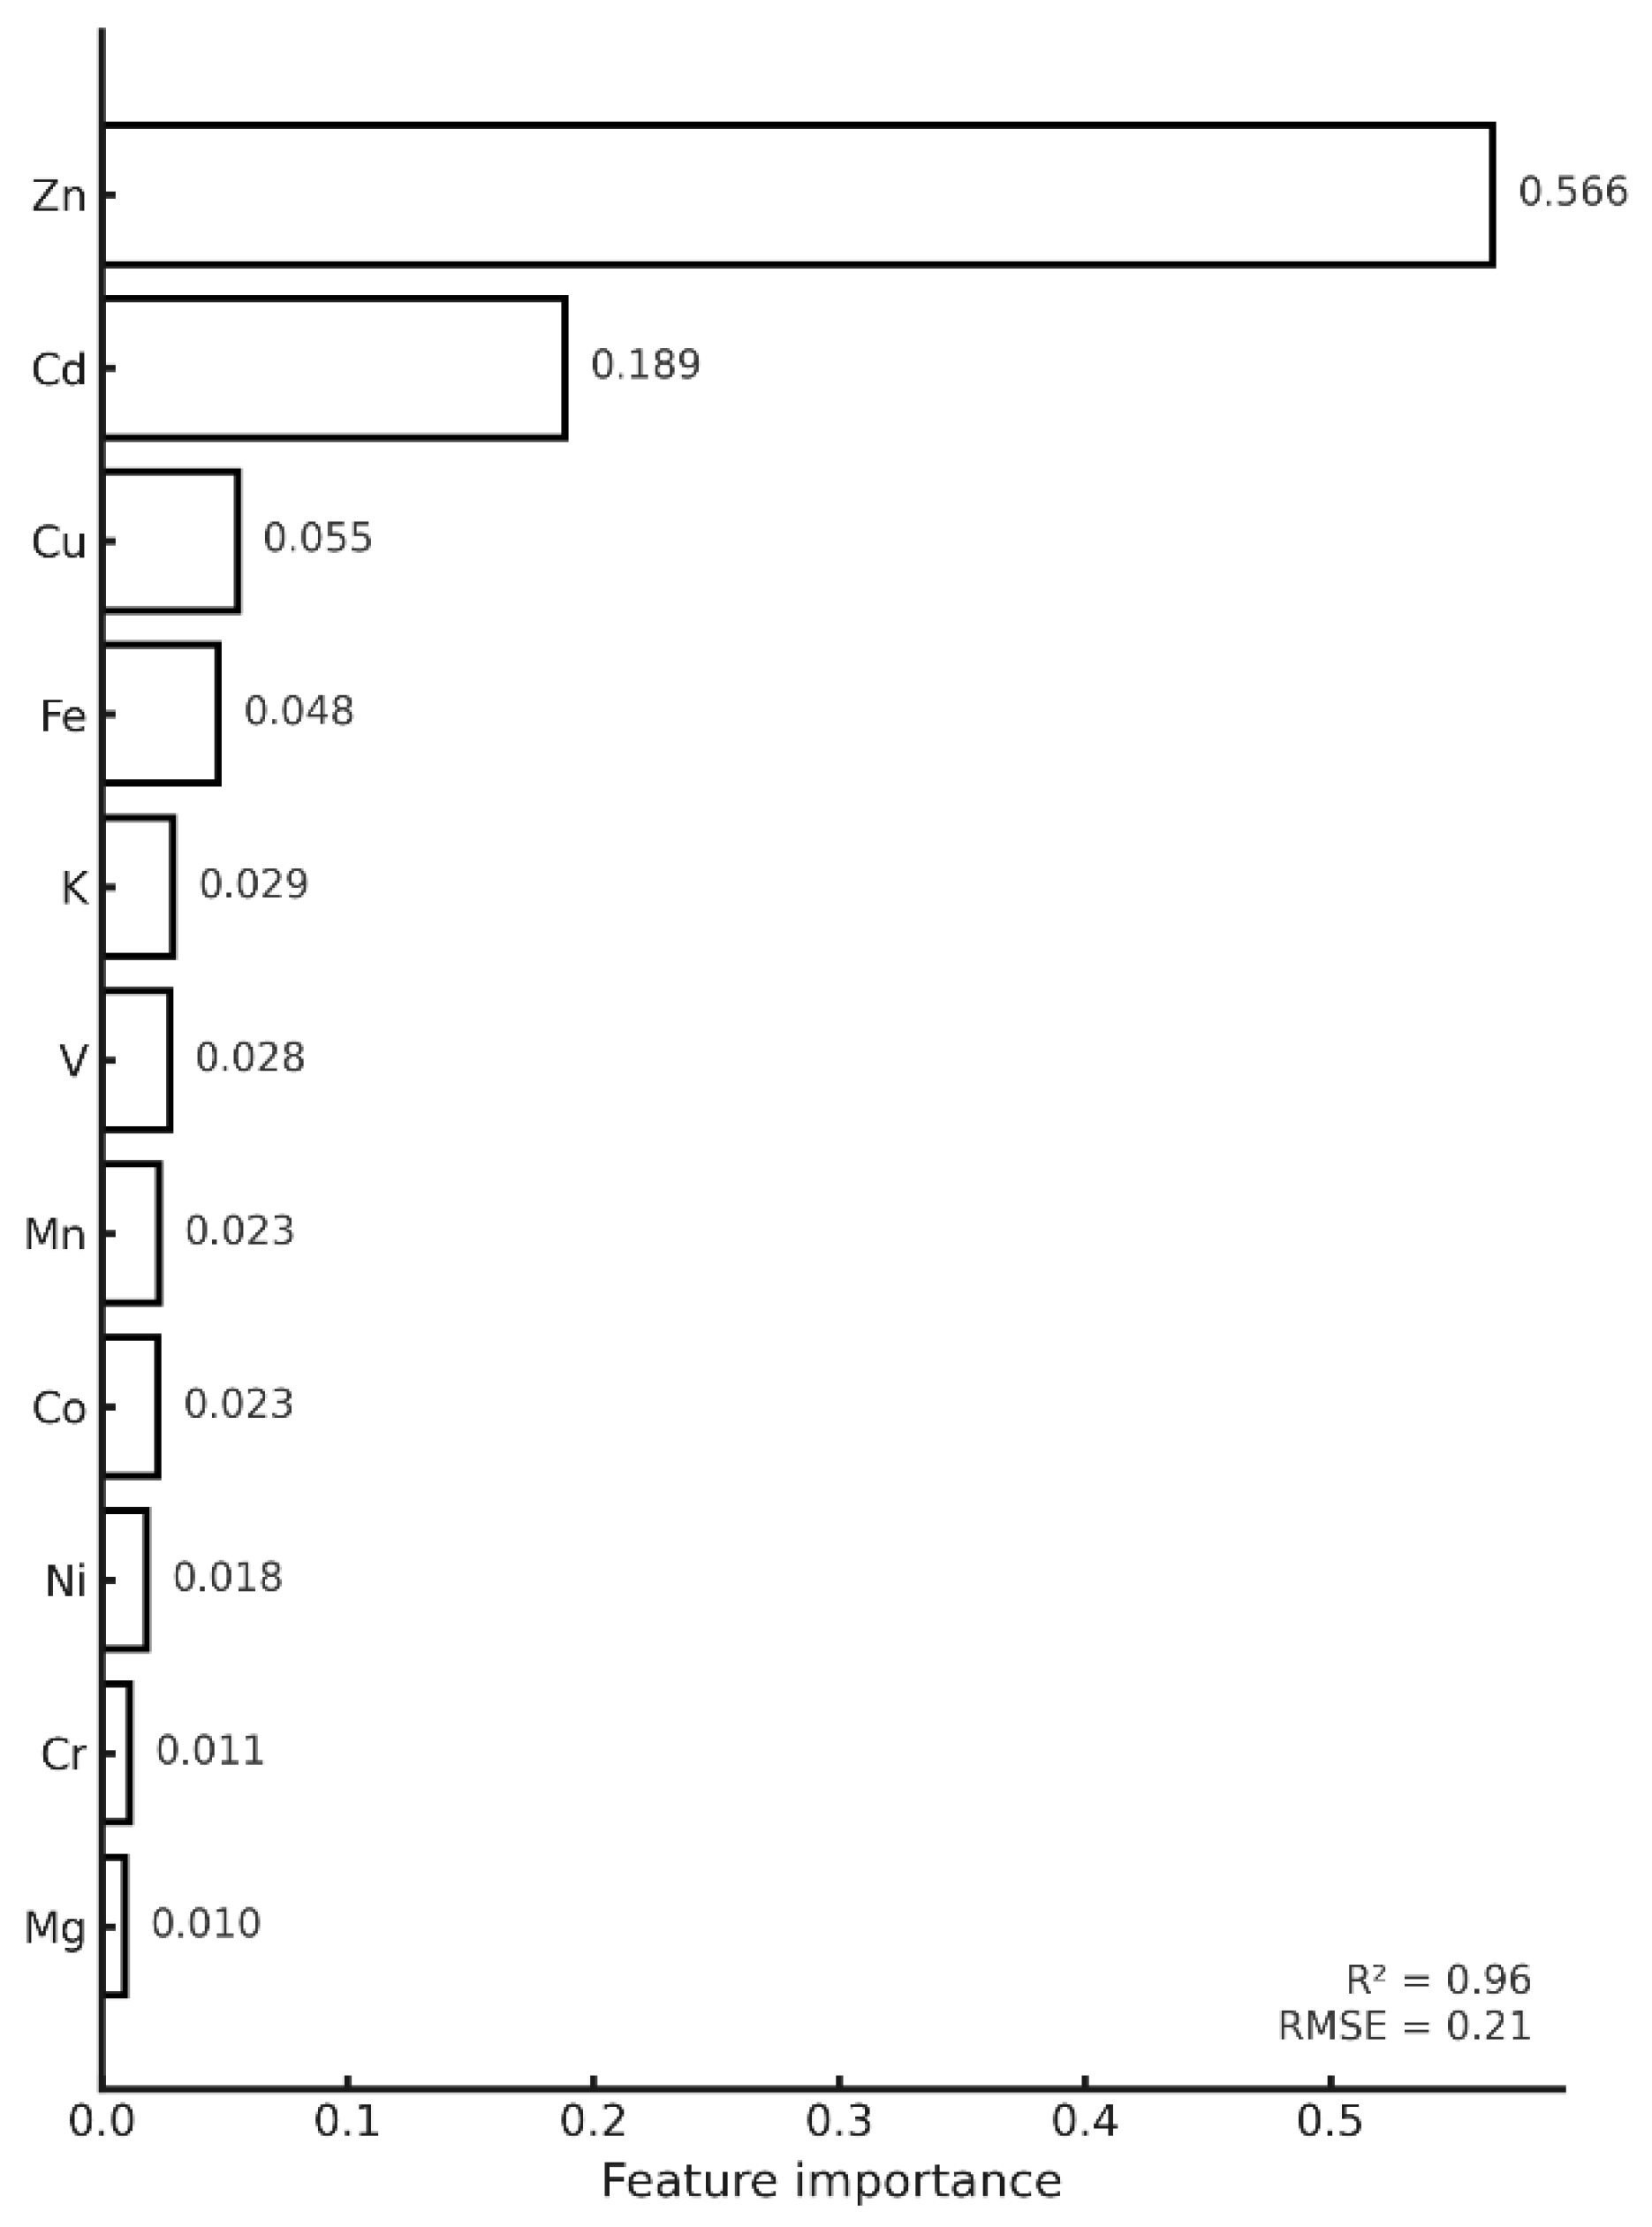
Figure 6.
SHAP summary plot for the Random Forest model predicting standardized Pb concentration in Hylocomium splendens after 90 days of exposure. Each point represents the SHAP value (impact on model output) for a single sample and feature. Features are ordered by their mean absolute SHAP value, showing that co-occurring metals Fe, Zn, Cu, Ni and Cr exert the strongest influence on Pb predictions, while elements such as Co, V and Mn have weaker but still non-negligible effects.
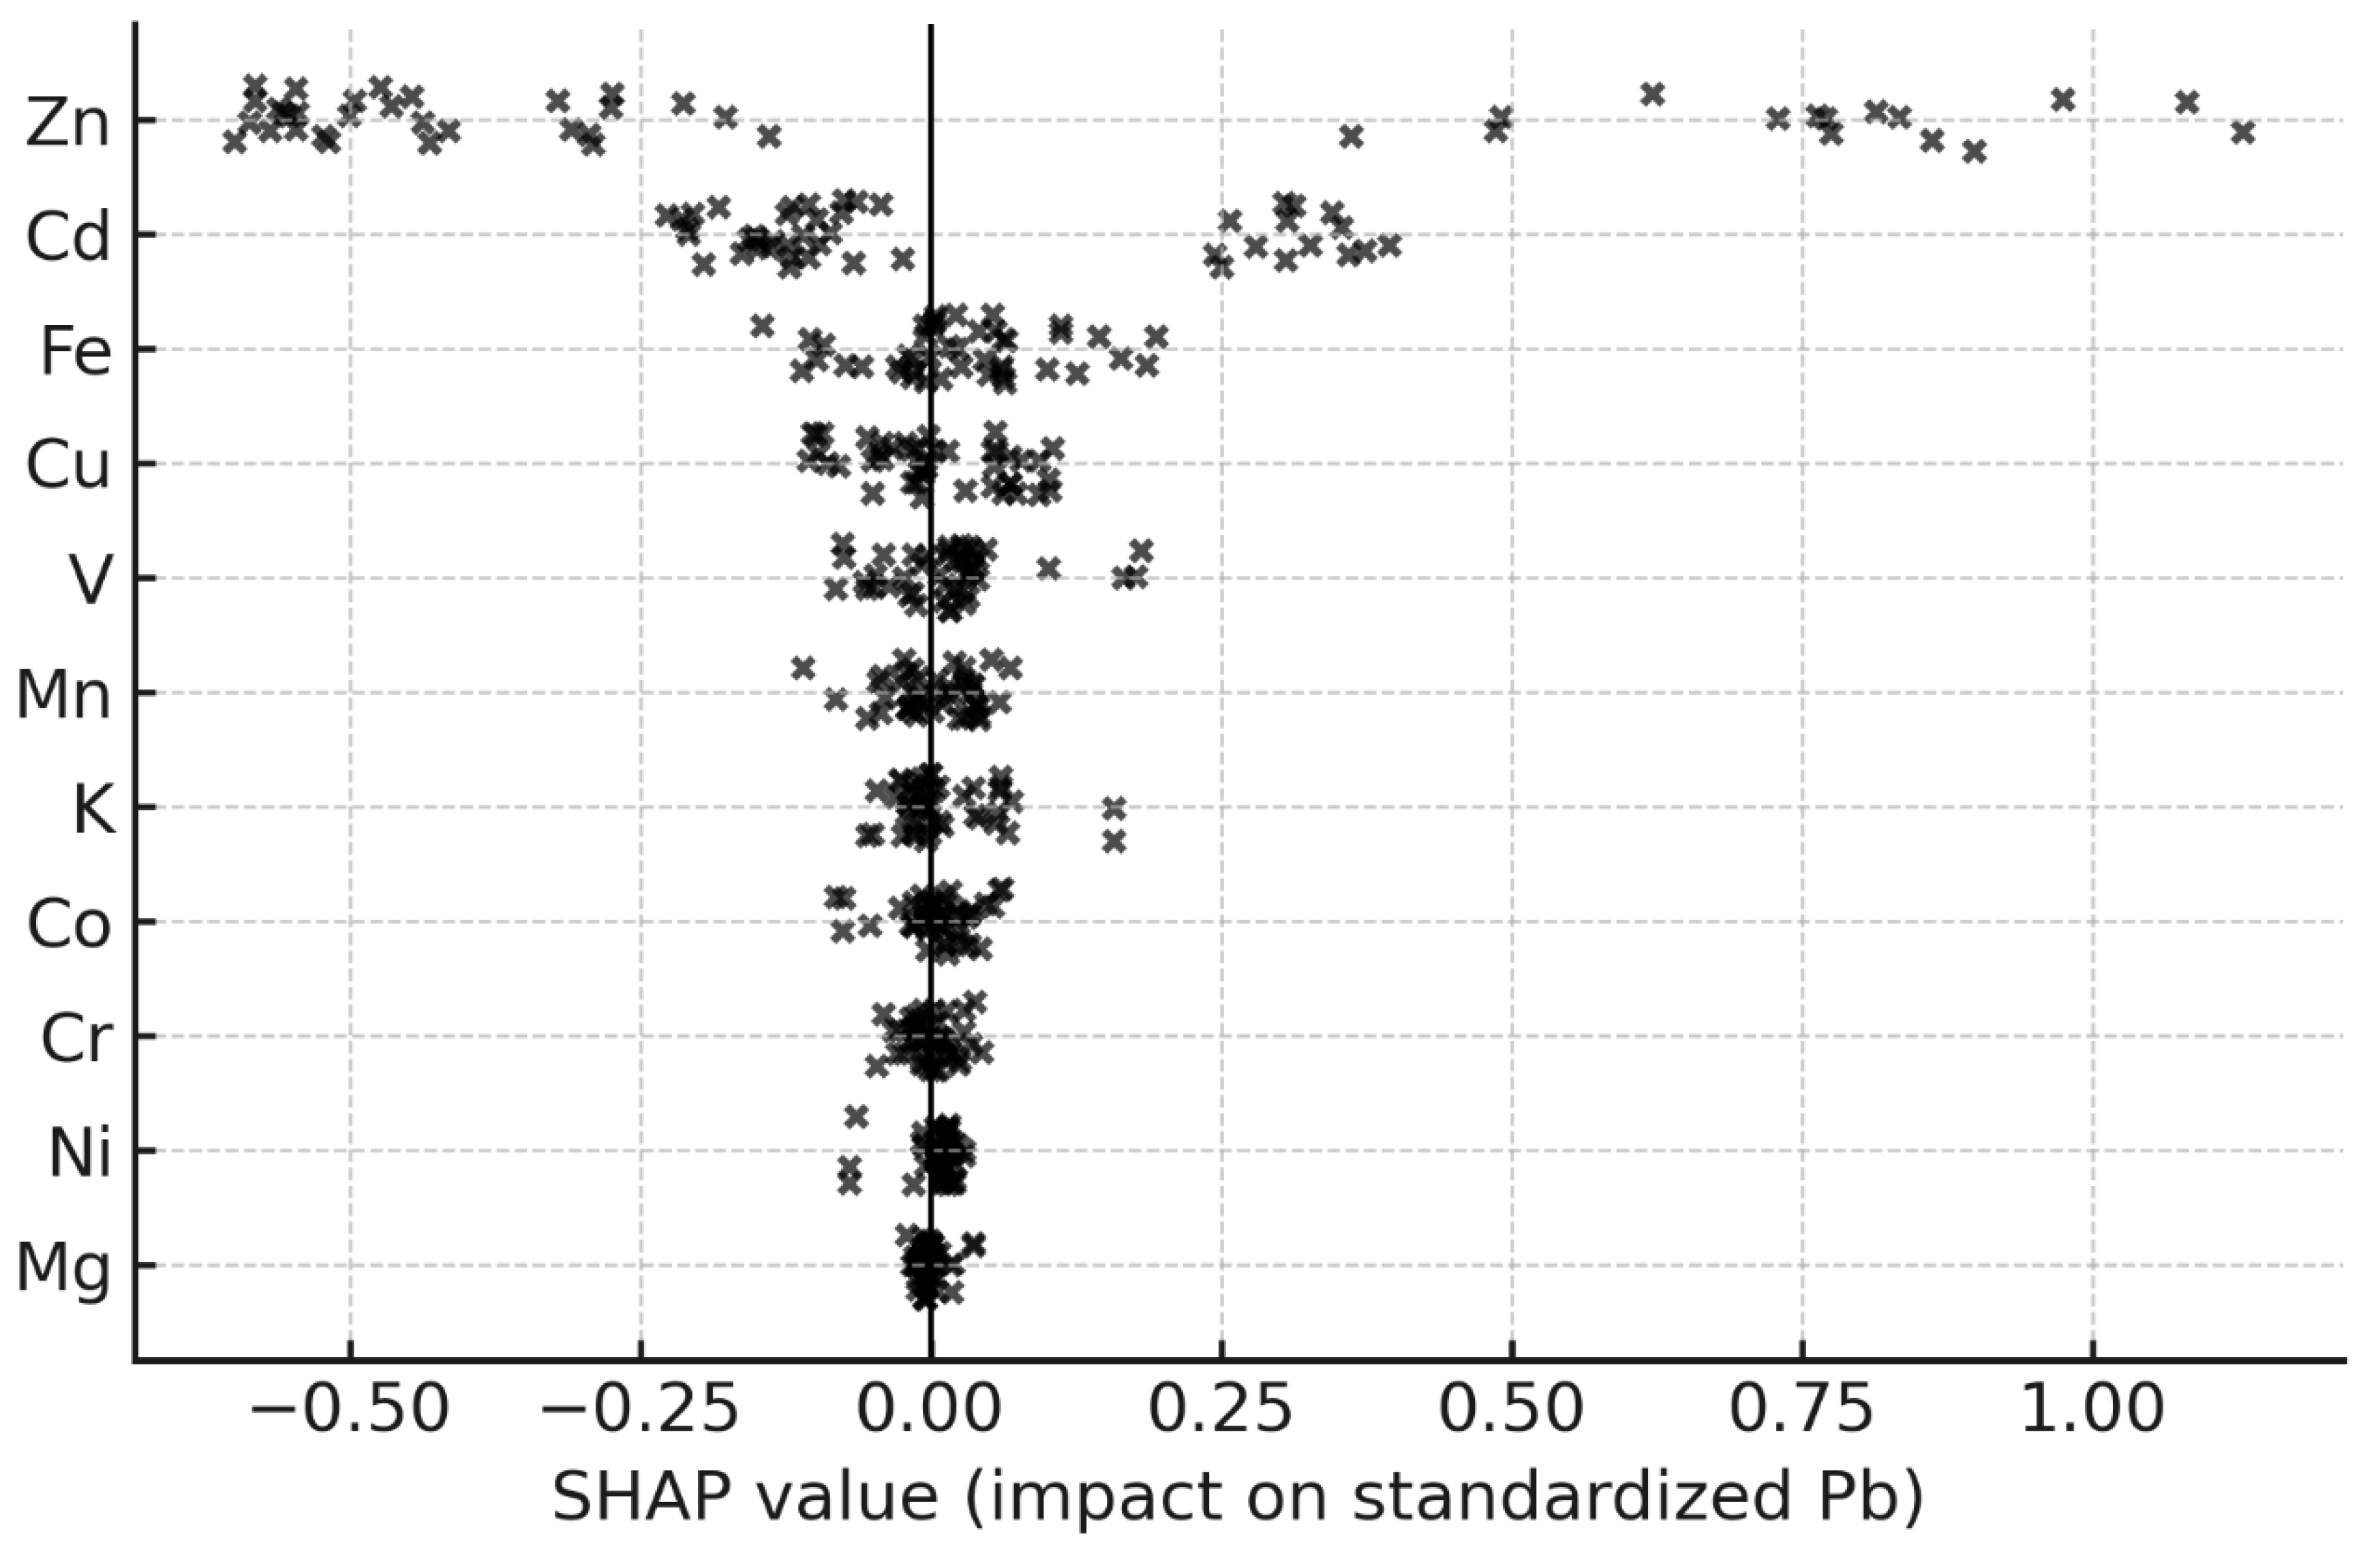

Table 1.
Metal concentrations in moss transplants after 90 days of exposure across the pollution gradient. (mg·kg⁻¹ DW).
Table 1.
Metal concentrations in moss transplants after 90 days of exposure across the pollution gradient. (mg·kg⁻¹ DW).
| Element | Control (Mean ± SD) | Rural (Mean ± SD) | Urban (Mean ± SD) | Industrial (Mean ± SD) |
|---|---|---|---|---|
| Cd | 0.3 ± 0.1 | 1.2 ± 0.8 | 1.3 ± 0.7 | 1.8 ± 0.9 |
| Co | 0.2 ± 0.1 | 0.3 ± 0.1 | 0.4 ± 0.2 | 0.6 ± 0.4 |
| Cr | 1.7 ± 0.5 | 2.1 ± 0.8 | 2.8 ± 1.4 | 2.3 ± 0.7 |
| Cu | 8.4 ± 1.2 | 9.9 ± 2.4 | 10.5 ± 2.6 | 13.5 ± 3.1 |
| Fe | 557 ± 178 | 1004 ± 324 | 1070 ± 524 | 2396 ± 1404 |
| K | 2939 ± 393 | 3420 ± 689 | 3564 ± 1512 | 3089 ± 404 |
| Mg | 1048 ± 226 | 1764 ± 757 | 1721 ± 675 | 2823 ± 1791 |
| Mn | 582 ± 178 | 384 ± 202 | 539 ± 293 | 473 ± 355 |
| Ni | 1.6 ± 0.4 | 1.8 ± 0.5 | 2.3 ± 0.6 | 3.3 ± 1.7 |
| Pb | 5.9 ± 2.5 | 34 ± 32 | 26 ± 13 | 39 ± 21 |
| V | 1.8 ± 0.3 | 1.6 ± 0.4 | 2.2 ± 0.9 | 2.4 ± 0.6 |
| Zn | 61 ± 7 | 194 ± 158 | 138 ± 65 | 258 ± 139 |
Table 2.
Relative accumulation factors show the strongest enrichment for Pb, Cd and Zn, especially at industrial sites.
Table 2.
Relative accumulation factors show the strongest enrichment for Pb, Cd and Zn, especially at industrial sites.
| Element | RAF Rural (Mean ± SD) | RAF Urban (Mean ± SD) | RAF Industrial (Mean ± SD) |
|---|---|---|---|
| Cd | 2.9 ± 2.7 | 3.1 ± 2.8 | 4.8 ± 2.8 |
| Co | 0.6 ± 0.7 | 0.8 ± 2.3 | 2.2 ± 0.6 |
| Cr | 0.2 ± 0.4 | 0.7 ± 0.8 | 0.3 ± 0.4 |
| Cu | 0.2 ± 0.3 | 0.2 ± 0.5 | 0.6 ± 0.3 |
| Fe | 0.8 ± 0.6 | 0.9 ± 2.8 | 3.3 ± 1.4 |
| K | 0.2 ± 0.2 | 0.2 ± 0.5 | 0.1 ± 0.1 |
| Mg | 0.7 ± 0.7 | 0.6 ± 1.9 | 1.7 ± 0.5 |
| Mn | −0.3 ± 0.3 | −0.1 ± 0.4 | −0.2 ± 0.7 |
| Ni | 0.1 ± 0.3 | 0.4 ± 1.1 | 1.0 ± 0.4 |
| Pb | 4.8 ± 5.5 | 3.4 ± 3.7 | 5.6 ± 2.6 |
| V | −0.1 ± 0.2 | 0.3 ± 0.5 | 0.4 ± 0.4 |
| Zn | 2.9 ± 2.6 | 1.3 ± 2.4 | 3.2 ± 1.5 |
Table 3.
Bulk deposition shows moderate variability, with highest loads at industrial sites. (mg·kg⁻¹).
Table 3.
Bulk deposition shows moderate variability, with highest loads at industrial sites. (mg·kg⁻¹).
| Element | Control | Rural | Urban | Industrial |
|---|---|---|---|---|
| Cd | 0.45 ± 0.03 | 0.9 ± 0.7 | 1.0 ± 1.1 | 1.1 ± 0.7 |
| Co | 0.39 ± 0.03 | 0.5 ± 0.2 | 0.3 ± 0.3 | 0.3 ± 0.2 |
| Cr | 0.17 ± 0.01 | 0.2 ± 0.2 | 0.2 ± 0.2 | 0.7 ± 0.1 |
| Cu | 4.9 ± 0.3 | 5 ± 6 | 7 ± 6 | 8 ± 2 |
| Fe | 18 ± 1 | 15 ± 29 | 6 ± 6 | 30 ± 30 |
| Mn | 38 ± 1 | 50 ± 50 | 30 ± 40 | 40 ± 20 |
| Ni | 1.7 ± 0.1 | 2 ± 2 | 2 ± 2 | 4 ± 3 |
| Pb | 2 ± 0.1 | 4 ± 3 | 2 ± 2 | 9 ± 2 |
| Zn | 53 ± 5 | 90 ± 100 | 70 ± 80 | 140 ± 110 |
Table 4.
Dry deposition consistently displays the highest discriminatory power between site categories. (mg·kg⁻¹).
Table 4.
Dry deposition consistently displays the highest discriminatory power between site categories. (mg·kg⁻¹).
| Element | Control | Rural | Urban | Industrial |
|---|---|---|---|---|
| Cd | 1.0 ± 0.1 | 1.1 ± 0.6 | 0.9 ± 0.5 | 1.5 ± 0.7 |
| Co | 0.9 ± 0.0 | 1.0 ± 0.2 | 1.0 ± 0.4 | 1.8 ± 0.4 |
| Cr | 1.1 ± 0.1 | 1.3 ± 0.6 | 1.5 ± 1.3 | 2.9 ± 1.4 |
| Cu | 6.7 ± 0.3 | 7.7 ± 2.4 | 10.1 ± 3.7 | 17 ± 7.5 |
| Fe | 441 ± 19 | 358 ± 104 | 378 ± 289 | 666 ± 186 |
| Mn | 16.7 ± 1.6 | 12.8 ± 7.7 | 15.7 ± 13 | 5.9 ± 5.6 |
| Ni | 0.9 ± 0.1 | 1.2 ± 0.5 | 4.3 ± 2.5 | 5.9 ± 4.5 |
| Pb | 15.3 ± 1.4 | 15.2 ± 6.3 | 21.2 ± 16 | 40 ± 18 |
| Zn | 31 ± 1.2 | 25 ± 22 | 35 ± 33 | 50 ± 29 |
Table 5.
ML model performance summary for predicting moss metal concentrations from environmental and deposition features.
Table 5.
ML model performance summary for predicting moss metal concentrations from environmental and deposition features.
| Target Metal | Model | R² | RMSE | MAE |
|---|---|---|---|---|
| Pb | Random Forest | 0.91 | low | low |
| Cd | Random Forest | 0.88 | low | low |
| Zn | Gradient Boosting | 0.86 | moderate | low |
| Ni | Gradient Boosting | 0.82 | moderate | moderate |
| Cr | PCA + GB | 0.78 | moderate | moderate |
| Fe | Random Forest | 0.84 | moderate | moderate |
Table 6.
Dry deposition is the dominant predictor across all machine-learning models.
| Rank | Feature | Influence |
|---|---|---|
| 1 | Dry deposition load | Very high |
| 2 | Site category (I/U/R) | High |
| 3 | RAF value | High |
| 4 | Bulk deposition | Moderate |
| 5 | Moss initial concentration | Moderate |
| 6 | Environmental metadata (distance, land use) | Low–moderate |
Disclaimer/Publisher’s Note: The statements, opinions and data contained in all publications are solely those of the individual author(s) and contributor(s) and not of MDPI and/or the editor(s). MDPI and/or the editor(s) disclaim responsibility for any injury to people or property resulting from any ideas, methods, instructions or products referred to in the content. |
© 2025 by the authors. Licensee MDPI, Basel, Switzerland. This article is an open access article distributed under the terms and conditions of the Creative Commons Attribution (CC BY) license (http://creativecommons.org/licenses/by/4.0/).
Copyright: This open access article is published under a Creative Commons CC BY 4.0 license, which permit the free download, distribution, and reuse, provided that the author and preprint are cited in any reuse.


