Submitted:
13 December 2023
Posted:
13 December 2023
You are already at the latest version
Abstract
This study conducts a comprehensive analysis of the presence of heavy metals, including zinc (Zn), lead (Pb), copper (Cu), chromium (Cr), and arsenic (As), in the dust found inside educational buildings and the top layer of soil in different areas of Vilnius. The study focuses on the analysis of topsoil samples gathered between 2011 and 2023, with a specific emphasis on dust samples obtained from 24 schools in 2022. The research reveals significant variations in the concentrations of heavy metals, providing a clear understanding of the complex relationship between sources of urban pollution, environmental processes, and the correlation between soil and dust contamination by heavy metals. Indoor dust in schools shows unique contamination patterns in contrast to topsoil, suggesting distinctive sources of indoor pollution, while there are some general similarities. This finding emphasizes similarities and distinctions between soil and dust in educational environments. The study utilizes advanced statistical methods such as Pearson correlation, Principal Component Analysis (PCA), and hierarchical clustering to examine the distribution and characteristics of these metals. This study distinguishes itself by examining indoor dust in educational facilities and topsoil in Vilnius, providing crucial insights into the relationship between these two environmental matrices.
Keywords:
Heavy Metal
; Environmental pollution
; Topsoil
; Soil and Dust
; Vilnius
; Dust
; Dust pollution
1. Introduction
Soil is a complex and dynamic substrate consisting of a porous matrix that allows the interactions of air, water, and biota. Alterations in soil processes have a significant impact on ecosystem functioning, as the complex balance between inorganic and organic substances within the soil gives rise to a range of environmental issues. In order to maintain the quality and functionality of soil, it is essential that all soil types are maintained in a sustainable condition. The presence of heavy metals has a detrimental impact on these aspects [1].
Particulate matter, or dust, is the general term for fine solid particles smaller than 100 µm. Due to its high airborne dispersal capability, it has significant contamination potential [2,3,4]. One major source of pollution in metropolitan areas is street dust. Mold spores, dander, pollen, heavy metals, organic matters, and inorganic substances are among the many components found in this complex mixture of particles. Wind may carry these particles into the air, where they can become a significant cause of air pollution. Cities' roadways and roofs are among the surfaces where they may settle [5,6,7,8].
Studies conducted in Lithuania have identified significant soil contamination problems, namely in urban areas and alongside major roadways. Grigalavičiene et al. [9] and Jankaitė et al. [10] discovered heightened concentrations of Pb, Cu, and other harmful metals in surface soil samples close to the Vilnius-Klaipėda highway and other roadways, attributing this phenomenon to increased car movement. The proximity to highways resulted in significantly elevated levels of toxic metals, frequently above the established safety thresholds [11,12].
Taraškevičius et al. [13,14,15] conducted more research and found varying degrees of Zn, Pb, and Cu pollution in different areas of Vilnius. Industrial locations had elevated levels of pollution, whereas the level of contamination in residential zones fluctuated correlated with the degree of urbanization. The soil in the vicinity of a preschool in Vilnius showed a high concentration of metals within the first 0.5 meters, which gradually decreased with depth as a result of the sandy composition of the area's soil. In addition, Kumpienė et al. [16] documented the presence of metal pollution in preschool playgrounds in Vilnius, specifically in older, elevated regions with a history of industrial activity. The Vilnius Aplinka [17] investigation also revealed significant pollution in older industrial districts and landfills, primarily with lead (Pb) and zinc (Zn). The soil contamination is worsened by activities like as construction and deforestation, which disrupt the soil and contribute to the pollution caused by dust.
Our study specifically focuses on the environmental impacts of heavy metals in schools of Vilnius. We compare these findings with topsoil samples from various studies to detect both similarities and differences, especially with the accumulation of dust in schools. This unexplored viewpoint in Vilnius provides novel insights into the risks presented by heavy metals in educational environments and their patterns of accumulation.
2. Materials and methods
2.1. Description of the area of study
Lithuania's capital and largest city, Vilnius, is located about 312 kilometers inland from the Baltic Sea. With a population of about 550,000, it occupies an area of 401 square kilometers. Vilnius is located 112 meters above sea level and is coordinated 54.687157 degrees north and 25.279652 degrees east. The city has a moderate climate, with July receiving 80 mm of precipitation on average and February receiving 30 mm. Vilnius experiences an annual average humidity of roughly 78 percent. Though it fluctuates throughout the year, the city's major wind directions are from the south and west.
2.2. Sample Collection
In 2022, our research team gathered dust samples from 24 educational institutions. The samples were collected from regions that cleaners usually disregard, such as behind radiators, above bookcases, in corners, above windowsills, and inaccessible sections of gymnasiums. We primarily focused on the dust that had gathered over an extended duration. X-ray fluorescence (XRF) spectroscopy was used to examine the collected dust samples. XRF is a popular method for determining the elemental composition of materials. The samples were prepared for examination by breaking them into smaller pieces and placing them on a sample holder. The sample must be clean and devoid of any impurities that could interfere with the analysis. XRF spectroscopy has advantages such as element-specific identification and eliminates the requirement for sample pre-treatment.
2.3. Statistical Analysis Methods
2.3.1. Descriptive analysis
Descriptive statistical analysis was used in this work to clarify the features and distribution of different environmental pollutants in Vilnius surface soil samples and dust samples from schools. The information included lead (Pb), zinc (Zn), copper (Cu), arsenic (As), and chromium (Cr) concentrations measured over a number of years. In order to give a thorough perspective of the data, the analysis involved calculating fundamental statistical metrics like mean, median, standard deviation, and range. This method made it possible to fully comprehend the central tendencies and variability of the dataset, providing a solid basis for additional inferential statistical studies, including Pearson correlation, to investigate the links between dust and soil pollutant levels over time.
2.3.2. Pearson Correlation Analysis
In our study, Pearson correlation analysis is a crucial statistical method for determining the strength and direction of a linear relationship between two variables. We can precisely and statistically carefully examine and quantify the links between the important variables in our study thanks to this rigorous methodology. We utilized Python programming to employ Pearson correlation in the construction of tables. This correlation analysis involved the integration of our own dataset with data from previous research conducted in the Vilnius region.
2.3.3. Principal Component Analysis
Principal component analyses (PCA) are widely used in data reduction and latent factor identification. This method aims to discover a small number of latent factors, known as principal components (PCs), that effectively reflect the relationships among observable variables. Principal Component Analysis (PCA) is a statistical technique that enables the transformation of a collection of correlated variables into a reduced set of orthogonal factors. This process aids in the comprehension of intricate multidimensional systems by revealing the correlations among the initial variables [18].
2.3.4. Hierarchical Clustering Analysis
Hierarchical Clustering Analysis (HCA) is a method utilized in the field of data analysis. Prior to doing the cluster analysis, it was necessary to standardize the results using z-scores. Subsequently, the Euclidean distances were computed among the heavy metal values. The linkage criterion employed in the hierarchical clustering analysis was Ward's approach, as described by Zheng et al. [19]. The objective is to ascertain clusters of data points that exhibit shared characteristics or properties. In the context of HCA, many metrics of similarity or dissimilarity can be employed to ascertain the proximity or divergence of data points. According to Radhi et al. [4], a positive coefficient signifies a positive linear relationship, whereas a negative coefficient signifies a negative linear relationship.
3. Results and Discussion
Significant diversity was found in the dust samples from schools (Figure 1), especially in the Zn concentration, where extreme values suggested the presence of outliers or a highly variable dust composition in such environments. Zn's distribution pattern in the dust samples was different and significantly deviated from the other elements' patterns.
Furthermore, more distinct distribution patterns were shown by the comparative visualization of elements including As, Cu, Pb, Cr, and Zn in the dust samples. These trends might provide information about the types and origins of dust buildup in educational settings. The pronounced variations in element concentrations between the dust and soil samples emphasize how difficult it is to sample the environment and how careful analysis and interpretation of such environmental data are required. The element concentration range and variability seen in this preliminary analysis set the stage for a more thorough comparative and correlational investigation that may clarify the connections between the compositions of soil and dust in urban environments.
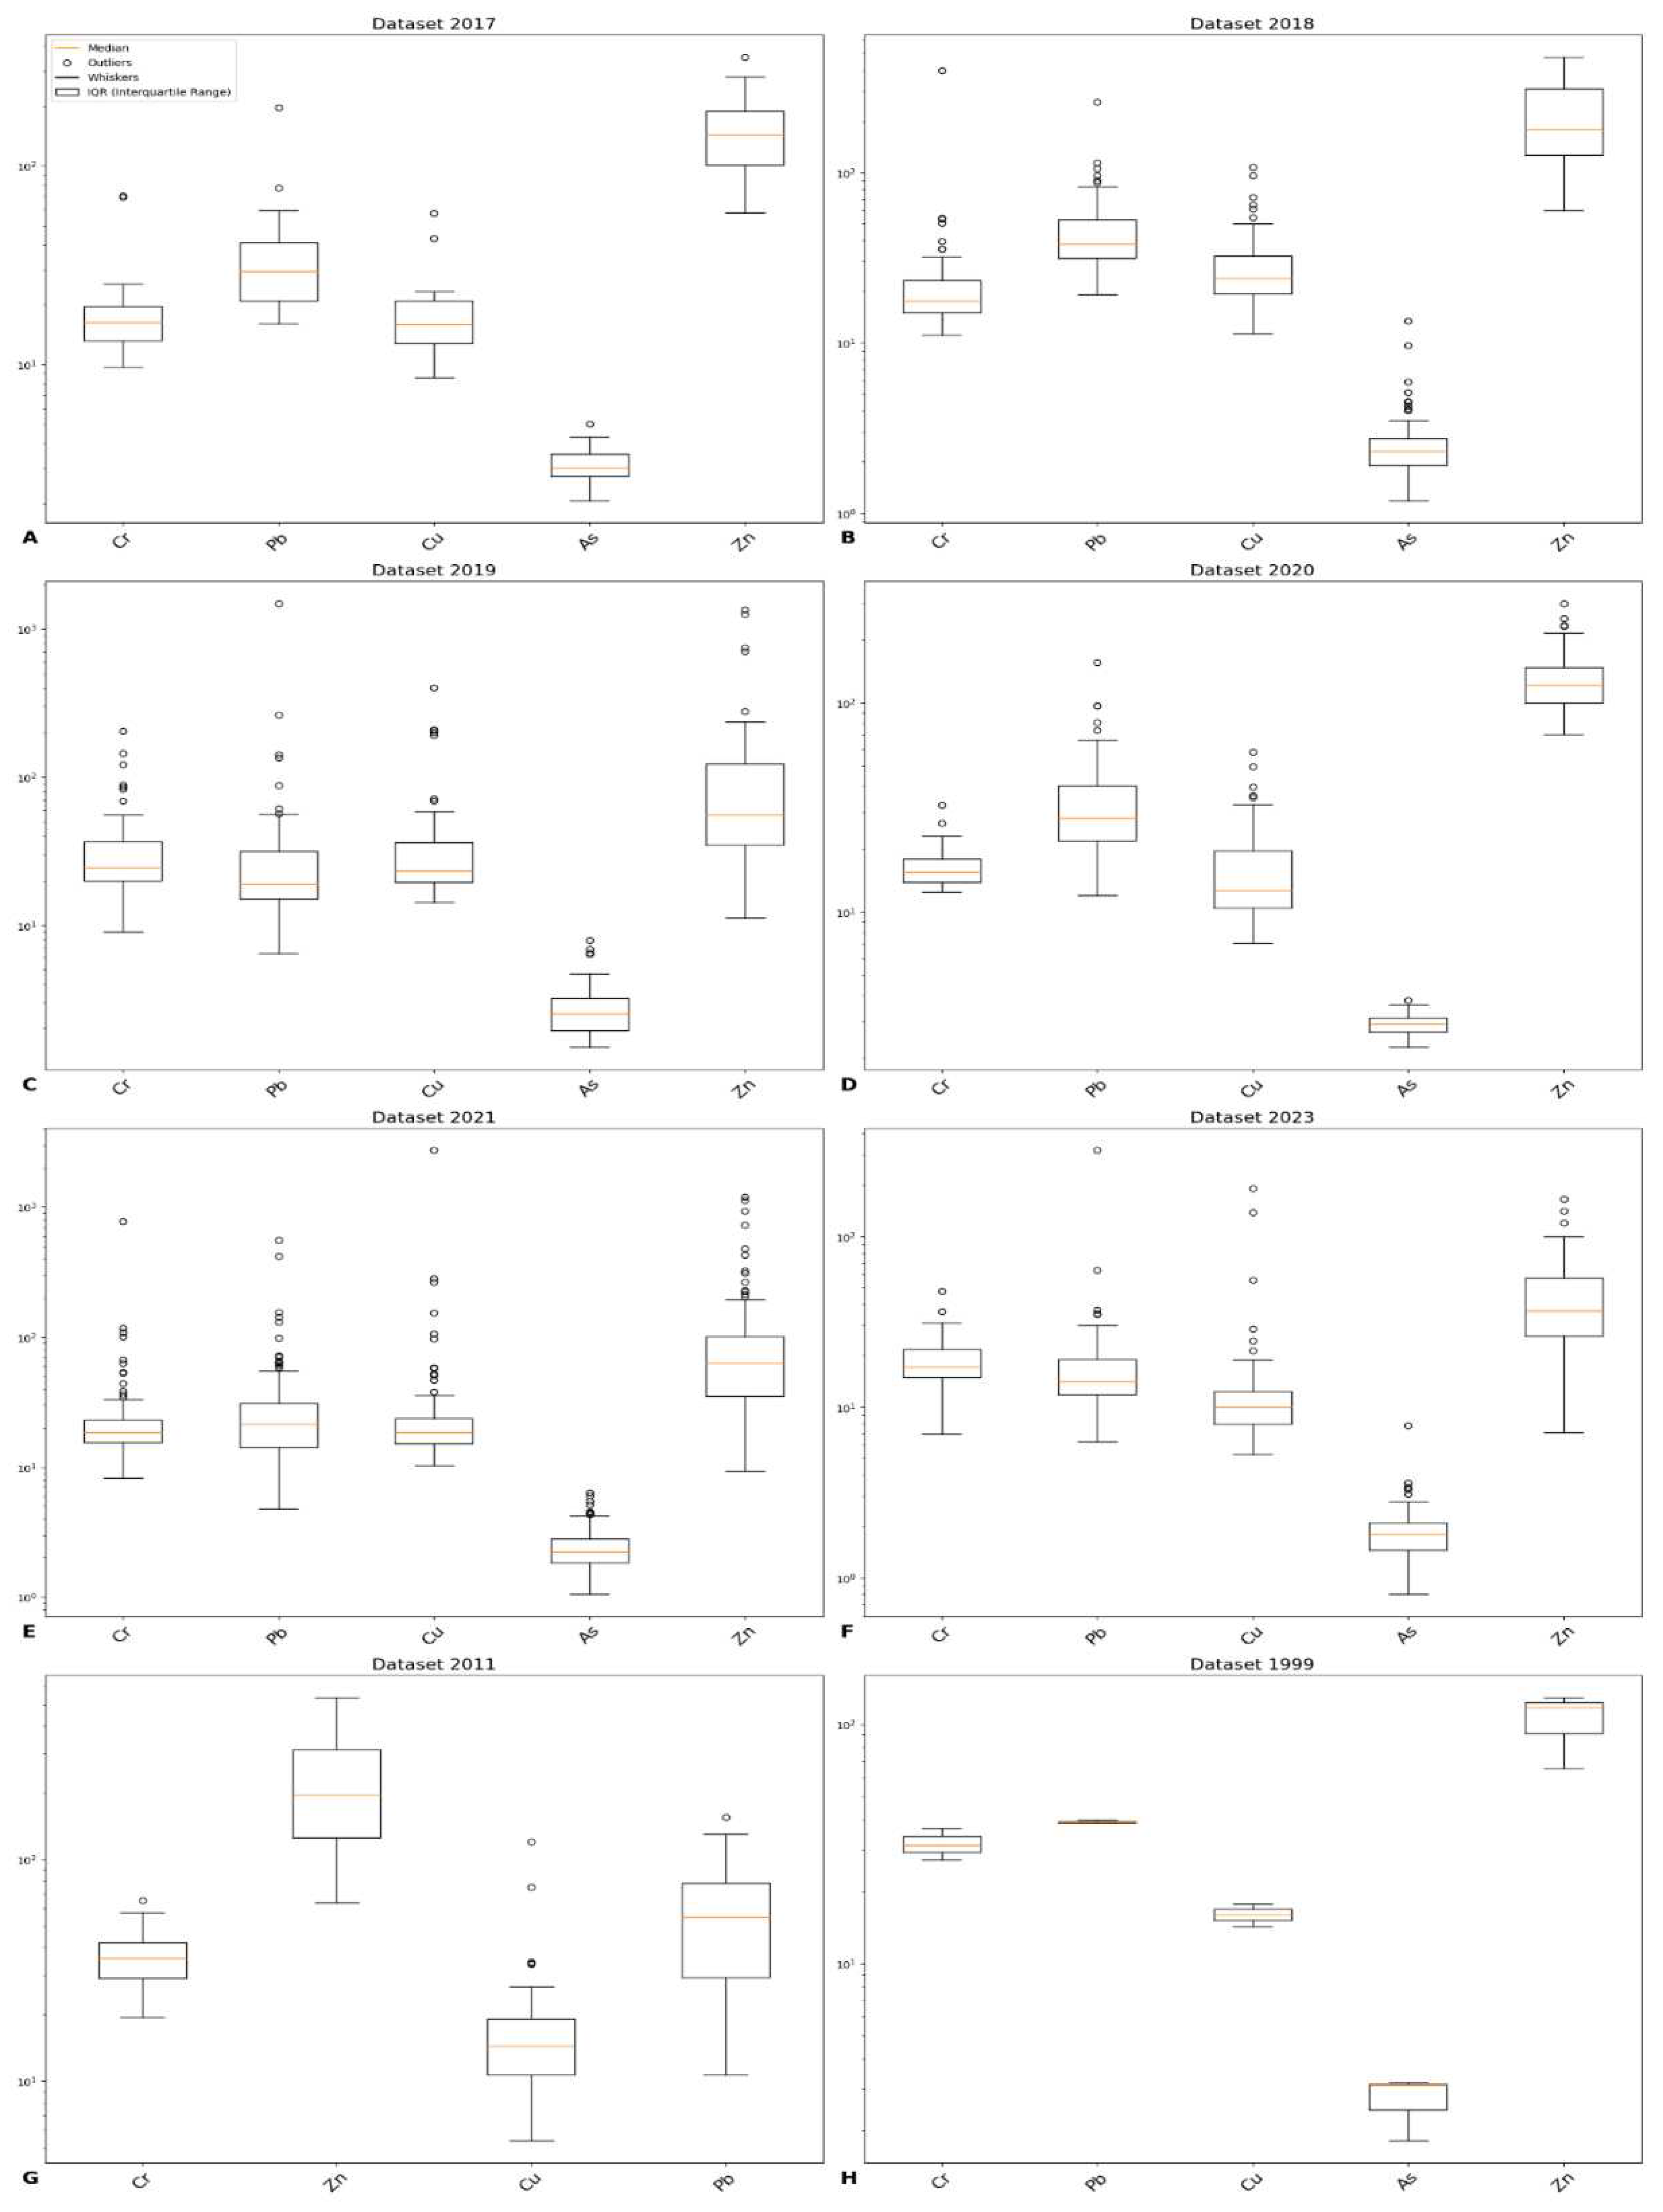
Figure 2 shows descriptive analysis of soil datasets, with 49 observations from Vilnius, Kumpiene et al. [16] Preschool Data dataset offers intriguing information regarding the amounts of several metals. With a mean of roughly 216.82 mg/kg, Zn concentrations vary widely, suggesting significant variability. There is a minimum of 63.8 mg/kg and a maximum of 537 mg/kg for Zn levels. The concentrations of Pb and Cu, with averages of 57.97 mg/kg and 18.40 mg/kg, respectively, also vary significantly. The range of lead is 10.7 mg/kg to 155 mg/kg. The average content of Cr is 36.22 mg/kg.
The dataset from Kadūnas et al.'s [20] from Vilnius is smaller, which restricts the scope of statistical analysis. Descriptive statistics, however, offer a quick glance at the metal concentrations in this sample. The mean content of Zn is 103.83 mg/kg. Zn has a concentration range of 65.5 mg/kg to 129 mg/kg. Cu has an average of 16 mg/kg, which is less variable. The average values of Pb and Cr are 39.1 mg/kg and 31.63 mg/kg, respectively. The Atlas dataset also includes measurements of As, with an average value of 2.71 mg/kg.
The heavy metal concentrations found in soil samples from 2017 ranged from 2.07 to 5.02 mg/kg for As, 9.70 to 70.60 mg/kg for Cr, 8.60 to 57.70 mg/kg for Cu, 16.00 to 196.00 mg/kg for Pb, and 58.00 to 352.00 mg/kg for Zn. These ranges show significant variation in the amounts of contaminants found in the soil, particularly for lead and Zn. A broader range was observed for several metals in the 2018 data, which were based on 65 samples. Notably, values of copper peaked at 108.00 mg/kg while Cr reached as high as 398.00 mg/kg. The range of Zn levels, from 60.20 to 479.00 mg/kg, was likewise quite noticeable. With a maximal concentration of 261.00 mg/kg, Pb showed significant variability. Certain elements, such as Zn and Cu, had incredibly high maximum levels in 2019 (404.50 mg/kg and 1352.00 mg/kg, respectively), with 58 samples. These results suggested occasional but serious contamination episodes. The lead range widened considerably, with the highest amount ever measured being 1483.00 mg/kg, a result that highlights serious pollution situations in some areas. Data from 71 samples in 2020 revealed an overall decline in the range of heavy metal concentrations when compared to 2019 levels. Metals like Cu and Cr had substantially lower maximum levels—32.60 mg/kg and 58.60 mg/kg, respectively—recorded. The highest amounts of Pb and Zn were similarly lowered, coming in at 157.00 mg/kg and 299.00 mg/kg, respectively, suggesting a potential decrease in the sources of contamination. With a bigger sample size of 130 in 2021, there was a noticeable return to more variability, particularly for Cu and Cr, which reached maximum levels of 2732.00 mg/kg and 777.00 mg/kg, respectively. The examination of 59 samples for 2023 showed a general decline in the levels of contamination for the majority of metals. In comparison to prior years, the ranges for Pb, Cu, Zn, and Cr were significantly lower, with maximum values of 318.40 mg/kg, 190.50 mg/kg, 165.00 mg/kg, and 47.80 mg/kg, respectively. Insightful information about the dynamics of the urban environment was uncovered by the DGE Baltic Soil study in 2021 and 2023, which focused on the variability of heavy metal concentrations in Vilnius. The data obtained from 2017 to 2021 and 2023 also showed a general downward trend in pollution levels over time. This investigation, which included metals including Pb, Zn, As, Cr, and Cu revealed notable variations in amounts from year to year at different urban areas. These differences point to a complicated interaction between local sources of pollution.
When examining soil data obtained from 2011 and 1999 datasets alongside dust data, notable disparities are evident in the levels of different elements. The concentration of Zn in dust is significantly greater, with an average level of 1882.59 mg/kg, as compared to 103.83 mg/kg in the Atlas dataset and 216.82 mg/kg in the preschool datasets. The data pertaining to dust likewise exhibits a significantly broader spectrum of values, as evidenced by a substantial standard deviation of 3350.09 mg/kg. In a similar vein, it is worth noting that the levels of Pb in dust are found to be increased, with an average concentration of 107.09 mg/kg. This value surpasses the recorded data for both the 2011 (57.97 mg/kg) and 2009 (39.10 mg/kg) samples. Furthermore, the presence of a substantial standard deviation of 137.91 mg/kg in the dust data provides additional support for this assertion, which is consistent with the observations made by Kumpienė et al. The concentration of Cu in dust exhibits a significant increase at 98.79 mg/kg, in contrast to the lower values observed in preschool (18.40 mg/kg) and Atlas data (16.00 mg/kg). Cr demonstrates a similar pattern, as seen by the greater average concentration of 130.22 mg/kg observed in dust samples compared to 36.22 mg/kg in 2011 samples and 31.63 mg/kg in 1999 soil samples. The variability observed in dust samples is greater than that observed in soil samples, albeit to a lesser extent compared to Zn and Pb. In contrast to the mean value of 2.71 mg/kg in the 1999 dataset, the dust samples exhibit a considerably higher average As concentration of 13.23 mg/kg. The standard deviation of the dust data, which is 14.94 mg/kg, highlights the significant fluctuation observed in the amounts of arsenic.
During the period spanning from 2017 to 2023, an analysis of soil and dust data exhibited noteworthy disparities in the levels of several elements. Zn concentrations observed in soil samples exhibited a range of values, with the lowest recorded level of 44.33 mg/kg in the year 2023, and the highest peak of 219.50 mg/kg occurring in 2018. On the contrary, the analysis of dust samples revealed significantly elevated levels of Zn, with an average concentration of 1882.59 mg/kg and a considerable range spanning from 219.50 to 16131.34 mg/kg. This observation suggests that there is significant variability in Zn levels, which can occasionally reach exceptionally high concentrations in the vicinity of educational institutions. The concentration of Pb in dust was significantly elevated, measuring 107.09 mg/kg, in contrast to the soil, which exhibited an average maximum concentration of 57.00 mg/kg in 2019 and a minimum of 21.58 mg/kg in 2023. The dust concentration exhibited a range of values spanning from 5.30 to 564.25 mg/kg, continuously surpassing the variability observed in soil. Notably, soil had a notable rise in 2019, reaching an extreme value of 1483.00 mg/kg. Cu levels in soil samples exhibited temporal variations, with the minimum concentration recorded at 16.65 mg/kg in the year 2020, while the maximum concentration was observed at 47.46 mg/kg in the year 2021. Nevertheless, the dust samples exhibited considerably elevated levels of Cu, with an average concentration of 98.79 mg/kg and a range spanning from 51.28 to 395.37 mg/kg. The soil samples exhibited a variation in Cr levels, with concentrations ranging from 16.61 mg/kg in 2020 to 36.35 mg/kg in 2019. In contrast, the dust samples displayed a higher average concentration of 130.22 mg/kg, with a narrower range of 60.82 to 221.18 mg/kg. In conclusion, the average levels of As in dust were found to be much higher at 13.23 mg/kg, in contrast to the very minor variations observed between 1.97 and 3.20 mg/kg in soil samples. This indicates that soil may not serve as the primary source of exposure in school environments. It is noteworthy to acknowledge that the datasets from 2017 and 2020 exhibit the closest proximity to our dust samples, given they were likewise collected from schools.
One possible explanation for the observed differences can be attributed to the linked distinctions between soil and dust particles. The composition of soil extends a wider spectrum of particle sizes, ranging from bigger to finer, in contrast to dust particles which are generally characterized by their smaller size. The difference in size between these entities has a notable impact on their ability to concentrate and engage with their surroundings. The study on outdoor dust revealed a positive correlation between the presence of smaller particles and elevated pollutant levels [21]. The concentration of heavy metals and other elements indoor dust exhibits considerable variation across various particle sizes. Another investigation conducted by Beamer et al. [22] investigated the presence of increased metal concentrations in small particles (less than 63 µm) discovered in indoor dust and soil. Notably, the finest dust particles tend to contain the highest concentrations of numerous heavy metals and elements, while there is a general decline in concentration as the particle size increases [23]. Additionally, it should be acknowledged that particles of smaller sizes, specifically those less than 150 µm [24] and less than 100 µm [25], exhibit a greater specific surface area, elevated levels of organic carbon content, and enhanced cation exchange capacity. According to Gunawardana et al. [24], such characteristics increase the effectiveness of smaller particles in the process of metal adsorption when compared to bigger particles. It might be asserted that there may exist a correlation between higher concentration and this particular aspect.

| Year | Arsenic (As) | Chromium (Cr) | Copper (Cu) | Zinc (Zn) | Lead (Pb) |
|---|---|---|---|---|---|
| 2017 | 3.20 | 20.31 | 18.41 | 150.69 | 38.98 |
| 2018 | 2.76 | 26.60 | 29.82 | 219.50 | 48.64 |
| 2019 | 2.86 | 36.35 | 45.59 | 141.19 | 57.00 |
| 2020 | 2.93 | 16.61 | 16.65 | 131.25 | 34.90 |
| 2021 | 2.44 | 28.31 | 47.46 | 110.75 | 34.58 |
| 2023 | 1.97 | 18.58 | 16.76 | 44.33 | 21.58 |
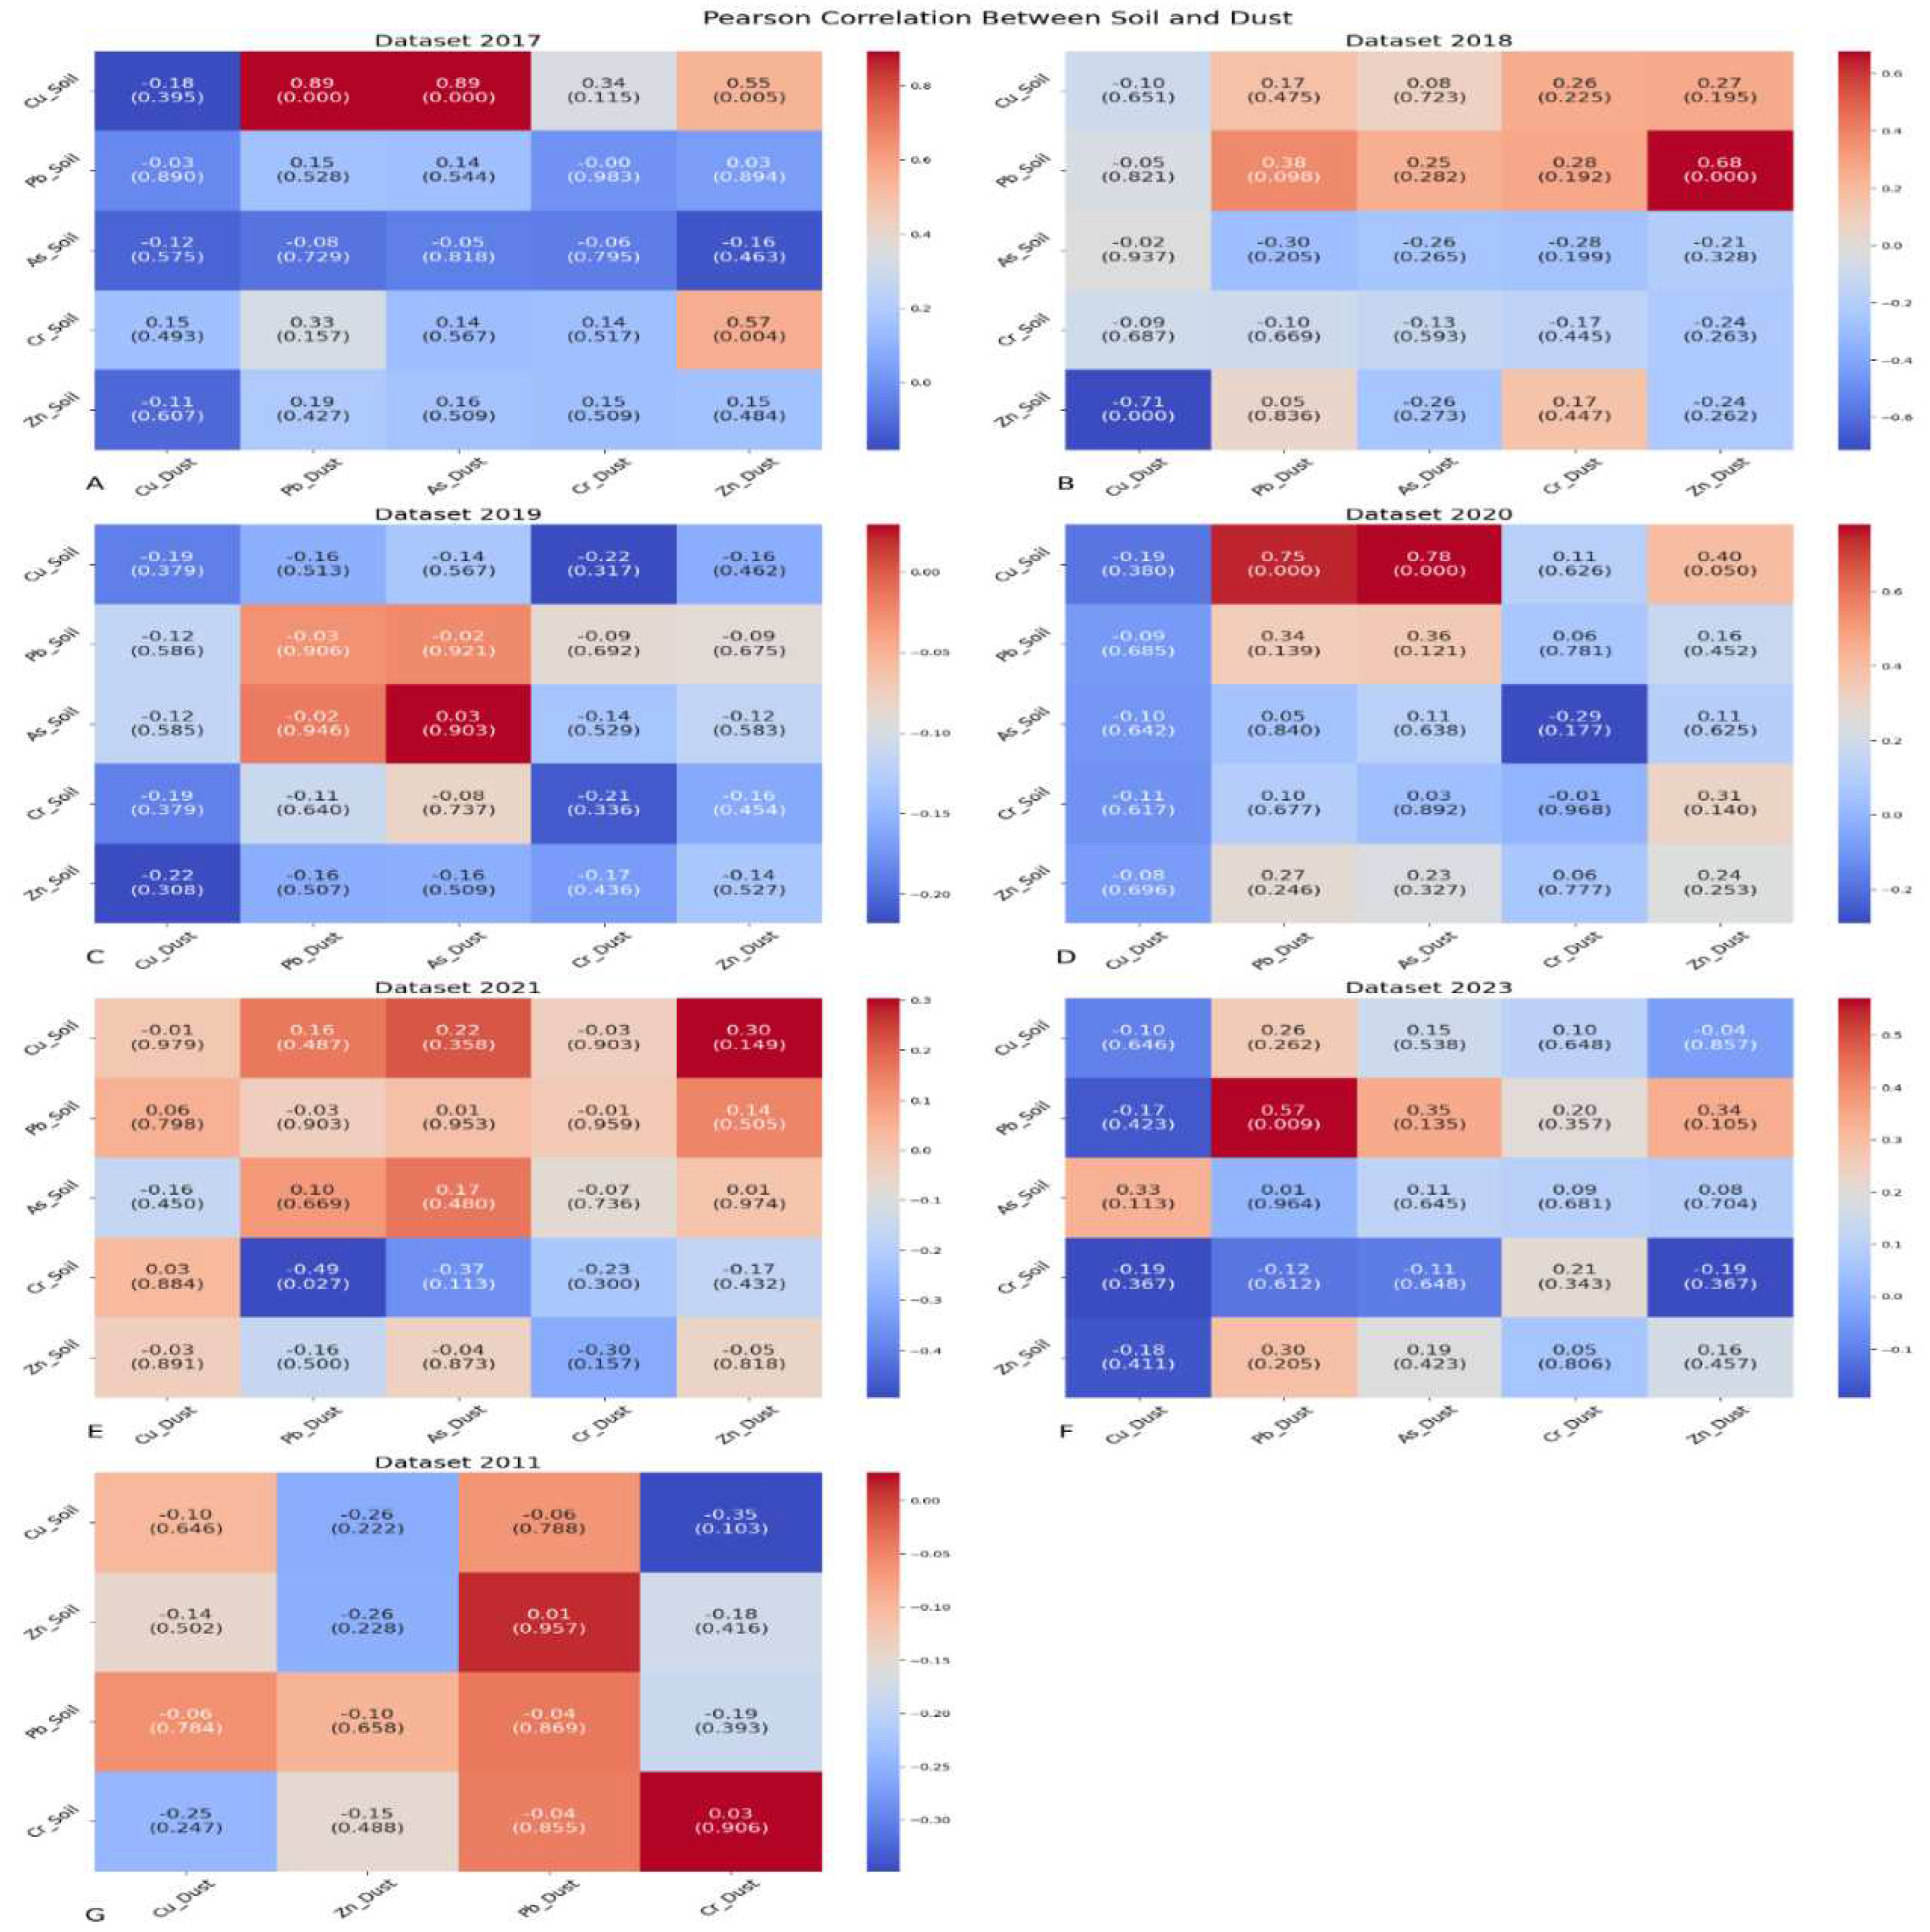
3.1. Pearson Correlations
A Pearson correlation analysis between the metals was carried out in order to gain further insight into the differences in the distribution of metal contamination across various investigations conducted in the same city. There were found to be significant relationships between the concentrations of the various metal species and nevertheless, in some data locations there was no correlation found between the levels of heavy metals in urban dust and soil (Figure 3).
Since all p-values in the 2011 dataset are higher than the 0.05 threshold, none of the connections between elements in soil and school dust, such as Pb, Cu, Cr, and Zn, are statistically significant, there were no As in this study to pair. This may be because of different environmental circumstances or other unmeasured factors impacting their distributions, but it also shows that there are weak or inconsistent correlations between these components in soil and school dust for this specific year.
Investigation over a number of years has shown intriguing relationships between elements in soil and those in school dust. In 2017, we found a substantial relationship between Pb in school dust and Cu levels in soil, as well as an association between As and Cu in the dust. Furthermore, a moderate but substantial association between Zn in school dust and Cr and Cu in soil was discovered. According to the 2018 data, there was a significant inverse association between Cu in schools’ dust and Zn in soil, and a substantial correlation between Zn in school dust and Pb in soil. Surprisingly, the 2019 data showed no considerable connections. Significant relationships were found in 2020 between Cu in soil and Pb, As, and Zn, among other elements in school dust. A moderately negative connection was seen in the 2021 data between Pb in school dust and Cr in soil. In 2023 revealed a somewhat favorable association between Pb concentrations in soil and school dust. These annual correlations highlight the sophisticated relationships that exist between dust and soil pollutants in school settings.
Similar sources, such as industrial emissions, infrastructure deterioration, and transportation, are frequently the source of heavy metals found in urban soil and dust. But between soil and dust, their concentrations vary greatly [28]. According to Peng et al. [29] and Mahanta et al. [30], heavy metals have a tendency to attach to soil particles, which makes the soil a sink for these metals and causes their levels to fluctuate slowly. On the other hand, the levels of heavy metals in urban dust are significantly impacted by both natural and human disturbances. Road dust gets renewed by rainfall, strong winds, and road cleaning [31]. However, indoor dust, especially in areas with limited air flow, can accumulate for extended periods of time and can be different than outdoor dust.
Figure 3.
Pearson correlation between dust and soil datasets.
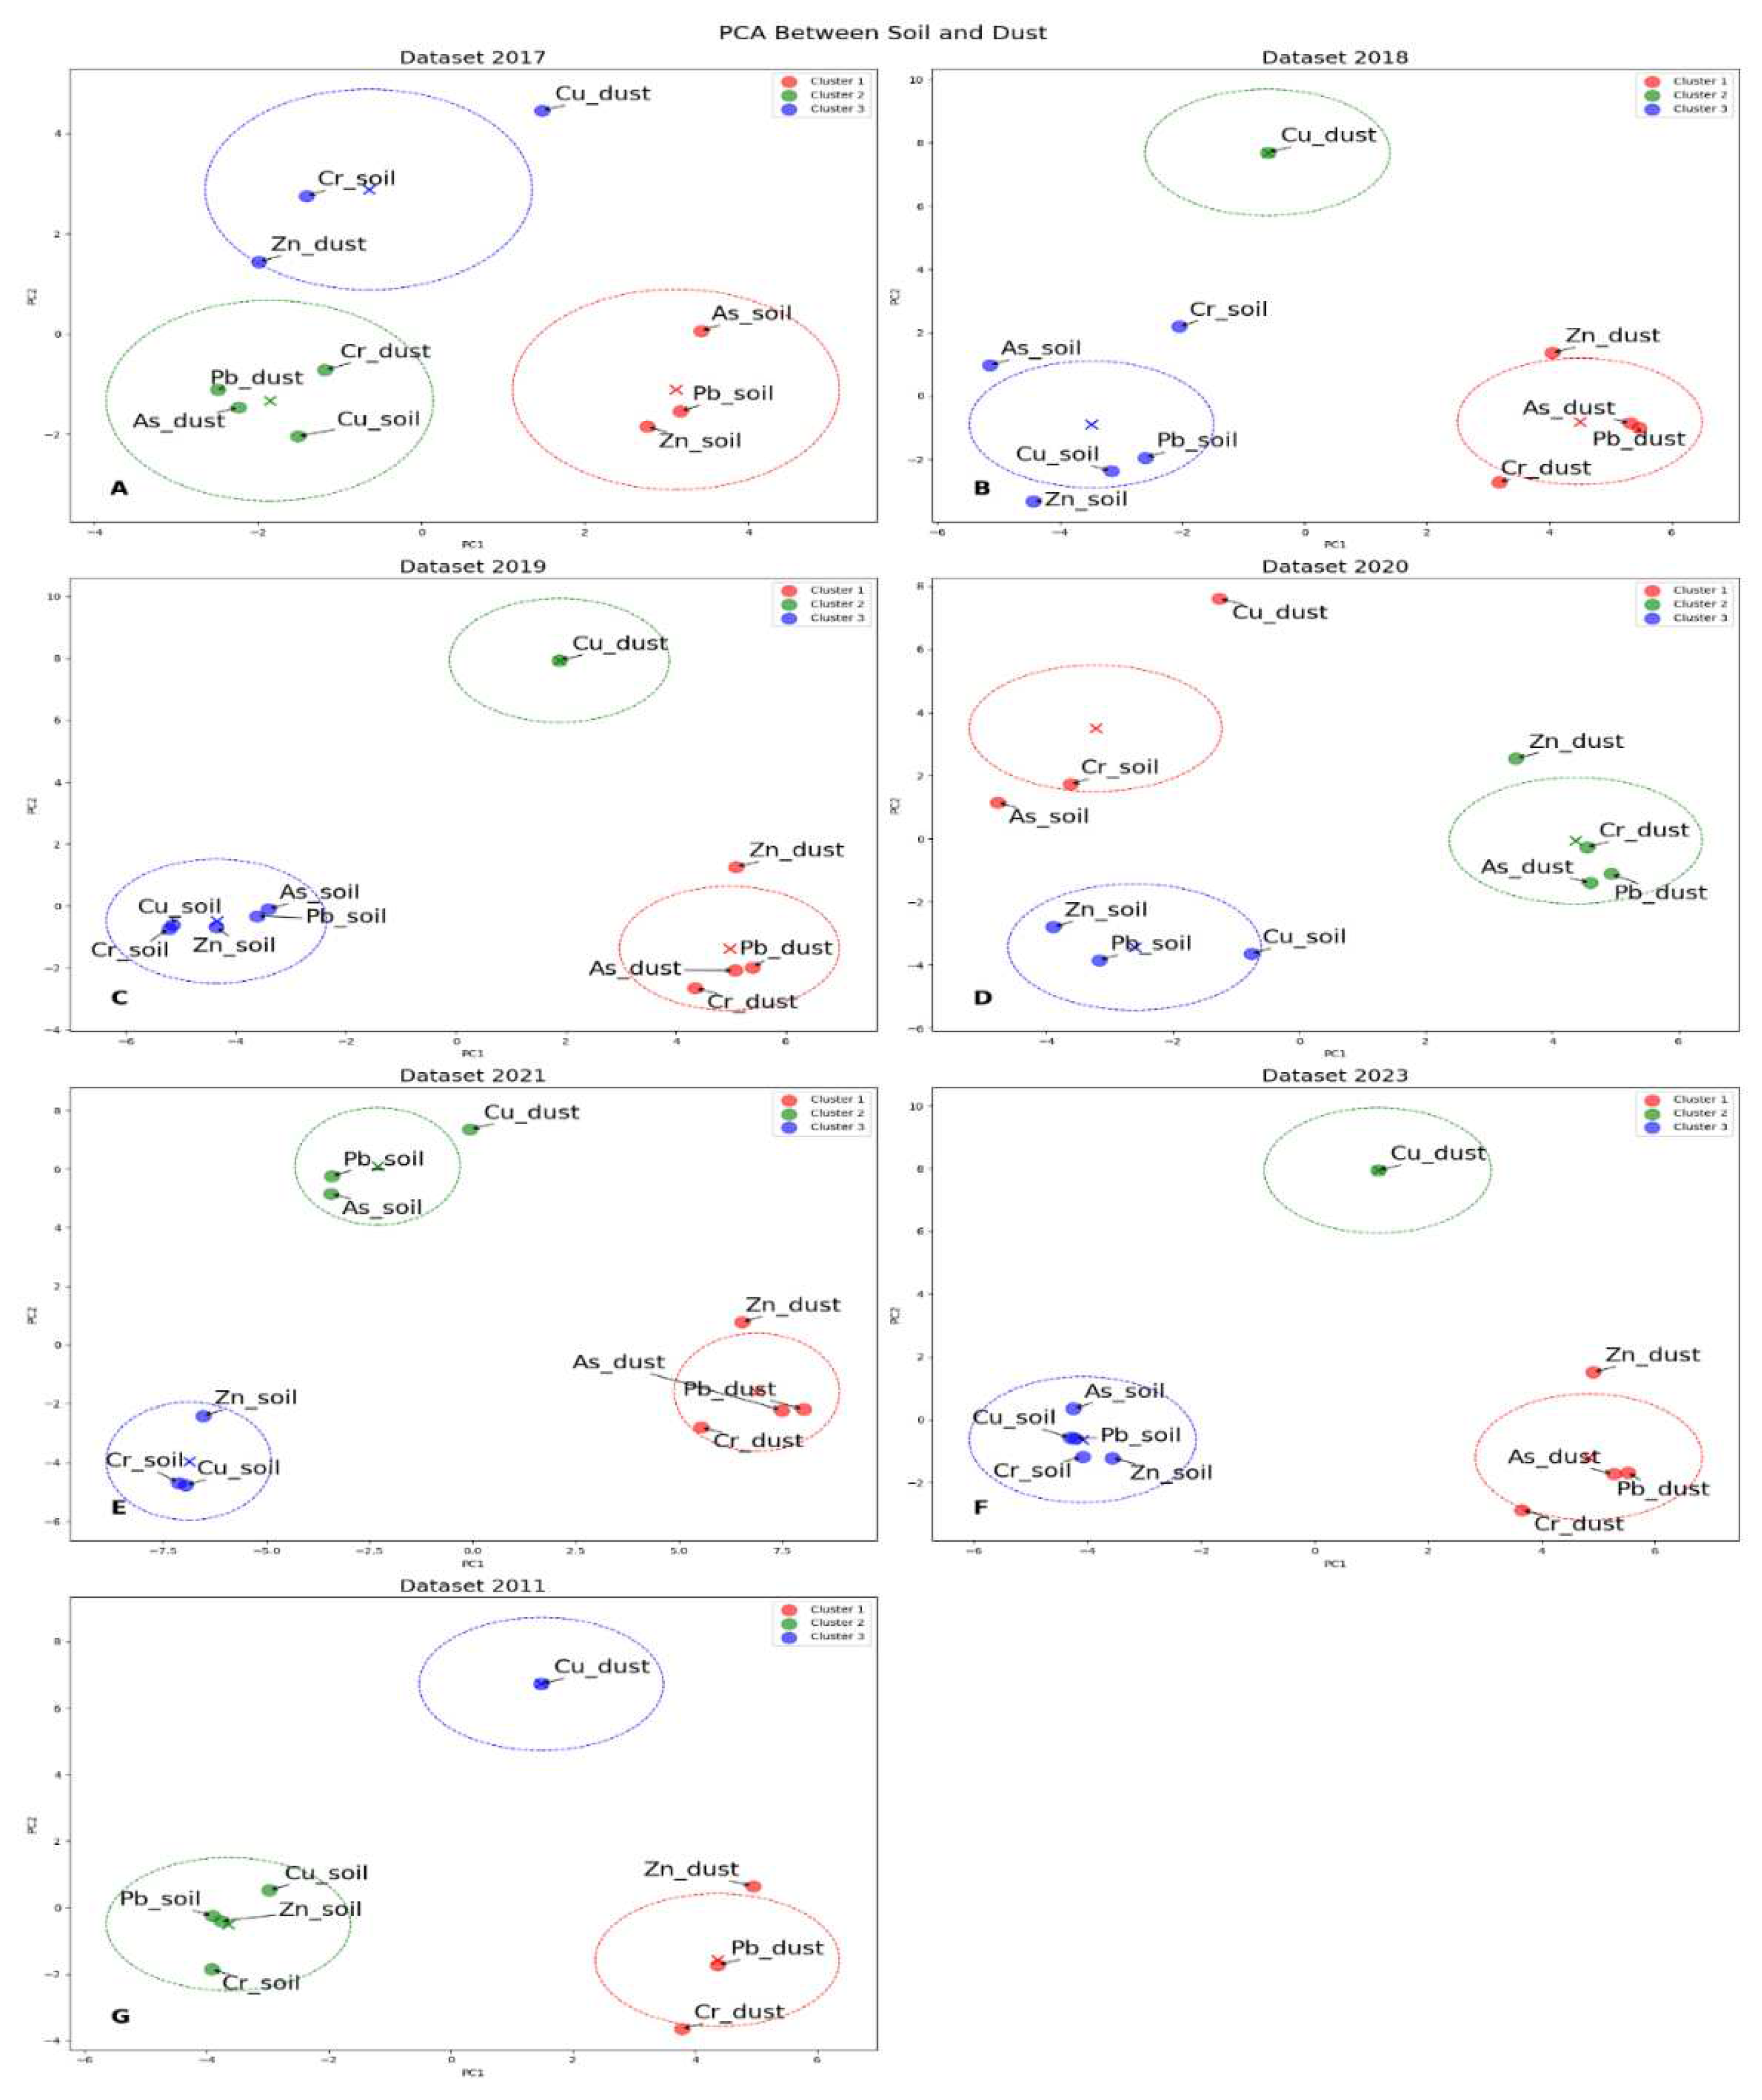
3.2. Principal Component Analysis with Clusters
The study utilized Principal Component Analysis (PCA) in conjunction with K-Means clustering to examine the distribution of several environmental factors in soil and school dust samples obtained from 2017 to 2023, as well as a particular dataset known as Kumpienė et al. [16]. By using this method, it was possible to find patterns and connections between the different elements, which provided information about the effects of the environment and possible sources of contamination (Figure 4).
Three separate clusters were identified by the 2017 data. The first cluster primarily consisted of soil elements such as Cu and Cr from both dust and soil also dust Zn influences this cluster. Zn, Pb, and As—elements found in both soil and school dust—were combined in the second cluster along with Cu from soil, suggesting the presence of common environmental variables and human influences, because of the high traffic density and consequent wear and tear on vehicle components, vehicles are especially important as a source of copper and zinc in metropolitan areas. This may result in higher concentrations of these metals in dust and soil near roadsides. The components of soil made up the third cluster. 2018 and 2019 data showed that one cluster of elements in the soil and school environments followed a similar pattern of element distribution, while another cluster's components differed from those of the soil, indicating separate environmental impacts. Interestingly, Cu in school dust developed its own cluster, indicating distinct sources or mechanisms contributing to accumulation in the school setting. Similar to the diversity observed in the 2017 data, a broader range of origins and settings were revealed by the examination of soil and dust in 2020. But clusters made of Cu in dust and As and Cr in soil remained distinctive, especially when compared to dust and soil from schools, these elements can be released from fossil fuels during combustion. The trends seen in the data from 2020 and 2017 were also evident in the data from 2021. As, Pb from soil, and Cu from dust were grouped together in the cluster analysis, while a different cluster that represented direct sources from the soil and dust was clearly separated. Due to its strong capacity for long-distance air transport, Pb contributes to pollution levels both locally and globally. The mining and smelting industries are the main producers of Pb pollution [32]. Although its historical usage in from solvent-based paints shows smaller particle sizes and elevated levels of dangerous metals such as As, Cu, Pb, and Zn in comparison to dust from water-based paints [33] and gasoline, it is frequently found in urban soils, vehicle exhaust, tire wear, and bearing wear are also contributing factors to the current pollution [32].
Elements were classified based on similarities in their environmental distributions in years when there were numerous clusters. For example, certain heavy metals were frequently detected in combination, indicating shared sources or comparable environmental routes indicating differing environmental dynamics in these locations. The distinct environmental characteristics seen in school settings were highlighted by the dust data from the schools, which showed up in different clusters from the soil data. 2011 dataset and some annual studies made this very clear, pointing to factors like indoor activities or nearby sources of pollution.
Different years' analyses revealed a combination of multiple cluster distributions. A single dominant cluster was seen in years like 2018, 2019, 2023 and 2011, except dust Cu, it always created another cluster in datasets, indicating a consistent environmental influence in both soil and school’s dust contexts. On the other hand, years like 2017, 2020 and 2021 showed several clusters, pointing to a wider variety of environmental effects. High amounts of Cu were found close to bus stops, railroad stations, and a parking lot on a commercial road. Cu has been used in brake friction materials since the 1930s, which is related to this (Li et al., 2016). Furthermore, the closer proximity of certain schools to these bus and rail stations—where dust samples were collected—could potentially be a factor in the higher Cu levels detected in these regions.
Figure 4.
PCA between dust and soil datasets.
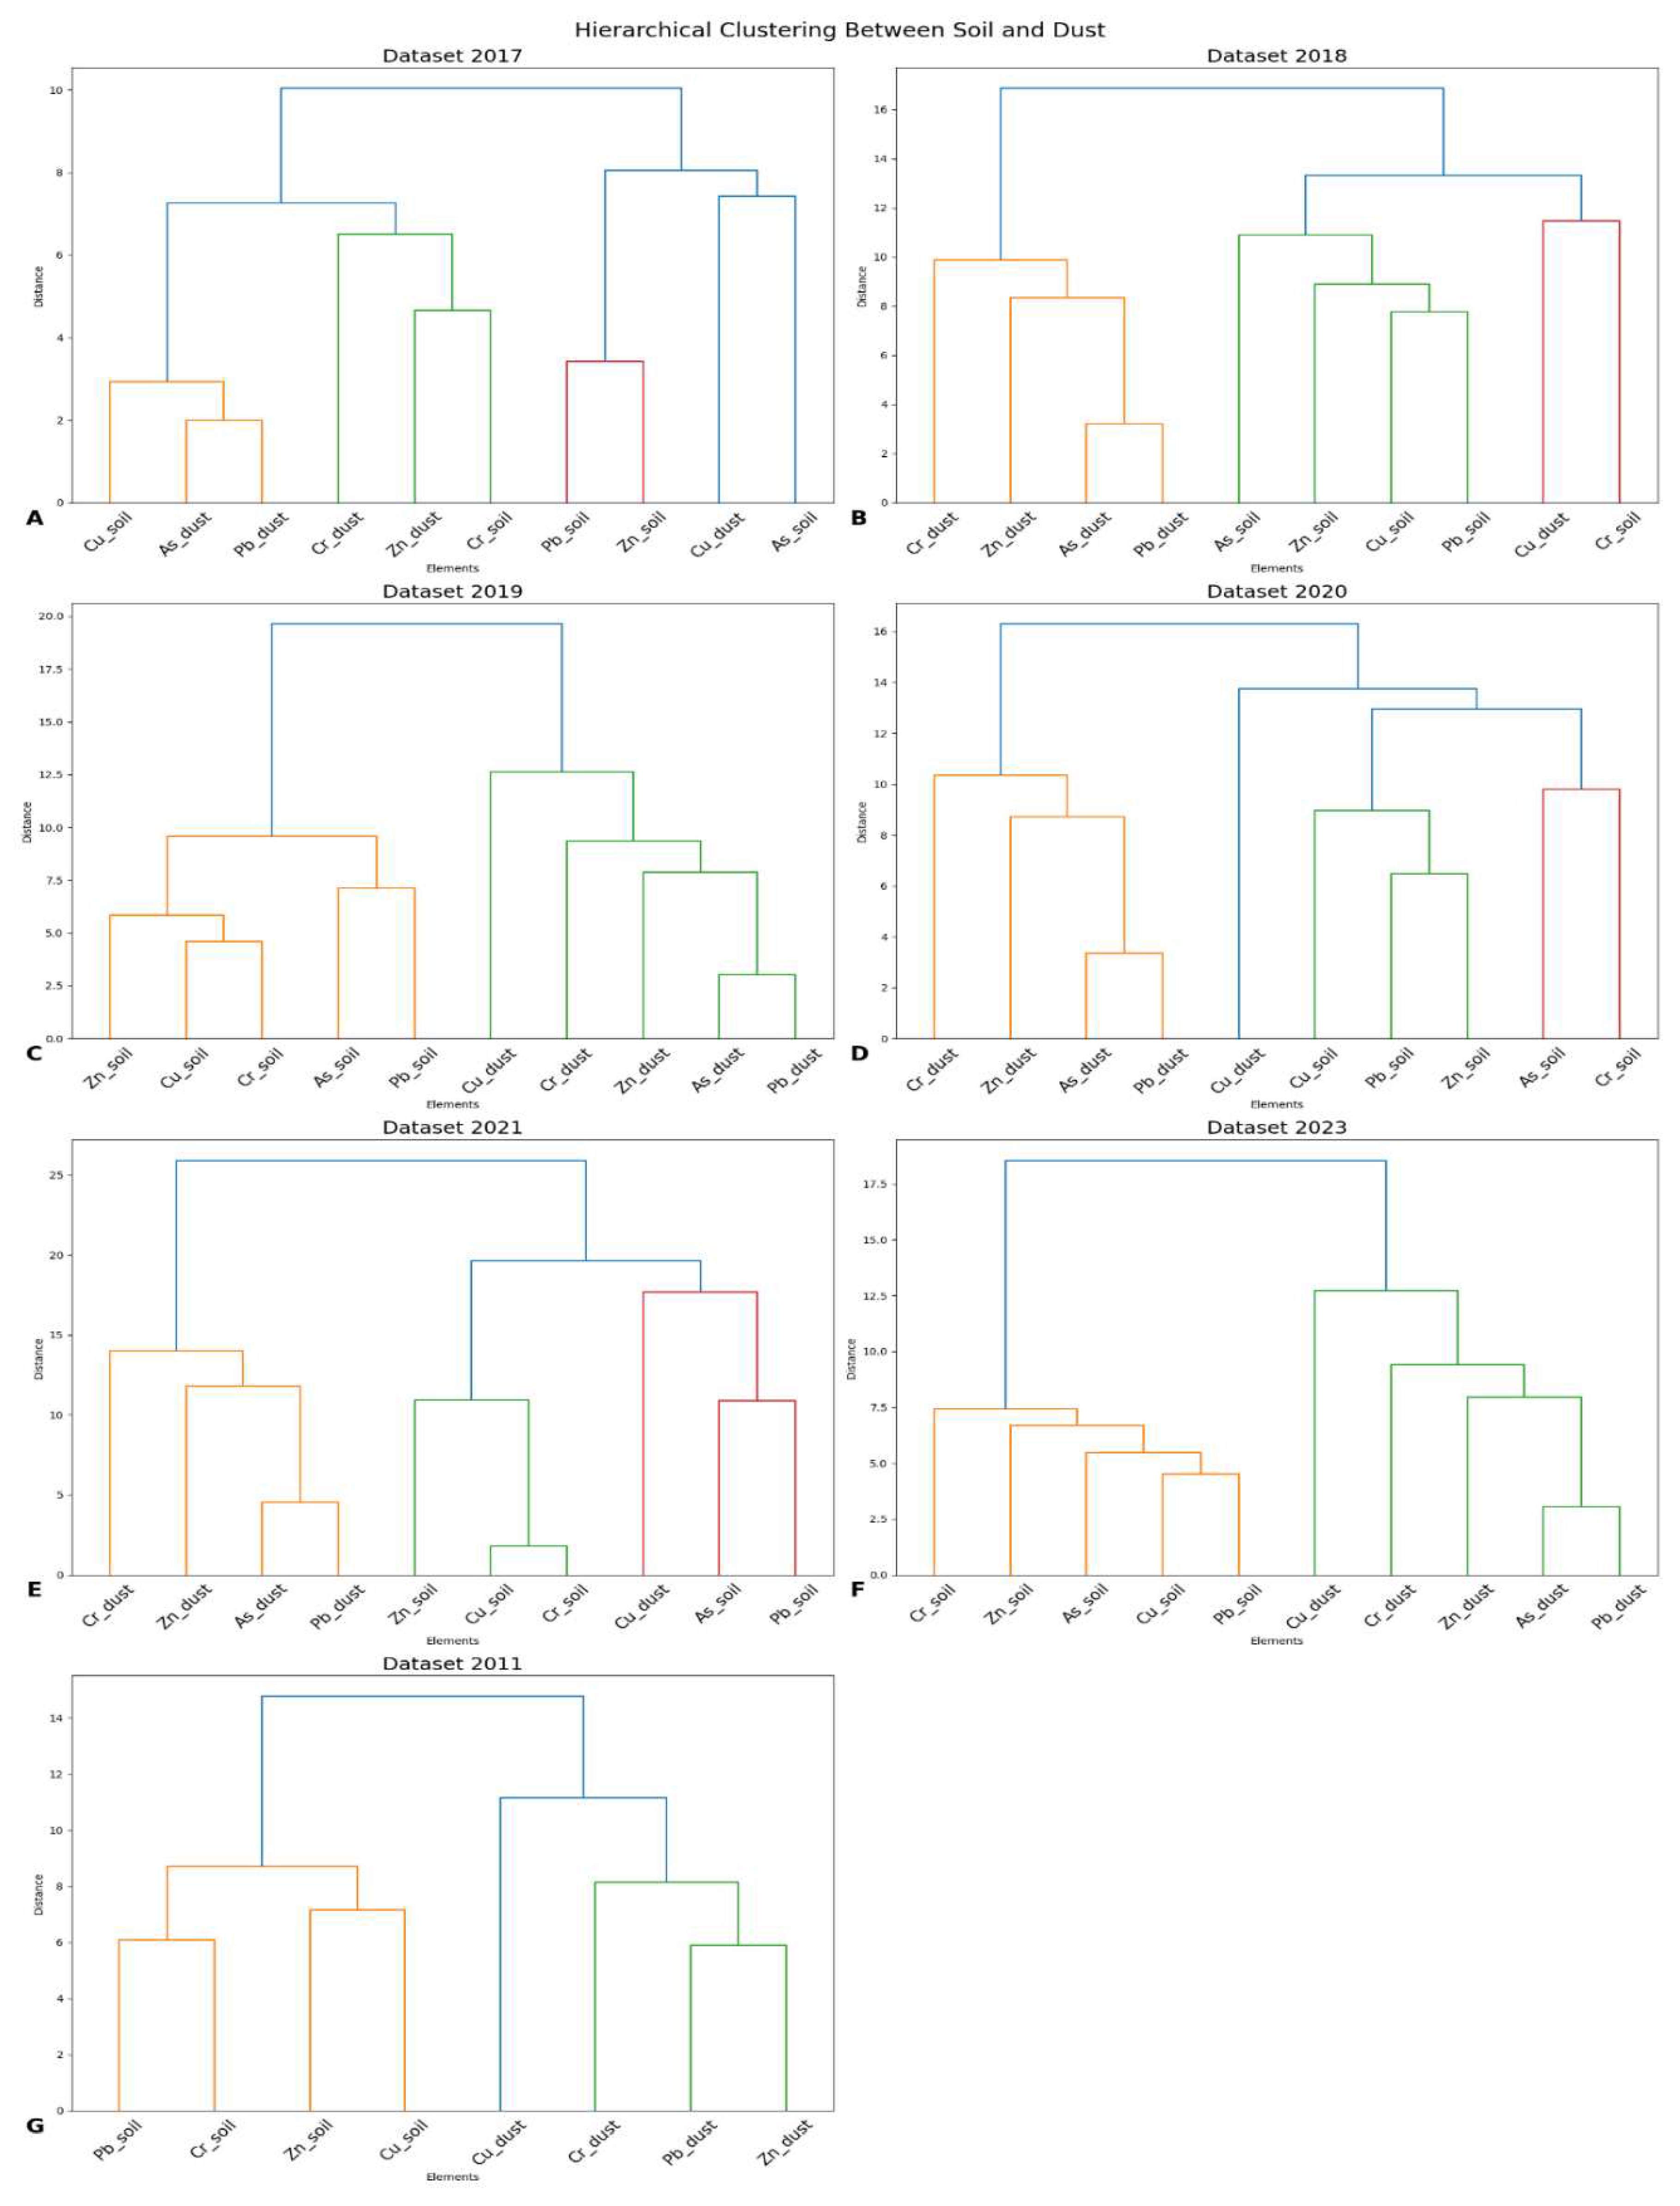
3.3. Hierarchical Clustering Analysis
The main findings into elemental behavior and environmental contamination found in Vilnius between 2017 and 2021 can be obtained from the hierarchical clustering of soil and school dust samples. Over the years, patterns in the dendrogram show that elements such as Cr, As, Pb, Cu, and Zn in soil and dust have both common and distinct properties (Figure 5).
The appearance of elements such as 'Cr_Dust' and 'Cr_Soil' in close proximity in 2017 and 2018 indicates a mirrored Cr presence in both mediums, most likely as a result of widespread environmental pollution. On the other hand, in 2018, the distinction between 'As_Soil' and 'As_Dust' suggests that there are different sources or concentrations of As in soil and dust; this is also the case for Pb, Cu, and Zn. By 2019, there is a noticeable difference in the way these elements cluster between dust and soil, indicating distinct dynamics or sources of contamination. This divergence is becoming increasingly noticeable. 2020 and 2021, on the other hand, show more detailed pattern. Although some elements first group together with soil samples, suggesting similar environmental features, their eventual inclusion in the dust element cluster indicates other contributing aspects. 2019-like trends are also evident in soil data from 2023 and 2011. Findings of both PCA and hierarchical clustering consistently group the same elements together and show comparable trends in elemental distribution over time, therefore similarities between the two techniques can be identified.
Figure 5.
Hierarchical clustering analysis between dust and soil datasets.
Even though the majority of the heavy metals in urban soil and dust came from similar sources—such as transportation, vehicular and industrial emissions, air depositions, power plants that use fossil fuels, infrastructure construction, destruction or renovation, windstorms, cooking, or even dust carried in by shoes—the distribution of heavy metal concentrations in urban soil and indoor dust shows similarity and differences from each other according to years and studies.
4. Conclusion
This extensive investigation has examined the concentrations of harmful metals in dust found indoors and in the uppermost layer of soil in Vilnius. The study covers a time frame from 2011 to 2023 for topsoil. Our investigation uncovers complex patterns of environmental pollution, specifically within educational settings.
The identification of elevated levels of particular metals in indoor dust suggests distinct origins or mechanisms of deposition that diverge from those impacting surface soil. The difference in concentration levels between indoor and outdoor environments is particularly noticeable in the case of zinc (Zn). The comparative and correlational analysis conducted in our study over multiple years not only detected occasional instances of pollution but also revealed larger environmental patterns. The data unveiled correlations between metal concentrations and particular years or locations in close proximity to dust sites, indicating the presence of pollution from specific sources in those areas. Furthermore, the study revealed both symmetrical and unique grouping patterns for specific metals, suggesting different sources or techniques of contamination. These patterns highlight the intricate interaction of various elements that contribute to the accumulation of metals in diverse environments.
An important discovery of this study is the distinct separation in the distribution patterns of zinc (Zn), lead (Pb), copper (Cu), chromium (Cr), and arsenic (As) between dust found indoors and the upper layer of soil. This differentiation implies that although there may be certain shared sources of pollution for both mediums, indoor dust in schools possesses distinct contamination characteristics. Evidently, the buildup of harmful elements in dust found in schools seems to occur over an extended period of time. This process is affected by various factors, including the age of the school buildings, their restoration history, proximity to highways or train stations, weather conditions, wind patterns, air circulation within the buildings, and the use of cleaning agents, among others. Older schools or schools that have been renovated to different extents over the years exhibit differences in the levels of heavy metals, which indicate the evolving indoor conditions over time.
To summarize, this study sheds light on the ever-changing state of environmental pollution in Vilnius, specifically inside school environments. This highlights the significance of focused environmental investigations for efficient policy formulation and management approaches. Our research shows a correlation between soil pollution and the presence of metal in interior dust. Additionally, we have identified specific elements that affect indoor settings, such as the age, restoration history and vicinity of school buildings. These observations require a sophisticated method for dealing with environmental health risks in schools, considering both the gradual build-up over time and the structural differences in educational buildings.
Funding
The authors have no relevant financial or non-financial interests to disclose.
Data Availability Statement
The data that support the study's findings are not publicly available owing to sensitivity concerns but are available from the corresponding author upon reasonable request.
Conflicts of Interest
In our paper, there are no potential competing interests. And all of the authors have read the manuscript and agreed to submit it to your journal. We confirm that the manuscript's material has not been published or submitted for publication elsewhere. The research was carried out following the guidelines of the ethics committee listed in the ethics statements.
References
- Ignatavičius, G.; Unsal, M.H.; Busher, P.E.; Wołkowicz, S.; Satkūnas, J.; Šulijienė, G.; Valskys, V. Geochemistry of Mercury in Soils and Water Sediments. AIMS Environ. Sci. 2022. [Google Scholar] [CrossRef]
- Yesilkanat, C.M.; Kobya, Y. Spatial Characteristics of Ecological and Health Risks of Toxic Heavy Metal Pollution from Road Dust in the Black Sea Coast of Turkey. Geoderma Reg. 2021, 25, e00388. [Google Scholar] [CrossRef]
- Muhamad-Darus, F.; Nasir, R.A.; Sumari, S.M.; Ismail, Z.S.; Omar, N.A. Nursery Schools: Characterization of Heavy Metal Content in Indoor Dust. Asian J. Environ.-Behav. Stud. 2017, 2. [Google Scholar] [CrossRef]
- Radhi, A.B.; Shartooh, S.M.; Al-Heety, E.A. Heavy Metal Pollution and Sources in Dust from Primary Schools and Kindergartens in Ramadi City, Iraq. Iraqi J. Sci. 2021, 62. [Google Scholar] [CrossRef]
- Sezgin, N.; Ozcan, H.; Demir, G.; Nemlioglu, S.; Bayat, C. Determination of Heavy Metal Concentrations in Street Dusts in Istanbul E-5 Highway. Environ. Int. 2004, 29, 979–985. [Google Scholar] [CrossRef] [PubMed]
- Al-Khashman, O.A. Heavy Metal Distribution in Dust, Street Dust and Soils from the Work Place in Karak Industrial Estate, Jordan. Atmos. Environ. 2004, 38, 6803–6812. [Google Scholar] [CrossRef]
- Suryawanshi, P.; Rajaram, B.; Bhanarkar, A.D.; Rao, C.V. C. Determining Heavy Metal Contamination of Road Dust in Delhi, India. Atmósfera. 2016, 29, 221–234. [Google Scholar] [CrossRef]
- Trujillo-González, J.M.; Torres-Mora, M.A.; Keesstra, S.; Brevik, E.C.; Jiménez-Ballesta, R. Heavy Metal Accumulation Related to Population Density in Road Dust Samples Taken from Urban Sites Under Different Land Uses. Sci. Total Environ. 2016, 553, 636–642. [Google Scholar] [CrossRef]
- Grigalavičienė, I.; Rutkovienė, V.; Marozas, V. The Accumulation of Heavy Metals Pb, Cu and Cd at Roadside Forest Soil. Polish J. Environ. Stud. 14.
- Jankaitė, A.; Baltrėnas, P.; Kazlauskienė, A. Heavy Metal Concentrations in Roadside Soils of Lithuania’s Highways. Geologija 2008, 50, 237–245. [Google Scholar] [CrossRef]
- HN 60-1996. Hazard Substances. Maximum Permitted and Temporarily Permitted Concentration in Soil. Health Protection Ministry of Lithuanian Republic, 1996.
- Vaicys, M. Results of Forest Soil Monitoring. In Monitoring of Forest Ecosystems in Lithuania. Ed. Ozolinčius, R., 1999, pp. 122-142.
- Taraškevičius, R.; Zinkutė, R.; Jankauskaitė, M. Differences of Vilnius Topsoil Contamination in the Neris River Valley Due to Anthropogenic Factors. Geologija 2008, 50, 135–142. [Google Scholar] [CrossRef]
- Taraskevicius, R.; Zinkutė, R.; Čyžius, G.J.; Kaminskas, M.; Jankauskaitė, M. Soil Contamination in One of Preschools Influenced by Metal Working Industry. Vide. Tehnologija. Resursi - Environ. Technol. Resour. 2013, 1, 83–86. [Google Scholar]
- Taraškevičius, R.; Zinkutė, R.; Čyžius, G.J.; Kaminskas, M.; Jankauskaitė, M. Soil Contamination in One of Preschools Influenced by Metal Working Industry. Environ. Technol. Resour. Proc. Int. Sci. Pract. Conf. 2015, 1, 83. [Google Scholar] [CrossRef]
- Kumpienė, J.; Brännvall, E.; Taraškevičius, R.; Aksamitauskas, E.; Zinkutė, R. Spatial Variability of Topsoil Contamination with Trace Elements in Preschools in Vilnius, Lithuania. J. Geochem. Explor. 2011, 108, 15–20. [Google Scholar] [CrossRef]
- Vilnius City Municipality Administration. Soil Pollution. https://aplinka.vilnius.lt/aplinkos-kokybe/uzterstos-teritorijos/dirvozemio-tarsa/#17 (accessed on 10.10.2023).
- Chen, H.; Lu, X.; Gao, T.; Chang, Y. Identifying Hot-Spots of Metal Contamination in Campus Dust of Xi’an, China. Int. J. Environ. Res. Public Health 2016, 13, 555. [Google Scholar] [CrossRef] [PubMed]
- Zheng, Y.; Gao, Q.; Wen, X.; Yang, M.; Chen, H.; Wu, Z.; Lin, X. Multivariate Statistical Analysis of Heavy Metals in Foliage Dust Near Pedestrian Bridges in Guangzhou, South China in 2009. Environ. Earth Sci. 2012, 70, 107–113. [Google Scholar] [CrossRef]
- Kadūnas, V.; Budavičius, R.; Gregorauskienė, V.; Katinas, V.; Kliaugienė, E.; Radzevičius, A.; Taraškevičius, R. Lietuvos Geocheminis Atlasas - Geochemical Atlas of Lithuania. 1999, Publisher: Geologijos institutas, Vilnius, Lithuania.
- Logiewa, A.; Miazgowicz, A.; Krennhuber, K.; Lanzerstorfer, C. Variation in the Concentration of Metals in Road Dust Size Fractions Between 2 µm and 2 mm: Results from Three Metallurgical Centres in Poland. Arch. Environ. Contam. Toxicol. 2019, 78, 46–59. [Google Scholar] [CrossRef] [PubMed]
- Beamer, P.I.; Elish, C.A.; Roe, D.J.; Loh, M.M.; Layton, D.W. Differences in Metal Concentration by Particle Size in House Dust and Soil. J. Environ. Monit. 2012, 14, 839. [Google Scholar] [CrossRef] [PubMed]
- Lanzerstorfer, C. Variations in the Composition of House Dust by Particle Size. J. Environ. Sci. Health, Part A 2017, 52, 770–777. [Google Scholar] [CrossRef] [PubMed]
- Gunawardana, C.; Egodawatta, P.; Goonetilleke, A. Role of Particle Size and Composition in Metal Adsorption by Solids Deposited on Urban Road Surfaces. Environ. Pollut. 2014, 184, 44–53. [Google Scholar] [CrossRef] [PubMed]
- Cao, Z.G.; Yu, G.; Chen, Y.S.; Cao, Q.M.; Fiedler, H.; Deng, S.B.; Huang, J.; Wang, B. Particle Size: A Missing Factor in Risk Assessment of Human Exposure to Toxic Chemicals in Settled Indoor Dust. Environ. Int. 2012, 49, 24–30. [Google Scholar] [CrossRef] [PubMed]
- DGE Baltic Soil. Vilniaus Miesto Viešųjų, Socialiai ir Taršai Jautrių, Potencialiai Užterštų Bei Praeities Taršos Šaltinių Teritorijų Dirvožemio (Ar Grunto) Monitoringo Rezultatai 2017–2021 Metų Laikotarpiu. https://aplinka.vilnius.lt/wp-content/uploads/2022/08/2017-2021-Dirvozemio-ataskaita-VVA.pdf (accessed on December 6, 2023).
- DGE Baltic Soil. Vilniaus Miesto Dirvožemio Ir Grunto Monitoringo Rezultatai 2023 Metais. https://aplinka.vilnius.lt/wp-content/uploads/2023/10/vilniaus-dirvozemio-monitroringas-2023.pdf (accessed on December 6, 2023).
- He, Y.; Peng, C.; Zhang, Y.; Guo, Z.; Xiao, X.; Kong, L. Comparison of Heavy Metals in Urban Soil and Dust in Cities of China: Characteristics and Health Risks. Int. J. Environ. Sci. Technol. 2022. [Google Scholar] [CrossRef]
- Peng, C.; Wang, M.; Chen, W. Modelling Cadmium Contamination in Paddy Soils Under Long-Term Remediation Measures: Model Development and Stochastic Simulations. Environ. Pollut. 2016, 216, 146–155. [Google Scholar] [CrossRef]
- Mahanta, M.J.; Bhattacharyya, K.G. Total Concentrations, Fractionation and Mobility of Heavy Metals in Soils of Urban Area of Guwahati, India. Environ. Monit. Assess. 2010, 173, 221–240. [Google Scholar] [CrossRef] [PubMed]
- Li, Y.M.; Ma, J.H.; Liu, D.X.; Sun, Y.L.; Chen, Y.F. Assessment of Heavy Metal Pollution and Potential Ecological Risks of Urban Soils in Kaifeng City. Environ. Sci. 2015, 36, 1037–1044. [Google Scholar]
- Li, Y.; Yu, Y.; Yang, Z.; Shen, Z.; Wang, X.; Cai, Y. A Comparison of Metal Distribution in Surface Dust and Soil among Super City, Town, and Rural Area. Environ. Sci. Pollut. Res. 2016, 23, 7849–7860. [Google Scholar] [CrossRef] [PubMed]
- Huang, S.L.; Yin, C.Y.; Yap, S.Y. Particle Size and Metals Concentrations of Dust from a Paint Manufacturing Plant. J. Hazard. Mater. 2010, 174, 839–842. [Google Scholar] [CrossRef] [PubMed]
Figure 1.
Descriptive analysis of dust data.
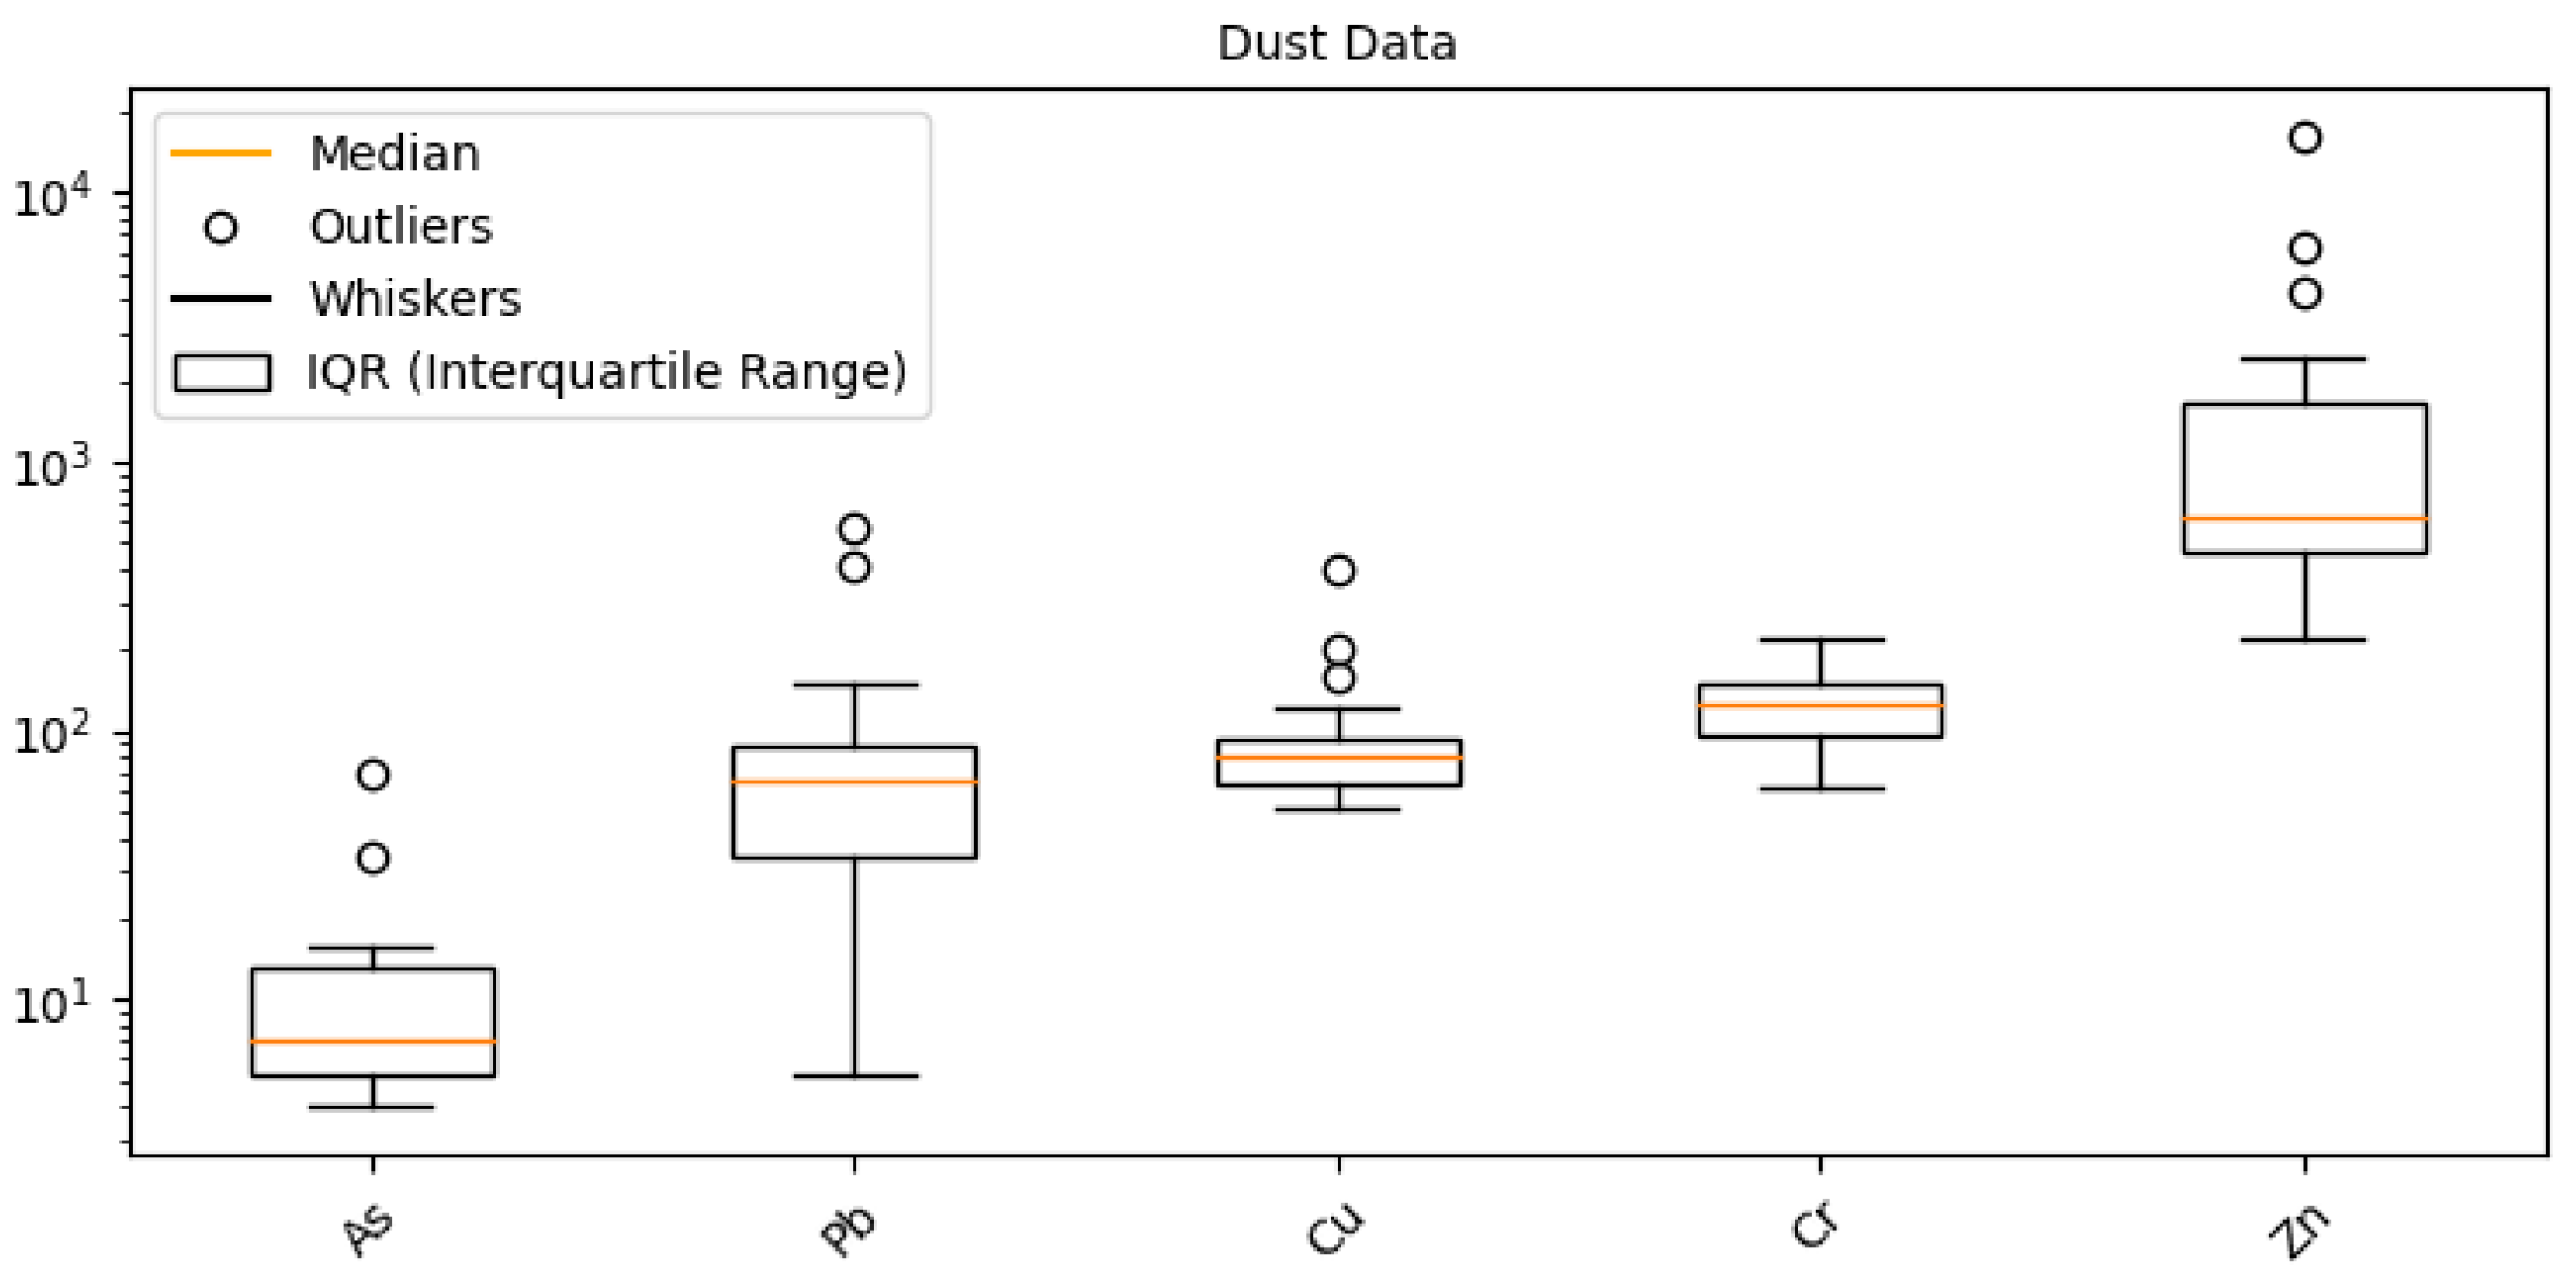
Figure 2.
Descriptive analysis of soil datasets.
Disclaimer/Publisher’s Note: The statements, opinions and data contained in all publications are solely those of the individual author(s) and contributor(s) and not of MDPI and/or the editor(s). MDPI and/or the editor(s) disclaim responsibility for any injury to people or property resulting from any ideas, methods, instructions or products referred to in the content. |
© 2023 by the authors. Licensee MDPI, Basel, Switzerland. This article is an open access article distributed under the terms and conditions of the Creative Commons Attribution (CC BY) license (http://creativecommons.org/licenses/by/4.0/).
Copyright: This open access article is published under a Creative Commons CC BY 4.0 license, which permit the free download, distribution, and reuse, provided that the author and preprint are cited in any reuse.


