
Submitted:
14 December 2025
Posted:
15 December 2025
You are already at the latest version
Abstract
Heat stress is considered as the most important limiting factor for the productivity of beans and the emerging increase in global temperature is estimated to have a strong negative impact on its yield. In this context, the green bean industry is looking for means to mitigate these adverse effects. Foliar application of amino acids-based bi-ostimulants, supplemented with silicon or sulfur, has been reported to have beneficial effects on bean crops to mitigate the effects of various stresses but not of heat stress, yet. Amino16 is a commercial biostimulant with 16 L-amino acids and was used as a basis so that two novel products; Amino16+Si and Amino16+S were further produced. Their efficacy was tested upon foliar application in two consecutive growing seasons (early and late) of green beans. The mitigation of the effects of heat stress in green bean crops was not achieved upon the combined application of amino acids supplemented with sulfur or silicon at several rates. Obviously, higher concentrations of sulfur and silicon are required to induce beneficial effects, and probably through drench application, especially in crops with high sulfur demand, such as beans, while silicon requires another form, other than silicon dioxide, which is not easily absorbed by the plant’s roots.
Keywords:
Phaseolus vulgaris L.
; high temperatures
; climate change
; chlorophyll fluorescence
1. Introduction
The rise in global temperature is estimated to cause a significant reduction in the yield of many crops, given that heat stress is considered as one of the most important limiting environmental factors in crop productivity [1]. As a summer crop, green beans, although of a short duration (approximately 60 days), are often subjected to heat stress, with extremely adverse effects on their yield. Climate modeling studies project that the increase in global temperature by the year 2050 will induce strongly negative effects on their yield, leading to a drastic reduction of the cultivated area by at least 50% [2].
High temperatures (>30 °C during the day and/or >20-22 °C at night) are considered harmful to bean cultivation, as it is well known among growers and has been experimentally proven for decades that its yield is negatively affected by prevalence of high temperatures, especially during the reproductive stage of its development [3,4,5,6,7,8,9,10,11]. The greatest sensitivity to high temperatures occurs 6 days before flowering and is maintained until flowering [3,4].
Beyond the reproductive stage of growth, heat stress negatively affects various physiological, biochemical and molecular processes, including photosynthesis, primary and secondary metabolism [5,8,9,11,12,13,14,15]. Photosynthesis is known to be one of the most sensitive processes and can be completely inhibited by high temperatures before other symptoms of stress are detected [16]. High temperatures affect the photosynthetic capacity of C3 plants (including beans) more strongly than in C4 plants [17]. These reductions in photosynthesis could result from the inhibition of photosystem II (PSII) activity, which has been shown to be the most thermally unstable component of the electron transport chain. Damage to PSII under abiotic stresses is most often reflected by a decrease in the maximum quantum yield of PSII; Fv/Fm [18].
Thus, chlorophyll fluorescence has been shown to be a sensitive and reliable method for detecting and quantifying temperature-induced changes in the photosynthetic process. Changes in various photosynthetic parameters under heat stress conditions are good indicators of plant resistance. Among the chlorophyll fluorescence parameters, basal fluorescence (Fο) and the variable-to-maximum fluorescence ratio (Fv/Fm) have been shown to be correlated with resistance to heat stress [14,19]. However, the evaluation of data obtained with these techniques from leaves and their transfer to the whole plant level for the assessment of the response to heat stress remains an additional challenge [14].
To date, a scale of 1-9 has been proposed to assess resistance to heat stress, based on the observations of the effects of high temperatures on plant growth, flowering and fruit set [20].
In general, plant resistance to heat stress is characterized by minimal damage to the photosynthetic process and increased biosynthesis of protective compounds [8]. Heat stress intensifies the production of reactive oxygen species (ROS), through enzymatic (by inactivating key antioxidant enzymes) or non-enzymatic mechanisms, with the result that plants are at risk of oxidative damage [11,12,21,22]. Increased ROS production negatively affects metabolic, physiological and molecular processes and poses a threat to cells, as it promotes nucleic acid damage, lipid peroxidation, protein oxidation, activation of the programmed cell death pathway and ultimately cell death [8]. Higher POD, SOD and CAT activity in leaves indicates increased plant protection against oxidative stress, through the reduction of lipid peroxidation level and H2O2 accumulation and the enhancement of ROS scavenging efficiency [19].
Plants exposed to temperatures at least 5 °C higher than their optimal growth and development exhibit a characteristic set of cellular and metabolic responses to survive under these conditions. These responses include changes in the organization of cellular structures and membrane functions accompanied by the biosynthesis of protective molecules and the activation of antioxidant mechanisms [8,23]. Plants have evolved powerful enzymatic and non-enzymatic mechanisms for scavenging ROS [9,11,12,13,24,25], with enzymatic ones usually considered to be the most effective [13]. Enzymatic components of the defense mechanism include enzymes such as CAT, SOD, POX, GPx, Prxs, along with enzymes of the glutathione-ascorbic acid cycle such as APX, DHAR, MDHAR and GR [26].
Non-enzymatic components include glutathione, ascorbic acid, carotenoids, tocopherol and phenolic compounds [11,26]. Various amino acids and their derivatives, sugars, sugar alcohols, quaternary ammonium and tertiary sulfonium compounds act as osmolytes and may exert protective effects under stress conditions [8,21,25]. The ability to synthesize these osmolytes under heat stress varies from species to species and their exogenous application may contribute to this direction [12,25]. However, the investigation of the actual responses and the effectiveness of their application should be documented under field conditions for a wide range of important crops [9,21].
The resistance of cultivated plants to heat stress can be enhanced by exogenous application of various compounds, and foliar application or pre-sowing seed treatment are common approaches for their application [9,12,27,28].
The application of amino acid-based biostimulants has been reported to have beneficial effects on many cultivated plants [29]. Mechanisms of plant acclimation to heat stress include, among others, the accumulation of compatible nitrogen-rich solutes, such as amino acids, which enhance resistance by acting as osmolytes, regulating ion transport and stomatal opening [30]. Amino acid accumulation is a natural process resulting from the hydrolysis of functional proteins or the inhibition of new protein synthesis [31].
It has been found that the application of amino acids under heat stress conditions improves photochemical efficiency and prevents the destruction of photosynthetic pigments. Amino acid-based biostimulants have been available for more than 40 years and are used to improve plant resistance to various stresses. However, the way in which their exogenous application acts in plant physiology is not fully elucidated or evaluated [32].
Amino16 is a commercial biostimulant product, manufactured by EVYP Crop Biostimulation Technologies with 16 L-amino acids (glutamic acid, proline, phenylalanine, tyrosine, threonine, alanine, glycine, lysine, serine, valine, isoleucine, histidine, aspartic acid, methionine, leucine and arginine), and a content of 11.3 and 19.0% free and total amino acids, respectively and a few peptides (https://evyp.gr/proion/amino-16/). Its use has been documented to alleviate the effects of transplanting shock, which is a form of abiotic stress [33], ensure uniformity in the development of leafy vegetables [33,34], reduce tomato fruit cracking [35], reduce the nitrate content of lettuce [33,34], increase the ascorbic acid content of lettuce [34] and increase the yield of green bean under conditions of reduced pre-planting nitrogen fertilization (https://evyp.gr/research-flyers-gr/).
Two novel biostimulants based on Amino16 and supplemented with sulfur (24% SO3, 9.6% S) or silicon (3% Si in the form of silicon dioxide) were developed.
Sulfur plays an important role in plant physiology and protection against environmental and biotic stresses, through its antioxidant protective functions [36,37]. It is the main regulator controlling plant resistance to stresses, mediated by glutathione. It is incorporated into organic molecules and is found in thiol (-SH) groups in proteins or non-protein thiols (glutathione) [38].
Due to the high reactivity of -SH groups, sulfur compounds, including cysteine and glutathione, are central to the regulation of metabolic redox [39]. The significant induction of the glutathione-based stress defense system, its role in scavenging ROS and maintaining cellular redox homeostasis has been extensively demonstrated in plants under various environmental stresses [38,40,41].
Silicon is considered a beneficial element under certain conditions and especially biotic and abiotic stresses [42,43,44,45,46]. There has been significant commercial interest in the development of Si-based products for foliar applications, which could compensate for the low uptake by roots [47,48]. Thus, a significant number of silicon-based foliar fertilizers are already available, and their application has increased in agriculture, especially in crops such as soybean and bean [49].
Although many studies have been carried out on various plant species that absorb limited amounts of silicon from the soil, aiming to investigate the effectiveness of foliar silicon supply, there is no strong evidence, nor agreement among researchers, whether silicon can be assimilated in sufficient quantities by the leaves and furthermore few scientific studies have confirmed the direct benefits of foliar applications on the growth and development of cultivated plants [48].
From the available data, it is evident that the uptake of silicon by leaves depends on its source and concentration, as the polymerization rate of this element in a solution is affected and consequently the response of the crop [50,51], especially in species that do not accumulate silicon, such as legumes, which include beans [51].
All the above demonstrate the differences in the sensitivity of beans to silicon and that additional studies are required to confirm any conclusions [49], as well as that a significant effect of silicon is observed when plants grow under conditions of nutritional stress [51]. However, there are no reports in the literature on the effect of silicon on plants under heat stress conditions. The hypothesis of the current study is whether the combined foliar application of amino acids and sulfur or silicon can mitigate the adverse effects of heat stress in bean plants.
2. Materials and Methods
2.1. Plant Material
In the early growing season of green bean, bush-type cv. Ribera (thin and circular pod shape) was established in a field of 3.75 hectares in the Gallika area of Giannitsa upon sowing on 7 May 2024, while in the late growing season cv. Falcao (wide and flat pod shape) was established in a field of 2.20 hectares in the Schinas area of Giannitsa after sowing on 5 August 2024. Common cultural practices were carried out during cultivation by the growers, following the guidance provided by the industry, who is the recipient of the produce. The harvest was carried out after 55 and 80 days of sowing, with a yield of 8,000 and 13,700 kg/ha, respectively.
In each growing season, the experimental plots (area 6.73 m2 each) consisted of 6 plant rows (2.5 m long), with a row spacing of 0.45 m and a population of 39±0.3 and 27±0.4 plants/m2, for the early and late growing season, respectively. For the determinations, an area within the experimental plot consisting of 4 rows of 1.5 m length (excluding the 0.5 m part at the beginning and end of each row) was selected, with an area of 2.70 m2 in each experimental plot.
2.2. Treatments
The experiment included 5 treatments arranged in a completely randomized block design with 4 replications (20 experimental plots in total).
The rates and solution types of foliar spray applications were: i) 0.5% Amino16+Si, ii) 1.0% Amino16+Si, iii) 0.5% Amino16+S, iv) 1.0% Amino16+S, v) Control (water).
In the early growing season, the 1st application of biostimulants took place on 10 June 2024, 34 days after sowing, when the plants were in the R6 stage, which corresponds to the opening of the first flower in 50% of the plants [2] and the 2nd application 7 days later. In the late growing season, the 1st application of biostimulants took place on 4 September 2024, 30 days after sowing, when the plants were in the R5 stage, which corresponds to the emergence of the first flower in 50% of the plants [2] and the 2nd application 7 days later. The control plants were sprayed with water.
Applications were performed with a handheld battery sprayer between 12:00 and 14:00 p.m. and the plants were sprayed until runoff, using a spray volume of 600-700 mL/m2. The Si concentration in the sprays was 150 or 300 ppm and the total amount applied to the crop was 975 or 1,950 g Si/ha, respectively, while the S concentration in the sprays was 480 or 960 ppm and the total amount applied to the crop was 3,120 or 6,240 g S/ha, respectively.
2.3. Environmental Conditions
Data regarding air temperature, relative humidity and solar radiation intensity were recorded every 10 min and throughout the whole growing season were obtained from the nearest meteorological stations of the National Observatory of Athens located in Giannitsa (temperature and relative humidity) and Paleo Skylitsi (solar radiation intensity).
The mean values for air temperature, relative humidity and solar radiation intensity were calculated for each of the two growing seasons. In addition, growing degree hours with temperatures (T) >30.0 °C (GDH >30 °C), which are considered harmful to bean cultivation, were calculated according to the equation:
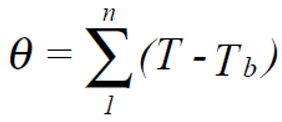 where ∑: sum, T: temperature >30.0 °C, Tb: base temperature (30.0 °C), and n: time (h).
2.4. Determinations
Upon 7 days from each application (7 and 14 days after the 1st application) the chlorophyll content of the leaves was determined using the SPAD-502Plus chlorophyll meter and the chlorophyll fluorescence using the Fluorpen FP100-MAX, PAM (Photon Systems Instruments, Drásov, Czech Republic). The parameters Fo, Fv, Fm, ABS/RC and Area are presented, while Fv/Fm and Fv/Fo were further calculated. Measurements were taken on 3 individual fully expanded leaves on 3 plants of each replication.
At harvest, the plants of each plot were excised at the soil surface, their number and weight (aerial plant biomass, APBM) were recorded and then the pods were separated into marketable and non-marketable (length <4 cm) ones before their number and weight were recorded. The yield (kg/ha) was determined as the weight of marketable pods (WMP), while the harvest index (HI) was calculated from the equation: HI= [WMP/(APBM)]x100.
2.5. Statistical Analysis
The analysis of variance (ANOVA) of the data was performed using SPSS v.22 software based on a randomized complete block design (RCBD), with 4 replicates. When F-values were significant (P <0.05), the comparison of means was performed using the Least Significant Difference (LSD).
To determine the relative contribution of each factor (growing season, type of biostimulant and rate of application), as well as their interaction on the total variance of data in each parameter determined, η2 (eta squared) was calculated as follows: η2= SSfactor/SStotal, where SS= sum of squares, while η2x100 values are presented.
3. Results
3.1. Environmental Cobditions
3.1.1. Air Temperature
Air temperature (Figure 1) and temperatures >30 οC (Figure 2) exhibited large variation during the whole growing season as well as during individual stages within both growing seasons (early and late) (Figure 3). In particular, during the whole growing season, the air temperature was in the range of 12.1-39.3 and 5.8-39.2 οC in the early and late growing season, respectively. The mean air temperature was 24.3 and 23.0 οC in the early and late growing season, respectively and the growing degree hours with temperatures >30 οC (GDH >30 οC) were 931 and 1,023, respectively.
During the 10 days before the first application of the biostimulants, the air temperature was in the range of 16.7-36.9 and 18.1-36.7 οC in the early and late growing season, respectively, the mean air temperature was 26.6 and 26.0 οC and the GDH >30 οC were 249 and 202, respectively in the early and late growing season.
In the period 10 days before the first application of the biostimulants and until the second application, the air temperature was in the range of 16.7-39.3 and 17.9-36.7 οC in the early and late growing season, respectively, the mean air temperature was 27.0 and 25.4 οC and the GDH >30 οC were 452 and 277, respectively in the early and late growing season.
3.1.2. Air Relative Humidity
The air relative humidity exhibited a small variation during both growing seasons, while a large one was observed daily and was in the range of 18-91 and 15-92% in the early and late growing season, respectively. The mean air relative humidity was 61.2 and 66.0% in the early and late growing season, respectively. Particularly, during the 10 days before the first application of the biostimulants, the mean air relative humidity was 55.2 and 64.0%, respectively in the early and late growing season. In the period 10 days before the first application of biostimulants until the second application, the mean air relative humidity was 54.5 and 67.4%, respectively in the early and late growing season.
3.1.3. Solar Radiation Intensity
The solar radiation intensity showed a small variation during both growing seasons. The mean solar radiation intensity was 1,003 and 867 μmol/m2/s and the sum of the solar radiation intensity was 7,870,166 and 9,292,446 μmol/m2/s in the early and late growing season, respectively. During the 10 days before the first application of the biostimulants, the mean solar radiation intensity was 1,074 and 1,040 μmol/m2/s and the sum of the solar radiation intensity was 1,546,822 and 1,497,205 μmol/m2/s in the early and late growing season, respectively. In the period 10 days before the first application of the biostimulants until the second application, the mean solar radiation intensity was 1,102 and 936 μmol/m2/s and the sum of the solar radiation intensity was 2,698,059 and 2,291,499 μmol/m2/s in the early and late growing season, respectively.
3.1.4. The Contribution of the Three Factors
The ANOVA showed that out of the three factors (growing season, type of biostimulant and rate of application), the growing season clearly emerged as the most important one, given that it had a significant effect on the chlorophyll content (SPAD) and on 5 out of the 7 chlorophyll fluorescence parameters determined at 7 days from the first application, while the other two factors did not had any effect on any of the parameters determined (Table 1 and Table 2). Two weeks from the first application (7 days from the second application), the growing season, although did not have a significant effect on the chlorophyll content, significantly affected all 7 chlorophyll fluorescence parameters determined. Of the other two factors, only the type of biostimulant significantly affected 2 parameters (Fv and Fm), for which the η2 was much lower than the corresponding one of the growing seasons (Table 3 and Table 4).
At the harvest, the growing season had a significant effect on 7 parameters determined (aerial plant biomass, marketable and non-marketable yield, number of marketable and non-marketable pods, mean weight of marketable pods and harvest index) (Table 5 and Table 6).
Given that the growing season had a dominant effect, a new ANOVA was performed separately for each growing season (early and late).
3.1.5. Chlorophyll Content, Chlorophyll Fluorescence and Harvesting Parameters After Biostimulant Application
In the early growing season, chlorophyll content (SPAD) and the 7 chlorophyll fluorescence parameters determined 7 and 14 days after the first application were not affected by the application of the biostimulants. On the other hand, Fv/Fm, Fv/Fo and ABS/RC chlorophyll fluorescence parameters determined 7 days after the first application in the late growing season, as well as the harvest index were affected by the rate of the biostimulants (Table 7). On average for the two biostimulants, the 0.5% application rate resulted in a decrease in the Fv/Fo (1.259 vs. 1.341 and 1.301 at rates 0 and 1.0%, respectively) and Fv/Fm (0.555 vs. 0.572 and 0.563 at rates 0 and 1.0%, respectively) parameters and an increase in the ABS/RC (3.442 vs. 3.298 and 3.317 at rates 0 and 1.0%, respectively) parameter determined 7 days after the first application of the biostimulants. On the other hand, the 1.0% application rate resulted in a decrease in the harvest index (40.0 vs. 41.9 and 41.3 at rates 0 and 1.0%, respectively) (Table 7).
In both growing seasons, the aerial plant biomass (22,130-24,900 and 38,600-41,010 kg/ha, in the early and late growing season, respectively), the marketable yield (7,140-7,690 and 13,910-15,830 kg/ha, respectively), the non-marketable yield (375-545 and 1,200-1,345 kg/ha, respectively), the number of marketable pods (1,287,500-1,367,500 and 3,705,000-4,502,500/ha, respectively), the number of non-marketable pods (765,000-1,020 and 1,722,500-1,890,000/ha, respectively) and the average weight of marketable pods (5.29-5.64 and 3.51-3.78 g, respectively) were not affected by the application of biostimulants.
3.1.6. Correlations
A high and significant linear correlation was found for the weight and number of marketable pods with the aerial plant biomass (Figure 4).
4. Discussion
Heat stress conditions prevailed during both growing seasons, as the maximum air temperature reached 39.3 and 39.2 οC in the early and late growing season, respectively (Figure 1). Furthermore, the Fv/Fm values determined in bean plants were in the range of 0.60-0.62 and 0.57-0.62 in the early and late growing season, respectively, being much lower than the range of 0.74-0.85 which is considered optimal, indicating a disturbance in the state and function of photosystem II (PSII) due to plant stress [52,53,54]. The Fv/Fm is the most widely used chlorophyll fluorescence parameter to test whether plant stress affects PSII or not [54,55].
Chlorophyll fluorescence measurements provide information about plant responses to stress conditions and are considered extremely important [56]. However, although the equipment is inexpensive and provides rapid measurements, making it an important tool for determining plant stress in the field [52,57], the interpretation of the data remains complex and controversial [18,52,55,58].
The above heat stress conditions resulted in reduced marketable yield in the early crop by 51%, compared to the late one (7,350 and 14,910 kg/ha, respectively). The ANOVA showed that among the three studied factors (growing season, type of biostimulant and rate of application), the growing season clearly emerged as the most important, while the other two ones did not have a significant effect on any of the parameters determined (Table 1, Table 2, Table 3, Table 4, Table 5 and Table 6).
This variation between the two growing seasons is apparently due to the fact that the heat stress was more intense in the early growing season, given that during the 10 days before the first biostimulants’ application, the GDH >30 οC was 249 compared to 202 in the late one, as well as during the period 10 days before the first up to the second application, the GDH >30 οC was 452 compared to 277 in the late one (Figure 3). Furthermore, different genotypes were used in the two growing seasons (cv. Ribera and cv. Falcao in the early and late growing season, respectively). The two genotypes differed significantly in terms of plant biomass, with cv Ribera producing a reduced biomass by 41% compared to cv. Falcao (23,250 and 39,500 kg/ha for cv. Ribera and cv. Falcao, respectively). Plant biomass is considered among the agronomic traits with the highest significant direct effects in the evaluation of heat stress tolerance [20] and in the present study, it was positively correlated with yield characteristics, namely number and weight of marketable pods (Figure 4).
Thus, cv. Falcao grew under milder heat stress conditions during the late growing season and developed higher plant biomass, resulting in a particularly high yield that was not affected by the heat stress conditions. Although no data are available on the behavior of the two genotypes under heat stress, it is evident that cv. Ribera showed limited heat stress tolerance, as its yield was relatively low while affected by the heat stress conditions.
Amino acid-based biostimulants have been available for more than 40 years and are used to improve plant tolerance to various stresses [32]. Mechanisms of plant acclimatization to heat stress include, among others, the accumulation of nitrogen-rich compounds, such as amino acids [30], a natural process because of protein hydrolysis or inhibition of new protein synthesis [31]. On the other hand, sulfur is considered to play an important role in providing tolerance to plants exposed to abiotic stresses, such as temperature, solar radiation, drought and salinity [59]. Finally, foliar application of silicon has increased in agriculture, especially in crops such as soybean and bean [49] and any beneficial effect of silicon on cultivated plants is more evident under stress conditions [45].
However, under the conditions prevailing during the present research, the application of amino acid-based biostimulants in combination with sulfur or silicon did not affect chlorophyll content (SPAD), chlorophyll fluorescence parameters Fv/Fm and Fv/Fo nor the parameters related to plant growth (biomass, number of marketable and non-marketable pods, mean marketable pod weight and harvest index) and crop yield (marketable and non-marketable production). It is worth noting that Fv/Fo is considered a more sensitive parameter than Fv/Fm, given that it detects changes caused by stresses more quickly [53].
Obviously, to induce any beneficial effects, sufficient sulfur is required to maximize the concentration of active sulfur compounds [60] and not just its foliar application. It is known that sulfur is considered an essential macroelement for plant nutrition and is required in large quantities, especially by legumes, which include beans, compared to other cultivated species [59,61].
Regarding the effectiveness of silicon, although various beneficial effects have been reported because of its foliar application to plants, the most extensively studied beneficial effect is related to the reduced susceptibility to fungal and bacterial attacks of various plant species [45]. Only a few studies have shown that foliar applications could have moderate effects on growth and yield [48], while it is obvious that additional studies are required to confirm any conclusions [49], as well as that a significant effect of silicon is observed when plants grow under conditions of nutritional stress [51]. Recent studies have highlighted the importance of the correct source (silicates, stabilized monosilicic acid, silica nanoparticles) and concentration of silicon, as well as the type of stress that plants are subjected to [48,62]. From the available data, it is evident that silicon uptake by leaves depends on its source and concentration, as it affects the polymerization rate of this element in solution and consequently the crop response [50,51], especially in species that do not accumulate silicon, such as legumes, which include beans [51].
Silicon dioxide is not available for plant uptake. The only form of silicon available to plants is monosilicic or (orthosilicic) acid (H4SiO4 or Si(OH)4) [48], which they take up mainly (if not exclusively) through the roots [46,47,62,63]. Foliar applications of silicates at concentrations of 500-1,000 ppm are effective mainly as pesticides, without having a direct effect on plant growth and development, and an application frequency of 3-4 times is optimal for most crops, at intervals of 10-20 days, starting from the early vegetative stage [48].
5. Conclusions
During the early green bean growing season, conditions of intense heat stress prevailed and in combination with the cultivation of a relatively sensitive genotype, the marketable yield was reduced. The exogenous application of amino acid-based biostimulants in combination with sulfur or silicon did not have a significant effect on chlorophyll fluorescence parameters (which are considered good indicators of plant tolerance to heat stress) nor did it prevent the reduction in yield.
During the late growing season, conditions of milder heat stress prevailed and in combination with the cultivation of a relatively resistant genotype, the marketable yield was not affected, and it was high. The exogenous application of amino acid-based biostimulants in combination with sulfur or silicon did not have a significant effect on chlorophyll fluorescence parameters nor on the yield.
In conclusion, the mitigation of the effects of heat stress in green beans was not achieved with the combined application of amino acids with sulfur or silicon in the form and concentrations used foliarly. Obviously, to ensure beneficial effects, higher concentrations of sulfur and silicon are required via drench application, especially in crops with high sulfur requirements, such as beans, while silicon requires another form than silicon dioxide, which is not available for uptake by plants.
Abbreviations.
The following abbreviations are used in this manuscript:
| APBM | Aerial plant biomass |
| APX | Ascorbate peroxidase |
| CAT | Catalase |
| DHAR | Dehydroascorbate reductase |
| Fο | Basal fluorescence |
| Fv/Fm | Variable-to-maximum fluorescence ratio |
| GR | Glutathione reductase |
| GDH | Growing degree hours |
| GPx | Glutathione peroxidase |
| HI | Harvest index |
| MDHAR | Monodehydroasorbate reductase |
| PSII | photosystem II |
| POD | Peroxidase |
| POX | Proline oxidase |
| Prxs | Peroxiredoxins |
| ROS | Reactive oxygen species |
| SOD | Superoxide dismutase |
| WMP | Weight of marketable pods |
Author Contributions
Conceptualization, D.S.K. and A.S.S.; methodology, D.S.K. and A.S.S.; formal analysis, E.A.S., M.A.P., D.S.K., A.S.S. and P.I.T.; data curation, E.A.S., M.A.P., D.S.K., A.S.S. and P.I.T.; writing—original draft preparation, E.A.S., M.A.P., D.S.K., A.S.S. and P.I.T.; writing—review and editing, E.A.S., M.A.P., D.S.K., A.S.S. and P.I.T.; supervision, A.S.S.; project administration, D.S.K.; funding acquisition, D.S.K. All authors have read and agreed to the published version of the manuscript.
Funding
This research has been financed by EVYP Crop Biostimulation Technologies (project code: 10969).
Data Availability Statement
The raw data supporting the conclusions of this article will be made available by the authors on request.
Acknowledgments
We thank Symeon Siomos for his assistance in collecting data in the field.
Conflicts of Interest
The authors declare no conflicts of interest.:.
References
- Lesk, C.; Rowhani, P.; Ramankutty, N. Influence of extreme weather disasters on global crop production. Nature 2016, 529, 84–87. [Google Scholar] [CrossRef]
- Fernández, F.; Gepts, P.; López, M. English production; Arregocés, O.; Hidalgo, R; Correa, A.; Centro Internacional de Agricultura Tropical (CIAT). Stages of development of the common bean plant. Study guide to be used as a supplement to the audio tutorial unit on the same topic. Scientific content; (Series 04EB-09.03): Cali, Colombia, 1986; p. 32 p. [Google Scholar]
- Monterroso, V.A.; Wien, W.C. Flower and pod abscission due to heat stress in beans. J. Am. Soc. Hortic. Sci. 1990, 115, 631–634. [Google Scholar] [CrossRef]
- Konsens, I.; Ofir, M.; Kigel, J. The effect of temperature on the production and abscission of flowers and pods in snap bean (Phaseolus vulgaris L.). Ann. Bot. 1991, 67, 391–399. [Google Scholar] [CrossRef]
- Rainey, K.M.; Griffiths, P.D. Diallel analysis of yield components of snap beans exposed to two temperature stress environments. Euphytica 2005, 142, 43–53. [Google Scholar] [CrossRef]
- Hoffmann, L.; Ribeiro, N.D.; da Rosa, S.S.; Jost, E.; Poersch, N.L.; Medeiros, S.L.P. Response of beans cultivars to high air temperature in the reproductive period. Ciênc. Rural 2007, 37, 1543–1548. [Google Scholar]
- Porch, T.G.; Smith, J.R.; Beaver, J.S.; Griffiths, P.D.; Canaday, C.H. TARS-HT1 and TARS-HT2 heat-tolerant dry bean germplasm. HortScience 2010, 45, 1278–1280. [Google Scholar]
- Bita, C.E.; Gerats, T. Plant tolerance to high temperature in a changing environment: scientific fundamentals and production of heat stress-tolerant crops. Front. Plant Sci. 2013, 4, 273. [Google Scholar] [CrossRef]
- Hasanuzzaman, M.; Nahar, K.; Alam, M.; Roychowdhury, R.; Fujita, M. Physiological, biochemical, and molecular mechanisms of heat stress tolerance in plants. Int. J. Mol. Sci. 2013, 14, 9643–9684. [Google Scholar] [CrossRef]
- Hatfield, J.L.; Prueger, J.H. Temperature extremes: Effect on plant growth and development. Weather Clim. Extrem. 2015, 10(Part A), 4–10. [Google Scholar] [CrossRef]
- Mondal, S.; Karmakar, S.; Panda, D.; Pramanik, K.; Bose, B.; Singhal, R.K. Crucial plant processes under heat stress and tolerance through heat shock proteins. Plant Stress 2023, 10, 100227. [Google Scholar] [CrossRef]
- Wahid, A.; Gelani, S.; Ashraf, M.; Foolad, M.R. Heat tolerance in plants: An overview. Environ. Exp. Bot. 2007, 61, 199–223. [Google Scholar] [CrossRef]
- Fahad, S.; Bajwa, A.A.; Nazir, U.; Anjum, S.A.; Farooq, A.; Zohaib, A.; Sadia, S.; Nasim, W.; Adkins, S.; Saud, S.; Ihsan, M.Z.; Alharby, H.; Wu, C.; Wang, D.; Huang, J. Crop production under drought and heat stress: Plant responses and management options. Front. Plant Sci. 2017, 8, 1147. [Google Scholar] [CrossRef] [PubMed]
- Moore, C.E.; Meacham-Hensold, K.; Lemonnier, P.; Slattery, R.A.; Benjamin, C.; Bernacchi, C.J.; Lawson, T.; Cavanagh, A.P. The effect of increasing temperature on crop photosynthesis: From enzymes to ecosystems. J. Exp. Bot. 2021, 72, 2822–2844. [Google Scholar] [CrossRef] [PubMed]
- Saini, N.; Nikalje, G.C.; Zargar, S.M.; Suprasanna, P. Molecular insights into sensing, regulation and improving of heat tolerance in plants. Plant Cell Rep. 2022, 41, 799–813. [Google Scholar] [CrossRef]
- Berry, J; Bjorkman, O. Photosynthetic response and adaptation to temperature in higher plants. Annu. Rev. Plant Physiol. 1980, 31, 491–543. [Google Scholar] [CrossRef]
- Salvucci, M.E.; Crafts-Brandner, S.J. Inhibition of photosynthesis by heat stress: Τhe activation state of Rubisco as a limiting factor in photosynthesis. Physiol. Plant. 2004, 120, 179–186. [Google Scholar] [CrossRef]
- Baker, N.R. Chlorophyll fluorescence: A probe of photosynthesis in vivo. Ann. Rev. Plant Biol. 2008, 59, 89–113. [Google Scholar] [CrossRef]
- Duc, N.H.; Csintalan, Z.; Posta, K. Arbuscular mycorrhizal fungi mitigate negative effects of combined drought and heat stress on tomato plants. Plant Physiol. Biochem. 2018, 132, 297–307. [Google Scholar] [CrossRef]
- Tene, T.M.; Sari, H.; Canci, H.; Maaruf, A.; Eker, Τ.; Toker, C. Traits related to heat stress in Phaseolus species. Agriculture 2023, 13, 953. [Google Scholar] [CrossRef]
- Ghosh, U.K.; Islam, Md.N.; Siddiqui, Md.N.; Khan, Md.A.R. Understanding the roles of osmolytes for acclimatizing plants to changing environment: A review of potential mechanism. Plant Signal. Behav. 2021, 16, 1913306. [Google Scholar] [CrossRef]
- Haider, S.; Iqbal, J.; Naseer, S.; Shaukat, M.; Abbasi, B.A.; Yaseen, T.; Zahra, S.A.; Mahmood, T. Unfolding molecular switches in plant heat stress resistance: A comprehensive review. Plant Cell Rep. 2022, 41, 775–798. [Google Scholar] [CrossRef] [PubMed]
- Zhou, Y.; Xu, F.; Shao, Y.; He, J. Regulatory mechanisms of heat stress response and thermomorphogenesis in plants. Plants 2022, 11, 3410. [Google Scholar] [CrossRef] [PubMed]
- Baxter, A.; Mittler, R.; Suzuki, N. ROS as key players in plant stress signalling. J. Exp. Bot. 2014, 65, 1229–1240. [Google Scholar] [CrossRef] [PubMed]
- Suprasanna, P.; Nikalje, G.C.; Rai, A.N. Osmolyte accumulation and implications in plant abiotic stress tolerance. In Osmolytes and Plants Acclimation to Changing Environment: Emerging Omics Technologies; Iqbal, N., Nazar, R., Khan, N.A., Eds.; Springer: New Delhi, 2015; pp. 1–12. [Google Scholar]
- Mittler, R.; Vanderauwera, S.; Gollery, M.; van Breusegem, F. Reactive oxygen gene network of plants. Trends Plant Sci. 2004, 9, 490–498. [Google Scholar] [CrossRef]
- Kotak, S.; Larkindale, J.; Lee, U.; von Koskull-Döring, P.; Vierling, E.; Scharf, K.D. Complexity of the heat stress response in plants. Curr. Opin. Plant Biol. 2007, 10, 310–316. [Google Scholar] [CrossRef]
- Waraich, E.; Ahmad, R.; Haleem, A.; Aziz, T. Alleviation of temperature stress by nutrient management in crop plants: A review. J. Soil Sci. Plant Nutr. 2012, 12, 221–244. [Google Scholar] [CrossRef]
- Sun, W.; Shahrajabian, M.H.; Kuang, Y.; Wang, N. Amino acids biostimulants and protein hydrolysates in agricultural sciences. Plants 2024, 13, 210. [Google Scholar] [CrossRef]
- Feng, D.; Jia, X.; Yan, Z.; Li, J.; Gao, J.; Xiao, W.; Shen, X.; Sun, X. Underlying mechanisms of exogenous substances involved in alleviating plant heat stress. Plant Stress 2023, 10, 100288. [Google Scholar] [CrossRef]
- Araújo, W.L.; Toghe, T.; Ishizaki, K.; Leaver, C.J.; Fernie, A.R. Protein degradation – An alternative respiratory substrate for stressed plants. Trends Plant Sci. 2011, 16, 489–498. [Google Scholar] [CrossRef]
- Botta, A. Enhancing plant tolerance to temperature stress with amino acids: An approach to their mode of action. Acta Hortic. 2013, 1009, 29–35. [Google Scholar] [CrossRef]
- Krinis, D.I.; Kasampalis, D.S.; Siomos, A.S. Biostimulants as a means to alleviate the transplanting shock in lettuce. Horticulturae 2023, 9, 968. [Google Scholar] [CrossRef]
- Tsouvaltzis, P.; Koukounaras, A.; Siomos, A.S. Application of amino acids improves lettuce crop uniformity and inhibits nitrate accumulation induced by the supplemental inorganic nitrogen fertilization. Int. J. Agric. Biol. 2014, 16, 951–955. [Google Scholar]
- Koukounaras, A.; Tsouvaltzis, P.; Siomos, A.S. Effect of root and foliar application of amino acids on the growth and yield of greenhouse tomato in different fertilization levels. J. Food, Agric. Env. 2013, 11, 644–648. [Google Scholar]
- Mazid, M.; Khan, Z.H.; Quddusi, S.; Khan, T.A.; Mohammad, F. Significance of sulphur nutrition against metal induced oxidative stress in plants. J. Stress Physiol. Biochem. 2011, 7, 165–184. [Google Scholar]
- Anjum, N.A.; Gill, S.S.; Umar, S.; Ahmad, I.; Duarte, A.C.; Pereira, E. Improving growth and productivity of Oleiferous brassicas under changing environment: Significance of nitrogen and sulphur nutrition, and underlying mechanisms. Sci. World J. 2012, 2012, 657808. [Google Scholar] [CrossRef]
- Anjum, N.A.; Gill, R.; Kaushik, M.; Hasanuzzaman, M.; Pereira, E.; Ahmad, I.; Tuteja, N.; Gill, S.S. ATP-sulfurylase, sulfur compounds, and plant stress tolerance. Front. Plant Sci. 2015, 6, 210. [Google Scholar] [CrossRef]
- Prioretti, L.; Gontero, B.; Hell, R.; Giordano, M. Diversity and regulation of ATP sulfurylase in photosynthetic organisms. Front. Plant Sci. 2014, 5, 597. [Google Scholar] [CrossRef]
- Latowski, D.; Surówka, E.; Strzałka, K. Regulatory role of components of ascorbate–glutathione pathway in plant stress tolerance. In Ascorbate-Glutathione Pathway and Stress Tolerance in Plants; Anjum, N., Chan, MT., Umar, S., Eds.; Springer: Dordrecht, 2010; pp. 1–53. [Google Scholar]
- Gill, S.S.; Tuteja, N. Reactive oxygen species and antioxidant machinery in abiotic stress tolerance in crop plants. Plant Physiol. Biochem. 2010, 48, 909–930. [Google Scholar] [CrossRef]
- Farooq, M.A.; Dietz, KJ. Silicon as versatile player in plant and human biology: Overlooked and poorly understood. Front. Plant Sci. 2015, 12, 994. [Google Scholar] [CrossRef]
- Luyckx, M.; Hausman, J.F.; Lutts, S.; Guerriero, G. Silicon and plants: Current knowledge and technological perspectives. Front. Plant Sci. 2017, 8, 411. [Google Scholar] [CrossRef]
- Pavlovic, J.; Kostic, L.; Bosnic, P.; Kirkby, E.A.; Nikolic, M. Interactions of silicon with essential and beneficial elements in plants. Front. Plant Sci. 2021, 12, 697592. [Google Scholar] [CrossRef] [PubMed]
- Ma, J.F.; Zhao, F.J.; Rengel, Z.; Cakmak, I. Beneficial elements. In Marschner’s Mineral Nutrition of Plants (Fourth Edition); Rengel, Z., Cakmak, I., White, P.J., Eds.; Academic Press: San Diego, 2023; pp. 387–418. [Google Scholar]
- Raza, T.; Abbas, M.; Amna; Imran, S.; Khan, M.Y.; Rebi, A.; Rafe-Rad, Z.; Eash, N.S. Impact of silicon on plant nutrition and significance of silicon mobilizing bacteria in agronomic practices. Silicon 2023, 15, 3797–3817. [Google Scholar] [CrossRef]
- Guével, M.H.; Menzies, J.G.; Bélanger, R.R. Effect of root and foliar applications of soluble silicon on powdery mildew control and growth of wheat plants. Eur. J. Plant Pathol. 2007, 119, 429–436. [Google Scholar] [CrossRef]
- Laane, H.M. The effects of foliar sprays with different silicon compounds. Plants 2018, 7, 45. [Google Scholar] [CrossRef]
- Barros, T.C.; de Mello Prado, R.; Garcia Roque, C.; Ribeiro Barzotto, G.; Roberto Wassolowski, C. Silicon and salicylic acid promote different responses in legume plants. J. Plant Nutr. 2018, 41, 2116–2125. [Google Scholar] [CrossRef]
- de Souza Junior, J.P.; de Mello Prado, R.; Soares, M.B.; da Silva, J.L.F.; de Farias Guedes, V.H.; dos Santos Sarah, M.M.; Cazetta, J.O. Effect of different foliar silicon sources on cotton plants. J. Soil Sci. Plant Nutr. 2021, 21, 95–103. [Google Scholar] [CrossRef]
- dos Santos Sarah, M.M.; de Mello Prado, R.; de Souza Júnior, J.P.; Teixeira, G.C.M.; dos Santos Duarte, J.C.; de Medeiros, R.L.S. Silicon supplied via foliar application and root to attenuate potassium deficiency in common bean plants. Sci. Rep. 2021, 11, 19690. [Google Scholar] [CrossRef]
- Maxwell, K.; Johnson, G.N. Chlorophyll fluorescence—A practical guide. J. Exp. Bot. 2000, 51, 659–668. [Google Scholar] [CrossRef]
- Lichtenthaler, H.K.; Buschmann, C.; Knapp, M. How to correctly determine the different chlorophyll fluorescence parameters and the chlorophyll fluorescence decrease ratio RFd of leaves with the PAM fluorometer. Photosynthetica 2005, 43, 379–393. [Google Scholar] [CrossRef]
- Guidi, L.; Lo Piccolo, E.; Landi, M. Chlorophyll fluorescence, photoinhibition and abiotic stress: Does it make any difference the fact to be a C3 or C4 species? Front. Plant Sci. 2019, 10, 174. [Google Scholar] [CrossRef]
- Baker, N.R.; Oxborough, K. Chlorophyll fluorescence as a probe of photosynthetic productivity. In Advances in Photosynthesis and Respiration; Papageorgiou, G.C., Govindjee, G., Eds.; Springer: Dordrecht, The Netherlands, 2004; pp. 65–82. [Google Scholar]
- Banks, J.M. Continuous excitation chlorophyll fluorescence parameters: A review for practitioners. Tree Physiol. 2017, 37, 1128–1136. [Google Scholar] [CrossRef]
- Murchie, E.H.; Lawson, T. Chlorophyll fluorescence analysis: A guide to good practice and understanding some new applications. J. Exp. Bot. 2013, 64, 3983–3998. [Google Scholar] [CrossRef]
- Lazár, D. Parameters of photosynthetic energy partitioning. J. Plant Physiol. 2015, 175, 131–147. [Google Scholar] [CrossRef]
- Zenda, T.; Liu, S.; Dong, A.; Duan, H. Revisiting sulphur–The once neglected nutrient: It’s roles in plant growth, metabolism, stress tolerance and crop production. Agriculture 2021, 11, 626. [Google Scholar] [CrossRef]
- Szulc, W.; Rutkowska, B.; Sosulski, T.; Szara, E.; Stępień, W. Assessment of sulphur demand of crops under permanent fertilization experiment. Plant Soil Environ. 2014, 60, 135–140. [Google Scholar] [CrossRef]
- Sharma, R.K.; Cox, M.S.; Oglesby, C.; Dhillon, J.S. Revisiting the role of sulfur in crop production: A narrative review. J. Agric. Food Res. 2024, 15, 101013. [Google Scholar] [CrossRef]
- Tubana, B.S. Dynamics of silicon in soil and plant to establish silicate fertilization. In Benefits of Silicon in the Nutrition of Plants; de Mello Prado, R., Ed.; Springer Nature: Switzerland AG, 2023; pp. 57–73. [Google Scholar]
- Ma, J.F.; Yamaji, N. Silicon uptake and accumulation in higher plants. Trends Plant Sci. 2006, 11, 392–397. [Google Scholar] [CrossRef]
Figure 1.
The air temperature during the two growing seasons (early and late) of green beans. The arrows indicate the time of biostimulants’ application.
Figure 1.
The air temperature during the two growing seasons (early and late) of green beans. The arrows indicate the time of biostimulants’ application.
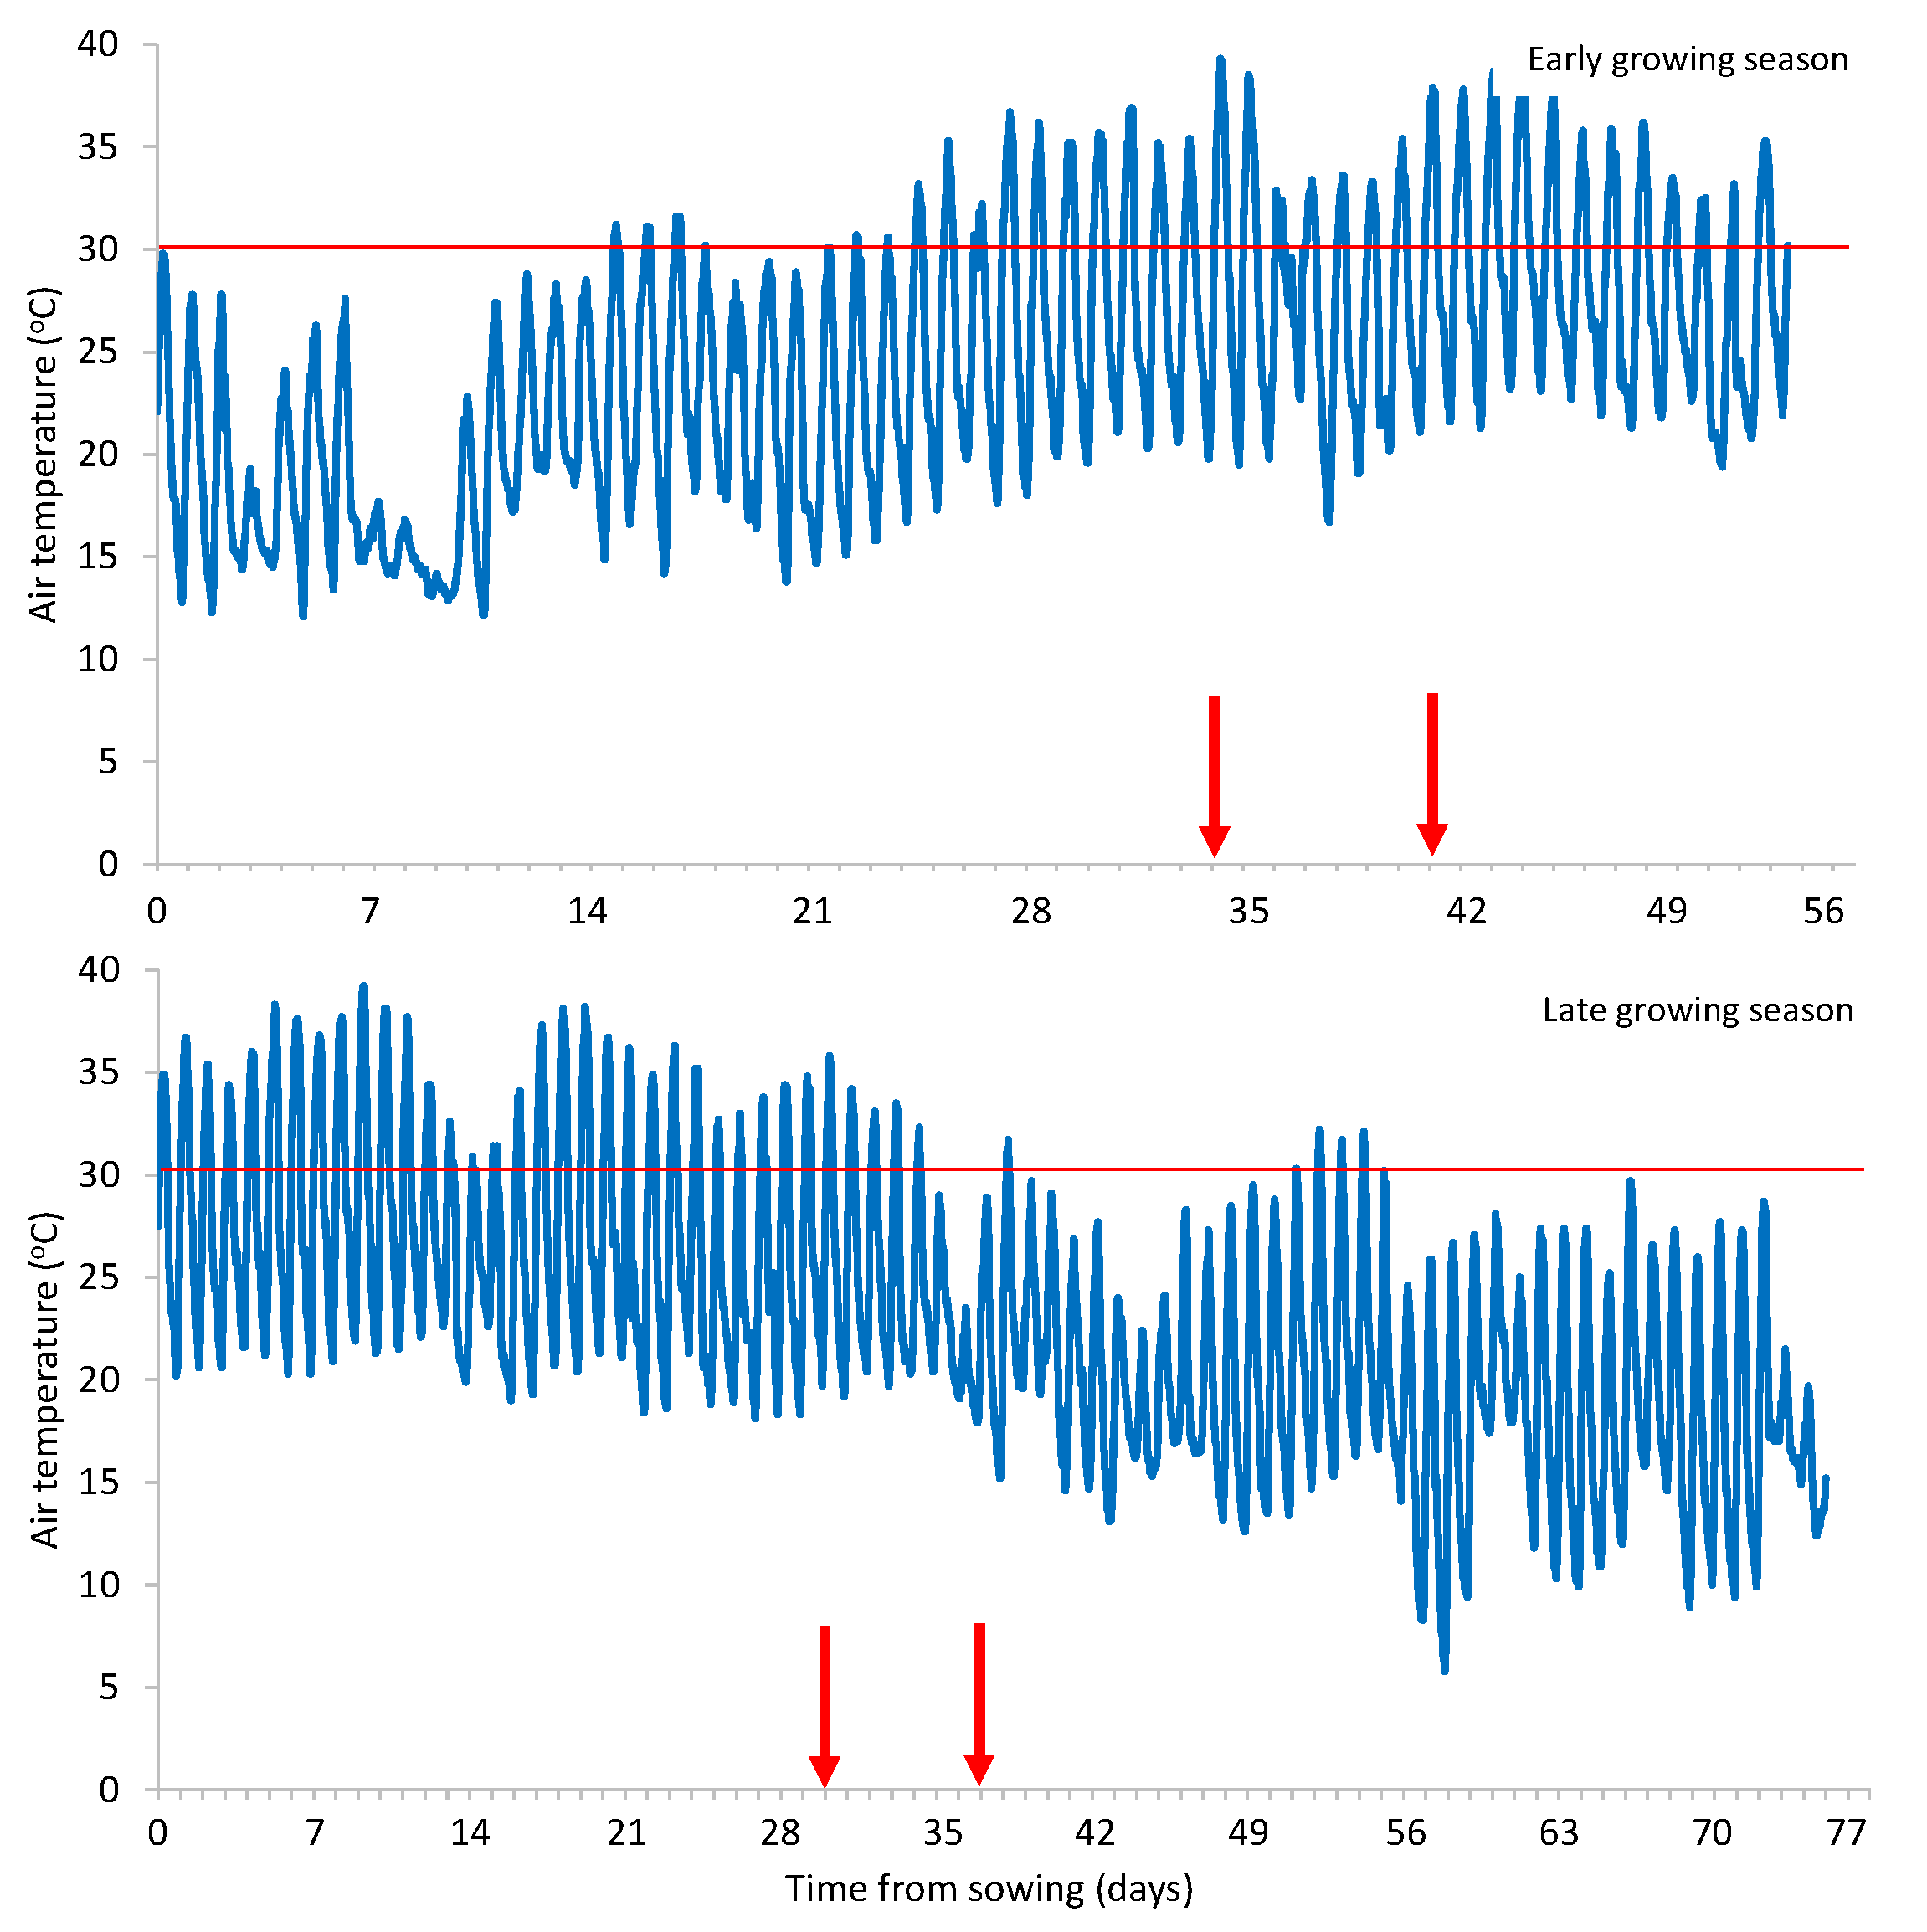
Figure 2.
The air temperature >30 οC during the two growing seasons (early and late) of green beans. The arrows indicate the time of biostimulants’ application.
Figure 2.
The air temperature >30 οC during the two growing seasons (early and late) of green beans. The arrows indicate the time of biostimulants’ application.
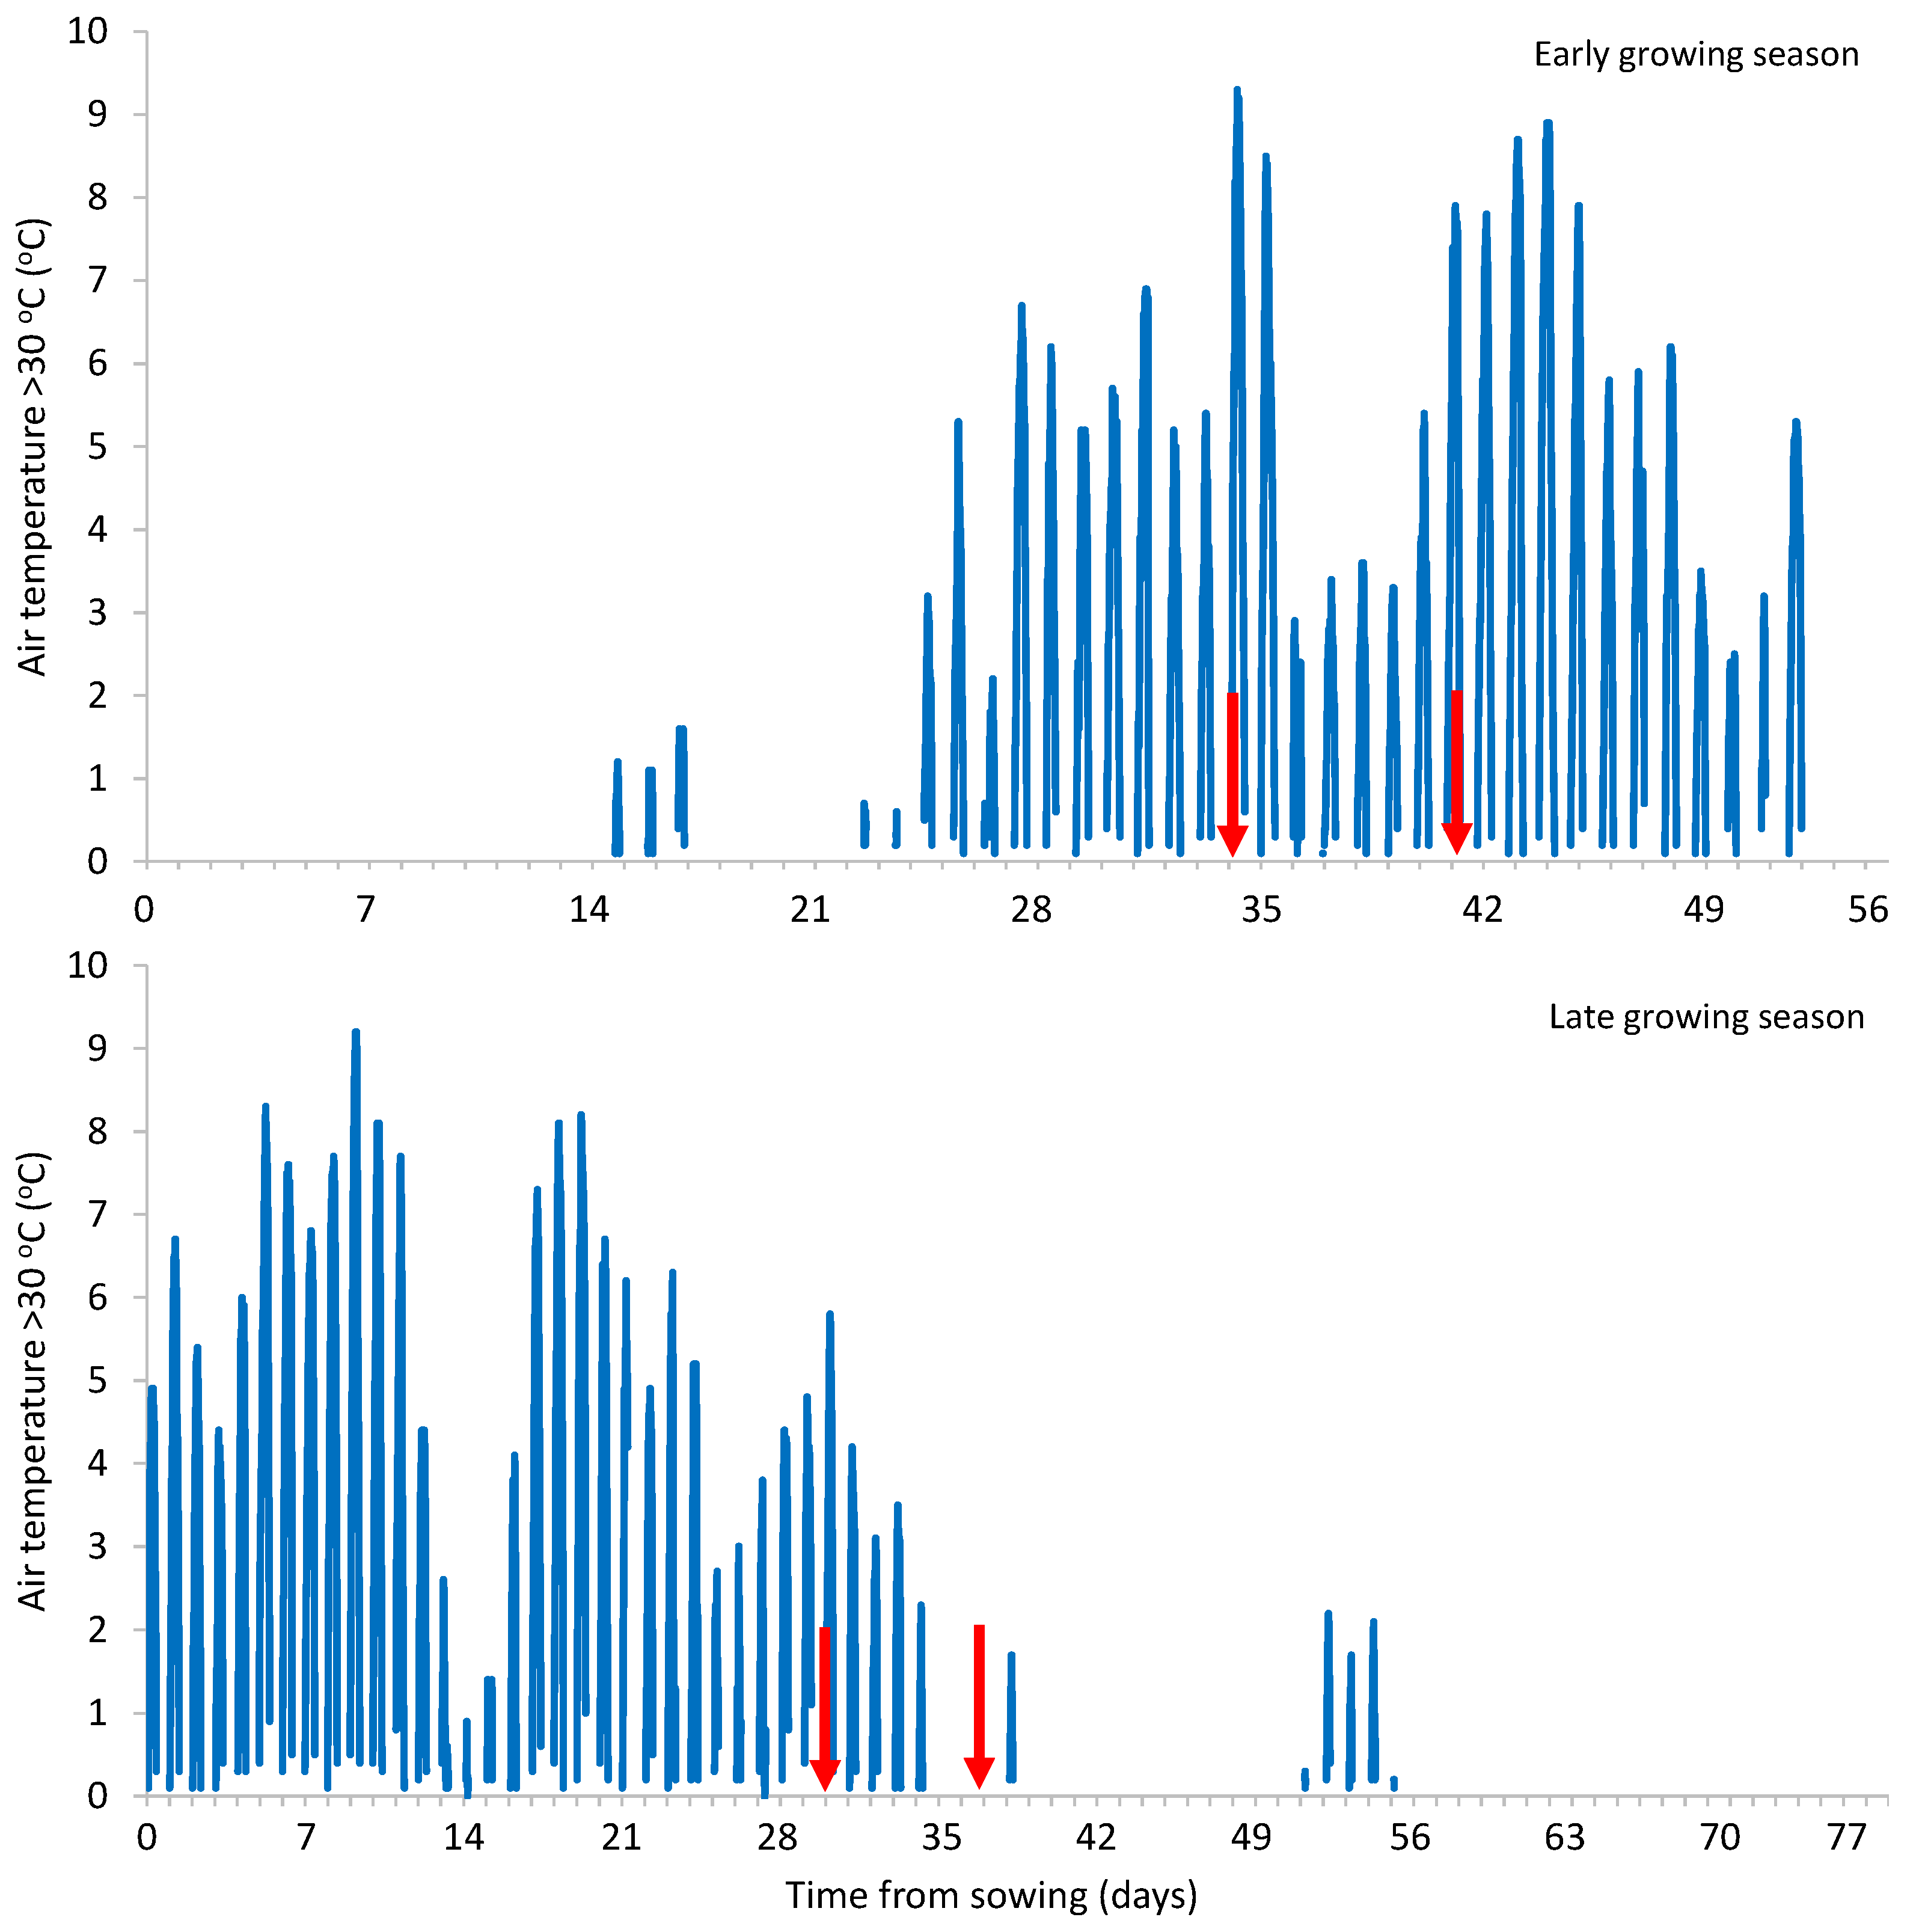
Figure 3.
The mean air temperature, the growing degree hours with temperatures >32 οC (GDH >30 οC) and the mean relative air humidity in the whole cultivation period and in individual stages during the two growing seasons ( early and
  late) of green beans.
early and late) of green beans.
Figure 3.
The mean air temperature, the growing degree hours with temperatures >32 οC (GDH >30 οC) and the mean relative air humidity in the whole cultivation period and in individual stages during the two growing seasons ( early and late) of green beans.
early and late) of green beans.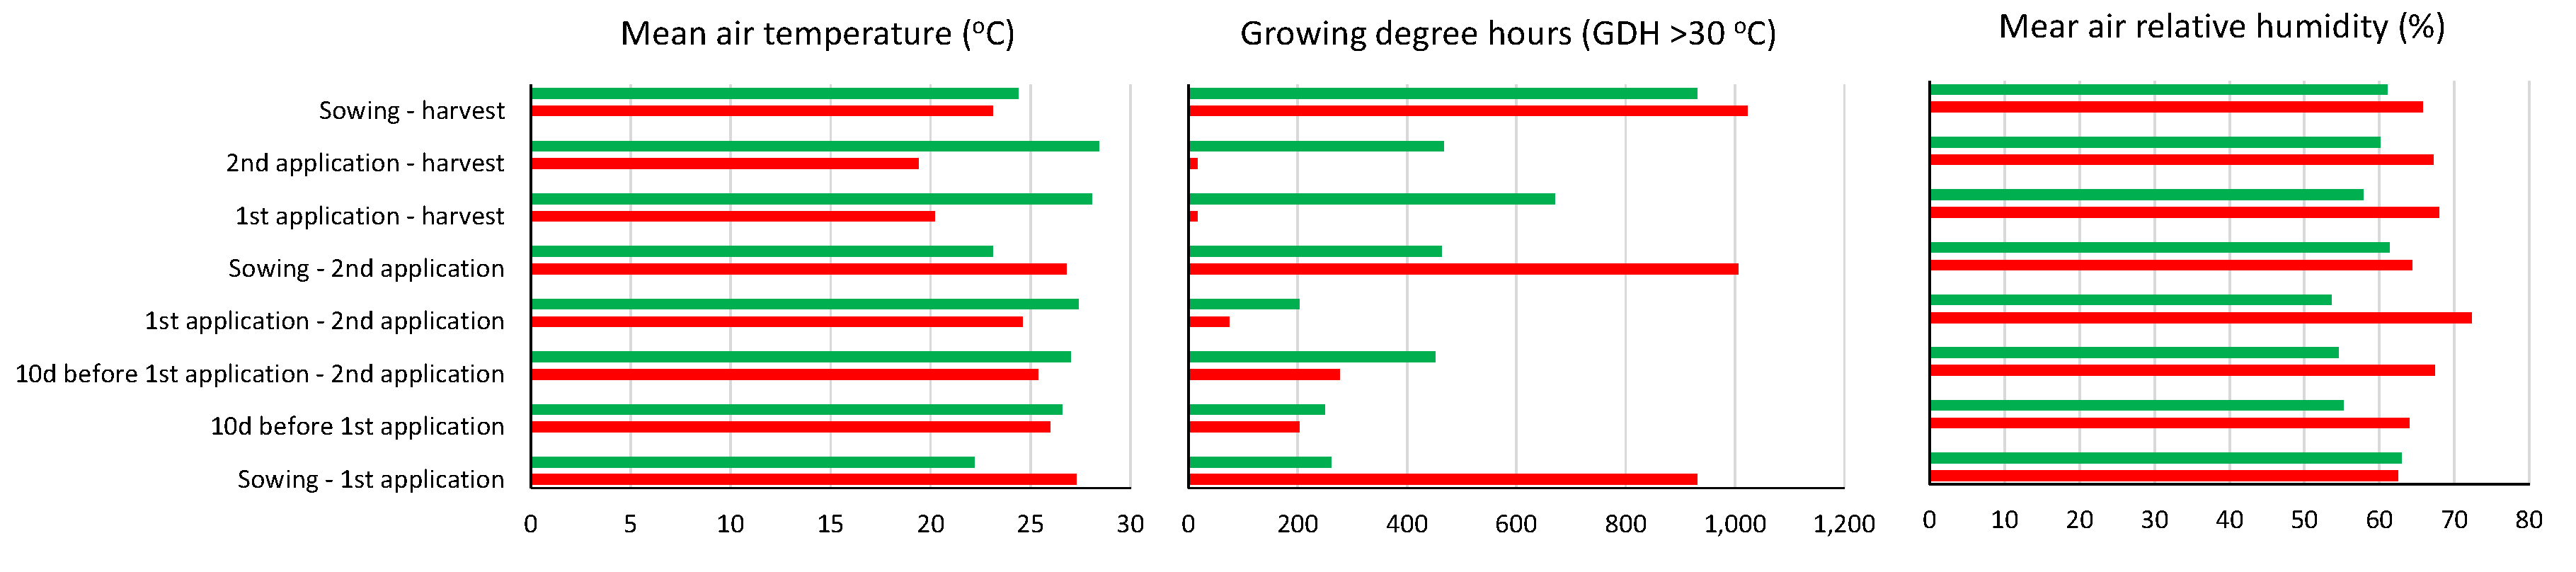
Figure 4.
The linear correlation of weight and number of marketable pods with plant aerial biomass during the two growing seasons (early and late) of green beans.
Figure 4.
The linear correlation of weight and number of marketable pods with plant aerial biomass during the two growing seasons (early and late) of green beans.
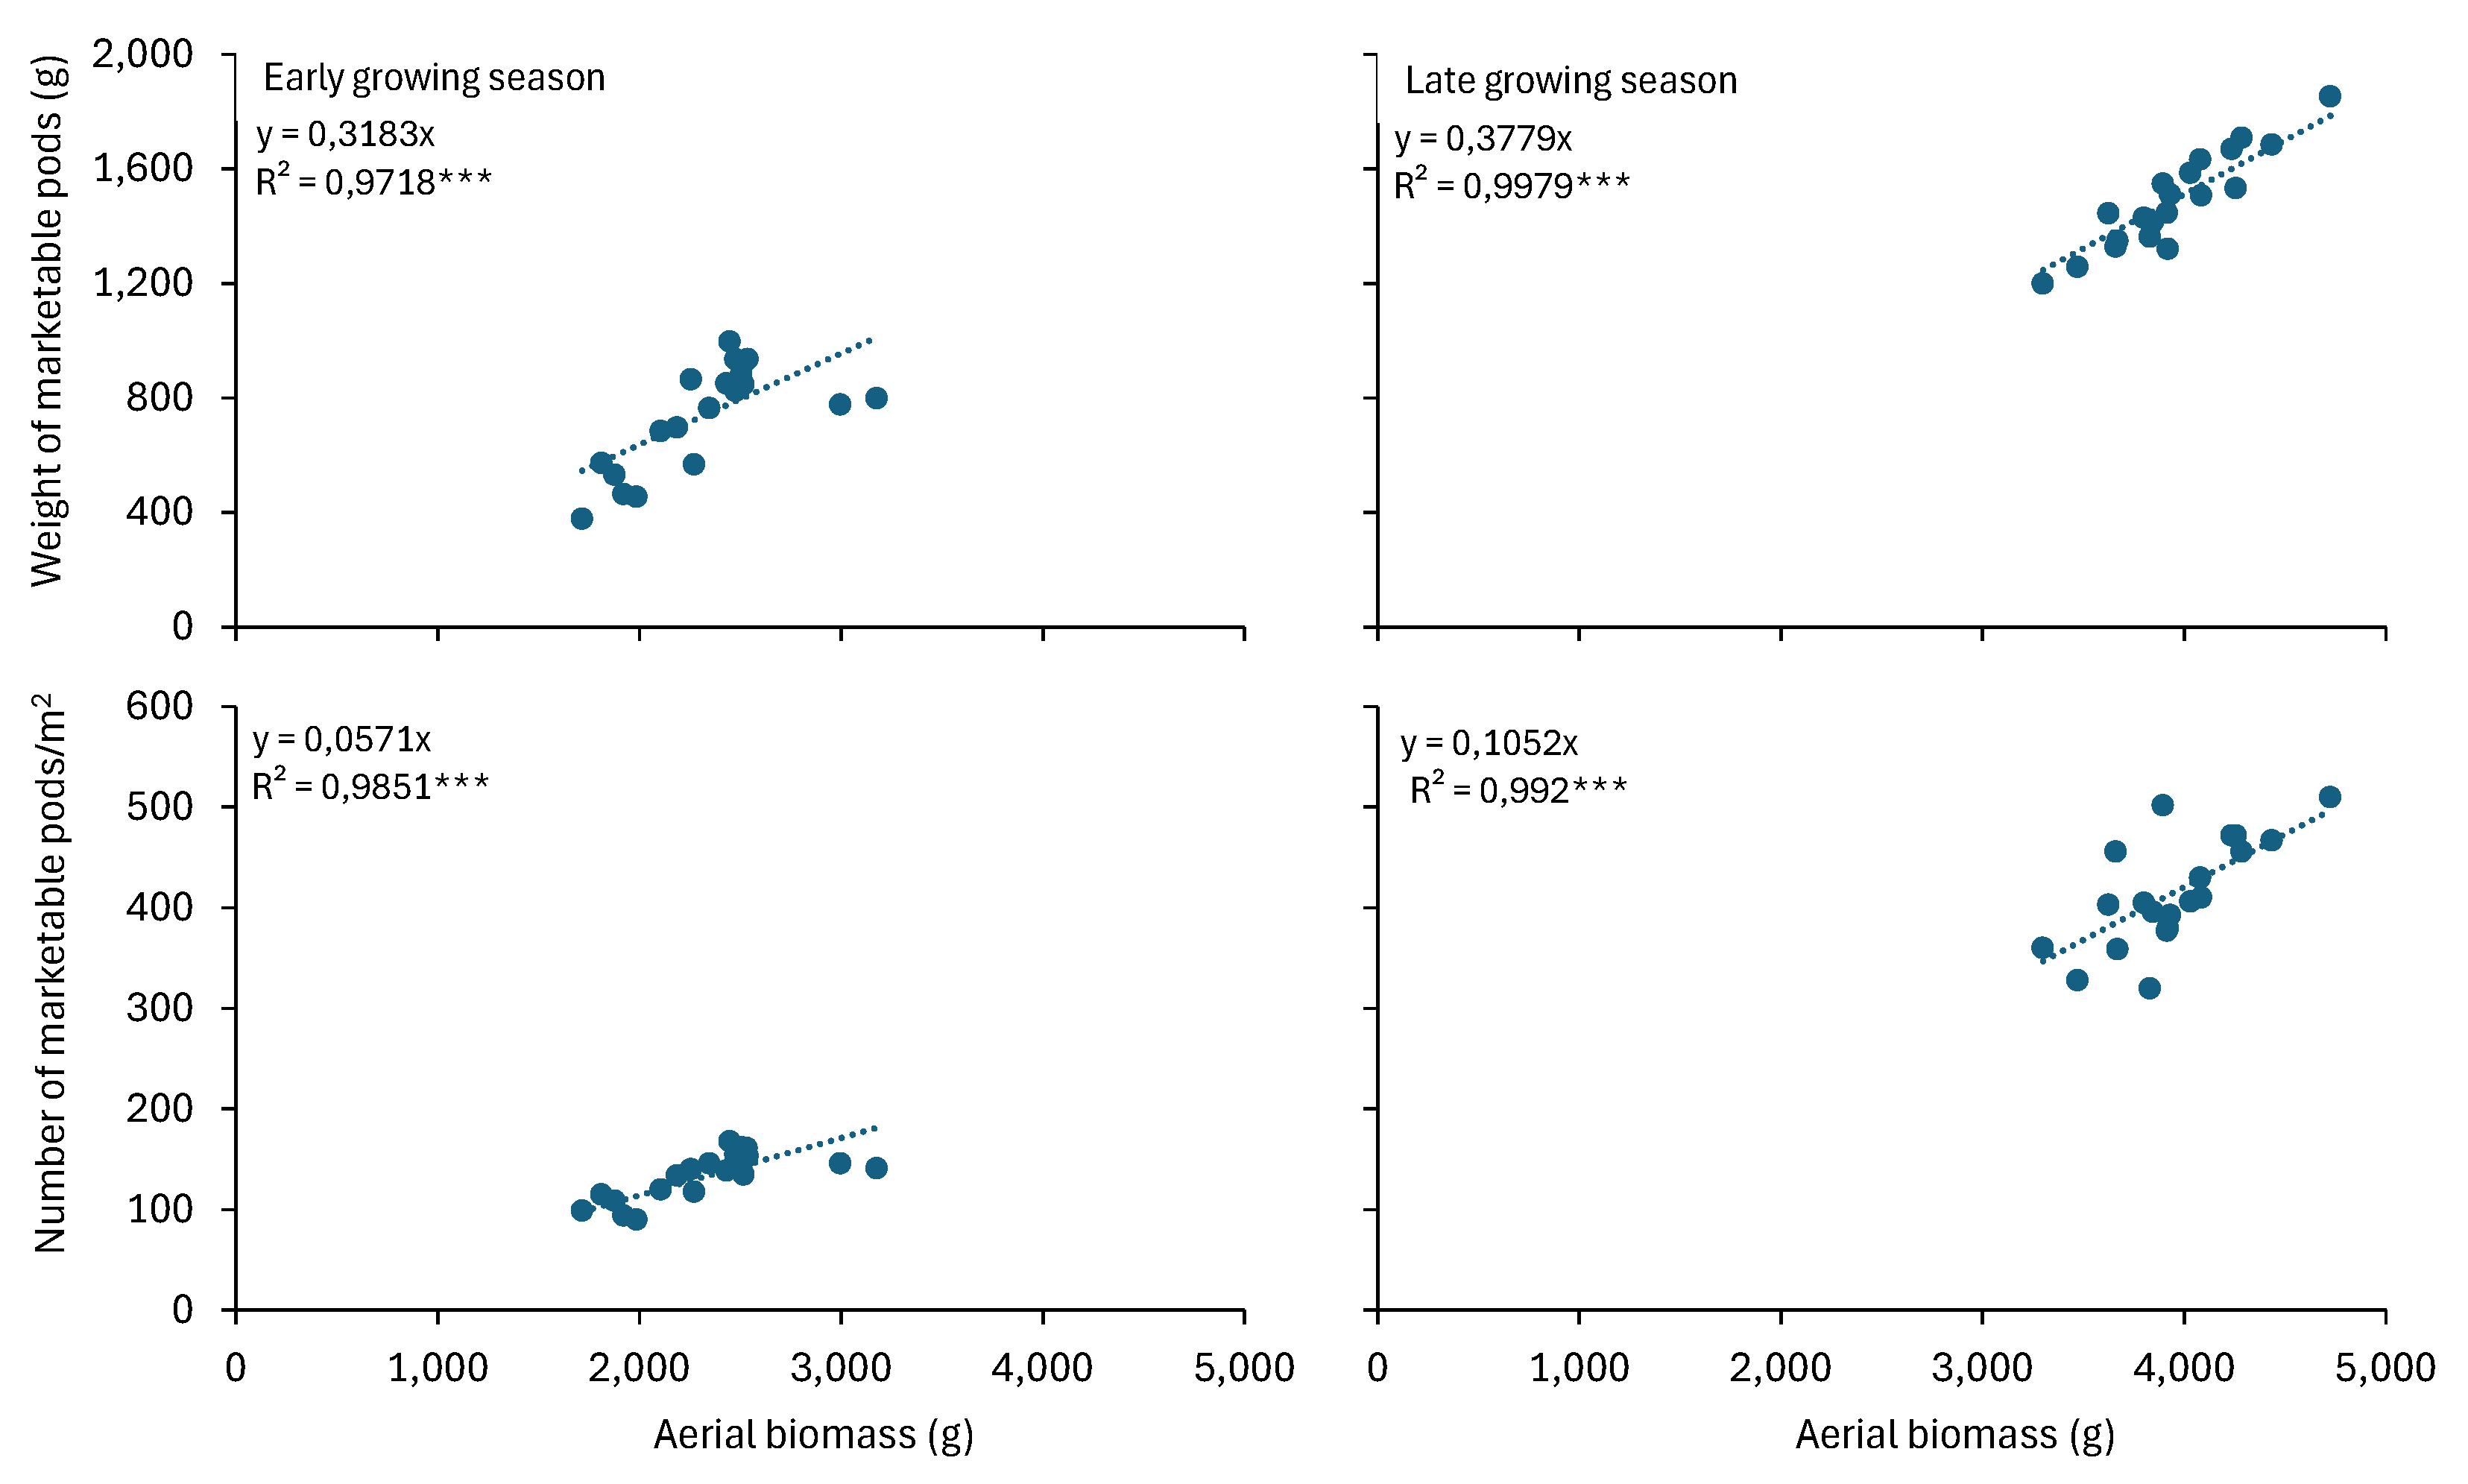

Table 1.
Analysis of variance (ANOVA) for green bean leaf chlorophyll content (SPAD) and fluorescence parameters Fo, Fv and Fm at 7 days after biostimulants’ application. The plants of two consecutive growing seasons (early and late) were treated with two biostimulants (Amino16+Si and Amino16+S) in three rates of application (0.0, 0.5 or 1.0%) each.
| SPAD | Fo | Fv | Fm | ||||||||||||||
| Source of variance | DF | MS | P | η2 | MS | P | η2 | MS | P | η2 | MS | P | η2 | ||||
| Growing season (A) | 1 | 702.270 | *** | 88.1 | 3,933,075 | *** | 27.5 | 20,777,008 | * | 11.2 | 6,626,817 | 2.7 | |||||
| Biostimulant (B) | 1 | 0.608 | 0.1 | 114,075 | 0.8 | 2,115,960 | 1.1 | 3,212,123 | 1.3 | ||||||||
| Rate of application (C) | 2 | 0.762 | 0.1 | 340,886 | 4.8 | 2,706,384 | 2.9 | 4,159,485 | 3.4 | ||||||||
| AxB | 1 | 0.008 | 0.0 | 49,280 | 0.3 | 2,885,121 | 1.5 | 3,687,980 | 1.5 | ||||||||
| AxC | 2 | 2.780 | 0.3 | 28,243 | 0.4 | 2,013,298 | 2.2 | 2,460,053 | 2.0 | ||||||||
| BxC | 2 | 0.664 | 0.1 | 35,575 | 0.5 | 1,113,068 | 1.2 | 1,522,771 | 1.2 | ||||||||
| AxBxC | 2 | 0.106 | 0.0 | 500,572 | 7.0 | 7,515,123 | 8.1 | 11,847,499 | 9.7 | ||||||||
| Block | 3 | 10.275 | 1.3 | 833,758 | ** | 17.5 | 9,124,520 | 14.7 | 14,679,997 | * | 18.0 | ||||||
| Error | 33 | 79.332 | 177,921 | 3,222,055 | 4,451,807 | ||||||||||||
DF, degrees of freedom; MS, mean square; P, probability; η2, eta squared; *** significant effect at the 0.001 level; ** significant effect at the 0.01 level; * significant effect at the 0.05 level.
Table 2.
Analysis of variance (ANOVA) for green bean leaf fluorescence parameters Fv/Fm, Fv/Fo, ABS/RC and Area at 7 days after biostimulants’ application. The plants of two consecutive growing seasons (early and late) were treated with two biostimulants (Amino16+Si and Amino16+S) in three rates of application (0.0, 0.5 or 1.0%) each.
| Fv/Fm | Fv/Fo | ABS/RC | Area | |||||||||||||
| Source of variance | DF | MS | P | η2 | MS | P | η2 | MS | P | η2 | MS | P | η2 | |||
| Growing season (A) | 1 | 0.013 | *** | 23.5 | 0.544 | *** | 34.4 | 1.876 | *** | 65.2 | 236,392,066,625 | 2.5 | ||||
| Biostimulant (B) | 1 | 0.000 | 0.7 | 0.016 | 1.0 | 0.014 | 0.5 | 397,935,384 | 0.0 | |||||||
| Rate of application (C) | 2 | 0.000 | 1.8 | 0.019 | 2.4 | 0.031 | 2.2 | 53,892,764,999 | 1.1 | |||||||
| AxB | 1 | 0.000 | 0.8 | 0.020 | 1.3 | 0.005 | 0.2 | 1,072,858,852 | 0.0 | |||||||
| AxC | 2 | 0.001 | 3.6 | 0.015 | 1.9 | 0.019 | 1.3 | 131,168,829,514 | 2.8 | |||||||
| BxC | 2 | 0.000 | 0.7 | 0.009 | 1.1 | 0.008 | 0.6 | 94,679,874,137 | 2.0 | |||||||
| AxBxC | 2 | 0.001 | 3.6 | 0.034 | 4.3 | 0.003 | 0.2 | 452,455,536,090 | 9.6 | |||||||
| Block | 3 | 0.001 | 5.4 | 0.052 | 9.9 | 0.023 | 2.4 | 285,455,584,729 | 9.1 | |||||||
| Error | 33 | 0.001 | 0.021 | 0.024 | 207,372,048,414 | |||||||||||
DF, degrees of freedom; MS, mean square; P, probability; η2, eta squared; *** significant effect at the 0.001.
Table 3.
Analysis of variance (ANOVA) for green bean leaf chlorophyll content (SPAD) and fluorescence parameters Fo, Fv and Fm at 14 days after biostimulants’ application. The plants of two consecutive growing seasons (early and late) were treated with two biostimulants (Amino16+Si and Amino16+S) in three rates of application (0.0, 0.5 or 1.0%) each.
| SPAD | Fo | Fv | Fm | ||||||||||||||
| Source of variance | DF | MS | P | η2 | MS | P | η2 | MS | P | η2 | MS | P | η2 | ||||
| Growing season (A) | 1 | 1.920 | 1.2 | 21,686,785 | *** | 42.4 | 713,228,974 | *** | 61.2 | 983,662,776 | *** | 60.0 | |||||
| Biostimulant (B) | 1 | 2.430 | 1.5 | 1,258,416 | 2.5 | 40,687,943 | * | 3.5 | 56,255,360 | 3.4 | |||||||
| Rate of application (C) | 2 | 0.206 | 0.2 | 132,679 | 0.5 | 805,501 | 0.1 | 1,547,682 | 0.2 | ||||||||
| AxB | 1 | 0.213 | 0.1 | 420 | 0.0 | 3,181,155 | 0.3 | 3,252,084 | 0.2 | ||||||||
| AxC | 2 | 2.470 | 3.0 | 1,464,371 | 5.7 | 19,699,509 | 3.4 | 31,794,915 | 3.9 | ||||||||
| BxC | 2 | 3.010 | 3.6 | 771,580 | 3.0 | 13,168,779 | 2.3 | 19,858,693 | 2.4 | ||||||||
| AxBxC | 2 | 1.156 | 1.4 | 186,945 | 0.7 | 1,247,041 | 0.2 | 2,031,837 | 0.2 | ||||||||
| Block | 3 | 1.221 | 2.2 | 406,308 | 2.4 | 11,169,211 | 2.9 | 11,245,596 | 2.1 | ||||||||
| Error | 33 | 4.363 | 664,615 | 9,220,253 | 13,721,053 | ||||||||||||
DF, degrees of freedom; MS, mean square; P, probability; η2, eta squared; *** significant effect at the 0.001 level; * significant effect at the 0.05 level.
Table 4.
Analysis of variance (ANOVA) for green bean leaf fluorescence parameters Fv/Fm, Fv/Fo, ABS/RC and Area at 14 days after biostimulants’ application. The plants of two consecutive growing seasons (early and late) were treated with two biostimulants (Amino16+Si and Amino16+S) in three rates of application (0.0, 0.5 or 1.0%) each.
| Fv/Fm | Fv/Fo | ABS/RC | Area | |||||||||||||
| Source of variance | DF | MS | P | η2 | MS | P | η2 | MS | P | η2 | MS | P | η2 | |||
| Growing season (A) | 1 | 0.053 | *** | 53.8 | 4.294 | *** | 60.0 | 0.100 | *** | 15.3 | 4,815,087,826,519 | *** | 26.7 | |||
| Biostimulant (B) | 1 | 0.002 | 2.0 | 0.206 | 2.9 | 0.020 | 3.1 | 153,167,212,030 | 0.8 | |||||||
| Rate of application (C) | 2 | 0.000 | 0.2 | 0.004 | 0.1 | 0.009 | 2.8 | 245,824,371,201 | 2.7 | |||||||
| AxB | 1 | 0.000 | 0.0 | 0.009 | 0.1 | 0.008 | 1.2 | 285,436,237,177 | 1.6 | |||||||
| AxC | 2 | 0.001 | 2.0 | 0.069 | 1.9 | 0.007 | 2.1 | 188,966,716,361 | 2.1 | |||||||
| BxC | 2 | 0.001 | 2.0 | 0.052 | 1.5 | 0.005 | 1.5 | 118,877,954,137 | 1.3 | |||||||
| AxBxC | 2 | 0.000 | 0.2 | 0.007 | 0.2 | 0.003 | 0.9 | 310,786,760,576 | 3.4 | |||||||
| Block | 3 | 0.002 | 6.1 | 0.180 | * | 7.5 | 0.038 | * | 17.5 | 486,871,152,362 | 8.1 | |||||
| Error | 33 | 0.001 | 0.056 | 0.011 | 290,687,988,169 | |||||||||||
DF, degrees of freedom; MS, mean square; P, probability; η2, eta squared; *** significant effect at the 0.001 level; * significant effect at the 0.05 level.
Table 5.
Analysis of variance (ANOVA) for green bean aerial plant biomass, marketable yield and non-marketable yield. The plants of two consecutive growing seasons (early and late) were treated with two biostimulants (Amino16+Si and Amino16+S) in three rates of application (0.0, 0.5 or 1.0%) each.
Table 5.
Analysis of variance (ANOVA) for green bean aerial plant biomass, marketable yield and non-marketable yield. The plants of two consecutive growing seasons (early and late) were treated with two biostimulants (Amino16+Si and Amino16+S) in three rates of application (0.0, 0.5 or 1.0%) each.
| Aerial plant biomass | Marketable yield | Non-marketable yield | ||||||||
| Source of variance | DF | MS | P | η2 | MS | P | η2 | MS | P | η2 |
| Growing season (A) | 1 | 30,545,848 | *** | 82.1 | 6,867,507 | *** | 82.4 | 75,446 | *** | 72.8 |
| Biostimulant (B) | 1 | 19,080 | 0.1 | 1,121 | 0.0 | 68 | 0.1 | |||
| Rate of application (C) | 2 | 331 | 0.0 | 11,506 | 0.3 | 129 | 0.2 | |||
| AxB | 1 | 7,475 | 0.0 | 2,352 | 0.0 | 501 | 0.5 | |||
| AxC | 2 | 177,984 | 1.0 | 21,412 | 0.5 | 39 | 0.1 | |||
| BxC | 2 | 5,352 | 0.0 | 3,037 | 0.1 | 25 | 0.0 | |||
| AxBxC | 2 | 32,977 | 0.2 | 6,829 | 0.2 | 147 | 0.3 | |||
| Block | 3 | 48,488 | 0.4 | 69,430 | 2.5 | 2,817 | ** | 8.1 | ||
| Error | 33 | 183,092 | 35,387 | 562 | ||||||
DF, degrees of freedom; MS, mean square; P, probability; η2, eta squared; *** significant effect at the 0.001 level; ** significant effect at the 0.01level.
Table 6.
Analysis of variance (ANOVA) for green bean number of marketable pods, number of non-marketable pods, mean weight of marketable pods and harvest index. The plants of two consecutive growing seasons (early and late) were treated with two biostimulants (Amino16+Si and Amino16+S) in three rates of application (0.0, 0.5 or 1.0%) each.
| Number of marketable pods | Number of non-marketable pods | Mean weight of marketable pods | Harvest index | ||||||||||||||
| Source of variance | DF | MS | P | η2 | MS | P | η2 | MS | P | η2 | MS | P | η2 | ||||
| Growing season (A) | 1 | 949,219 | *** | 92.7 | 98,827 | *** | 71.2 | 40.114 | *** | 76.7 | 714.409 | *** | 48.7 | ||||
| Biostimulant (B) | 1 | 40 | 0.0 | 408 | 0.3 | 0.052 | 0.1 | 0.002 | 0.0 | ||||||||
| Rate of application (C) | 2 | 2,712 | 0.5 | 30 | 0.0 | 0.159 | 0.6 | 6.655 | 0.9 | ||||||||
| AxB | 1 | 243 | 0.0 | 1,180 | 0.8 | 0.002 | 0.0 | 0.357 | 0.0 | ||||||||
| AxC | 2 | 3,609 | 0.7 | 55 | 0.1 | 0.058 | 0.2 | 8.484 | 1.2 | ||||||||
| BxC | 2 | 598 | 0.1 | 223 | 0.3 | 0.027 | 0.1 | 2.221 | 0.3 | ||||||||
| AxBxC | 2 | 601 | 0.1 | 400 | 0.6 | 0.001 | 0.0 | 0.217 | 0.0 | ||||||||
| Block | 3 | 679 | 0.2 | 2,825 | * | 6.1 | 1.269 | ** | 7.3 | 116.940 | *** | 23.9 | |||||
| Error | 33 | 1,728 | 865 | 0.238 | 11.101 | ||||||||||||
DF, degrees of freedom; MS, mean square; P, probability; η2, eta squared; *** significant effect at the 0.001 level; ** significant effect at the 0.01 level; * significant effect at the 0.05 level.
Table 7.
Analysis of variance (ANOVA) and the effect of biostimulants’ rates of application for green bean leaf fluorescence parameters Fv/Fm, Fv/Fo and ABS/RC at 7 days after biostimulants’ application, as well as for harvest index. The plants of the late growing season were treated with two biostimulants (Amino16+Si and Amino16+S) in three rates of application (0.0, 0.5 or 1.0%) each.
| Fv/Fm | Fv/Fo | ABS/RC | Harvest index | |||||||||||||
| Source of variance | DF | MS | P | η2 | MS | P | η2 | MS | P | η2 | MS | P | η2 | |||
| Biostimulant (A) | 1 | 0.000 | 0.0 | 0.000 | 0.0 | 0.001 | 0.3 | 0.155 | 0.2 | |||||||
| Rate of application (B) | 2 | 0.001 | * | 19.7 | 0.014 | * | 10.4 | 0.049 | * | 24.6 | 7.241 | * | 16.6 | |||
| AxB | 2 | 0.000 | 2.8 | 0.005 | 3.7 | 0.001 | 0.5 | 1.745 | 4.0 | |||||||
| Block | 3 | 0.002 | *** | 59.0 | 0.057 | *** | 63.6 | 0.054 | ** | 40.7 | 13.674 | ** | 47.1 | |||
| Error | 15 | 0.000 | 0.004 | 0.009 | 1.862 | |||||||||||
| Rate of application (%) | ||||||||||||||||
| 0.0 | 0.572 | a | 1.344 | a | 3.30 | b | 41.89 | a | ||||||||
| 0.5 | 0.555 | b | 1.259 | b | 3.44 | a | 41.32 | ab | ||||||||
| 1.0 | 0.563 | ab | 1.301 | ab | 3.32 | b | 40.04 | b | ||||||||
| LSD0.05% | 0.012 | 0.067 | 0,10 | 1.45 | ||||||||||||
DF, degrees of freedom; MS, mean square; P, probability; η2, eta squared; *** significant effect at the 0.001 level; ** significant effect at the 0.01 level; * significant effect at the 0.05 level. Different letters in each column indicate significantly different values at 0.05 level according to Least Significant Difference (LSD).
Disclaimer/Publisher’s Note: The statements, opinions and data contained in all publications are solely those of the individual author(s) and contributor(s) and not of MDPI and/or the editor(s). MDPI and/or the editor(s) disclaim responsibility for any injury to people or property resulting from any ideas, methods, instructions or products referred to in the content. |
© 2025 by the authors. Licensee MDPI, Basel, Switzerland. This article is an open access article distributed under the terms and conditions of the Creative Commons Attribution (CC BY) license (http://creativecommons.org/licenses/by/4.0/).
Copyright: This open access article is published under a Creative Commons CC BY 4.0 license, which permit the free download, distribution, and reuse, provided that the author and preprint are cited in any reuse.


