
Submitted:
12 December 2025
Posted:
15 December 2025
You are already at the latest version
Abstract
Extracellular DNA (eDNA) has gained attention as a danger signal between organisms because of the ecological implications of this mechanism and its great potential as a biological modulator in agriculture. Self-DNA has been evaluated earlier as a DAMP and non-self-DNA as a PAMP, both as plant elicitors. Here we show the biostimulant effect of eDNA extracted from the bacterial phytopathogen Clavibacter michiganensis subsp. Michiganensis foliarly applied one onto tomato plants in different concentra-tions (50, 100 and 150 µg mL-1). Monitoring morphology of the plants, spectrophoto-metric determinations and RT-qPCR assays showed that plant growth, immune system and secondary metabolism activation as well as differential expression of defense genes, showed a positive response to some of the eDNA treatments in a dose-dependent manner. This work represents a step forward in the development of effective and more sustainable agricultural technology in crop production.
Keywords:
bioestimulation
; elicitors
; extracellular DNA
; PAMPs
1. Introduction
Plants survival depends mostly on their capacity to sense and understand their close surroundings and display the right responses on time and intensity to overcome potential dangers [1]. Their immune systems rely on the structures that coevolution has shaped according to the most important signals to detect, for example the presence of microbial pathogens, and once the signals have been sensed, a specific signal transduction starts, including several cascades of molecular events generally ending in expression changes of genes [2]. The defense program that is activated depends on the signals that the system detects, one of the commonly reported is the PAMP-triggered immunity (PTI), which is sensible to pathogen (or microbial)-associated molecular patterns (PAMPs), as its name indicates and consists of the initial general layer of defense whose main objective is to restrict the pathogen proliferation inside the plant tissues [3]. PAMPs have been reported as highly conserved molecules in common pathogen structures, sensed by organisms as a danger signal [4]. Identified PAMPs are flagellin, a ubiquitous component of bacterial flagella that causes the activation of early immune events in plants. Such signal activation includes receptor-like cytoplasmic kinases (RLCKs), ion channels and defense-specific mitogen-activated protein kinases (MAPKs), accumulation of reactive oxygen species (ROS), increase in cytosolic Ca2+ influx, among other that eventually end in synthesis of secondary metabolites and defense hormones [5]. Another PAMP example is the elongation factor Tu (EF-Tu), one of the most abundant bacterial proteins activate the so called PAMP-triggered immunity (PTI) in plants. EF-Tu is detection causes the transcriptional reprogramming of defense genes such as WRKY transduction factors and pathogenesis-related proteins (PR), different from the activation of the effector-triggered immunity (ETI) response [6].
A recently identified PAMP is the extracellular DNA (eDNA). eDNA has been addressed as a damage-associated molecular pattern (DAMP) when is sensed as self-DNA in multiple organisms [7], but recent studies have also shown that plants respond to eDNA extracted from microorganisms as potential pathogens. Serrano-Jamaica et al. [8] applied a mixture of fragmented DNA extracted from common phyopathogenic microorganisms (Phytophthora capsici, Fusarium oxysporum and Rhizoctonia solani), to Capsicum annumm plants and reported the activation of several defense responses such as an increment of phenolic compounds and total flavonoids, and upregulation of phenylalanine ammonium lyase and chalcone synthase. Moreover, as proof of immune activation, the treated plants showed more resistance to the induced infection of these three pathogens at the same time. Also, the role of DNA as part of a strategy to manage tomato (Solanum lycopersicum) pathogens has been addressed as a DAMP while applying DNA from the plant and as a PAMP when applying DNA from de pathogen [9] opening the possibility to a DNA-based agricultural application.
Aside from the elicitor effect, that eDNA used PAMPs cause in plants immune system, the effect on variables of agricultural interest such as growth and development in absence of the pathogen have not been fully evaluated. This trait should be addressed in PTI activation events to avoid negative impact in agronomical variables of the culture. Biostimulants have effect on primary metabolism of plants and causes the increment of plant growth and development through the plant phenological stages [10]. This may be finally reflected on yield increments. Thus, based on the aforementioned scenario, this work aimed to evaluate the biostimulation effect of tomato (Solanum lycopersicum) using extracellular DNA (e-DNA) fragments of the pathogen Clavibacter michiganensis subsp. Michiganensis (Cmm) as an elicitor.
2. Results
2.1. Effect of Applying eDNA Fragments from Cmm on Tomato Plants Morphological Variables
Plant height and stem diameter were determined at 0, 5, 15, and 30 days after elicitation (dae) with eDNA of Cmm. The height of plants treated with eDNA fragments of the Cmm is shown in Figure 1a. A statistically significant increase in plant height can be observed at 15 and 30 dae in treatments with eDNA fragments of the Cmm at concentrations of 100 and 150 µg mL-1, compared to the control plants (C).
The measurement of plants stem diameter is a fundamental variable for assessing plant health, monitoring its development, and even planning its management and harvest. It indicates the strength and vigor of the plant’s growth, affects its capacity to support and transport fluids (water and nutrients), and can be a predictor of crop quality and yield [11]. At 15 and 30 dae, a statistically significant increase in diameter was observed for eDNAFCmm50 and eDNAFCmm100 treatments compared to the control plants (C) (Figure 1b).
Another important organ for the survival and healthy growth of plants is the root; the root size (length, width, and dry weight) is related to the search for resources in the soil, thereby determining the plant’s ability to absorb water and nutrients and providing physical anchorage [12]. In herbaceous plants, Wijesinghe et al. [13] found that root size was related to the accuracy of nutrient search among species; root system size is also related to the yield and drought tolerance of many plants. The length, width, and weight of the roots were evaluated at 30 dae as indicators of healthy growth in tomato plants (Figure 2a, 2b, 2c and Figure 3). In the case of root length (Figure 2a) a statistically significant increase was observed among the eDNAFCmm50 treatment plants compared to the control plants (C). The highest values for root width and dry root weight were obtained for eDNAFCmm50 and eDNA eDNAFCmm100 treatments, showing a statistically significant difference compared to the control plants (C) and eDNAFCmm150 treatments (Figure 2b, 2c and Figure 3. In dry root weight variable a decrease was observed as an effect of the higher concentration of eDNA (150 µg mL-1).
Figure 1.
Morphological variables in tomato plants. (a) Plant height and (b) Stem diameter evaluated in different times (0, 5, 15 and 30 dae). Two-way mean ± standard deviation, Tukey’s test, p < 0.005. Significant differences between treatments are indicated by different letters. FCmm: DNA fragments from the pathogen Clavibacter michiganensis subsp. michiganensis; C: Control plants. 50, 100, and 150, concentration of the mixture of the eDNA fragments of the pathogen Cmm given in µg mL-1.
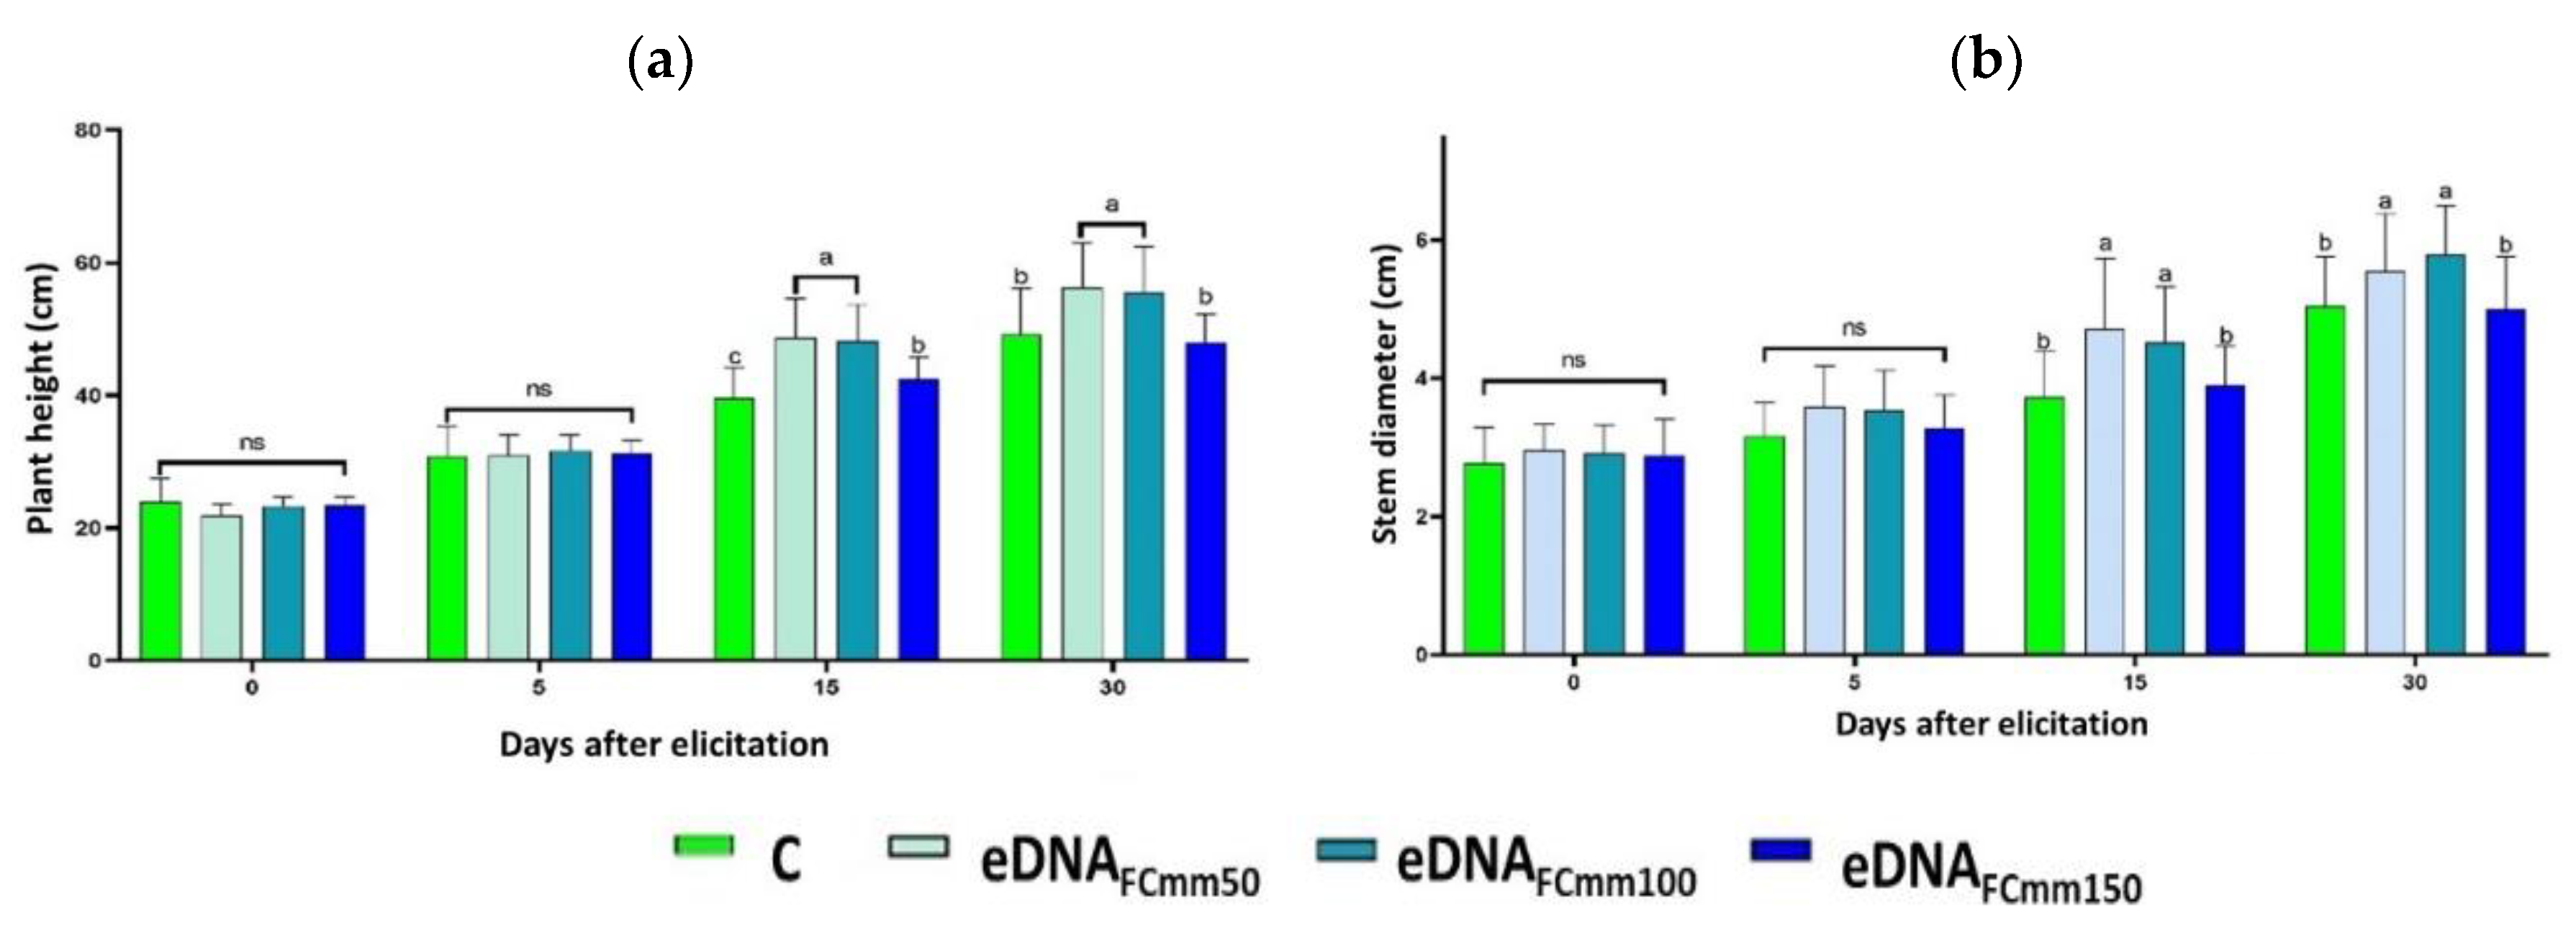
Figure 2.
Morphological variables in root of evaluated tomato plants. Length (a), width (b), and dry weight (c) of roots at 30 dae. Two-way mean ± standard deviation, Tukey’s test, p < 0.005. Significant differences between treatments are indicated by different letters. FCmm, DNA fragments from the pathogen Clavibacter michiganensis subsp. michiganensis; C, Control plants. 50, 100, and 150, concentration of the mixture of the eDNA fragments of the pathogen Cmm given in µg mL-1.
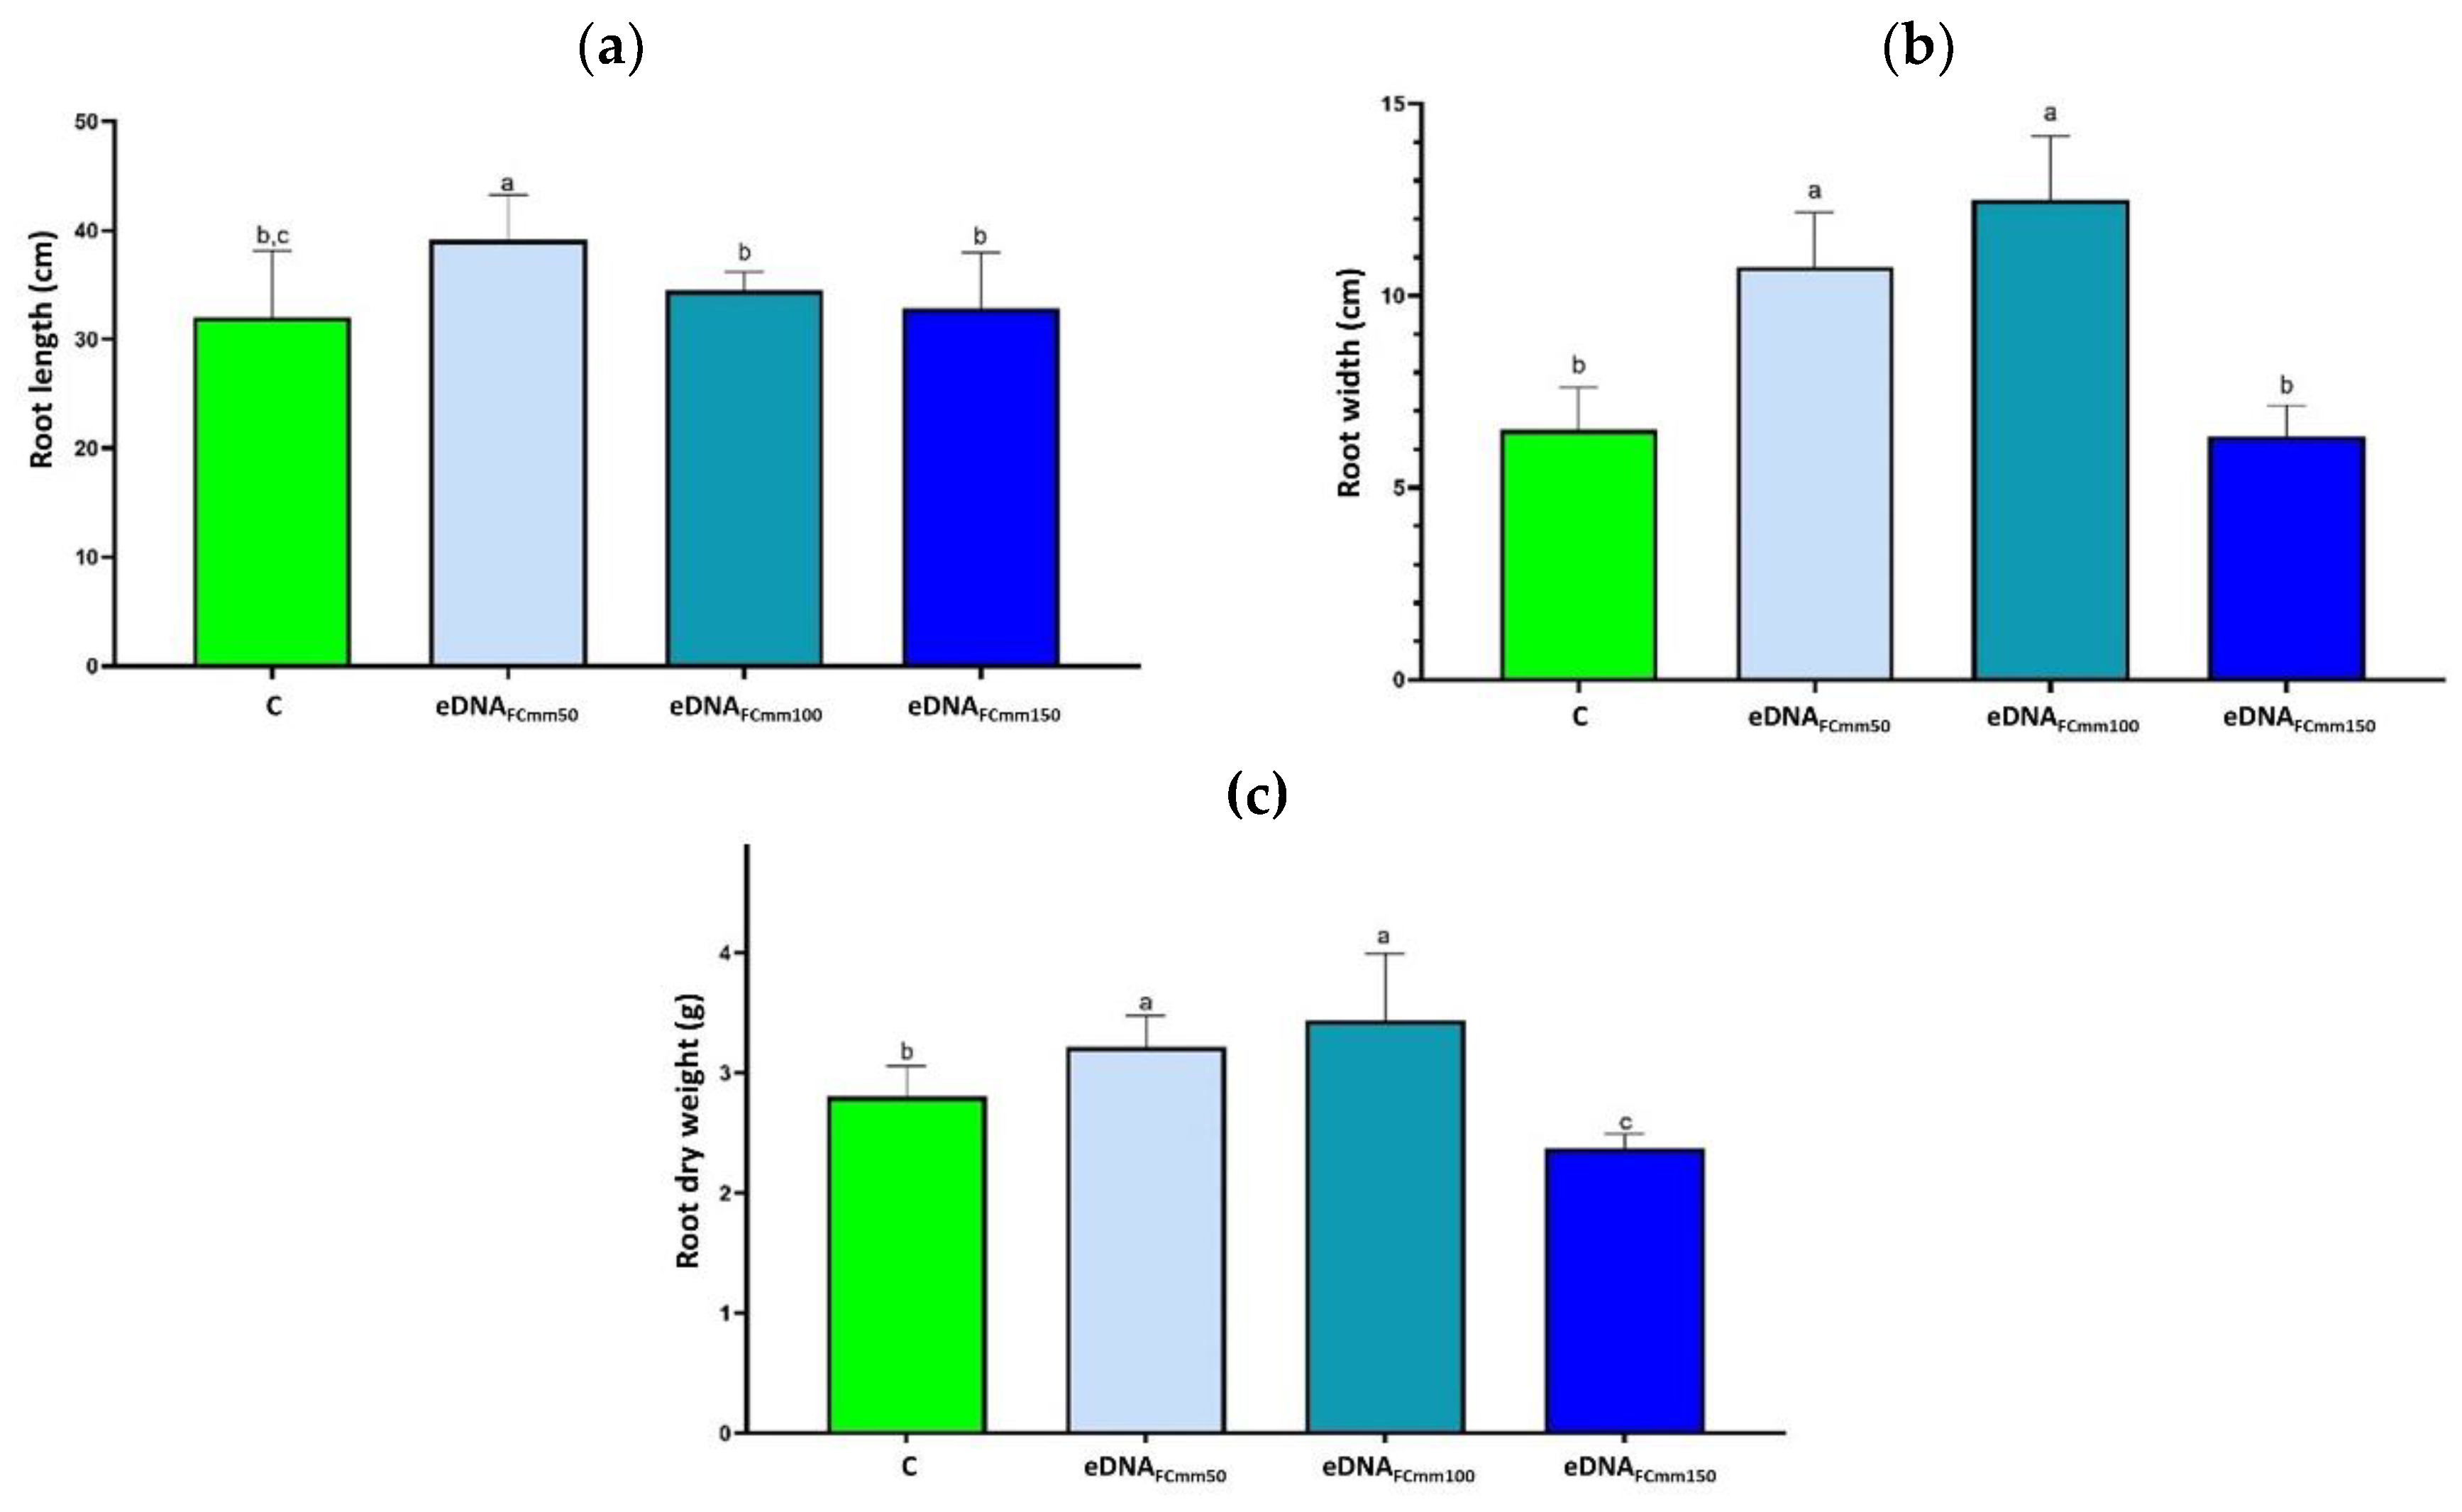
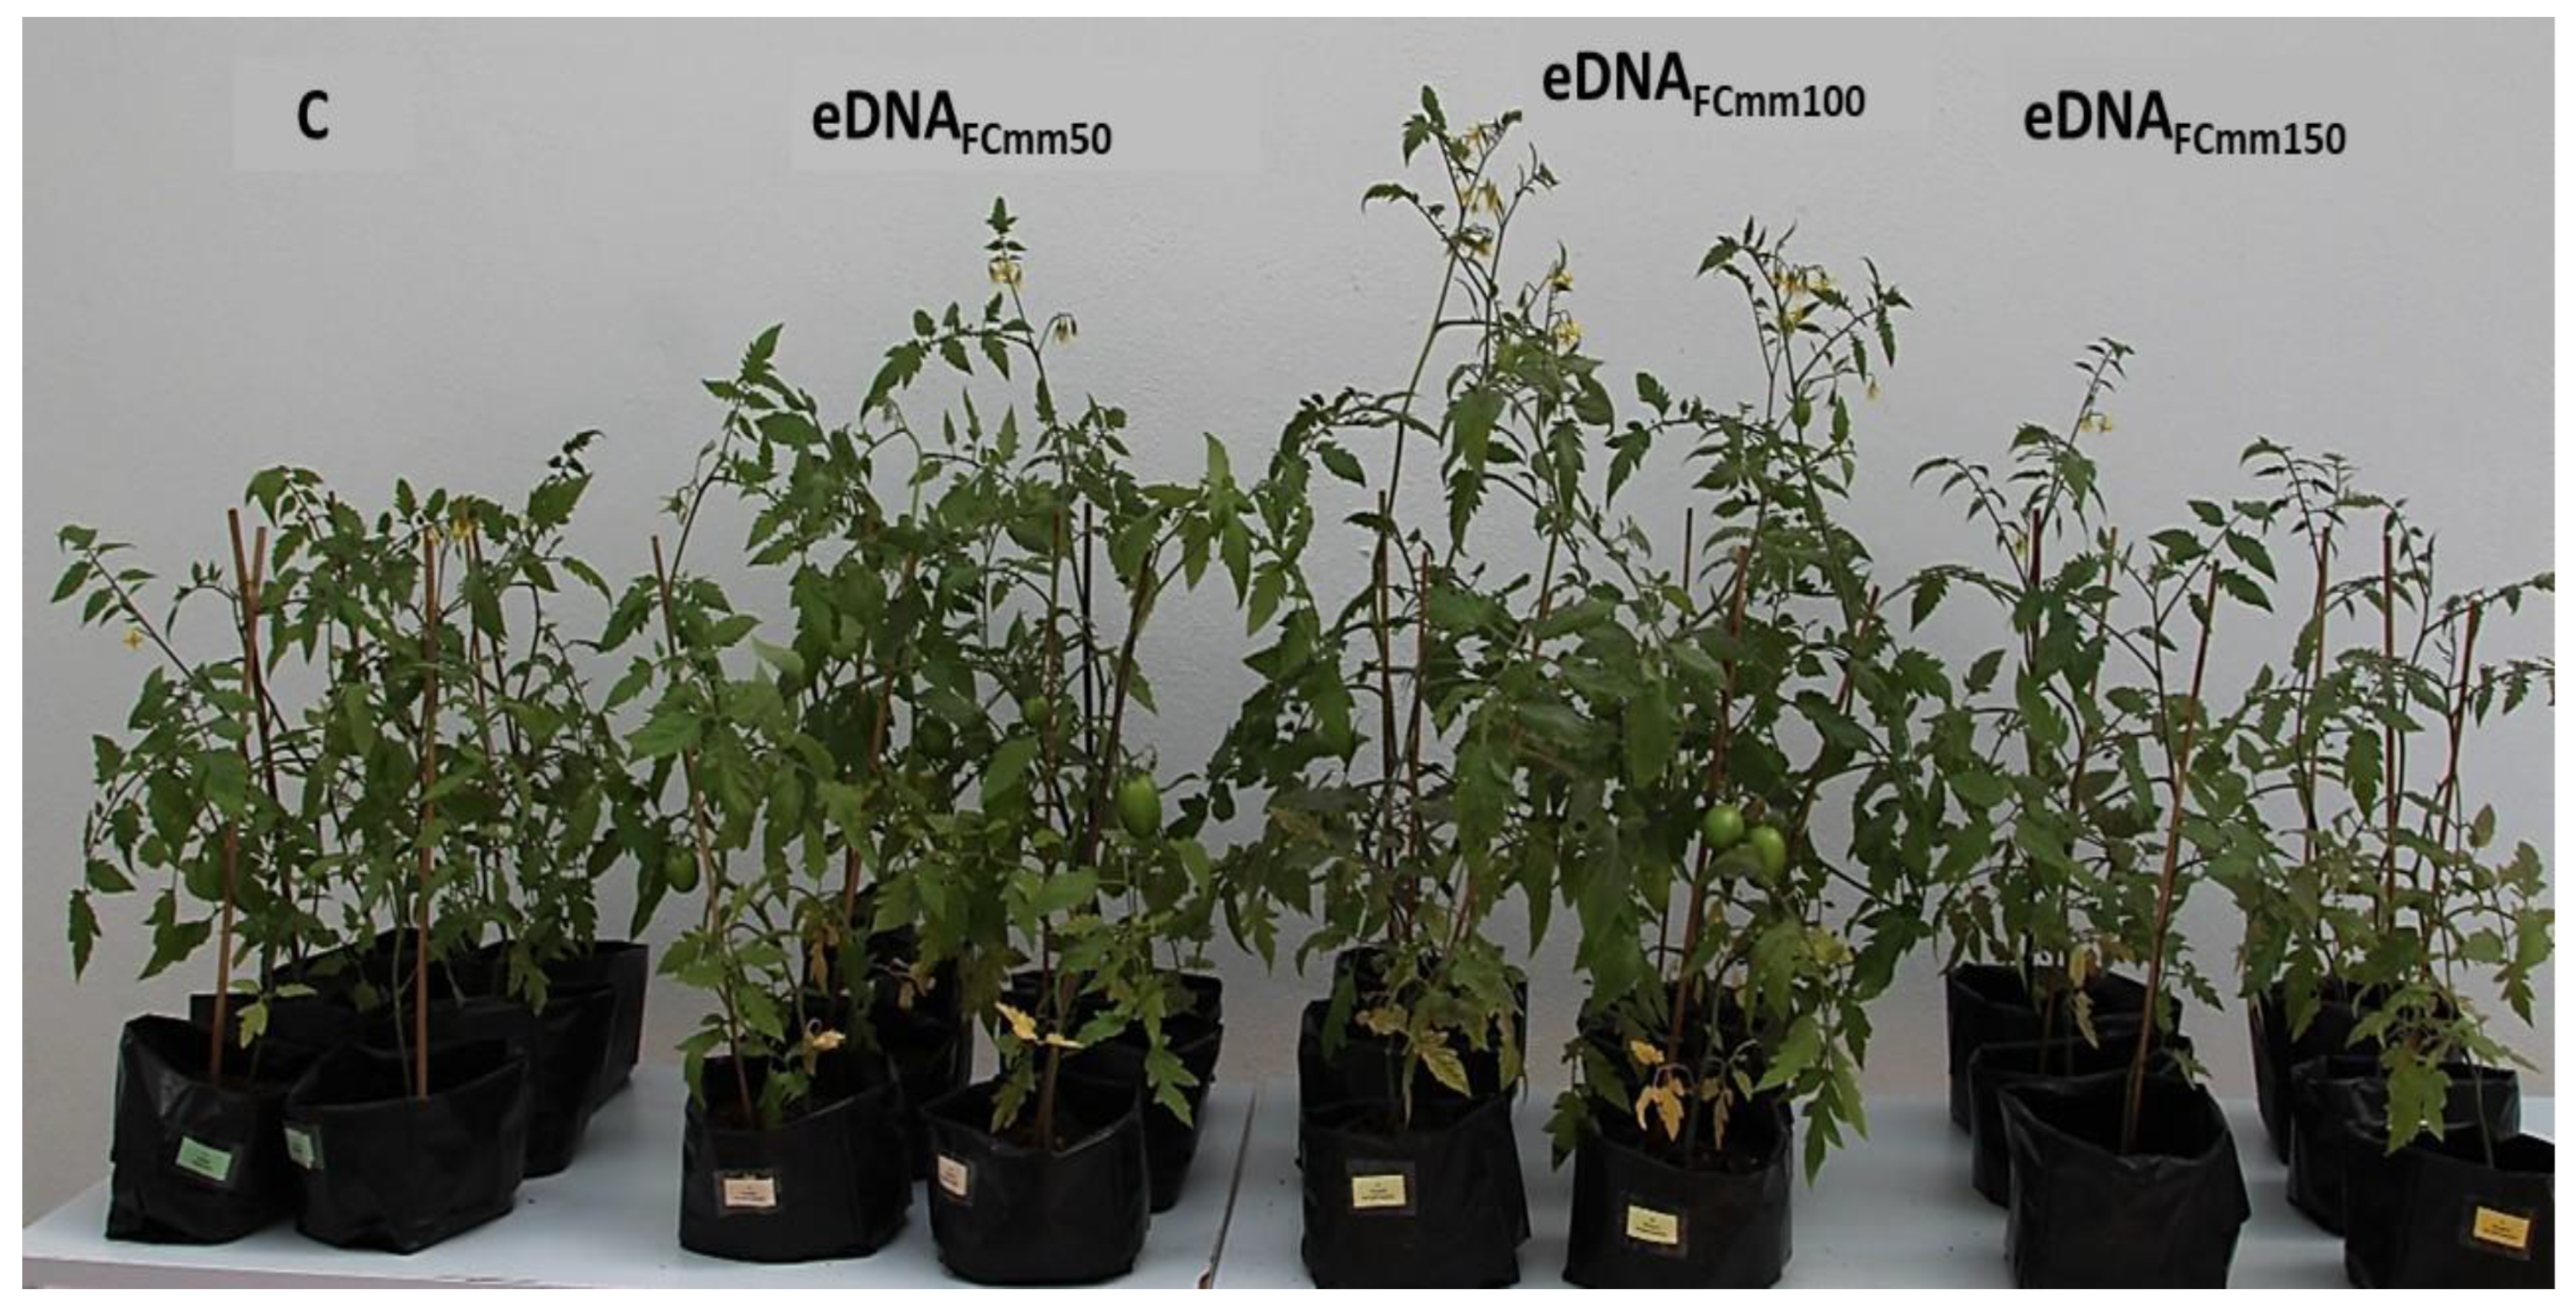
Figure 4 shows the phenotypic characteristics of tomato plants subjected to treatments with eDNA fragments from Cmm, as well as control plants at 30dae. The biostimulation of plant performance was improved in the treatments eDNAFCmm150 and 100.
Figure 3.
Root of tomato plants evaluated at 30 dae. FCmm, DNA fragments from the pathogen Clavibacter michiganensis subsp. michiganensis; C, Control plants. 50, 100, and 150, concentration of the eDNA fragments of the pathogen Cmm are given in µg mL-1.
Figure 3.
Root of tomato plants evaluated at 30 dae. FCmm, DNA fragments from the pathogen Clavibacter michiganensis subsp. michiganensis; C, Control plants. 50, 100, and 150, concentration of the eDNA fragments of the pathogen Cmm are given in µg mL-1.
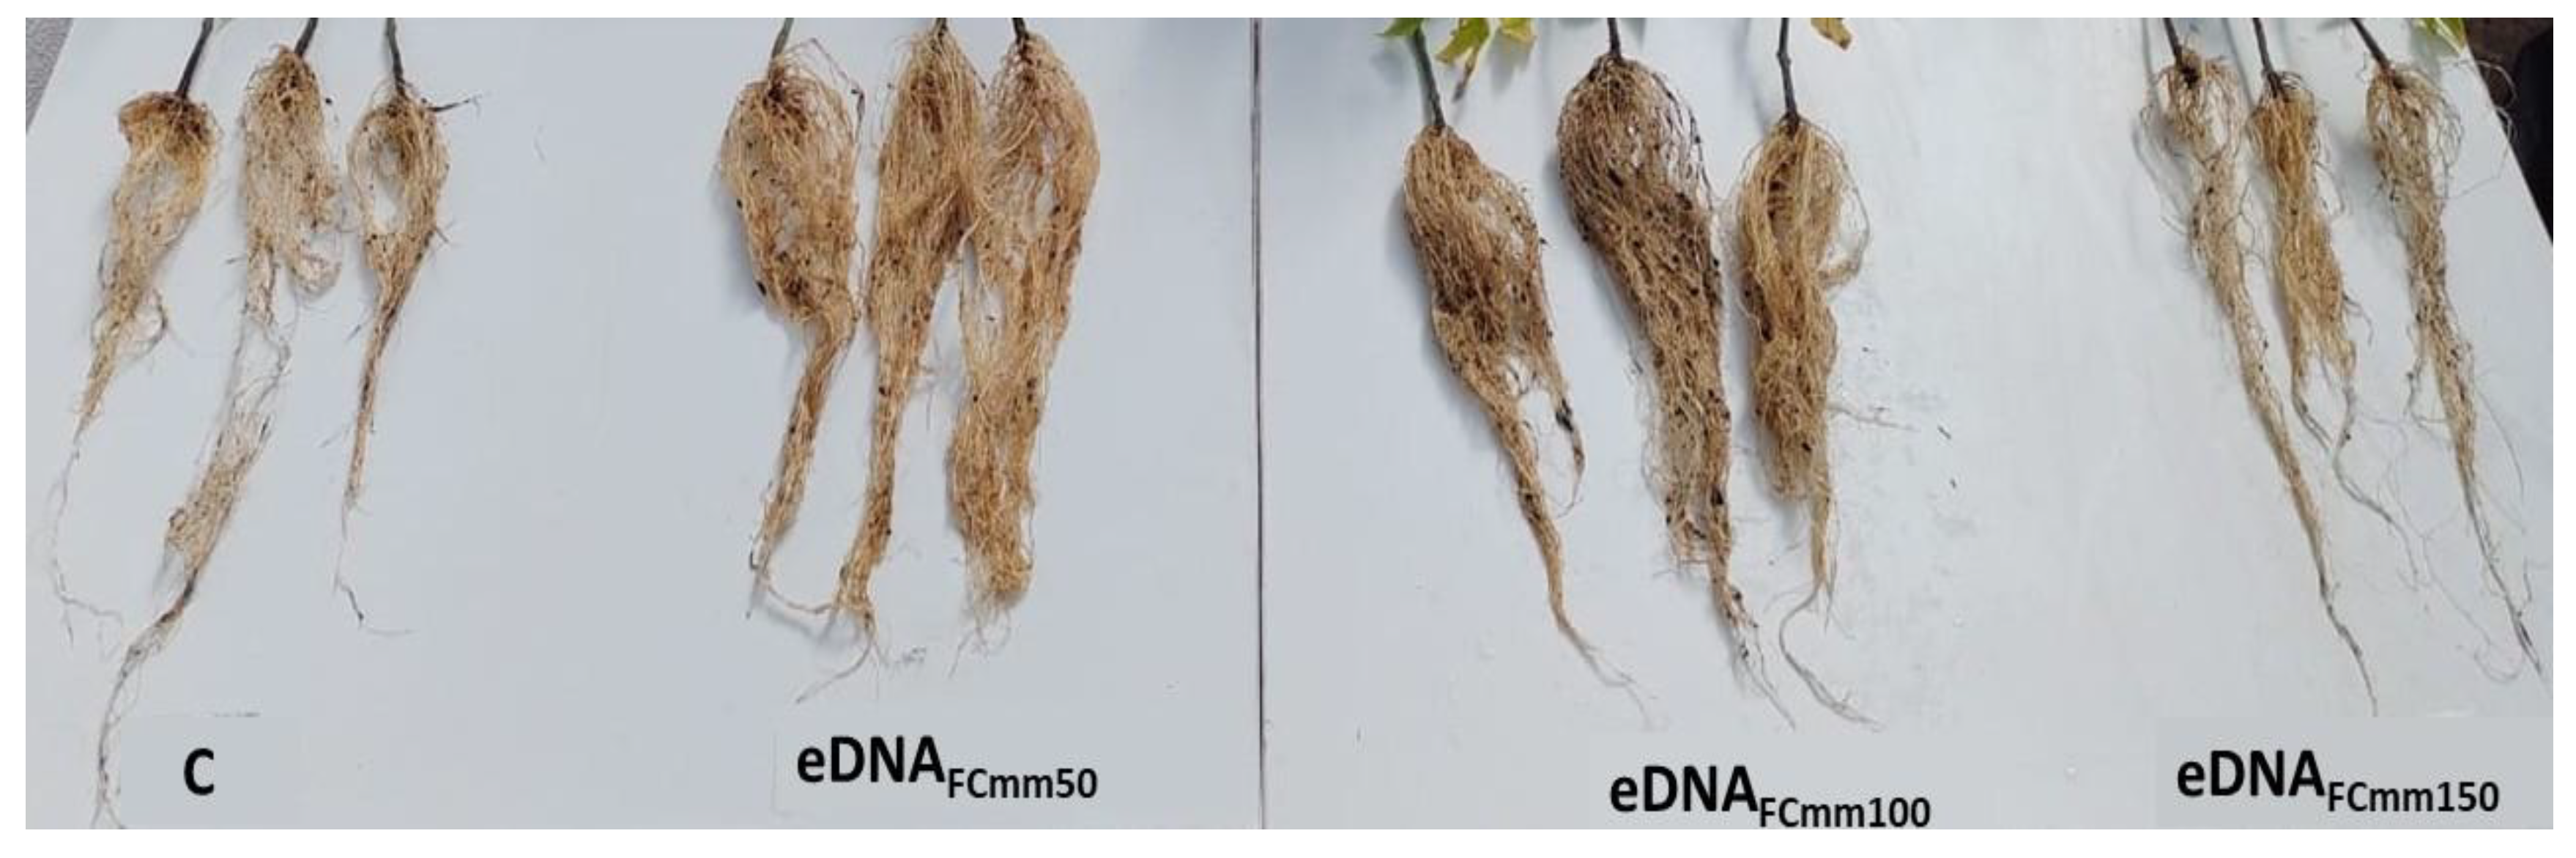
Figure 4.
Tomato plants (Solanum lycopersicum) treated with eDNA fragments of the pathogen Cmm at 30 dae (days after elicitation). FCmm, DNA fragments from the pathogen Clavibacter michiganensis subsp. michiganensis; C, Control plants. 50, 100, and 150, concentrations of the eDNA fragments are given in µg mL-1.
2.2. Total Phenol and Flavonoids Levels in Tomato Plants Treated with the eDNA Fragments from the Pathogen Cmm
Plants have the ability to produce substances that act as a first line of defense when subjected to stress (biotic or abiotic), initiating the synthesis of phenolic compounds and flavonoids [14]. The production of phenolic compounds in plants works against oxidative damage, while the production of flavonoids has been directly linked to protection against pathogens [15].
The results obtained in the different treatments at 0, 1, 5, 15, and 30 dae showed an increase in the concentration of these phytochemicals (Figure 5). This increase was gradual over time in all plants, but it was significant in plants treated with eDNAFCmm100.
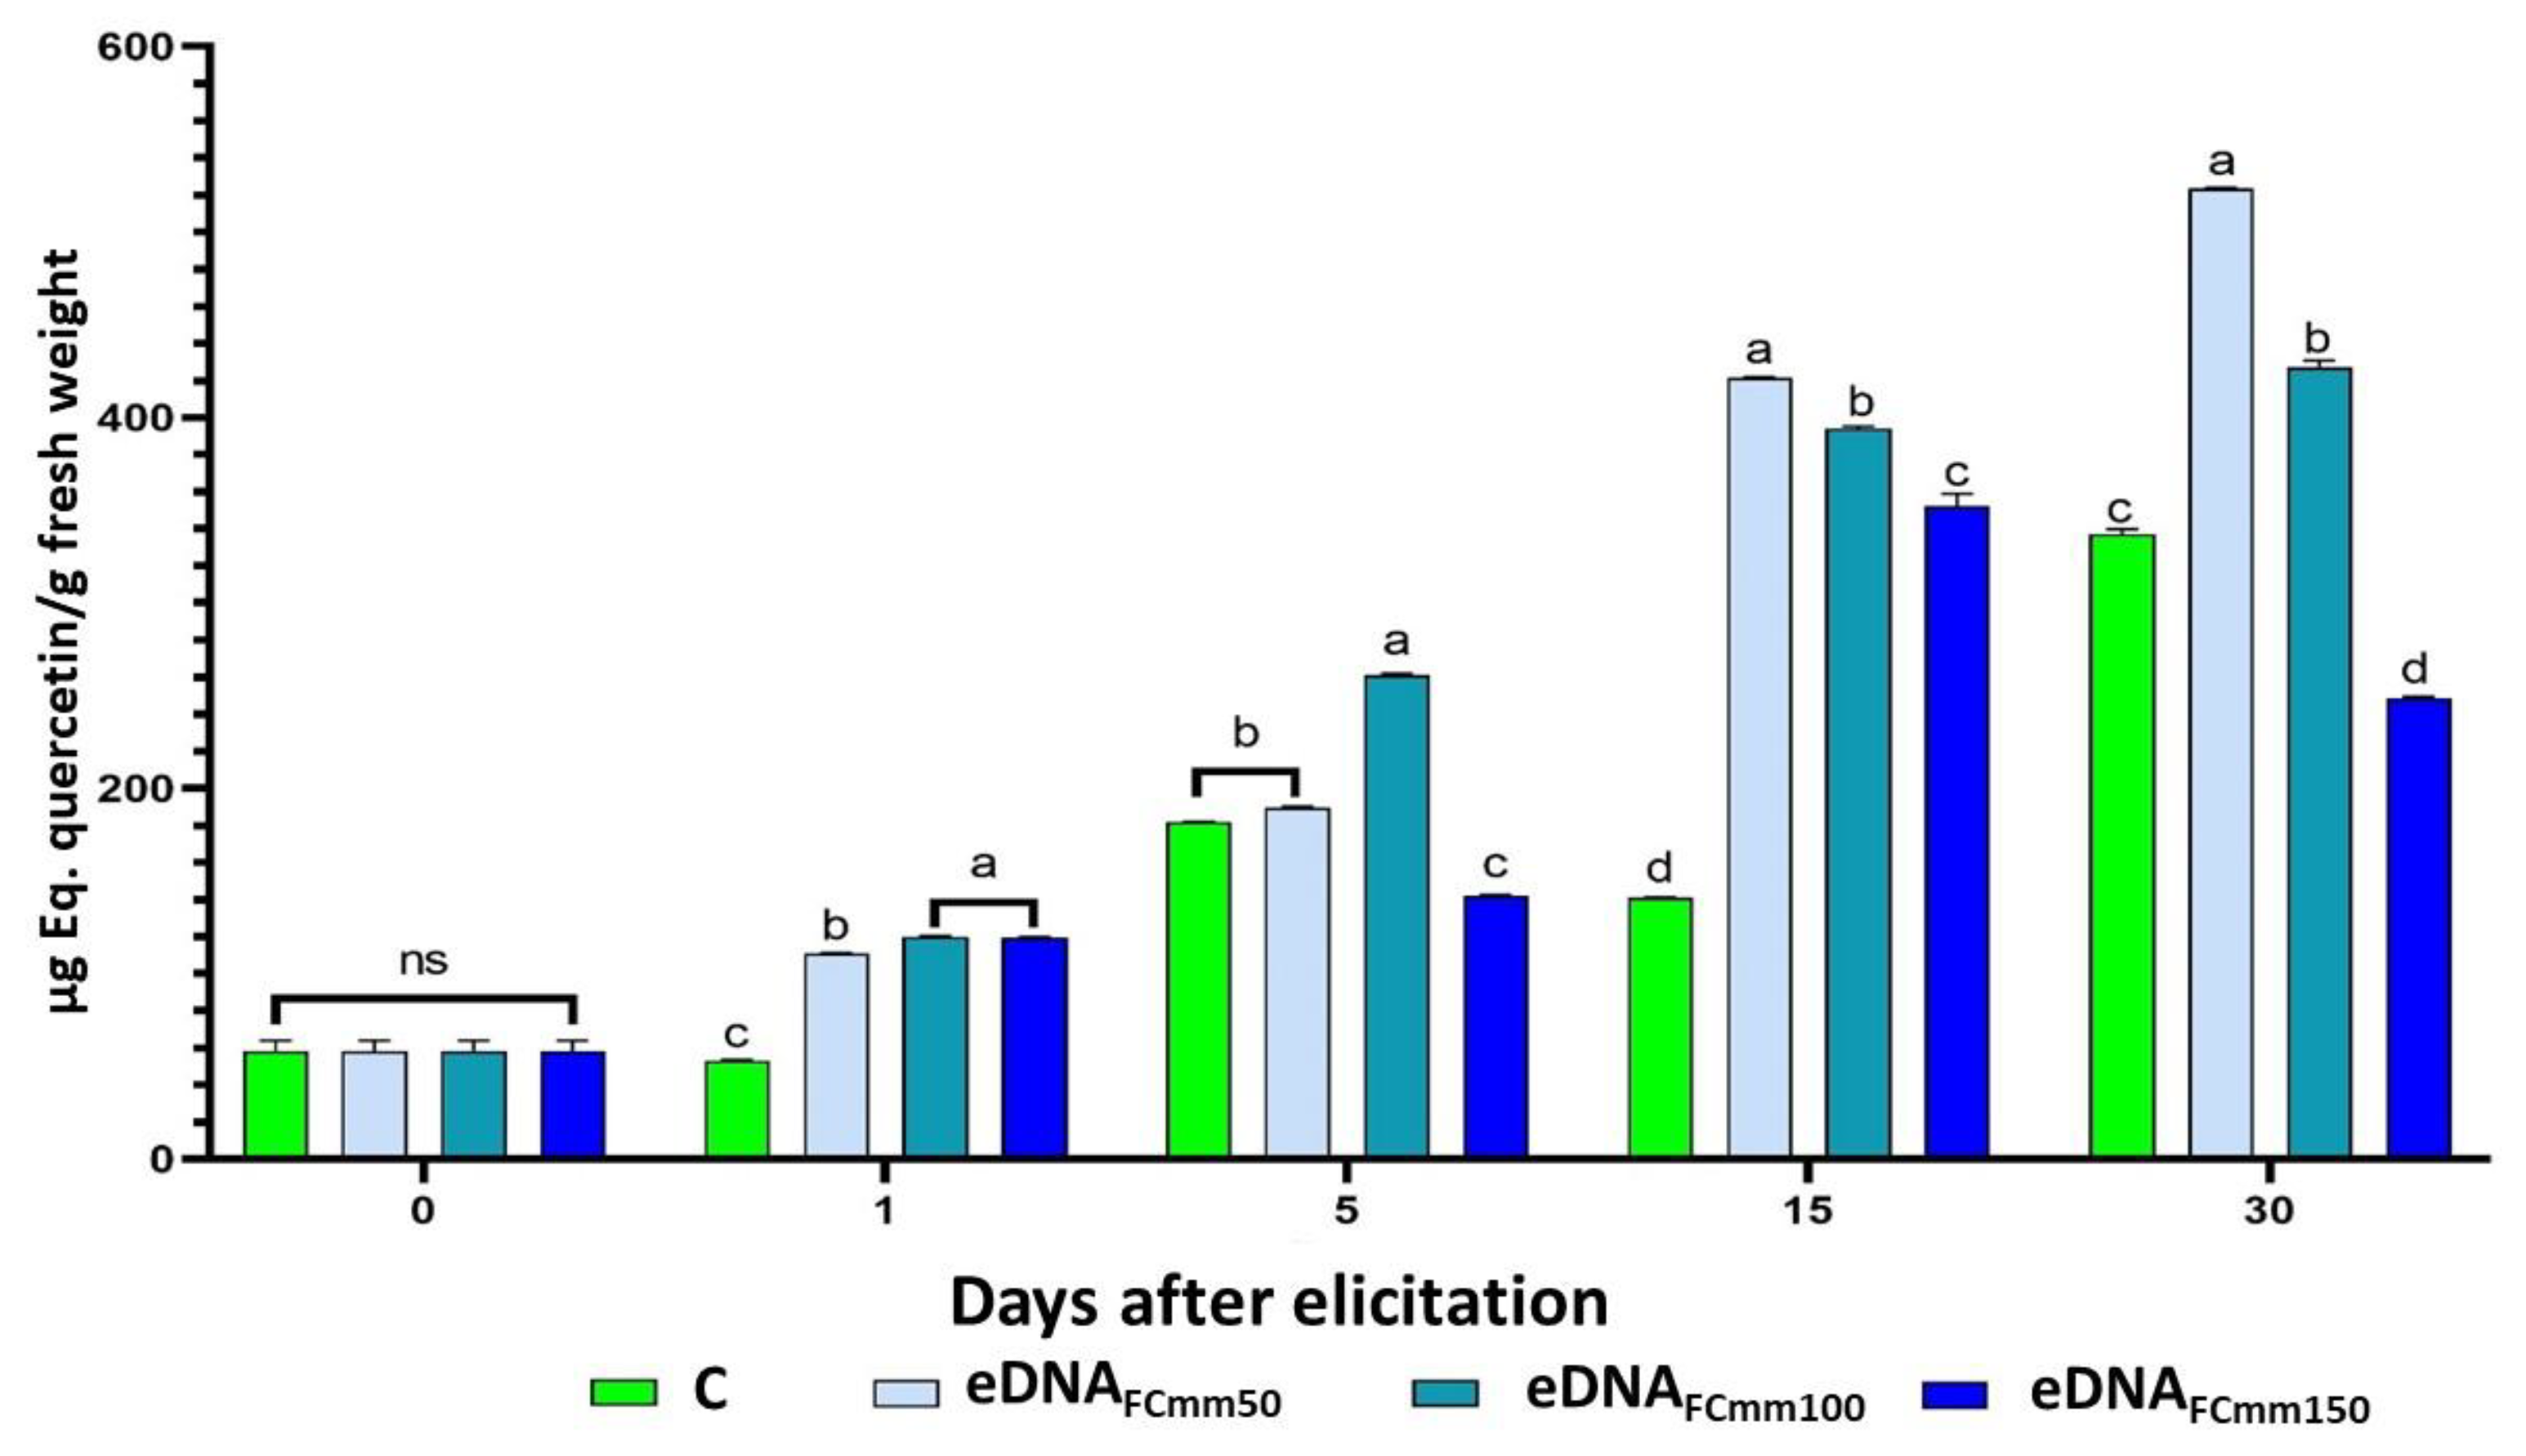
In the case of total flavonoids production (Figure 6), at 1 dae, the highest concentration was found in the eDNAFCmm100 and eDNAFCmm150 treatments. At 5 dae, the concentration increased for all treatments. A significant difference was observed for the eDNA 100 treatment. At 15 dae, the concentration of total flavonoids increased for all treatments with eDNA from the pathogen Cmm, but not for control plants (C). At 30 dae, the highest concentrations were found in the eDNAFCmm50 treatment.
Figure 5.
Total phenols from plants treated with eDNA fragments from Cmm. Samples at 0, 1, 5, 15, and 30 dae. FCmm, DNA fragments from the pathogen Clavibacter michiganensis subsp. michiganensis; C, Control plants. 50, 100, and 150, concentrations of the eDNA fragments are given in µg mL-1. Statistical analysis was performed using two-way ANOVA, Tukey’s test, p < 0.05. Significant differences between treatments are indicated by different letters.
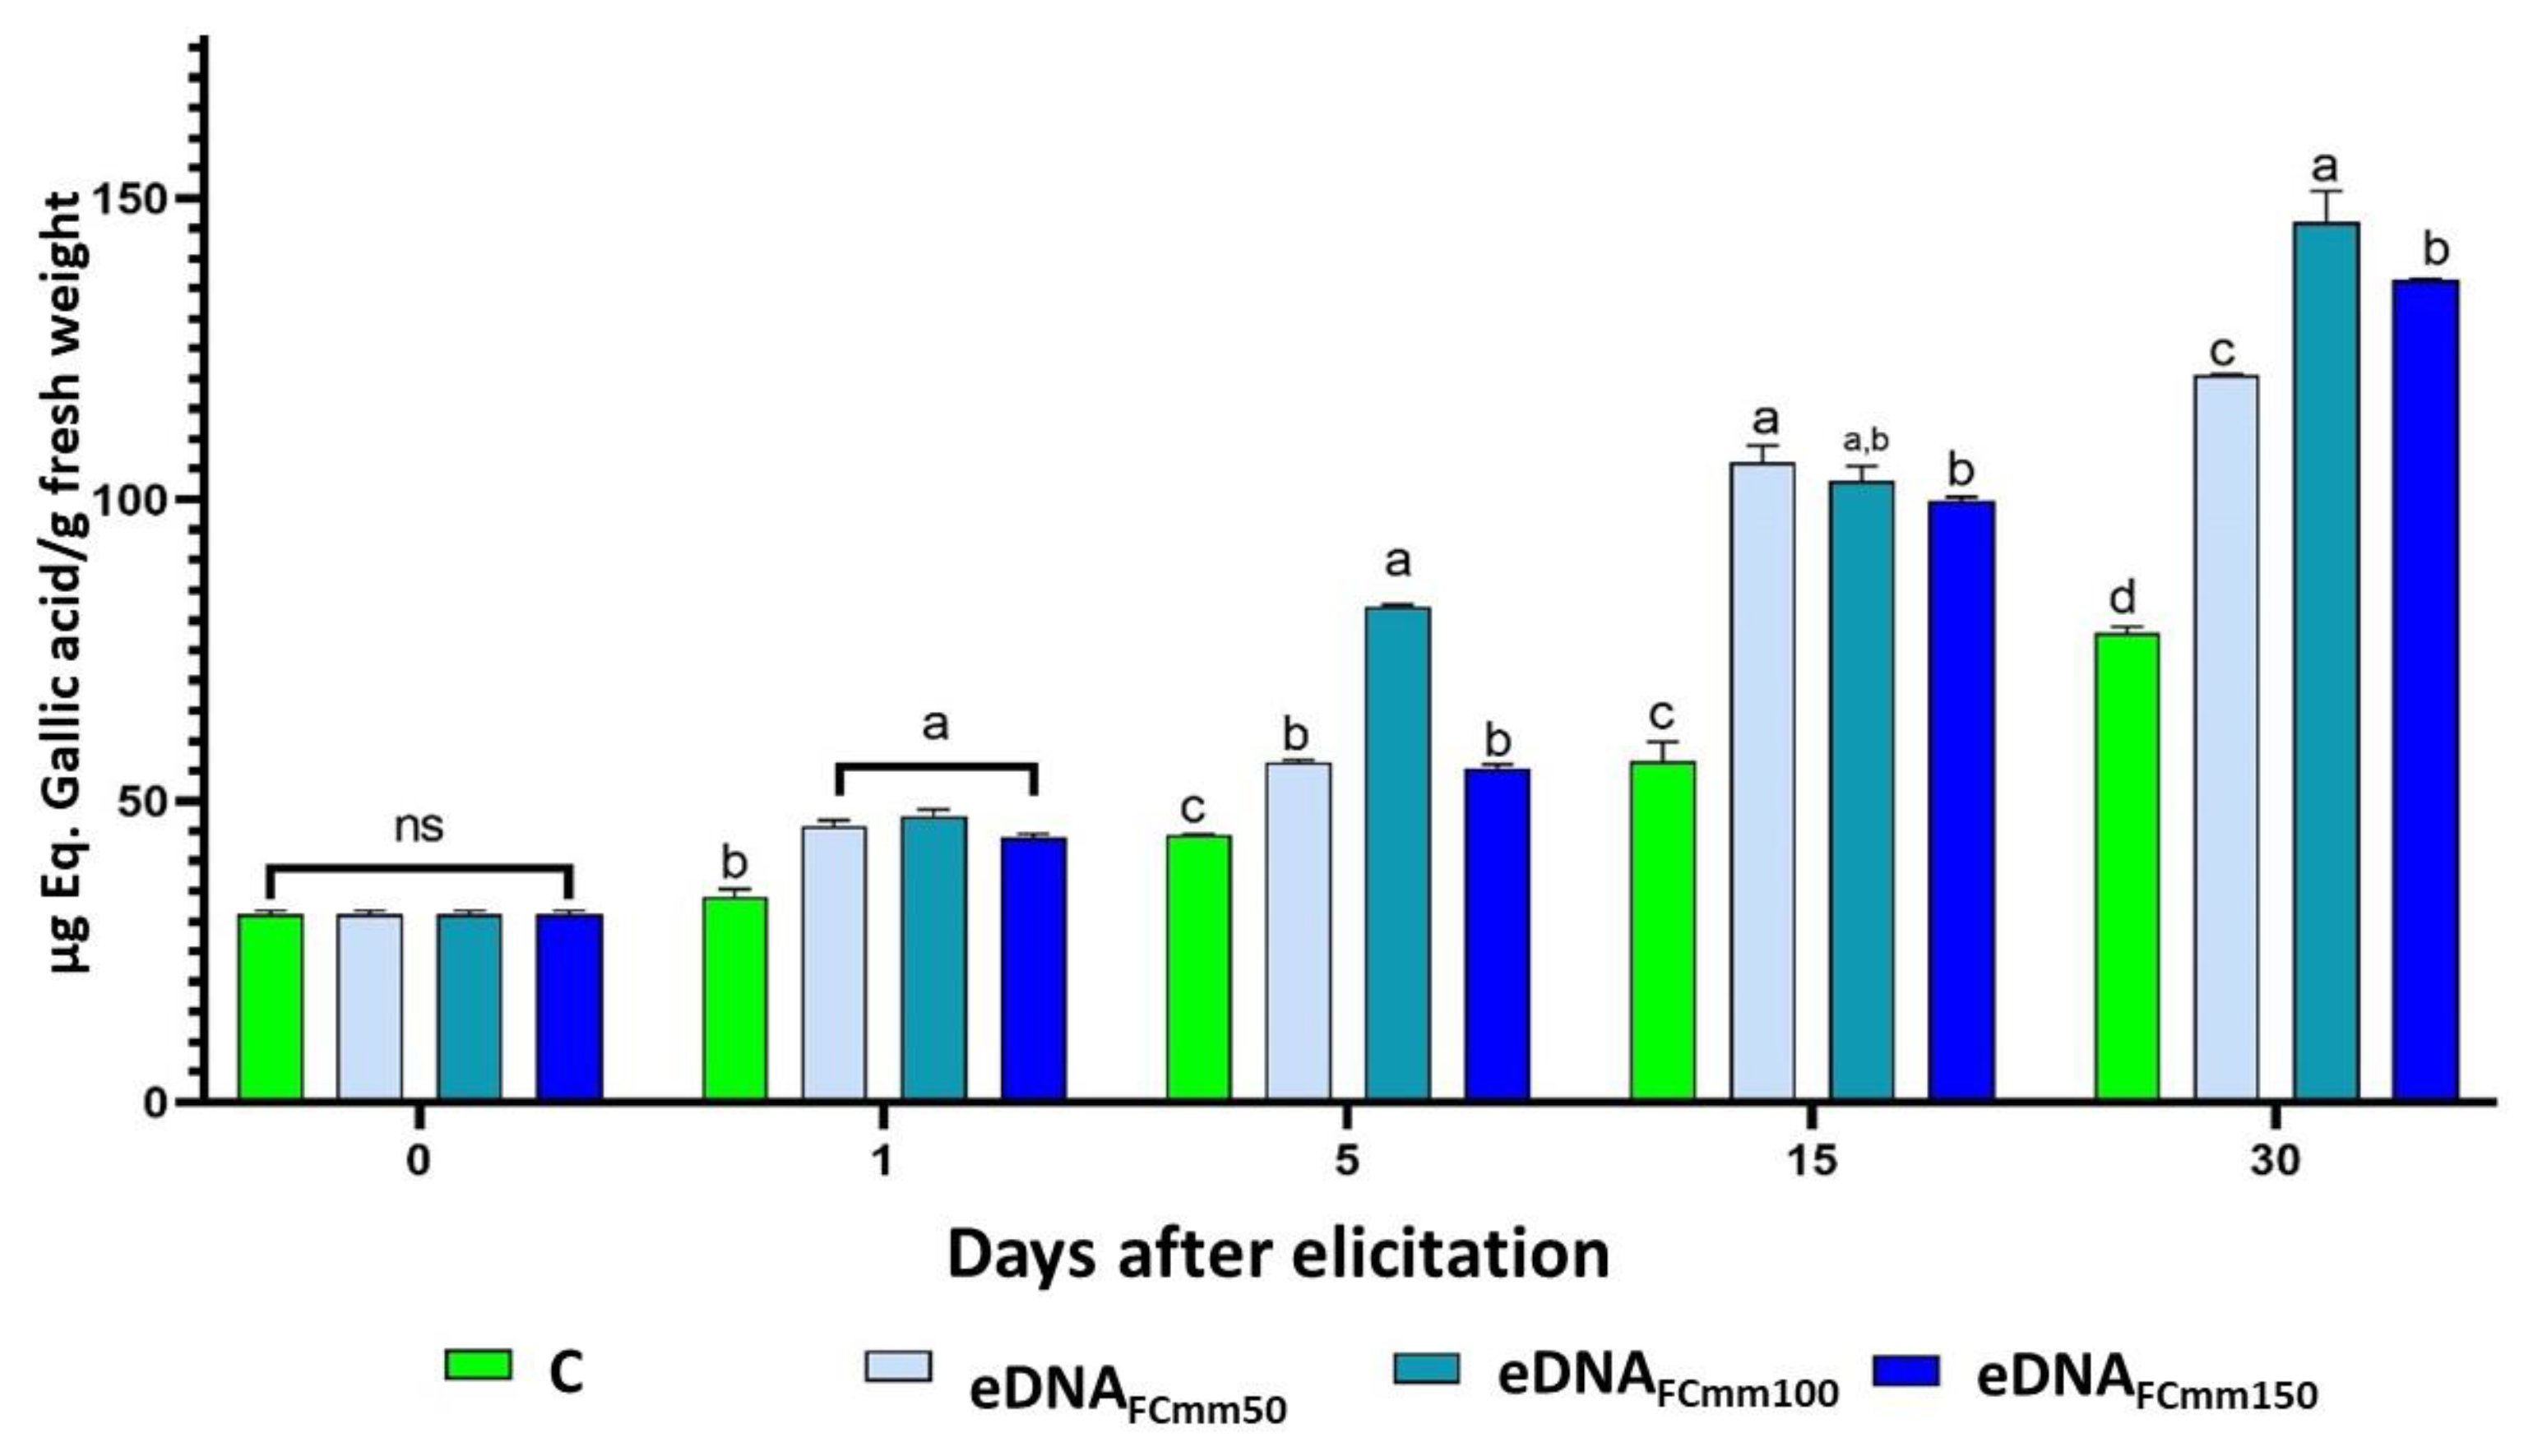
Figure 6.
Total flavonoids from plants treated with eDNA fragments from Cmm. Samples at 0.1, 5, 15, and 30 dae. FCmm, DNA fragments from the pathogen Clavibacter michiganensis subsp. michiganensis; C, Control plants. 50, 100, and 150, concentrations of the eDNA fragments are given in µg mL-1. Statistical analysis: two-way ANOVA, Tukey’s test, p < 0.05. Averages with identical letters indicate no statistically significant differences.
2.3. Analysis of Gene Expression-Associated to Stress Response in Tomato Plants Treated with the eDNA Fragments of Cmm
The expression patterns of the pal, chs and pr1a genes (Systemic Acquired Resistance, SAR gene markers) were analyzed at 0, 5 and 15 dae in the treatments C and eDNAFcmm100 (Figure 7). In general, the three genes were induced as an effect of the application of the treatments with respect to control plants. This suggest, as expected, that the defense response via acquired systemic response (SAR) was induced by these treatments, although in absence of the pathogen. In the case of pal (Figure 7a) and chs (Figure 7b), the highest expression levels occurred at 15 dae. The expression levels of the pr1a showed significant differences at 15 dae between the control plants and the eDNAFCmm100 treatment (Figure 7c).
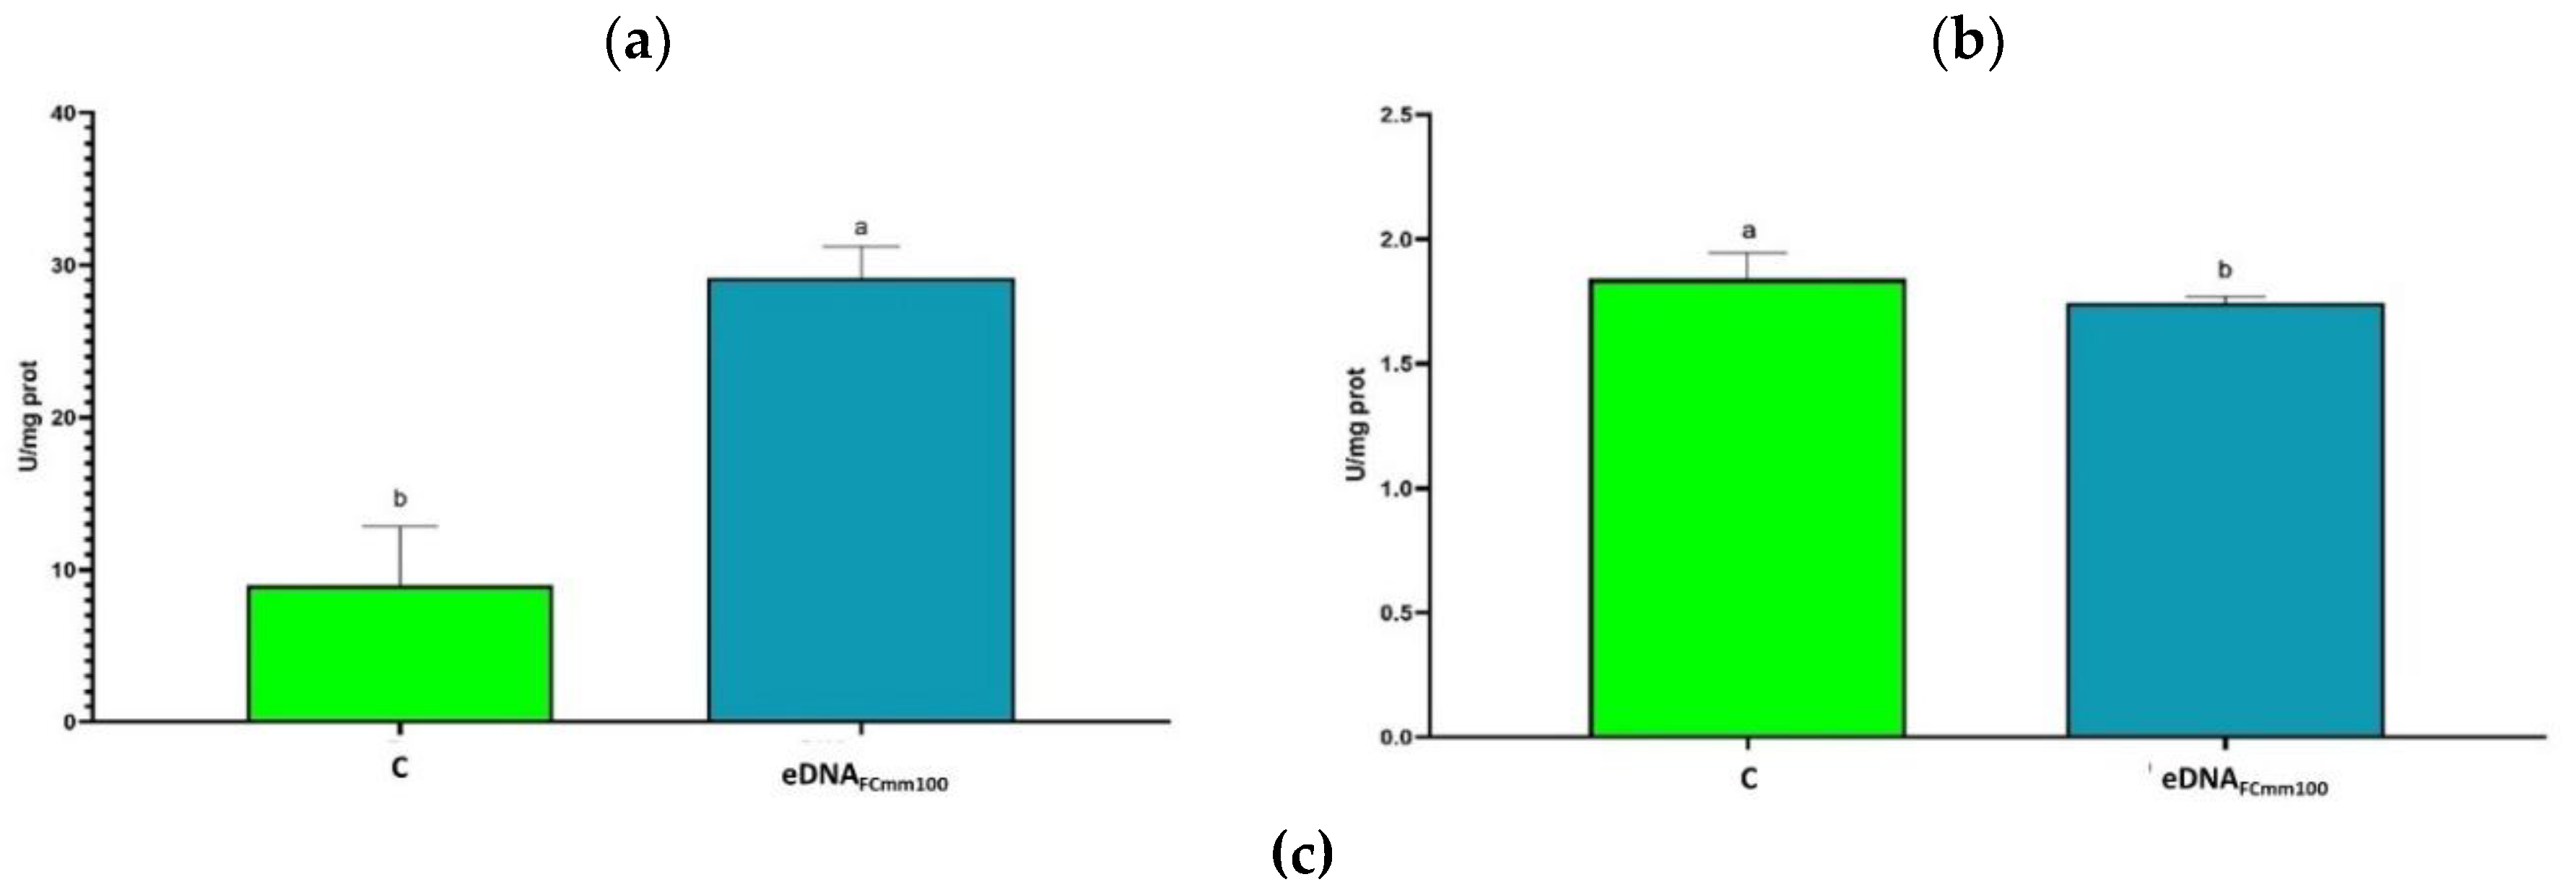
2.4. Analysis of Antioxidant Enzyme Activity in Tomato Plants Treated with eDNA Fragments of the Pathogen Cmm
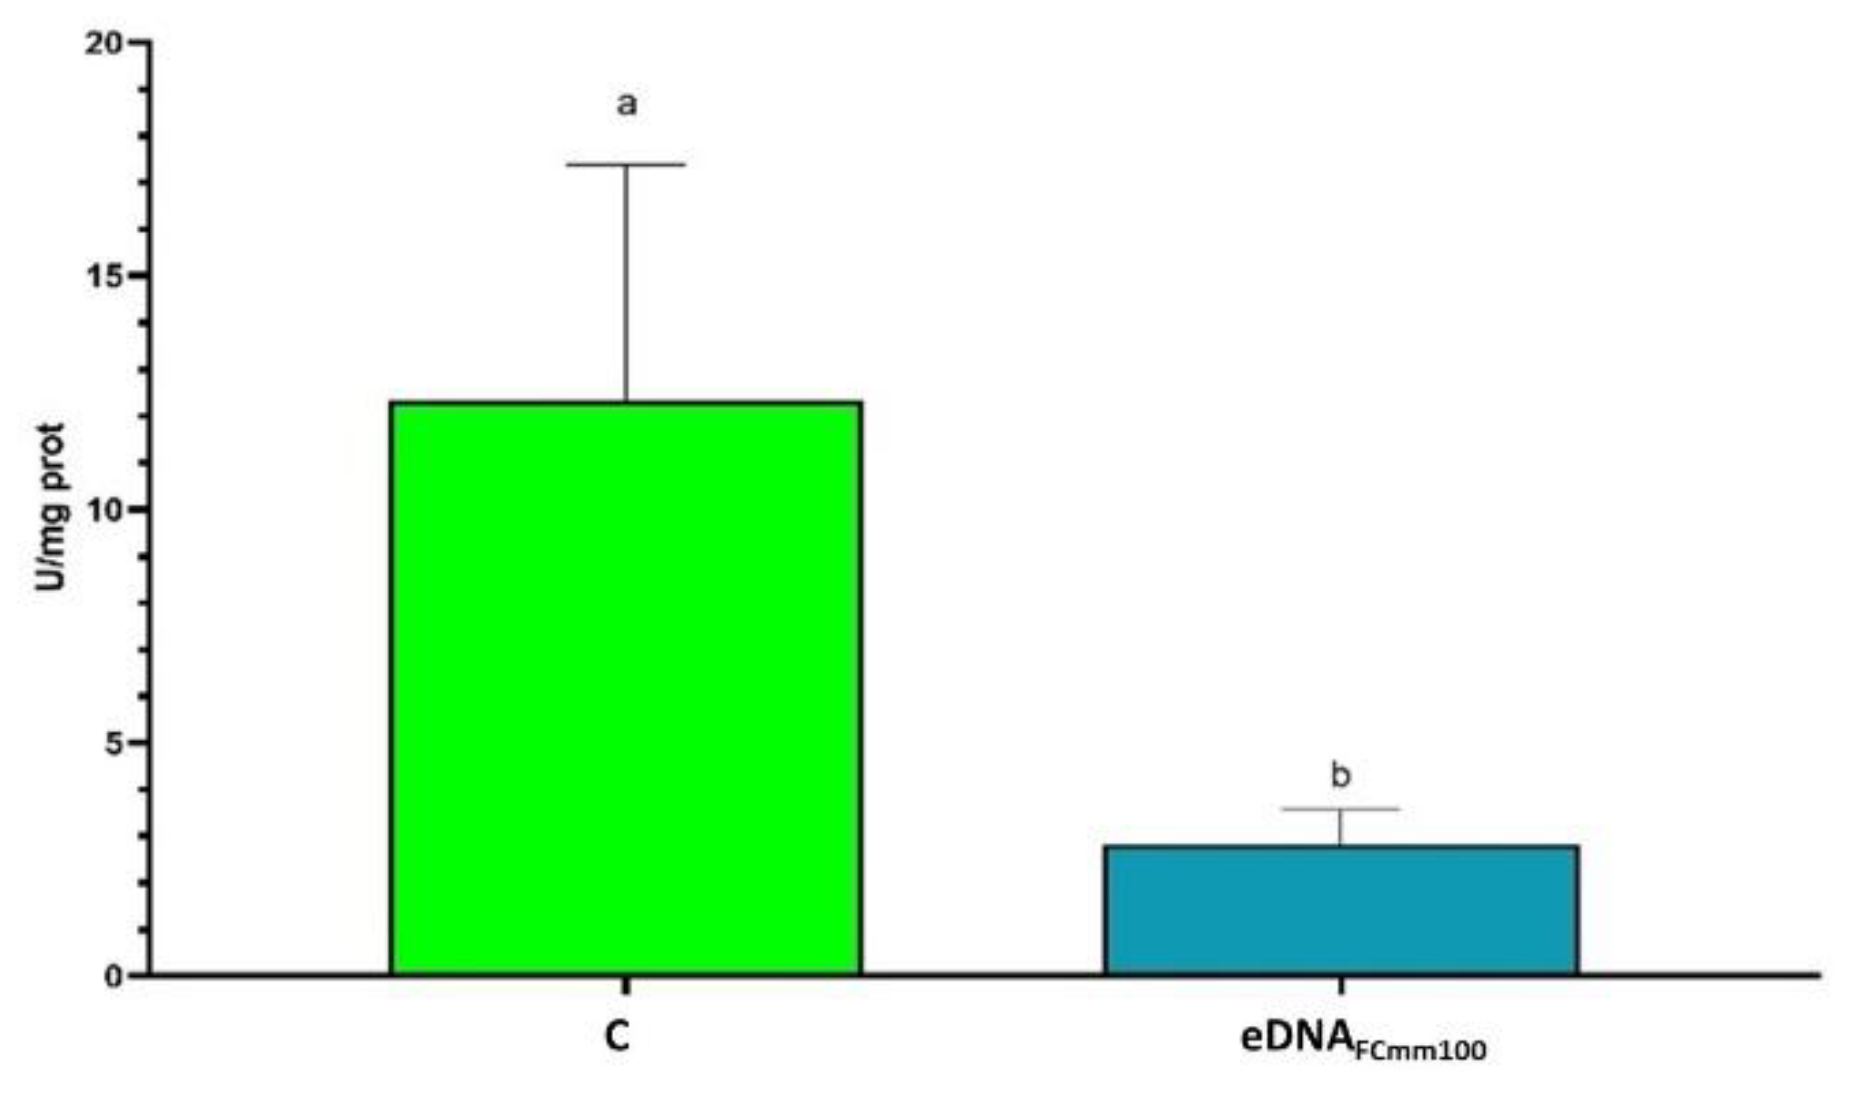
The effect of eDNA treatment on the antioxidant enzyme activities related to stress response was evaluated only in the FCcmm100 treatment, based on the fact that in the previous variables evaluated in this study, in general, that treatment displayed the best biostimulant responses. As shown in Figure 8a, on the one hand, the treatment with eDNA caused a significant activation of PAL at 15dae. On the other hand, SOD and CAT activities showed a significant decrease compared to the control group (Figure 8b,c).
3. Discussion
Biostimulants have recently arise as common products for agricultural use, their principal goals are to increase productivity to meet the population feeding needs and optimize the resources use efficiency while reducing the environmental impact of production systems [10]. Generally, biostimulants are molecules that modulate plants metabolism depending on each case species and goal. Extracellular DNA has shown to affect plants metabolism focusing plant energy on specific biological tasks such as the activation of the plant immune system [16]. This is a positive effect when crops are exposed to pests and pathogens, causing a decrease on the infection symptoms [8] and reflecting on an increment in the final yield. On the other hand, it may be expected that elicitation cause limitations on plant growth or development because of the highly explained growth-defense trade-offs [17]. This is the reason by which evaluation of the effect of multiple concentrations of elicitor applications in growth variables is very important.
In this work, extracellular DNA from the pathogen Clavibacter michiganensis subsp. michiganensis was applied onto tomato plants and growth and immune variables were monitored at different times of the experiment. Almost all the morphological, biochemical and molecular variables evaluated displayed similar response: an increment with statistical differences from the control group starting at 5 days after the elicitation for treatment concentrations of 50 and 100 µg mL-1 and no differences or a decrease for the concentration of 150 µg mL-1. These results recalls a common hormetic response in plants treated with stress factors, consisting in a biphasic response to a stimulus depending on its concentration, expecting positive responses (eustress/biostimulation) at low doses but negative responses (excessive toxic elicitation/distress) at higher doses [18]. Thus, in the present work, the higher treatment (eDNAFCmm150) showed no differences compared to control group at morphological variables and a negative effect in root development because of the accumulation of distress in plants [19].
The application of eDNAFCmm100 and eDNAFCmm50 showed clear biostimulation effects on plants from the day 10 after the elicitation for morphological variables and the day 5 after the elicitation for secondary metabolites production. These results contrast to early studies where Capsicum annuum plants were treated with a mixture of phytopathogen fungi fragmented DNA at 20, 60 and 100 µg mL-1 and plant showed a decrease in height from 14 days after the elicitation and root development at the end of the assay [8]. However, the effect on the synthesis of defense metabolites were similar to this study presenting an increment since early days after the elicitation.
In another study, enzymatic activity of PAL, CAT and SOD were determined after non-self DNA were applied to tomato plants causing an increment in these immune markers from the first hours and a decrement at 10 days after as shown here [16]. CAT and SOD represent the earlier responses and efforts of the plant to balance the oxidative burst activated after the detection of danger signals (such as a PAMP), this may explain why a reduction was observed at 15 dae but the activation effect was maintained for phenols and flavonoids, which represent the late responses of plants to danger. This response was reported also by Agati, et al. [20] when Ligustrum vulgare plants were exposed to UV light and saline stress and antioxidant enzymatic activity was activated as early response which decreased at 12 days of the treatment and the concentration of flavonoids increased at the same time as late responses. In this context, the downregulation of SOD and CAT enzymatic activities at 15 dae may be the signal of an earlier activation and later control.
Non-self DNA effect on plants have been studied in a transcriptomic level unveiling molecular responses related to systemic acquired resistance and hypersensitive stress responses and an expression reprogramming that highly differs from that to self-DNA when exposing A. thaliana plants to common herring DNA [21]. More studies are needed to characterize the differences in the responses to DNA from different species depending on their pathogenicity level to confirm the exclusive function of pathogen’s DNA as PAMPs.
Finally, Capsicum plants responses have been reported to increment hydrogen peroxide and antioxidant enzymes activity at 3-5 days after elicitation with salicylic acid, hydrogen peroxide and chitosan [22], all of them involved in PAMPs signaling pathway. This characterization of the response that a specific plant species has at a specific stimulus may help researchers to develop stress management strategies for agricultural industry in a way that biostimulation and elicitation maintain only their positive effects and plant stress never reach the distressic zone. Hormetic studies using eDNA using PAMPs as plant biostimulants are necessary in order to define more accurate applications of these molecules in sustainable crop production. Moreover, profitable strategies to scale-up of eDNA production will also be necessary to be developed.
4. Materials and Methods
4.1. Biological Material
Tomato (Solanum lycopersicum L.) seedlings Guanacaste variety from the Seminis seed company with a physiological age of 12 true leaves were used. The 10-day acclimatization process was carried out, placing them in a greenhouse bag with sterile Sunshine 3M substrate under greenhouse conditions. Pathogen used in this study was isolated from Guanajuato state in Central México affecting tomato plants with bacterial canker disease. This pathogen was identified as Clavibacter michiganensis subsp. michiganensis (Cmm) using specific PCR strategy reported by Sousa Santos et al. [23].
4.2. Extraction and Fragmentation of Genomic DNA from Clavibacter michiganensis subsp. Michiganenesis
To obtain the DNA fragments, Clavibacter michiganensis subsp. michiganensis (Cmm) was first grown in NBY medium (yeast extract 2.0 g, nutrient broth 8.0 g, monobasic potassium phosphate 0.5 g, dibasic potassium phosphate 2.0 g, dextrose 2.5 g, magnesium sulfate heptahydrate (1M) 1 mL, agar 15 g in g/L), incubated at 28 °C for 24 hours, then centrifuged at 7000 rpm for 7 minutes to recover the cell sediment, the supernatant was discarded, and DNA extraction was performed based on the CTAB protocol [24]. Once the DNA from Clavibacter michiganensis subsp. michiganensis (Cmm) was obtained, fragmentation was performed using a sonicator (Ultrasonic processor-vibra cell, SONICS® brand, model VCX130) at a frequency of 20 KHz, 10 W, and an amplitude of 50% per second for 20 minutes. The size of the fragments was then determined by electrophoresis in 1.2% agarose gel, 1Kb plus weight marker, 1X gel intercalator, at 80V for 30 minutes. Once fragments between 100-1500 bp were verified, DNA concentrations were adjusted to 50, 100, and 150 µg/mL for storage at -40 °C until use.
4.3. Application of eDNA Fragments from the Pathogen Cmm to Tomato Plants (Plant Elicitation)
After 10 days of acclimatization, the plants were sprayed with eDNA fragments from the pathogen Cmm (eDNAFCmm) at concentrations of 50, 100, and 150 µg.mL-1, respectively, for each treatment. Spraying was carried out at the point of dripping according to Mejía-Teniente et al. [22]. Twenty-four plants were used per treatment, with three replicates. Tomato plants without eDNA application were considered as control plants (C).
4.4. Meaasurement of Morphological Variables of Plants
The height and diameter of the plant stems were measured in centimeters at 0, 5, 15, and 30 days after application of eDNA fragments of the pathogen Cmm (days after elicitation, dae). In the case of height, a tape measure was used, measuring from the base to the apex of the plant, while a vernier caliper was used to measure stem diameter.
The length and width, and the weight of the roots of the plants were determined in the different treatments at 30 dae using a flexometer and a vernier caliper. The dry weight of the root of the different treatments was determined, drying the tissue of the plant using an oven at 60 °C for a time of 48 h until it reached a constant weight and a weighing scale. In all cases, three biological replicates were carried out in the study.
4.5. Determination of Phenols and Total Flavonoids Content
The determination of phenolic compounds for all the evaluated treatments was carried out at 0, 1, 5, 15, and 30 dae, according to Mejía-Teniente et al. [22]. Briefly for the sample preparation, 50 mg of leaf tissue was collected, ground with liquid nitrogen, and homogenized in 2.5 mL of absolute methanol, and protected from light, with constant stirring at 150 rpm, 20 °C for 24 h. After this time, it was centrifuged for 10 min at 5000 rpm, and the supernatant was recovered and stored at −20 °C in the dark. After extraction, the total phenol content was determined by the Folin-Ciocalteu method, adapted for use in microplates. The reaction mixture consisted of 20 μL of the extract, 230 μL of distilled water, and 125 μL of Folin-Ciocalteu 1N reagent; the sample was homogenized and left to stand for 5 min, and 625 μL of 20% NaCO3 was added. The mixture was homogenized and left to stand for 2 h in the dark. After the resting time, 250 μL were taken to place on the microplate, and then the absorbance at 760 nm was determined on the Thermo Scientific Multiskan GO spectrophotometer. The amount of total phenols was expressed in micrograms equivalents of gallic acid per gram of fresh weight. For the determination of total flavonoids, it was performed according to Iqbal et al. [25]. For this method, 125 μL of the extract was mixed with 25 μL of 10% aluminum chloride, 25 μL of 1M potassium acetate, 375 μL of 80% methanol, and 700 μL of distilled water. This mixture was homogenized and allowed to stand 30 min at room temperature. Subsequently, the absorbance at 415 nm was determined on the Thermo Scientific Multiskan GO spectrophotometer. Total flavonoids were expressed in micrograms of quercetin equivalents per gram of fresh weight. Three biological replicates were carried out in the study for these measurements.
4.6. Analysis of Gene Expression-Associated to Stress Response in Plants
For the extraction of total RNA, triplicate upper leaf samples were ground in liquid nitrogen, the TRIzolR Reagent method (Ambion, Life Technologies) was used, following the manufacturer’s methodology. The integrity of the extracted RNA was checked on agarose gel electrophoresis, and its purity and concentration were assessed by a NanoDrop. Complementary DNA (cDNA) synthesis was performed using the Clontech PCR-Select cDNA subtraction package (BD Biosciences). The cDNA was diluted to 400 ng uL−1 and stored in −20 ◦C for qPCR until further analysis.
Gene expression analysis was performed using RT-qPCR of three genes reported as indicators of immunity induction in tomato plants. Two molecular markers of phenylpropanoids and flavonoid biosynthesis phenylalanine ammonium lyase (pal, GenBank accession number AF081215), and chalcone synthase (chs, GenBank accession number FJ705842.1) and a molecular marker of salicylic acid plant defense pathway pR1 pathogenesis-related protein 1a (pr-1a, accession number XM_004242627.4) As a housekeeping gene control, actin (act, Gene Bank accession number AB199316.1) was used.
For the amplification of these genes in the treated tomato plants, primers used were previously reported by Rodríguez-Calzada et al. [26]; 200 ng of cDNA was used to perform qPCR, using Maxima SYBR Green qPCRMaster Mix Thermo Scientific, in the C100 Touch Thermal Cycler device, BIORAD CFX96 Real Time System brand. Amplification conditions for pal, chs and pR1a were 5 min at 94 °C, 40 cycles of 94 °C for 1 min, 55 °C for 1 min, and 65 °C for 5 s; Amplification conditions for act were 5 s at 94 °C and 40 cycles of 5 s at 94 °C and 30 s at 57 °C.
This analysis was performed on treated tomato plants at 0-, 5- and 15-days after elicitation (dae) and only in plants treated with eDNAFcmm100 and control plants. Three biological replicates were analyzed in this study for all treatments. Relative gene expression was determined using the ΔΔCt method [26].
4.7. Determination of Enzymatic Activity
For enzymatic activity determination, an enzymatic extract was obtained from control plants and from the plants treated with eDNAFcmm100 at 15dae. The procedure consisted in using 300 mg of Solanum lycopersicum L. leaves frozen powder directly homogenized with 2 mL of extraction buffer (Potassium phosphate 0.05 Mm, pH 7.8) for superoxide dismutase and 1mL for phenylalanine ammonium-lyase and catalase then vortexed for two minutes. Subsequently the extract was centrifuged at 10,600 rpm for 15 min and supernatant was collected to obtain the enzymatic extracts.
4.7.1. Phenylalanine Ammonium-Lyase (PAL)
PAL activity was estimated following the protocol of [27] with slight modifications. 20 μL of the enzymatic extract was mixed with 230 μL of reaction buffer (Borate 0.1 M, 10 mM phenylalanine; pH 8.8). The mixture was incubated at 40 ◦C for 1 h and stopped with 50 μL of 5 N HCl. The absorbance was measured at the wavelength 290 nm. The activity was quantified as mmol of cinnamic acid formed per gram of protein and expressed as units per milligram of protein (U mg -1) each treatment was repeated three times.
4.7.2. Catalase (CAT)
CAT activity was quantified following the protocol of Afiyanti and Chen [28]. Then, 0.1 mL of the enzymatic extract were mixed with 2 ml of reaction buffer (Potassium phosphate 50 mM, pH 8) and 0.2 mL of 100 mM H2O2 were added to a quartz cell to immediately calculated the rate of H2O2 decreased by spectrophotometer at 240 nm per minute for 6 min according to the Bradford method. One unit of CAT activity is equal to 1 μmol/min equivalent of H2O2 consumed per milliliter per minute each treatment was repeated three times. CAT activity was expressed in units per mg of protein (U mg -1).
4.7.3. Superoxide Dismutase (SOD)
One unit of SOD is referred to the amount of enzyme needed to exhibit 50% dismutation of the superoxide radical. SOD activity was calculated by the 50% inhibition of nitro blue tetrazolium [29]. The enzymatic extract (0.05 mL) was mixed with 1.5 mL of the reaction buffer, EDTA-NA2, and 0.3mL of methionine, 0.3mL of nitroblue tetrazolium, 0.3mL of riboflavin, and 0.25mL of distilled water. The mix were exposed to UV light controlling the same amount of light for each tube during 15min. and absorbance was measured at 560 nm. SOD activity was expressed in units per milligram of protein (U mg -1).
4.8. Statistical Analysis
The biostimulation effect of eDNA fragments from the pathogen Cmm on Solanum lycopersicum tomato plants was evaluated using a completely randomized block design. To determine statistical differences in all variables, two-way analysis of variance (ANOVA) and Tukey’s test p<0.05 were performed on GraphPad Prism 10.2.0 software.
5. Conclusions
Fragmented eDNA from Cmm causes biostimulation effects in several morphological, biochemical and molecular variables evaluated, especially at FCmm50 and FCmm100 µg.mL-1 in tomato plants. This strategy may represent an effective agricultural application with low environmental and health risks to crop producers and final consumers that might contribute to the development of more sustainable agricultural systems.
Author Contributions
Conceptualization: R. G. G. G and G- M. R.; methodology: L. M. S. J.; validation and formal analysis: L. M. S. J. and L. V.; investigation: I. A. C. V. and L. V.; resources: G. M. R. and R. G. G. G.; data curation: L. M. S. J.; writing—original draft preparation; I. A. C. V.; writing—review and editing: R. G. G. G. and G. M. R.; visualization: R. G. G. G. and G. M. R. All authors have read and agreed to the published version of the manuscript.
Funding
This research was partially financed by IDEA-GTO (Instituto de Innovacion, Ciencia y Emprendimiento para la Competitividad para el Estado de Guanajuato), Fondo Mentefacturalo-Conexión Internacional de la Ciencia 2022 (IDEAGTO/CONV/095/2021UPG).
Acknowledgments
I.A.C.V acknowledges to CONACYT-SNII, for an especial research grant support.
Conflicts of Interest
The authors declare no conflicts of interest. The funders had no role in the design of the study; in the collection, analyses, or interpretation of data; in the writing of the manuscript; or in the decision to publish the results.
Abbreviations
The following abbreviations are used in this manuscript:
| PAMP | Pathogen-associated molecular pattern |
| PTI | PAMP-triggered immunity |
| MAPK | Mitogen-activated protein kinase |
| ROI | Reactive oxygen intermediatesLinear dichroism |
| ETI | Effector-triggered immunity |
| DAMP | Damage-associated molecular pattern |
| eDNA | Extracellular DNA |
References
- Lamers, J.; Der Meer; Van, T.; Testerink, C. How plants sense and respond to stressful environments. Plant Physiology 2020, 182, 1624–1635. [Google Scholar] [CrossRef] [PubMed]
- Thieffry, A.; López-Márquez, D.; Bornholdt, J.; Malekroudi, M. G.; Bressendorff, S.; Barghetti, A.; Sandelin, A.; Brodersen, P. PAMP-Triggered genetic reprogramming involves widespread alternative transcription initiation and an immediate transcription factor wave. Plant Cell 2022, 34, 2615–2637. [Google Scholar] [CrossRef]
- Zhang, J.; Zhou, J. M. Plant immunity triggered by microbial molecular signatures. Molecular Plant 2010, 3, 783–793. [Google Scholar] [CrossRef] [PubMed]
- DeFalco, T. A.; Zipfel, C. Molecular mechanisms of early plant pattern-triggered immune signaling. Molecular Cell 2021, 81, 3449–3467. [Google Scholar] [CrossRef] [PubMed]
- Ryu, H.; Choi, S.; Cheng, M.; Koo, B. K.; Kim, E. Y.; Lee, H. S.; Lee, D. H. Flagellin sensing, signaling, and immune responses in plants. Plant Communications 2025, 6. [Google Scholar] [CrossRef] [PubMed]
- Furukawa, T.; Inagaki, H.; Takai, R.; Hirai, H.; Che, F. S. Two distinct EF-Tu epitopes induce immune responses in rice and Arabidopsis. Molecular Plant-Microbe Interactions 2014, 27, 113–124. [Google Scholar] [CrossRef]
- Mazzoleni, S.; Cartenì, F.; Bonanomi, G.; Senatore, M.; Termolino, P.; Giannino, F.; Incerti, G.; Rietkerk, M.; Lanzotti, V.; Chiusano, M. L. Inhibitory effects of extracellular self-DNA: A general biological process? New Phytologist 2015, 206, 127–132. [Google Scholar] [CrossRef]
- Serrano-Jamaica, L. M.; Villordo-Pineda, E.; González-Chavira, M. M.; Guevara-González, R. G.; Medina-Ramos, G. Effect of Fragmented DNA From Plant Pathogens on the Protection Against Wilt and Root Rot of Capsicum annuum L. Plants. Frontiers in Plant Science 2021, 11. [Google Scholar] [CrossRef]
- Jiménez-Hernández, A.; Carbajal-Valenzuela, I. A.; Torres-Pacheco, I.; Rico-García, E.; Ocampo-Velazquez, R. V.; Feregrino-Pérez, A. A.; Guevara-Gonzalez, R. G. Extracellular DNA as a Strategy to Manage Vascular Wilt Caused by Fusarium oxysporum in Tomato (Solanum lycopersicum L.) Based on Its Action as a Damage-Associated Molecular Pattern (DAMP) or Pathogen-Associated Molecular Pattern (PAMP). Plants 2024, 13. [Google Scholar] [CrossRef]
- du Jardin, P. Plant biostimulants: Definition, concept, main categories and regulation. Scientia Horticulturae 2015, 196, 3–14. [Google Scholar] [CrossRef]
- Génard, M.; Fishman, S.; Vercambre, G.; Huguet, J.-G.; Bussi, C.; Besset, J.; Habib, R. A biophysical analysis of stem and root diameter variations in woody plants. Plant Physiol 2001, 126, 188–202. [Google Scholar] [CrossRef] [PubMed]
- Guo, C.; Sun, H.; Bao, X.; Zhu, L.; Zhang, Y.; Zhang, K.; Li, A.; Bai, Z.; Liu, L.; Li, C. Increasing root-lower characteristics improves drought tolerance in cotton cultivars at the seedling stage. Journal of Integrative Agriculture 2024, 23, 2242–2254. [Google Scholar] [CrossRef]
- Wijesinghe, D. K.; John, E. A.; Beurskens, S.; Hutchings, M. J. Root system size and precision in nutrient foraging: responses to spatial pattern of nutrient supply in six herbaceous species. Journal of Ecology 2001, 89, 972–983. [Google Scholar] [CrossRef]
- Nieto Ramírez, M.I.; García Trejo, J.F.; Caltzontzin Rabell, V.; Chávez Jaime, R.; Estrada Sánchez, M.L. Efecto de las condiciones de cultivo en la producción de fenoles, flavonoides totales y su capacidad antioxidante en el árnica (Heterotheca inuloides). Revista mexicana de ciencias agrícolas 2018, 9, 4296–4305. [Google Scholar] [CrossRef]
- Ávalos, A.; Elena, G. Metabolismo secundario de plantas. Reduca Biología 2009, 2, 119–145. [Google Scholar]
- Carbajal-Valenzuela, I. A.; Guzmán-Cruz, R.; González-Chavira, M. M.; Medina-Ramos, G.; Serrano-Jamaica, L. M.; Torres-Pacheco, I.; Vázquez, L.; Feregrino-Pérez, A. A.; Rico-García, E.; Guevara-González, R. G. Response of Plant Immunity Markers to Early and Late Application of Extracellular DNA from Different Sources in Tomato (Solanum lycopersicum). Agriculture 2022, 12. [Google Scholar] [CrossRef]
- Figueroa-Macías, J. P.; García, Y. C.; Núñez, M.; Díaz, K.; Olea, A. F.; Espinoza, L. Plant growth-defense trade-offs: Molecular processes leading to physiological changes. International Journal of Molecular Sciences 2021, 22, 1–18. [Google Scholar] [CrossRef]
- Godínez-Mendoza, P. L.; Rico-Chávez, A. K.; Ferrusquía-Jimenez, N. I.; Carbajal-Valenzuela, I. A.; Villagómez-Aranda, A. L.; Torres-Pacheco, I.; Guevara-González, R. G. Plant hormesis: Revising of the concepts of biostimulation, elicitation and their application in a sustainable agricultural production. Science of The Total Environment 2023, 894, 164883. [Google Scholar] [CrossRef]
- Rico-García, E.; Ortega-Torres, A. E.; Verlinden, S.; Torres-Pacheco, I.; Guevara-González, R. G. Respuesta en la fotosíntesis de jitomate (Solanum lycopersicum) elicitado para distinguir eustrés-distrés: primer acercamiento. CIENCIA Ergo-Sum 2024, 32. [Google Scholar] [CrossRef]
- Agati, G.; Biricolti, S.; Guidi, L.; Ferrini, F.; Fini, A.; Tattini, M. The biosynthesis of flavonoids is enhanced similarly by UV radiation and root zone salinity in L. vulgare leaves. Journal of Plant Physiology 2011, 168, 204–212. [Google Scholar] [CrossRef]
- Chiusano, M. L.; Incerti, G.; Colantuono, C.; Termolino, P.; Palomba, E.; Monticolo, F.; Benvenuto, G.; Foscari, A.; Esposito, A.; Marti, L.; de Lorenzo, G.; Vega-Muñoz, I.; Heil, M.; Carteni, F.; Bonanomi, G.; Mazzoleni, S. Arabidopsis thaliana response to extracellular dna: Self versus nonself exposure. Plants 2021, 10. [Google Scholar] [CrossRef] [PubMed]
- Mejía-Teniente, L.; Duran-Flores, F. de D.; Chapa-Oliver, A. M.; Torres-Pacheco, I.; Cruz-Hernández, A.; González-Chavira, M. M.; Ocampo-Velázquez, R. V.; Guevara-González, R. G. Oxidative and molecular responses in capsicum annuum L. after hydrogen peroxide, salicylic acid and chitosan foliar applications. International Journal of Molecular Sciences 2013, 14, 10178–10196. [Google Scholar] [CrossRef] [PubMed]
- Sousa Santos, M.; Cruz, L.; Norskov, P.; Rasmussen, O. F. A rapid and sensitive detection of Clavibacter michiganensis subsp. michiganensis in tomato seeds by polymerase chain reaction. Seed Sci y Technol. 1997, 25, 581–584. [Google Scholar]
- Porebski, S.; Bailey, L.G.; Baum, B.R. Modification of a CTAB DNA extraction protocol for plants containing high polysaccharide and polyphenol components. Plant Mol Biol Rep 1997, 15, 8–15. [Google Scholar] [CrossRef]
- Iqbal, E.; Abu, S. K.; Lim, L. B. L. Phytochemical screening, total phenolics and antioxidant activities of bark and leaf extracts of Goniothalamus velutinus (Airy Shaw) from Brunei Darussalam. J. King Saud Univer. Sci. 2015, 27, 224–232. [Google Scholar] [CrossRef]
- Rodríguez-Calzada, T.; Qian, M.; Strid, Å; Neugart, S.; Schreiner, M.; Torres-Pacheco, I. Effect of UV-B radiation on morphology, phenolic compound production, gene expression, and subsequent drought stressresponses in chili pepper (Capsicum annuum L.) Plant Physiol. Biochem 2019, 134, 94–102. [Google Scholar] [CrossRef]
- Toscano, S.; Ferrante, A.; Leonardi, C.; Romano, D. PAL activities in asparagus spears during storage after ammonium sulfate treatments. Postharvest Biology and Technology 2018, 140, 34–41. [Google Scholar] [CrossRef]
- Afiyanti, M.; Chen, H.J. Catalase activity is modulated by calcium and calmodulin in detached mature leaves of sweet potato. J Plant Physiol 2014, 171, 35–47. [Google Scholar] [CrossRef]
- Beauchamp, C.; Fridovich, I. Superoxide Dismutase: Improved Assays and an Assay Applicable to Acrylamide Gels. Analytical Biochemistry 1971, 44, 276–287. [Google Scholar] [CrossRef]
Figure 7.
Relative gene expression of pal, chs and pr1a at 0, 5 and 15 dae in tomato plants treated with eDNA fragments of Cmm. (a) Relative expression of the phenylalanine ammonium lyase (pal). (b) Relative expression of the chalcone synthase (chs). (c) Relative expression of the pathogenesis-related protein 1a (pR1). Average ± standard deviation data of three biological replicates is shown. Equal lower-case letters in each bar for each time indicates significant statistical difference according to Tukey test (p = 0.05). eDNAFCmm100, DNA fragments from the pathogen Clavibacter michiganensis subsp. Michiganensis at 100 µg mL-1; C, Control plants.
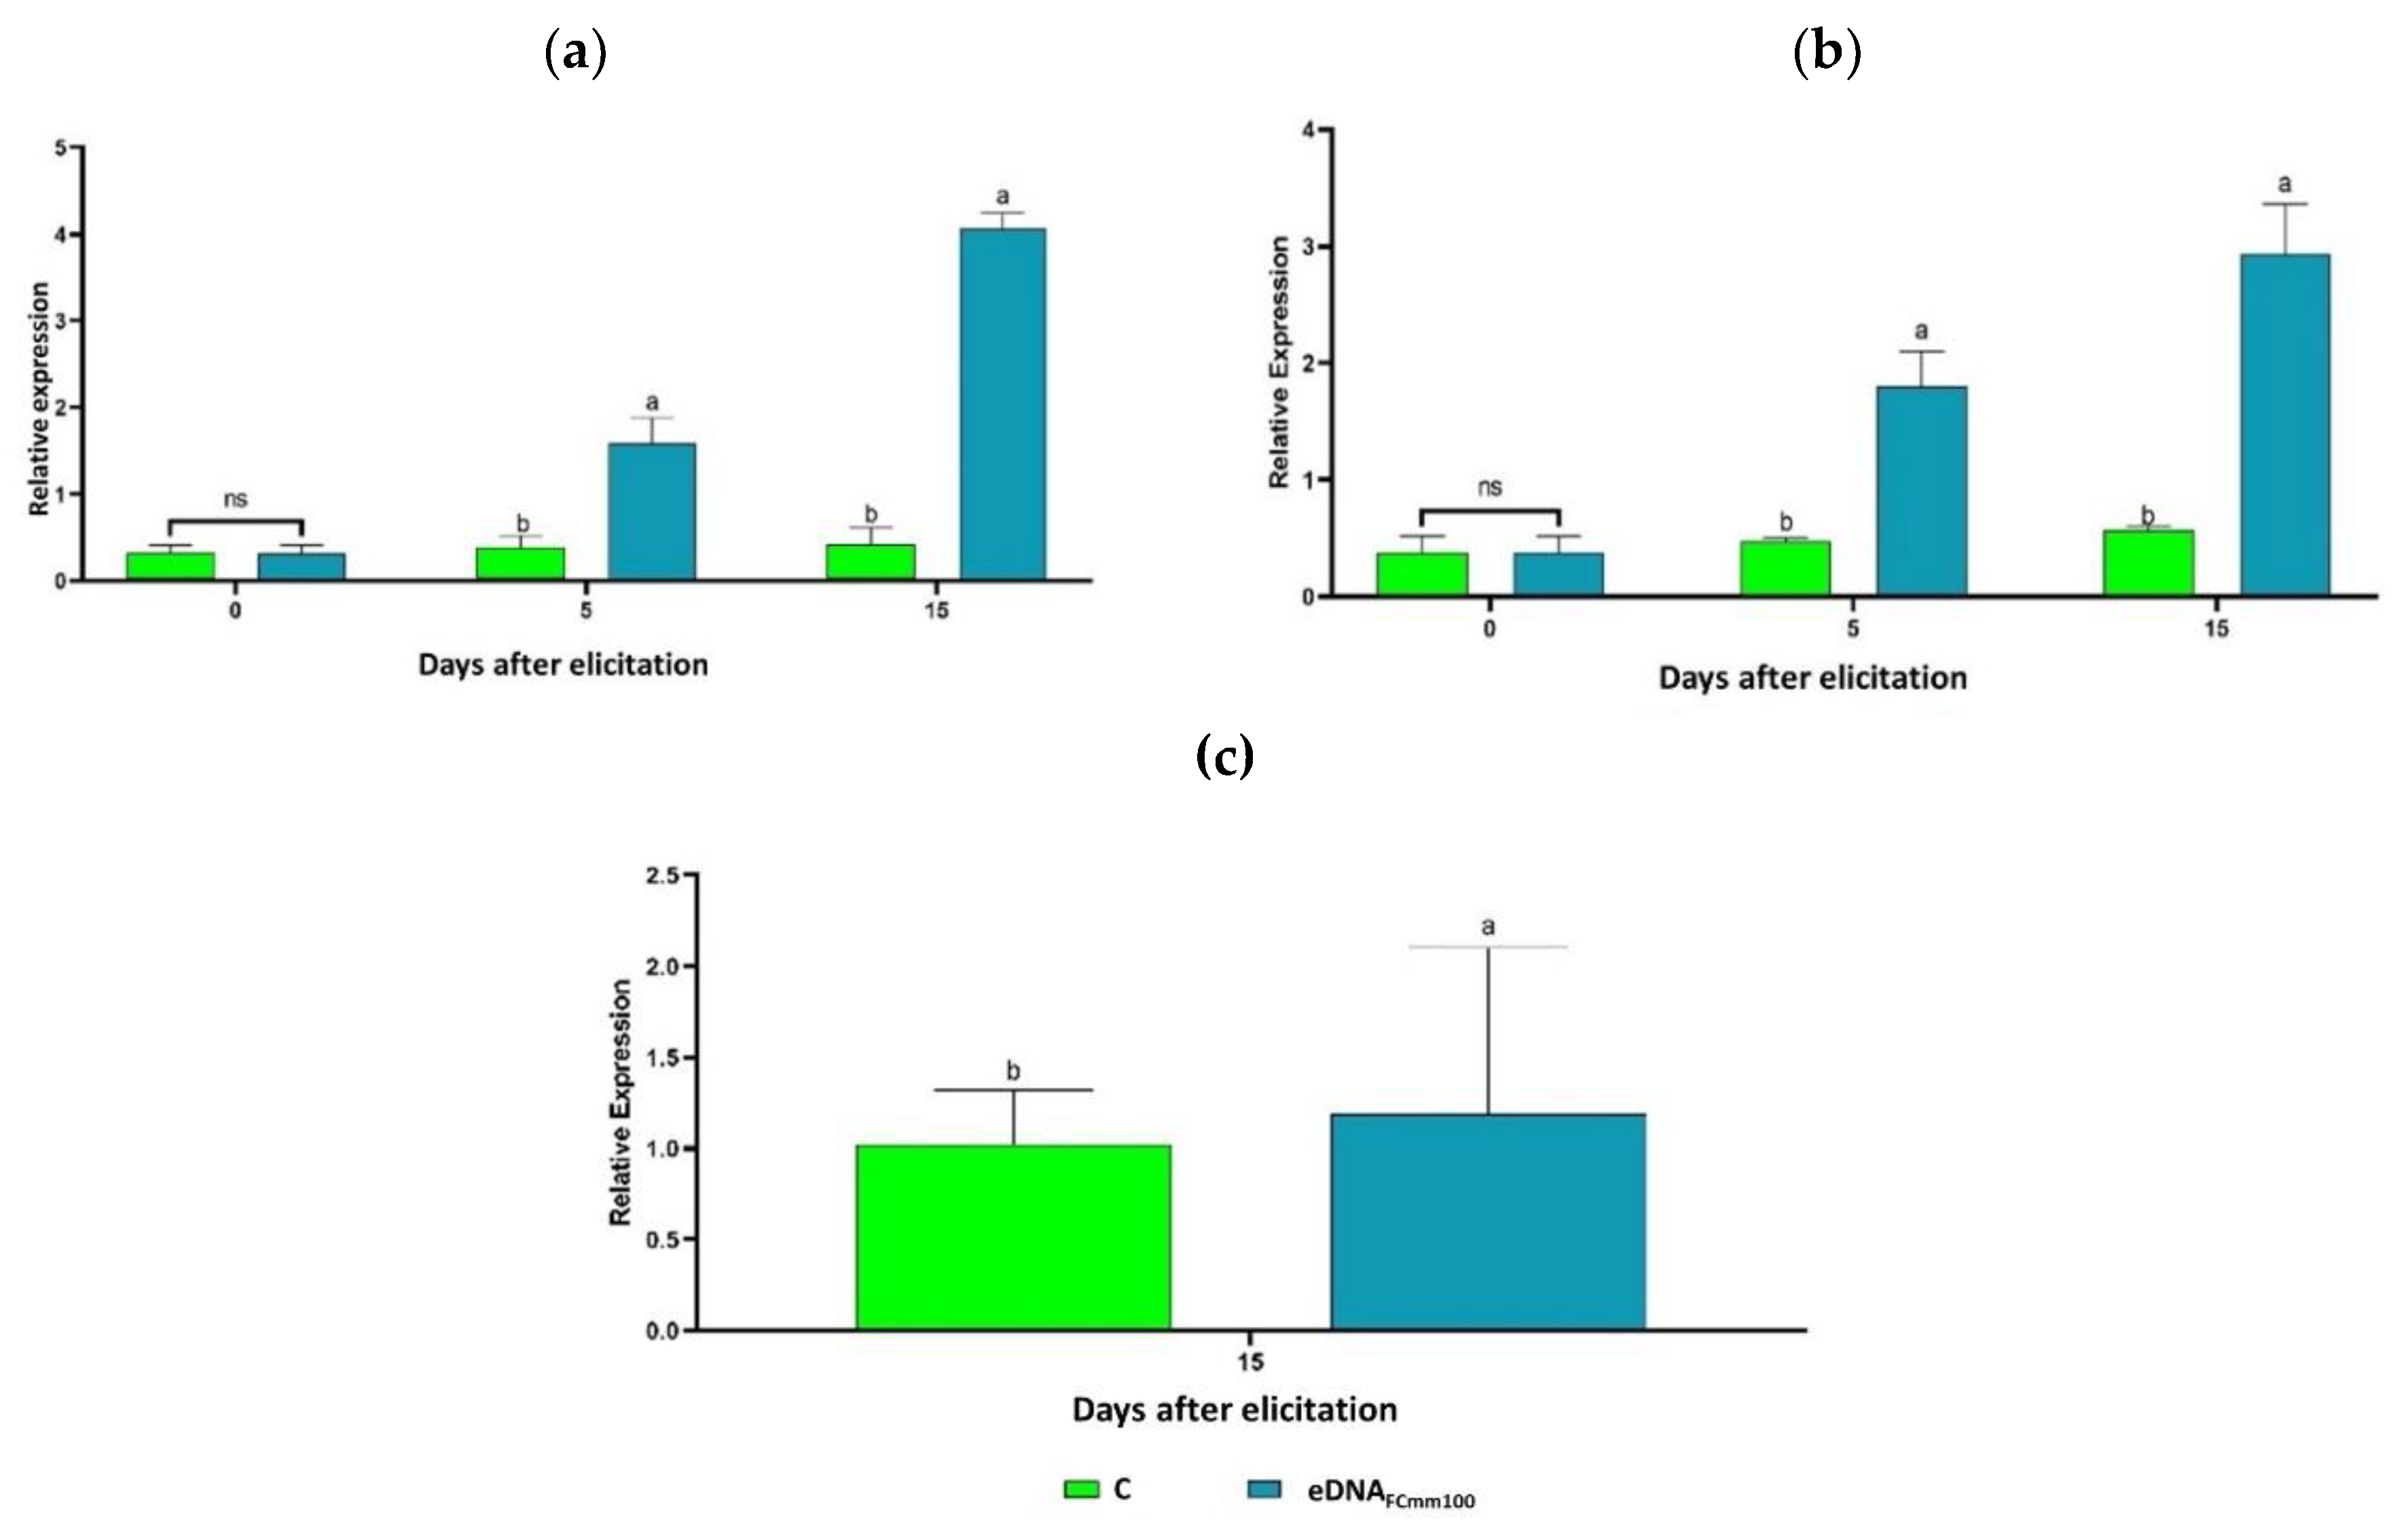
Figure 8.
Enzyme activity of PAL, SOD and CAT at 15 dae in tomato plants eDNA fragments of Cmm. (a) Enzyme activity of the phenylalanine ammonium lyase (PAL). (b) Enzyme activity of superoxide dismutase (SOD). (c) Enzyme activity of the catalase (CAT). Average ± standard deviation data of three biological replicates is shown. Different lower-case letters in each bar for each time indicates significant statistical difference according to Tukey test (p = 0.05). Symbology: FCmm100, DNA fragments from the pathogen Clavibacter michiganensis subsp. michiganensis at 100µg mL-1.; C, Control plants.
Disclaimer/Publisher’s Note: The statements, opinions and data contained in all publications are solely those of the individual author(s) and contributor(s) and not of MDPI and/or the editor(s). MDPI and/or the editor(s) disclaim responsibility for any injury to people or property resulting from any ideas, methods, instructions or products referred to in the content. |
© 2025 by the authors. Licensee MDPI, Basel, Switzerland. This article is an open access article distributed under the terms and conditions of the Creative Commons Attribution (CC BY) license (http://creativecommons.org/licenses/by/4.0/).
Copyright: This open access article is published under a Creative Commons CC BY 4.0 license, which permit the free download, distribution, and reuse, provided that the author and preprint are cited in any reuse.


