
Submitted:
11 December 2025
Posted:
12 December 2025
You are already at the latest version
Abstract
Background: Infertility and hormonal imbalances are becoming more prevalent issues among women globally, particularly in developing countries. Plant-based, protein-rich dietary interventions offer a natural approach to support reproductive health and metabolic balance. Protein-rich legumes from Uttarakhand's Kumaoni and Garhwal region combined with Asparagus racemosus (A. racemosus) (Shatavari) may provide phytoestrogens, antioxidants, and steroidal saponins that contribute to female hormonal and reproductive well-being. Objective: This study aimed to develop and characterize a protein-rich A. racemosus–legume premix as a therapeutic supplement targeting women’s reproductive and overall health. Methods: Four formulations of the premix were prepared using a mixture of legumes, A. racemosus powder, Kulthi Dal, Moth Bean dal, bhat dal, jaggery, and cocoa powder. The formulations were evaluated for proximate composition and mineral analysis, phytochemical levels (phenolics, flavonoids, and tannins), and antioxidant activity. Functional and structural properties were assessed using Fourier-transform infrared spectroscopy, differential scanning calorimetry, X-ray diffraction, and particle size analysis. Microbial safety was confirmed through total plate count and the absence of yeast, mold, and pathogenic bacteria. Results: Among the four formulations, BKMA4 demonstrated the highest antioxidant activity (19.74 ± 0.45), elevated fat (19.04 ± 0.32) and fiber content (6.04 ± 0.24), Phenolic content (mg GAE/g) 1.0929 ± 0.1351,and uniform particle size (~1000 nm), suggesting improved dispersion and potential bioavailability. BKMA3 exhibited the highest protein content (9.02 ± 0.17). The premix successfully combined anthocyanin and isoflavone-rich legumes with saponin-containing A. racemosus, creating a nutrient-dense therapeutic, high-protein supplement for female reproductive and metabolic health. Conclusion: The developed protein-rich A. racemosus–legume premix shows promising dietary supplement as a functional food for women, providing both macronutrient support and bioactive compounds to address reproductive and metabolic health needs.
Keywords:
Asparagus racemosus
; legumes
; premixes
; phytochemicals
; antioxidant activity
1. Introduction
Infertility represents a considerable global public health issue, especially in South Asian emerging nations. Over 10% of couples worldwide are impacted, although the prevalence varies by region [1]. Primary infertility rates among couples in India range from 4% to 17%, and they are continuously rising due to poor dietary habits, altered lifestyles, and increased stress. High-protein plant-based therapeutic supplement pre-mixes are proposed as nutritional interventions to improve metabolic health, reproductive function, and hormonal balance. Protein-rich legumes and herbal supplements, which are currently underutilized, present viable nutrient-based solutions.
High-protein premixes combining protein-rich legumes and Asparagus racemosus (A. racemosus) (Shatavari) offer a phytochemical-rich, non-pharmaceutical approach. These premixes may positively impact female fertility and overall metabolic health [1]. Black soybeans are rich in high-quality essential amino acids, anthocyanins, and isoflavones such as genistein and daidzein. They are known for their bioactive potential. These compounds reduce oxidative stress, improve glycemic response, and regulate estrogenic activity [2]. Such properties make them particularly suitable for managing metabolic and hormonal imbalances in women of reproductive age. Their low glycemic index and therapeutic protein profile allow them to be incorporated into functional diets supporting metabolism and reproduction [3]. Protein-rich legumes provide an excellent base for functional formulations, particularly given consumer trends toward innovative therapeutic high-protein supplements that combine nutritional benefits with sensory appeal [4].
The market for plant-based nutritional supplements is rapidly expanding; however, most commercially available formulations rely on conventional ingredients and seldom incorporate therapeutically potent herbal adaptogens in combination with protein-dense legumes. This underscores a distinct research gap in the development of multifunctional supplements that synergize bioactive and nutritional components. Notably, there is a paucity of studies investigating formulations that integrate A. racemosus (a well-recognized adaptogenic herb) with protein-rich legumes to produce nutrient and phytoactive-dense products. The present study aims to address this gap by developing a novel formulation specifically designed to support women’s reproductive and metabolic health, particularly targeting individuals experiencing hormonal imbalances and metabolic dysfunctions.
A. racemosus is rich in steroidal saponins, primarily shatavarins, which are known to contribute to hormonal regulation and reproductive balance. Traditionally, the herb has been employed to enhance ovarian function, normalize estrogen levels, mitigate stress-induced endocrine disruption, and provide antioxidant defense mechanisms [5]. Emerging evidence also suggests that A. racemosus enhances insulin sensitivity and modulates inflammatory cytokines implicated in metabolic syndrome and female infertility. Furthermore, it supports menstrual regularity, promotes uterine relaxation [6], and exerts significant anti-inflammatory effects, which may play a crucial role in alleviating chronic inflammation associated with reproductive dysfunctions [6].
Recent advances in women's supplementation have explored plant-derived bioactives for hormonal regulation and metabolic control. For example, a combination of Theobroma cacao extract and Punica granatum rind improved antioxidant status and serum testosterone levels in young women [7]. Similarly, olive leaf extract has demonstrated benefits in mitigating inflammation and improving metabolic profiles in middle-aged women [8]. Despite these developments, many existing formulations fail to adequately meet specific nutritional needs or lack sufficient protein density. The present study is among the first to combine A. racemosus with protein-rich legumes high in anthocyanins and isoflavones to develop a therapeutic high-protein supplement. This combination aims to synergistically fulfill both nutritional and bioactive demands to support female reproductive and metabolic health.
This formulation integrates phytochemical insights and evidence-based research to develop a protein-enriched, bioactive-rich premix. Although large-scale clinical validation remains to be undertaken, the formulation represents a promising advancement in functional food innovation aimed at supporting metabolic and reproductive health. By combining modern nutritional technology with traditional medicinal expertise, this work contributes to the development of nutrient-dense, clinically relevant, and scientifically substantiated supplements that accommodate diverse dietary requirements while promoting optimal female reproductive function [9].
2. Materials and Methods
2.1. Experimental Design
A quasi-experimental, formulation-based design was adopted for the nutritional and functional profiles of premixes.
2.2. Materials & Methods
All legumes, including black mountain soyabean (Glycine max), Kulthi dal (Macrotyloma uniflorum), Moth bean (Vigna aconitifolia), from Uttarakhand's Kumaoni and Garhwal region and jaggery powder, were procured from the local rural market of Bidholi, Dehradun, Uttarakhand, India. A. racemosus powder was obtained from Patanjali Ayurveda Ltd., Uttarakhand, India. Natural and unsweetened cocoa powder was purchased from Urban Platter, Mumbai, India. Commercially available plant-based powdered Oziva Herbalance, from Zywie Ventures Pvt. Ltd., Mumbai, India, was used as a reference/positive control for nutritional and compositional benchmarking. All ingredients and chemicals were procured from certified and reliable sources. Most of the chemicals used were of analytical grade from High Media, Mumbai, Maharashtra, India.
2.3. Preparation of Product Formulation
The premixes were prepared using A. racemosus powder, legumes (Bhat dal, Kulthi dal, and Moth dal), jaggery powder, and natural unsweetened cocoa powder. All the materials were mixed in different ratios to prepare the experimental formulations (BKMA1–BKMA4) and the control (Control without A. racemosus) (Table 1). Legumes were carefully selected, sorted, and thoroughly washed to remove any impurities or damaged seeds. The cleaned pulses were soaked in fresh distilled water at ambient temperature for 8 to 12 hours to initiate hydration. The excess amount of water was drained, and the legumes were transferred to clean trays or cloth-lined containers for germination. Germination was carried out for 24 to 48 hours under controlled environmental conditions of 28 °C, with periodic rising to maintain adequate moisture and prevent microbial growth.
Once sprouting was achieved, the germinated legumes were dried using a tray dryer (DELLMARCTM, Thrissur, Kerala, India) at 40 °C until a constant weight was attained, ensuring moisture removal for safe storage. The dried sprouts were ground in a mechanical grinder (Sujata Applications, Delhi, India) to form a fine powder, then sieved to ensure uniform particle size (40 mesh). The resulting legume flour was blended for each formulation (BKMA1 - BKMA4 and control). All blends were labelled appropriately and stored in clean, dry, and airtight containers at 27 °C until further analysis. The ingredient ratios for BKMA1–BKMA4 were determined based on traditional proportions, nutritional enrichment goals, and preliminary organoleptic screening. Higher inclusion levels of A. racemosus (30–45 %) were chosen to maximize adaptogenic and saponin content, while protein-rich legumes were varied inversely (5–20%) to maintain protein balance and amino-acid diversity. Jaggery (5%) and unsweetened cocoa (5%) were kept constant to ensure baseline palatability across all blends (Table 1).
2.4. Estimation of Nutritional Composition
2.4.1. Proximate Analysis
The moisture content was determined by oven-drying the sample at 105 °C to constant weight. Protein content was estimated from nitrogen content multiplied by a conversion factor of 6.25. The fat content was determined by Soxhlet extraction with petroleum ether as the solvent, and the dry weight of the residual extract was used to calculate the percentage fat content. Upon incineration of the sample in a muffle furnace at 550° C, the ash content was obtained after leaving inorganic elements in the residues. Fibre content was determined using standard gravimetric procedures, where the sample was subjected to enzymatic chemical treatment and the remaining residue was weighed to calculate the total dietary fibre percentage. Antioxidant activity was measured using the standard assay procedure, and the absorbance values obtained were used to determine the antioxidant potential of the formulations.
2.4.2. Mineral Analysis
The mineral content (Ca, Cr, Cu, Fe, K, Mg, Mn, Na, and Zn) in the PL samples was measured using ICP-OES, following the procedure described by Kiani et al. [43]. Around 2 g of the PL sample was first converted to ash in a muffle furnace at 550 °C for 4 hours. After cooling, 9 mL of HNO₃ and 1 mL of H₂O₂ (9:1) were added, and the mixture was left at room temperature (25 °C) for 10 minutes to allow proper mixing. The digested sample was then heated on a heating mantle inside a fume hood for 15 minutes. The solution was evaporated to remove extra acid until only a semi-dry residue remained. Finally, the volume was brought up to 20 mL using deionized water in a volumetric flask.
2.5. Phytochemical Screening
2.5.1. Estimation of Total Phenolic Content
Total phenolic content (TPC) in the extract was assessed following a method reported earlier [10], with slight modifications. Briefly, 1 mL of the extract was mixed with 5 mL of 10% Folin–Ciocalteu reagent and 4 mL of 7% sodium carbonate solution. The mixture was kept on a water bath at 30–35 °C for 30 minutes. The absorbance was measured at 760 nm against a reagent blank with a UV–visible spectrophotometer (LAMDA 35, PerkinElmer Inc., Waltham, MA, USA). A standard calibration curve was plotted with gallic acid, and the results were expressed as mg of gallic acid equivalent per gram of sample (mg GAE/g).
2.5.2. Estimation of Total Flavonoid Content
The concentration of flavonoids was determined using the aluminium chloride (AlCl₃) colorimetric method as described by Zin et al [11]. Briefly, 0.5 mL of the sample was mixed with 0.1 mL of 10 % AlCl3, 0.1 mL of 1 M potassium acetate, and 1.5 mL of 95 % methanol. The solution was incubated at 25 °C for 30 minutes, followed by the addition of 2.8 mL of distilled water. Absorbance was measured at 415 nm using a UV-visible spectrophotometer (LAMDA 35, PerkinElmer Inc., Waltham, MA, USA). The reaction mixture was incubated at room temperature for 30 minutes, and absorbance was measured at 415 nm. Quercetin (10–100 µg/mL) was used to generate the standard curve, and results were expressed as mg quercetin equivalent per gram (mg QE/g).
2.5.3. Estimation of Tannin Content
A total of 250 mg of powdered material was extracted in 20 mL of distilled water; no additional heating was applied. Incubation was carried out in the dark at room temperature for 30 minutes to prevent light-induced oxidation and ensure colour stabilisation before absorbance measurement. The solution was filtered using Whatman No. 40 filter paper. The resultant filtrate was incubated with 0.25 mL of Folin–Ciocalteu reagent, 1.25 mL of sodium carbonate solution, and 0.50 mL of distilled water. The absorbance was measured at 725 nm following a 40-minute incubation at room temperature. Tannic acid was utilized to construct the standard curve, and findings were expressed as milligrams of tannic acid equivalent per gram of material (mg TAE/g) [12].
2.5.4. Antioxidant Activity (DPPH Assay)
Antioxidant activity was measured using the DPPH (2,2-diphenyl-1-picrylhydrazyl) free radical scavenging method. A fresh solution of 0.1 mM DPPH solution was prepared in methanol. One millilitre of this solution was mixed with 1 mL of extract at 10–100 µg/mL concentrations. The mixture was incubated in the dark at room temperature for 30 minutes, and absorbance was recorded at 517 nm using a UV–Vis spectrophotometer (LAMDA 35, PerkinElmer Inc., Waltham, MA, USA). The scavenging activity (%) was calculated using below formula:
where A₀ = absorbance of control and A₁ = absorbance of sample.
Scavenging % = [(A₀ – A₁)/A₀] × 100,
2.6. Fourier Transform Infrared Spectroscopy
The functional groups and chemical bonds present in the protein-rich dietary supplement were determined using a Fourier Transform Infrared Spectrophotometer (FTIR) (PerkinElmer, Waltham, Massachusetts, USA). Supplement powder was dried and mixed thoroughly with potassium bromide to produce a transparent pellet. FTIR spectra were recorded between 4000–400 cm-1.
2.7. Differential Scanning Calorimetry
Differential Scanning Calorimetry (DSC) was performed to evaluate the thermal behaviour and stability of the dietary supplement using a DSC instrument (DSC-7020, Hitachi High-Tech Science Corporation, Tokyo, Japan). A small amount of finely powdered sample (5–10 mg) was placed in an aluminium pan and sealed, while an empty sealed pan served as the reference. The samples were heated from 30°C to 300°C at a constant heating rate of 10°C/min under a nitrogen atmosphere. The thermograms obtained were analysed to determine key thermal transitions such as glass transition temperature (Tg), melting point (Tm), and onset of thermal degradation, providing insights into the thermal stability and structural characteristics of the supplement.
2.8. X-Ray Diffraction
X-ray Diffraction (XRD) was carried out to determine the crystalline structure and phase purity of the dietary supplement using an XRD analyzer (Thermo Fisher Scientific,ARL series, Massachusetts, USA). A powdered sample was placed on an XRD sample holder, and the analysis was performed using Cu-Kα radiation (λ = 1.5406 Å). Diffraction patterns were recorded from 10° to 80° at a step size of 0.02°. From the patterns, the crystallinity index and phase composition of the supplement were determined.
2.9. Particle Size Analysis
Particle size distribution of the supplement particles was determined by particle size analysis (Malvern Instruments Zetasizer Nano series nano model: ZEN1690). The powdered supplement dispersion was prepared in distilled water with a dispersing agent (0.1% sodium hexametaphosphate) and analyzed using the laser diffraction particle size analyzer. The particle size parameters, such as d10, d50, and d90, were calculated to characterize the distribution range within the supplement.
2.10. Microbial Analysis
Microbial analysis was done to check the microbial acceptability of the supplement. TPC analysis was carried out by serial dilution followed by plating onto nutrient agar to estimate bacterial content. For fungi and yeast, the sample was plated on Sabouraud Dextrose Agar (SDA). For pathogen detection, specific media were used for Escherichia coli (E. coli), Staphylococcus aureus (S. aureus), and Salmonella spp. The plates were incubated at 37°C for 24-48 h, and colony-forming units (CFUs) per gram were compared with permissible safety standards.
2.11. Statistical Analysis
The statistical analysis of the data was performed using SPSS (version 26). Descriptive statistics calculated the mean and standard deviation for nutrients like protein, fat, and carbohydrates. One-way ANOVA determined significant differences (p < 0.05) between experimental formulations (BKMA1–BKMA4), control, and the standard product (Oziva Her Balance). Tukey's post-hoc test confirmed variations, highlighting BKMA4 for superior protein and nutrient content. All analytical procedures were conducted in triplicate.
3. Results
Among all, BKMA4 was selected for detailed analysis because it showed the highest fibre, ash, and antioxidant activity. BKMA3 contains good levels of proteins, high values for minerals, but shows lower antioxidant activity and weaker ash content. So, in the overall assessment of nutritional attributes and functional performance, BKMA4 proved to be a better formulation. Hence, detailed physico-chemical characterisation using FTIR, DSC, XRD, and particle size distribution, along with microbial analysis, was performed only on BKMA4, together with the standard formulation and the control sample, as these samples were found most relevant for comparative evaluation based on preliminary screening.
3.1. Nutritional Value Analysis
The nutritional profile demonstrates a balanced composition of macronutrients and key micronutrients, supporting the formulation’s potential as a premix supplement. Table 2 presents the nutritional composition and antioxidant reports of experimental formulations (BKMA1–BKMA4). BKMA1 showed moderate antioxidant activity (11.57 ± 0.33) with a protein content of 8.43 ± 0.15 and fat of 18.15 ± 0.31. BKMA2 exhibited slightly higher antioxidant activity (15.01 ± 0.41) and the highest ash content (36.82 ± 1.45), suggesting a mineral-dense composition in line with prior reports on mineral-rich formulations for metabolic regulation [13]. BKMA3 and BKMA4 demonstrated superior nutritional profiles and antioxidant potential. BKMA3 exhibited the highest protein content (9.02 ± 0.17) and substantial antioxidant activity (18.30 ± 0.50). Formulation BKMA4 showed the highest antioxidant activity (19.74 ± 0.45), along with elevated fat (19.04 ± 0.32) and fiber content (6.04 ± 0.24). The fibre-enriched profile of BKMA4 aligns with findings that fiber supplementation improves insulin sensitivity and androgen levels in women with fertility disorders [14]. Although BKMA4 contained relatively higher fat, it remained within physiological limits conducive to hormonal transport and anti-inflammatory modulation [16]. Moisture levels across all formulations (55.85–61.02) were within FAO (Food and Agriculture Organization)-recommended limits, ensuring product stability.
Formulation BKMA3 and BKMA4 outperformed the control in antioxidant potential and overall nutrient balance, highlighting their potential in dietary strategies aimed at managing reproductive problems in women. These findings are consistent with dietary guidelines for oxidative stress and endocrine dysfunction management [15].
BKMA1–BKMA3 showed higher concentrations of key minerals such as Ca, Cu, Fe, Zn, and Sr compared to BKMA4, control and the standard. BKMA3 displayed the highest values for Cu, Sr, and Pb, whereas Control had elevated Mg, Mn, Na, and Zn. The Standard contained lower mineral levels overall. Several minerals were undetected across samples. Overall, BKMA1–BKMA3 demonstrated a comparatively richer mineral profile (Table 3). Even though BKMA4 had relatively low mineral values, this was observed as the best formulation owing to its highest fibre content, ash content, and antioxidant activity, in addition to very strong functional performance in subsequent characterization tests.
3.2. Phytochemical Screening
The phytochemical estimation conducted at 100 µL of the experimental formulation demonstrated distinct variations in phenol, flavonoid, and tannin concentrations (Table 3). As illustrated in Table 4, tannins (1.2233 ± 0.1522 mg TAE/g) and phenols (1.0929 ± 0.1351 mg GAE/g) constituted the major bioactive components, while flavonoids were present in smaller amounts (0.0611 ± 0.0142 mg QE/g). The higher levels of phenol and tannin compounds observed in the formulation align with existing evidence that polyphenols play a central role in antioxidant activity and support metabolic and reproductive functions [16,17].
The relatively low standard error for flavonoids further indicates consistent extraction efficiency across replicates. These phytochemical levels correspond with prior reports highlighting the significance of effective extraction processes and controlled processing conditions in preserving heat-sensitive bioactive [18,19]. Collectively, the phytochemical richness evident at 100 µL reinforces the potential of the formulation as a bioactive supplement for improving women’s reproductive health through antioxidant-mediated mechanisms [20].
3.3. Characterization of Dietary Supplement
3.3.1. Fourier Transform Infrared Spectroscopy
The FTIR spectral analysis of the BKMA4 formulation, the control sample, and the commercial standard (Oziva Herbalance) revealed distinct absorption bands corresponding to major phytochemical functional groups (Figure 1). All three spectra presented a broad absorption region between 3300–3500 cm⁻¹, characteristic of O–H stretching vibrations associated with polyphenols and flavonoids. The notably deeper trough observed in BKMA4 compared to the control and the standard indicates a higher abundance of hydroxyl-containing constituents, consistent with findings reported by Garg et al. in polyphenol-rich botanical extracts [21].
Prominent peaks near 2920 cm⁻¹ and 2850 cm⁻¹ correspond to C–H stretching of alkanes, reflecting the presence of aliphatic and lipid-associated structures. These bands were more intense in BKMA4, aligning with the observations of Peramuna et al., who linked similar peaks to fatty acid components and organic backbones in plant-derived formulations [22]. A clearly defined absorption band in the 1700–1650 cm⁻¹ region, indicative of C=O stretching vibrations, was present across all samples; however, BKMA4 exhibited the most vigorous intensity, suggesting a greater concentration of carbonyl-bearing compounds such as esters, phenolic acids, and flavonoid glycosides. Additional peaks between 1550–1400 cm⁻¹ and 1200–1000 cm⁻¹, representing N–H bending, aromatic C=C stretching, and C–O/C–N stretching, were also more prominent in BKMA4. These suggest the presence of proteinaceous, glycosidic, and amine-containing phytoconstituents, consistent with the spectral features described by Matsuura et al. in bioactive plant matrices [23]. In comparison, the control demonstrated similar functional groups but with lower absorption intensity, indicating comparatively lesser phytochemical density.
The commercial standard exhibited identifiable O–H, C–H, C=O, and C–O absorption regions, though with reduced intensity relative to BKMA4, mirroring patterns previously reported for processed herbal supplements by Chatterjee et al. and Rana et al. Notable C–O and O–H peaks in the standard further agreed with glycoside- and flavonoid-rich spectra described by Deng et al. [24]. Overall, the FTIR data clearly demonstrate that BKMA4 possesses a more enriched and diverse phytochemical profile than both the control and the commercial standard, as reflected by its stronger O–H, C–H, C=O, and C–O absorption bands. These findings support the quantitative phytochemical analysis and highlight BKMA4’s superior bioactive composition.
3.3.2. Differential Scanning Calorimetry
The DSC thermograms of BKMA4, the control, and the commercial standard (Oziva Herbalance) showed clear thermal transitions reflecting their stability and structural composition (Figure 2). All samples exhibited a prominent endothermic transition between 115–120 °C, indicating a similar thermal event probably allied with the decomposition or melting of carbohydrate protein matrix components. BKMA4 displayed a slightly deeper endothermic dip in this region, suggesting a higher proportion of thermally responsive components. A major melting peak occurred at 115–122°C across all samples. BKMA4 presented the sharpest and most intense peak, implying a more uniform and well-organised matrix enriched with thermally active phytoconstituents, consistent with trends reported in polyphenol- and protein-rich formulations [25]. Following the main endothermic transition, the thermograms remain relatively stable with no distinct secondary indicating minimal structural changes beyond 150°C within the measured range. BKMA4 exhibited a slightly deeper primary endothermic peak compared to both the control and the standard, reflecting a greater thermal responsive component and more stable molecular interactions. The control and standard showed similar but less pronounced transitions, with shallower peaks, indicating lower overall thermal robustness. In summary, BKMA4 demonstrates superior thermal stability through its sharper and more defined primary peak, supporting its suitability for formulations requiring enhanced thermal resilience in line with established optimization principles for nutraceutical products [26].
3.3.3. X-Ray Diffraction Analysis
The XRD patterns of the control, standard, and BKMA4 formulations displayed broad, low-intensity diffraction humps between 15° and 30° (2θ), indicating predominantly amorphous structural characteristics (Figure 3). BKMA4 showed a slightly more elevated and defined broad peak in this region compared with the control and standard, suggesting relatively higher structural ordering, consistent with earlier reports associating such diffuse peaks with semi-crystalline tendencies in plant-based matrices [27,28].
The standard formulation exhibited a modest rise in intensity around 20°–25°. At the same time, the control showed the flattest profile with minimal peak definition, reflecting lower crystallinity, in agreement with Li et al. [29], who linked such broad patterns to formulation composition and processing variations. None of the samples demonstrated sharp crystalline reflections; intensities gradually declined beyond 30° and remained stable up to 60°, reflecting limited long-range ordering, as commonly observed in biopolymer–phytochemical mixtures [30].
Overall, the XRD results confirm that while all samples remain largely amorphous, BKMA4 exhibits comparatively improved structural organization, likely attributable to its unique compositional or processing attributes, supporting prior findings that minor enhancements in crystallinity can contribute to enhanced stability in functional supplement matrices [31].
3.3.4. Particle Size Analysis
The particle size distribution profiles of BKMA4, the control, and the standard revealed distinct size populations with varying degrees of uniformity (Figure 4). BKMA4 exhibited a single, narrow peak centred around ~100 nm, indicating a highly uniform particle population. This narrow distribution supports previous observations by Upton et al., who reported that particle sizes below 150 nm promote improved dispersion and reduced aggregation in supplement matrices [32].
In contrast, the standard formulation displayed a single, broader peak at a much larger size ~1000 nm, reflecting less uniformity and increased aggregation tendencies, consistent with findings that larger particle fractions typically signify reduced dispersibility. that broader distributions within this size range typically signify reduced dispersibility [33]. The control sample single peak at a very small size ~10 nm, suggesting the presence of fine fragments or low molecular weight fractions rather than a stable nanosuspension. Overall, the particle size analysis confirms that BKMA4 demonstrates the most uniform and optimized particle size profile, while the control and standard show less stable size distributions, supporting previous evidence that controlled nanosizing improves structural stability and functional performance in dietary supplement systems [34].
3.4. Microbial Analysis
The total plate count shows the highest microbial load at 9.7 × 10⁷ CFU/g (Figure 5), indicating a substantial presence of bacterial load, which is comparable to findings by Cabello et al., who reported similar microbial loads in plant-based formulations under ambient storage conditions [35]. Yeast and fungus are present at a moderate level of about 3.2 × 10² CFU/g, aligning with observations by Mohapatra et al., where fungal contamination remained below critical thresholds due to effective drying and storage protocols [38]. Pathogenic bacteria, including E. coli and Salmonella spp., are detected at 6.4 × 101 CFU/g and 2.7 × 101 CFU/g, respectively, which are consistent with values reported in functional food assessments by Palanivelu et al. [36].
S. aureus exhibited a higher abundance, measured at 3.1 × 10¹ CFU/g, consistent with the microbial profiles reported by Kepa et al., who linked the reduced prevalence of S. aureus to the antimicrobial properties of phenolic constituents [37]. According to the Food Safety and Standards Authority of India (FSSAI) and Codex Alimentarius (FAO/WHO), the recommended microbial safety limits for functional food products are as follows: TPC ≤ 10⁸ CFU/g, yeast and mold ≤ 10³ CFU/g, and absence or counts <10² CFU/g for pathogenic organisms, including E. coli, Salmonella spp., and S. aureus [41,42]. Microbial loads observed in the present study, including TPC (~9.7 × 10⁷ CFU/g), yeast and mould (~102 CFU/g), and S. aureus (~3.1 × 101 CFU/g), remained well within these regulatory thresholds. These findings indicate the microbial safety and acceptable hygienic quality of the BKMA4 formulation under standard storage conditions. Such microbial stability is consistent with standards observed in similar herbal and supplement formulations. Statistical annotations (a, b, c) suggest significant differences between the microbial counts of the various parameters, with total plate count (a) being significantly higher than the rest, and differing significance levels noted between the other groups.
4. Conclusions
The plant-based nutritional supplement formulated with legumes and A. racemosus demonstrates a strong nutrient profile with good levels of protein, essential minerals, and bioactive compounds. Its nutritional composition, mineral profiling, functional group identification, thermal behaviour, structural patterns, particle size analysis, microbial quality, and the estimation of tannins, phenolics, flavonoids, and antioxidant activity suggest potential benefits for women’s reproductive health, particularly in supporting hormonal regulation, metabolic function, and overall wellness. These findings suggest that the product has potential as a supportive nutritional supplement aimed at improving metabolic health and overall well-being. Future studies should assess bioavailability, sensory acceptability, improve stability, and explore its application within different food systems. Overall, this formulation provides a promising foundation for the development of functional foods designed to enhance nutritional intake and promote women’s reproductive and metabolic health.
Author Contributions
Soumya: Manuscript drafting writing, and methodology; Shuchi: Conceptualization and study design; Rajendra Awasthi: Technical guidance and manuscript editing; Deepika Kohli: Formal data analysis and support for article processing charges (APC); B. S. Rawat: Formal data analysis; B.S.Rawat: project administration; Rajeev Tiwari: investigation and APC facilitation. All authors have read and agreed to the published version of the manuscript.”
Funding
This study was supported by R&D UPES for financial and Lab support during the research work, The author Shuchi would like to acknowledge the SHODH grant of UPES for laboratory support
Institutional Review Board Statement
Not applicable.
Informed Consent Statement
Not applicable.
Data Availability Statement
The original contributions presented in this study are included in the article. Further inquiries can be directed to the corresponding author.
Acknowledgments
authors would like to acknowledge UPES R&D for financial and laboratory supports.
Conflicts of Interest
The authors declare that they have no known competing financial interests or personal relationships that could have appeared to influence the work reported in this paper.
Ethical Approval
Not applicable.
References
- Agiwal, V.; Madhuri, R.S.; Chaudhuri, S. Infertility burden across indian states: insights from a nationally representative survey conducted during 2019–21. Journal of Reproduction & Infertility 2023, 24, 287. [Google Scholar]
- Kundu, S.; Ali, B.; Dhillon, P. Surging trends of infertility and its behavioural determinants in India. PLoS One 2023, 18, e0289096. [Google Scholar] [CrossRef]
- Jeong, E.W.; Dhungana, S.K.; Yang, Y.S.; Baek, Y.; Seo, J.H.; Kang, B.K.; Jung, C.S.; Han, S.I.; Lee, H.G. Black and yellow soybean consumption prevents high-fat diet-induced obesity by regulating lipid metabolism in C57BL/6 mice. Evidence-Based Complementary and Alternative Medicine 2023, 2023, 6139667. [Google Scholar] [CrossRef]
- Zhou, Q.; Chen, Y.; Peng, L.; Wu, J.; Hao, W.; Wang, M. Sprouting facilitates the antiglycative effect of black soybean (Glycine max (L.) Merr.) by promoting the accumulation of isoflavones. Current Research in Food Science 2024, 9, 100827. [Google Scholar] [CrossRef]
- Tung, Y.T.; Tung, C.L.; Hsieh, C.C.; Huang, Y.C.; Li, S.; Tung, C.L.; Wu, J.H. Anti-inflammatory effects of anthocyanin-enriched black soybean seed coat (BSSC) crude extract on LPS-induced acute liver injury in mice. Antioxidants 2024, 13, 311. [Google Scholar] [CrossRef]
- Viscardi, G.; Back, S.; Ahmed, A.; Yang, S.; Mejia, S.B.; Zurbau, A.; Khan, T.A.; Selk, A.; Messina, M.; Kendall, C.W.; Jenkins, D.J. Effect of soy isoflavones on measures of estrogenicity: A systematic review and meta-analysis of randomized controlled trials. Advances in Nutrition 2025, 16, 100327. [Google Scholar] [CrossRef]
- Gudise, V.S.; Dasari, M.P.; Kuricheti, S.S. Efficacy and safety of shatavari root extract for the management of menopausal symptoms: A double-blind, multicenter, randomized controlled trial. Cureus 2024, 16. [Google Scholar] [CrossRef]
- Yadav, P.; Yadav, S.; Vedururu, S.S.; Kumari, G. A Standardized Asparagus Racemosus Root Extract Improves Hormonal Balance and Menstrual Health and Reduces Vasomotor Symptoms in Perimenopausal Women: A Randomized, Double-Blind, Placebo-Controlled Study. Journal of the American Nutrition Association 2025, 1–1. [Google Scholar] [CrossRef] [PubMed]
- Siddiqui, A.J.; Elkahoui, S.; Alshammari, A.M.; Patel, M.; Ghoniem, A.E.; Abdalla, R.A.; Dwivedi-Agnihotri, H.; Badraoui, R.; Adnan, M. Mechanistic Insights into the Anticancer Potential of Asparagus racemosus Willd. Against Triple-Negative Breast Cancer: A Network Pharmacology and Experimental Validation Study. Pharmaceuticals 2025, 18, 433. [Google Scholar] [CrossRef] [PubMed]
- Akagi, R.; Maruo, T.; Takara, T.; Maruyama, K. Effects of Consumption of Black Soybean Seed Coat Extract on Sleep Quality in Healthy Japanese: A Randomized, Placebo-Controlled, Double-Blind, Parallel-Group Comparison Study. Food Science & Nutrition 2025, 13, e70156. [Google Scholar]
- Aryal, S.; Baniya, M.K.; Danekhu, K.; Kunwar, P.; Gurung, R.; Koirala, N. Total Phenolic Content, Flavonoid Content and Antioxidant Potential of Wild Vegetables from Western Nepal. Plants 2019, 8, 96. [Google Scholar] [CrossRef]
- Zin, N.B.; Azemin, A.; Rodi, M.M.; Mohd, K.S. Chemical Composition and Antioxidant Activity of Stingless Bee Propolis from Different Extraction Methods. Int. J. Eng. Technol. 2018, 7, 90–95. [Google Scholar] [CrossRef]
- Kumar, S.R.; Sadiq, M.B.; Anal, A.K. Comparative Study of Physicochemical and Functional Properties of Soaked, Germinated and Pressure Cooked Faba Bean. J. Food Sci. Technol. 2022, 1–1. [Google Scholar] [CrossRef] [PubMed]
- Huang, X.; Yan, C.; Lin, M.; He, C.; Xu, Y.; Huang, Y.; Zhou, Z. The Effects of Conjugation of Walnut Protein Isolate with Polyphenols on Protein Solubility, Antioxidant Activity, and Emulsifying Properties. Food Res. Int. 2022, 161, 111910. [Google Scholar] [CrossRef] [PubMed]
- Unluhizarci, K.; Karaca, Z.; Kelestimur, F. Role of Insulin and Insulin Resistance in Androgen Excess Disorders. World J. Diabetes 2021, 12, 616. [Google Scholar] [CrossRef]
- Pararasa, C.; Ikwuobe, J.; Shigdar, S.; Boukouvalas, A.; Nabney, I.T.; Brown, J.E.; Devitt, A.; Bailey, C.J.; Bennett, S.J.; Griffiths, H.R. Age-Associated Changes in Long-Chain Fatty Acid Profile during Healthy Aging Promote Pro-Inflammatory Monocyte Polarization via PPAR γ. Aging Cell 2016, 15, 128–139. [Google Scholar] [CrossRef]
- Diamanti-Kandarakis, E.; Papalou, O.; Kandaraki, E.A.; Kassi, G. Mechanisms in Endocrinology: Nutrition as a Mediator of Oxidative Stress in Metabolic and Reproductive Disorders in Women. Eur. J. Endocrinol. 2017, 176, R79–R99. [Google Scholar] [CrossRef]
- Haldar, S.; Lee, S.H.; Tan, J.J.; Chia, S.C.; Henry, C.J.; Chan, E.C. Dose-Dependent Increase in Unconjugated Cinnamic Acid Concentration in Plasma Following Acute Consumption of Polyphenol Rich Curry in the Polyspice Study. Nutrients 2018, 10, 934. [Google Scholar] [CrossRef]
- Liu, K.; Luo, M.; Wei, S. The Bioprotective Effects of Polyphenols on Metabolic Syndrome against Oxidative Stress: Evidences and Perspectives. Oxid. Med. Cell. Longev. 2019, 2019, 6713194. [Google Scholar] [CrossRef]
- Yfanti, P.; Lazaridou, P.; Boti, V.; Douma, D.; Lekka, M.E. Enrichment of Olive Oils with Natural Bioactive Compounds from Aromatic and Medicinal Herbs: Phytochemical Analysis and Antioxidant Potential. Molecules 2024, 29, 1141. [Google Scholar] [CrossRef]
- Maisetta, G.; Batoni, G.; Caboni, P.; Esin, S.; Rinaldi, A.C.; Zucca, P. Tannin Profile, Antioxidant Properties, and Antimicrobial Activity of Extracts from Two Mediterranean Species of Parasitic Plant Cytinus. BMC Complement. Altern. Med. 2019, 19, 1–1. [Google Scholar] [CrossRef]
- Aiello, A.; Calabrone, L.; Noonan, D.M.; Corradino, P.; Nofri, S.; Cristoni, S.; Accardi, G.; Candore, G.; Caruso, C.; Zinellu, A.; Albini, A. Effect of a Phytochemical-Rich Olive-Derived Extract on Anthropometric, Hematological, and Metabolic Parameters. Nutrients 2024, 16, 3068. [Google Scholar] [CrossRef]
- Garg, S.K.; Shukla, A.; Choudhury, S. Polyphenols and Flavonoids. In Nutraceuticals in Veterinary Medicine; [Editor(s) unknown], Eds.; [Publisher unknown]: [Location unknown], 2019; pp 187–204.
- Peramuna, A.; Morton, R.; Summers, M.L. Enhancing Alkane Production in Cyanobacterial Lipid Droplets: A ModeFl Platform for Industrially Relevant Compound Production. Life 2015, 5, 1111–1126. [Google Scholar] [CrossRef]
- Matsuura, H.N.; Fett-Neto, A.G. Plant Alkaloids: Main Features, Toxicity, and Mechanisms of Action. In Plant Toxins; [Editor(s) unknown], Eds.; [Publisher unknown]: [Location unknown], 2015; 2, 1–5.
- Deng, Y.; Qiu, M.; Wang, Y.; Wang, R.; Lu, P.; Sun, L.; Li, X.; Gooneratne, R. Protective Effect of Antioxidant-Enriched Diets on T-2-Toxin-Induced Damage in Tilapia (Oreochromis niloticus). Aquaculture 2019, 506, 341–349. [Google Scholar] [CrossRef]
- Yang, L.; Yang, N.; Li, B. Extreme Low Thermal Conductivity in Nanoscale 3D Si Phononic Crystal with Spherical Pores. Nano Lett. 2014, 14, 1734–1738. [Google Scholar] [CrossRef]
- Upton, R.L.; Davies-Manifold, Z.; Marcello, M.; Arnold, K.; Crick, C.R. A General Formulation Approach for the Fabrication of Water Repellent Materials: How Composition Can Impact Resilience and Functionality. Mol. Syst. Des. Eng. 2020, 5, 477–483. [Google Scholar] [CrossRef]
- Huang, S.; Liu, X.; Lin, S.; Glynn, C.; Felix, K.; Sahasrabudhe, A.; Maley, C.; Xu, J.; Chen, W.; Hong, E.; Crosby, A.J. Control of polymers’ amorphous-crystalline transition enables miniaturization and multifunctional integration for hydrogel bioelectronics. Nature Communications. 2024, 15, 3525. [Google Scholar] [CrossRef]
- Yang, N.; Li, Y.; Feng, L.; Liu, Q.; Luo, Q.; Liu, J. Enhancing mechanical and rheological properties of HDPE films through annealing for eco-friendly agricultural applications. Green Processing and Synthesis 2024, 13, 20240005. [Google Scholar] [CrossRef]
- Salem, K.S.; Kasera, N.K.; Rahman, M.A.; Jameel, H.; Habibi, Y.; Eichhorn, S.J.; French, A.D.; Pal, L.; Lucia, L.A. Comparison and assessment of methods for cellulose crystallinity determination. Chemical Society Reviews 2023, 52, 6417–6446. [Google Scholar] [CrossRef]
- Danaei, M.R.; Dehghankhold, M.; Ataei, S.; Hasanzadeh Davarani, F.; Javanmard, R.; Dokhani, A.; Khorasani, S.; Mozafari, M.R. Impact of Particle Size and Polydispersity Index on the Clinical Applications of Lipidic Nanocarrier Systems. Pharmaceutics 2018, 10, 57. [Google Scholar] [CrossRef] [PubMed]
- Han, F.; Zhang, M.; Liu, Z.; Shang, H.; Li, Q.; Zhou, W. Dynamic Characteristics of Microbial Community and Soluble Microbial Products in Partial Nitrification Biofilm System Developed from Marine Sediments Treating High Salinity Wastewater. J. Environ. Manage 2021, 290, 112586. [Google Scholar] [CrossRef]
- Gandhi, J.; Golwala, P.; Madheshiya, S.; Shah, P. Nano-Sizing Crystals: An Exquisite Way of Drug Conveyance. Nanoscience Nanotechnology-Asia 2020, 10, 203–218. [Google Scholar] [CrossRef]
- Cabello-Olmo, M.; Oneca, M.; Torre, P.; Díaz, J.V.; Encio, I.J.; Barajas, M.; Araña, M. Influence of Storage Temperature and Packaging on Bacteria and Yeast Viability in a Plant-Based Fermented Food. Foods 2020, 9, 302. [Google Scholar] [CrossRef]
- Mohapatra, D.; Kumar, S.; Kotwaliwale, N.; Singh, K.K. Critical Factors Responsible for Fungi Growth in Stored Food Grains and Non-Chemical Approaches for Their Control. Ind. Crops Prod. 2017, 108, 162–182. [Google Scholar] [CrossRef]
- Palanivelu, J.; Thanigaivel, S.; Vickram, S.; Dey, N.; Mihaylova, D.; Desseva, I. Probiotics in Functional Foods: Survival Assessment and Approaches for Improved Viability. Appl. Sci. 2022, 12, 455. [Google Scholar] [CrossRef]
- Kępa, M.; Miklasińska-Majdanik, M.; Wojtyczka, R.D.; Idzik, D.; Korzeniowski, K.; Smoleń-Dzirba, J.; Wąsik, T.J. Antimicrobial Potential of Caffeic Acid against Staphylococcus aureus Clinical Strains. Biomed Res. Int. 2018, 2018, 7413504. [Google Scholar] [CrossRef] [PubMed]
- Hamid, F.; Hamid, F.H. Manual of methods of analysis of foods. Food safety and standards authority of India. 2015.
- World Health Organization. Risk characterization of microbiological hazards in food: guidelines. 2009. Available from: https://www.who.int/publications/i/item/9789241547895. Accessed on 03/10/2025.
- International Commission on Microbiological Specifications for Foods (ICMSF). (2018). Establishment of microbiological criteria. In Microorganisms in Foods 7: Microbiological Testing in Food Safety Management (pp. 117–129). Cham: Springer International Publishing.
- Kiani, A.; Arabameri, M.; Moazzen, M.; Shariatifar, N.; Aeenehvand, S.; Khaniki, G.J.; Abdel-Wahhab, M.; Shahsavari, S. Probabilistic health risk assessment of trace elements in baby food and milk powder using ICP-OES method. Biol. Trace Elem. Res. 2021, 200, 2486–2497. [Google Scholar] [CrossRef] [PubMed]
Figure 1.
FTIR spectra of BKMA4, the control, and the commercial standard showing key absorption bands across 500–4000 cm⁻¹ (Oziva Herbalance).
Figure 1.
FTIR spectra of BKMA4, the control, and the commercial standard showing key absorption bands across 500–4000 cm⁻¹ (Oziva Herbalance).
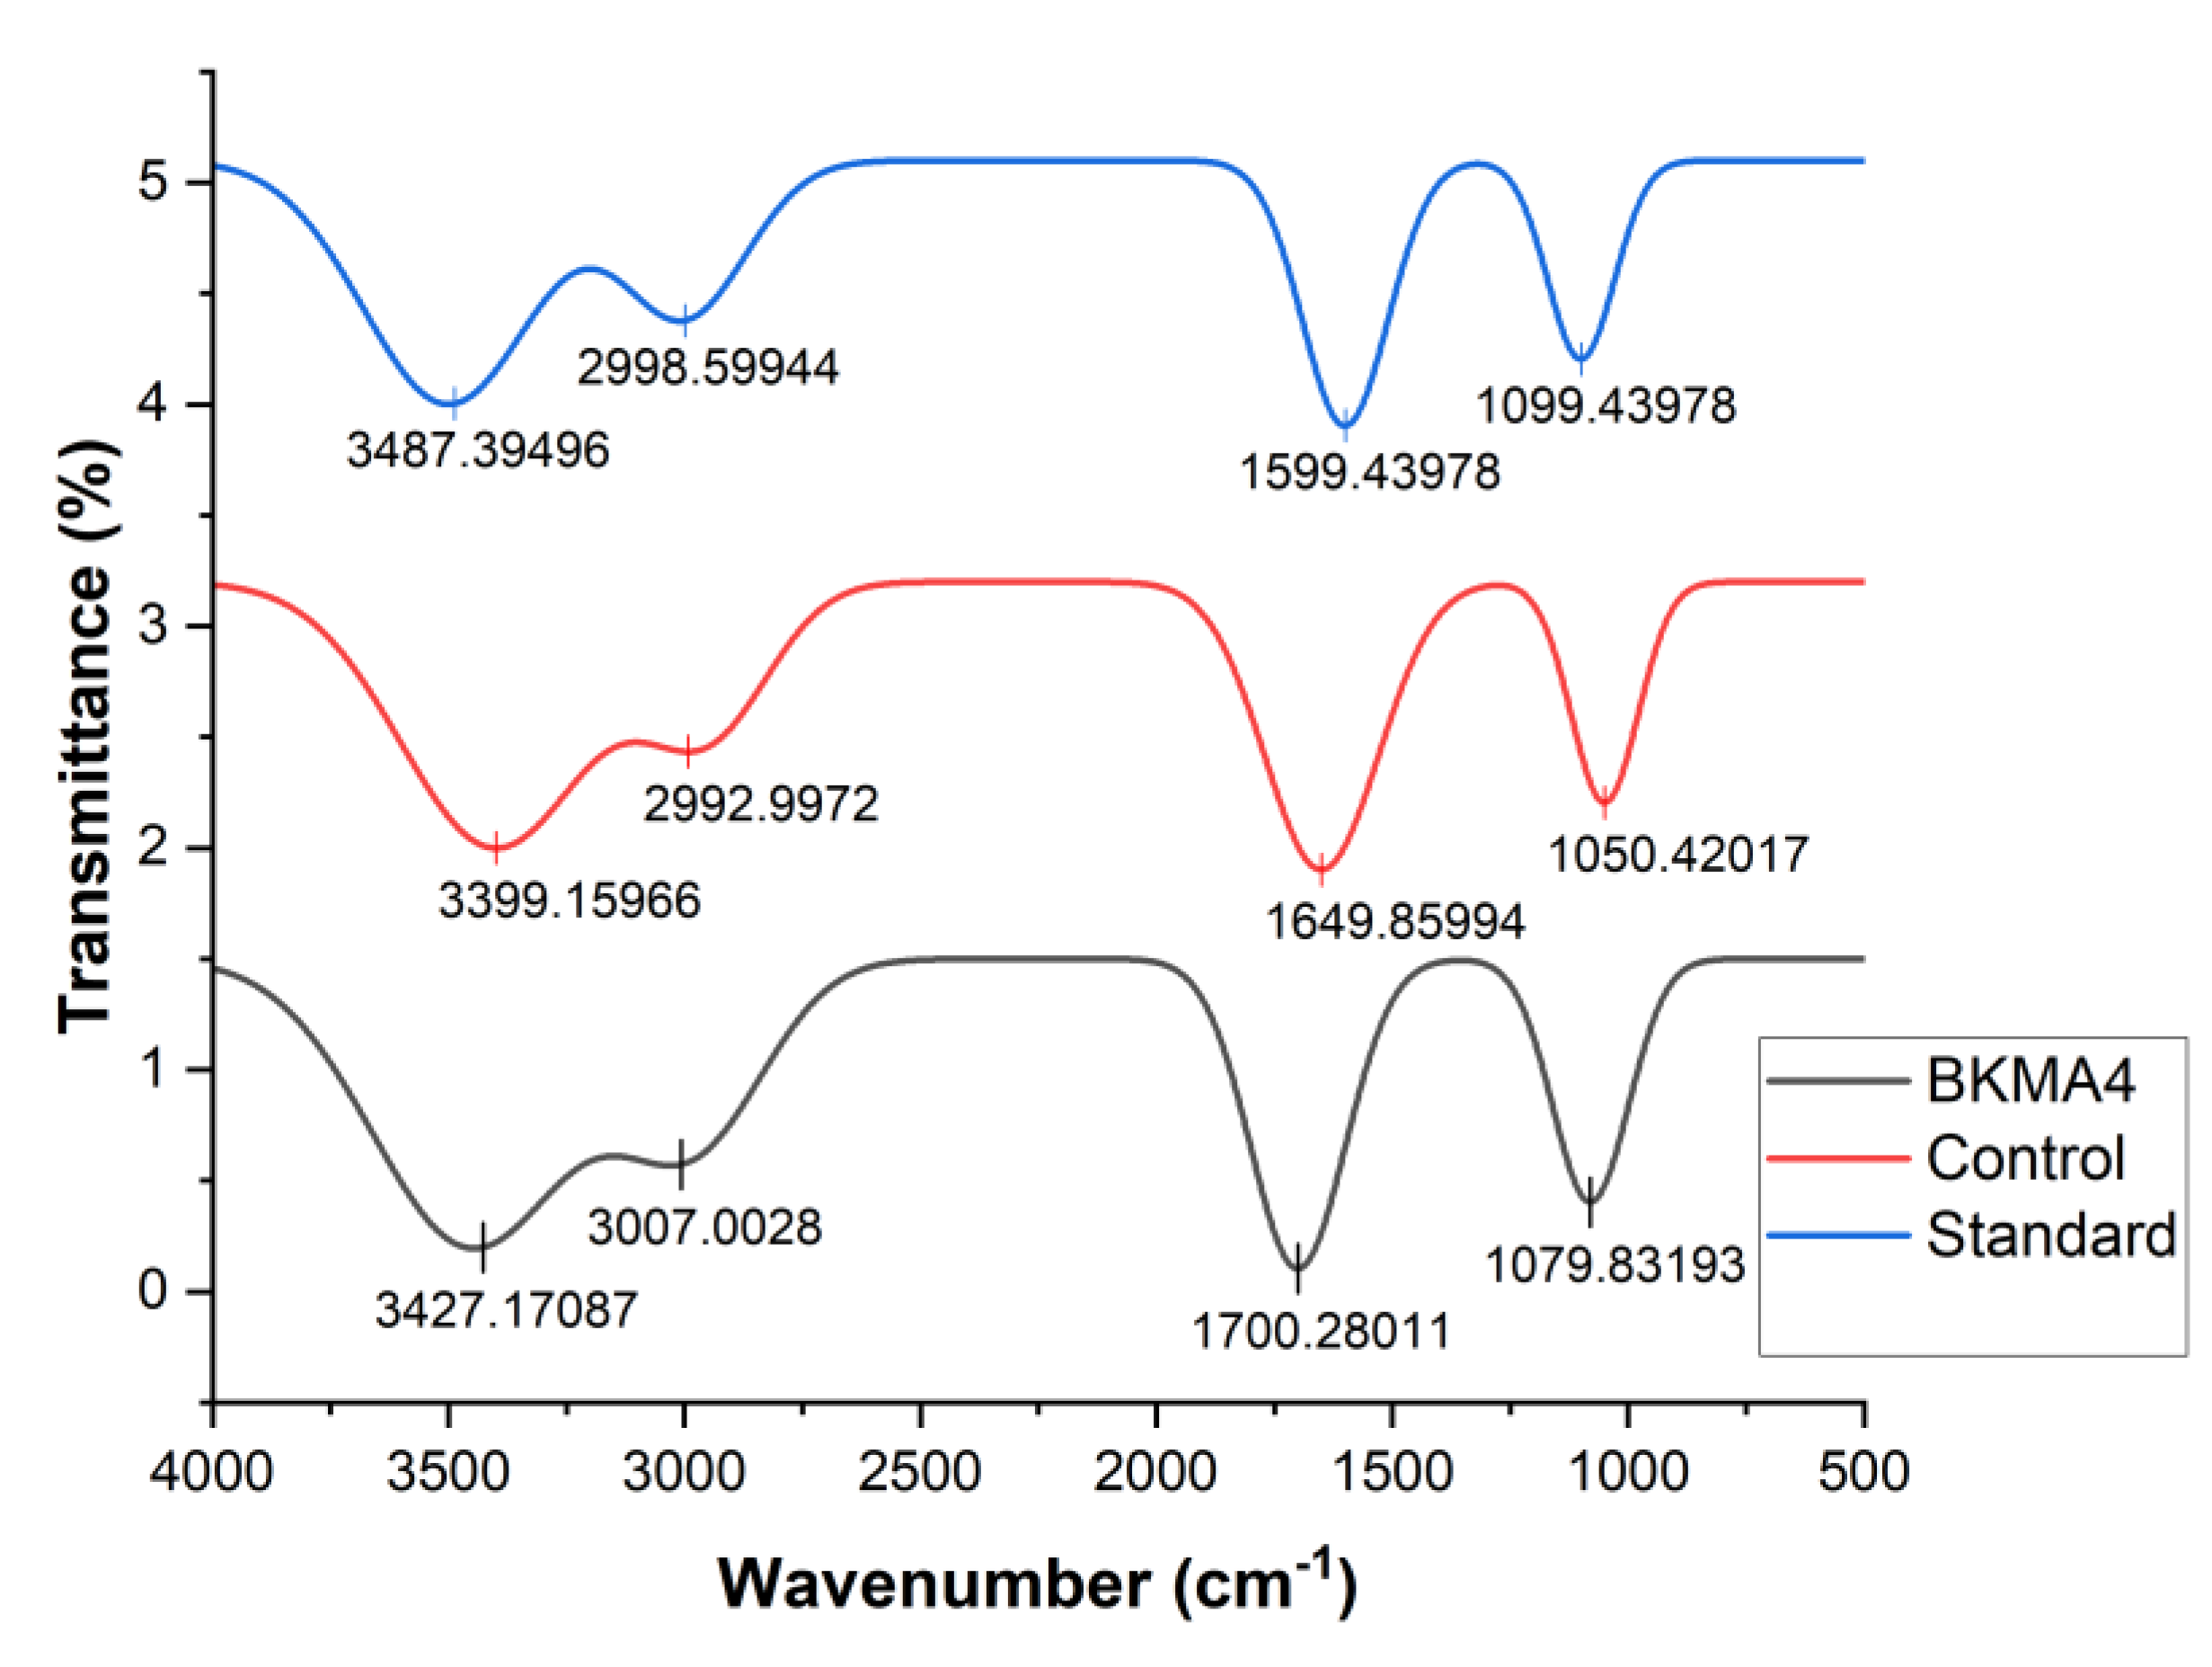
Figure 2.
DSC thermograms of BKMA4, the control, and the commercial standard showing melting onset, peak transition, and offset temperature.
Figure 2.
DSC thermograms of BKMA4, the control, and the commercial standard showing melting onset, peak transition, and offset temperature.
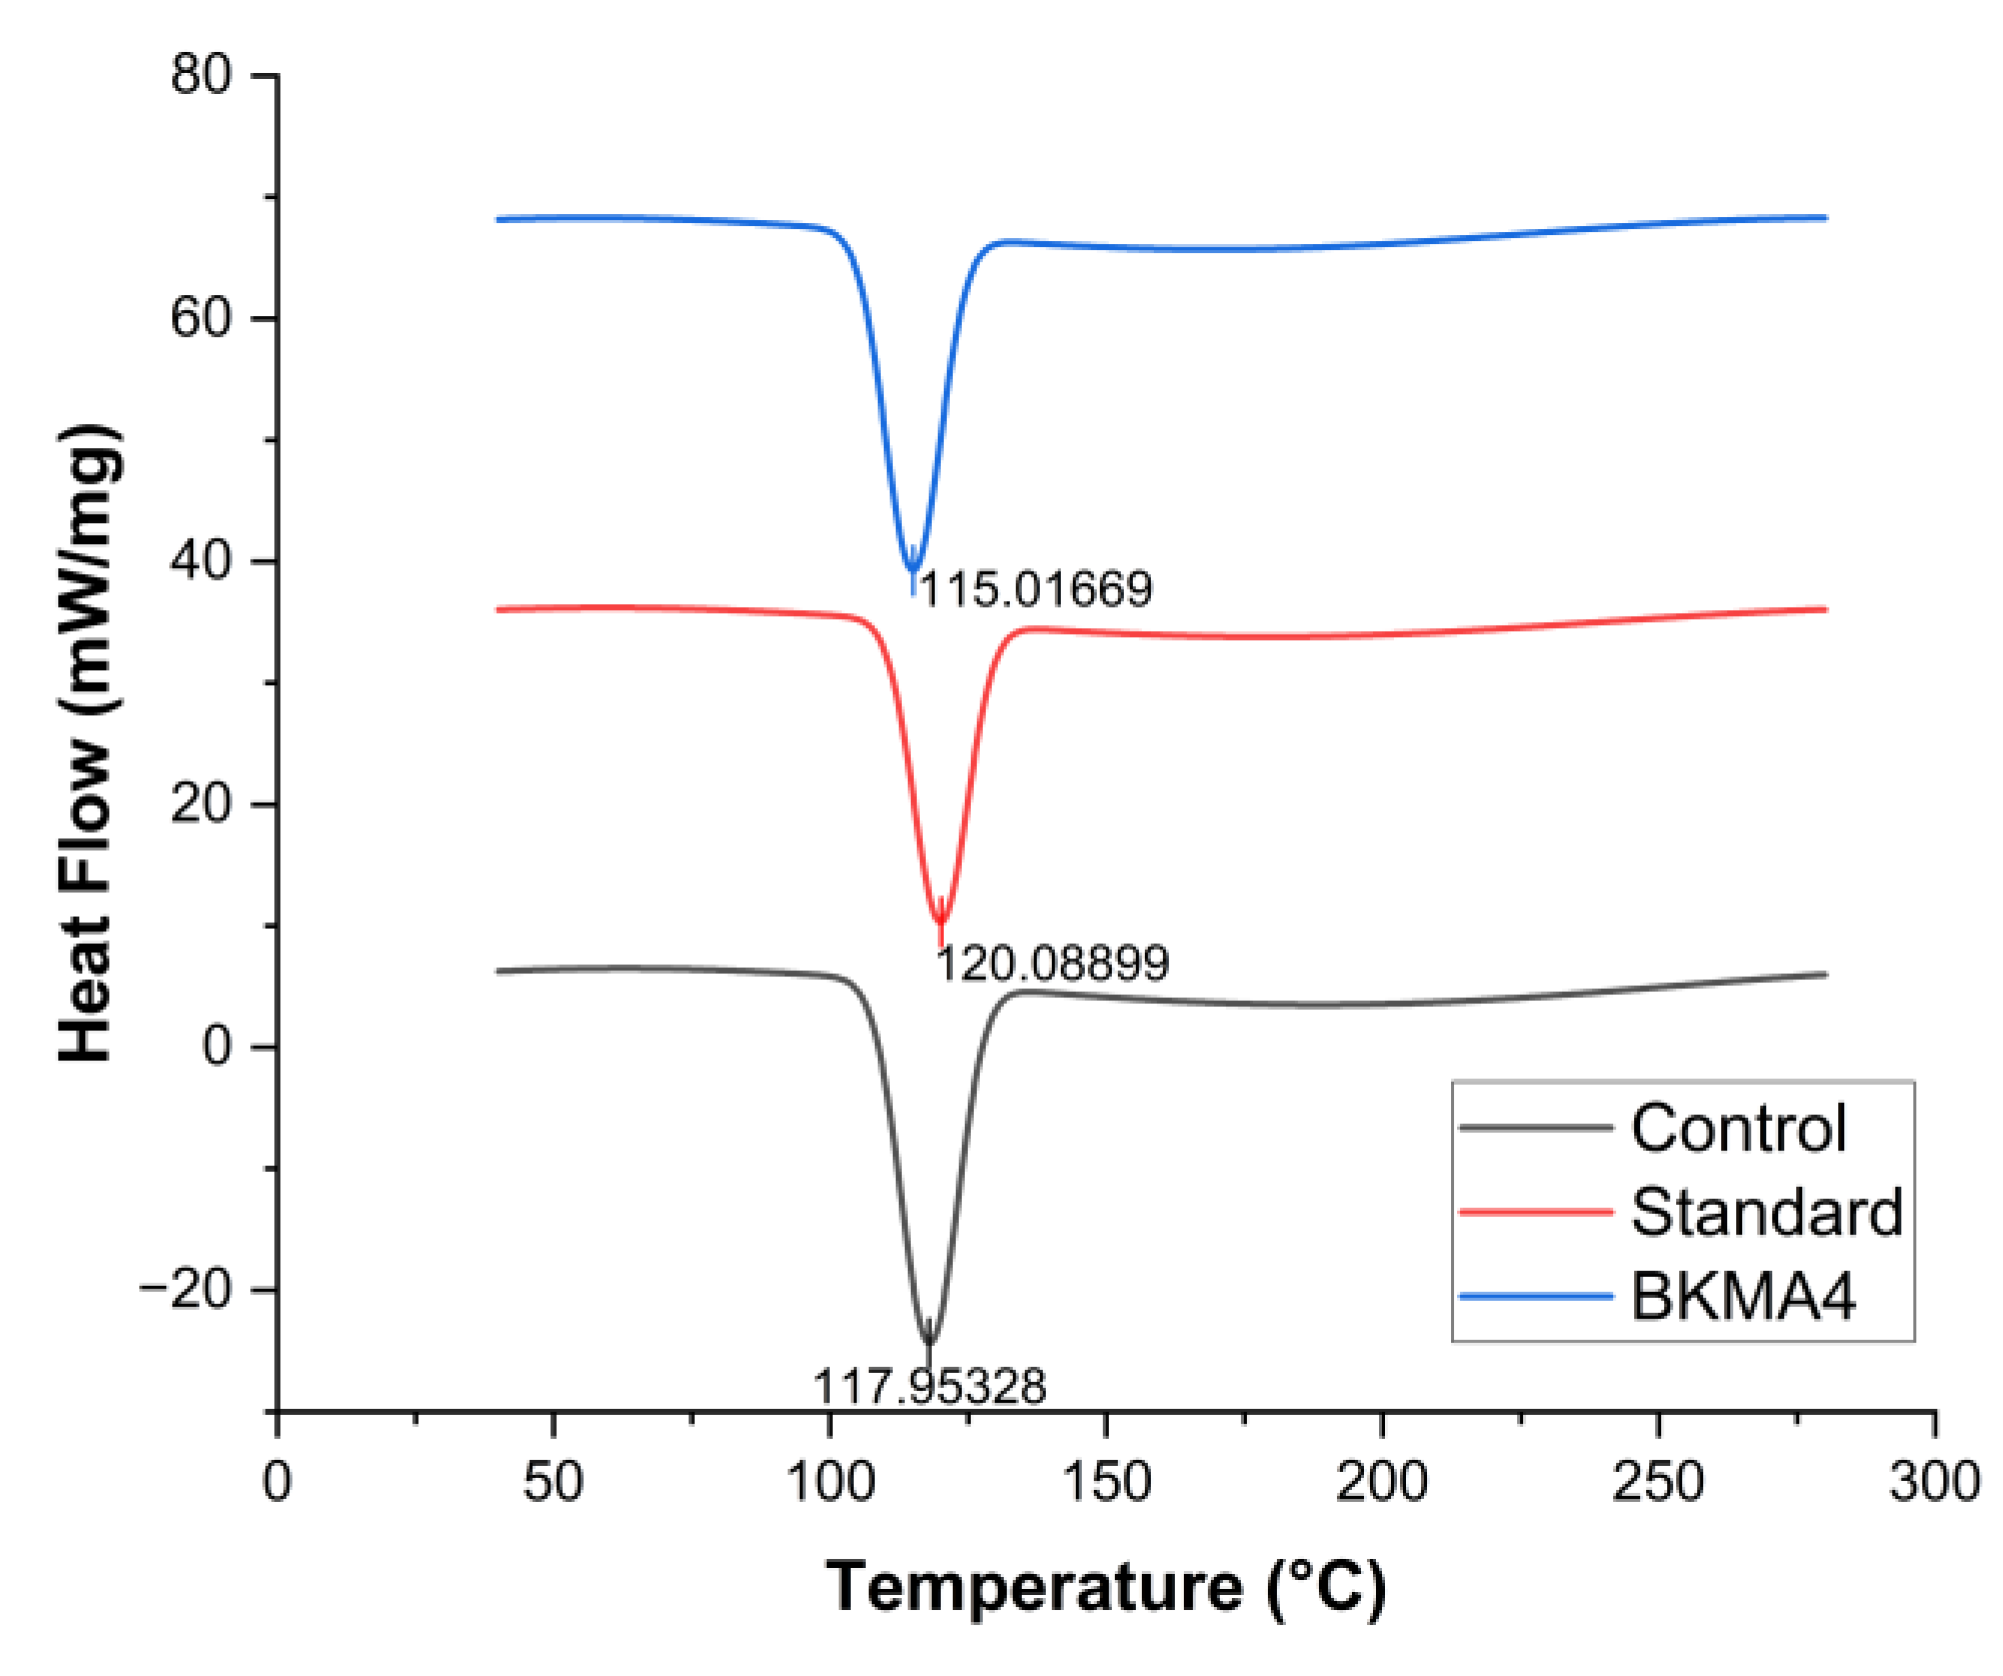
Figure 3.
XRD patterns of the control, standard, and formulation BKMA4.
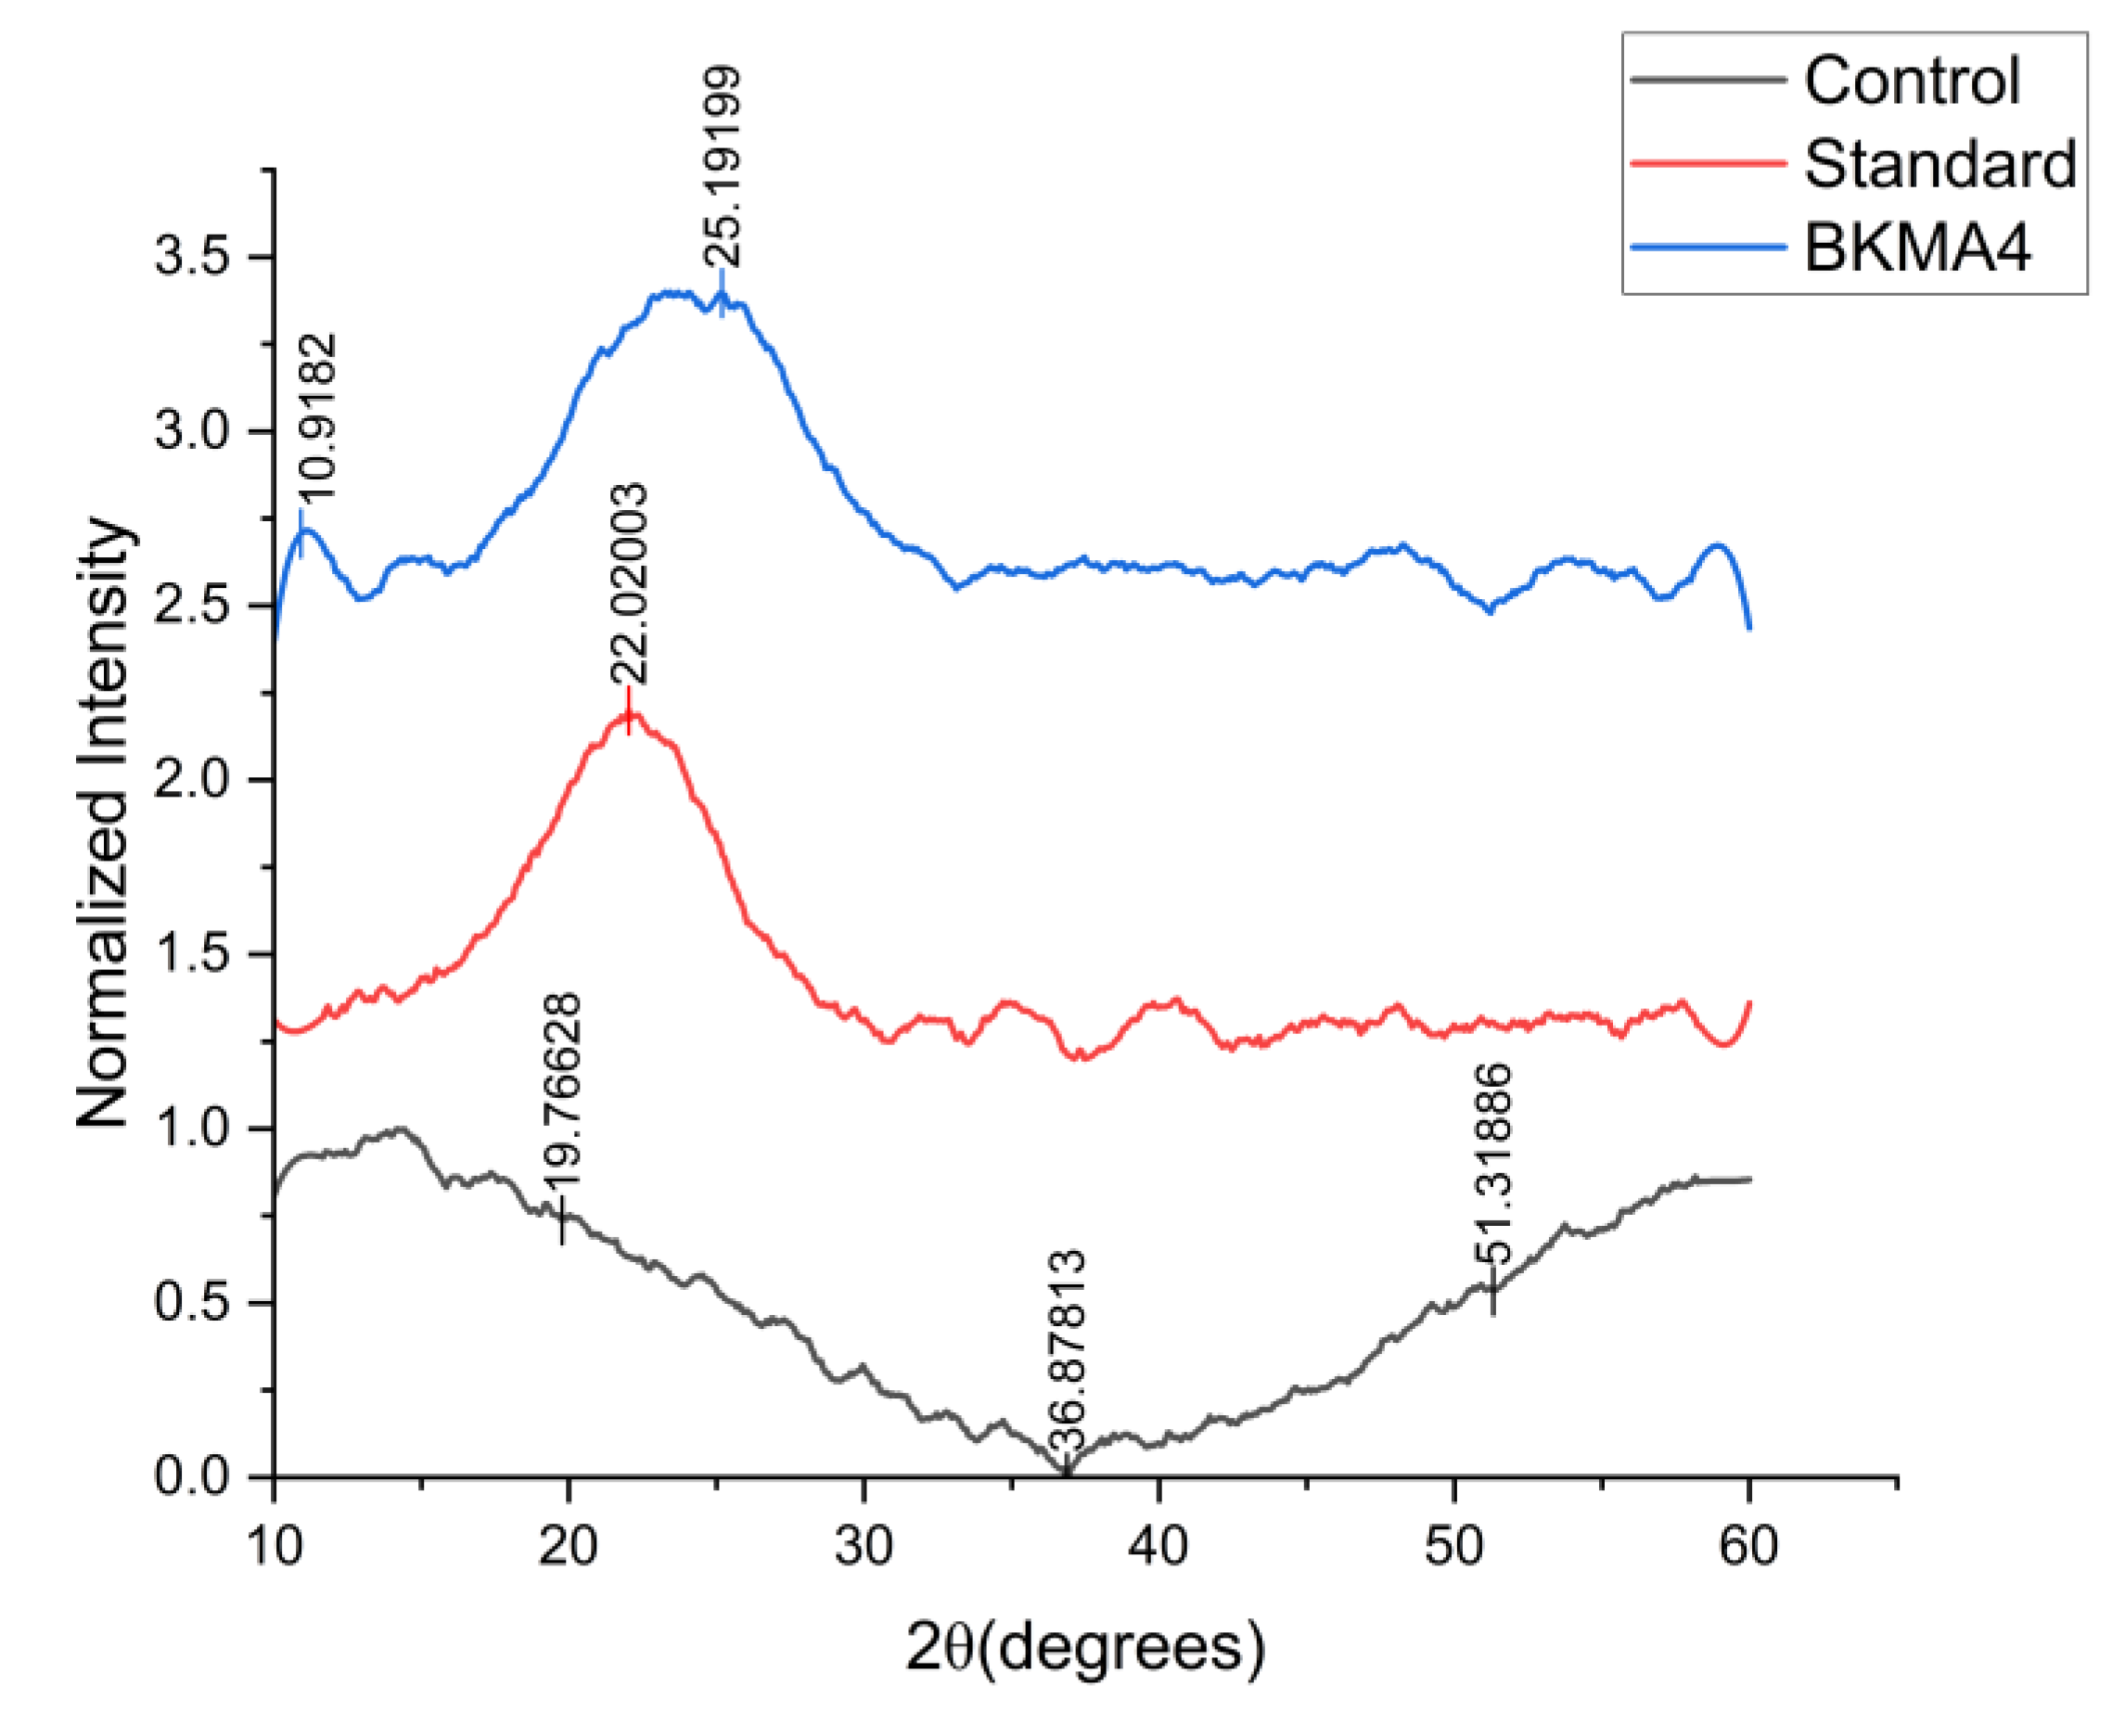
Figure 4.
Particle size distribution of BKMA4, Control and standard (Oziva Herbalance). Scale in nm; BKMA4 shows the most uniform particle distribution.
Figure 4.
Particle size distribution of BKMA4, Control and standard (Oziva Herbalance). Scale in nm; BKMA4 shows the most uniform particle distribution.
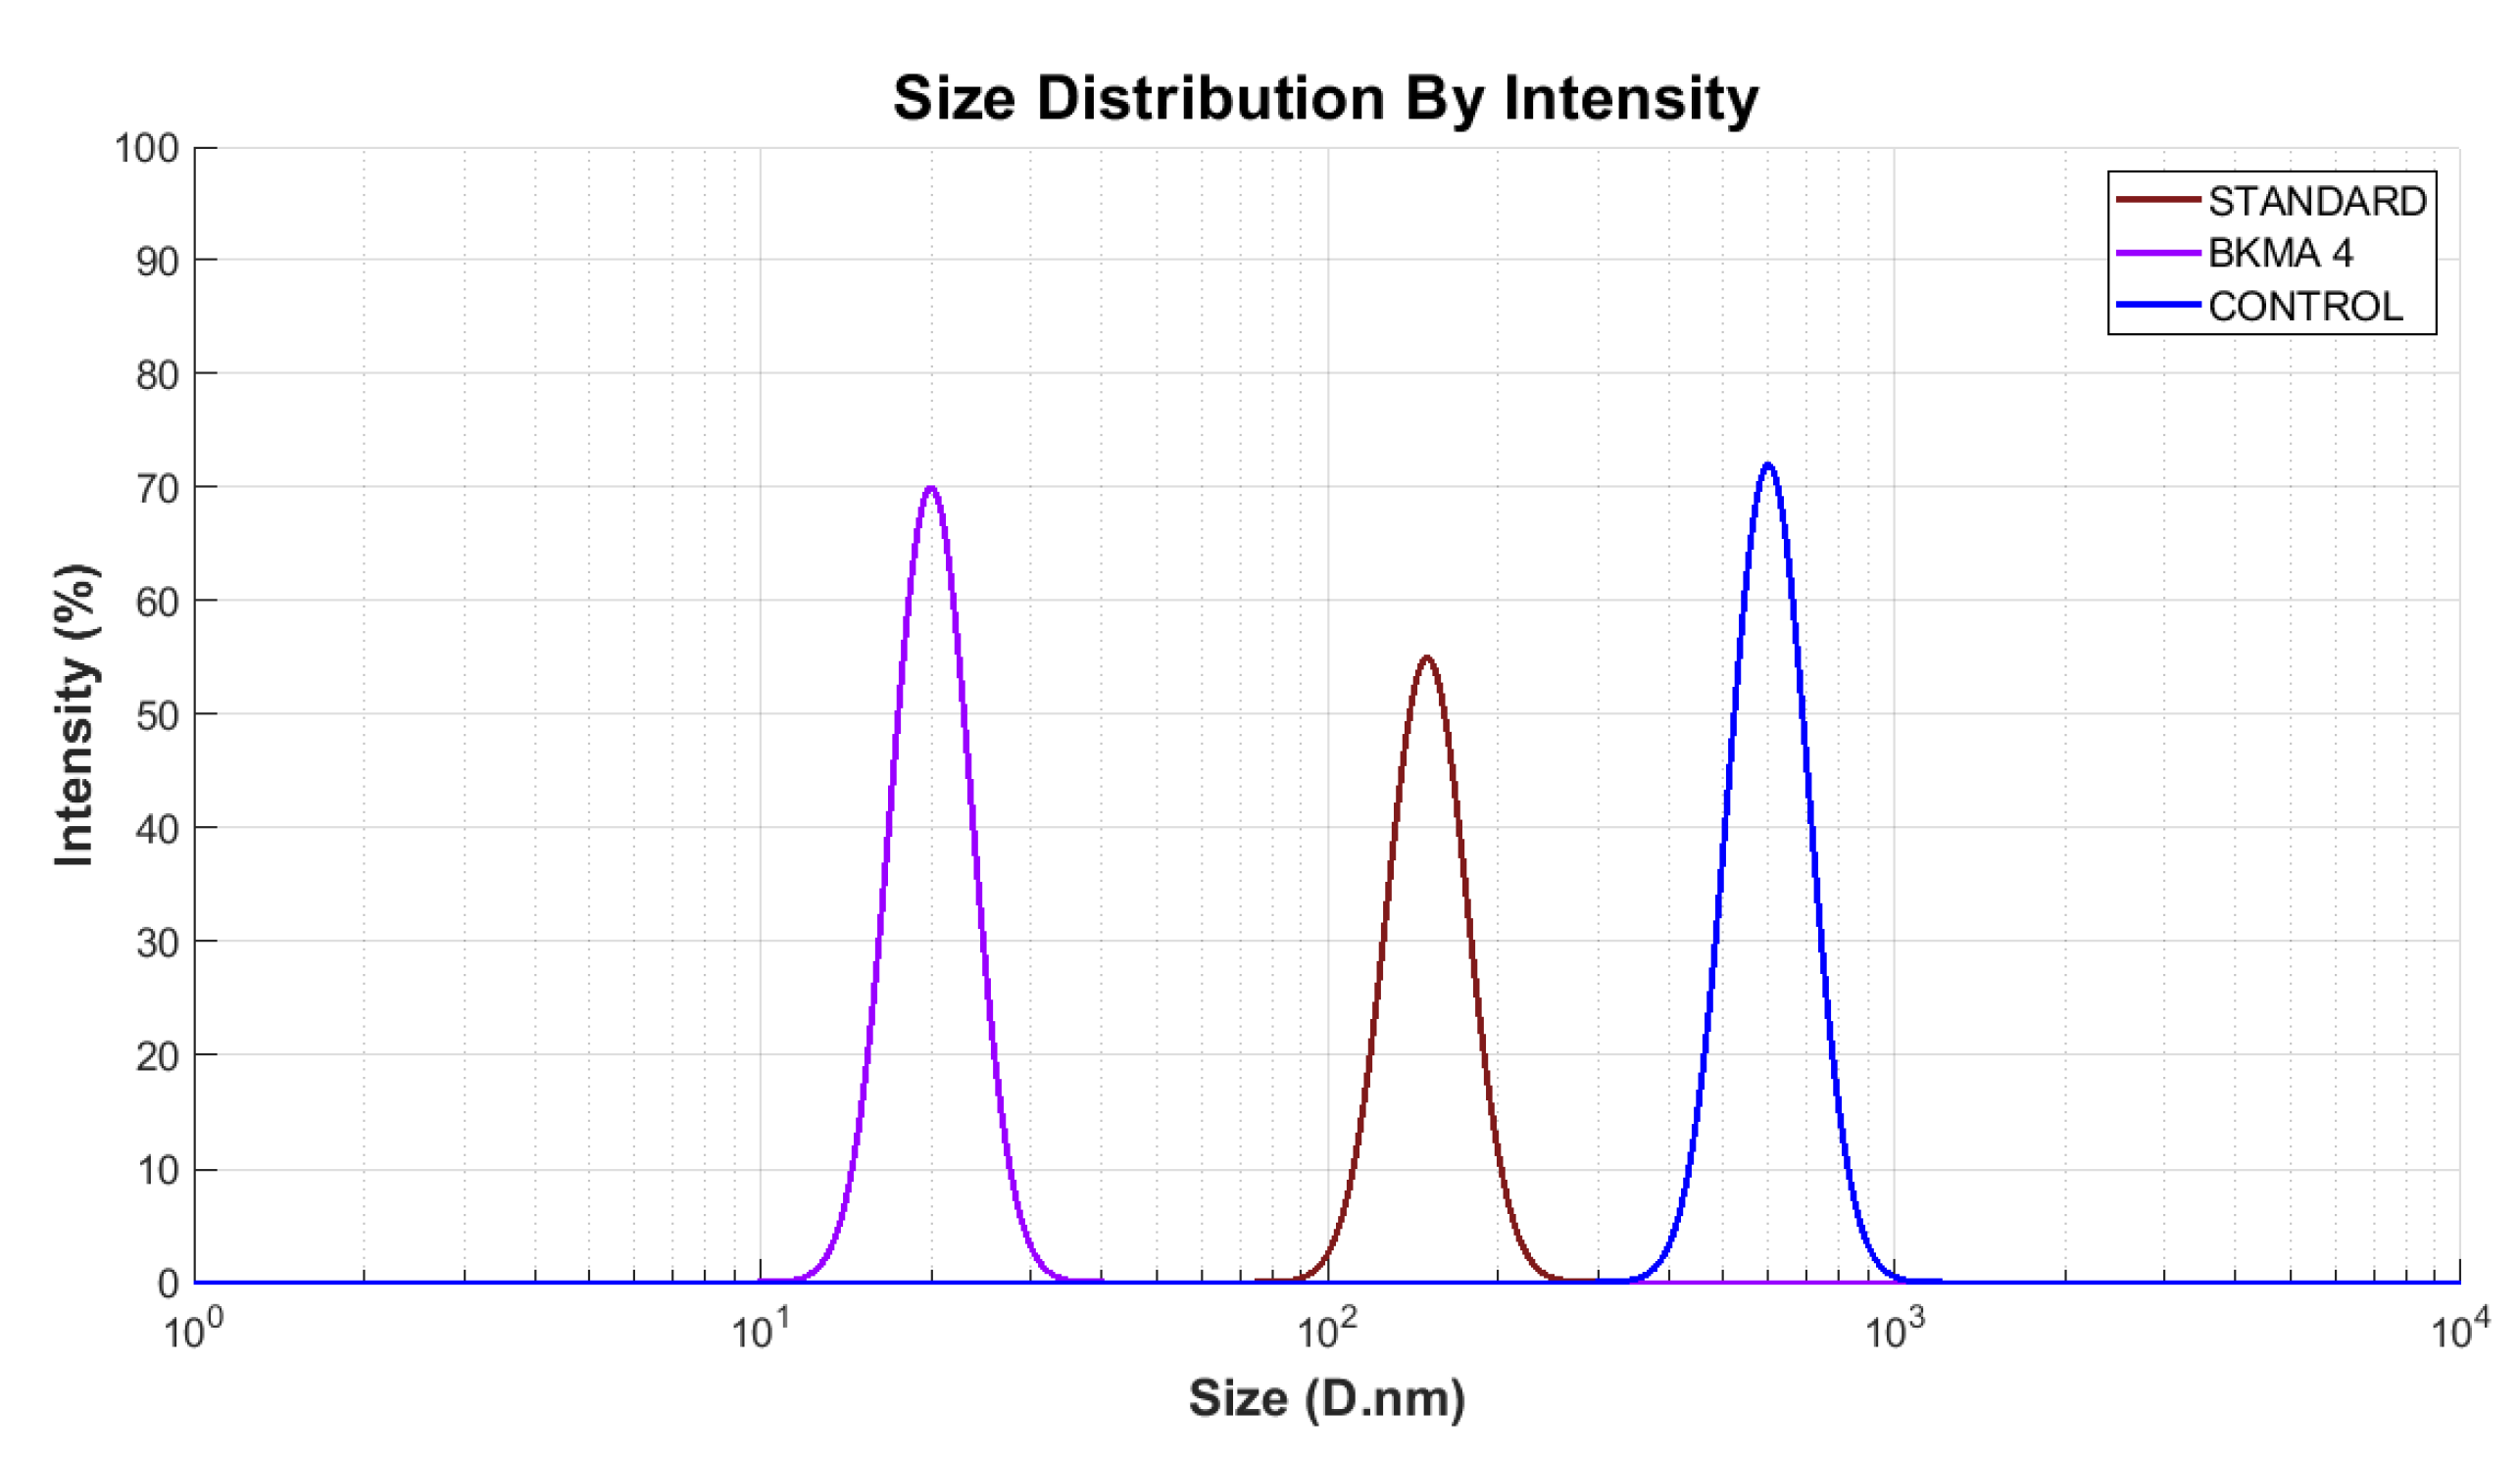
Figure 5.
Microbial load (CFU/g) of experimental formulations, BKMA4, Control and Standard. Bars with different superscripts (a, b, c) are significantly different at p < 0.05 (Tukey’s HSD). The y-axis is on a log scale.
Figure 5.
Microbial load (CFU/g) of experimental formulations, BKMA4, Control and Standard. Bars with different superscripts (a, b, c) are significantly different at p < 0.05 (Tukey’s HSD). The y-axis is on a log scale.
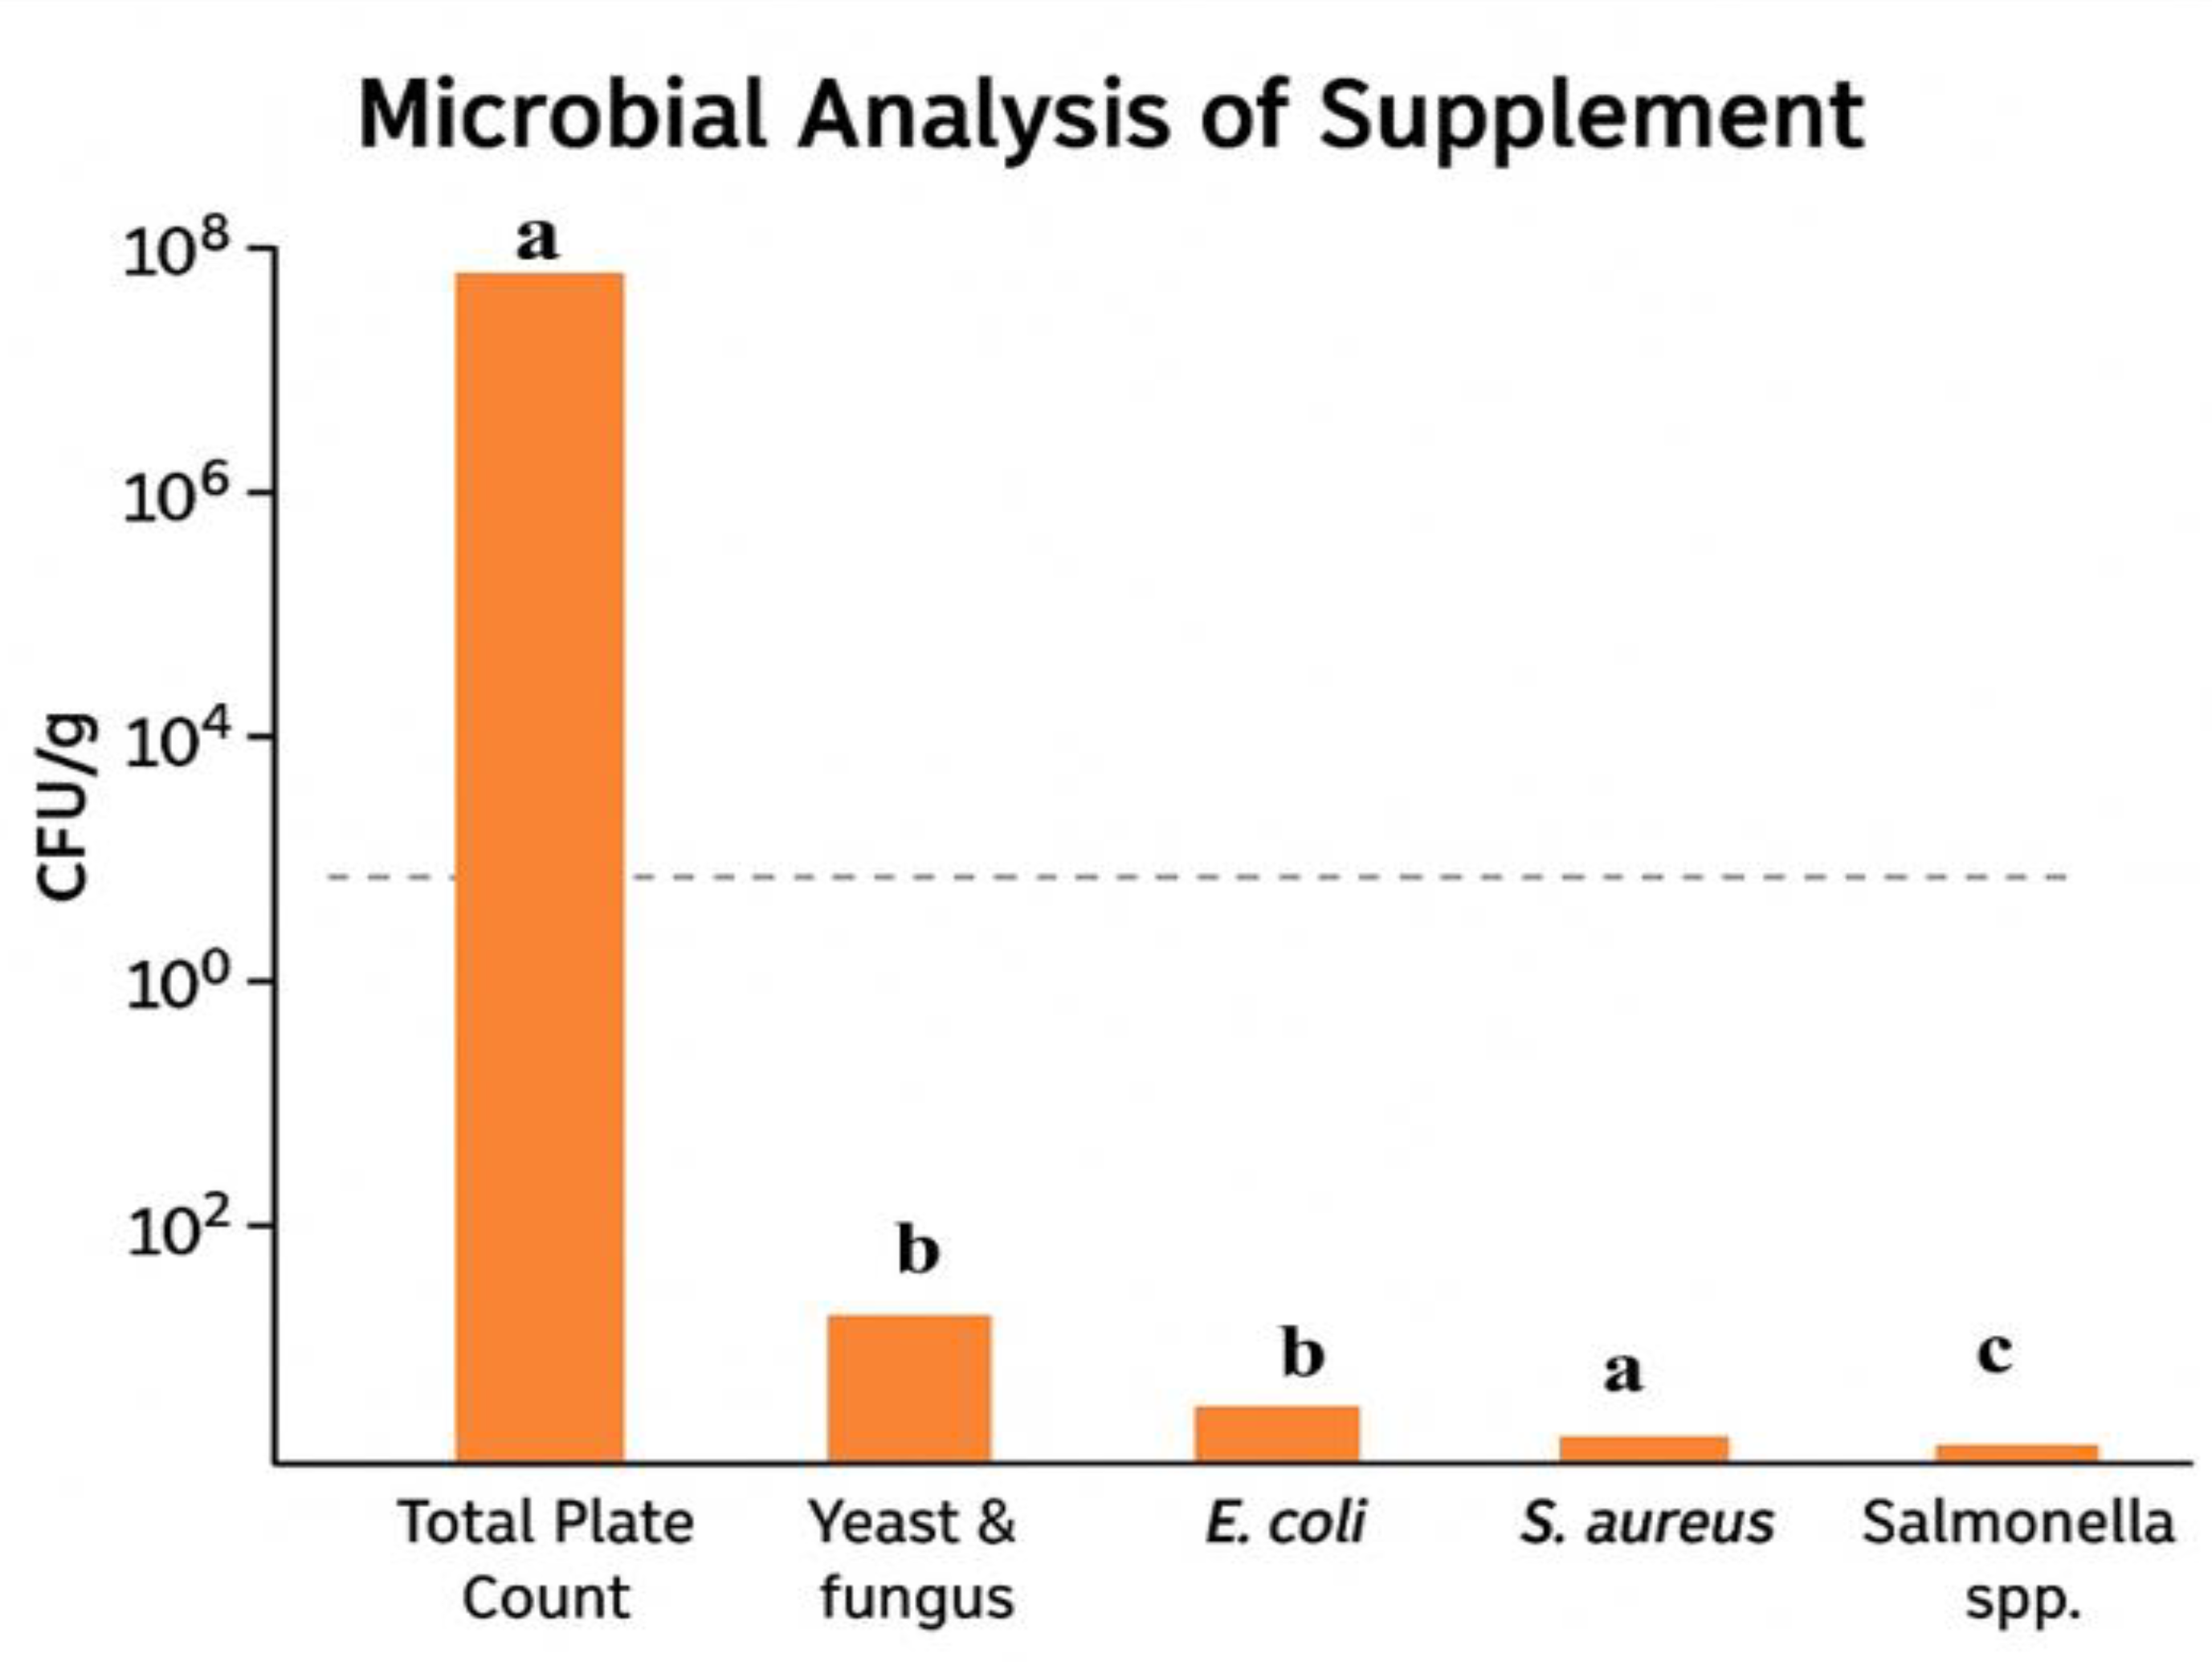

Table 1.
Composition of premixes supplement formulations.
| Formulation | Glycine max (Bhat dal) | Macrotyloma uniflorum (Kulthi dal) | Vigna aconitifolia (Moth dal) | A. racemosus (Shatavari) | Cocoa | Saccharum officinarum (Jaggery) |
| BKMA1 | 20 % | 20 % | 20 % | 30 % | 5 % | 5 % |
| BKMA2 | 15 % | 20 % | 20 % | 35 % | 5 % | 5 % |
| BKMA3 | 10 % | 20 % | 20 % | 40 % | 5 % | 5 % |
| BKMA4 | 5 % | 20 % | 20 % | 45 % | 5 % | 5 % |
| Control | 30 % | 30 % | 30 % | 0 % | 5 % | 5 % |
| Note: Control = No A. racemosus. Standard = Commercial plant-based formulation (Oziva Herbalance). | ||||||
Table 2.
Results of nutritional composition and antioxidant study. Data presents mean ± SD.
| Formulation | Moisture | Protein | Fat | Ash | Fibre | Antioxidant activity |
|---|---|---|---|---|---|---|
| BKMA1 | 60.53 ± 0.42 | 8.43 ± 0.15 | 18.15 ± 0.31 | 5.51 ± 0.22 | 4.69 ± 0.18 | 11.57 ± 0.33 |
| BKMA2 | 61.02 ± 0.39 | 8.36 ± 0.12 | 18.01 ± 0.29 | 36.82 ± 1.45 | 5.42 ± 0.21 | 15.01 ± 0.41 |
| BKMA3 | 59.52 ± 0.47 | 9.02 ± 0.17 | 18.20 ± 0.35 | 4.60 ± 0.19 | 5.39 ± 0.20 | 18.30 ± 0.50 |
| BKMA4 | 55.85 ± 0.36 | 8.77 ± 0.13 | 19.04 ± 0.32 | 9.85 ± 0.40 | 6.04 ± 0.24 | 19.74 ± 0.45 |
| Control | 64.37 ± 0.44 | 7.33 ± 0.14 | 16.58 ± 0.26 | – | 4.87 ± 0.19 | – |
| Standard | 43.84 ± 0.41 | 10.88 ± 0.18 | 21.65 ± 0.30 | – | 4.18 ± 0.16 | – |
Table 3.
Comparative ICP Elemental Profile of Samples.
| Sample | As | Ca | Cd | Cr | Cu | Fe | Pb | Sr | Zn | Mg | Mn | Na | Ni |
|---|---|---|---|---|---|---|---|---|---|---|---|---|---|
| BKMA1 | 0.1351ᵇ | 163.8ᵃ | 0.1644ᵃ | −0.0074ᶜ | 0.2663ᵇ | −0.8959ᶜ | 0.1558ᶜ | 0.8064ᵇ | 0.1070ᶜ | ND | ND | ND | ND |
| BKMA2 | 0.1318ᶜ | 156.5ᵇ | 0.1632ᵇ | −0.0038ᵇ | 0.2751ᵃ | −0.8753ᵇ | 0.1664ᵇ | 0.8930ᵃ | 0.1042ᵇ | ND | ND | ND | ND |
| BKMA3 | 0.1344ᵇ | 137.9ᶜ | 0.1629ᶜ | −0.0028ᵃ | 0.2865ᵃ | −0.8749ᵇ | 0.2055ᵃ | 0.9730ᵃ | 0.1332ᵇ | ND | ND | ND | ND |
| BKMA4 | 0.1350ᵇ | 10.44ᶜ | 0.1638ᵇ | −0.0058ᶜ | 0.2544ᶜ | −0.8484ᵇ | 0.1726ᵇ | 0.5448ᵇ | 0.1367ᵃ | ND | ND | ND | ND |
| Control | 0.2018ᵃ | 13.20ᶜ | ND | ND | ND | ND | 0.2063ᵃ | 0.4873ᶜ | 0.3851ᵃ | 40.10ᵃ | 0.3242ᵃ | 21.56ᵃ | 0.0349ᵃ |
| Standard | 0.1974ᵃ | 7.393ᶜ | 0.1638ᵇ | 0.0052ᵃ | 0.2581ᶜ | −0.8390ᵃ | 0.1800ᵃ | 0.1975ᶜ | 0.1079ᶜ | ND | ND | ND | ND |
The values are written as mean values (n = 3). ND = Not Detected. ᵃ, b, c Means within columns with different superscripts indicate relative comparative differences across formulations (highest = ᵃ, intermediate = ᵇ, lowest detectable = ᶜ).
Table 4.
Phytochemical content (mean ± SD) of experimental formulations at 100 µL concentration.
| Phytochemical | Concentration (µL) | |
|---|---|---|
| Phenolic content (mg GAE/g) | 1.0929 ± 0.1351 | |
| Flavonoid content (mg QE/g) | 0.0611 ± 0.0142 | |
| Tannin content (mg TAE/g) | 1.2233 ± 0.1522 |
Disclaimer/Publisher’s Note: The statements, opinions and data contained in all publications are solely those of the individual author(s) and contributor(s) and not of MDPI and/or the editor(s). MDPI and/or the editor(s) disclaim responsibility for any injury to people or property resulting from any ideas, methods, instructions or products referred to in the content. |
© 2025 by the authors. Licensee MDPI, Basel, Switzerland. This article is an open access article distributed under the terms and conditions of the Creative Commons Attribution (CC BY) license (http://creativecommons.org/licenses/by/4.0/).
Copyright: This open access article is published under a Creative Commons CC BY 4.0 license, which permit the free download, distribution, and reuse, provided that the author and preprint are cited in any reuse.


