Submitted:
10 December 2025
Posted:
12 December 2025
You are already at the latest version
Abstract
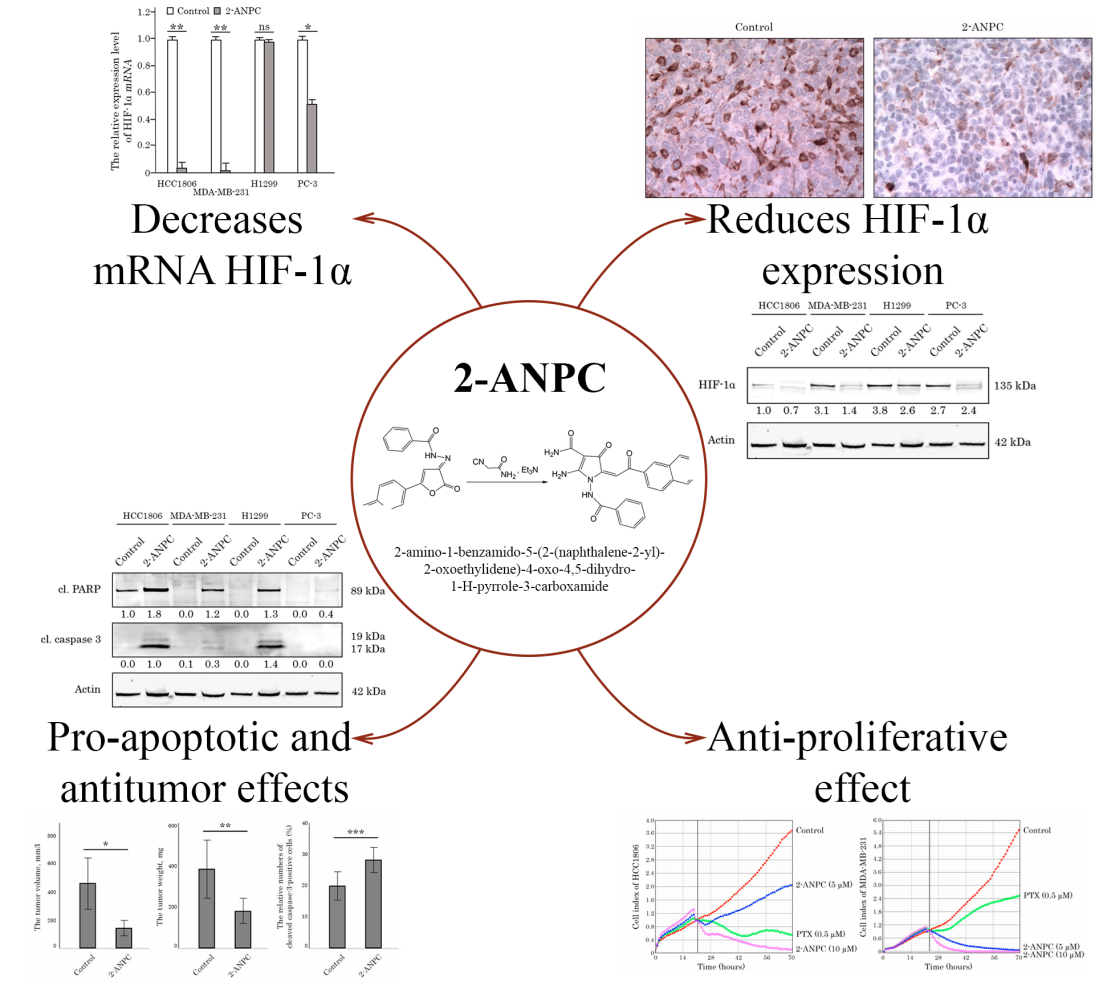
Hypoxia-inducible factor-1α (HIF-1α) is a well-known transcriptional regulator that me-diates a broad spectrum of cellular responses to hypoxia, including angiogenesis, extra-cellular matrix remodeling, and metabolic reprogramming. These activities can be achieved by up-regulation of numerous genes, such as vascular endothelial growth fac-tors, fibroblast growth factors, and platelet-derived growth factors, which are involved in the growth regulation of normal tissues and solid tumors. Of note, HIF-1α-mediated regu-lation of the solid tumor’s microenvironment effectively modulates tumor sensitivity to anticancer therapies and thereby can contribute to disease progression. We show here that a 2-aminopyrrole derivative (2-amino-1-benzamido-5-(2-(naphthalene-2-yl)-2-oxoethylidene)-4-oxo-4,5-dihydro-1-H-pyrrole-3-carboxamide – 2-ANPC), previously shown as a potent microtubule-targeting agent, effectively down-regulates HIF-1α expression in a broad spectrum of cancer cell lines, including breast, lung, and prostate cancer. The downregulation of HIF-1α expression in 2-ANPC-treated cancer cells was due to en-hanced proteasome-mediated degradation, whereas the proteasome inhibitor MG-132 ef-fectively reversed this downregulation. 2-ANPC’s potency to down-regulate HIF-1α was also shown in vivo by using the 4T1 breast cancer syngraft model. Important, this 2-aminopyrrole derivative also down-regulated the expression of vascular endothelial growth factor receptors 1 and 3 (VEGFR1 and 3) in 4T1 tumors, which correlated with de-creased tumor weight and size. As expected, an increase of apoptotic (i.e., cleaved caspa-se-3-positive) cells was detected in 4T1 tumors treated with 2-aminopyrrole derivative. Lastly, using various computational tools, we identified four potential binding sites for 2-ANPC to interact with HIF-1α, HIF-1β, and the p300 complex. Collectively, we show here, for the first time, that HIF-1α is a novel molecular target for the 2-aminopyrrole de-rivative (2-ANPC), thereby illustrating it as a potential scaffold for the development of po-tent chemotherapeutic agents with anti-angiogenic activity.
Keywords:
HIF-1α
; 2-aminopyrroles
; heterocycles
; apoptosis
; proliferation
; tumor growth
; folding
; molecular docking
1. Introduction
Hypoxia-inducible factor HIF-1α is a well-known regulator of cellular responses to hypoxia, functioning by activating several genes. Under normoxic conditions, HIF-1α becomes hydroxylated in the oxygen-dependent degradation (ODD) domain and, after recognition by the von Hippel–Lindau tumor suppressor protein (pVHL), is degraded by the ubiquitin–proteasome pathway. Under hypoxic conditions, HIF-1α accumulates, translocates to the nucleus, dimerizes with HIF-1β (aryl hydrocarbon receptor nuclear translocator – ARNT), and after binding to CREB-binding protein (CBP) or p300 activators interacts with hypoxia-responsive elements to induce gene expression.
The expression of HIF initiates the mechanism of tissue adaptation to hypoxia. This leads to enhanced erythropoiesis, increasing the oxygen-carrying capacity of blood; triggers angiogenesis via activation of vascular endothelial growth factor (VEGF), thereby expanding the blood supply to hypoxic regions; and regulates glucose metabolism, reducing oxygen demand for adenosine triphosphate production. The role of the HIF is also crucial in signaling pathways associated with both cell proliferation and the maintenance of normal tissue apoptosis [1].
The consequences of HIF expression are highly significant, not only in hypoxic normal tissues and organs but also in tumor development. Significant cell density and increased metabolic activity, coupled with insufficient oxygen supply [2], lead to HIF involvement in tumor growth and development, thereby enhancing blood supply.
HIF-driven metabolic changes sustain viability under pathological conditions in which reduced oxygen levels reduce the efficacy of both radiotherapy and chemotherapy, as available oxygen reserves are insufficient to counter oxidative damage to cells [3]. Furthermore, mechanisms that confer cell survival under hypoxic conditions also contribute to drug resistance; for example, by facilitating the active efflux of chemotherapeutic agents (e.g., doxorubicin) from cancer cells [3].
HIF-mediated pathway is deeply involved in tumor cell evasion of apoptosis. On one hand, p53 protein, a well-known tumor suppressor, inhibits HIF activity and induces apoptosis upon activation [4]. Conversely, p53 is downregulated by the overexpression of HIF-1α due to the hypoxic tumor microenvironment (TME). Indeed, increased expression of HIF-1α reduces p53 levels and attenuates its transcriptional activities by competing for p300, a coactivator of both p53 and HIF-1α [5]. Additionally, p53 mutations leading to loss of function are known to be a common genetic alteration in human cancers observed in more than 50% of cancer cases [6]. This results, in particular, in the absence of p53-mediated apoptosis and an increased role for HIF in oncogenesis. Moreover, recent studies suggest that p53 mutations can induce the sustained activation of the mTOR pathway, which is a positive regulator of HIF-1α [7]. Besides its potency to inhibit function of p53, HIF also reduces the activity of the apoptosis regulator Bcl-2 [8].
Thus, HIF-1α is considered a highly relevant target for cancer therapy. Currently, several strategies to inhibit HIF-1α activity and associated pathways are under intensive investigation. In particular, this includes the development of approaches to inhibit the HIF-1α transcriptional activity, its translation, stability, heterodimerization, transport into the nucleus, binding to DNA, and HIF target genes, as well [4,9]. For example, anthracyclines, topoisomerase inhibitors, steroids, and microtubule-targeting agents (MTA) are shown to inhibit the HIF-1α mRNA expression [10]. Several drugs with distinct therapeutic activities can also effectively block HIF-1α mRNA translation. This includes mTOR inhibitors (e.g., rapamycin, everolimus), MTA (e.g., taxotere), cyclooxygenase type 2 inhibitors (ibuprofen), topoisomerase inhibitors (e.g., mitoxantrone and topotecan), cardiac glycosides (e.g., digoxin), and the inhibitors of heat shock protein 90 (HSP90) (e.g., ganetespib) [11,12]. Similarly, some HSP90 inhibitors (e.g., 17-allylamino-17-demethoxygeldanamycin) were shown to reduce HIF-1α protein stability and promote its proteasomal degradation. This activity was also observed for class II histone deacetylase (HDAC) inhibitors (e.g., panobinostat) and the thioredoxin inhibitor (e.g., PX-12) [13]. Several reports indicate that HDAC inhibitors can stabilize the HIF-1α protein and promote HIF-1α nuclear localization via modulating the acetylation of either the HIF-1 protein itself or of its cofactors (e.g., p300) [14,15,16]. Anthracyclines (e.g., doxorubicin and daunorubicin) are widely used in cancer treatment due to their ability to inhibit topoisomerase activity. Besides this fact, they were also found to decrease HIF-1 transcriptional activity via the inhibition of HIF-1 heterodimer binding to the hypoxia response element DNA sequences [17].
We examined here the potential activity of the 2-ANPC to interact with and inhibit HIF-1α activity in vitro and in vivo across a broad spectrum of cancer cell lines. We show here, for the first time, that 2-ANPC interacts with HIF-1α and promotes its proteasome-mediated degradation, resulting in decreased HIF-1α expression in cancer cells both in vitro and in vivo. Moreover, reduced HIF-1α expression in syngraft tumors moderately downregulated VEGFR1 and 3 and was associated with decreased tumor volume and size. Using various computational tools, we confirmed the effective targeting of HIF-1α by 2-ANPC and identified potential binding sites for 2-ANPC to interact with HIF-1α, HIF-1β, and the p300 complex.
Collectively, we show here that the 2-ANPC synthesized in our lab and previously shown to be an effective MTA [18,19,20] also exhibits potent anti-HIF-1α activity, thereby demonstrating this derivative as a scaffold for the development of successful chemotherapeutic anticancer agents with dual therapeutic modalities.
2. Materials and Methods
2.1. Chemistry
2.2. Cell Lines and Culture Conditions
The following cancer cell lines were used in the present study: HCC1806 and MDA-MB-231 TNBC cell lines, mouse H1299 NSCLC cell line, and PC-3 prostate cancer cell line. Cancer cell lines indicated above were obtained from the American Type Culture Collection (ATCC, Manassas, VA, USA). All cell lines were maintained in Dulbecco’s modified Eagle’s medium or RPMI-1640 medium (PanEco, Moscow, Russia), supplemented with 10–15% fetal bovine serum (HyClone, Logan, UT, USA), 1% L-glutamine, 50 U/ml penicillin, and 50 μg/ml streptomycin (PanEco, Moscow, Russia), and cultured in a humidified atmosphere of 5% CO2 at 37 °C (LamSystems, Mass, Russia).
2.3. Real-Time Monitoring of Cell Proliferation
Cells (1 × 10⁵/mL) were seeded into the wells of an E-Plate L8 PET cassette (ACEA Biosciences, San Diego, CA, USA). The cassettes were installed in the iCELLigence cell growth kinetics system (ACEA Biosciences, San Diego, CA, USA). Cells were allowed to attach and grow for the following 24 h. Subsequently, 2-ANPC 10 µM was introduced into cell culture. DMSO-treated cells served as the control. Cell proliferation index values were recorded every hour throughout the experiment. The experiments were performed at least in triplicate. RTCA Software version 1.0 (ACEA Biosciences, Inc., San Diego, CA, USA) was used to analyze the data.
2.4. Antibodies
Primary antibodies raised against the following proteins were used for Western blotting and IHC-staining: cleaved forms of caspase-3 (#9662S) and PARP (#5625S) (Cell Signaling, Danvers, MA, USA); Actin (A00730-200, Abcam, Cam-bridge, MA, USA); HIF-1α (sc-10790), VEGF-1 (sc-271789) and VEGF-3 (sc-28297) (Santa Cruz Biotechnology, Santa Cruz, CA, USA). HRP-conjugated secondary antibodies for Western blot-ting were purchased from Santa Cruz Biotechnology.
2.5. Western Blotting
For the preparation of whole-cell extracts, the cells were lysed in RIPA buffer (25 mM Tris-HCl, pH 7.6, 150 mM NaCl, 5 mM EDTA, 1% NP-40, 1% sodium deoxycholate, 0.1% SDS) supplemented with protease and phosphatase inhibitors. The cellular lysates were incubated in a buffer for 20 min at 4 °C, then clarified by centrifugation for 30 min at 13,000 rpm at 4 °C. Protein concentrations were measured by the BCA assay (Thermo Fisher Scientific, Rockford, IL, USA). The samples containing 30 μg of protein were resolved on 4 to 12% Bis-Tris NuPAGE gel (Invitrogen, Carlsbad, CA, USA). SDS-PAGE was carried out at 4 °C for approximately 3 h using a constant voltage (80V) in 1X NuPAGE MOPS SDS running buffer (Invitrogen, Carlsbad, CA, USA). Protein transfer to a nitrocellulose membrane was performed by using 1X transfer buffer (25 mM Tris, 192 mM Glycine, 20% (v/v) methanol, pH 8.3) at 350 mA for 1.5 h at 4 °C. To block the nonspecific interactions, 5% non-fat dry milk was used in the antibody-dilution buffers. The nitrocellulose membrane was incubated with primary antibodies overnight at 4 °C, washed 3 times with 1xPBS, and further incubated with HRP-conjugated secondary antibody for 1 h. Protein expression was detected by the chemiluminescence imaging system, Fusion Solo S (Vilber Lourmat, Collégien, France). Densitometry analysis of Western blotting images was performed by using the NIH Image J software (Bethesda, MD, USA).
2.6. RNA Extraction and RT-PCR
Total RNA was extracted from cancer cells and converted into complementary DNA (cDNA) as previously described [22]. One µL template cDNA was used in a RT-PCR reaction with 5× qPCRmix-HS SYBR (PB025, Evrogen, Moscow, Russia) and 10 mM each forward and reverse primers for HIF-1α or GAPDH genes (Supplementary Table S1). According to the manufacturer’s protocol, real-time qPCR was performed using the CFX96 Real-Time Detection System (Bio-Rad, Hercules, CA, USA). The relative levels of each mRNA were normalized to those of GAPDH. Quantitative data were generated based on the number of cycles required for the fluorescence generated by amplification to reach a specific threshold of detection (the Ct value).
2.7. Study of Antitumor Activity
The antitumor activity of 2-ANPC was studied in vivo using a syngeneic model. 4T1 breast cancer cells were transplanted subcutaneously into the flank regions of Balb/c mice. The animal experimental protocols were approved by the Committee for Ethics of Animal Experimentation, and the experiments were conducted in accordance with the Guidelines for Animal Experiments in N.N. Blokhin National Medical Research Center of Oncology. After tumor volumes reached 200 mm3, animals were randomized into two groups (control (n=5) and 2–ANPC–treated (n=4)) and administered either vehicle (control) or 2-ANPC i.p. at a dose of 10 mg/kg on days 10, 13, 16, 19, 22, 25, and 28 after transplantation. On day 30, the mice were sacrificed, and the tumors were isolated and photographed. The terminal tumor volume in each group was measured with a caliper and calculated as width × height × depth × 0.5. The terminal weight of syngrafts was also recorded. Formalin-fixed, paraffin-embedded (FFPE) tissues were sectioned at 4 μm for H&E staining and IHC-staining for HIF-1α, VEGFR-1, and VEGFR-3. The images of the stained samples were captured using an Olympus BX63 microscope (Olympus, Tokyo, Japan).
2.8. Statistics
All the experiments were repeated a minimum of 3 times. The Shapiro–Wilk test was used to assess normality. Normally distributed data were presented as mean ± standard deviation for each group. Differences were considered significant at p < 0.05 (*) using an unpaired Student’s t-test.
2.9. HIF-1α Modelling
Protein sequence of HIF-1α was taken from UniProtKB Q16665-1, its structure was predicted with AlphaFold 2 Colab [23,24], for the following molecular dynamics system, which was built in Visual Molecular Dynamics (VMD) v1.9.3 [25] (TIP3P water, 0.015 M NaCl), the simulation was performed during 100 ns in Nanoscale Molecular Dynamics (NAMD) v2.15 [26,27] using the CHARMM36 force field [28,29,30]. After the HIF-1α dynamics simulation, the 99.6 ns snapshot was chosen for the docking based on the Ramachandran plot data.
For the multiligand simulation, the 26 copies of I were added to the solvate box, and the simulation was performed for 300 ns. The system was built in VMD v1.9.3 [25] (TIP3P water, 0.015 M NaCl), and the simulation was performed using NAMD v2.15 [26,27] using the CHARMM36 force field [28,29,30]. The ligand parametrization was performed with SwissParam [31,32].
2.10. HIF-1 Protein Complex Modelling
The protein sequences of HIF-1α, HIF-1β, and p300 were taken from UniProtKB (Q16665-1, P27540-1, and Q09472, respectively). The HIF-1 complex was predicted with AlphaFold 3 [33]. The following molecular dynamics simulation was performed for 300 ns in Desmond [34] by using the OPLS4 force field [35], TIP3P water, and 0.015 M NaCl. The trajectory was clustered, and the snapshot of the system for the docking was chosen based on the Ramachandran plot data.
2.11. Site Mapping and Docking
All the molecular dynamics snapshots were minimized by the OPLS4 force field [36] in Prime [37,38] before docking. The search for binding sites was performed by SiteMap [39,40]. Molecular docking was performed using the forced ligand positioning protocol (energy spent on formation of the laying of the compound in the binding site and binding energy of ligand and protein – IFD) [41,42] with the following conditions: flexible protein and ligand; grid matrix size of 20 Å; amino acids (within a radius of 5 Å from the ligand) restrained and optimized, taking into account the influence of the ligand; the maximum number of positions was limited to 10; docking solutions were ranked by evaluating the following calculated parameters: docking score (based on Glide score minus penalties); parameter of model energy value (Emodel), including Glide score value, energy unrelated interactions, and the parameters of energy spent on formation of the laying of the compound in the binding site and binding energy of ligand and protein (IFD score).
3. Results
3.1. 2-ANPC Exhibits Potent Anti-Proliferative and Pro-Apoptotic Activities Against Breast, Lung, and Prostate Cancer Cell Lines
We initially examined whether 2-ANPC affects the proliferative activity of cancer cells in vitro. For this, we used the HCC1806, MDA-MB-231 (triple-negative breast cancer [TNBC]), H1299 (non-small cell lung cancer [NSCLC]), and PC-3 prostate cancer cell lines. We observed that 2-ANPC significantly affected growth kinetics in the aforementioned cancer cell lines (Figure 1). Of note, this effect was dose-dependent and more potent than that of paclitaxel (PTX), a potent MTA agent used as a positive control.
Besides the anti-proliferative effect of 2-ANPC in epithelial cancer cells, this amino-pyrrole derivative exhibited potent pro-apoptotic activity, which was evidenced by the increased expression of common apoptotic markers (e.g., cleaved forms of poly(ADP)-ribose polymerase (PARP) and caspase-3) at 48 h post-treatment (Figure 2).
3.2. 2-ANPC Effectively Decreases HIF-1α Expression In Vitro in Epithelial Cancer Cells by Promoting Its Proteasome-Dependent Degradation
Besides the anti-proliferative and pro-apoptotic activities of 2-ANPC in the aforementioned cancer cell lines, this 2-aminopyrrole derivative also effectively decreased the expression of HIF-1α in the majority of cancer cell lines used in the present study. This was shown for both HCC1806, MDA-MB-231 TNBC cells, and PC-3 cells, whereas H1299 NSCLC cells exhibited a moderate decrease in HIF-1α after 2-ANPC treatment (Figure 3A). In concordance with WB data, 2-ANPC also effectively decreased HIF-1α at the transcriptional level. Indeed, Real-time polymerase chain reaction (RT-PCR) data shown in Figure 3B illustrate a significant decrease in HIF-1α mRNA levels after 2-ANPC treatment of HCC1806, MDA-MB-231, and PC-3 cells. Again, no differences in mRNA HIF-1α between non-treated and 2-ANPC-treated cells were observed for H1299 lung cancer cells (Figure 3B).
Next, we examined whether 2-ANPC affects HIF-1α’s stability. To test this possibility directly, we treated PC-3 prostate cancer cells with 2-ANPC in the presence of MG-132, a 26S proteasome inhibitor. The data shown in Figure 3C illustrate increased expression of HIF-1α in cancer cells cultured with 2-ANPC in the presence of MG-132, compared with cancer cells cultured with 2-ANPC alone, thereby suggesting rapid protein turnover in cancer cells after exposure to 2-ANPC due to increased proteasome-mediated HIF-1α degradation. Overall, this data shows that this 2-aminopyrrole derivative significantly alters HIF-1α stability at the protein level and promotes its proteasome-dependent degradation.
3.3. 2-ANPC Inhibits Tumor Growth and Decreases HIF-1α, VEGFR1 and VEGFR3 Expression In Vivo
Next, we examined 2-ANPC for its antitumor and HIF-1α-inhibitory activities using the 4T1 breast cancer syngraft model. Syngraft tumors were allowed to reach ~200 mm3 before randomizing mice into two groups (control (n = 5) and 2-ANPC-treated (n = 5)) (day 10 after inoculation). 2-ANPC was diluted, as described in the section Chemical compounds and administered on days 10, 13, 16, 19, 22, 25, and 28 after inoculation. The dose of 2-ANPC used for this experiment was 10 mg/kg. We observed a moderate decrease in tumor volume and weight in 2-ANPC-treated mice bearing 4T1 syngrafts when compared with vehicle-treated (control) mice, illustrating that 2-ANPC exhibits antitumor activity. Importantly, no toxicity was observed in any animal group throughout the experiment (30 days). The graphs depicting the decrease in tumor volume and weight after 2-ANPC treatment are shown in Figure 4A and Figure 4B, respectively. To examine whether the increased apoptosis in 4T1 sygrafts was responsible for the aforementioned changes in tumor volumes and weights, we performed immunohistochemical (IHC) staining of tumors for cleaved caspase-3. Strikingly, we observed a significant increase in the number of caspase-3-positive (i.e., apoptotic) cells after 2-ANPC treatment, as shown in Figure 4C.
In concordance with these findings, 2-ANPC-treated syngrafts also exhibited an increase in areas of central necrosis as assessed by hematoxylin and eosin (H&E) staining, when compared with control (solvent-treated) 4T1 syngrafts (Figure 5A). Important, the increased number of pathological mitosis was also detected in 2-ANPC-treated syngrafts (Figure 5B), thereby revealing the previously shown molecular mechanism of action of this derivative, targeting the microtubule network due to tubulin depolymerisation and inducing substantial changes in cell cycle regulation and accumulation of cancer cells in M-phase [18,19,20].
Based on our in vitro data illustrating 2-ANPC’s potency to decrease HIF-1α in cancer lines (as shown in Figure 3), we examined whether the antitumor activity of this amino-pyrrole derivative was due to its ability to decrease HIF-1α expression in vivo. Strikingly, we observed reduced HIF-1α expression in 4T1 syngrafts after 2-ANPC treatment (Figure 6A and B). This data was also consistent with in vitro data demonstrating a moderate decrease of HIF-1α expression in 4T1 cells cultured in the presence of 2-ANPC (Figure 6C). Again, this derivative effectively inhibited the proliferative activity of this cancer cell line and was much more effective than PTX, used as a positive control for these experimental settings (Supplementary Figure 1).
In concordance with 2-ANPC-induced decrease of HIF-1α in 4T1 syngrafts, the expression of VEGFR1 and 3 was also reduced after 2-ANPC treatment when compared with vehicle-treated controls (Figure 7A-D), thereby revealing hypoxia in the tissues as a potent mechanism promoting angiogenesis.
3.4. Molecular Modeling Studies
3.4.1. Folding and Binding Sites Search
First, we considered folding HIF-1α alone; its structure was predicted using ColabFold. As expected, the best folded domains were basic helix–loop–helix (bHLH) and Per-Arnt-Sim (PAS) (Figure 8), which were partially included in protein data bank (PDB) 4H6J and PDB 4ZPR crystals.
The unfolded regions were identified as the ODD domain (401-603), the Inhibitory Domain (ID, 576-785), and the c-terminal transactivation domain (CTAD) (786-826), which could be assigned to Intrinsically Disordered Regions (IDRs). Thus, the authors of [43] proposed that the ODD and Inhibitory Domain (ID) domains were intrinsically disordered, in agreement with the Nuclear Magnetic Resonance (NMR) and far-UV circular dichroism data. NMR demonstrated the disorder character of CTAD, as shown in [44].
The HIF-1α model was equilibrated for 100 ns in a molecular dynamics simulation (Supplementary Figure S2A). The system snapshot at 99.6 ns was selected from the stable-trajectory cluster based on the fine Ramachandran plot (Supplementary Figure S2B). After the protein minimization, the system was used for the subsequent investigation.
3.4.2. Site Mapping and Multi-Ligand Dynamics
By searching for potential binding sites using SiteMap, five potential cavities were found (Figure 9). Thus, two possible sites were identified in the bHLH and ID domains, and two in the PAS and ODD domains, with the last one specific to the ODD domain. Unfortunately, the following docking didn’t confirm the last one of the found sites as potentially binding, so we considered that we had only seen the four sites at this step. For additional site searching, we performed multi-ligand molecular dynamics, in which 26 copies of the most active 2-ANPC were placed in the simulation box. After 300 ns, the trajectories of each small molecule were analyzed, and potential sites were identified. It should be noted that not all of the protein surface interacted with ligands; generally, the PAS domain didn’t bind to 2-ANPC. That approach enabled us to identify additional binding sites in the structural domain of HIF-1α, not included in any of its functional domains. The ligand occupied this site for almost the entire simulation, with only minor conformational changes.
The 2-ANPC was docked into each site. As mentioned above, the one site identified by SiteMap did not yield any plausible docking poses, so we did not consider it further. For the 1-5 sites, the docking scores from -5.9 to -9.8 kcal/mol were obtained (Supplementary Table S2).
Convincing data was obtained for sites 1-4. Based on the protein structure, binding at two positions could directly affect HIF-1α activity by interacting with the bHLH domain. By binding to sites 1 and 4, 2-ANPC could prevent dimerization of HIF-1α with HIF-1β, as it lies near the PAS-A and B domains. Interestingly, one of the good binding sites, 3, was partially formed by the ODD domain, which could potentially inhibit HIF-1α degradation, leading to a reversal of the effect and HIF-1α accumulation. At the same time, while the ODD domain is involved in active HIF complex formation, where its secondary and tertiary structure would be stabilized, its stabilization by ligand may have a counterintuitive effect. The fifth site, identified from multi-ligand dynamics, was located partially within the PAS domain and partially in the disordered region. Binding the ligands could also prevent active complex formation, but we obtained a poor docking score for that site.
Considering the protein pocket structures, it is notable that the 1 and 4 sites were well-folded, whereas the 3 and 2 sites contained significant unfolded regions. It could indicate that sites 1 and 4 were the result of the false-positive site mapping and docking. On the other hand, the binding and stabilization of the unfolded polyprotein could prevent dimerization with HIF-1β and the formation of an active complex, indicating that their ligands act as protein-protein interactions (PPIs). Nevertheless, in vitro experiments and more complex modeling should be conducted to confirm or refute the existence of these binding sites.
Interestingly, that second site contains Ser 641. If the ligand actually stabilizes the ODD region close enough to Ser641, it could prevent its phosphorylation by mitogen-activated protein kinase, leading to more efficient chromosome region maintenance 1 (CRM1) dependent nuclear export of the CRM1 and less potent HIF-1 activity [45]. On the other hand, pocket 2 contains a part of the bHLH domain, in particular Lys32, for which a significant role in regulating HIF-1α activity was demonstrated. It could be proposed that inhibiting the DNA-binding domain would decrease HIF-1 activity. Nevertheless, it was described that the methylation of Lys32 serves as a signal for the recruitment of the ubiquitin ligase complex that targets HIF-1α for proteasomal degradation via a VHL-independent pathway [46]. As a result, inhibition of Lys34 methylation could enhance HIF-1 activity.
Moreover, due to the complex role of HIF-1α and its regulation of activity, it is difficult to say whether the other domains or essential regulatory amino acids are influenced by binding to the found sites. We considered only the ligand-binding regions of these pockets and proposed the corresponding effects on HIF-1 activity. Nevertheless, the impact on HIF-1α regulatory activity or protein interactions could be indirect, i.e., through allosteric regulation or the PPI pathway, and it is not possible to predict the result without direct cellular experiments.
In summary, we performed a folding analysis of HIF-1α alone and identified six potential binding sites, four of which yielded favorable docking scores. Two of these sites were located in a well-folded region.
3.5. HIF Active Complex Binding Hypothesis
Considering the second hypothesis, which assumes the compound acts as a DNA-binding inhibitor, the entire HIF-1 protein complex should be taken into account. It follows from the complex mechanism of action as well as the HIF-1α disorder structure; thus, if the ligands bind site 2 of HIF-1α, which is mostly formed by the unfolded polypeptide chain, it would rather possibly prevent dimerization with HIF-1β than direct HIF-1 activity.
3.5.1. Folding and Molecular Dynamics
The most complete modeling of the HIF-1α-HIF-1β complex was performed in [47]. The authors did not describe the obtained HIF-1α-HIF-1β complex in detail, but, based on [45], it can be concluded that the PAS and bHLH domains of the proteins are separated, which contradicts the experimental data from the protein crystals 4ZPR and 4H6J.
In an attempt to fold the HIF-1 protein, it was found that HIF-1α and HIF-1β, when folded together, resulted in both well-folded and unfolded regions, similar to what was observed with HIF-1α alone. Surprisingly, simultaneous folding of HIF-1α, HIF-1β, and p300 together led to a fine folded structure, where disordered regions were obtained to be packed into alpha-helices. Moreover, the DNA fragment to be added to the complex for folding was placed directly into the bHLH domain formed by HIF-1α and HIF-1β.
It should be noted that system growth, which initially contains disordered sequences, can lead to false positives due to a significant increase in local energy minima [47]. For this reason, we chose the complex with mutual spatial arrangement of HIF-1α and p300 chains, as it was obtained in 7LVS [48] for HIF-1α and CPB. An attempt to include Zn2+ in the model during the folding stage did not yield the correct ion positions according to 7LVS, so we used a complex without ions for further complex stabilization via a 300 ns molecular dynamics simulation (Supplementary Figure S3). As additional validation, it was considered that both PAS domains of HIF-1α and HIF-1β were well-folded, and their interface was consistent with the PDB 4H6J crystal structure. Moreover, the folded conformations of HIF-1α and HIF-1β parts, which formed the bHLH domain, were consistent with the corresponding structure of the 4ZPR PDB crystal. Based on this, we considered the obtained protein complex model to be more accurate (Supplementary Figure S4), than the model, as shown in [49].
Interestingly, IDRs in protein complexes are often organized as alpha-helices, making it difficult to assess the reliability of the folded model. Nevertheless, the well-folded regions of these three proteins were consistent with the corresponding crystal structures. After the folding and 300 ns relaxation dynamic, taking the most suitable snapshot based on the trajectory clustering, and analyzing the Ramachandran plots (Supplementary Figure S5).
3.5.2. Site Mapping and Docking
After the folding, the site mapping was performed. We proposed only the DNA-binding inhibitory mechanism, excluding any far allosteric sites, due to the system size and model complexity, as well as the fact that the folded complex could contain numerous inaccuracies that could not be resolved without experimental data.
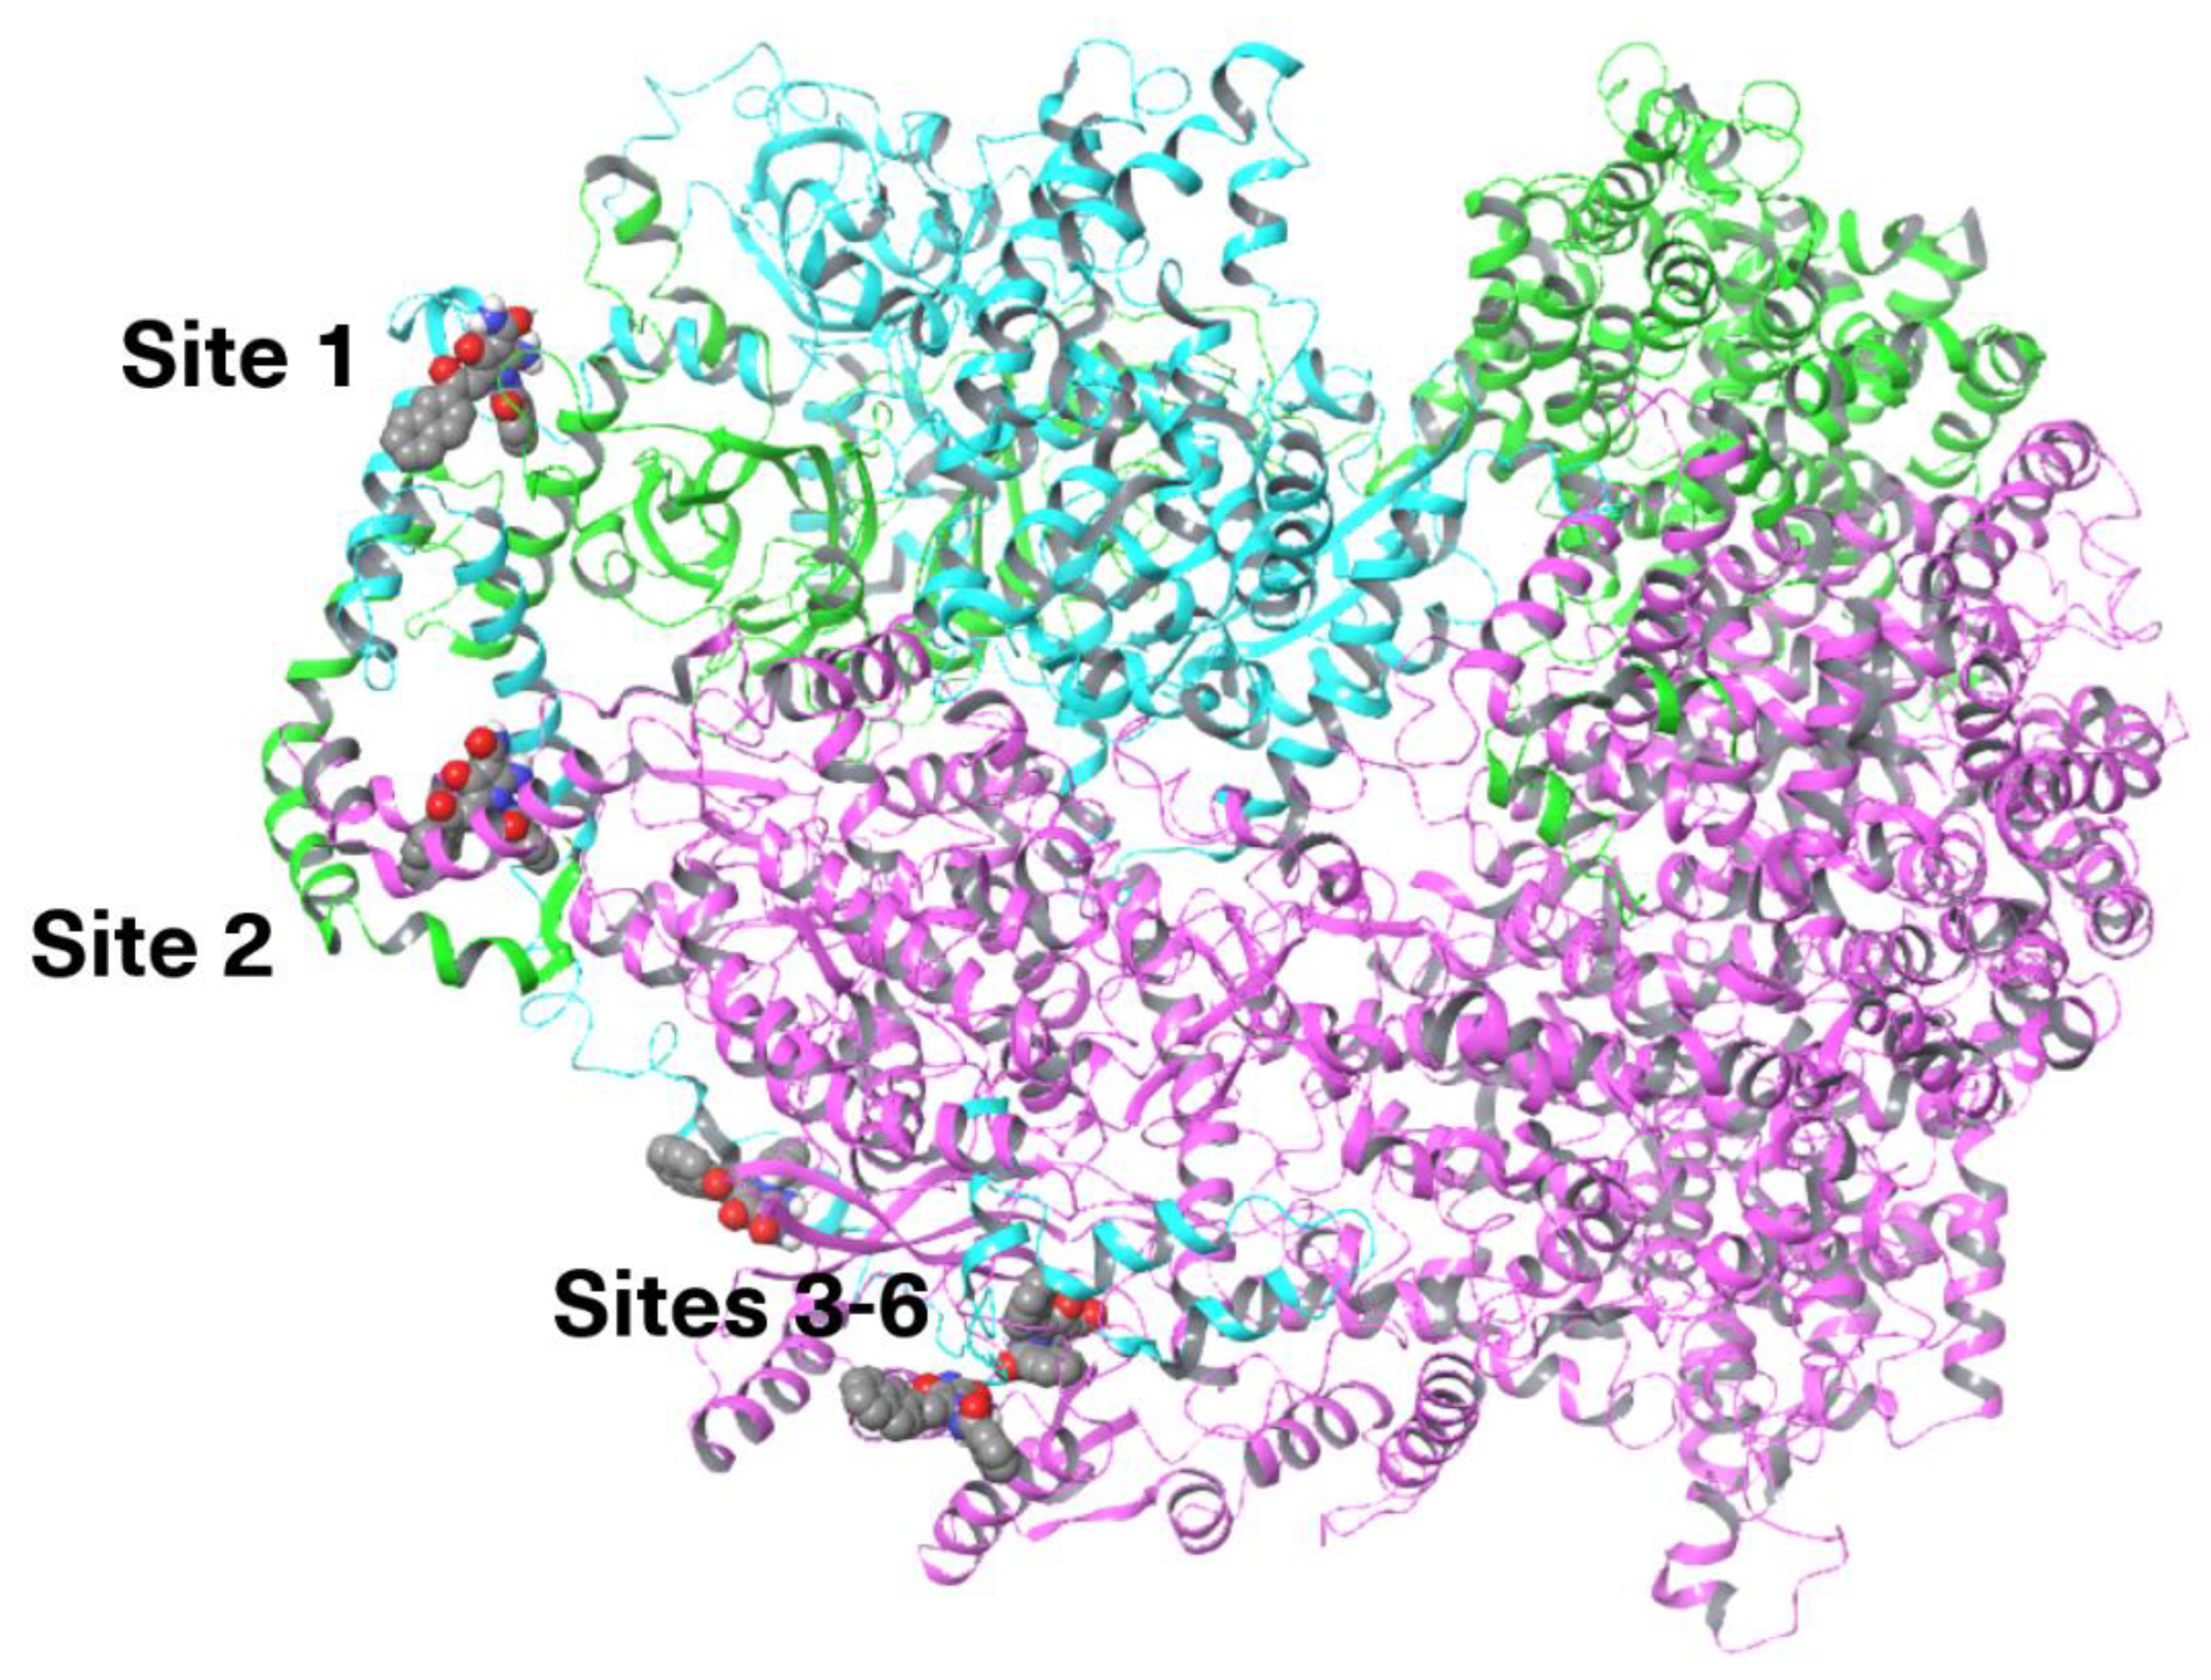
Thus, bHLH domains of HIF-1α and HIF-1β recognize and bind DNA, while the bHLH of HIF-1β is not the terminal protein domain. As it was obtained by folding, the downstream segment is located on the complex surface, suggesting its conformational flexibility and potential influence on DNA binding. Accordingly, we considered not only the bHLH domain of HIF-1α but also those of both HIF-1α and HIF-1β. Binding these domains could prevent ligands from directly binding DNA, or at least stabilize both a-helices, preventing them from assuming the conformation required for DNA interaction. Unfortunately, it was not specified whether the triple protein complex formed alone before DNA binding, or whether HIF-1α and HIF-1β first bind to the DNA, with the activator subsequently binding. Therefore, we attempted to model the first mechanism of inhibition. Using the SiteMap with the following docking, we identified two sites that contain bHLH domains in both proteins. The other four sites were found to be located closer to the N-terminus of HIF-1β (Figure 10). Due to the uncertainty of the HIF-1β conformations in these pockets, despite the good docking scores of 2-ANPC, we considered sites 2-6 as more questionable.
Considering the docking scores (Supplementary Table S3), as well as the folding results and partial validation by the PDB crystal structure, we concluded that only one site is more reliable for ligand binding within the whole active complex. Despite this, the two sites include both the HIF-1α and HIF-1β fragments and plausible docking results; however, we considered it less favorable due to its location in a significantly flexible and poorly pre-organized region.
4. Discussion
It is well known that HIF-1α is a common regulator of a broad spectrum of molecular pathways in solid tumors. In particular, this includes angiogenesis, glycolysis, cancer cell proliferation, growth, migration, and metastasis formation [50,51,52,53].
Besides the activities above, hypoxia can also promote the progression of human malignancies through the formation of an immune suppressive TME via activation of immunosuppressive cells, inhibiting the activities of cytotoxic T cells, including CD8 T-cells and NK cells, as well [54,55,56].
Additionally, the HIF-1α signaling pathway plays a vital role in metabolic reprogramming in solid tumors, including enhancing glucose uptake by positively regulating glycolytic enzymes. This pathway also regulates the expression of pyruvate dehydrogenase kinase, a well-known negative regulator of pyruvate dehydrogenase, leading to the conversion of pyruvate to lactate rather than acetyl-CoA. Of note, HIF-1α produces higher levels of reactive oxygen species in cancer cells by inhibiting the tricarboxylic acid cycle and by activating the pentose phosphate pathway [57,58].
Lastly, HIF-1α might also be involved in cancer resistance to chemo- and radiotherapies. Indeed, under hypoxic conditions, solid tumors rely on glycolysis for energy production, which results in an acidic microenvironment, making them less sensitive to chemotherapy and radiotherapy [59].
Therefore, targeting HIF-1α and its related proteins is currently considered a promising approach for developing new anticancer therapeutics and sensitizing chemo- and radioresistant malignancies to current therapies [60,61,62,63].
We show here for the first time that 2-aminopyrrole derivative 2-ANPC, exhibits high potency to interact with HIF-1α and downregulate its expression in multiple cancer cell lines in vitro. Our findings were further confirmed by in vivo studies showing a significant decrease in HIF-1α expression in breast cancer syngrafts. Of note, this decrease was also associated with reduced expression of VEGFR1 and 3 and correlated with the decreased tumor volumes after 2-ANPC treatment. Moreover, we found that 2-ANPC effectively downregulated HIF-1α at both the translational and transcriptional levels in the majority of cancer cells and promoted its proteasome-dependent degradation.
Among known small molecules that interact with HIF-1α and are relevantly similar to the studied 2-aminopyrrole derivatives are 2-methoxyestradiol, lificiguat, and acriflavine.
2-Methoxyestradiol (2-ME2) is a metabolite of estradiol possessing HIF-inhibiting activity [64]. Inhibition of hypoxia-inducible factor by 2-ME2 eliminates the previously described effects of HIF-1α expression, thereby reducing the growth rate of the primary tumor and, consequently, its angiogenesis. Equally important is the overcoming of tumor resistance to chemotherapy [64,65].
Lificiguat (YC-1) is a small molecule whose heterocyclic structure is known as one of the factors contributing to its HIF-inhibiting activity [66,67]. Acriflavine – an acridine dye with antiseptic properties – has demonstrated HIF-1-inhibiting properties, manifested in reduced tumor angiogenesis and an improved response to radiotherapy in brain tumors [68]. The aforementioned HIF inhibitors exhibit structural similarities to the 2-aminopyrrole derivative, 2-ANPC, used in the present study. Given the small size of the molecules, the presence of heterocyclic nitrogen-containing molecules, such as acriflavine and YC-1, appears significant. Furthermore, the biological activities of 2-aminopyrroles correlate with the action of 2-ME2. Indeed, 2- ANPC exhibited potent cytotoxic activities against a broad spectrum of epithelial cancer cell lines, including breast, lung, and prostate cancer. The anticancer activity of 2-ANPC was due to its ability to disrupt the microtubule network and inhibit tubulin polymerization [18,19]. In addition to strong cytotoxic and anti-proliferative activities of 2-ANPC, this 2-aminopyrrole derivative exhibited potent anti-tumor activity in a xenograft tumor model (HCC1806 cell line), demonstrating results comparable to those of the comparison drug paclitaxel [20].
Molecular docking demonstrated efficient binding of 2-ANPC to the colchicine-binding site on tubulin [18,19]. Similar interaction patterns and biological activities were observed for 2-ME2 [69,70]. Besides binding to tubulin, 2-ME2 also binds to the PAS-B domain of HIF-1α [71]. Thus, the examination of the HIF-1-inhibitory activities of 2-ANPC, with proven cytotoxic, anti-proliferative, and anti-tumor activities, is highly attractive and, if successful, would consider 2-aminopyrroles a novel class of potent anticancer agents with a dual mode of action, effectively targeting microtubule polymerization and inhibiting HIF-1 activity.
HIF-1α, HIF-1β, and CBP/p300 are nuclear proteins with multiple functions and contain intrinsically disordered regions. Only a few crystal structures of HIF-1α fragments have been reported; for example, PDB ID 4H6J [72] contains the PAS-B domain of the HIF-1α/HIF-1β heterodimer, and PDB ID 4ZPR [73] includes parts of the PAS-A, PAS-B, and bHLH domains from both subunits. Several crystal structures contain short sequences of HIF-1α, i.e., complexes of Factor Inhibiting HIF-1α or pVHL that selectively hydroxylate amino acids (Asn803 by HIF-1 or Pro402/Pro564 by pVHL), thereby inhibiting the activity of HIF-1α. In that, protein crystals up to 51 amino acids of HIF-1α are presented.
Thus, considering HIF-1α as a molecular target, based on its domain functions and its mechanism of action, we identified two possible molecular mechanisms and consequences of its interactions with 2-ANPC. First, small molecules could bind to domains that mediate protein–protein interactions, thereby preventing complex assembly. In particular, binding compounds to the PAS or CTAD of proteins could act as PPI inhibitors. Second, binding the bHLH domain of the entire complex, ligands can prevent DNA binding and inhibit direct HIF-1 activity. This might also interfere with HIF-1α’s stability and promote its degradation, thereby leading to a significant decrease in HIF-1α expression in 2-ANPC-treated cancer cells. Moreover, significant down-regulation of HIF-1α expression in 4T1 syngrafts in 2-ANPC-treated mice correlated with a substantial reduction in VEGFR1 and 3 expression, thereby illustrating that inhibition of HIF-1α signaling as a secondary anti-tumor mechanism of 2-ANPC, supplementing its potent cytotoxic and anti-proliferative activities in vivo.
Overall, we show here for the first time that 2-ANPC, the 2-aminopyrrole derivative, synthesized in our lab and previously shown as potent compound targeting microtubules and inducing tubulin depolymerization [18,19,20] also exhibits potent anti-HIF-1α activity. Besides the direct targeting of HIF-1α, a significant decrease in HIF-1α at both transcriptional and translational levels in 2-ANPC-treated cancer cells might be due to its previously demonstrated ability to alter microtubule dynamics and inhibit tubulin polymerization. Indeed, several reports indicate that translational initiation of HIF-1α mRNA is also regulated by microtubule dynamics, and the disruption of microtubule dynamics suppresses HIF-1α mRNA translation and leads to the accumulation of HIF-1α mRNA in the P-bodies [74]. For example, 2-ME, a derivative of estradiol that lacks estrogenic activity, was shown to inhibit microtubule polymerization and translation of HIF-1α mRNA. This was associated with its potent anti-tumor activity in vitro and in vivo by using various xenografted tumor models [75,76].
Collectively, our data shown here illustrate that 2-ANPC, the 2-aminopyrrole derivative synthesized in our lab, can serve as a scaffold for the development of successful chemotherapeutic anticancer agents with dual therapeutic modalities.
5. Conclusions
Overall, we show here that 2-ANPC, the 2-aminopyrrole derivative, synthesized in our lab and previously shown as potent compound targeting microtubules and inducing tubulin depolymerization also exhibits potent anti-HIF-1α activity. Besides the direct targeting of HIF-1α, a significant decrease in HIF-1α at both transcriptional and translational levels in 2-ANPC-treated cancer cells might be due to its previously demonstrated ability to alter microtubule dynamics and inhibit tubulin polymerization. This in turn illustrate that 2-ANPC, the 2-aminopyrrole derivative synthesized in our lab, can serve as a scaffold for the development of successful chemotherapeutic anticancer agents with dual therapeutic modalities.
Supplementary Materials
The following supporting information can be downloaded at the website of this paper posted on Preprints.org, Figure S1: Anti-proliferative and pro-apoptotic activity of 2-ANPC in 4T1 cell line; Figure S2: (A) Root mean square deviation of atomic positions plot for the hypoxia-inducible factor (HIF)-1α after its modelling. (B) Ramachandran plot for the chosen snapshot at 99.6 ns; Figure S3. Root mean square deviation of atomic positions plot for the hypoxia-inducible factor (HIF)-1α for the multi-ligand MD simulations; Figure S4. (A) pLDDT confidence scores for predicted HIF-1 protein complex. (B) Expected Position Error for the predicted HIF-1 protein complex; Figure S5. Ramachandran plot for the chosen median of the MD clusters; Table S1: Primers for quantitative polymerase chain reaction; Table S2. Docking results for 2-ANPC in HIF-1α; Table S3. Docking results for 2-ANPC in HIF-1.
Author Contributions
Conceptualization Svetlana Zykova, Sergei Boichuk and Sophia Borisevich; methodology Sergei Boichuk, Sophia Borisevich and Evgenii Mozhaitsev; resources Sergei Boichuk and Nazim Igidov; investigation, data analysis, visualization Sergei Boichuk, Tatyana Gessel, Aigul Galembikova, Ekaterina Mikheeva, and Evgenii Mozhaitsev; biological investigation – Sergei Boichuk, Tatyana Gessel, Emilia Egorova, Pavel Kopnin, Alina Galyautdinova and Aigul Galembikova; writing—original draft preparation Sergei Boichuk, Evgenii Mozhaitsev and Maxim Shustov; writing—review and editing Sergei Boichuk and Maxim Shustov.
Funding
This research was funded by the Ministry of Health of the Russian Federation, in case of state assignment ZUNI-2025-0004 “Development of targeted drug candidates with high cytotoxic and antitumor activity based on 2-aminopyrroles”. The molecular modeling was performed within the framework of the state assignment of the Ufa Institute of Chemistry UFRC RAS Kinetic, Spectral- Luminescent, and Theoretical Investigation of Key Intermediates in Chemical and Biochemical Oxidation Processes 125020601626–9. Biological studies were funded by Russian Science Foundation (grant # 25-15-00086). The authors are grateful to the theoretical group “Quanta and Dynamics” for theoretical study https://monrel.ru/about_en/.
Institutional Review Board Statement
The animal study protocol was approved by the Ethics Committee the PSPA (protocol No. 3, application No. 03-2021-n-zh dated 11/10/2021.
Informed Consent Statement
Not applicable.
Acknowledgments
The authors acknowledge the Supercomputing Center of the Novosibirsk State University (http://nusc.nsu.ru) for providing computational resources.
Conflicts of Interest
The authors declare no conflicts of interest.
Abbreviations
The following abbreviations are used in this manuscript:
| 2-ANPC | 2-amino-1-benzamido-5-(2-(naphthalene-2-yl)-2-oxoethylidene)-4-oxo-4,5-dihydro-1-H-pyrrole-3-carboxamide |
| 2-ME2 | 2-Methoxyestradiol |
| ARNT/HIF-1 β | Aryl hydrocarbon receptor nuclear translocator/Hypoxia-inducible factor-1β |
| bHLH | basic helix–loop–helix |
| CBP | CREB-binding protein |
| CRM1 | Chromosome region maintenance 1 |
| CTAD | C-terminal transactivation domain |
| GAPDH | Glyceraldehyde-3-phosphate dehydrogenase |
| H&E | Hematoxylin and eosin |
| HDAC | Class II histone deacetylase |
| HIF-1α | Hypoxia-inducible factor-1α |
| HSP90 | Heat shock protein 90 |
| ID | Inhibitory Domain |
| IDRs | Intrinsically Disordered Regions |
| IFD score | Energy spent on formation of the laying of the compound in the binding site and binding energy of ligand and protein |
| IHC | Immunohistochemical |
| MTA | Microtubule-targeting agents |
| NAMD | Nanoscale Molecular Dynamics |
| NMR | Nuclear Magnetic Resonance |
| NSCLC | Non-small cell lung cancer |
| NTAD | N-terminal transcription activation domain |
| ODD | Oxygen-dependent degradation |
| PARP | Poly(ADP)-ribose polymerase |
| PAS | Per-ARNT-Sim domain |
| PDB | Protein data bank |
| PPI | Protein-protein interaction |
| PTX | Paclitaxel |
| pVHL | von Hippel–Lindau tumor suppressor protein |
| RT-PCR | Real-time polymerase chain reaction |
| SD | Standard deviation |
| TMA | Tissue microarrays |
| TME | Tumor microenvironment |
| TNBC | Triple-negative breast cancer |
| VEGF | Vascular endothelial growth factor |
| VEGFR | Vascular endothelial growth factor receptor |
| VMD | Visual Molecular Dynamics |
| YC-1 | Lificiguat |
References
- Semenza, G.L. HIF-1 and Mechanisms of Hypoxia Sensing. Curr Opin Cell Biol 2001, 13, 167–171. [CrossRef]
- Sebestyén, A.; Kopper, L.; Dankó, T.; Tímár, J. Hypoxia Signaling in Cancer: From Basics to Clinical Practice. Pathology and Oncology Research 2021, 27, 1609802. [CrossRef]
- Rashid, M.; Zadeh, L.R.; Baradaran, B.; Molavi, O.; Ghesmati, Z.; Sabzichi, M.; Ramezani, F. Up-down Regulation of HIF-1α in Cancer Progression. Gene 2021, 798, 145796. [CrossRef]
- Zhao, Y.; Xing, C.; Deng, Y.; Ye, C.; Peng, H. HIF-1α Signaling: Essential Roles in Tumorigenesis and Implications in Targeted Therapies. Genes Dis 2024, 11, 234–251. [CrossRef]
- Zhang, C.; Liu, J.; Wang, J.; Zhang, T.; Xu, D.; Hu, W.; Feng, Z. The Interplay Between Tumor Suppressor p53 and Hypoxia Signaling Pathways in Cancer. Front. Cell Dev. Biol. 2021, 9, 648808. [CrossRef]
- Zhang, C.; Liu, J.; Xu, D.; Zhang, T.; Hu, W.; Feng, Z. Gain-of-Function Mutant P53 in Cancer Progression and Therapy. J Mol Cell Biol 2020, 12, 674–687. [CrossRef]
- Alam, M.M.; Fermin, J.M.; Knackstedt, M.; Noonan, M.J.; Powell, T.; Goodreau, L.; Daniel, E.K.; Rong, X.; Moore-Medlin, T.; Khandelwal, A.R.; et al. Everolimus downregulates STAT3/HIF-1α/VEGF pathway to inhibit angiogenesis and lymphangiogenesis in TP53 mutant head and neck squamous cell carcinoma (HNSCC). Oncotarget 2023, 14, 85–95. [CrossRef]
- Kilic, M.; Kasperczyk, H.; Fulda, S.; Debatin, K.M. Role of Hypoxia Inducible Factor-1 Alpha in Modulation of Apoptosis Resistance. Oncogene 2007, 26, 2027–2038. [CrossRef]
- Qannita, R.A.; Alalami, A.I.; Harb, A.A.; Aleidi, S.M.; Taneera, J.; Abu-Gharbieh, E.; El-Huneidi, W.; Saleh, M.A.; Alzoubi, K.H.; Semreen, M.H.; et al. Targeting Hypoxia-Inducible Factor-1 (HIF-1) in Cancer: Emerging Therapeutic Strategies and Pathway Regulation. Pharmaceuticals 2024, 17, 195. [CrossRef]
- Shirai, Y.; Chow, C.C.T.; Kambe, G.; Suwa, T.; Kobayashi, M.; Takahashi, I.; Harada, H.; Nam, J.M. An overview of the recent development of anticancer agents targeting the hif-1 transcription factor. Cancers 2021, 13, 2813. [CrossRef]
- Seredinski, S.; Boos, F.; Günther, S.; Oo, J.A.; Warwick, T.; Izquierdo Ponce, J.; Lillich, F.F.; Proschak, E.; Knapp, S.; Gilsbach, R.; et al. DNA topoisomerase inhibition with the HIF inhibitor acriflavine promotes transcription of lncRNAs in endothelial cells. Mol. Ther. Nucl. Acids 2022, 27, 1023–1035. [CrossRef]
- Xiang, L.; Gilkes, D.M.; Chaturvedi, P.; Luo, W.; Hu, H.; Takano, N.; Liang, H.; Semenza, G.L. Ganetespib blocks HIF-1 activity and inhibits tumor growth, vascularization, stem cell maintenance, invasion, and metastasis in orthotopic mouse models of triple-negative breast cancer. J. Mol. Med. 2014, 92, 151–164. [CrossRef]
- Takamori, H.; Yamasaki, T.; Kitadai, R.; Minamishima, Y.A.; Nakamura, E. Development of drugs targeting hypoxia-inducible factor against tumor cells with VHL mutation: Story of 127 years. Cancer Sci. 2023, 114, 1208–1217. [CrossRef]
- Kim, S.H.; Jeong, J.W.; Park, J.A.; Lee, J.W.; Seo, J.H.; Jung, B.K.; Bae, M.K.; Kim, K.W. Regulation of the HIF-1alpha stability by histone deacetylases. Oncol. Rep. 2007, 17, 647–651.
- Schoepflin, Z.R.; Shapiro, I.M.; Risbud, M.V. Class I and IIa HDACs Mediate HIF-1alpha Stability Through PHD2-Dependent Mechanism, While HDAC6, a Class IIb Member, Promotes HIF-1alpha Transcriptional Activity in Nucleus Pulposus Cells of the Intervertebral Disc. J. Bone Miner. Res. 2016, 31, 1287–1299. [CrossRef]
- Zhang, C.; Yang, C.; Feldman, M.J.; Wang, H.; Pang, Y.; Maggio, D.M.; Zhu, D.; Nesvick, C.L.; Dmitriev, P.; Bullova, P.; et al. Vorinostat suppresses hypoxia signaling by modulating nuclear translocation of hypoxia inducible factor 1 alpha. Oncotarget 2017, 8, 56110–56125. [CrossRef]
- Tanaka, T.; Yamaguchi, J.; Shoji, K.; Nangaku, M. Anthracycline inhibits recruitment of hypoxia-inducible transcription factors and suppresses tumor cell migration and cardiac angiogenic response in the host. J. Biol. Chem. 2012, 287, 34866–34882. [CrossRef]
- Galembikova A.R., Dunaev P.D., Bikinieva F.F., Mustafin I.G., Kopnin P.B., Zykova S.S., Mukhutdinova F.I., Sarbazyan E.A., Boichuk S.V. Mechanisms of cytotoxic activity of pyrrole-carboxamides against multidrug-resistant tumor cell sublines. Usp. mol. onkol. 2023, 10, 59-71. [CrossRef]
- Boichuk, S.; Galembikova, A.; Syuzov, K.; Dunaev, P.; Bikinieva, F.; Aukhadieva, A.; Zykova, S.; Igidov, N.; Gankova, K.; Novikova, M.; et al. The Design, Synthesis, and Biological Activities of Pyrrole-Based Carboxamides: The Novel Tubulin Inhibitors Targeting the Colchicine-Binding Site. Molecules 2021, 26, 5780. [CrossRef]
- Boichuk S.V., Zykova S.S.; et al. 2-amino-1-benzamido-5-[2-(naphthalene-2-yl)-2-oxoethylidene]-4-oxo-4,5-dihydro-1h-pyrrole-3-carboxamide and 2-amino-5-(3,3-dimethyl-2-oxobutylidene)-4-oxo-1-[2-(phenylamino)benzamido]-4,5-dihydro-1h-pyrrole-3-carboxamide inhibiting the process of polymerisation of tubulin and exhibiting cytotoxic and antitumour activity against human epithelial tumours. RU 2777209 C1, 01.08.2022.
- Kizimova, I.A.; Igidov, N.M.; Kiselev, M.A.; Dmitriev, M. V.; Chashchina, S. V.; Siutkina, A.I. Synthesis of New 2-Aminopyrrole Derivatives by Reaction of Furan-2,3-Diones 3-Acylhydrazones with CH-Nucleophiles. Russ J Gen Chem 2020, 90, 182–186. [CrossRef]
- Boichuk, S.; Galembikova, A.; Dunaev, P.; Valeeva, E.; Shagimardanova, E.; Gusev, O.; Khaiboullina, S. A Novel Receptor Tyrosine Kinase Switch Promotes Gastrointestinal Stromal Tumor Drug Resistance. Molecules 2017, 22, 2152. [CrossRef]
- Jumper, J.; Evans, R.; Pritzel, A.; Green, T.; Figurnov, M.; Ronneberger, O.; Tunyasuvunakool, K.; Bates, R.; Žídek, A.; Potapenko, A.; et al. Highly Accurate Protein Structure Prediction with AlphaFold. Nature 2021, 596, 583–589. [CrossRef]
- Mirdita, M.; Schütze, K.; Moriwaki, Y.; Heo, L.; Ovchinnikov, S.; Steinegger, M. ColabFold: Making Protein Folding Accessible to All. Nat. Methods 2022, 19, 679–682. [CrossRef]
- Humphrey, W.; Dalke, A.; Schulten, K. VMD: Visual Molecular Dynamics. J. Mol. Graph. 1996, 14, 33–38. [CrossRef]
- Phillips, J.C.; Hardy, D.J.; Maia, J.D.C.; Stone, J.E.; Ribeiro, J. V.; Bernardi, R.C.; Buch, R.; Fiorin, G.; Hénin, J.; Jiang, W.; et al. Scalable Molecular Dynamics on CPU and GPU Architectures with NAMD. J. Chem. Phys. 2020, 153. [CrossRef]
- Phillips, J.C.; Braun, R.; Wang, W.; Gumbart, J.; Tajkhorshid, E.; Villa, E.; Chipot, C.; Skeel, R.D.; Kalé, L.; Schulten, K. Scalable Molecular Dynamics with NAMD. J. Comput. Chem. 2005, 26, 1781–1802. [CrossRef]
- Best, R.B.; Zhu, X.; Shim, J.; Lopes, P.E.M.; Mittal, J.; Feig, M.; MacKerell, A.D. Optimization of the Additive CHARMM All-Atom Protein Force Field Targeting Improved Sampling of the Backbone ϕ, ψ and Side-Chain χ 1 and χ 2 Dihedral Angles. J. Chem. Theory Comput. 2012, 8, 3257–3273. [CrossRef]
- MacKerell, A.D.; Feig, M.; Brooks, C.L. Improved Treatment of the Protein Backbone in Empirical Force Fields. J. Am. Chem. Soc. 2004, 126, 698–699. [CrossRef]
- MacKerell, A.D.; Bashford, D.; Bellott, M.; Dunbrack, R.L.; Evanseck, J.D.; Field, M.J.; Fischer, S.; Gao, J.; Guo, H.; Ha, S.; et al. All-Atom Empirical Potential for Molecular Modeling and Dynamics Studies of Proteins. J. Phys. Chem. B 1998, 102, 3586–3616. [CrossRef]
- Bugnon, M.; Goullieux, M.; Röhrig, U.F.; Perez, M.A.S.; Daina, A.; Michielin, O.; Zoete, V. SwissParam 2023: A Modern Web-Based Tool for Efficient Small Molecule Parametrization. J. Chem. Inf. Model. 2023, 63, 6469–6475. [CrossRef]
- Allouche, A. Software News and Updates Gabedit — A Graphical User Interface for Computational Chemistry Softwares. J. Comput. Chem. 2012, 32, 174–182. [CrossRef]
- Abramson, J.; Adler, J.; Dunger, J.; Evans, R.; Green, T.; Pritzel, A.; Ronneberger, O.; Willmore, L.; Ballard, A.J.; Bambrick, J.; et al. Accurate Structure Prediction of Biomolecular Interactions with AlphaFold 3. Nature 2024, 630, 493–500. [CrossRef]
- Bowers, K.J.; Chow, D.E.; Xu, H.; Dror, R.O.; Eastwood, M.P.; Gregersen, B.A.; Klepeis, J.L.; Kolossvary, I.; Moraes, M.A.; Sacerdoti, F.D.; et al. Scalable Algorithms for Molecular Dynamics Simulations on Commodity Clusters. In Proceedings of the ACM/IEEE SC 2006 Conference (SC’06); IEEE, November 2006; pp. 43–43.
- Lu, C.; Wu, C.; Ghoreishi, D.; Chen, W.; Wang, L.; Damm, W.; Ross, G.A.; Dahlgren, M.K.; Russell, E.; Von Bargen, C.D.; et al. OPLS4: Improving Force Field Accuracy on Challenging Regimes of Chemical Space. J. Chem. Theory Comput. 2021, 17, 4291–4300. [CrossRef]
- Jacobson, M.P.; Pincus, D.L.; Rapp, C.S.; Day, T.J.F.; Honig, B.; Shaw, D.E.; Friesner, R.A. A Hierarchical Approach to All-Atom Protein Loop Prediction. Proteins Struct. Funct. Genet. 2004, 55, 351–367. [CrossRef]
- Jacobson, M.P.; Friesner, R.A.; Xiang, Z.; Honig, B. On the Role of the Crystal Environment in Determining Protein Side-Chain Conformations. J. Mol. Biol. 2002, 320, 597–608. [CrossRef]
- Halgren, T. New Method for Fast and Accurate Binding-site Identification and Analysis. Chem. Biol. Drug Des. 2007, 69, 146–148. [CrossRef]
- Halgren, T.A. Identifying and Characterizing Binding Sites and Assessing Druggability. J. Chem. Inf. Model. 2009, 49, 377–389. [CrossRef]
- Sherman, W.; Day, T.; Jacobson, M.P.; Friesner, R.A.; Farid, R. Novel Procedure for Modeling Ligand/Receptor Induced Fit Effects. J. Med. Chem. 2006, 49, 534–553. [CrossRef]
- Farid, R.; Day, T.; Friesner, R.A.; Pearlstein, R.A. New Insights about HERG Blockade Obtained from Protein Modeling, Potential Energy Mapping, and Docking Studies. Bioorg. Med. Chem. 2006, 14, 3160–3173. [CrossRef]
- Sherman, W.; Beard, H.S.; Farid, R. Use of an Induced Fit Receptor Structure in Virtual Screening. Chem. Biol. Drug Des. 2006, 67, 83–84. [CrossRef]
- Sánchez-Puig, N.; Veprintsev, D.B.; Fersht, A.R. Binding of Natively Unfolded HIF-1α ODD Domain to P53. Mol. Cell 2005, 17, 11–21. [CrossRef]
- Nyqvist, I.; Dogan, J. Characterization of the Dynamics and the Conformational Entropy in the Binding between TAZ1 and CTAD-HIF-1α. Sci. Rep. 2019, 9, 20–22. [CrossRef]
- Chen, H.; Ma, D.; Yue, F.; Qi, Y.; Dou, M.; Cui, L.; Xing, Y. The Potential Role of Hypoxia-Inducible Factor-1 in the Progression and Therapy of Central Nervous System Diseases. Curr. Neuropharmacol. 2021, 20, 1651–1666. [CrossRef]
- Kim, Y.; Nam, H.J.; Lee, J.; Park, D.Y.; Kim, C.; Yu, Y.S.; Kim, D.; Park, S.W.; Bhin, J.; Hwang, D.; et al. Methylation-Dependent Regulation of HIF-1α Stability Restricts Retinal and Tumour Angiogenesis. Nat. Commun. 2016, 7. [CrossRef]
- Dewi, F.R.; Fatchiyah, F. Methylation Impact Analysis of Erythropoietin (EPO) Gene to Hypoxia Inducible Factor-1α (HIF-1α) Activity. Bioinformation 2013, 9, 782–787. [CrossRef]
- Appling, F.D.; Berlow, R.B.; Stanfield, R.L.; Dyson, H.J.; Wright, P.E. The Molecular Basis of Allostery in a Facilitated Dissociation Process. Structure 2021, 29, 1327-1338.e5. [CrossRef]
- Seoane, B.; Carbone, A. Soft Disorder Modulates the Assembly Path of Protein Complexes. PLoS Comput. Biol. 2022, 18, 1–19. [CrossRef]
- Zhang, T.; Kastrenopoulou, A.; Larrouture, Q.; Athanasou, N.A.; Knowles, H.J. Angiopoietin-like 4 promotes osteosarcoma cell proliferation and migration and stimulates osteo-clastogenesis. BMC Cancer 2018, 18, 536. [CrossRef]
- Maxwell, P.H. The HIF pathway in cancer. Semin. Cell Dev. Biol. 2005, 16, 523–53. [CrossRef]
- Wan, J.; Chai, H.; Yu, Z.; Ge, W.; Kang, N.; Xia, W.; Che, Y. HIF-1α effects on angiogenic potential in human small cell lung carcinoma. J. Exp. Clin. Cancer Res. 2011, 30, 77. [CrossRef]
- Magar, A.G.; Morya, V.K.; Kwak, M.K.; Oh, J.U.; Noh, K.C. A Molecular Perspective on HIF-1α and Angiogenic Stimulator Networks and Their Role in Solid Tumors: An Update. Int. J. Mol. Sci. 2024, 25, 3313. [CrossRef]
- Voron, T.; Marcheteau, E.; Pernot, S.; Colussi, O.; Tartour, E.; Taieb, J.; Terme, M. Control of the immune response by pro-angiogenic factors. Front. Oncol. 2014, 4, 70. [CrossRef]
- Chen, Y.; Song, Y.; Du, W.; Gong, L.; Chang, H.; Zou, Z. Tumor-associated macrophages: An accomplice in solid tumor progression. J. Biomed. Sci. 2019, 26, 78. [CrossRef]
- Rani, S.; Roy, S.; Singh, M.; Kaithwas, G. Regulation of Transactivation at C-TAD Domain of HIF-1α by Factor-Inhibiting HIF-1α (FIH-1): A Potential Target for Therapeutic Interven-tion in Cancer. Oxid. Med. Cell. Longev. 2022, 2022, 2407223. [CrossRef]
- Nagao, A.; Kobayashi, M.; Koyasu, S.; Chow, C.C.T.; Harada, H. HIF-1-Dependent Repro-gramming of Glucose Metabolic Pathway of Cancer Cells and Its Therapeutic Significance. Int. J. Mol. Sci. 2019, 20, 238. [CrossRef]
- Magar, A.G.; Morya, V.K.; Kwak, M.K.; Oh, J.U.; Noh, K.C. A Molecular Perspective on HIF-1α and Angiogenic Stimulator Networks and Their Role in Solid Tumors: An Update. Int. J. Mol. Sci. 2024, 25, 3313. [CrossRef]
- Dong, W.; Keibler, M.A.; Stephanopoulos, G. Review of metabolic pathways activated in cancer cells as determined through isotopic labeling and network analysis. Metab. Eng. 2017, 43, 113–124. [CrossRef]
- Masoud, G.N.; Li, W. HIF-1α pathway: Role, regulation and intervention for cancer thera-py. Acta Pharm. Sin. B 2015, 5, 378–389. [CrossRef]
- Roy, S.; Kumaravel, S.; Sharma, A.; Duran, C.L.; Bayless, K.J.; Chakraborty, S. Hypoxic tumor microenvironment: Implications for cancer therapy. Exp. Biol. Med. 2020, 245, 1073–1086. [CrossRef]
- Rani, S.; Roy, S.; Singh, M.; Kaithwas, G. Regulation of Transactivation at C-TAD Domain of HIF-1α by Factor-Inhibiting HIF-1α (FIH-1): A Potential Target for Therapeutic Intervention in Cancer. Oxid. Med. Cell. Longev. 2022, 2022, 2407223. [CrossRef]
- Zhao, Y.; Xing, C.; Deng, Y.; Ye, C.; Peng, H. HIF-1α signaling: Essential roles in tumorigenesis and implications in targeted therapies. Genes Dis. 2024, 11, 234–251. [CrossRef]
- Ricker, J.L.; Chen, Z.; Yang, X.P.; Pribluda, V.S.; Swartz, G.M.; Van Waes, C. 2-Methoxyestradiol Inhibits Hypoxia-Inducible Factor 1α, Tumor Growth, and Angiogenesis and Augments Paclitaxel Efficacy in Head and Neck Squamous Cell Carcinoma. Clinical Cancer Research 2004, 10, 8665–8673. [CrossRef]
- Attia, Y.M.; Mokhlis, H.A.; Ismail, A.; Doghish, A.S.; Sobhy, M.H.; Hassanein, S.S.; El-Dakroury, W.A.; Mariee, A.D.; Salama, S.A.; Sharaky, M. 2-Methoxyestradiol Sensitizes Tamoxifen-Resistant MCF-7 Breast Cancer Cells via Downregulating HIF-1α. Medical Oncology 2024, 41, 1–10. [CrossRef]
- Ouyang, C.; Zhang, J.; Lei, X.; Xie, Z.; Liu, X.; Li, Y.; Huang, S.; Wang, Z.; Tang, G. Advances in Antitumor Research of HIF-1α Inhibitor YC-1 and Its Derivatives. Bioorg Chem 2023, 133, 106400. [CrossRef]
- Yu, K.H.; Hung, H.Y. Synthetic Strategy and Structure–Activity Relationship (SAR) Studies of 3-(5′-Hydroxymethyl-2′-Furyl)-1-Benzyl Indazole (YC-1, Lificiguat): A Review. RSC Adv 2021, 12, 251–264. [CrossRef]
- Mangraviti, A.; Raghavan, T.; Volpin, F.; Skuli, N.; Gullotti, D.; Zhou, J.; Asnaghi, L.; Sankey, E.; Liu, A.; Wang, Y.; et al. HIF-1α- Targeting Acriflavine Provides Long Term Survival and Radiological Tumor Response in Brain Cancer Therapy. Scientific Reports 2017, 7, 1–13. [CrossRef]
- Mabjeesh, N.J.; Escuin, D.; LaVallee, T.M.; Pribluda, V.S.; Swartz, G.M.; Johnson, M.S.; Willard, M.T.; Zhong, H.; Simons, J.W.; Giannakakou, P. 2ME2 Inhibits Tumor Growth and Angiogenesis by Disrupting Microtubules and Dysregulating HIF. Cancer Cell 2003, 3, 363–375. [CrossRef]
- D’Amato, R.J.; Lin, C.M.; Flynn, E.; Folkman, J.; Hamel, E. 2-Methoxyestradiol, an Endogenous Mammalian Metabolite, Inhibits Tubulin Polymerization by Interacting at the Colchicine Site. Proceedings of the National Academy of Sciences 1994, 91, 3964–3968. [CrossRef]
- Poch, A.; Villanelo, F.; Henriquez, S.; Kohen, P.; Muñoz, A.; Strauss, J.F.; Devoto, L. Molecular Modelling Predicts That 2-Methoxyestradiol Disrupts HIF Function by Binding to the PAS-B Domain. Steroids 2019, 144, 21–29. [CrossRef]
- Cardoso, R.; Love, R.; Nilsson, C.L.; Bergqvist, S.; Nowlin, D.; Yan, J.; Liu, K.K.C.; Zhu, J.; Chen, P.; Deng, Y.L.; et al. Identification of Cys255 in HIF-1α as a Novel Site for Development of Covalent Inhibitors of HIF-1α/ARNT PasB Domain Protein-Protein Interaction. Protein Sci. 2012, 21, 1885–1896. [CrossRef]
- Wu, D.; Potluri, N.; Lu, J.; Kim, Y.; Rastinejad, F. Structural Integration in Hypoxia-Inducible Factors. Nature 2015, 524, 303–308. [CrossRef]
- Carbonaro, M.; O’Brate, A.; Giannakakou, P. Microtubule disruption targets HIF-1alpha mRNA to cytoplasmic P-bodies for translational repression. J. Cell Biol. 2011, 192, 83–99. [CrossRef]
- Mabjeesh, N.J.; Escuin, D.; LaVallee, T.M.; Pribluda, V.S.; Swartz, G.M.; Johnson, M.S.; Willard, M.T.; Zhong, H.; Simons, J.W.; Giannakakou, P. 2ME2 inhibits tumor growth and angiogenesis by disrupting microtubules and dysregulating HIF. Cancer Cell 2003, 3, 363–375. [CrossRef]
- LaVallee, T.M.; Burke, P.A.; Swartz, G.M.; Hamel, E.; Agoston, G.E.; Shah, J.; Suwandi, L.; Hanson, A.D.; Fogler, W.E.; Sidor, C.F.; et al. Significant antitumor activity in vivo following treatment with the microtubule agent ENMD-1198. Mol. Cancer Ther. 2008, 7, 1472–1482. [CrossRef]
Scheme 1.
Scheme of synthesis of 2-ANPC.
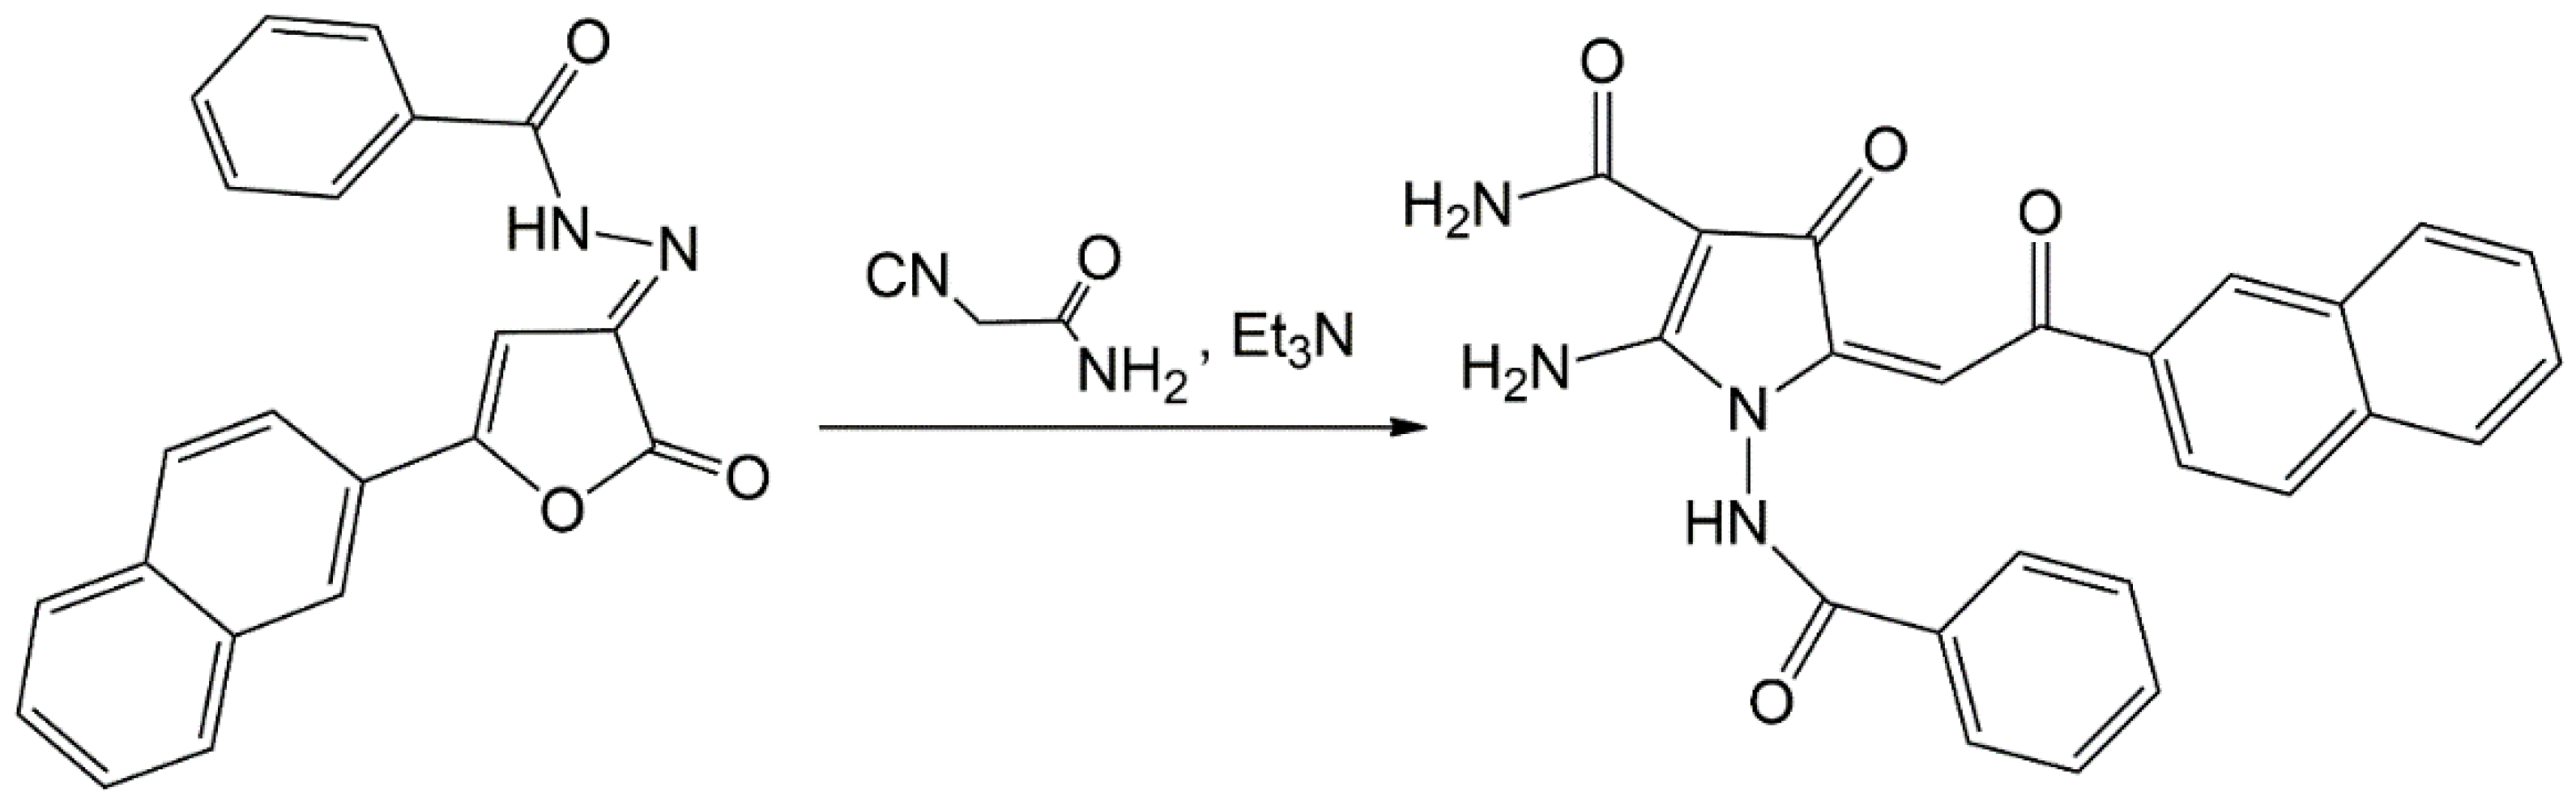
Figure 1.
Anti-proliferative effects of 2-ANPC in epithelial cancer cell lines. Changes in growth kinetics of HCC1806, MDA-MB-231, H1299, and PC-3 cells treated with 2-ANPC, PTX (positive control), and solvent DMSO (negative control). Cells (0.5 × 10⁵/ml) were seeded into the wells of an E-Plate L8 PET cassette and installed in the iCELLigence cell growth kinetics system (ACEA Biosciences, San Diego, CA, USA). Cells were allowed to attach and grow for the following 24 h. Afterwards, 2-ANPC, PTX, or DMSO were introduced into the cell culture. Cell proliferation index values were recorded every hour throughout the experiment. RTCA Software version 1.0 (ACEA Biosciences, Inc., San Diego, CA, USA) was used to analyze the data.
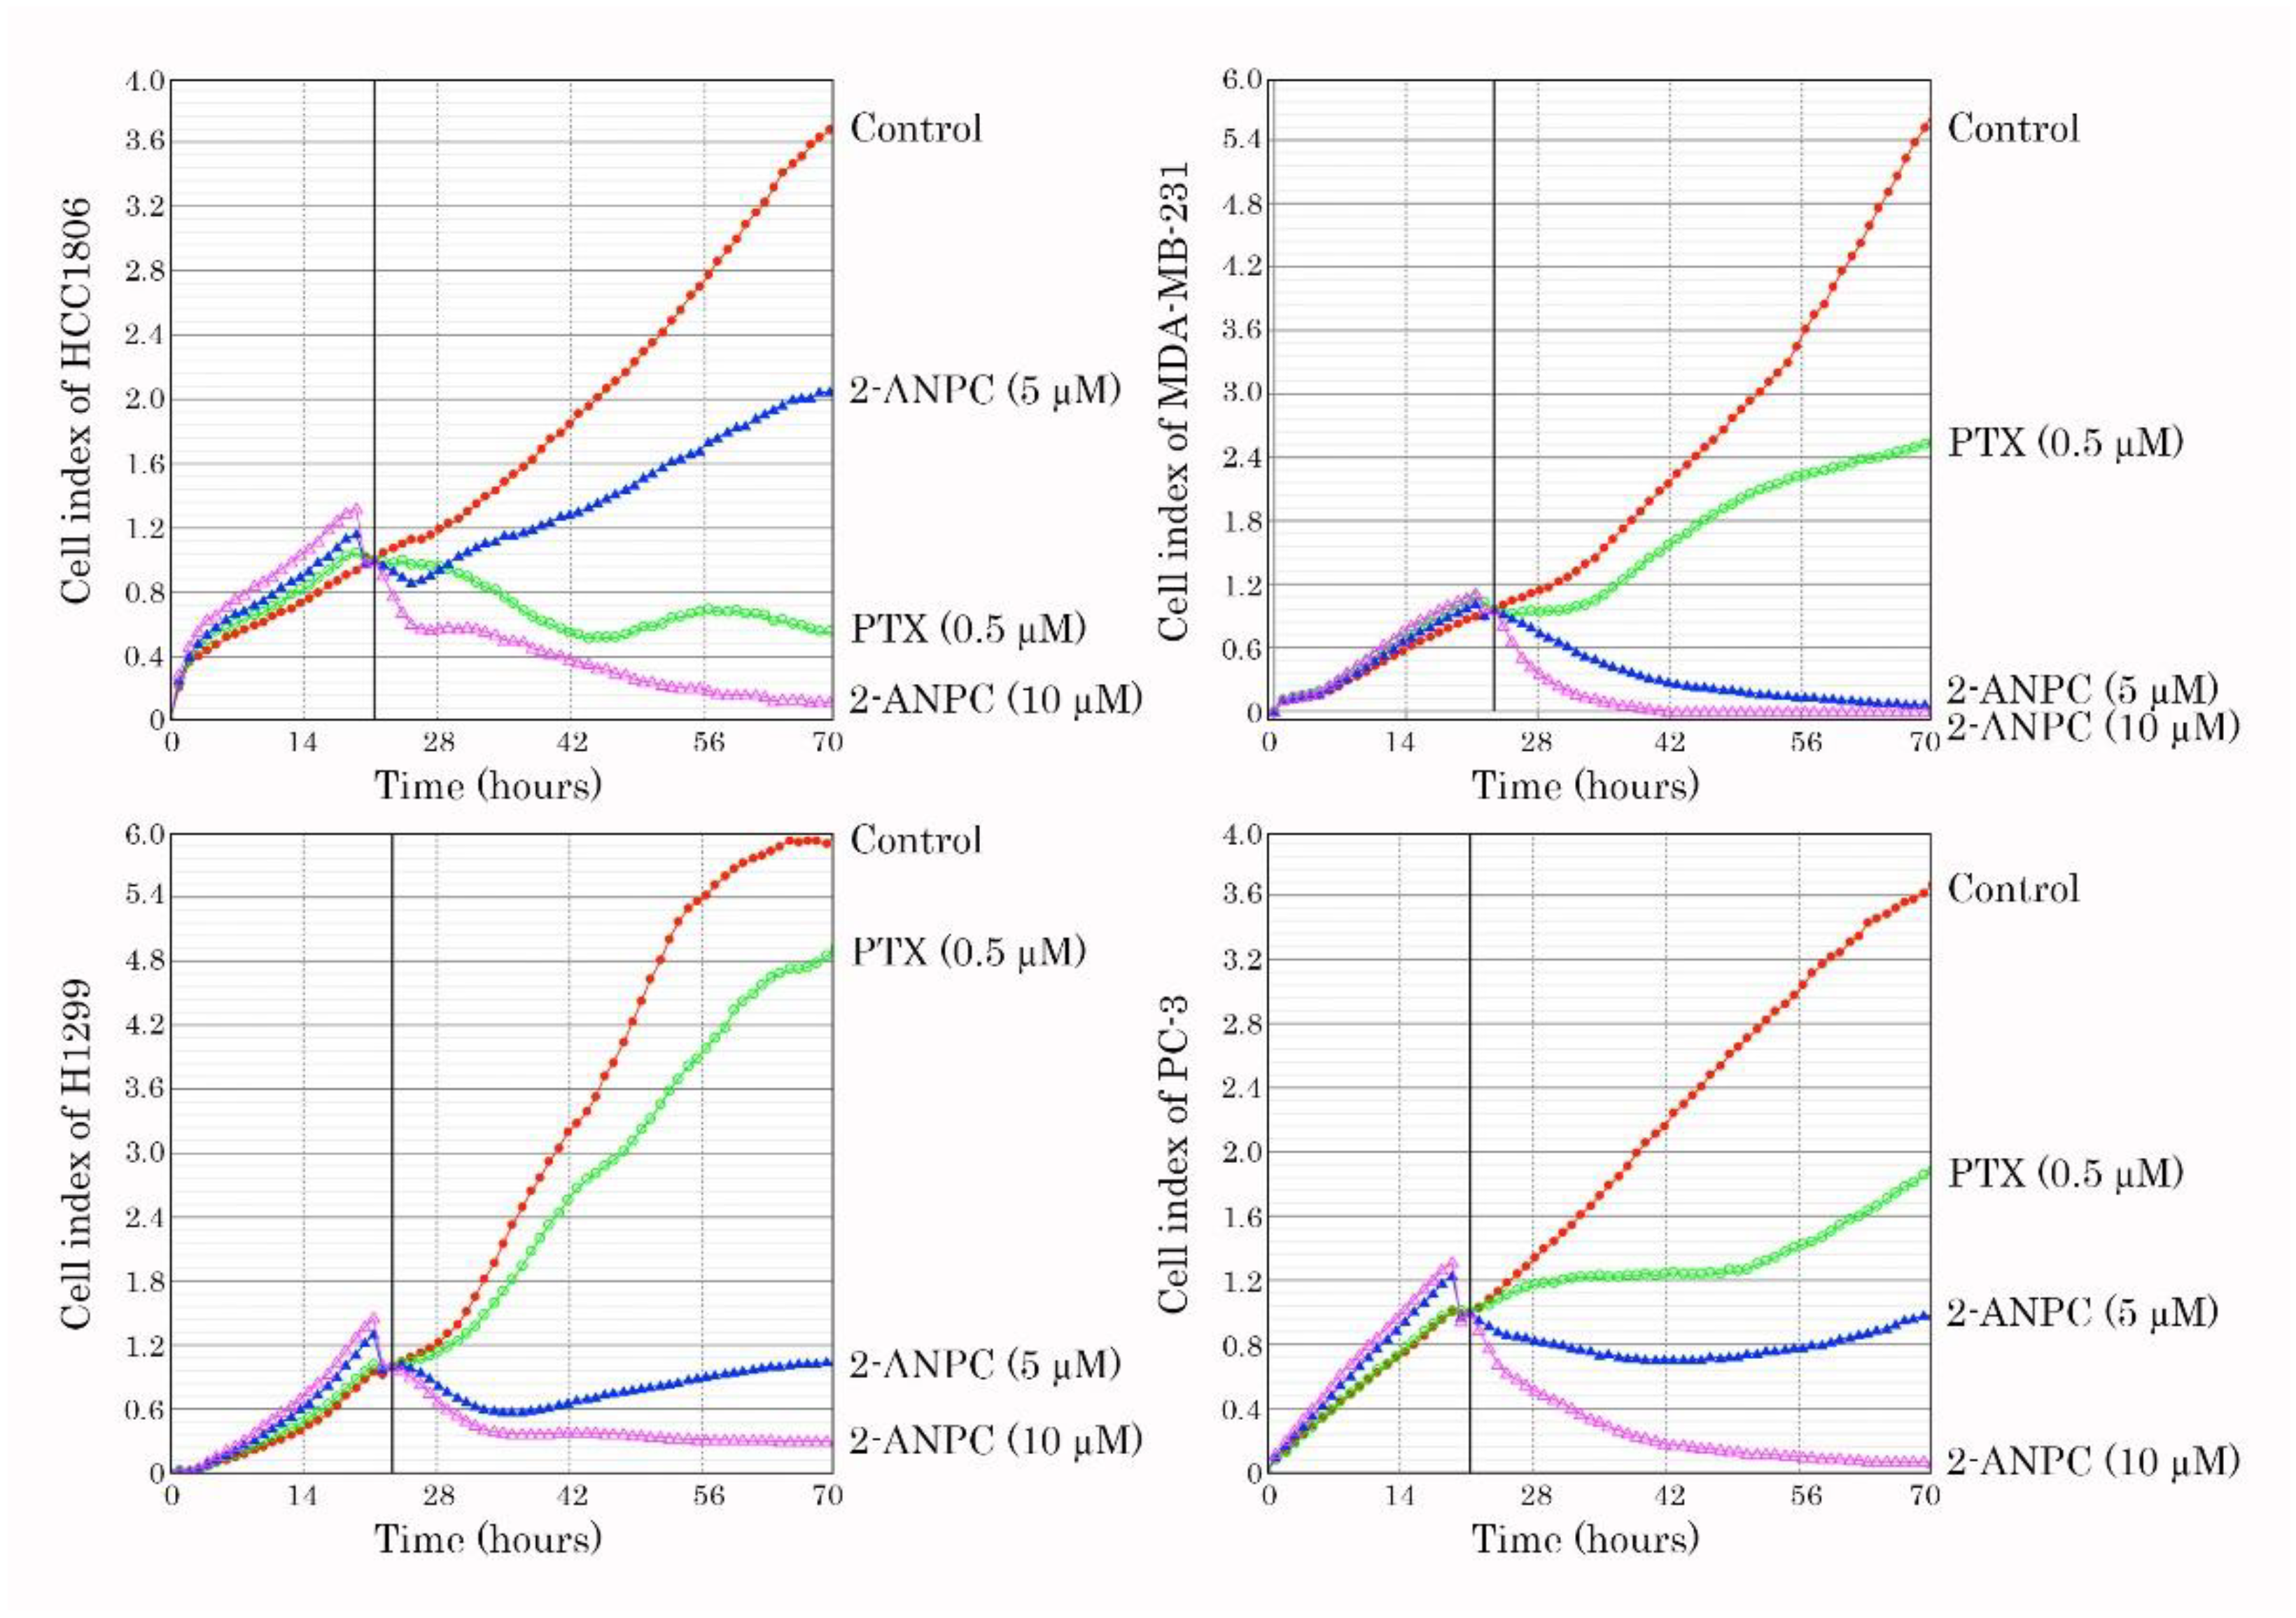
Figure 2.
Pro-apoptotic activity of 2-ANPC in epithelial cancer cell lines. HCC1806, MDA-MB-231, H1299, and PC-3 cells were treated with 2-ANPC (10 µM) for 48 h and subjected to western blot analysis to examine the expression of apoptotic markers, including cleaved PARP and cleaved caspase-3. Actin staining was used to show the comparable amounts of protein loaded into each sample.
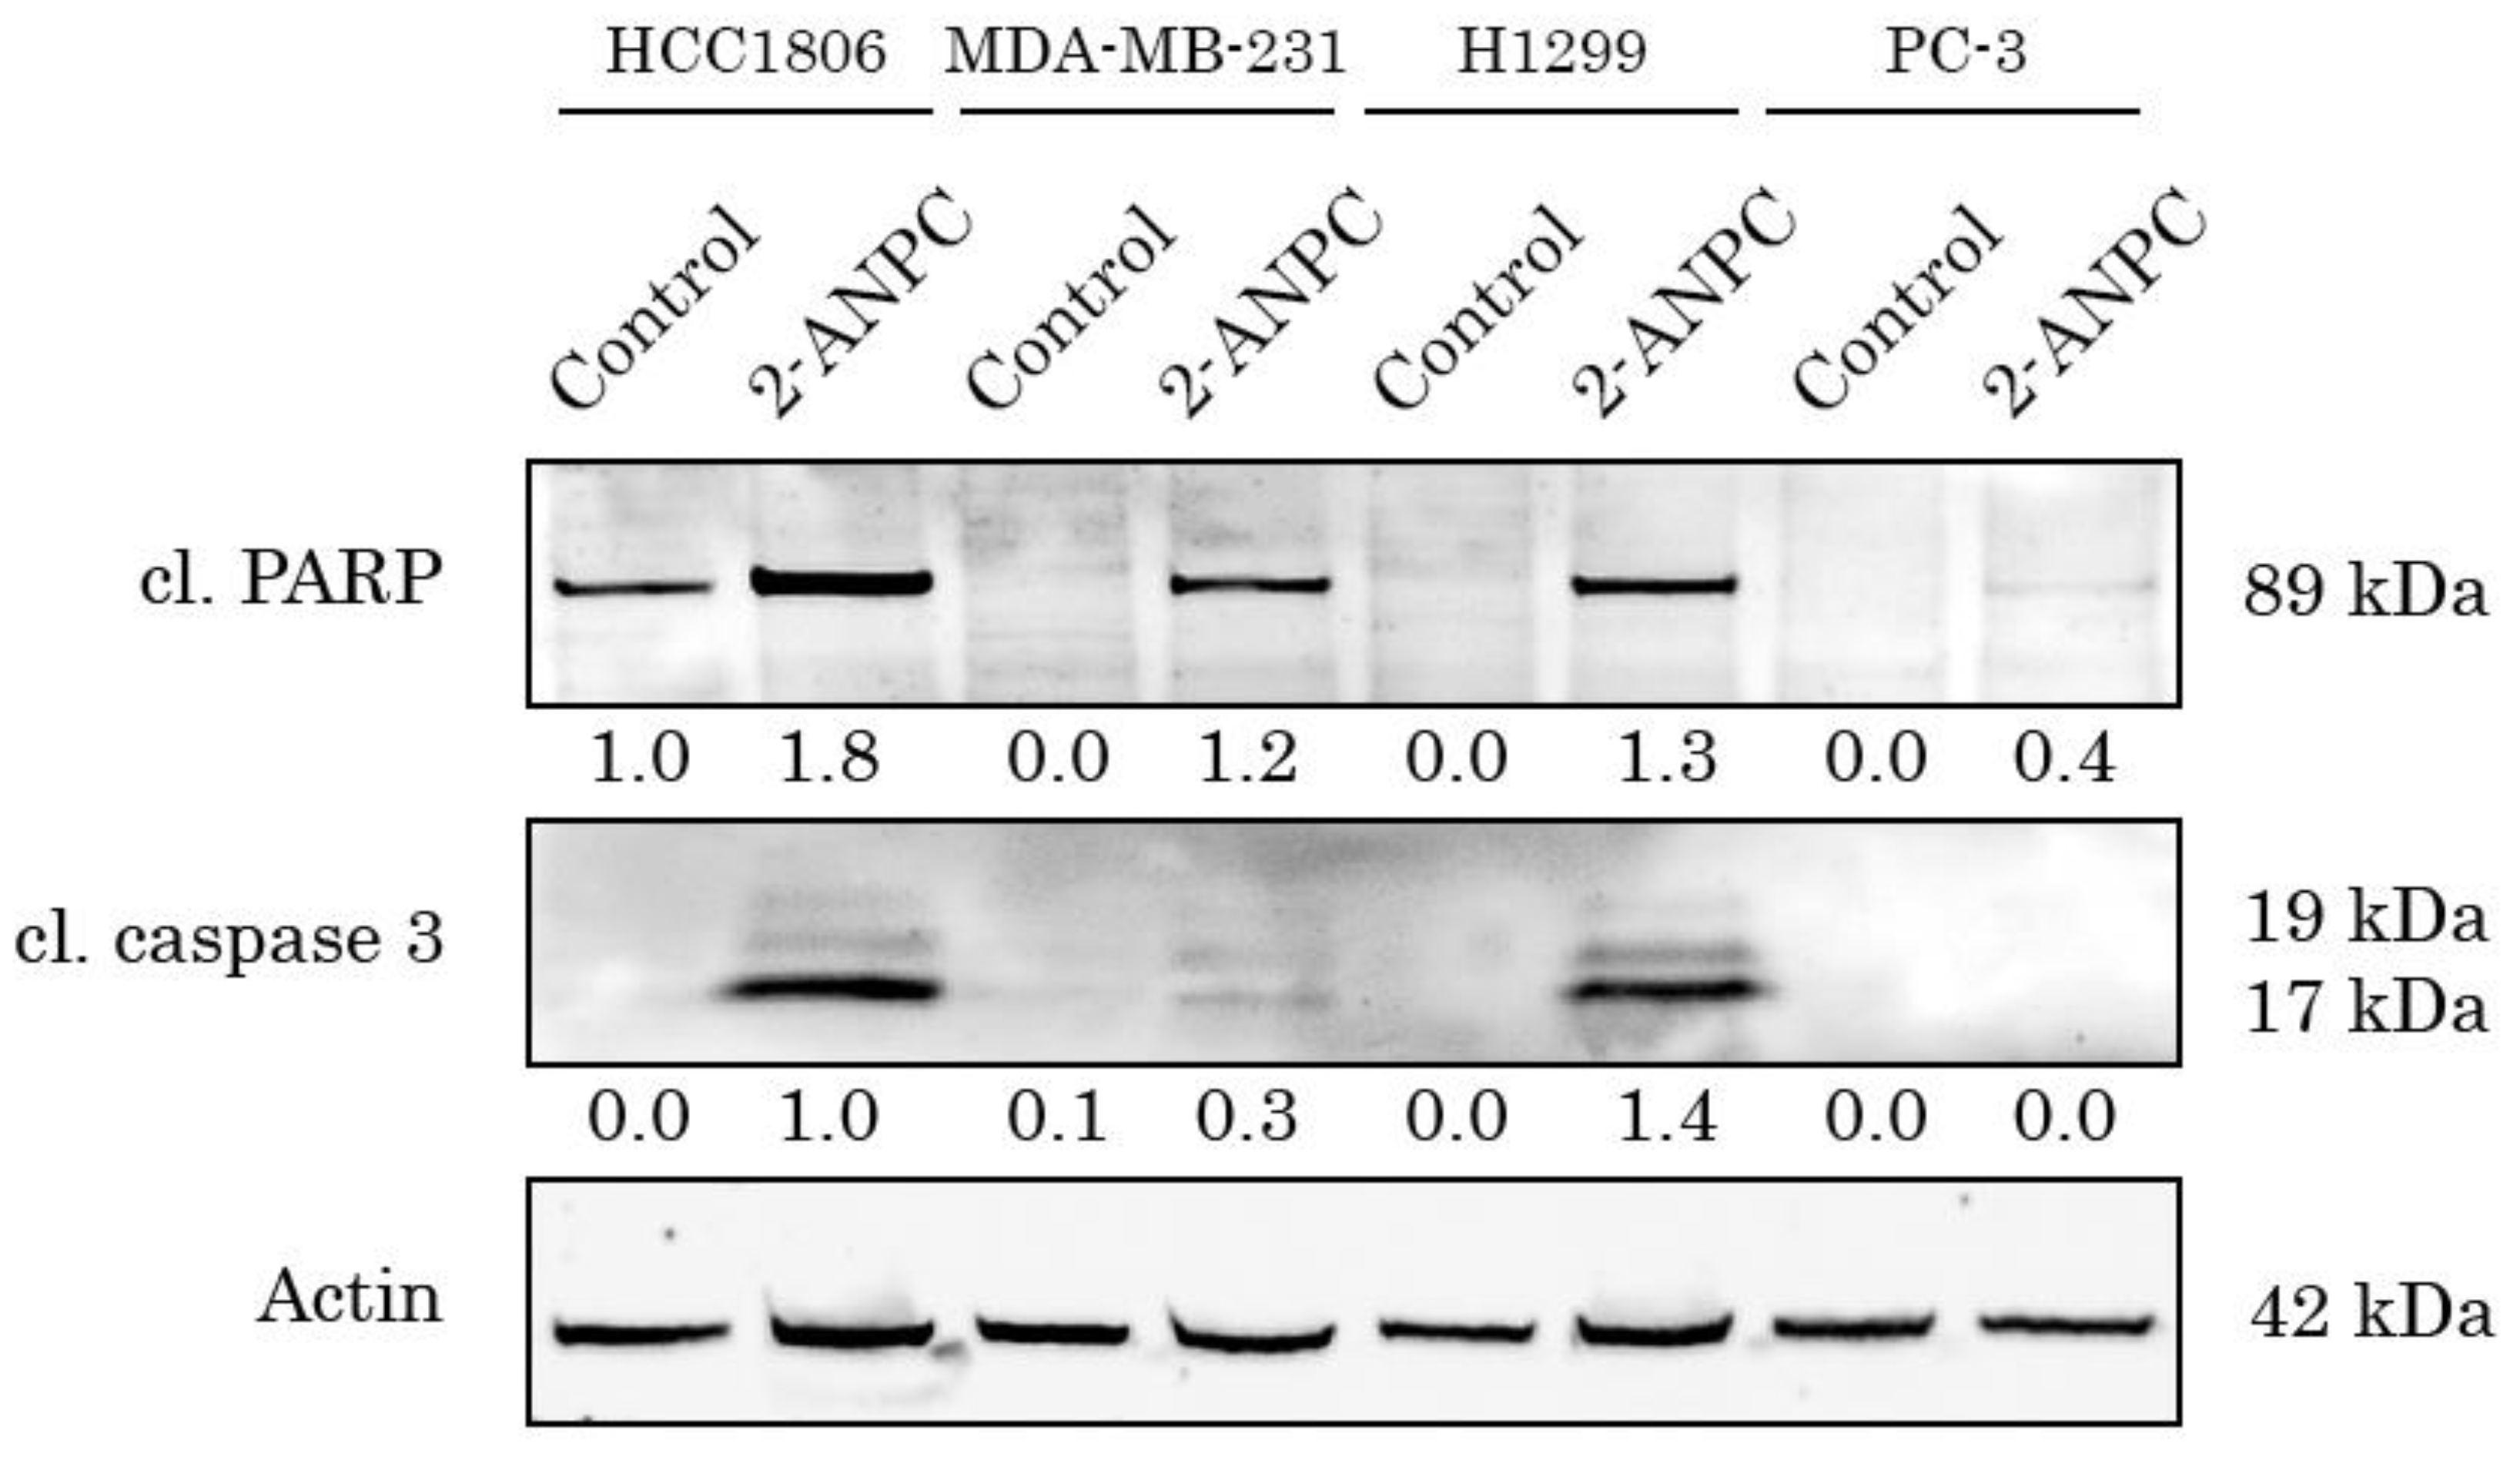
Figure 3.
2-ANPC decreases expression of HIF-1α in epithelial cancer cell lines by reducing its stability and promoting the proteasome-dependent degradation. (A) HCC1806, MDA-MB-231, H1299, and PC-3 cells were treated with 2-ANPC (10 µM) for 48 h and subjected to western blotting analysis to examine the expression of HIF-1α. Actin staining was used to show comparable amounts of protein loaded into each sample. (B) Changes in the relative expression level of HIF-1α mRNA in epithelial cancer cells (HCC1806, MDA-MB-231, H1299, PC-3) treated with 2-ANPC (10 µM - 48 h), as determined by quantitative RT-PCR. As an internal control, glyceraldehyde-3-phosphate dehydrogenase (GAPDH) amplification was used. Data are presented as median ± standard deviation (SD). Significant differences with p < 0.05 (*), p < 0.001 (**) from n ≥ 3 using unpaired Student’s t-test. (C) To examine the impact of 2-ANPC on proteasome degradation of HIF-1α, PC-3 prostate cancer cells were treated with 2-ANPC in the presence of MG-132 (2.5 μM) for 6 h and were subjected to immunoblotting for HIF-1α and actin as a loading control.
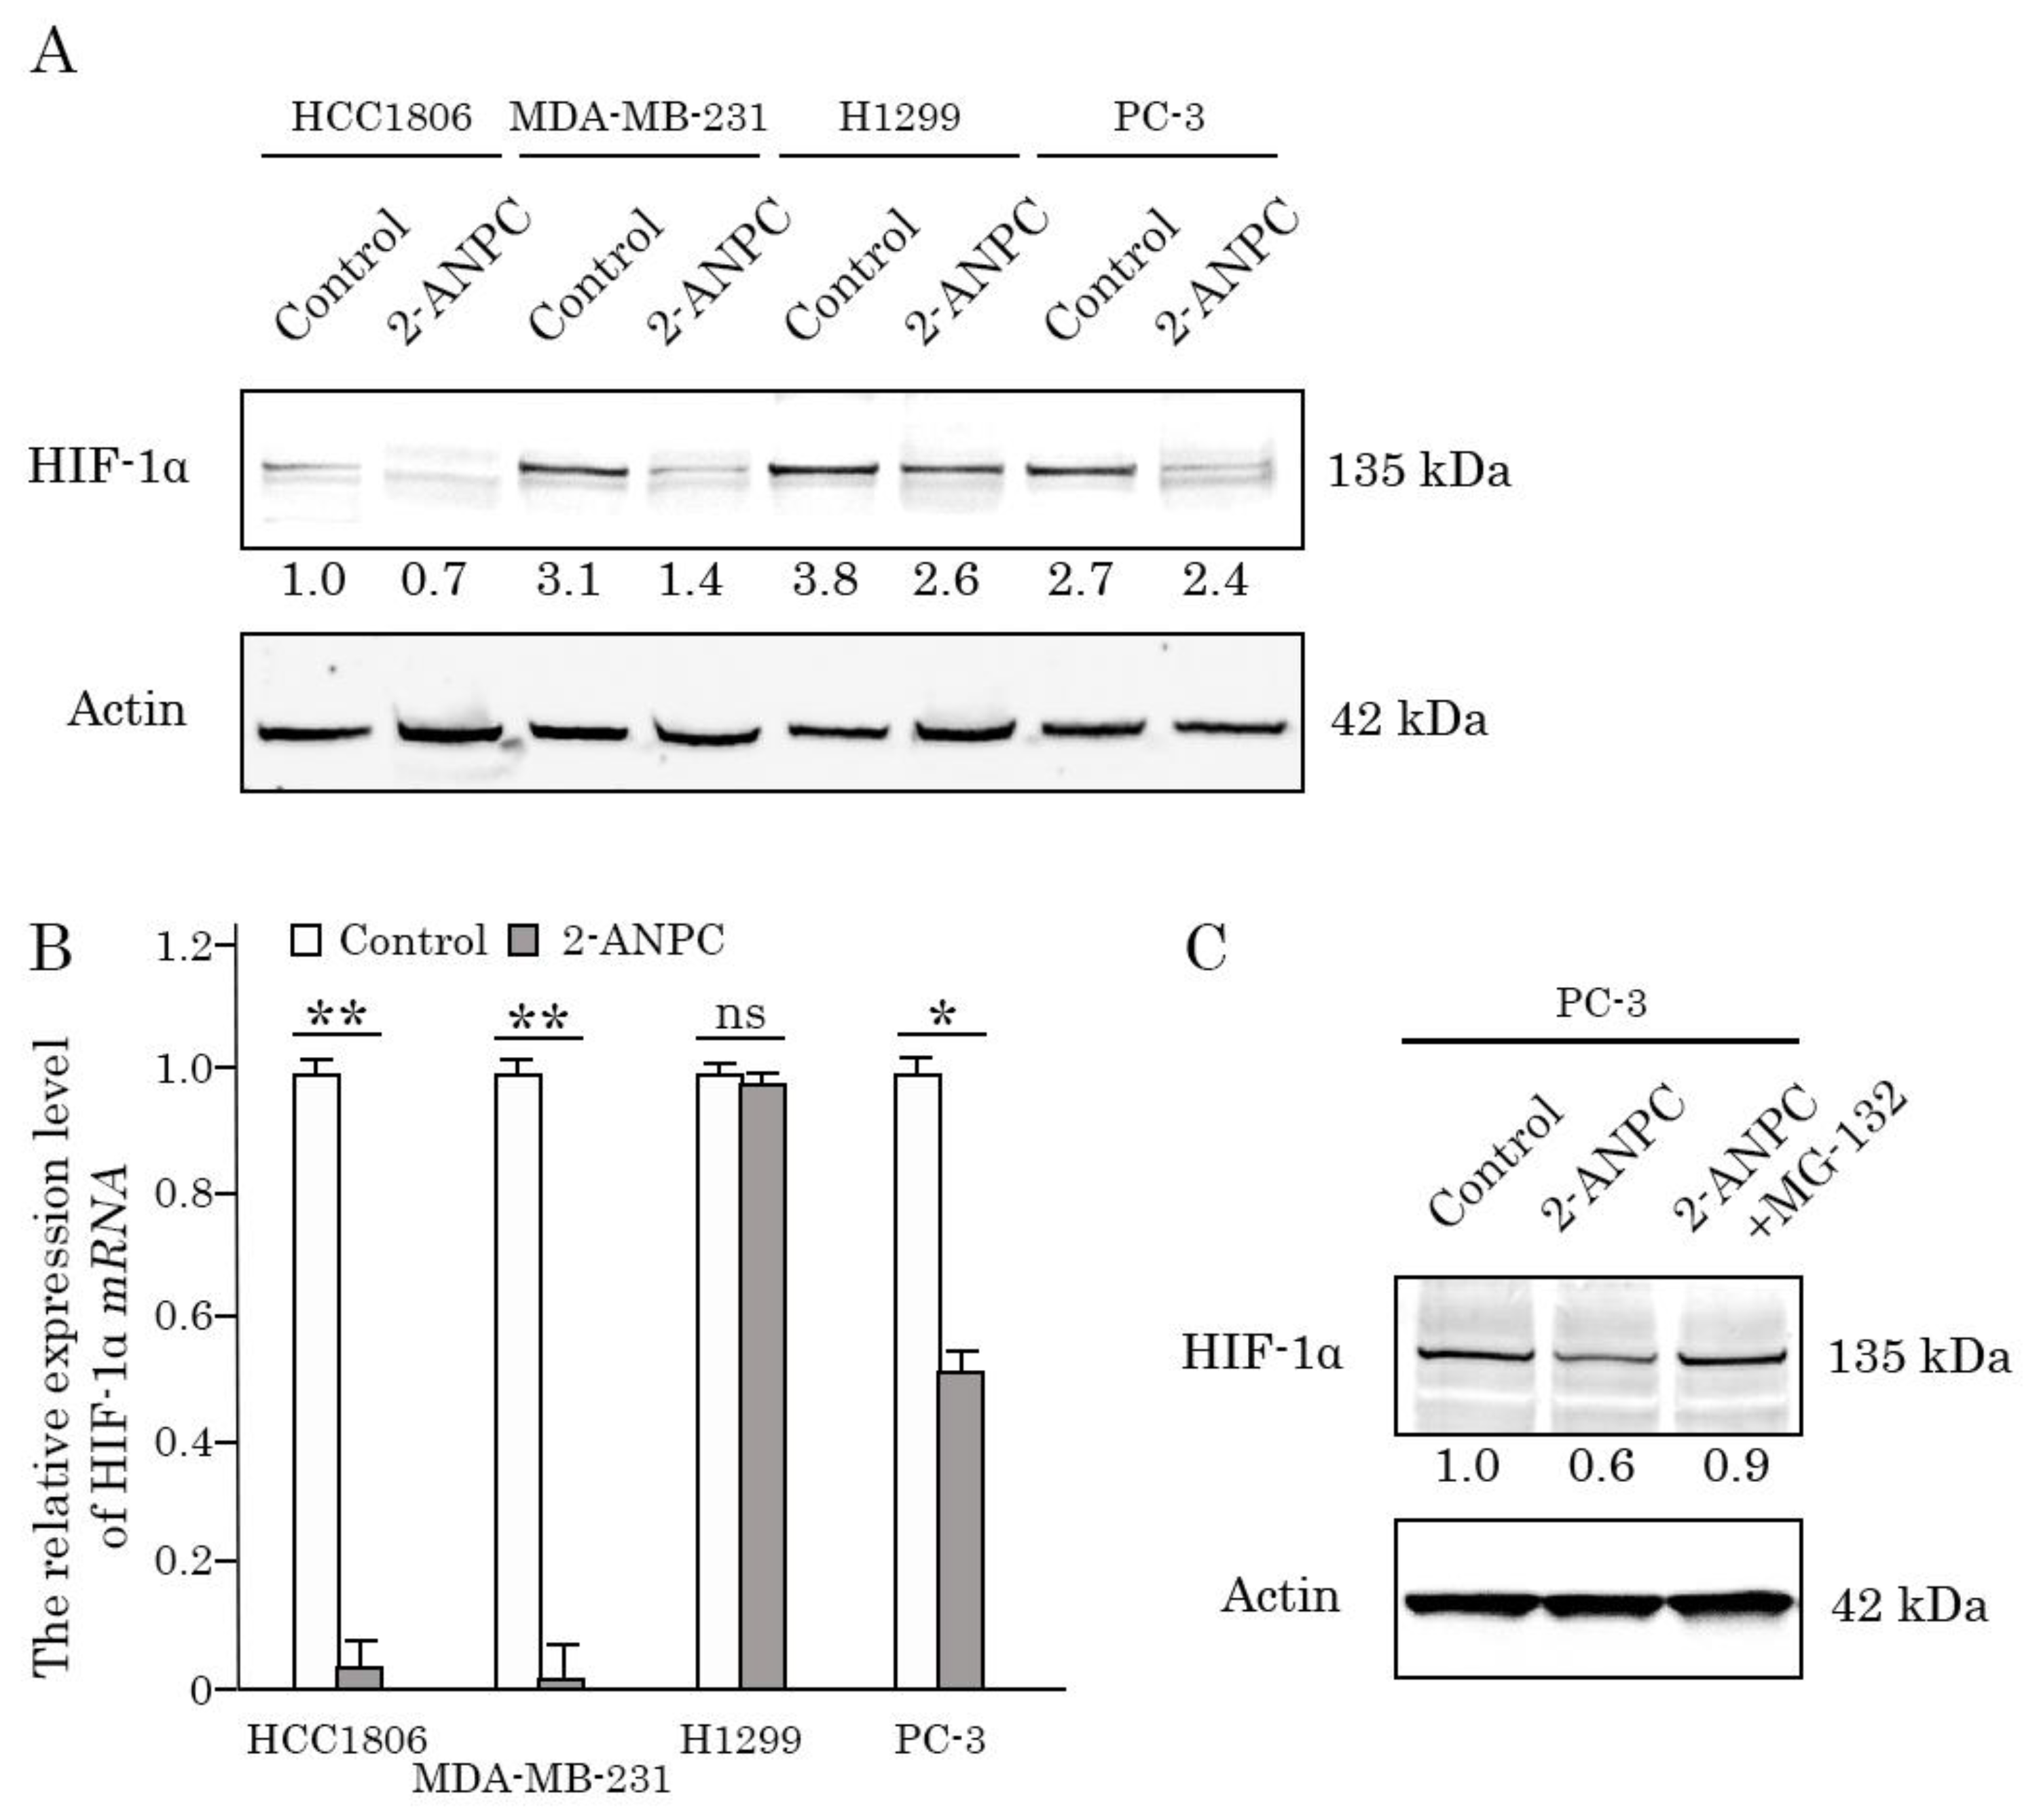
Figure 4.
Antitumor and pro-apoptotic effect of 2-ANPC in the syngraft tumor model (4T1 cell line). After subcutaneous inoculation of 4T1 cells (day 10), Balb/c mice were randomized into two groups: control (n = 5) and 2-ANPC-treated (n = 5). They administered i.p. 100 μL of vehicle (negative control), 2-ANPC (10 mg/kg) and administered on days 10, 13, 16, 19, 22, 25, and 28 after inoculation. The tumor volume in each group was assessed using calipers, calculated as length × width × height × 0.5. Expression of cleaved caspased-3 in non-treated vs. 2-ANPC 4T1 syngrafts was assessed by IHC staining of the tissue microarrays (TMA). The tumor volumes (A), the tumor weights (B), and the number of cleaved caspase-3-positive cells (C) at the end-point of the experiment for each experimental group. Data are presented as median ± SD. Significant differences with p= 0.02 (*), p= 0.03 (**) from n=5 using unpaired Student’s t-test. Significant differences with p= 0.0004 (***) from n=20 using unpaired Student’s t-test.
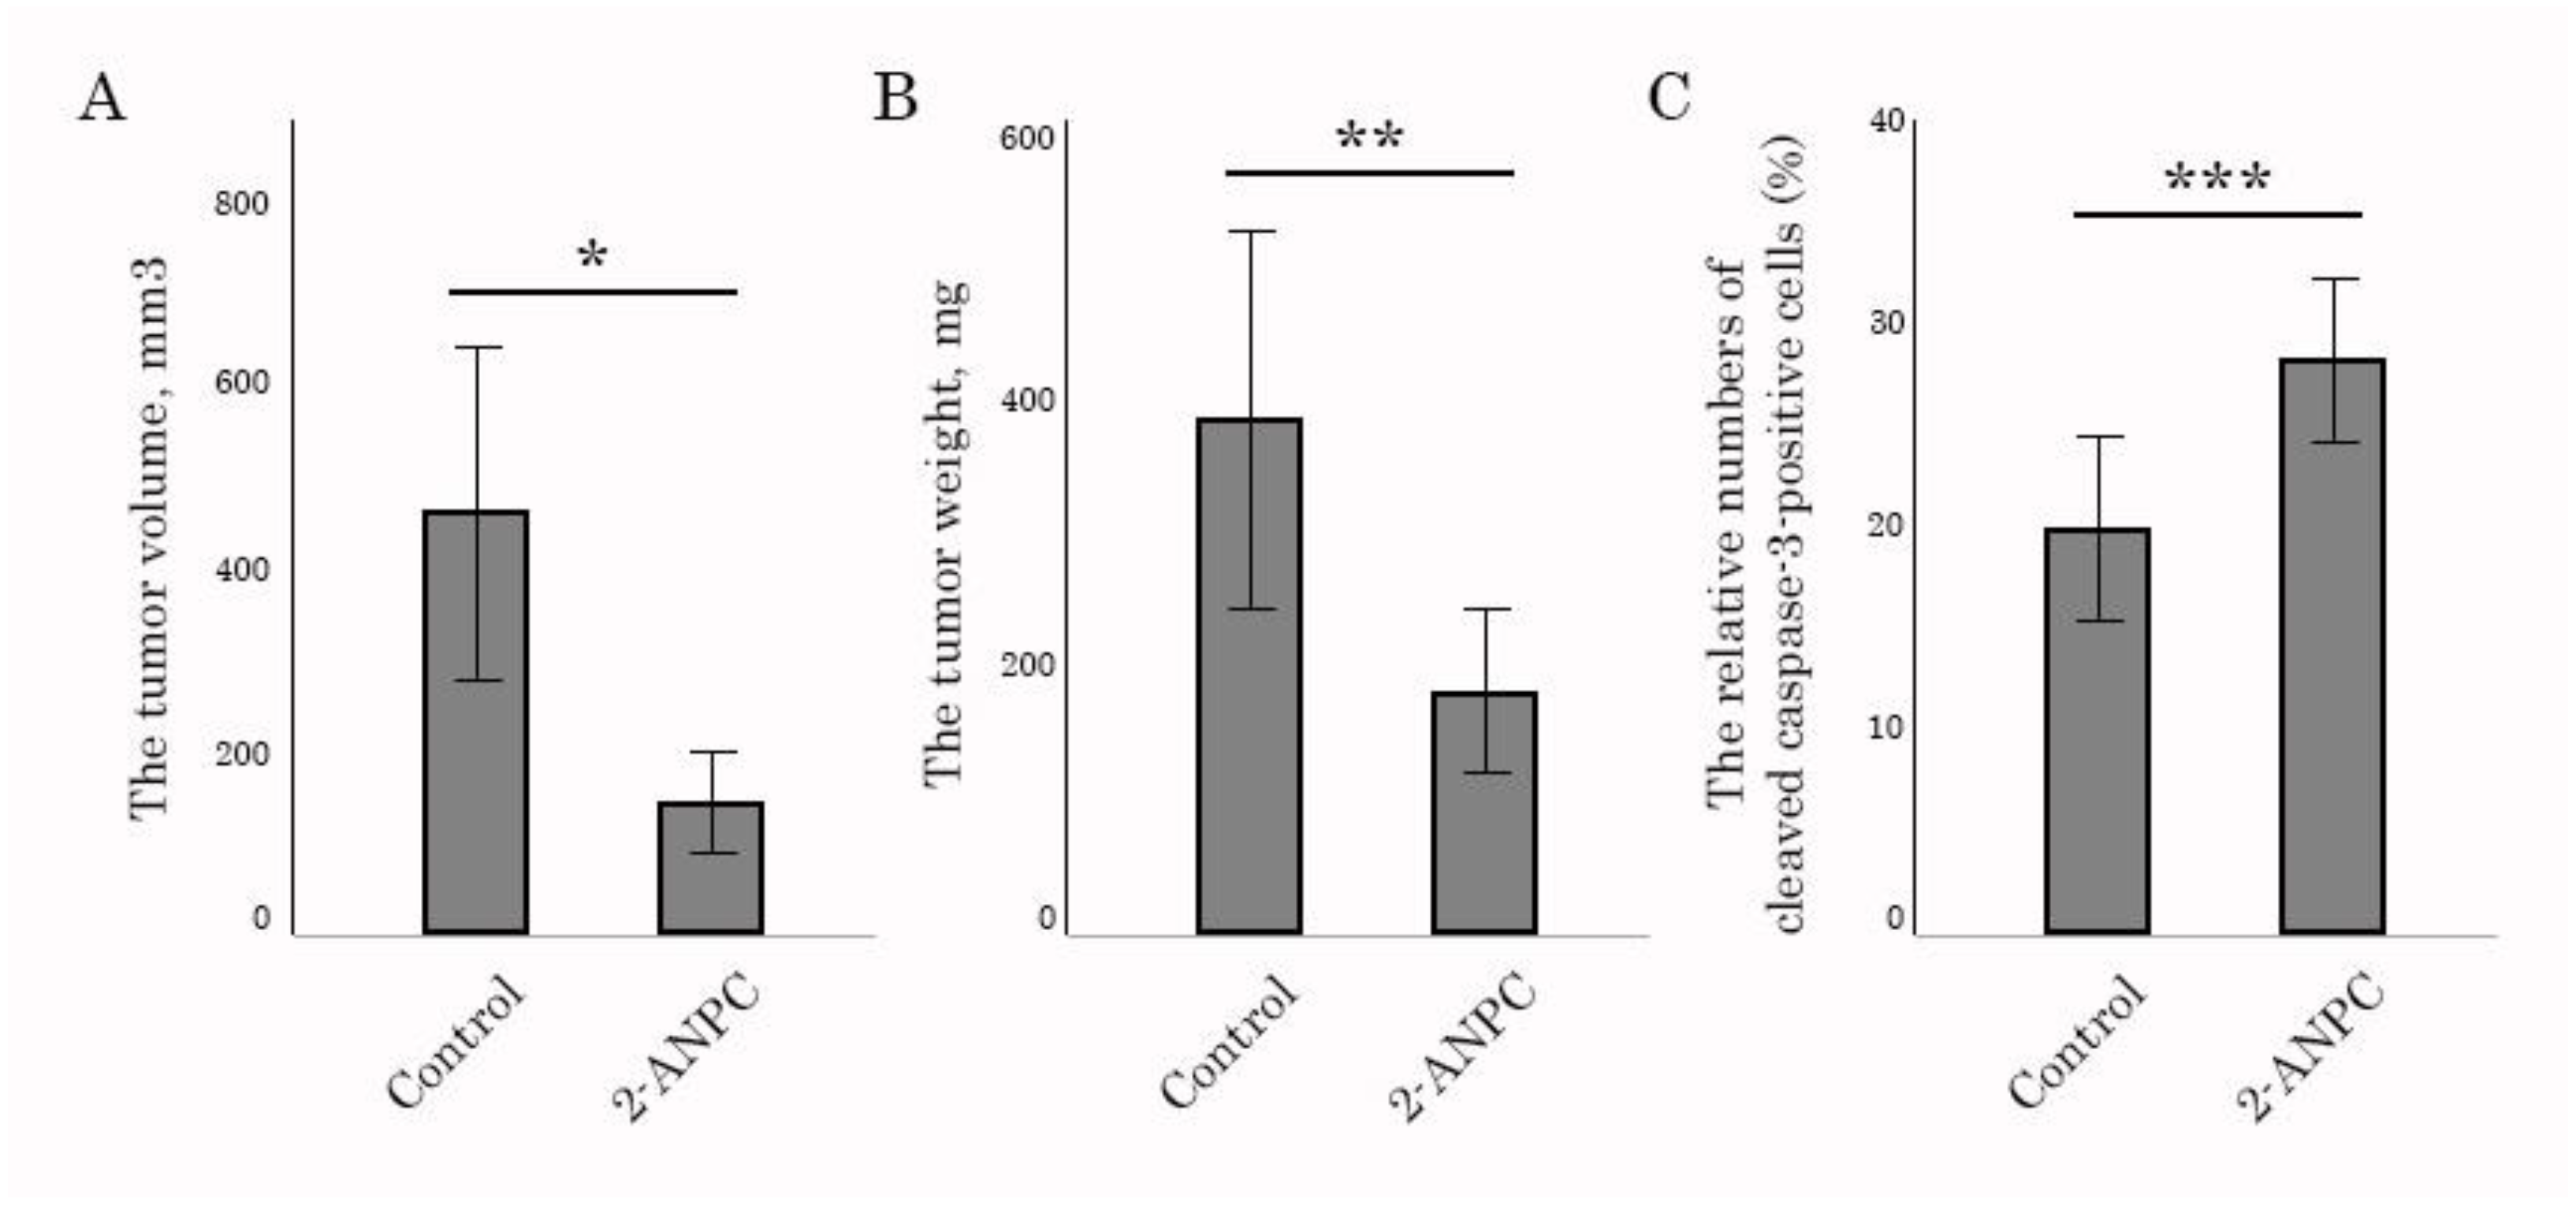
Figure 5.
Antitumor activity of 2-ANPC in the syngraft tumor model. (A, B) Representative images of H&E stained 4T1 syngrafts treated. Magnification of x50 (A). Magnification of x400 (B). Scale bar = 500 μm. (C) Graph depicting the numbers (in %) of normal and pathological mitoses in 4T1 syngrafts. Mitosis counting in two sections was performed in living tumor tissue in 10 random fields of view at a magnification of x400, without taking into account “hot” and “average” spots. Scale bar = 500 μm.
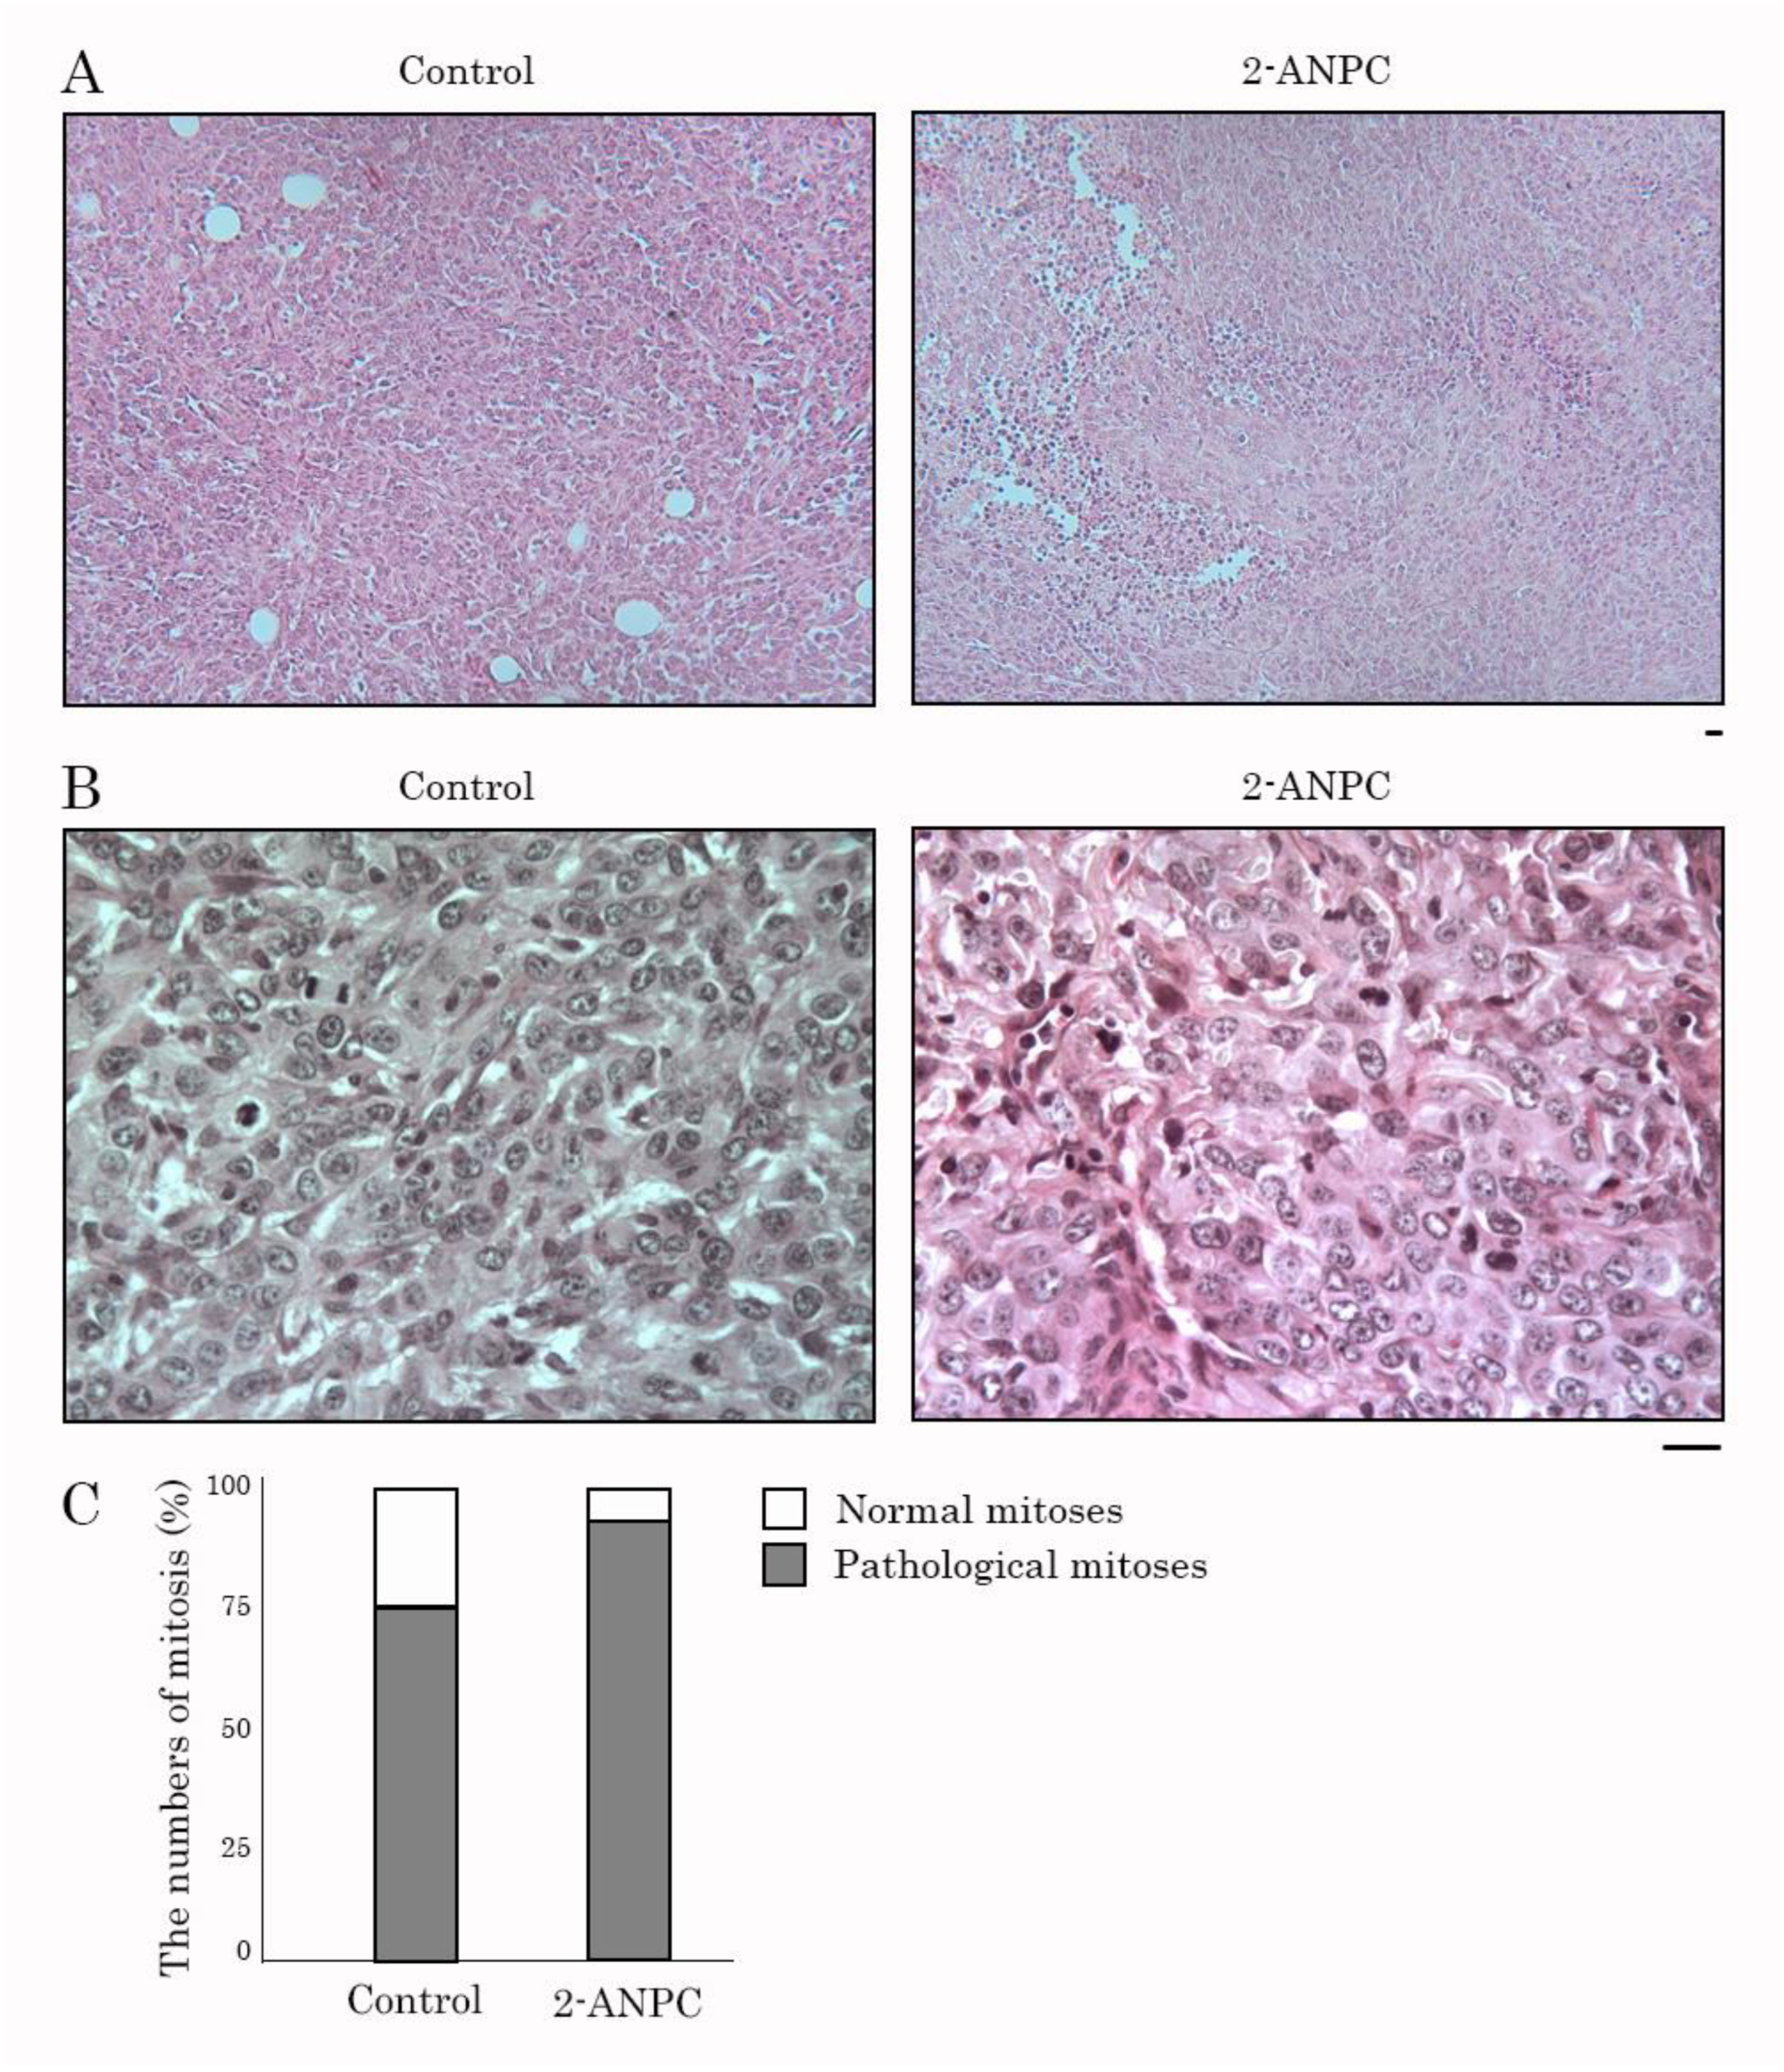
Figure 6.
2-ANPC decreases HIF-1α expression in 4T1 breast cancer cells in vivo and in vitro. (A) Representative images of HIF-1α expression in non-treated vs. 2-ANPC 4T1 syngrafts were assessed by IHC staining of TMA. HIF-1α expression is shown in 4T1 syngrafts at 400× magnification. Scale bar = 500 μm; (B) Graphs depicting the numbers (in %) of HIF-1α-positive tumor specimens in non-treated vs. 2-ANPC-treated tumors. Data are presented as median ± SD. Significant differences with p = 0.00002 (*) from n=10 using unpaired Student’s t-test; (C) Cells were treated (2-ANPC – 10 µM) for 48 h and subjected to western blotting analysis to examine the expression of HIF-1α. Actin staining was used to show the comparable amounts of protein loaded into each sample.
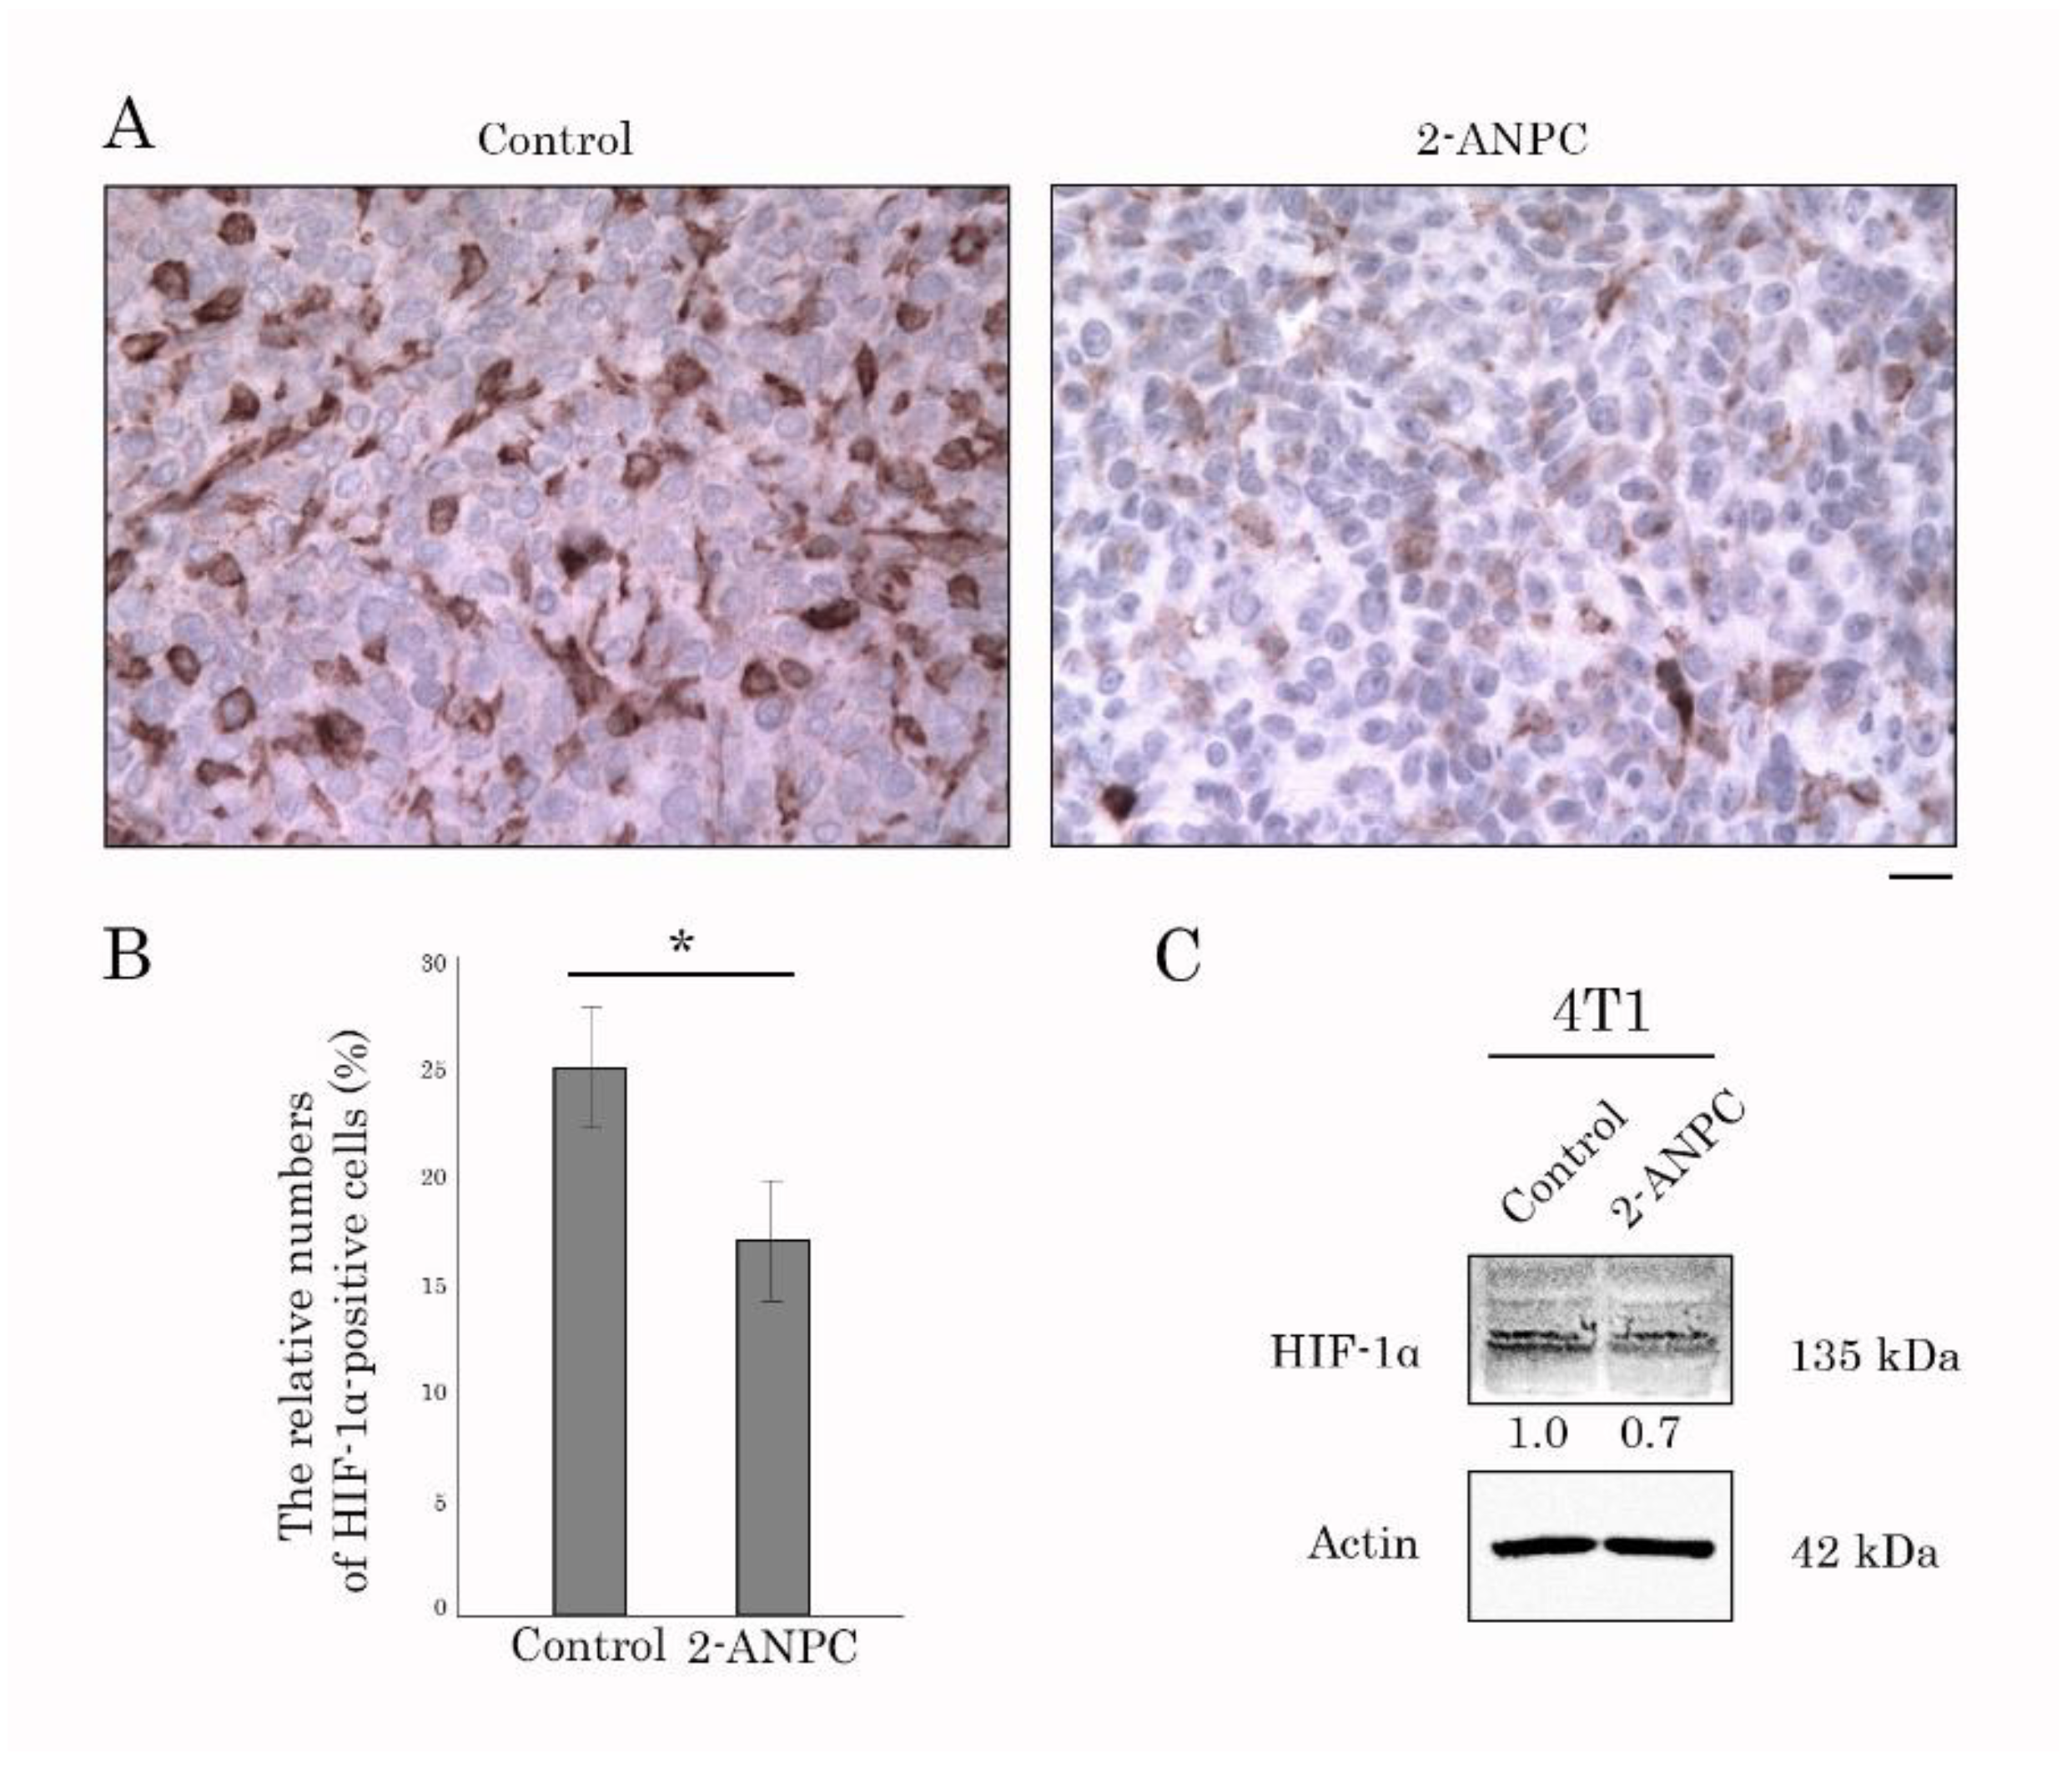
Figure 7.
2-ANPC reduces expression of VEGFR1 and 3 in 4T1 breast cancer syngrafts. (A, B) The representative images of VEGFR1 (A) and VEGFR3 (B) expression in non-treated vs. 2-ANPC 4T1 syngrafts assessed by IHC staining of the TMA. VEGFR1 and 3 expression are shown in 4T1 syngrafts at 400× magnification. Scale bar = 500 μm. (C, D) Graphs depicting the numbers (in %) of VEGFR1-positive (C), and VEGFR3-positive (D) tumor specimens in non-treated vs. 2-ANPC-treated tumors. Data are presented as median ± SD. Significant differences with p= 0.000002 (*), p= 0.000000003 (**) from n=20 using unpaired Student’s t-test.
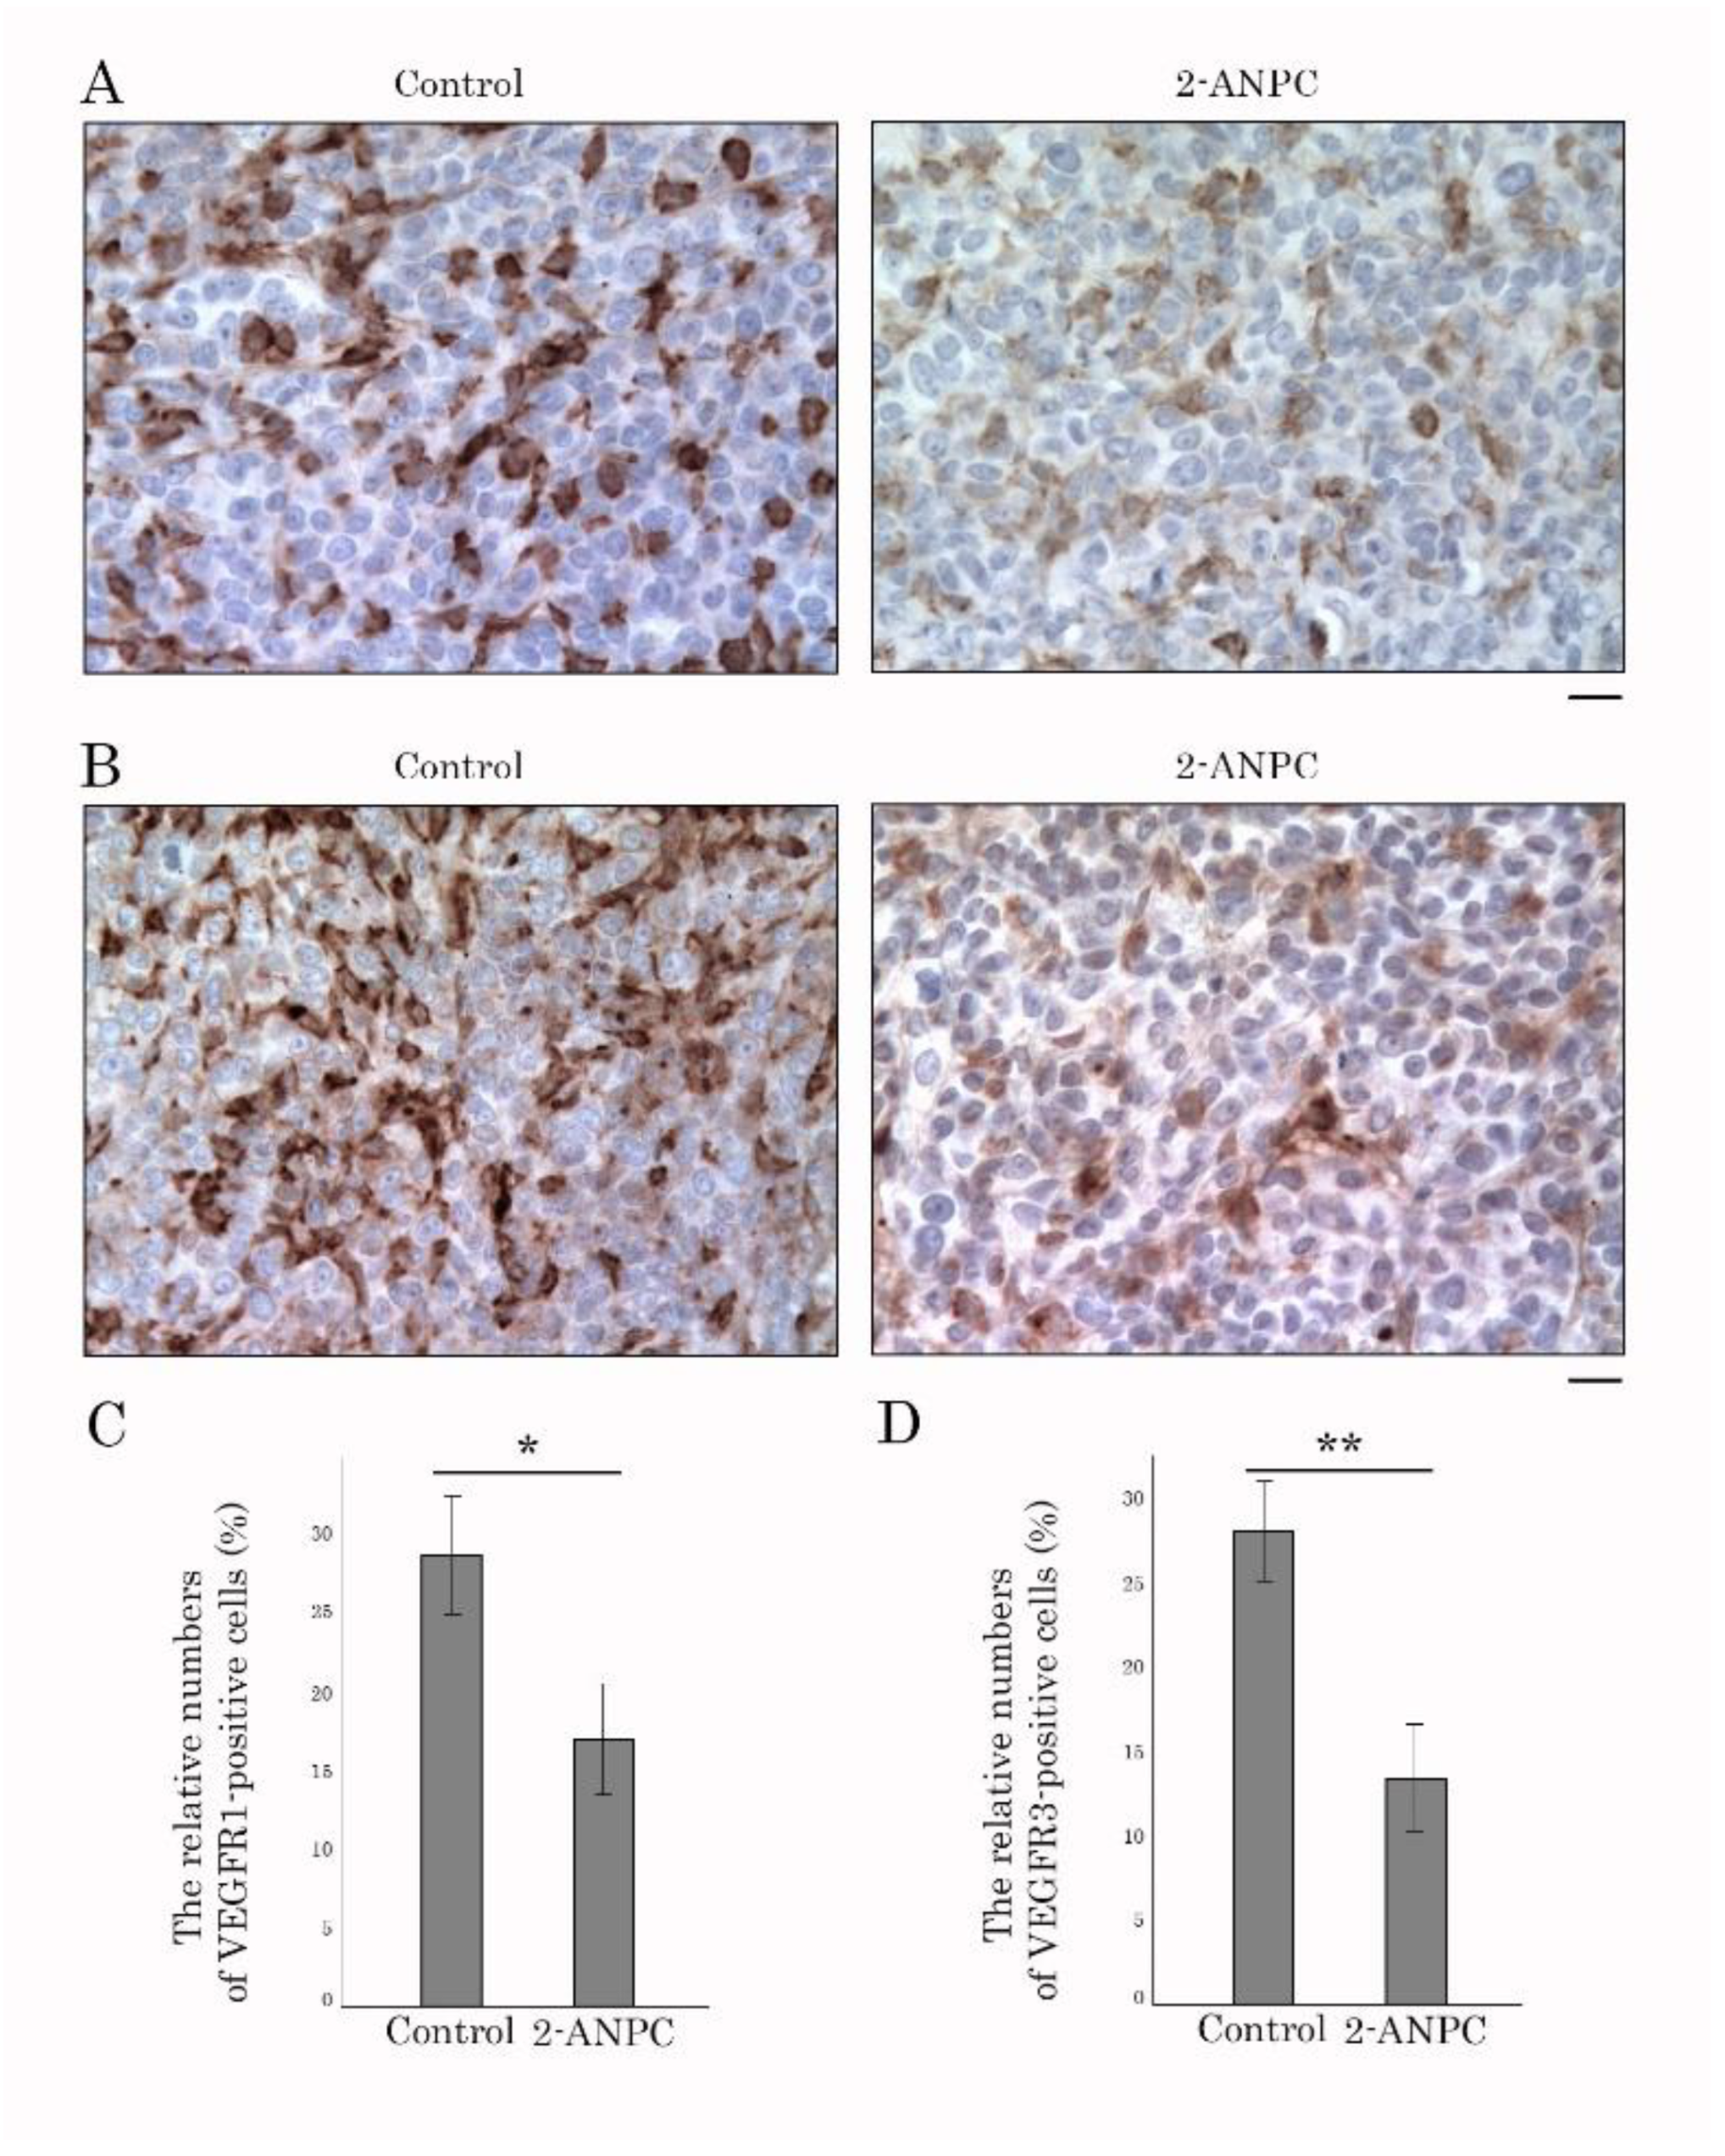
Figure 8.
(A) AlphaFold-predicted HIF-1α structure with per-residue measure of local confidence test values (pLDDT). (B) pLDDT confidence scores for predicted HIF-1α structure.
Figure 8.
(A) AlphaFold-predicted HIF-1α structure with per-residue measure of local confidence test values (pLDDT). (B) pLDDT confidence scores for predicted HIF-1α structure.
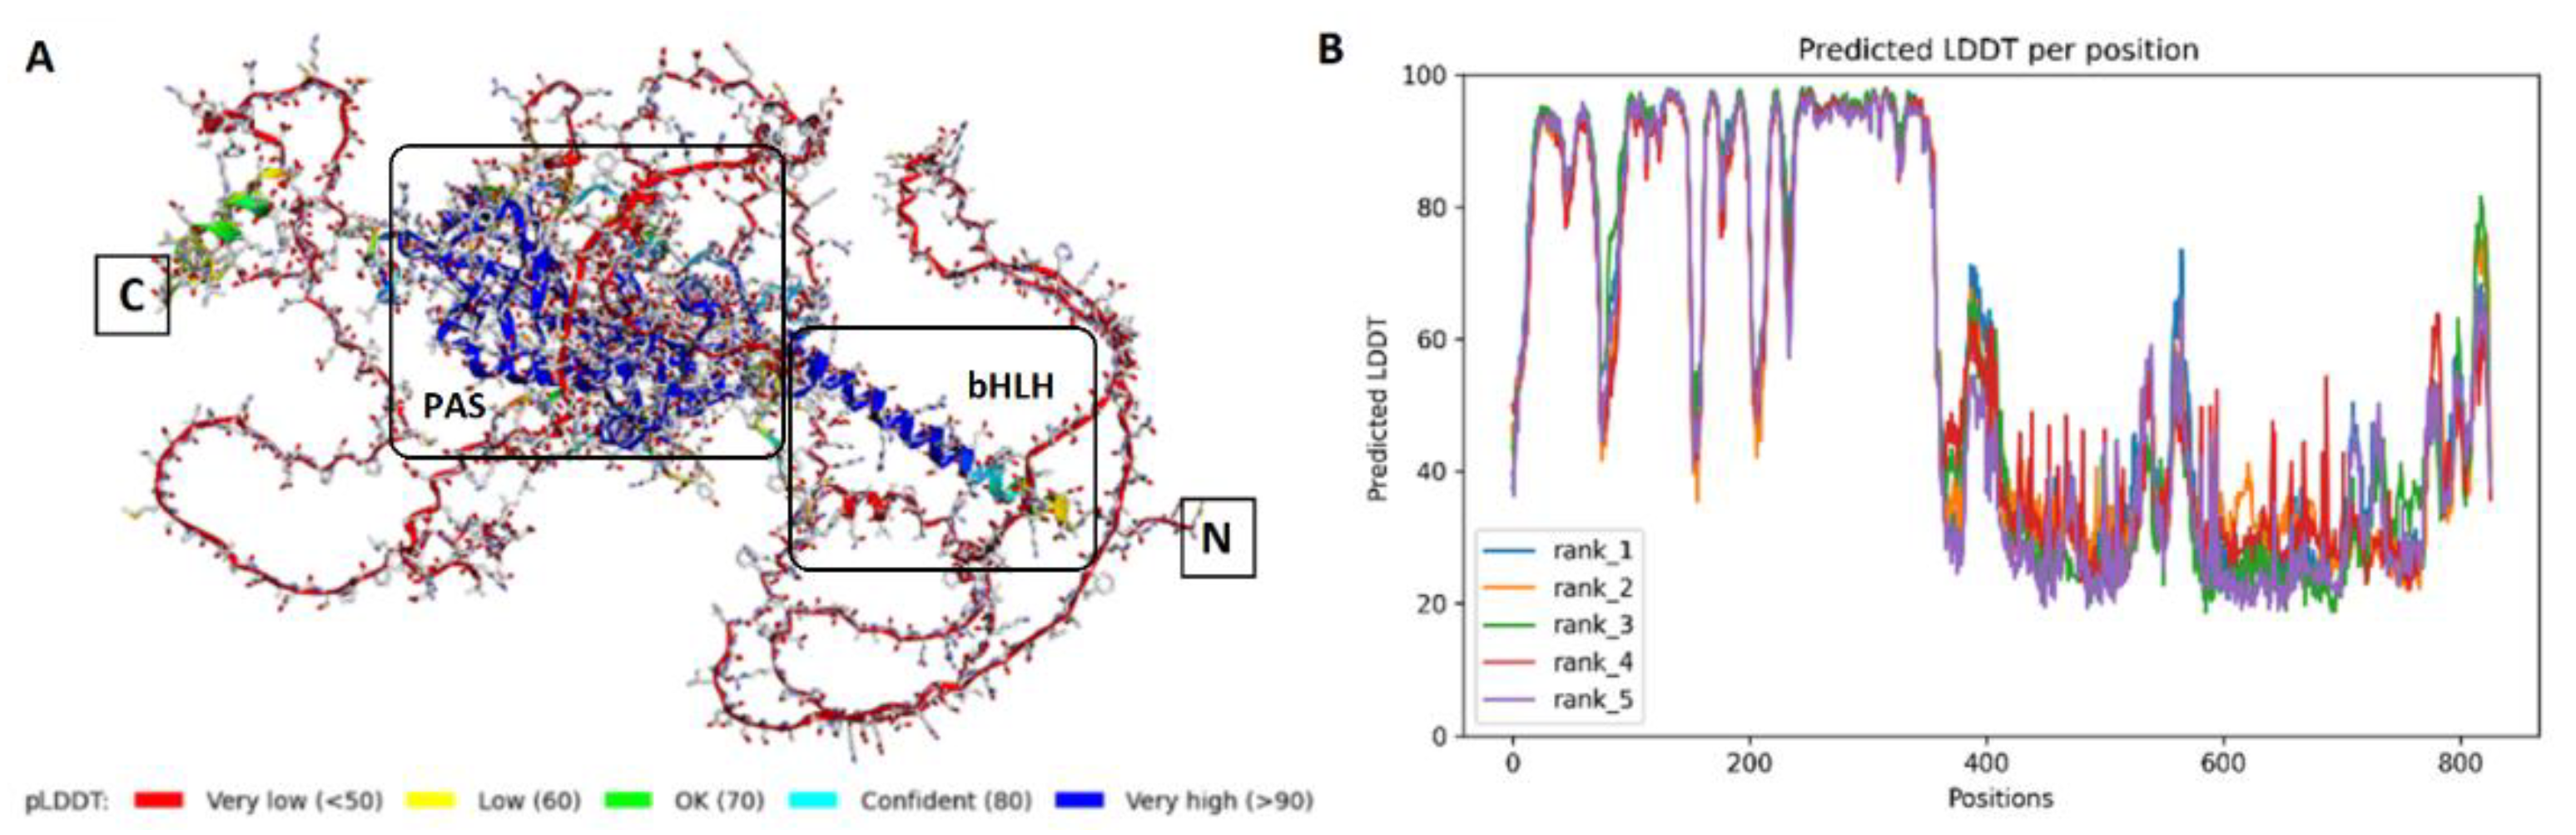
Figure 9.
(A) Predicted binding sites for the HIF-1α. Sites 1-4 were obtained by SiteMap, site 5 was located by multi-ligand molecular dynamics. Blue is bHLH domain, orange is PAS-A and PAS-B domains, red is ODD domain, green is N-terminal transcription activation domain (NTAD) and CTAD, dark green is ID. (B) Domain schematic for HIF-1α.
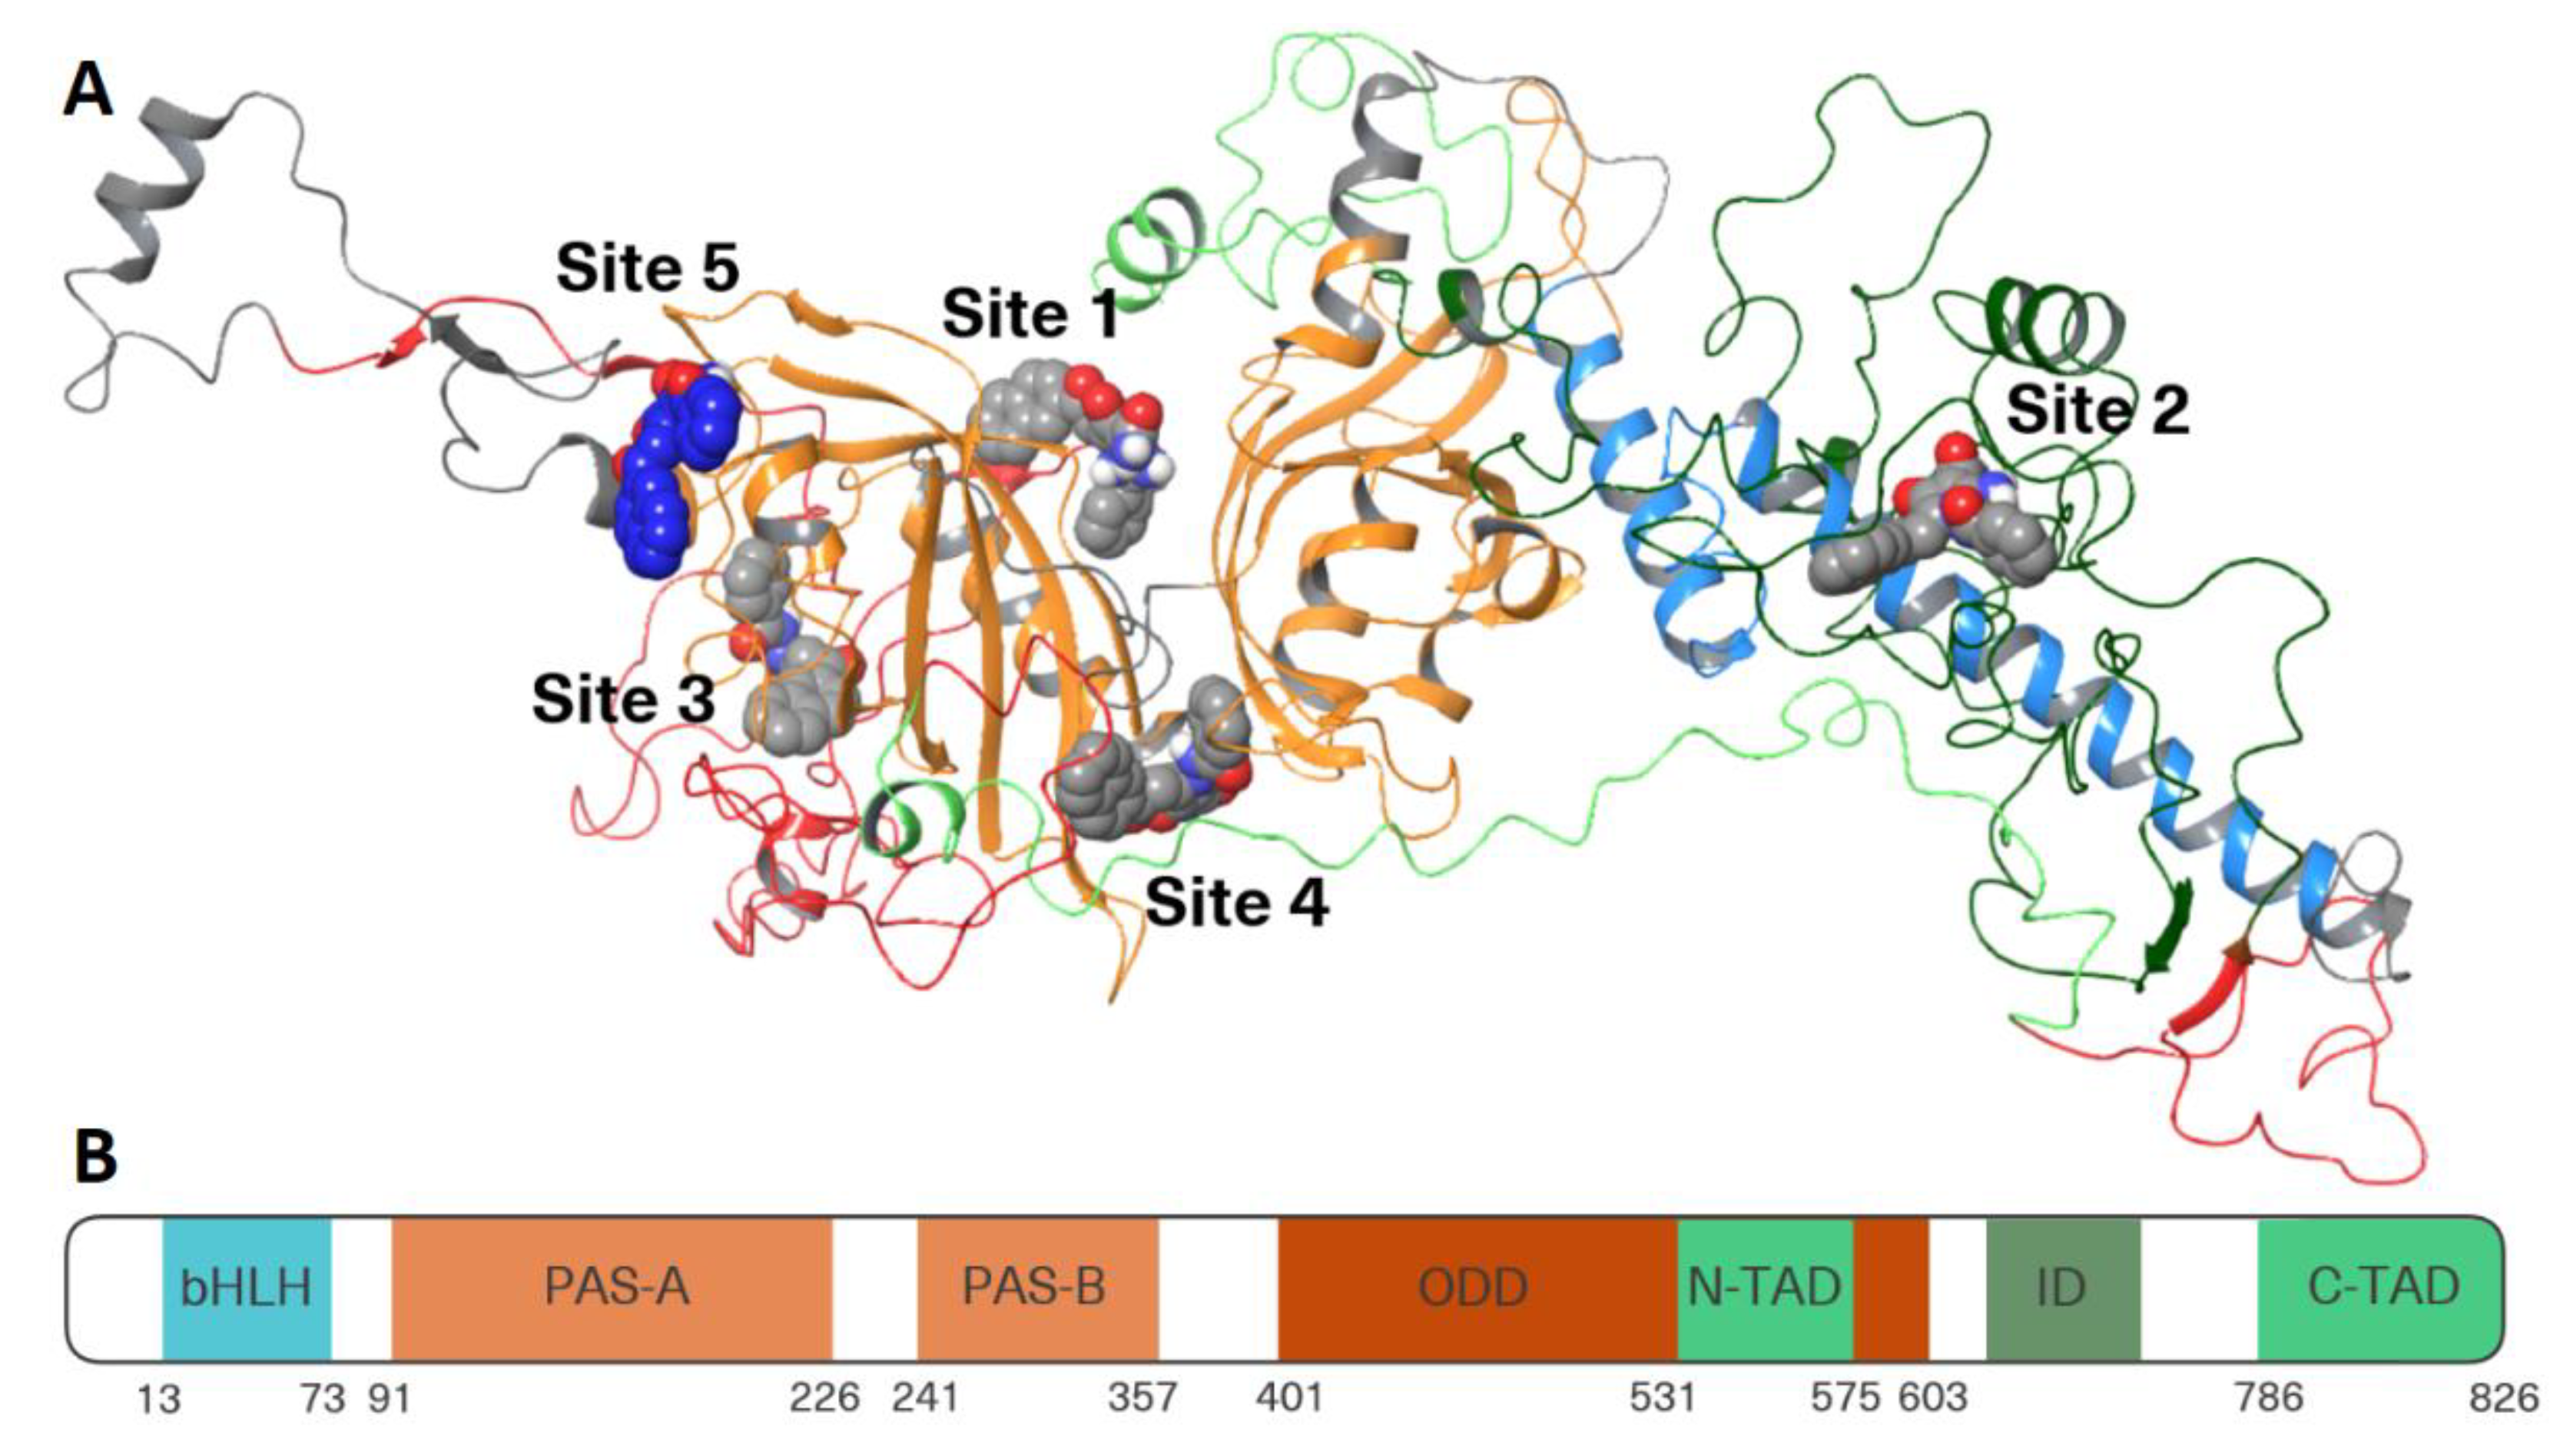
Figure 10.
Predicted binding sites for the HIF-1 protein complex. Green – HIF-1α, blue – HIF-1β, purple – p300.
Figure 10.
Predicted binding sites for the HIF-1 protein complex. Green – HIF-1α, blue – HIF-1β, purple – p300.
Disclaimer/Publisher’s Note: The statements, opinions and data contained in all publications are solely those of the individual author(s) and contributor(s) and not of MDPI and/or the editor(s). MDPI and/or the editor(s) disclaim responsibility for any injury to people or property resulting from any ideas, methods, instructions or products referred to in the content. |
© 2025 by the authors. Licensee MDPI, Basel, Switzerland. This article is an open access article distributed under the terms and conditions of the Creative Commons Attribution (CC BY) license (http://creativecommons.org/licenses/by/4.0/).
Copyright: This open access article is published under a Creative Commons CC BY 4.0 license, which permit the free download, distribution, and reuse, provided that the author and preprint are cited in any reuse.


