
Submitted:
10 December 2025
Posted:
11 December 2025
You are already at the latest version
Abstract
Innovative developments of GC-MS over the last two decades made this methodology a powerful tool for profiling a broad range of volatile metabolites and non-volatile ones of non-polar, semi-polar and even polar nature after appropriate derivatization. Indeed, the high potential of GC-MS in the analysis of low molecular weight metabolites involved in essential cellular functions (energy production, metabolic adjustment, signaling) made it the method of choice for the life and plant scientists. However, despite these advances, due to their intrinsic thermal lability, multiple classes of hydrophilic low-molecule weight metabolites (like nucleotides, sugar phosphates, cofactors, CoA esters) are unsuitable under the high temperature conditions of the SSL injection and GC separation, that makes analysis of such compounds by GC-MS challenging. Therefore, to ensure comprehensive coverage of the plant metabolome, the GC-MS-based metabolomics platform needs to be efficiently combined with other metabolomics techniques and instrumental strategies. Moreover, to get a deeper insight into dynamics of plant cell metabolism in response to endogenic and exogenic clues, integration of the metabolomics data with the output obtained from other post-genomics techniques is desired. Therefore, here we overview different strategies for integration of the GC-MS-based metabolite profiling output with the data, acquired by other metabolomics techniques in terms of the multi-platform metabolomics approach. Further, we comprehensively discuss the implementation of the GC-MS-based metabolomics in multi-omics strategies and the data integration strategies behind this. We are convinced that this approach is the strategy of future, as it gives deep and multi-level insight into physiological processes in plants in the systems biology context with consideration of all levels of gene expression. However, multiple challenges may arise in the way of integrating data from different omics technologies, which are comprehensively discussed in this review.
Keywords:
GC-MS
; metabolite profiling
; metabolomics platforms
; multi-omics
; plant metabolomics
; primary metabolites
1. Introduction
Due to the fascinating development of new post-genomic methodological platforms - transcriptomics, proteomics and metabolomics, valuable information about the corresponding global sets of gene products, i.e. transcriptome, proteome and metabolome, as well as their dynamics in response to external and internal clues, can be accessed. Obviously, well-coordinated parallel investigation of these sets might give new insights into gene functions and mechanisms behind the fine regulation of metabolism, stress response and development. Indeed, transcriptomics targets the changes in transcriptome, i.e. the population of mRNA molecules responsive to the internal or external stimuli, proteomics addresses the corresponding changes in protein dynamics, whereas metabolomics delivers valuable information about the resulted shifts in cellular metabolism at the level of small effector molecules [1,2,3,4]. Integration of these three information layers allows implementation of the systems biology tools and delivers an integrative overview of the molecular regulation within the cell and in the whole organism [5,6].
In solving the actual problems of the systems biology, the state of the art metabolomics serves as a vital information source offering metabolic solutions and giving access to fine regulatory mechanisms behind cellular and organism responses [6,7]. In terms of the metabolomics approach, dynamics of individual metabolites - the ultimate products of gene expression, can be characterized. Thereby, a comprehensive phenotypic assessment of a biological system can be achieved. On the other hand, metabolites can act as the substrates, intermediates and products of enzymatic and non-enzymatic reactions occurring in the organism. They are not directly encoded in the genome, and their biosynthesis often involves multiple enzymes. Therefore, some metabolites might be stoichiometrically interconnected. This and other features specific for metabolites underlie the complex metabolic networks, which are not characteristic for proteome and transcriptome [8,9]. Thus, metabolomics experiments might deliver valuable functional information that is crucial in systems biology research.
From methodological point of view, metabolomics offers a combination of various approaches, each of which allows simultaneous analysis of only a certain group of metabolites – the method usually referred to as metabolite profiling [10,11]. Due to impressive diversity of the plant metabolome, individual metabolite classes are too different in their physicochemical properties to be efficiently analyzed by only one metabolomics technique. Therefore, several metabolomics platforms need to be combined to gain the best possible metabolome coverage and to obtain the most comprehensive information on the plant metabolite network and related regulatory pathways [12,13]. This strategy often serves as the optimal solution to address the changes in metabolome accompanying development and stress responses [4,14].
Among the available analytical platforms, which are currently employed in the state-of-the-art metabolomics workflows, gas chromatography coupled on-line to mass spectrometry (GC-MS) still remains one of the most attractive techniques. Indeed, on one hand, in combination with appropriate derivatization strategies, GC-MS ideally suits for analysis of diverse low molecular weight plant metabolites with essentially different properties, i.e. not only volatiles, but also non-volatile compounds of non-polar and even polar nature can be analyzed by this technique [10,15,16]. Thereby, the most widely employed derivatization strategy is trimethylsilylation, which can be efficiently applied to the most of the low molecular weight polar thermally stable primary metabolites, such as amino acids, amines and polyamines, carboxylic acids (including the intermediates of the tricarbon acid cycle), fatty acids, carbohydrates, polyols [17,18]. As the primary metabolome often appears to be involved in adaptive metabolic adjustment in terms of the long-term plant stress adaptation [19], the comprehensive profiling of low molecular weight polar metabolites with GC-MS made it the method of choice in the biology of plant response to environmental stress, development, plant-animal and plant-microbial interactions [4,14,20,21].
On the other hand, GC-MS instrumentation is typically relatively inexpensive and is easy in operation. Not less importantly, processing of the acquired GC-MS data relies on the combination of unique retention indices (calculated based on the tR calibration) and compound-specific electron ionization (EI)-MS spectra acquired at the standardized energy of 70 eV. This combination makes the whole GC-MS setup extremely robust and reliable [22].
However, despite these obvious advantages, GC-MS-based metabolomics has some intrinsic limitations [23,24]. Thus, adequate analysis by this analytical technique assumes high thermal stability and volatility of the analytes or/and their derivatives. Importantly, stability of analyte derivatives (e.g. TMS-derivatives) is essentially limited by the compound molecular weight. In the context of these considerations, semi-polar secondary metabolites (e.g. alkaloids, polyphenol conjugates and polycyclic terpenes), as well as multiple classes of primary metabolites (nucleotides, carbohydrate-phosphates, cofactors, low molecular weight antioxidants and coenzyme A esters) are incompatible with efficient and reliable GC-MS analysis [25,26]. Because of this, an essential portion of important metabolites involved in central energy and biosynthetic pathways are missing in the metabolomics datasets acquired by GC-MS.
Therefore, to get access to the most representative set of low molecular weight metabolites, it is necessary to complement GC-MS methodology with one or several orthogonal analytical platforms which would cover the metabolite classes hardly accessible by GC-MS. Further integration of the outputs from different metabolomics platforms at the data interpretation step would enable comprehensive characterization of the target plant physiological responses at the molecular level [2,4,27]. We are absolutely convinced that this approach, especially in integration with other omics techniques, is currently becoming the mainstream of metabolomics research [28].
Therefore, here we comprehensively review the existing multi-platform metabolomics strategies focusing on the integration of the GC-MS-based workflow with other metabolomics platforms and discuss the prospects of its implementation in multi-omics concepts.
2. Integration of the GC-MS-Based Workflow with Other Metabolomics Platforms
As was mentioned above, only a part of the total plant metabolome can be addressed with one specific instrumental platform. Therefore, the metabolomics datasets, typically acquired in terms of the currently existing workflows, represent only subsets of complex metabolic profiles [29]. Thus, bioinformatics approaches and data analysis tools are required to integrate the information from several datasets acquired by different analytical methods [30]. Despite the impressive development of instrumental setups and data handling strategies, this task still appears to be challenging to date.
Importantly, each separation method is featured with characteristic resolution and sensitivity, which are adjusted with consideration of the chemical and physical properties of the target analyte groups. On the other hand, the dynamics of metabolite patterns, associated with ageing- or stress-induced physiological shifts is a kind of puzzle in which it is necessary to consider as many individual metabolic changes as possible [31,32,33]. In this context, obviously, the overall success of the metabolomics analysis to a high extent is defined by the number of metabolites addressed. Therefore, using a combination of different instrumental platforms might increase the numbers of identified individual compounds, i.e. might improve metabolome coverage and the overall analytical efficiency [34,35]. Over the recent decade, parallel implementation of different instrumental platforms became a gold standard in the metabolomics research. Most often, the corresponding analytical techniques complement each other or even partly “overlap” by their metabolome coverage, that appears to be advantageous [36,37]. Indeed, on one hand, it gives an opportunity to compare the potential of each method within the integrated setups for the analysis of specific individual metabolites (both in the identification and quantification aspects) [38,39,40]. On the other, sample preparation for all individual techniques might be scheduled as a general and universal multi-staged workflow including specific sequential steps to prepare samples for GC–MS, LC–MS and/or spectroscopic analyses [41,42,43]. Typically, it appears to be possible to organize such methods as multi-well high-throughput protocols, which are especially suitable for large-scale experiments.
When designing a multi-platform metabolomics strategy, selection of the techniques to be combined with GC-MS is the key question. In this context, some general and GC-specific considerations need to be addressed.
Generally, when combining different methods, their target analyte groups need to be well-understood and well-defined. For this, in each case, validation experiments might be useful for selecting the most appropriate analytical approach and for precise optimization of the selected method. In terms of such validation, Koistinen and coworkers [44] compared the metabolome coverage obtained with different analytical platforms, including several LC-QqTOF, one LC-QTRAP, one LC-Q-MS, and two GC-MS instruments. The authors proposed an analytical coverage quality control mix consisting of twelve chemical standards, which covered a broad chemical spectrum representing different groups of natural plant products. Based on such information, a specific strategy for integration of LC- and GC-MS methodologies can be developed.
To date, the cross-validation approach is best-established for analysis of amino acids and their derivatives, which can be accessed not only by GC-FID or GC-MS, but also by RP-, IP-, HILIC-(U)HPLC or CE with MS, fluorescence or UV-VIS detection [45]. Combination of those techniques for comprehensive profiling of amino acids was convincingly proved to increase the overall efficiency and reliability of the analysis [46,47]. Recently, this approach was successfully extended to other metabolite classes. For example, Hazrati and coworkers employed LC-QqQ-MS, LC-QqTOF-MS and GC-TOF-MS in a parallel global metabolite profiling of benzoxazinoids in rye [36]. After analysis with uni- and multivariate statistics, the results of such experiments allowed selection of the most suitable methodology to characterize the aglycones and glycosides of benzoxazinoids. This was in agreement with the results of other studies, which indicated that multi-platform metabolomics yields the most complete and representative metabolite profiles of the plant objects on study [48,49].
Considering specifically the analytical potential of GC-MS, it should be noted that the application area of this method is limited to exclusively volatile analytes [50]. Thus, hydrophilic compounds (i.e. non-volatiles) need to be chemically modified to obtain their volatile and thermally stabile derivatives prior to GC-MS analysis [51]. Usually, volatile organic compounds, as well as easy-to-derivatize small hydrophilic molecules and fatty acids are the proper analytes for GC-MS, while the semi-polar secondary metabolites (which are typically well-retainable on the reversed phase in terms of LC-MS methods) can be reliably accessed by RP-HPLC-MS and can be directly analyzed without derivatization [34]. However, some secondary metabolites, in particular, polyphenolic compounds, flavonoids, tannins and proanthocyanidins, can also be analyzed by GC-MS methods after appropriate derivatization [52,53,54]. On the other hand, several groups of primary metabolites appear to be challenging for GC-MS analysis.
The latter aspect should not be underestimated. Indeed, for example, sugar phosphates (which are the intermediates of important central pathways – glycolysis, pentose phosphate and Calvin cycles), nucleotides and some co-factors do not form thermally stable derivatives under the conditions of standard sample preparation protocols and/or their derivatives do not sustain high temperatures required for liquid GC injection in the split-splitless (SSL) injectors and further separation in temperature gradients [55,56]. High complexity of the sugar derivatization patterns, which are represented with at least two reaction products per sugar metabolite, appears to be a less pronounced, although quite important problem [57,58]. Because of these reasons, to get the idea about the dynamics of the primary metabolism (or at least to cover a major part of the principal pathways), the GC-MS analysis needs to be complemented with at least one other hyphenated technique, which gives access to thermally labile primary metabolites. One of the most suitable candidates for such a platform is hydrophilic interaction liquid chromatography, coupled on-line to electrospray ionization mass spectrometry (HILIC-ESI-MS) [59,60]. As this technique relies on the mobile phases based on organic solvents with high dipole moment (acetonitrile, methanol or isopropanol), it allows (with implementation of appropriate desolvatation techniques) the best possible ionization efficiency in the ESI source and, hence, the best accessible MS-sensitivity [61]. Over the last decade, it was successfully applied for comprehensive profiling of primary metabolites (especially amino acids) [62], sugars, sugar acids and phosphates [63,64], lipids [65,66] and many other metabolomics applications comprehensively reviewed by Tang et al [67].
The information on successful integration of HILIC-MS and GC-MS datasets acquired with the same sample sets is limited and is available mostly in the clinical context. Thus, recently Macioszek and co-workers reported a multiplatform study (comprising RP-LC-MS, HILIC-MS and GC-MS) to address the differences between individual KIT (receptor tyrosine kinase) mutants and assessing the impact of imatinib treatment on gastrointestinal stromal tumor tissues in mice [68]. The authors highlighted the stronger, in comparison to HILIC, potential of GC-MS for analysis of polar metabolites, although the metabolome coverage of these two techniques was only partly complementary. Thus, acylcarnitines, characteristic for the tissue response to the imatinib treatment, were available only in the HILIC dataset. The same scheme Kind et al. employed for comprehensive profiling of urine metabolome of cancer patients [69]. In that study, the complementary character of HILIC was more pronounced – this technique appeared to be the most suited for analysis of the glucuronated metabolome. Importantly, HILIC was efficient in analysis of complex conjugated metabolites with the molecular weights of up to 4000 Da, whereas GC-MS performed well with small molecules below 500 Da.
Recently, the multiplatform combination including RP-LC-MS, HILIC-MS and GC-MS was transferred to plants. Thus, Siddajah and co-workers applied the combination of these techniques to comprehensive characterization of the Alangium salviifoliums bark metabolome [70]. The authors reported annotaton of 81 metabolites by their characteristic accurate m/z and fragmentation patterns. Obviously, implementation of the quantitative approach is required as the next step of the GC-MS/HILIC-MS-based plant integrative metabolomics.
Unfortunately, despite the great potential of HILIC for analysis of plant polar metabolites, it has some intrinsic limitations. First, being normal phase distributional chromatography, this method is featured with relatively slow kinetics of analyte interaction with stationary phase [71]. It results in long run times, high consumption of expensive organic solvents, compromised chromatographic efficiency that results in unfavorably high peak width [72,73,74]. The latter fact negatively affects chromatographic resolution, metabolome coverage and sensitivity (due to reduced peak heights). Not less importantly, HILIC is associated with strong sample solubility problems and suffers from complex patterns of unspecific “non-HILIC” interactions of analytes with stationary phase, which affect its retention mechanism [75,76]. To overcome these excessive interactions, sophisticated buffer-based strategies need to be implemented [77]. Despite recent introduction of UHPLC technology and improved amide-based phases in HILIC practice [78,79], the overall performance of the method is still below the standards universally accepted for RP-UHPLC [80].
Therefore, overcoming the major limitation of the reversed phase chromatography (RPC) – poor retention of hydrophilic compounds, might be considered to be a promising strategy for analysis of polar thermolabile compounds, which can be treated as an elegant alternative to HILIC. Indeed, retention of polar metabolites can be dramatically improved by application of ion-pair RPC (IP-RP-(U)HPLC) with alkylamines as ion pair agents [81]. In its most comprehensive version, this method was established in 2000s by the Rabinowitz group [82], and to date it is well-established for analysis of several key classes of polar primary compounds involved in central and energy metabolism, including nucleotides, coenzyme A esters, sugar nucleotides, amino acids, sugar phosphates and bisphosphates [83] with further extension to oligonucleotides [84]. This technique can be efficiently combined with the established GC-MS methodological platform.
Surprisingly, relatively few works report integration of IP-RP-HPLC with GC-MS. One of the first such studies, employing simultaneously these two techniques was reported in the beginning of the last decade by Dietl and co-workers [85]. The authors addressed the role of lactate in tumor necrosis factor (TNF) secretion and glycolysis flux. Thereby, the general metabolite profiling was done with GC-MS, whereas the lactate conversion – by IP-HPLC-QqQ-MS/MS.
Later, the results acquired by GC-quadrupole mass spectrometry with EI ionization (GC-EI-Q-MS) and IP-RP-HPLC-QqQ-MS/MS (the state of the art protocol of Balcke et al [83]) could be successfully integrated at the step of data processing. In terms of this approach, after integration of the characteristic analyte peak areas in corresponding extracted ion chromatograms (XICs), the result tables obtained with both methods were combined in one metabolite matrix (biomatrix) prior to the post-processing (statistical interpretation) step. Recently, Shumilina and co-workers demonstrated that GC-EI-Q-MS revealed 321 thermally stable primary metabolites in the aqueous methanolic extracts from cucumber roots, whereas the RP-IP-HPLC-QqQ-MS-based approach revealed 157 thermally labile metabolites. After merging the two corresponding datasets, a combined result matrix with 391 entries was built and processed with the MetaboAnalyst 5.0 online software tool. Thus, in this case the integration of two metabolomics approaches occurs at the level of statistical and bioinformatics (functional) analysis [86]. Thereby, differentially abundant metabolites were identified and the biological context of these alterations could be addressed by the pathway and enrichment analysis [87].
CE-MS is another promising methodological platform, which can be used complementary to GC-MS for improving the quality and completeness of metabolomics datasets. Indeed, these two techniques appeared to have comparable performance in metabolite profiling [88]. Thus, in early studies, a high level of metabolome coverage similarity was found when CE-MS and GC-MS were used for profiling of amino acids in suspension cultures of Medicago truncatula cells. In these early experiments, CE-MS proved to be an acceptable alternative to GC-MS for targeted profiling of metabolites [46]. Later on, CE-MS was shown to be a powerful method for separation of both cationic (amino acids, nucleosides and small peptides) and anionic (sugar phosphates, nucleotides and organic acids) metabolites [89]. As some of these metabolites (e.g. small peptides of sugar phosphates) are hardly accessible by GC-MS, CE-MS can be considered as a complementary to GC-MS technique.
Further, Kim and co-workers reported parallel GC-TOF-MS and CE-TOF-MS-based comprehensive metabolite profiling of the fast-fermented bean paste (cheonggukjang) inoculated with Bacillus strains to address the accompanying metabolic changes as a function of fermentation time [90]. Application of these two separation methods appeared to be really complementary: among the 123 metabolites discovered, 55% were assigned by GC-MS and 45% were annotated by CE-MS. On the other hand, these two techniques can be complementary for characterization of one specific metabolite group, as was recently shown for extraction-free capillary electrophoresis coupled to mass spectrometry (CE-MS). This complementary character was also shown for direct immersion-solid-phase microextraction (DI-SPME) in the combination with GC-MS (DI-SPME-GC-MS) as applied simultaneously to analysis of biogenic amines in wines [91].
Another approach to address the contents of individual sugar phosphates in plant tissues is ion chromatography (IC). For example, glycolytic intermediates – pyruvate, glucose-6-phosphate, fructose-6-phosphate, fructose-1,6-bisphosphate, phosphoenolpyruvate, and the sum of 2-phosphoglycerate (2PG) and 3-phosphoglycerate (3PG) can be reliably quantified by IC-MS/MS. However, 2PG and 3PG (which co-elute under the IC conditions) can be efficiently separated and precisely analyzed by GC-MS. The same is the case for glyceraldehyde 3-phosphate (GAP) and diacylglycerol diphosphate (DGPP), which are likely to break down in the IC column due to the high concentration of sodium hydroxide used in the gradient [92].
Despite combination of GC-MS with other MS-based techniques is obviously advantageous in terms of metabolome coverage, such setups still suffer from limited structural information, i.e. multiple analytes remain annotated as unknowns. Fortunately, this situation can be essentially improved by implementation of spectroscopic techniques in the MS-based multiplatform workflows [93].
For example, an integrated GC-MS- and LC-MS-based approach can be efficiently combined with spectroscopic techniques for analysis of polysaccharides [94,95,96]. Expectedly, this strategy could give access to high-quality detailed structural information. For example, Honda and co-workers employed it for analysis of acid hydrolysates prepared with extracellular polysaccharide (ECP) after its isolation from tuberose (Polianthes tuberosa) callus cultures [96]. These analyses employed ion exchange column chromatography with sub-sequent GC-MS analysis of the unretained component and two acidic hydrolysate fractions (TPS-1 and 2) to access the contents of its constituent monosaccharides – arabinose, mannose, galactose and glucuronic acid. This dataset was complemented with 1H and 13C NMR spectroscopy after methylation of the polymeric sample [96].
The advantages of NMR spectroscopy as the tool for structural characterization of natural products are universally recognized – currently it is the method of choice and the gold standard for the most reliable feature identification [50,97,98]. Unfortunately, this method is limited to the detection of the most abundant metabolites, whereas MS allows discovery, tentative annotation and quantification of natural products at very low concentrations. One needs to take into account, however, that MS provides only structure confirmation, but not unambiguous identification of plant metabolites. This makes NMR spectroscopy and MS highly complementary tools in the state-of-the-art metabolomics. It is therefore clear, that the combination of these two methodological platforms is likely to improve the overall quality of the study and expand the scope of metabolome applications [93,99]. Thus, due to the obvious advantages of NMR - high productivity, minimal sample preparation required, reasonable sample analysis time (with higher sample amounts), it can be used as a promising extension of the regular GC-MS-based metabolomics workflow to gain a deeper insight in the molecular mechanisms underlying changes in the metabolome [93,98,100].
In particular, Barding and colleagues [101] addressed the stress-associated metabolism rearrangements using 1H NMR and GC-MS to understand the complex biochemical and molecular response of rice plants to water immersion. The high dynamic range of NMR, as compared with that of the GC-TOF-MS provided a broad coverage of the metabolome within a single experiment. Some metabolites, such as S-methylmethionine and the dipeptide alanylglycine, could be detected and quantified only by 1H NMR. The sensitivity of GC-MS allowed the quantification of sugars, organic acids, and amino acids, some of which were not detected by NMR, and provided additional information on the regulation of the TCA cycle [101].
As a metabolite profiling tool, NMR is featured with high accuracy and reproducibility, whereas the limited sensitivity of NMR can be efficiently compensated by the use of multivariate statistics [102]. Moreover, vendor-specific software packages for interpretation of the NMR data are available. For example, Agilent Mass Profiler Professional (MPP, Agilent Technologie, [103]) includes several useful visualization and quantification tools for analysis of the primary metabolomics data. Importantly, this software gives access to the parallel analysis of metabolomics data acquired by LC-MS, GC-MS, CE-MS, ICP-MS and NMR within one project.
To summarize, integrated analytical techniques essentially enlarge the spectrum of detected and efficiently quantified metabolites in comparison to the metabolomics studies based on a single analytical method [104]. Thus, most often the different metabolomic approaches complement each other, and the combination of GC-MS with other metabolomic approaches is a promising and important strategy for metabolomic research aimed at the widest possible coverage of the plant’s metabolome.
3. Implementation of GC-MS in Multi-Omics Strategies of Post-Genomic Analysis
It is well-known that all methodological platforms of post-genomic research (often referred to as omics technologies) represent the valuable sources of rich functional information, which are provided deep inside in dynamics of transcripts, proteins and metabolites in the living cell. However, besides the obvious advantages, all these platforms have intrinsic limitations, mostly associated with sample preparation, sensitivity, precision and reproducibility issues. Combination of several post-genomic platforms in one workflow allows mutual cross-complementation of these limitations. It makes the integrated workflow more powerful and the whole data processing strategy more robust and less prone to generation of false results due to the possibility for cross-validation of the corresponding datasets [50]. On the other hand, the possibility of inter-omics data cross-validation within the multi-omics setups essentially improves the reliability of each individual complementing omics technique.
In the context of the data reliability and quality gain, the inter-omics cross-validation appears to be especially useful for metabolomics. Indeed, among the all-global molecular pools - transcriptome, proteome and metabolome, the latter is featured with the highest plasticity, that is mostly underlined by fast enzyme kinetics and, hence, high rates of metabolite conversion. Because of this reason, plant metabolome is actually a unique snapshot of the intermediates, generated by a complex dynamic metabolite network at the specified moment. Therefore, plant metabolome, assessed in two different (even very close) time points, might be rather different. Due to this highly dynamic character of the metabolome, very often metabolomics data are insufficient to understand the long-term regulatory mechanisms involved in regulation of the metabolic pathways of interest [105]. Therefore, to get a deeper insight into the plant metabolome and to address the physiological role of specific metabolic pathways and/or individual metabolites in a more comprehensive way, metabolomics data need to be considered together with the outputs of transcriptomics and proteomics experiments.
In terms of such multi-omics strategies, metabolomics plays the central role in characterization of the current physiological and metabolic status of the plant, as well as its direct role in plant phenotype, whereas the other omics techniques impact more on the establishment of the molecular mechanisms behind the observed metabolome dynamics, especially in the context of the information encoded in genome [5]. Thus, within the multi—omics workflows, metabolomics occupies the most central (“heart”) position of the whole pipeline, as it gives the critical information about the affected metabolic pathways. At the further step, proteomics and transcriptomics might deliver not only important mechanistic information, but also response-specific markers of the accompanying alterations in the cellular metabolism. As these markers are expected to be more reproducible in time than metabolites, they can contribute to elucidation of the associations between the omics variables and underlying biological functions. This would finally, help to achieve another goal of the multi-omics approach - to provide an essential readout of biological processes for metabolism reprogramming [6].
The availability and rapid development of high throughput and cost-efficient platforms made generation of massive multi-omics data possible. Due to this, the multi-omics strategy gained growing interest of plant scientists over the recent decade that resulted in increasing number of reported integrated multi-omics datasets. GC-MS as one of the powerful analytical techniques in the metabolomics toolbox was successively applied alone [106,107] or in combination with other metabolomics platforms (e.g. UHPLC-MS [108,109], NMR [110], CE-MS [111] in the integrative multi-omics analysis (Figure 1). It contributes in the connection of individual omics variables (metabolites, proteins, transcripts, genes) in network to associate them to a phenotype of interest (e.g. in study on prediction of phenotypic traits [109]) or alteration of phenotype associated with a disease (e.g. chronic social defeat stress rat [106]) or environmental stress [112]. In establishment of such connection, GC-MS plays an important and well-defined role. Indeed, as this technique covers the most of primary metabolites of central biosynthetic and energetic pathways, it became widely implemented in multiple large-scale multi-omics studies aiming understanding development-dependent reprogramming (seedling growth and its modulation by growth-promoting agents [113], seed maturation and storage [108], post-harvest fruit physiology [107]) and stress tolerance mechanisms in different plant systems [114].
Another rationale for implementation of GC-MS in multi-omics research is its valuable impact on crop breeding programs. In this aspect, metabolites are considered as integrators in the complex interaction between the plant genotype and the environment. Interpretation of the metabolomics data collected from plants grown in different environments might be helpful in prediction of the valuable from the agronomic point of view phenotypes and identification of the metabolites that can be used as biomarkers for these traits. This approach, combined with related genomics information, allows accurate identification of the genes and metabolic pathways involved in the formation of agronomically important traits that can be applied in crop breeding programs [105,109].
However, despite the growing interest to the multi-omics approach in scientific communities, integration of several datasets acquired by multiple omics platforms still remains a challenging task [5,6]. Indeed, on one hand, the inter-omics comparisons of experimental designs, instrumental platforms and analytical procedures are not straightforward. Therefore, direct comparisons are difficult and proper integration upon such direct comparisons is hardly possible without proper normalization. The issues to be considered include limited amounts of the tissue samples, high heterogeneity of biological material, differences in abundances and analytical responses of specific biomolecules in the samples, differences in the sample storage regimen and processing, technical artifacts, including batch effects, background contamination, differences in format of integrating omics datasets resulted from measurements fundamentally different biomolecules.
To overcome at least some of these issues, a least of minimal requirements to ensure the dataset compatibility was developed by the society [6]. Thereby, the proposed guidelines relied on the experimental design and analytical workflow specific for metabolomics, that is not surprising in the context of its above mentioned central position in multi-omics workflows due to the largest contribution of metabolite patterns in phenotype [6]. Not less importantly, the metabolomics experimental design appeared to be the most compatible with the other post-genomic platforms. Therefore, following this recommendation would significantly improve the output of multi-omics research.
Another important requirement to be followed to secure high-quality of the multi-omics data integration is inter-set consistence at the level of the plant material. Thus, all parallel omics experiments need to be accomplished with the same plant material, i.e. all analyses need to rely on the same sample set. Ideally, the frozen milled material is weighed from the same tube in several method-specific aliquots.
A comprehensive literature mining and development a well-formulated initial central hypothesis to be addressed in the whole experiment also essentially contributes in the success of the large-scale multi-omics experiment. At this step, a decision about the desired strategy (i.e. experiment type) for integrating the datasets from multiple omics platforms needs to be taken.
To date, several classifications of multi-omics data integration types are known. One of them categorize the integration analyses with respect of the type of the input data, subjected for integration (Figure 2): low-, mid- and high-level data integration (or data fusion) [5]. When the low-level integration (also known as concatenation-based integration) is employed, row or processed data obtained by different omics technologies are combined in a total matrix for further statistical analysis and/or molecular network modeling. This approach gives access to the most complete use of the acquired information and allows preserving information about the interaction between variables from different omics platforms. Thereby, finding the way for an appropriate common representation for datasets from different scales represents the main challenge of the this type of the inter-omics data integration [5]. The issue was successfully overcome by Lopez-Hidalgo and co-workers [115], who applied this type of integration to visualize and partially reconstruct the metabolism in holm oak. In this study, data (i.e. omics variables - transcripts, proteins and metabolites) obtained from analyses of transcriptome (by NGS-Illumina), proteome (by shotgun nanoLC-MS/MS) and metabolome (by GC-MS) were integrated by their EC numbers (transcripts and proteins) and Kyoto Encyclopedia of Genes and Genomes (KEGG) identifies (GC-MS metabolites) to further obtain a holm oak metabolic overview with help of bioinformational tool MapMan.
The mid-level data fusion (also known as the model-based integration) assumes combination of the datasets generated by different omics sources at the data level after selection of meaningful variables [116]. In terms of the concept of high-level data integration (also known as transformation-based integration), original omics datasets are first transformed or mapped to different model responses to indicate relationships between the treatment groups. Afterwards, the models are fused to produce a final response integrative model [5]. For mapping and integration steps, multiple graph- (or network-) based and kernel-based bioinformational algorithms are used [117]. The graph-based methods represent relationships between the sample groups by denoting subjects by nodes and relationships between them by edges. This type of representation provides an easy and straightforward way of data integration. This approach provides good data interpretability and becomes, therefore widely used in omics data integration. Kernel-based methods are used for analysis of high-dimensional data. These methods consider nonlinear effects, and were successfully applied to the capture of important data type-specific effects [117]. The kernel-based approaches have strong prediction power [118].
Implementation of the GC-MS-based workflow in the mid- and high-level integration strategies, supported by the graph-based methods, can be exemplified the works of Shi et al [119], Yun et al [107], Wang et al [113] and Yang et al [106]. In the first study, addressing the effect of the exogenous methyl jasmonate application on the fresh tea leaves, a combination of GC-MS and UHPLC-MS in parallel to an iTRAQ-based proteomics analysis was employed. The subsequent statistical interpretation of the acquired metabolomics and proteomics datasets allowed detection of 100 volatile and 266 nonvolatile metabolites as differentially abundant in addition to a rich pattern of differentially expressed proteins. These differentially abundant outputs of both proteomics and metabolomics were integrated in one result set by KEGG mapping. Based on the raw KEGG maps, the authors designed self-constructed maps which provided explicit visualization of key changes in major biosynthetic pathways of volatile compounds, associated with tea aroma quality.
The strategy of high-level integration of two omics datasets (GC-MS-based metabolomics and iTRAQ/nanoLC-MS-based proteomics) was successfully employed by Yang and co-workers [13] for elucidation of the metabolite and protein dynamics in the hippocampus of rat after chronic social defeat stress. The original GC-MS-based metabolomics dataset was first analyzed by PCA and orthogonal partial least squares discriminant analysis (OPLS-DA) to identify the differentially abundant metabolites. At the next step, pathway and enrichment analyses were accomplished for these regulated metabolites. These analyses yielded preliminary information on the rat metabolic pathways, which were affected by stress treatment. Analogously, all proteins detected in the study were filtered to select a set of differentially expressed polypeptides, which were subjected to hierarchical clustering, gene ontology (GO), KEGG enrichment and protein-protein interaction (String) analyses. These efforts resulted in identification of the pathways, which were putatively associated with depression rat phenotype. At the final step, Ingenuity pathway analysis (including canonical pathway and molecular interaction network analyses) of integrated metabolites and proteins was applied. As the result, intracellular signal transduction cascades (and related secondary messengers) could be highlighted as the most significantly altered in the hippocampus of the depressed rats [106]. One needs to take into account, however, that the high-level integration strategy has some limitations. Thus, as initial models are designed independently, some important information about the potential inter-omics interactions can be lost [5].
Another classification of the integration strategies might rely on the focus of the multi-omics study. In this sense, the multi-omics data integration strategies can be categorized as sequential integration, biological analysis and model-based analysis [5].
The first strategy aims finding the reason for development a certain phenotype rather than prediction of its appearance. The key questions addressed by this strategy are (i) how does the multi-omics data integration help to enhance understanding of the phenotype and (ii) would be application of additional omics data validate the results obtained from the application of each individual omics dataset? The sequential integration typically follows the following conventional scheme: (i) the first step assumes recognition of the genes associated with the phenotypic response to environmental or exogenous treatments/stimuli and integration of the related omics data, (ii) then the genes that can be attributed to specific metabolites and proteins, are involved in the integration pipeline and (iii) the final step assumes the integration of the genes, proteins and metabolites, which were previously annotated to corresponding metabolic pathways among those subjected to the enrichment analysis with the aim to highlight the pathways of interest, most strongly involved in the target response. This strategy is also well applicable to discovery of the biomarkers, characteristic of specific phenotype traits. The sequential integration was applied in number of studies including those employing the GC-MS-based metabolomics setup [107,112,113].
The model-based integration approach relies on the statistics and machine learning methods to prove capacity of the integrative model. This strategy allows significant improvement of the prediction quality and is more resistant to technical and methodological biases for model-based integration. In this approach methods of dimensionality reduction (canonical correlation analysis (CCA), principal component analysis (PCA) and partial least squares (PLS)-derived methods) are of widely used as they focus to find correlation patterns (combinations between variables) and provide information in terms of common and orthogonal components [120]. However, it is not straightforward to quantify the associations between various type variables, and therefore, limiting the overall model-based integration with regards to explanations of mutual interrelationships between variables [116]. In biological integration prior knowledge on metabolism of the biological system under investigation can be used to facilitate an interpretation of the results obtained by the dimensionality reduction methods. The main purpose of this approach is to establish molecular mechanisms (i.e. biological meaning) on interacting variables obtained from various omics platforms. Thus, the biological integration focuses on uncovering of the biological meanings (metabolic, regulatory and signaling mechanisms) from the functional information acquired by interacting different omics variables for biological integration [5]. In general, both strategies (model-based and biological integrations) can exploit the same panel of statistical methods for data integration. However, the former approach via the methods only seeks statistically significant associations, while the latter uses the methods in combination with biological knowledge to drive underlying biological mechanisms.
The study of Acharjee and co-authors demonstrated the power of the random forest regression in integrating multiple omics data (which included gene expression, LC-MS, GC-MS and proteomics data sets) for prediction of four quality traits of potato [109]. In terms of the biological integration setup, a special emphasis is put on the importance of the previously collected knowledge about the metabolism of the biological object in study. Thus, the previously collected information serves to enhance the interpretability of the resulting statistical output of interacting omics variables. Multiple multi-omics studies including the GC-MS-based setups for analysis of primary metabolites in a design of multi-omics experiment often employ the biological integration strategy [107,112,113]. The reason for this might be the high analytical power of the GC-MS-based profiling of primary metabolites. It allows relatively easy and straightforward mapping of the processes, potentially essential for maintaining cellular homeostasis, stress-induced adaptations, plant growth and development. Therefore, as GC-MS delivers this critical core information, in the integration workflows of this type, the corresponding datasets usually act as the starting point of omics data co-interpretation. Complementary information, delivered by other omics, allows better understanding of the biological roles of the assigned pathways in terms of the associations found in the multi-omics experiment.
4. Conclusions
Taking together, the use of multiple omics techniques for generation and interpretation of the complementary datasets from the same samples provides a deeper insight in the molecular mechanisms behind the morphological and physiological responses, observable at the level of phenotype. Thereby, implementation of the GC-MS-based profiling of polar metabolites in the multi-omics workflows provides the key meaningful information. On the other hand, the multi-omics experiment brings multiple challenges regarding analytical procedures, data processing and integration of the GC-MS data with other platforms. However, due to the development of new powerful analytical platforms, data science and bioinformatics, these challenges can be overcome. For this, special requirements for the proper design of the multi-omics experiment were established in the post-genomics society. Thus, currently, the multi-source data integration remains a real “bottleneck” in all multi-omics studies. Obviously, this aspect will be the mainstream of the multi-omics research of the coming decade. New and more powerful algorithms need to be proposed for multi-omics data integration and interpretation. However, their diversity without comprehensive comparison of their performance makes the selection of appropriate tools still difficult.
Author Contributions
N.F., T.B. and A.F. proposed the idea of the manuscript and contributed to its conceptualization. N.F., T.B., A.G. and A.O. contributed in writing the first draft and critical discussion. A.F. and T.B. supervised the whole work and wrote the final draft of the manuscript. All authors contributed in writing final draft of the manuscript and have read and agreed to the published version of the manuscript.
Funding
This research was funded by the Russian Science Foundation. Thereby integrative metabolomics was elaborated in term s of the project # P22-16-00047 , while the multiomics part was supported by the project # 25-24-00575.
Acknowledgments
The infrastructural support provided by the K.A. Timiryazev Institute of Plant Physiology, Russian Academy of Sciences (theme no. 122042700044-6) is acknowledged.
Conflicts of Interest
The authors declare no conflict of interest.
Abbreviations
| 2PG | 2-phosphoglycerate |
| 3PG | 3-phosphoglycerate |
| CE | Capillary electrophoresis |
| CE-MS | Capillary electrophoresis-mass spectrometry |
| CE-TOF-MS | Capillary electrophoresis-time-of-flight-mass spectrometer |
| CoA | Coenzyme A |
| DGPP | Diacylglycerol diphosphate |
| DI-SPME-GC-MS | Direct immersion-solid-phase microextraction-gas chromatography-mass spectrometry |
| EC numbers | Enzyme commission number |
| ECP | Extracellular polysaccharide |
| EI | Electron impact |
| ESI | Electrospray |
| GAP | Glyceraldehyde 3-phosphate |
| GC-EI-Q-MS | GC-quadrupole mass spectrometry with EI ionization |
| GC-FID | Gas chromatography-flame ionization detector |
| GC-MS | Gas chromatography-mass spectrometry |
| GC-TOF-MS | Gas chromatography combined with time-of-flight mass spectrometry |
| GO | Gene ontology |
| HILIC | Hydrophilic interaction chromatography |
| HILIC-(U)HPLC | Hydrophilic interaction-high performance liquid chromatography |
| HILIC-ESI-MS | Hydrophilic interaction chromatography-electrospray-mass spectrometry |
| HILIC-MS | Hydrophilic interaction chromatography-mass spectrometry |
| IC | Ion chromatography |
| IC-MS/MS | Ion chromatography-tandem mass spectrometry |
| IP | Ion paired |
| IP-HPLC-QqQ-MS/MS | Ion pared high performance liquid chromatography coupled with triple quadrupole tandem mass spectrometry |
| IP-RP-(U)HPLC | Ion pared-reversed phase-(ultra) high performance liquid chromatography |
| iTRAQ | Isobaric tags for relative and absolute quantification |
| KEGG | Kyoto Encyclopedia of Genes and Genomes |
| KIT | Tyrosine kinase |
| LC-MS | Liquid chromatography-mass spectrometry |
| LC-Q-MS | Liquid chromatography-quadrupole mass spectrometry |
| LC-QqQ-MS | Liquid chromatography-triple quadrupole-mass spectrometry |
| LC-QqTOF | Liquid chromatography-quadrupole time-of-flight mass spectrometer |
| LC-QqTOF-MS | Liquid chromatography-quadrupole time-of-flight mass spectrometry |
| LC-QTRAP | Liquid chromatography-quadrupole ion trap mass spectrometer |
| MPP | Mass Profiler Professional |
| mRNA | Messenger RNA |
| MS | Mass spectrometry |
| NGS | Next generation sequencing |
| NMR | Nuclear magnetic resonance |
| OPLS-DA | Orthogonal partial least squares-discriminant analysis |
| RP | Reversed phase |
| RPC | Reversed phase chromatography |
| RP-HPLC-MS | Reversed phase-high performance liquid chromatography-mass spectrometry |
| RP-LC-MS | Reversed phase-liquid chromatography-mass spectrometry |
| RP-UHPLC | Reversed phase-ultra-high performance liquid chromatography |
| TCA cycle | Tricarboxylic acid cycle |
| TMS | Trimethylsilyl |
| TNF | Tumor necrosis factor |
| UHPLC | Ultra high performance liquid chromatography |
| UV-VIS | Ultraviolet-visible spectroscopy |
| XICs | Extracted ion chromatograms |
References
- Hao, Y.; Zhang, Z.; Luo, E.; Yang, J.; Wang, S. Plant metabolomics: applications and challenges in the era of multi-omics big data. aBIOTECH 2025, 6, 116–132. [Google Scholar] [CrossRef] [PubMed]
- Yan, S.; Bhawal, R.; Yin, Z.; Thannhauser, T.W.; Zhang, S. Recent advances in proteomics and metabolomics in plants. Molecular Horticulture 2022, 2, 17. [Google Scholar] [CrossRef]
- Klčová, B.; Balarynová, J.; Trněný, O.; Krejčí, P.; Cechová, M.Z.; Leonova, T.; Gorbach, D.; Frolova, N.; Kysil, E.; Orlova, A.; et al. Domestication has altered gene expression and secondary metabolites in pea seed coat. Plant J 2024. [Google Scholar] [CrossRef]
- Frolova, N.; Gorbach, D.; Ihling, C.; Bilova, T.; Orlova, A.; Lukasheva, E.; Fedoseeva, K.; Dodueva, I.; Lutova, L.A.; Frolov, A. Proteome and Metabolome Alterations in Radish (Raphanus sativus L.) Seedlings Induced by Inoculation with Agrobacterium tumefaciens. Biomolecules 2025, 15, 290. [Google Scholar] [CrossRef] [PubMed]
- Jendoubi, T. Approaches to Integrating Metabolomics and Multi-Omics Data: A Primer. Metabolites 2021, 11, 184. [Google Scholar] [CrossRef]
- Pinu, F.R.; Beale, D.J.; Paten, A.M.; Kouremenos, K.; Swarup, S.; Schirra, H.J.; Wishart, D. Systems Biology and Multi-Omics Integration: Viewpoints from the Metabolomics Research Community. Metabolites 2019, 9, 76. [Google Scholar] [CrossRef] [PubMed]
- Bais, P.; Moon, S.M.; He, K.; Leitao, R.; Dreher, K.; Walk, T.; Sucaet, Y.; Barkan, L.; Wohlgemuth, G.; Roth, M.R.; et al. PlantMetabolomics.org: A Web Portal for Plant Metabolomics Experiments. Plant Physiol. 2010, 152, 1807–1816. [Google Scholar] [CrossRef]
- Lanier, E.R.; Andersen, T.B.; Hamberger, B. Plant terpene specialized metabolism: complex networks or simple linear pathways? Plant J 2023, 114, 1178–1201. [Google Scholar] [CrossRef]
- Ji, W.; Osbourn, A.; Liu, Z. Understanding metabolic diversification in plants: branchpoints in the evolution of specialized metabolism. Philos Trans R Soc Lond B Biol Sci 2024, 379, 20230359. [Google Scholar] [CrossRef]
- Wase, N.; Abshire, N.; Obata, T. High-Throughput Profiling of Metabolic Phenotypes Using High-Resolution GC-MS. Methods Mol Biol 2022, 2539, 235–260. [Google Scholar] [CrossRef]
- Choudhury, F.K.; Pandey, P.; Meitei, R.; Cardona, D.; Gujar, A.C.; Shulaev, V. GC-MS/MS Profiling of Plant Metabolites. Methods Mol Biol 2022, 2396, 101–115. [Google Scholar] [CrossRef] [PubMed]
- Yun, Z.; Li, T.; Gao, H.; Zhu, H.; Gupta, V.K.; Jiang, Y.; Duan, X. Integrated Transcriptomic, Proteomic, and Metabolomics Analysis Reveals Peel Ripening of Harvested Banana under Natural Condition. Biomolecules 2019, 9, 167. [Google Scholar] [CrossRef]
- Yang, L.-N.; Pu, J.-C.; Liu, L.-X.; Wang, G.-W.; Zhou, X.-Y.; Zhang, Y.-Q.; Liu, Y.-Y.; Xie, P. Integrated Metabolomics and Proteomics Analysis Revealed Second Messenger System Disturbance in Hippocampus of Chronic Social Defeat Stress Rat. Front Neurosci 2019, 13, 247. [Google Scholar] [CrossRef]
- Osmolovskaya, N.; Bilova, T.; Gurina, A.; Orlova, A.; Vu, V.D.; Sukhikh, S.; Zhilkina, T.; Frolova, N.; Tarakhovskaya, E.; Kamionskaya, A.; et al. Metabolic Responses of Amaranthus caudatus Roots and Leaves to Zinc Stress. Plants (Basel) 2025, 14, 2119. [Google Scholar] [CrossRef]
- Asteggiano, A.; Occhipinti, A.; Capuzzo, A.; Mecarelli, E.; Aigotti, R.; Medana, C. Quali-Quantitative Characterization of Volatile and Non-Volatile Compounds in Protium heptaphyllum (Aubl.) Marchand Resin by GC-MS Validated Method, GC-FID and HPLC-HRMS2. Molecules 2021, 26, 1447. [Google Scholar] [CrossRef]
- Papadimitropoulos, M.-E.P.; Vasilopoulou, C.G.; Maga-Nteve, C.; Klapa, M.I. Untargeted GC-MS Metabolomics. Methods Mol Biol 2018, 1738, 133–147. [Google Scholar] [CrossRef]
- Lisec, J.; Schauer, N.; Kopka, J.; Willmitzer, L.; Fernie, A.R. Gas chromatography mass spectrometry-based metabolite profiling in plants. Nat Protoc 2006, 1, 387–396. [Google Scholar] [CrossRef] [PubMed]
- Erban, A.; Martinez-Seidel, F.; Rajarathinam, Y.; Dethloff, F.; Orf, I.; Fehrle, I.; Alpers, J.; Beine-Golovchuk, O.; Kopka, J. Multiplexed Profiling and Data Processing Methods to Identify Temperature-Regulated Primary Metabolites Using Gas Chromatography Coupled to Mass Spectrometry. Methods Mol Biol 2020, 2156, 203–239. [Google Scholar] [CrossRef] [PubMed]
- Frolov, A.; Bilova, T.; Paudel, G.; Berger, R.; Balcke, G.U.; Birkemeyer, C.; Wessjohann, L.A. Early responses of mature Arabidopsis thaliana plants to reduced water potential in the agar-based polyethylene glycol infusion drought model. J Plant Physiol 2017, 208, 70–83. [Google Scholar] [CrossRef]
- Sharma, S.; Kumar, M.; Sircar, D.; Prasad, R. Metabolic profiling and biomarkers identification in cluster bean under drought stress using GC-MS technique. Metabolomics 2024, 20, 80. [Google Scholar] [CrossRef]
- Szablińska-Piernik, J.; Lahuta, L.B. Polar Metabolites Profiling of Wheat Shoots (Triticum aestivum L.) under Repeated Short-Term Soil Drought and Rewatering. Int J Mol Sci 2023, 24, 8429. [Google Scholar] [CrossRef]
- Maciel, E.V.S.; Pereira Dos Santos, N.G.; Vargas Medina, D.A.; Lanças, F.M. Electron ionization mass spectrometry: Quo vadis? Electrophoresis 2022, 43, 1587–1600. [Google Scholar] [CrossRef]
- Scalbert, A.; Brennan, L.; Fiehn, O.; Hankemeier, T.; Kristal, B.S.; van Ommen, B.; Pujos-Guillot, E.; Verheij, E.; Wishart, D.; Wopereis, S. Mass-spectrometry-based metabolomics: limitations and recommendations for future progress with particular focus on nutrition research. Metabolomics 2009, 5, 435–458. [Google Scholar] [CrossRef]
- Shepherd, T.; Dobson, G.; Verrall, S.R.; Conner, S.; Griffiths, D.Wynne.; McNicol, J.W.; Davies, H.V.; Stewart, D. Potato metabolomics by GC–MS: what are the limiting factors? Metabolomics 2007, 3, 475–488. [Google Scholar] [CrossRef]
- Wang, Y.-T.; Yang, Y.; Sun, X.-L.; Ji, J. [Development of a widely-targeted metabolomics method based on gas chromatography-mass spectrometry]. Se Pu 2023, 41, 520–526. [Google Scholar] [CrossRef]
- Beale, D.J.; Pinu, F.R.; Kouremenos, K.A.; Poojary, M.M.; Narayana, V.K.; Boughton, B.A.; Kanojia, K.; Dayalan, S.; Jones, O.A.H.; Dias, D.A. Review of recent developments in GC-MS approaches to metabolomics-based research. Metabolomics 2018, 14, 152. [Google Scholar] [CrossRef] [PubMed]
- Shumilina, J.; Kiryushkin, A.S.; Frolova, N.; Mashkina, V.; Ilina, E.L.; Puchkova, V.A.; Danko, K.; Silinskaya, S.; Serebryakov, E.B.; Soboleva, A.; et al. Integrative Proteomics and Metabolomics Analysis Reveals the Role of Small Signaling Peptide Rapid Alkalinization Factor 34 (RALF34) in Cucumber Roots. Int J Mol Sci 2023, 24, 7654. [Google Scholar] [CrossRef]
- Pandita, D.; Pandita, A.; Wani, S.H.; Abdelmohsen, S.A.M.; Alyousef, H.A.; Abdelbacki, A.M.M.; Al-Yafrasi, M.A.; Al-Mana, F.A.; Elansary, H.O. Crosstalk of Multi-Omics Platforms with Plants of Therapeutic Importance. Cells 2021, 10, 1296. [Google Scholar] [CrossRef] [PubMed]
- Chen, Y.; Li, E.-M.; Xu, L.-Y. Guide to Metabolomics Analysis: A Bioinformatics Workflow. Metabolites 2022, 12, 357. [Google Scholar] [CrossRef]
- López-Hidalgo, C.; Guerrero-Sánchez, V.M.; Gómez-Gálvez, I.; Sánchez-Lucas, R.; Castillejo-Sánchez, M.A.; Maldonado-Alconada, A.M.; Valledor, L.; Jorrín-Novo, J.V. A Multi-Omics Analysis Pipeline for the Metabolic Pathway Reconstruction in the Orphan Species Quercus ilex. Front Plant Sci 2018, 9, 935. [Google Scholar] [CrossRef] [PubMed]
- Sardans, J.; Gargallo-Garriga, A.; Urban, O.; Klem, K.; Walker, T.W.N.; Holub, P.; Janssens, I.A.; Peñuelas, J. Ecometabolomics for a Better Understanding of Plant Responses and Acclimation to Abiotic Factors Linked to Global Change. Metabolites 2020, 10, 239. [Google Scholar] [CrossRef] [PubMed]
- Dokwal, D.; Cocuron, J.-C.; Alonso, A.P.; Dickstein, R. Metabolite shift in Medicago truncatula occurs in phosphorus deprivation. Journal of Experimental Botany 2022, 73, 2093–2111. [Google Scholar] [CrossRef]
- Garcia-Molina, A.; Pastor, V. Systemic analysis of metabolome reconfiguration in Arabidopsis after abiotic stressors uncovers metabolites that modulate defense against pathogens. Plant Communications 2023, 100645. [Google Scholar] [CrossRef]
- Zeki, Ö.C.; Eylem, C.C.; Reçber, T.; Kır, S.; Nemutlu, E. Integration of GC–MS and LC–MS for untargeted metabolomics profiling. Journal of Pharmaceutical and Biomedical Analysis 2020, 190, 113509. [Google Scholar] [CrossRef]
- Fang, X.; Liu, Y.; Xiao, J.; Ma, C.; Huang, Y. GC–MS and LC-MS/MS metabolomics revealed dynamic changes of volatile and non-volatile compounds during withering process of black tea. Food Chemistry 2023, 410, 135396. [Google Scholar] [CrossRef]
- Hazrati, H.; Kudsk, P.; Ding, L.; Uthe, H.; Fomsgaard, I.S. Integrated LC–MS and GC–MS-Based Metabolomics Reveal the Effects of Plant Competition on the Rye Metabolome. J. Agric. Food Chem. 2022, 70, 3056–3066. [Google Scholar] [CrossRef]
- Wang, X.; Jiang, M.; Lou, J.; Zou, Y.; Liu, M.; Li, Z.; Guo, D.; Yang, W. Pseudotargeted Metabolomics Approach Enabling the Classification-Induced Ginsenoside Characterization and Differentiation of Ginseng and Its Compound Formulation Products. J. Agric. Food Chem. 2023, 71, 1735–1747. [Google Scholar] [CrossRef]
- Sixto, A.; Pérez-Parada, A.; Niell, S.; Heinzen, H. GC–MS and LC–MS/MS workflows for the identification and quantitation of pyrrolizidine alkaloids in plant extracts, a case study: Echium plantagineum. Revista Brasileira de Farmacognosia 2019, 29, 500–503. [Google Scholar] [CrossRef]
- Qi, J.; Pang, Y.; An, P.; Jiang, G.; Kong, Q.; Ren, X. Determination of metabolites of Geotrichum citri-aurantii treated with peppermint oil using liquid chromatography-mass spectrometry and gas chromatography-mass spectrometry. J Food Biochem 2019, 43, e12745. [Google Scholar] [CrossRef]
- Bakir, S.; Hall, R.D.; De Vos, R.C.H.; Mumm, R.; Kadakal, Ç.; Capanoglu, E. Effect of drying treatments on the global metabolome and health-related compounds in tomatoes. Food Chemistry 2023, 403, 134123. [Google Scholar] [CrossRef] [PubMed]
- Zeki, Ö.C.; Eylem, C.C.; Reçber, T.; Kır, S.; Nemutlu, E. Integration of GC-MS and LC-MS for untargeted metabolomics profiling. J Pharm Biomed Anal 2020, 190, 113509. [Google Scholar] [CrossRef] [PubMed]
- t’Kindt, R.; Morreel, K.; Deforce, D.; Boerjan, W.; Van Bocxlaer, J. Joint GC-MS and LC-MS platforms for comprehensive plant metabolomics: repeatability and sample pre-treatment. J Chromatogr B Analyt Technol Biomed Life Sci 2009, 877, 3572–3580. [Google Scholar] [CrossRef]
- Hazrati, H.; Kudsk, P.; Ding, L.; Uthe, H.; Fomsgaard, I.S. Integrated LC-MS and GC-MS-Based Metabolomics Reveal the Effects of Plant Competition on the Rye Metabolome. J Agric Food Chem 2022, 70, 3056–3066. [Google Scholar] [CrossRef]
- Koistinen, V.M.; Da Silva, A.B.; Abrankó, L.; Low, D.; Villalba, R.G.; Barberán, F.T.; Landberg, R.; Savolainen, O.; Alvarez-Acero, I.; De Pascual-Teresa, S.; et al. Interlaboratory Coverage Test on Plant Food Bioactive Compounds and their Metabolites by Mass Spectrometry-Based Untargeted Metabolomics. Metabolites 2018, 8, 46. [Google Scholar] [CrossRef]
- Kambhampati, S.; Li, J.; Evans, B.S.; Allen, D.K. Accurate and efficient amino acid analysis for protein quantification using hydrophilic interaction chromatography coupled tandem mass spectrometry. Plant Methods 2019, 15, 46. [Google Scholar] [CrossRef]
- Williams, B.J.; Cameron, C.J.; Workman, R.; Broeckling, C.D.; Sumner, L.W.; Smith, J.T. Amino acid profiling in plant cell cultures: an inter-laboratory comparison of CE-MS and GC-MS. Electrophoresis 2007, 28, 1371–1379. [Google Scholar] [CrossRef]
- Halket, J.; Waterman, D.; Przyborowska, A.; Patel, R.; Fraser, P.; Bramley, P. Chemical derivatization and mass spectral libraries in metabolic profiling by GC/MS and LC/MS/MS. Journal of experimental botany 2005, 56, 219–243. [Google Scholar] [CrossRef]
- Chen, Q.; Lu, X.; Guo, X.; Guo, Q.; Li, D. Metabolomics Characterization of Two Apocynaceae Plants, Catharanthus roseus and Vinca minor, Using GC-MS and LC-MS Methods in Combination. Molecules 2017, 22, 997. [Google Scholar] [CrossRef]
- Bénard, C.; Acket, S.; Rossez, Y.; Fernandez, O.; Berton, T.; Gibon, Y.; Cabasson, C. Untargeted Analysis of Semipolar Compounds by LC-MS and Targeted Analysis of Fatty Acids by GC-MS/GC-FID: From Plant Cultivation to Extract Preparation. In Plant Metabolomics; António, C., Ed.; Methods in Molecular Biology; Springer New York: New York, NY, 2018; Vol. 1778, pp. 101–124. ISBN 978-1-4939-7818-2. [Google Scholar]
- Patel, M.K.; Pandey, S.; Kumar, M.; Haque, M.I.; Pal, S.; Yadav, N.S. Plants Metabolome Study: Emerging Tools and Techniques. Plants (Basel) 2021, 10, 2409. [Google Scholar] [CrossRef] [PubMed]
- Fiehn, O. Metabolomics by Gas Chromatography–Mass Spectrometry: Combined Targeted and Untargeted Profiling. CP Molecular Biology 2016, 114. [Google Scholar] [CrossRef] [PubMed]
- Alonso, A.-M.; Reyes-Maldonado, O.K.; Puebla-Pérez, A.M.; Arreola, M.P.G.; Velasco-Ramírez, S.F.; Zúñiga-Mayo, V.; Sánchez-Fernández, R.E.; Delgado-Saucedo, J.-I.; Velázquez-Juárez, G. GC/MS Analysis, Antioxidant Activity, and Antimicrobial Effect of Pelargonium peltatum (Geraniaceae). Molecules 2022, 27, 3436. [Google Scholar] [CrossRef] [PubMed]
- Naz, R.; Roberts, T.H.; Bano, A.; Nosheen, A.; Yasmin, H.; Hassan, M.N.; Keyani, R.; Ullah, S.; Khan, W.; Anwar, Z. GC-MS analysis, antimicrobial, antioxidant, antilipoxygenase and cytotoxic activities of Jacaranda mimosifolia methanol leaf extracts and fractions. PLoS ONE 2020, 15, e0236319. [Google Scholar] [CrossRef]
- Amalraj, S.; Murugan, R.; Gangapriya, P.; Krupa, J.; Divya, M.; Gurav, S.S.; Ayyanar, M. Evaluation of phytochemicals, enzyme inhibitory, antibacterial and antioxidant effects of Psydrax dicoccos Gaertn. Natural Product Research 2022, 36, 5772–5777. [Google Scholar] [CrossRef]
- Flanigan, I.L.; MacLeod, J.K.; Williams, J.F. A re-investigation of the path of carbon in photosynthesis utilizing GC/MS methodology. Unequivocal verification of the participation of octulose phosphates in the pathway. Photosynth Res 2006, 90, 149–159. [Google Scholar] [CrossRef]
- Jayasinghe, N.S.; Mendis, H.; Roessner, U.; Dias, D.A. Quantification of Sugars and Organic Acids in Biological Matrices Using GC-QqQ-MS. In Plant Metabolomics; António, C., Ed.; Methods in Molecular Biology; Springer New York: New York, NY, 2018; Vol. 1778, pp. 207–223. ISBN 978-1-4939-7818-2. [Google Scholar]
- Ruiz-Matute, A.I.; Hernández-Hernández, O.; Rodríguez-Sánchez, S.; Sanz, M.L.; Martínez-Castro, I. Derivatization of carbohydrates for GC and GC-MS analyses. J Chromatogr B Analyt Technol Biomed Life Sci 2011, 879, 1226–1240. [Google Scholar] [CrossRef]
- Harvey, D.J. Derivatization of carbohydrates for analysis by chromatography; electrophoresis and mass spectrometry. Journal of Chromatography B 2011, 879, 1196–1225. [Google Scholar] [CrossRef] [PubMed]
- Shen, Y.; Liang, J.; Guo, Y.-L.; Li, Y.; Kuang, H.-X.; Xia, Y.-G. Ultrafiltration isolation, structures and anti-tumor potentials of two arabinose- and galactose-rich pectins from leaves of Aralia elata. Carbohydrate Polymers 2021, 255, 117326. [Google Scholar] [CrossRef]
- Prandi, B.; Baldassarre, S.; Babbar, N.; Bancalari, E.; Vandezande, P.; Hermans, D.; Bruggeman, G.; Gatti, M.; Elst, K.; Sforza, S. Pectin oligosaccharides from sugar beet pulp: molecular characterization and potential prebiotic activity. Food Funct. 2018, 9, 1557–1569. [Google Scholar] [CrossRef]
- Tipke, I.; Bücker, L.; Middelstaedt, J.; Winterhalter, P.; Lubienski, M.; Beuerle, T. HILIC HPLC-ESI-MS/MS identification and quantification of the alkaloids from the genus Equisetum. Phytochemical Analysis 2019, 30, 669–678. [Google Scholar] [CrossRef] [PubMed]
- Letzel, T.; Grassmann, J.; Wahman, R.; Schröder, P. Plant Metabolomic Workflows Using Reversed-Phase LC and HILIC with ESI-TOF-MS. 2019, 34, 8–15. [Google Scholar]
- Mathon, C.; Barding, G.A.; Larive, C.K. Separation of ten phosphorylated mono-and disaccharides using HILIC and ion-pairing interactions. Analytica Chimica Acta 2017, 972, 102–110. [Google Scholar] [CrossRef] [PubMed]
- Koley, S.; Chu, K.L.; Gill, S.S.; Allen, D.K. An efficient LC-MS method for isomer separation and detection of sugars, phosphorylated sugars, and organic acids. Journal of Experimental Botany 2022, 73, 2938–2952. [Google Scholar] [CrossRef] [PubMed]
- Castellaneta, A.; Losito, I.; Losacco, V.; Leoni, B.; Santamaria, P.; Calvano, C.D.; Cataldi, T.R.I. HILIC-ESI-MS analysis of phosphatidic acid methyl esters artificially generated during lipid extraction from microgreen crops. J Mass Spectrom 2021, 56, e4784. [Google Scholar] [CrossRef]
- Hájek, R.; Lísa, M.; Khalikova, M.; Jirásko, R.; Cífková, E.; Študent, V.; Vrána, D.; Opálka, L.; Vávrová, K.; Matzenauer, M.; et al. HILIC/ESI-MS determination of gangliosides and other polar lipid classes in renal cell carcinoma and surrounding normal tissues. Anal Bioanal Chem 2018, 410, 6585–6594. [Google Scholar] [CrossRef]
- Tang, D.; Zou, L.; Yin, X.; Ong, C.N. HILIC-MS for metabolomics: An attractive and complementary approach to RPLC-MS. Mass Spectrometry Reviews 2016, 35, 574–600. [Google Scholar] [CrossRef]
- Macioszek, S.; Dudzik, D.; Biesemans, M.; Wozniak, A.; Schöffski, P.; Markuszewski, M.J. A multiplatform metabolomics approach for comprehensive analysis of GIST xenografts with various KIT mutations. Analyst 2023, 148, 3883–3891. [Google Scholar] [CrossRef]
- Kind, T.; Tolstikov, V.; Fiehn, O.; Weiss, R.H. A comprehensive urinary metabolomic approach for identifying kidney cancerr. Anal Biochem 2007, 363, 185–195. [Google Scholar] [CrossRef]
- Siddaiah, C.; Kumar Bm, A.; Deepak, S.A.; Lateef, S.S.; Nagpal, S.; Rangappa, K.S.; Mohan, C.D.; Rangappa, S.; Kumar S, M.; Sharma, M.; et al. Metabolite Profiling of Alangium salviifolium Bark Using Advanced LC/MS and GC/Q-TOFTechnology. Cells 2020, 10, 1. [Google Scholar] [CrossRef]
- Jandera, P. Stationary and mobile phases in hydrophilic interaction chromatography: a review. Analytica Chimica Acta 2011, 692, 1–25. [Google Scholar] [CrossRef]
- Kawachi, Y.; Ikegami, T.; Takubo, H.; Ikegami, Y.; Miyamoto, M.; Tanaka, N. Chromatographic characterization of hydrophilic interaction liquid chromatography stationary phases: Hydrophilicity, charge effects, structural selectivity, and separation efficiency. Journal of Chromatography A 2011, 1218, 5903–5919. [Google Scholar] [CrossRef] [PubMed]
- McCalley, D.V. Study of the selectivity, retention mechanisms and performance of alternative silica-based stationary phases for separation of ionised solutes in hydrophilic interaction chromatography. Journal of Chromatography A 2010, 1217, 3408–3417. [Google Scholar] [CrossRef]
- Dolci, M. Technical Note: Hydrophilic Interaction Liquid Chromatography: Some Aspects of Solvent and Column Selectivity.
- Li, H.; Liu, C.; Zhao, L.; Xu, D.; Zhang, T.; Wang, Q.; Cabooter, D.; Jiang, Z. A systematic investigation of the effect of sample solvent on peak shape in nano- and microflow hydrophilic interaction liquid chromatography columns. J Chromatogr A 2021, 1655, 462498. [Google Scholar] [CrossRef]
- Krumpochova, P.; Bruyneel, B.; Molenaar, D.; Koukou, A.; Wuhrer, M.; Niessen, W.M.A.; Giera, M. Amino acid analysis using chromatography-mass spectrometry: An inter platform comparison study. J Pharm Biomed Anal 2015, 114, 398–407. [Google Scholar] [CrossRef]
- Liu, Z.; Rochfort, S. Recent progress in polar metabolite quantification in plants using liquid chromatography–mass spectrometry. JIPB 2014, 56, 816–825. [Google Scholar] [CrossRef]
- Lara-Almazán, N.; Zarazúa-Ortega, G.; Ávila-Pérez, P.; Barrera-Díaz, C.E.; Cedillo-Cruz, A. Validation and uncertainty estimation of analytical method for quantification of phytochelatins in aquatic plants by UPLC-MS. Phytochemistry 2021, 183, 112643. [Google Scholar] [CrossRef]
- Li, Z.; Li, S.; Zhang, F.; Geng, H.; Yang, B. A hydrolytically stable amide polar stationary phase for hydrophilic interaction chromatography. Talanta 2021, 231, 122340. [Google Scholar] [CrossRef] [PubMed]
- Sahu, P.K.; Ramisetti, N.R.; Cecchi, T.; Swain, S.; Patro, C.S.; Panda, J. An overview of experimental designs in HPLC method development and validation. Journal of Pharmaceutical and Biomedical Analysis 2018, 147, 590–611. [Google Scholar] [CrossRef] [PubMed]
- Donegan, M.; Nguyen, J.M.; Gilar, M. Effect of ion-pairing reagent hydrophobicity on liquid chromatography and mass spectrometry analysis of oligonucleotides. Journal of Chromatography A 2022, 1666, 462860. [Google Scholar] [CrossRef]
- Bajad, S.U.; Lu, W.; Kimball, E.H.; Yuan, J.; Peterson, C.; Rabinowitz, J.D. Separation and quantitation of water soluble cellular metabolites by hydrophilic interaction chromatography-tandem mass spectrometry. Journal of Chromatography A 2006, 1125, 76–88. [Google Scholar] [CrossRef]
- Balcke, G.U.; Bennewitz, S.; Bergau, N.; Athmer, B.; Henning, A.; Majovsky, P.; Jiménez-Gómez, J.M.; Hoehenwarter, W.; Tissier, A. Multi-Omics of Tomato Glandular Trichomes Reveals Distinct Features of Central Carbon Metabolism Supporting High Productivity of Specialized Metabolites. Plant Cell 2017, 29, 960–983. [Google Scholar] [CrossRef] [PubMed]
- Gong, L. Comparing ion-pairing reagents and counter anions for ion-pair reversed-phase liquid chromatography/electrospray ionization mass spectrometry analysis of synthetic oligonucleotides. Rapid Comm Mass Spectrometry 2015, 29, 2402–2410. [Google Scholar] [CrossRef]
- Dietl, K.; Renner, K.; Dettmer, K.; Timischl, B.; Eberhart, K.; Dorn, C.; Hellerbrand, C.; Kastenberger, M.; Kunz-Schughart, L.A.; Oefner, P.J.; et al. Lactic Acid and Acidification Inhibit TNF Secretion and Glycolysis of Human Monocytes. The Journal of Immunology 2010, 184, 1200–1209. [Google Scholar] [CrossRef]
- Shumilina, J.; Kiryushkin, A.S.; Frolova, N.; Mashkina, V.; Ilina, E.L.; Puchkova, V.A.; Danko, K.; Silinskaya, S.; Serebryakov, E.B.; Soboleva, A.; et al. Integrative Proteomics and Metabolomics Analysis Reveals the Role of Small Signaling Peptide Rapid Alkalinization Factor 34 (RALF34) in Cucumber Roots. IJMS 2023, 24, 7654. [Google Scholar] [CrossRef]
- Chong, J.; Soufan, O.; Li, C.; Caraus, I.; Li, S.; Bourque, G.; Wishart, D.S.; Xia, J. MetaboAnalyst 4.0: towards more transparent and integrative metabolomics analysis. Nucleic Acids Research 2018, 46, W486–W494. [Google Scholar] [CrossRef]
- Zhao, Y.; Zhao, J.; Zhao, C.; Zhou, H.; Li, Y.; Zhang, J.; Li, L.; Hu, C.; Li, W.; Peng, X.; et al. A metabolomics study delineating geographical location-associated primary metabolic changes in the leaves of growing tobacco plants by GC-MS and CE-MS. Sci Rep 2015, 5, 16346. [Google Scholar] [CrossRef] [PubMed]
- Zhang, W.; Gulersonmez, M.C.; Hankemeier, T.; Ramautar, R. Sheathless Capillary Electrophoresis; Mass Spectrometry for Metabolic Profiling of Biological Samples. JoVE 2016, 54535. [Google Scholar] [CrossRef]
- Kim, J.; Choi, J.N.; John, K.M.M.; Kusano, M.; Oikawa, A.; Saito, K.; Lee, C.H. GC–TOF-MS- and CE–TOF-MS-Based Metabolic Profiling of Cheonggukjang (Fast-Fermented Bean Paste) during Fermentation and Its Correlation with Metabolic Pathways. J. Agric. Food Chem. 2012, 60, 9746–9753. [Google Scholar] [CrossRef]
- Woźniakiewicz, M.; Woźniakiewicz, A.; Nowak, P.M.; Kłodzińska, E.; Namieśnik, J.; Płotka-Wasylka, J. CE-MS and GC-MS as “Green” and Complementary Methods for the Analysis of Biogenic Amines in Wine. Food Anal. Methods 2018, 11, 2614–2627. [Google Scholar] [CrossRef]
- Van Dam, J.C.; Ras, C.; Ten Pierick, A. Analysis of Glycolytic Intermediates with Ion Chromatography- and Gas Chromatography-Mass Spectrometry. In Metabolic Profiling; Metz, T.O., Ed.; Methods in Molecular Biology; Humana Press: Totowa, NJ, 2011; Vol. 708, pp. 131–146. ISBN 978-1-61737-984-0. [Google Scholar]
- Marshall, D.D.; Powers, R. Beyond the paradigm: Combining mass spectrometry and nuclear magnetic resonance for metabolomics. Progress in Nuclear Magnetic Resonance Spectroscopy 2017, 100, 1–16. [Google Scholar] [CrossRef] [PubMed]
- Lebrilla, C.B.; Liu, J.; Widmalm, G.; Prestegard, J.H. Oligosaccharides and Polysaccharides. In Essentials of Glycobiology; Varki, A., Cummings, R.D., Esko, J.D., Stanley, P., Hart, G.W., Aebi, M., Mohnen, D., Kinoshita, T., Packer, N.H., Prestegard, J.H., Schnaar, R.L., Seeberger, P.H., Eds.; Cold Spring Harbor Laboratory Press: Cold Spring Harbor (NY), 2022; ISBN 978-1-62182-421-3. [Google Scholar]
- Si, H.-Y.; Chen, N.-F.; Chen, N.-D.; Huang, C.; Li, J.; Wang, H. Structural characterisation of a water-soluble polysaccharide from tissue-cultured Dendrobium huoshanense C.Z. Tang et S.J. Cheng. Nat Prod Res 2018, 32, 252–260. [Google Scholar] [CrossRef] [PubMed]
- Honda, Y.; Inaoka, H.; Takei, A.; Sugimura, Y.; Otsuji, K. Extracellular polysaccharides produced by tuberose callus. Phytochemistry 1996, 41, 1517–1521. [Google Scholar] [CrossRef]
- Emwas, A.-H.; Roy, R.; McKay, R.T.; Tenori, L.; Saccenti, E.; Gowda, G.A.N.; Raftery, D.; Alahmari, F.; Jaremko, L.; Jaremko, M.; et al. NMR Spectroscopy for Metabolomics Research. Metabolites 2019, 9, 123. [Google Scholar] [CrossRef]
- Bhinderwala, F.; Wase, N.; DiRusso, C.; Powers, R. Combining Mass Spectrometry and NMR Improves Metabolite Detection and Annotation. J. Proteome Res. 2018, 17, 4017–4022. [Google Scholar] [CrossRef]
- Larive, C.K.; Barding, G.A.; Dinges, M.M. NMR Spectroscopy for Metabolomics and Metabolic Profiling. Anal. Chem. 2015, 87, 133–146. [Google Scholar] [CrossRef]
- Bruno, C.; Patin, F.; Bocca, C.; Nadal-Desbarats, L.; Bonnier, F.; Reynier, P.; Emond, P.; Vourc’h, P.; Joseph-Delafont, K.; Corcia, P.; et al. The combination of four analytical methods to explore skeletal muscle metabolomics: Better coverage of metabolic pathways or a marketing argument? Journal of Pharmaceutical and Biomedical Analysis 2018, 148, 273–279. [Google Scholar] [CrossRef]
- Barding, G.A.; Béni, S.; Fukao, T.; Bailey-Serres, J.; Larive, C.K. Comparison of GC-MS and NMR for Metabolite Profiling of Rice Subjected to Submergence Stress. J. Proteome Res. 2013, 12, 898–909. [Google Scholar] [CrossRef]
- Pan, Z.; Raftery, D. Comparing and combining NMR spectroscopy and mass spectrometry in metabolomics. Anal Bioanal Chem 2007, 387, 525–527. [Google Scholar] [CrossRef]
- Prasad, B.; Technologies, A. Method Manager for Streamlined Statistical Analysis and Model Building.
- Alrabie, A.; Alrabie, N.A.; AlSaeedy, M.; Al-Adhreai, A.; Al-Qadsy, I.; Al-Horaibi, S.A.; Alaizeri, Z.M.; Alhadlaq, H.A.; Ahamed, M.; Farooqui, M. An integrative GC–MS and LC–MS metabolomics platform determination of the metabolite profile of Bombax ceiba L. root, and in silico & in vitro evaluation of its antibacterial & antidiabetic activities. Natural Product Research 2023, 37, 2263–2268. [Google Scholar] [CrossRef] [PubMed]
- Ramalingam, A.; Kudapa, H.; Pazhamala, L.T.; Weckwerth, W.; Varshney, R.K. Proteomics and Metabolomics: Two Emerging Areas for Legume Improvement. Front. Plant Sci. 2015, 6. [Google Scholar] [CrossRef]
- Yang, L.-N.; Pu, J.-C.; Liu, L.-X.; Wang, G.-W.; Zhou, X.-Y.; Zhang, Y.-Q.; Liu, Y.-Y.; Xie, P. Integrated Metabolomics and Proteomics Analysis Revealed Second Messenger System Disturbance in Hippocampus of Chronic Social Defeat Stress Rat. Front. Neurosci. 2019, 13, 247. [Google Scholar] [CrossRef]
- Yun, Z.; Li, T.; Gao, H.; Zhu, H.; Gupta, V.K.; Jiang, Y.; Duan, X. Integrated Transcriptomic, Proteomic, and Metabolomics Analysis Reveals Peel Ripening of Harvested Banana under Natural Condition. Biomolecules 2019, 9, 167. [Google Scholar] [CrossRef] [PubMed]
- Leonova, T.; Popova, V.; Tsarev, A.; Henning, C.; Antonova, K.; Rogovskaya, N.; Vikhnina, M.; Baldensperger, T.; Soboleva, A.; Dinastia, E.; et al. Does Protein Glycation Impact on the Drought-Related Changes in Metabolism and Nutritional Properties of Mature Pea (Pisum sativum L.) Seeds? IJMS 2020, 21, 567. [Google Scholar] [CrossRef]
- Acharjee, A.; Kloosterman, B.; Visser, R.G.F.; Maliepaard, C. Integration of multi-omics data for prediction of phenotypic traits using random forest. BMC Bioinformatics 2016, 17, 180. [Google Scholar] [CrossRef]
- Bhinderwala, F.; Wase, N.; DiRusso, C.; Powers, R. Combining Mass Spectrometry and NMR Improves Metabolite Detection and Annotation. J Proteome Res 2018, 17, 4017–4022. [Google Scholar] [CrossRef]
- Woźniakiewicz, M.; Woźniakiewicz, A.; Nowak, P.M.; Kłodzińska, E.; Namieśnik, J.; Płotka-Wasylka, J. CE-MS and GC-MS as “Green” and Complementary Methods for the Analysis of Biogenic Amines in Wine. Food Anal. Methods 2018, 11, 2614–2627. [Google Scholar] [CrossRef]
- Strenkert, D.; Schmollinger, S.; Gallaher, S.D.; Salomé, P.A.; Purvine, S.O.; Nicora, C.D.; Mettler-Altmann, T.; Soubeyrand, E.; Weber, A.P.M.; Lipton, M.S.; et al. Multiomics resolution of molecular events during a day in the life of Chlamydomonas. Proc. Natl. Acad. Sci. U.S.A. 2019, 116, 2374–2383. [Google Scholar] [CrossRef]
- Wang, J.Y.; Alseekh, S.; Xiao, T.; Ablazov, A.; Perez De Souza, L.; Fiorilli, V.; Anggarani, M.; Lin, P.-Y.; Votta, C.; Novero, M.; et al. Multi-omics approaches explain the growth-promoting effect of the apocarotenoid growth regulator zaxinone in rice. Commun Biol 2021, 4, 1222. [Google Scholar] [CrossRef] [PubMed]
- Larrainzar, E.; Wienkoop, S.; Weckwerth, W.; Ladrera, R.; Arrese-Igor, C.; González, E.M. Medicago truncatula Root Nodule Proteome Analysis Reveals Differential Plant and Bacteroid Responses to Drought Stress. Plant Physiology 2007, 144, 1495–1507. [Google Scholar] [CrossRef]
- López-Hidalgo, C.; Guerrero-Sánchez, V.M.; Gómez-Gálvez, I.; Sánchez-Lucas, R.; Castillejo-Sánchez, M.A.; Maldonado-Alconada, A.M.; Valledor, L.; Jorrín-Novo, J.V. A Multi-Omics Analysis Pipeline for the Metabolic Pathway Reconstruction in the Orphan Species Quercus ilex. Front. Plant Sci. 2018, 9, 935. [Google Scholar] [CrossRef]
- Jendoubi, T. Approaches to Integrating Metabolomics and Multi-Omics Data: A Primer. Metabolites 2021, 11, 184. [Google Scholar] [CrossRef]
- Yan, K.K.; Zhao, H.; Pang, H. A comparison of graph- and kernel-based –omics data integration algorithms for classifying complex traits. BMC Bioinformatics 2017, 18, 539. [Google Scholar] [CrossRef] [PubMed]
- Lanckriet, G.R.G.; Deng, M.; Cristianini, N.; Jordan, M.I.; Noble, W.S. Kernel-based data fusion and its application to protein function prediction in yeast. In Proceedings of the Biocomputing 2004; WORLD SCIENTIFIC, Hawaii, USA, 2003; pp. 300–311. [Google Scholar]
- Shi, J.; Wang, J.; Lv, H.; Peng, Q.; Schreiner, M.; Baldermann, S.; Lin, Z. Integrated proteomic and metabolomic analyses reveal the importance of aroma precursor accumulation and storage in methyl jasmonate-primed tea leaves. Hortic Res 2021, 8, 95. [Google Scholar] [CrossRef] [PubMed]
- Mishra, P.; Roger, J.M.; Jouan-Rimbaud-Bouveresse, D.; Biancolillo, A.; Marini, F.; Nordon, A.; Rutledge, D.N. Recent trends in multi-block data analysis in chemometrics for multi-source data integration. TrAC - Trends in Analytical Chemistry 2021, 137, 1–15. [Google Scholar] [CrossRef]
Figure 1.
Multiple omics experiment with implementation of GC-MS analytical platform and its potential applications in plant biology sciences.
Figure 1.
Multiple omics experiment with implementation of GC-MS analytical platform and its potential applications in plant biology sciences.
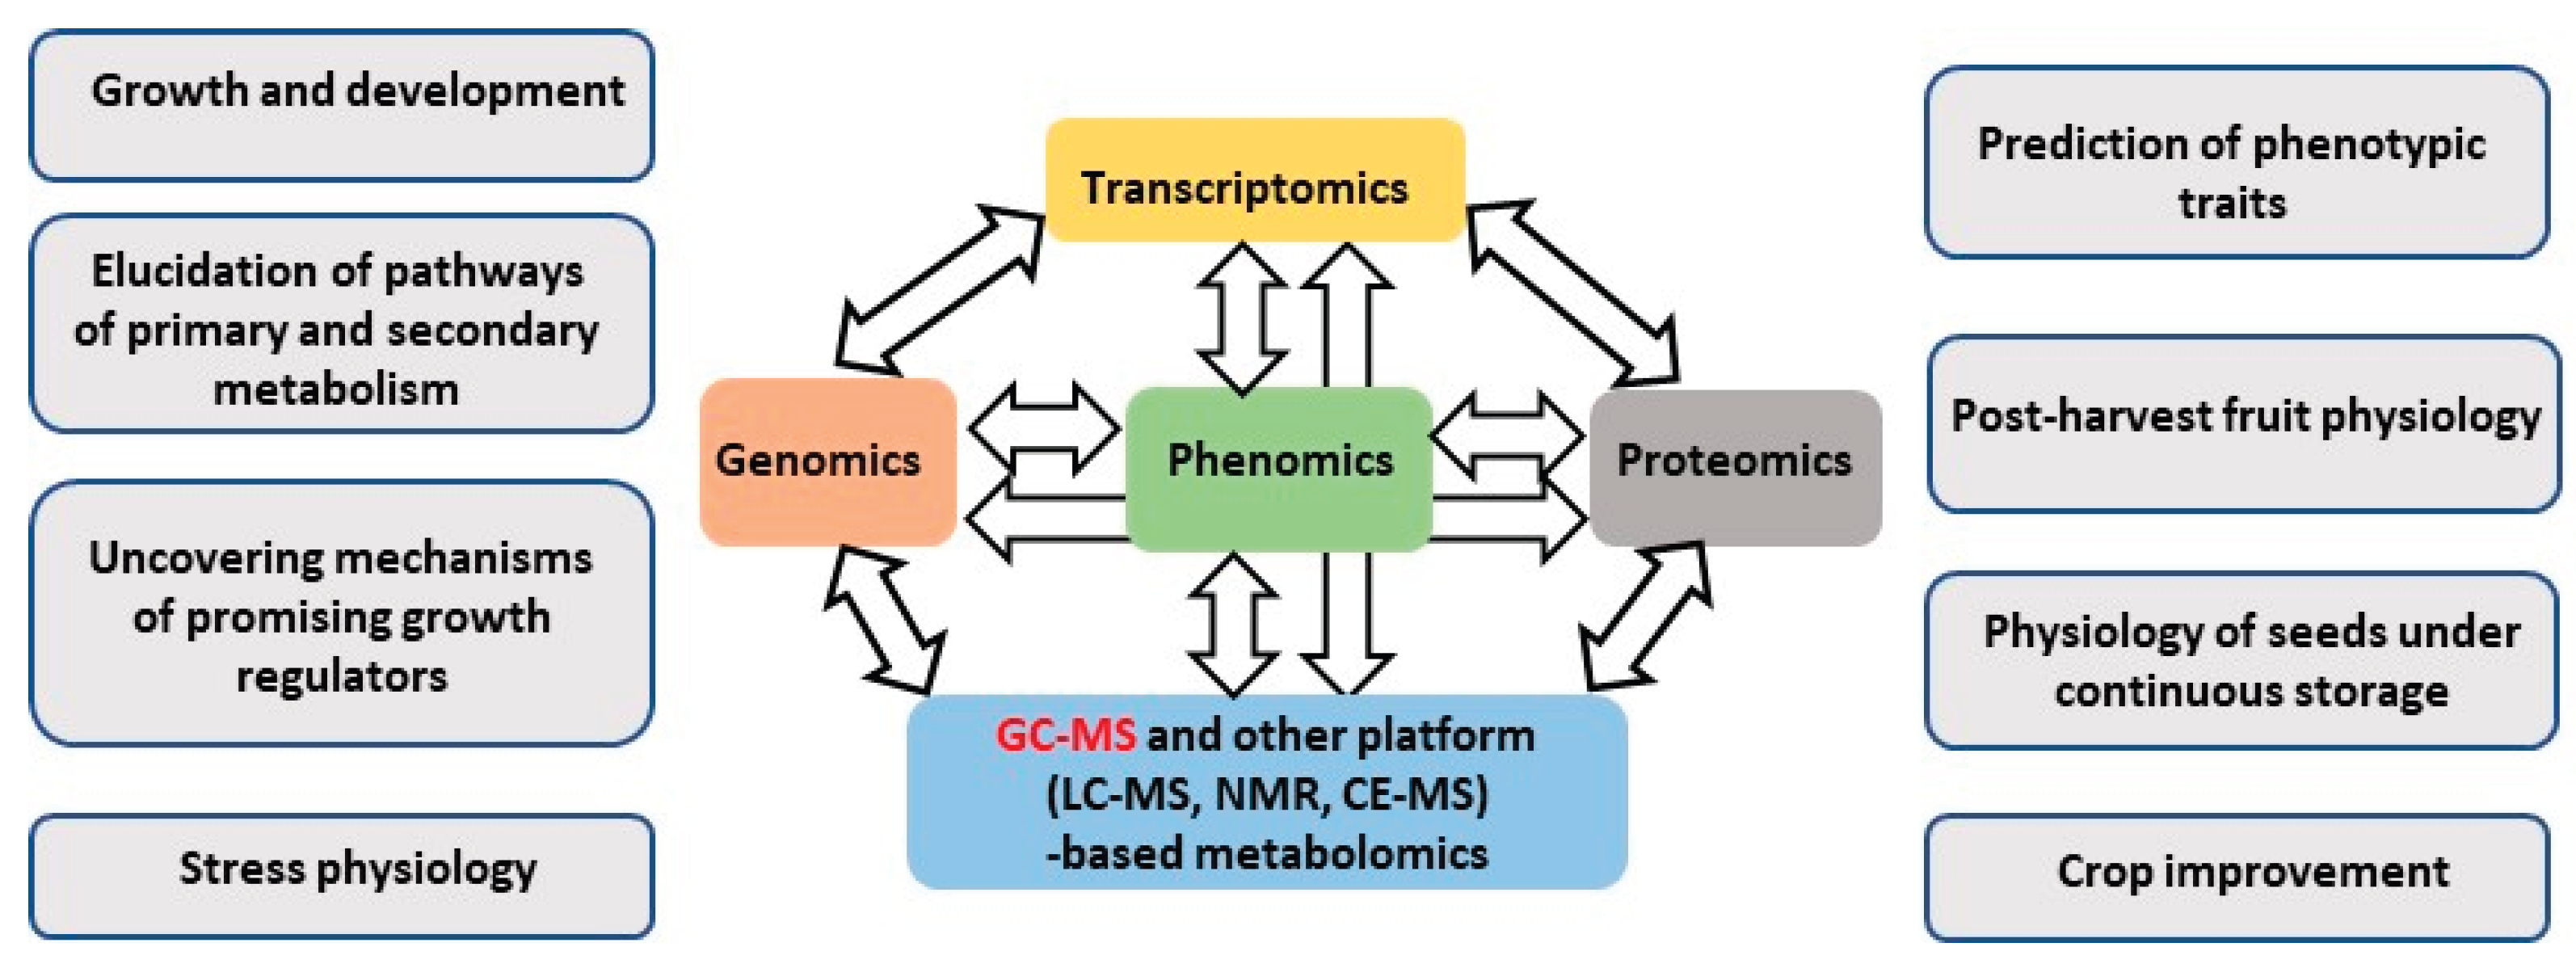
Figure 2.
Types of data integration strategies employed in multi-omics experiments including those implementing GC-MS-based metabolomics. Low-level integration (also called concatenation-based integration) depicts concatenation of individual omics datasets in a joined matrix in construction of an integrated model (left), mid-level integration assumes first mapping of individual omics sets or their transformation to obtain the data matrixes of less dimensionality, which serve as the input for further construction of an integrated model (middle) and high-level integration which assumes generation of separate models from each dataset (right). The models are used at the next step to construct an integrated model (adapted from [5]).
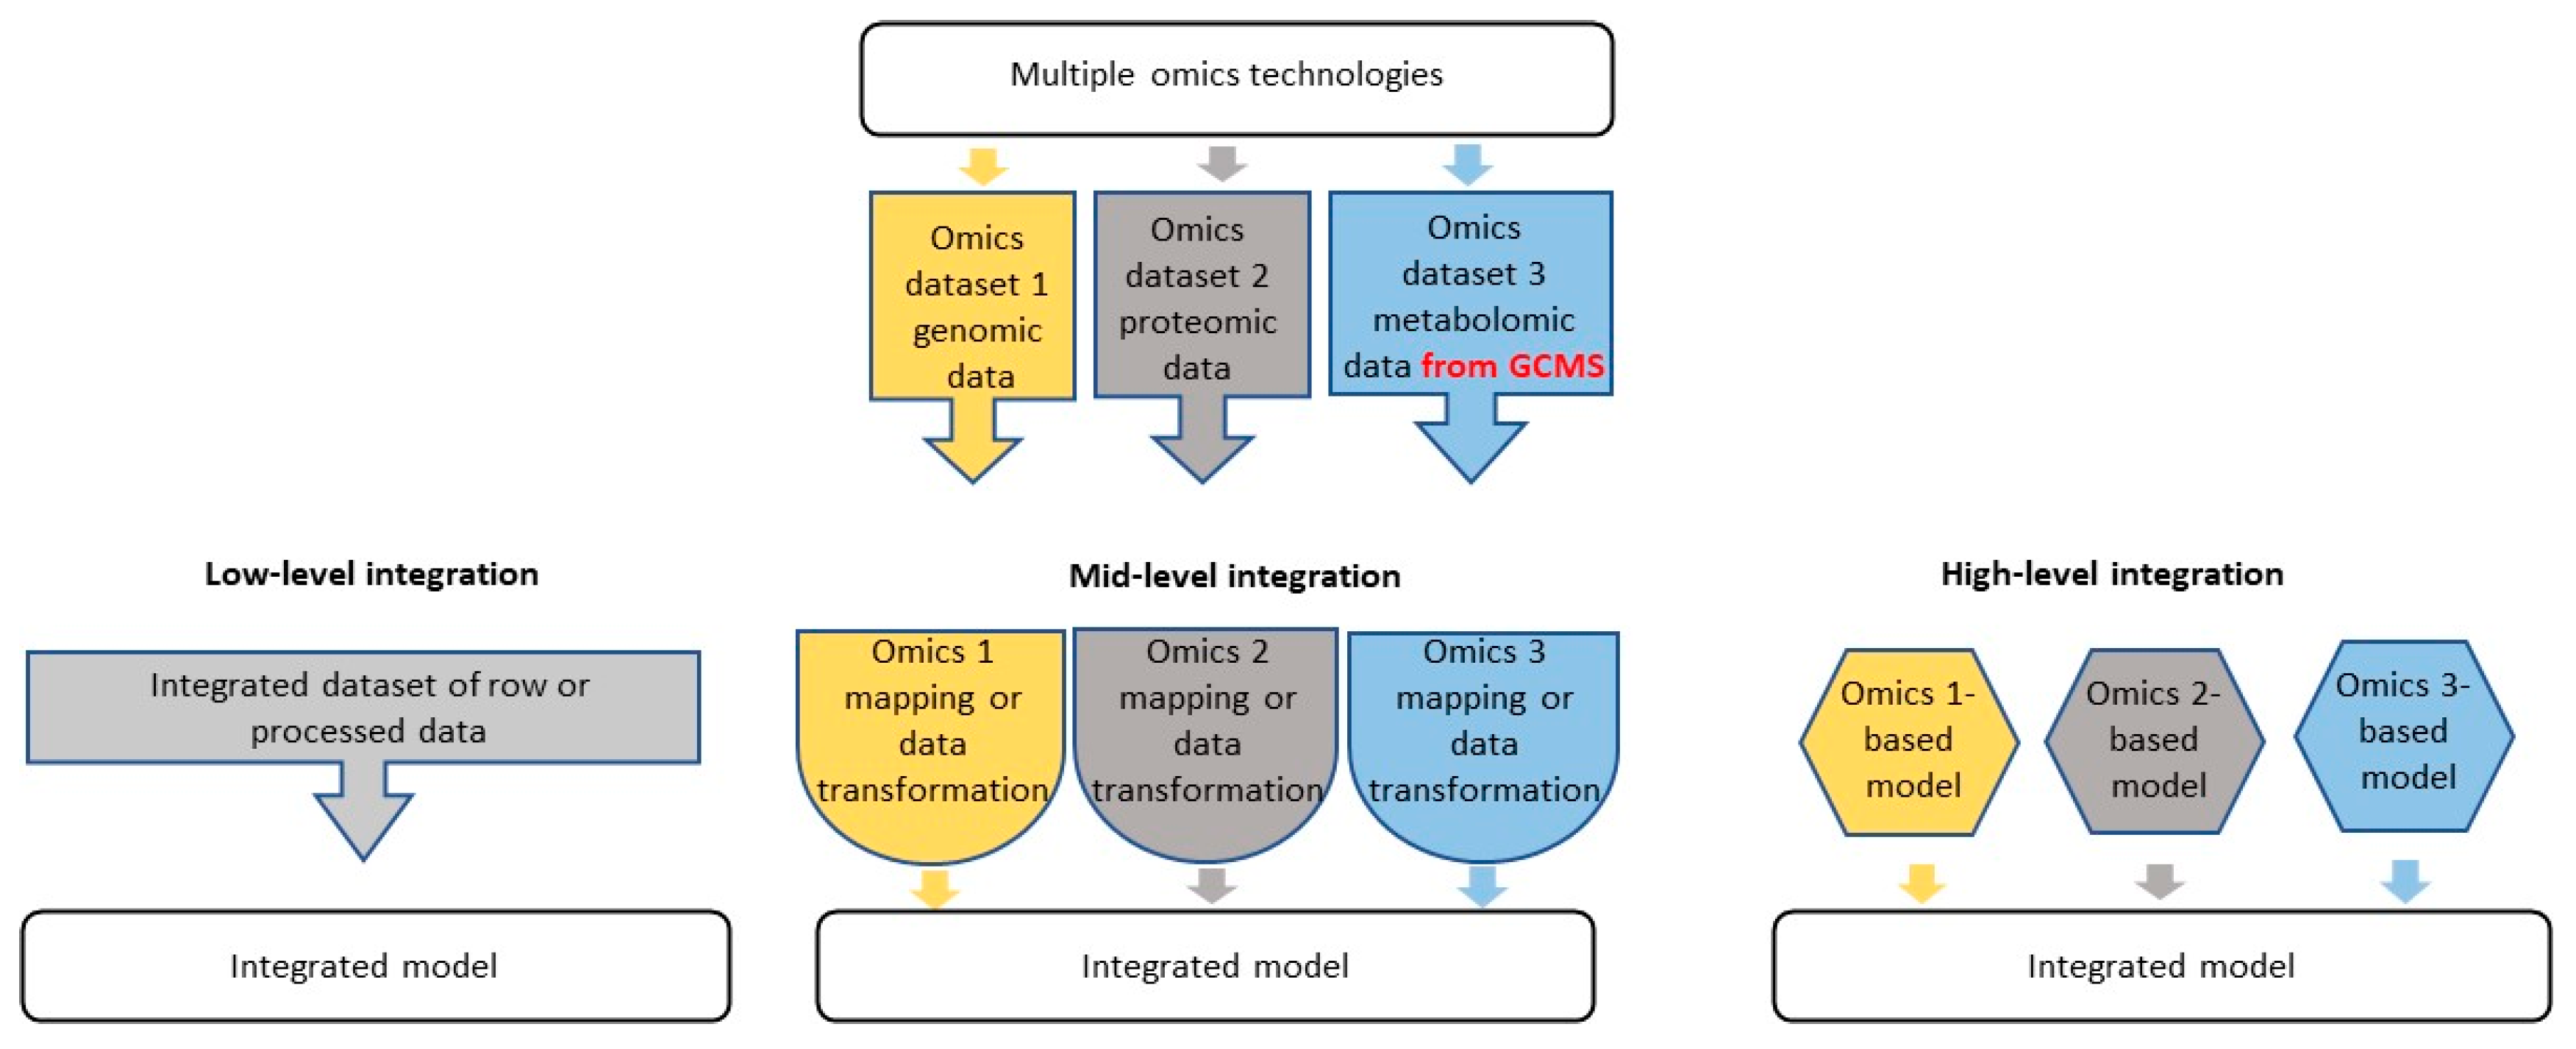
Disclaimer/Publisher’s Note: The statements, opinions and data contained in all publications are solely those of the individual author(s) and contributor(s) and not of MDPI and/or the editor(s). MDPI and/or the editor(s) disclaim responsibility for any injury to people or property resulting from any ideas, methods, instructions or products referred to in the content. |
© 2025 by the authors. Licensee MDPI, Basel, Switzerland. This article is an open access article distributed under the terms and conditions of the Creative Commons Attribution (CC BY) license (https://creativecommons.org/licenses/by/4.0/).
Copyright: This open access article is published under a Creative Commons CC BY 4.0 license, which permit the free download, distribution, and reuse, provided that the author and preprint are cited in any reuse.


