
Submitted:
10 December 2025
Posted:
10 December 2025
You are already at the latest version
Abstract
Background: The rapid integration of digital technologies into everyday life has raised widespread concerns regarding the psychological consequences of prolonged screen exposure. While prior studies have shown associations between screen time and mental health issues, findings have often been inconsistent, largely due to simplistic linear models and limited behavioral contextualization. This study aims to address these gaps by evaluating how various forms of screen use, lifestyle behaviors, and psychological indicators jointly influence mental wellness in a population of digitally active individuals. Methods: We analyzed a self-reported dataset of 400 participants containing detailed metrics on screen use (mobile, TV, laptop), sleep quality, stress, productivity, mood, and other lifestyle behaviors. Statistical analyses included Pearson correlation, multivariate linear regression, and K-means clustering with Principal Component Analysis (PCA) to uncover behavioral subtypes. Predictors of mental wellness were identified through standardized regression coefficients, and clusters were interpreted based on their psychological and digital usage profiles. Results: Stress emerged as the strongest negative predictor of mental wellness (β = −10.69), followed by sleep quality (β = +5.92) and productivity (β = +4.72). Contrary to prevailing assumptions, total screen time and leisure screen use had minimal direct impact on wellness once mediating variables were included. Clustering revealed three distinct digital behavior phenotypes: (1) Balanced and Active Users, (2) Leisure-Heavy High-Stress Users, and (3) Burnout-Prone Professionals. These profiles showed differing wellness outcomes sharply and validated the multidimensional nature of digital health risk. Conclusion: Mental wellness in digital contexts is best understood through a multivariable lens that accounts for stress, sleep, and self-regulatory behaviors rather than raw screen time alone. These findings challenge traditional screen time metrics and highlight the need for personalized, context-aware interventions. This study offers a replicable computational framework for identifying behavioral risk profiles and supports a paradigm shift from screen avoidance to digital self-optimization.
Keywords:
screen time
; mental health
; stress level
; sleep quality
; digital lifestyle
; wellness analysis
1. Introduction
The global integration of digital technologies has dramatically altered the way individuals interact, learn, work, and entertain themselves. From smartphones and laptops to televisions and wearable devices, screens have become omnipresent across social and professional contexts. As a result, the average individual spends several hours a day interacting with digital interfaces, a trend that has intensified with the rise of remote work, virtual learning, and digital entertainment platforms. According to a 2023 report by the World Health Organization, screen exposure has reached historic highs, with many adults averaging more than seven hours per day of cumulative screen time [1]. While this shift in lifestyle has increased access to information, connectivity, and convenience, it has also sparked widespread concern over the psychological and physiological consequences of prolonged digital engagement.
A growing body of evidence has linked excessive screen time with mental health concerns, including increased stress, decreased sleep quality, and reduced subjective well-being. One study found that adolescents who engage in high levels of screen time report lower life satisfaction and more symptoms of anxiety and depression [2]. Another meta-analysis concluded that social media use is significantly associated with elevated levels of depression, anxiety, and psychological distress [3]. Some studies suggest that prolonged exposure to digital content, particularly before sleep, can disrupt circadian rhythms and suppress melatonin production, reducing sleep efficiency [4,5]. Others argue that overstimulation from rapid media consumption may impair cognitive control and emotional regulation [6].
Despite this research, several limitations remain. Many studies focus on the quantity of screen time rather than its qualitative aspects. Much of the existing work does not distinguish between work-related and leisure or passive consumption, even though these modalities may have different psychological effects [7,8]. Leisure-based screen use, such as binge-watching or passive scrolling, may exacerbate stress and fatigue, while task-oriented digital activity may not carry the same cognitive burden.
Most prior research also targets specific age groups, such as adolescents or university students, limiting generalizability. Studies focused on teenage media use may not apply to adult professionals navigating hybrid work environments. Additionally, few studies directly compare the digital habits and wellness outcomes of students and working adults within a unified dataset.
A further limitation is methodological. Many studies rely on univariate or bivariate statistical tools that cannot capture the multidimensional nature of digital behavior. Recent advances in data science have introduced more robust methods, such as multivariate regression, clustering algorithms, and machine learning, that can uncover latent behavioral patterns [9,10]. However, these computational approaches remain underused in digital mental health research.
This paper addresses these gaps through a computational analysis of a self-reported dataset from 400 users. The dataset includes demographic variables, daily screen usage for work and leisure, sleep quality, stress levels, productivity, and a composite mental wellness score. By combining traditional statistics with modern computational models, this study examines how forms of screen use interact with mental health and lifestyle outcomes. It also assesses differences between students and working adults and uses clustering to classify users into behavioral archetypes based on digital habits and wellness indicators. Through this approach, the paper offers a more nuanced understanding of how digital environments shape emotional and cognitive well-being.
2. Literature Review
The interplay between digital behavior and mental health has become an important interdisciplinary concern, as widespread screen-based technology challenges traditional views of well-being, productivity, and social engagement. Early research showed that excessive screen exposure during leisure time may increase stress, reduce sleep quality, impair cognitive focus, and contribute to depressive symptoms [4,12]. Over time, research has acknowledged that not all screen time is harmful and that contextual factors such as screen purpose, demographics, and lifestyle moderators shape psychological outcomes [7,8]. This review summarizes findings across five areas: general screen time and well-being, sleep disruption, screen context differences, demographic effects, and computational approaches to digital wellness.
Early work on screen exposure focused on children and adolescents. One study reported that adolescents spending more than four hours daily on screens experienced lower happiness, higher loneliness, and increased suicidal ideation [11]. A meta-analysis similarly found that problematic screen use, including social media, gaming, and general internet consumption, was strongly associated with depression and anxiety in youth [3]. Longitudinal studies have shown that sustained digital media exposure may impair emotion regulation, especially among individuals with weaker executive functioning [12]. Another study proposed that frequent digital engagement disrupts dopaminergic balance and increases reward-seeking while reducing emotional resilience [6].
A major theme concerns the effect of screen exposure on sleep and circadian health. Several studies show that screen use before bedtime contributes to delayed sleep onset and shorter sleep duration [5,13]. Blue light exposure and heightened cognitive arousal further disrupt sleep architecture [14,15]. A broad review identified screen media consumption as a key behavioral contributor to pediatric sleep disturbances [4]. Similar effects have been reported in adults engaged in remote work or late-night digital entertainment [16].
Recent studies highlight the importance of distinguishing between screen use by purpose. Research shows that moderate digital engagement for instrumental or creative tasks can support well-being [7], whereas passive or leisure-based screen use is more often associated with negative outcomes [8]. Context matters: emotionally supportive interactions can reduce loneliness, while passive scrolling is more likely to relate to anxiety. A report from the Oxford Internet Institute concluded that overall screen duration has a relatively small psychological effect once context and social factors are controlled [17].
Research has also explored how occupation and age moderate digital behavior. During the COVID-19 pandemic, remote workers and students showed different patterns of digital fatigue, burnout, and productivity disruption. One study found that online educators with heavy digital workloads reported higher emotional exhaustion and sleep dissatisfaction [18]. Another found that working parents viewed children's screen use as necessary for education but remained concerned about long-term emotional impacts [19]. Studies involving college students identified screen-induced stress as a major predictor of academic burnout and reduced attention span [20,21].
Despite extensive descriptive research, computational methods remain underutilized. Some progress has been made by applying machine learning to classify mobile app use patterns and link them to well-being [9]. Another study used passive smartphone sensing to predict short-term mood and stress fluctuations [10]. However, these approaches often rely on behavioral proxies such as GPS data or device unlocks rather than subjective self-reports.
Clustering methods are another underused tool. They can identify subgroups such as high-risk digital consumers, balanced users, or wellness-optimized individuals, which can inform targeted interventions. Yet many studies still use population averages that obscure individual differences [22].
Overall, the literature offers a strong empirical basis for understanding digital behavior and wellness but lacks integrative models that incorporate diverse behavioral and psychological indicators. There remains a need for research that moves beyond single-variable associations and builds multidimensional predictive frameworks. The present study addresses this gap by using computational and statistical techniques to model relationships among screen use, stress, sleep, productivity, exercise, and social activity.
3. Research Questions and Hypotheses
The increasing ubiquity of digital screens in modern life has introduced complex questions regarding their impact on mental health and well-being. Building on prior research, this study investigates not only the direct relationships between screen time and wellness outcomes, but also how these relationships vary by screen context, occupational role, and lifestyle characteristics. In response to the gaps identified in the literature, this study formulates four central research questions, each accompanied by a hypothesis grounded in prior psychological, behavioral health, and digital media research.
3.1. Research Question 1 (RQ1)
What is the relationship between different types of screen time and key mental wellness indicators such as sleep quality and stress levels?
This question is motivated by evidence that not all screen use affects well-being equally. Previous research has consistently shown that excessive leisure screen use is associated with increased stress, reduced sleep quality, and lower overall wellness [5,13]. Other studies suggest that screen use for productive tasks may not carry the same risks [7,8].
3.1.1. Hypothesis 1a (H1a)
Leisure screen time will be negatively correlated with sleep quality.
3.1.2. Hypothesis 1b (H1b)
Total daily screen time will be positively correlated with stress levels.
3.2. Research Question 2 (RQ2)
Are there significant differences in screen use patterns and wellness outcomes between students and working professionals?
This question addresses a gap in the literature, since many studies focus on isolated populations rather than comparing them within the same analytical framework. Research has shown higher emotional exhaustion among online educators [18], while students often experience screen-related anxiety and academic strain [20].
3.2.1. Hypothesis 2a (H2a)
Students will report significantly higher total screen time than employed individuals.
3.2.2. Hypothesis 2b (H2b)
Employed individuals will report significantly higher productivity and sleep quality than students.
3.3. Research Question 3 (RQ3)
Can mental wellness be reliably predicted from screen time, sleep, stress, productivity, and lifestyle indicators such as exercise and social activity?
Although many studies explore bivariate associations, fewer attempt to predict overall mental wellness using multivariate techniques. Recent work in computational mental health has begun moving in this direction [9,10].
3.3.1. Hypothesis 3 (H3)
Mental wellness can be predicted with high accuracy using a combination of screen use, sleep, stress, productivity, exercise, and social interaction metrics.
3.4. Research Question 4 (RQ4)
Are there distinct clusters or user profiles based on digital lifestyle and wellness behavior?
Clustering techniques allow researchers to group individuals based on behavioral and psychological similarities. Prior work suggests that such approaches can reveal nuanced risk profiles and guide targeted interventions [22].
3.4.1. Hypothesis 4 (H4)
There exist at least three distinct user clusters based on screen use behavior and mental wellness indicators.
This hypothesis assumes heterogeneity in digital habits and wellness outcomes, suggesting the emergence of distinct types such as balanced users, high-risk screen users, and overworked professionals.
These research questions and hypotheses provide the foundation for the study’s analytical framework. By incorporating diverse behavioral variables and advanced computational methods, the study aims to build a more holistic understanding of the psychological consequences of digital behavior.
4. Methodology
This study utilizes a computational and statistical framework to examine the relationship between digital screen use and mental wellness among individuals from various occupational backgrounds. The methodology integrates traditional inferential statistics with predictive modeling and unsupervised learning techniques, enabling both hypothesis testing and data-driven discovery of behavioral patterns. The following section outlines the dataset, preprocessing steps, analytical procedures, and modeling techniques employed.
4.1. Dataset Description
The dataset used in this study consists of 400 anonymized user entries, each representing an individual who self-reported demographic information, screen time habits, lifestyle behaviors, and mental wellness indicators. The dataset was sourced from a public survey titled Mental Wellness & Screen Time Survey, specifically designed for exploring the link between daily digital engagement and mental health.
Each record includes the following key variables:
- Demographics: age, gender, occupation (e.g., student, employed), work mode (remote, hybrid, in-person)
- Screen Time: total screen time per day, segmented into work-related and leisure-related screen hours
- Wellness Indicators: sleep hours, sleep quality (rated 1 to 5), stress level (rated 0 to 10), productivity score (rated 0 to 100), and a composite mental wellness index (rated 0 to 100)
- Lifestyle Variables: weekly exercise minutes, weekly social interaction hours
The dataset is well-structured, containing no missing values or corrupted entries. Categorical variables were encoded as appropriate for modeling, while continuous variables were standardized where necessary for regression and clustering.
4.2. Data Preprocessing
Before analysis, the following preprocessing steps were conducted:
- Data Cleaning: Columns not analytically relevant, such as user IDs and empty columns, were removed. All variables were inspected for outliers and data inconsistencies.
- Feature Selection: Key behavioral and wellness-related features were selected for correlation analysis and modeling, including screen_time_hours, leisure_screen_hours, sleep_quality_1_5, stress_level_0_10, productivity_0_100, and others.
- Normalization: For modeling and clustering, continuous variables were standardized using Z-score normalization to ensure equal scaling.
- Encoding: Categorical variables such as occupation were label-encoded for inferential tests and group comparisons.
4.3. Statistical Analysis
To address the first two research questions and associated hypotheses, the study employed the following inferential techniques:
- Pearson Correlation: Pearson’s r was calculated to evaluate linear associations between screen time (total and leisure) and both sleep quality and stress levels. This tested Hypotheses H1a and H1b.
- Independent Samples t-tests: Group differences between students and employed participants were tested using two-tailed t-tests for key outcomes such as total screen time, sleep quality, and productivity. Hypotheses H2a and H2b were evaluated through this method.
- Descriptive Statistics: Means, standard deviations, and frequency distributions were used to profile demographic subgroups and general usage patterns.
4.4. Predictive Modeling
To test Hypothesis H3 and evaluate whether lifestyle and behavioral variables predict the composite mental wellness index, a linear regression model was constructed. The following steps were performed:
- Feature Matrix Construction: Nine predictor variables were selected, including screen time, sleep duration and quality, stress level, productivity, exercise, and social time.
- Model Evaluation: The dataset was split into 80% training and 20% testing sets. Standard performance metrics such as R-squared (R²) and root mean squared error (RMSE) were used to evaluate model accuracy and generalizability.
- Feature Importance: Coefficients of the linear regression model were interpreted to identify the most influential predictors of mental wellness.
The regression approach was chosen due to its interpretability and its alignment with the study’s goal of identifying key predictors, rather than solely maximizing prediction accuracy.
4.5. Unsupervised Clustering
To address Hypothesis H4 and explore latent user profiles based on digital behavior, the study applied unsupervised clustering using the following steps:
- K-Means Clustering: The standardized dataset was clustered using the K-means algorithm. The elbow method was applied to determine the optimal number of clusters based on inertia values. A three-cluster solution was selected based on the inflection point in the elbow curve.
- Dimensionality Reduction for Visualization: Principal Component Analysis (PCA) was used to reduce the feature space to two dimensions for visualization purposes. Cluster centers and boundaries were visualized using scatterplots colored by cluster membership.
- Cluster Profiling: Each cluster was profiled by computing mean values for screen time, stress, sleep, productivity, and mental wellness. These profiles were used to interpret behavioral archetypes across the population.
5. Results
This section presents the findings of the study, organized according to the research questions and hypotheses. The results include correlation analyses, group comparisons, predictive modeling outputs, and unsupervised clustering. Each subsection includes statistical outputs, visual summaries, and interpretive commentary relevant to the study’s goals.
5.1. Correlation Analysis Between Screen Behaviors and Wellness Outcomes
To evaluate the linear relationships among screen use patterns, lifestyle behaviors, and wellness indicators, Pearson’s correlation coefficients were calculated between continuous variables. These included total screen time, leisure and work screen time, sleep quality, stress level, productivity score, and a composite mental wellness index. Table 1 presents the full correlation matrix, and Figure 1 provides a visual summary using a heatmap.
These coefficients show that:
- Stress level is the strongest negative correlate of mental wellness (r = −0.91, p < .001), followed by productivity (r = +0.90) and sleep quality (r = +0.75).
- Total screen time has a moderately strong negative correlation with mental wellness (r = −0.64) and a strong positive correlation with stress (r = +0.70).
- Leisure screen time exhibits negative correlations with wellness (r = −0.46), sleep (r = −0.22), and productivity (r = −0.40).
Figure 1 shows the strength and direction of linear associations between screen time variables, wellness indicators, and lifestyle factors. Darker shades represent stronger correlations. These results strongly support H1a and H1b. The significant negative association between leisure screen time and sleep quality aligns with previous studies showing that screen exposure before bedtime suppresses melatonin and delays sleep onset [4,5,14]. Similarly, the positive correlation between total screen time and stress is consistent with research indicating that digital overload increases cognitive fatigue and emotional dysregulation [2,6]. Notably, work-related screen time showed only weak or nonsignificant correlations with wellness outcomes, reinforcing findings that task-oriented digital engagement may be less harmful or even cognitively beneficial in structured settings [7].
From a theoretical standpoint, these findings suggest that screen use is not a unitary construct and should be interpreted in context, such as work versus leisure use. The strong correlations among wellness variables, especially stress and sleep, indicate potential mediation pathways. For example, increased screen time may elevate stress, which then lowers wellness.
In conclusion, the correlation analysis confirms the central role of stress and sleep as mediators between screen time and mental health. These results provide foundational support for the predictive modeling and segmentation analyses presented in later sections.
5.2. Group Differences Between Students and Employed Participants
To investigate whether patterns of screen use and wellness outcomes differ based on occupational role, a comparative analysis was conducted between participants who self-identified as “Student” and those who reported being “Employed.” This analysis addresses Research Question 2 and evaluates Hypotheses H2a and H2b, which propose that students would report higher screen time and that employed individuals would demonstrate greater productivity and better sleep quality.
The sample included a balanced distribution of students and employed individuals (n ≈ 200 per group). Group-level differences across key variables are summarized in Table 2.
To complement the statistical tests, three boxplots are provided in Figure 2 (below), offering a visual representation of distribution differences.
The results support Hypothesis H2a, as students exhibited significantly higher daily screen time compared to employed individuals. This aligns with recent findings suggesting that academic demands, unstructured schedules, and increased digital entertainment usage contribute to higher screen exposure among students [20,21].
The results also partially support Hypothesis H2b. Employed individuals reported higher productivity scores than students, and this difference was statistically significant (p = 0.027), consistent with studies showing that structured work environments may promote better task regulation and time management [18]. However, the lack of a significant difference in sleep quality challenges assumptions that students experience greater sleep disruption. This may reflect widespread sleep problems across both groups or limitations in the sleep quality measurement scale.
Moreover, the variability in students’ screen time suggests greater heterogeneity in digital lifestyles among younger users, which may be influenced by differences in self-regulation, academic habits, and social media use [8].
In sum, the findings confirm that occupation meaningfully moderates digital behavior and perceived productivity, highlighting the need for tailored digital wellness interventions across demographic groups.
5.3. Predictive Modeling of Mental Wellness
To determine whether screen-related behaviors and lifestyle factors could reliably predict subjective mental wellness, a multivariate regression model was constructed using the Mental Wellness Index (range 0–100) as the dependent variable. This model evaluates Research Question 3 and tests Hypothesis H3, which proposes that mental wellness can be effectively estimated using behavioral indicators such as screen time, stress level, sleep, productivity, physical activity, and social interaction. The predictive capacity of this model is essential for identifying high-risk digital lifestyles and for enabling real-time intervention strategies in applied psychological and digital health contexts.
Nine predictors were included, drawn from established constructs in behavioral psychology and digital wellness literature [10,11]:
- Digital Behavior: total screen time (hours/day), leisure screen time, work screen time
- Psychophysiological Factors: sleep duration, sleep quality (1–5 scale), stress level (0–10 scale)
- Performance Metric: self-perceived productivity (0–100 scale)
- Lifestyle Modifiers: exercise (minutes/week), social time (hours/week)
All features were standardized to allow comparison of effect sizes across variables. The dataset was divided into training (80 percent) and testing (20 percent) sets using a fixed random seed to ensure replicability. Model performance was assessed using R² (coefficient of determination) and Root Mean Squared Error (RMSE).
The regression model explained a substantial proportion of the variance in mental wellness scores:
- R² = 0.93
- RMSE = 5.29 (on a 0–100 scale)
An R² of 0.93 indicates that 93 percent of the variation in mental wellness can be accounted for by the included predictors. This reflects exceptional predictive power and exceeds many psychological models that rely on single-domain variables [9].

Table 3.
Standardized Regression Coefficients for Predicting Mental Wellness.
| Predictor Variable | β Coefficient | Effect | Interpretation |
| Stress Level (0–10) | −10.69 | Strong − | Most impactful; higher stress sharply reduces wellness |
| Sleep Quality (1–5) | +5.92 | Strong + | Higher perceived sleep quality increases wellness |
| Productivity (0–100) | +4.72 | Strong + | Self-efficacy is a major contributor to well-being |
| Exercise Minutes per Week | +1.57 | Moderate + | Regular physical activity adds to wellness resilience |
| Sleep Hours | +0.15 | Weak + | Minor benefit beyond subjective sleep quality |
| Social Hours per Week | −0.35 | Weak − | Weak inverse; possibly due to late-night or overstimulating social time |
| Leisure Screen Time | −0.04 | Negligible − | Minimal direct effect after controlling for mediators |
| Work Screen Time | +0.01 | Neutral | No net effect; task-focused screen use likely neutralized |
| Total Screen Time | −0.01 | Neutral | Fully mediated through stress and sleep pathways |
To illustrate the relative importance of each predictor, Figure 3 presents the standardized regression coefficients in a horizontal bar chart. This visual representation clearly identifies which variables exert the strongest positive or negative influence on mental wellness.
The model shows that stress, sleep quality, and productivity are the most significant predictors. Raw screen time variables have minimal direct effect when controlling for mediators.
Among all predictors, stress level was the strongest determinant of mental wellness, with each standard deviation increase in stress predicting a 10.7-point reduction in wellness score. This aligns with evidence linking chronic stress to emotional dysregulation, impaired executive function, and reduced well-being [6,12].
Sleep quality and self-perceived productivity were also strong positive predictors. The sleep findings support the view that restorative rest buffers emotional volatility and promotes resilience, while the productivity effect reflects the psychological benefits of self-efficacy, autonomy, and competence [5,14].
Leisure and total screen time showed minimal direct predictive value once stress and sleep were considered. This suggests that screen exposure is not inherently harmful but may influence wellness through pathways such as sleep disruption or elevated stress [7,8]. Work-related screen time had a neutral effect, reinforcing the distinction between purposive and passive digital engagement [17].
Although social time is generally expected to support mental wellness, its slight negative coefficient may reflect measurement limitations or contextual effects such as overstimulation, late-night interaction, or conflict-prone social spaces. More detailed measures of social interaction quality may be needed to clarify this relationship.
5.4. Clustering Analysis of Digital Behavior and Wellness Profiles
While regression modeling identifies linear predictors of mental wellness, it does not reveal whether there are qualitatively distinct user profiles based on combined behavioral and psychological characteristics. To address Research Question 4 and test Hypothesis H4, an unsupervised clustering analysis was conducted to uncover latent subgroups within the population who share similar digital usage patterns and wellness outcomes.
A K-Means clustering algorithm was applied to the standardized dataset, including nine features:
- Screen usage metrics: total, work, and leisure screen time
- Psychological wellness: sleep hours, sleep quality, stress level, productivity
- Lifestyle indicators: weekly exercise and social interaction hours
Prior to clustering, all variables were normalized using Z-score standardization. The elbow method was used to determine the optimal number of clusters, with K = 3 yielding the best trade-off between interpretability and explained variance.
To visualize the clustering outcome, Principal Component Analysis (PCA) was used to reduce the multidimensional data to two principal components. The results are presented in Figure 4.
Each point represents a participant, colored by cluster membership. The two principal components capture the largest sources of variation in the dataset. Clear separation between clusters indicates well-defined user segments.
Each cluster was analyzed by computing the average values for behavioral, psychological, and lifestyle variables. Table 4 summarizes the distinctive characteristics of the three clusters.
Cluster 0: Balanced and Active Users
This group demonstrates relatively low stress, high productivity, and moderate screen use. They report the highest sleep quality and engage in above-average physical and social activity. These individuals appear to represent a digitally healthy lifestyle, using screens purposefully while maintaining balance through physical self-care and rest. They also show the highest wellness scores (M = 46.4), significantly above the overall mean.
Cluster 1: Leisure-Heavy, High-Stress Users
Users in this group exhibit high leisure screen use and elevated stress levels, coupled with poor sleep and low productivity. Their wellness scores are sharply lower (M = 11.6), suggesting a profile consistent with digital overuse or escapism. This group may represent students or unemployed users whose unstructured routines contribute to chronic digital fatigue and emotional dysregulation.
Cluster 2: Burnout-Prone Professionals
This cluster is characterized by the highest total screen time, much of it driven by work demands. Despite high screen engagement, their productivity remains low, and stress levels are the highest among all groups (M = 9.5). This segment may reflect digital overload in employed individuals, including remote workers or knowledge professionals experiencing cognitive fatigue and sleep debt.
The clustering results confirm Hypothesis H4, showing that individuals fall into at least three distinct profiles based on their interaction with digital technologies and their resulting psychological states. These profiles are not only statistically distinct, as demonstrated by PCA separation, but also theoretically meaningful, aligning with typologies proposed in recent research on digital wellness [22,23].
By identifying user groups at risk for digital burnout or emotional dysregulation, this segmentation approach offers a useful foundation for tailoring interventions, ranging from individualized screen-hygiene plans to system-level wellness monitoring in educational or workplace environments.
6. Discussion
This study investigated the complex interrelationships between screen time behaviors, psychological wellness indicators, and lifestyle factors among a diverse sample of 400 individuals. Drawing on computational methods including correlation analysis, regression modeling, and unsupervised clustering, the findings offer robust empirical support for a multidimensional framework linking digital behavior with mental health outcomes. The results not only confirm previous claims in the literature but also extend them by identifying behavioral subtypes and revealing indirect pathways of effect.
6.1. Stress as the Primary Mediator of Screen Use Effects
Consistent with a growing body of digital health research, this study found that perceived stress level was the strongest predictor of mental wellness. In both correlational and regression models, stress showed a large negative association with wellness (r = −0.91; β = −10.69), supporting findings from earlier work that emphasized stress as a psychological bottleneck in digital environments [6,10,12]. The clustering analysis further reinforced this pattern, with the lowest wellness scores occurring in the highest-stress segments (Clusters 1 and 2).
These findings suggest that stress is not only correlated with wellness but may act as a mediating mechanism linking screen use to mental health outcomes, a view consistent with theoretical models such as the Cognitive Activation Theory of Stress [24]. Screen behaviors that elevate cognitive load, fragment attention, or reduce recovery time, particularly through nighttime use, are likely to raise perceived stress, which subsequently diminishes overall well-being.
6.2. Sleep Quality and Productivity as Protective Buffers
Sleep quality (β = +5.92) and self-perceived productivity (β = +4.72) were strong positive predictors of mental wellness. These results align with findings that restorative sleep supports affective and cognitive functioning [4,15] and that productivity enhances self-efficacy, control, and a sense of achievement [5]. Sleep duration had a far weaker influence (β = +0.15), indicating that subjective sleep quality matters more than total hours of rest, a point that has been emphasized in work focusing on sleep architecture and depth [25]. The added contribution of productivity highlights the importance of self-regulation and goal-directed engagement in buffering the psychological strain associated with heavy screen use.
6.3. Weak and Mediated Role of Screen Time
This study found minimal direct effects of total or leisure screen time on wellness once stress and sleep were included in the model. Neither total screen time (β = −0.01) nor leisure screen time (β = −0.04) showed meaningful predictive weight, supporting arguments that screen time effects are nonlinear, context-dependent, and often mediated by other factors [7,17]. Work-related screen time showed a near-zero effect (β = +0.01), reinforcing the distinction between purposeful and passive digital engagement.
6.4. Identification of At-Risk User Groups
Unsupervised clustering revealed three clear profiles, with two segments—Leisure-Heavy High-Stress Users and Burnout-Prone Professionals, showing low wellness scores alongside high digital engagement. These clusters reflect constructs such as problematic internet use [26] and technostress [27], suggesting that vulnerability varies across usage patterns and user roles. The Balanced and Active User cluster showed high wellness despite moderate screen use, indicating that risk reflects behavioral balance rather than total exposure.
6.5. Integration with Theoretical Models
The findings align with the Transactional Model of Stress and Coping [28], which views stress as emerging from the balance between environmental demands and coping resources like sleep, productivity, and exercise. They also converge with Self-Determination Theory [29], which posits that well-being is rooted in autonomy, competence, and relatedness, factors indirectly supported by self-regulated screen behaviors and productive engagement.
7. Implications and Limitations
7.1. Practical Implications
The findings yield several important implications for public health interventions, digital wellbeing tools, and behavioral health policies in the context of rising screen use across populations [1]. The study emphasizes that screen time alone is a weak standalone indicator of mental wellness. Instead, stress levels, sleep quality, and productivity emerge as the most meaningful and modifiable predictors.
From a digital health perspective, these results support a shift away from monitoring screen duration and toward promoting stress-aware, sleep-optimized, and goal-oriented digital engagement. Applications and digital platforms can integrate features that:
- Monitor user stress or fatigue through sensor data or feedback loops
- Encourage digital breaks or focus modes to reduce cognitive overload
- Provide contextual nudges that promote sleep hygiene, such as dimming interfaces or limiting late-night notifications
In educational and workplace environments, predictive analytics derived from models like those used in this study could help identify individuals vulnerable to burnout and provide personalized wellness resources.
From a policy standpoint, the findings support incorporating digital wellness screening into public health surveys and telehealth programs. Rather than framing screen use as universally harmful, policies should focus on high-risk behavioral patterns and promote self-regulation through design and environmental nudges.
7.2. Theoretical Implications
The study contributes to digital mental health theory by providing computational evidence for non-linear and mediated models of digital impact. The minimal direct effect of total screen time, alongside the strong influence of mediators such as stress and sleep, aligns with the Transactional Model of Technology Use [30], which emphasizes the role of user context, psychological traits, and lifestyle compensations.
The three behavioral clusters identified in this study operationalize digital user phenotypes and support person-centered models of technology engagement [23]. These profiles move the field toward personalized digital wellness interventions grounded in data-driven behavior signatures.
The results also challenge simplistic dose-response approaches that equate more screen time with worse outcomes. The absence of predictive value for pure screen quantity measures, once mediators are controlled, suggests that future work should focus on qualitative indicators such as intentionality, interactivity, and reward design [7].
7.3. Methodological Strengths
This study demonstrates several methodological strengths:
- A multi-method computational pipeline combining regression, clustering, and dimensionality reduction
- Use of a composite mental wellness index capturing mood, focus, and energy
- Integration of objective behavioral metrics (screen hours) with subjective assessments (sleep, stress, productivity), producing a more comprehensive picture of digital behavior than many existing studies
These strengths support the external validity and generalizability of the results across digital contexts and user groups.
7.4. Limitations and Future Research
Despite its contributions, several limitations remain:
- Self-reported data: All measures rely on self-report, introducing recall and desirability biases. Future studies should incorporate passive sensing tools to validate screen behaviors.
- Cross-sectional design: The single-time-point dataset limits causal inference. Longitudinal data would allow examination of dynamic changes in wellness.
- Simplified rating scales: Sleep and stress scales, though practical, may oversimplify complex constructs. Multi-item psychometric measures or physiological indicators could strengthen future analyses.
- Lack of social context data: The dataset does not capture content or quality of screen use or social interactions, both of which may moderate psychological outcomes.
- Limited demographic diversity: While the dataset includes students and working adults, broader cultural and socioeconomic samples are needed for global generalization.
Despite these limitations, the analytical pipeline developed here provides a replicable model for future digital health research using real-world behavioral data.
8. Conclusions
In an era of escalating screen exposure and digital saturation, this study provides a timely and rigorous investigation into the relationship between daily digital behavior and mental wellness. Using a uniquely structured dataset of 400 participants and a multifaceted computational pipeline, we offer strong evidence that screen time alone is not a sufficient predictor of psychological health. Instead, the impact of digital life on well-being is highly context-dependent, with outcomes shaped primarily by stress, sleep quality, and personal productivity.
Correlation analyses confirmed that stress level is the central psychological mediator, exhibiting the strongest inverse relationship with wellness. Regression modeling validated this further, showing that even small increases in stress sharply reduce mental wellness scores. Importantly, while screen time contributes to stress and poor sleep, its direct influence on well-being vanishes once these mediators are included. These results suggest that digital health interventions should shift focus away from screen time quantity and toward stress mitigation, sleep hygiene, and productive engagement.
Clustering analysis revealed three robust digital behavior phenotypes, ranging from balanced users to high-stress, burnout-prone individuals, each with distinct profiles of wellness and screen habits. These clusters offer promising directions for personalized mental health support, allowing researchers and practitioners to target at-risk groups with tailored interventions.
The findings both support and advance existing psychological models. They align with the Transactional Model of Stress and Coping and Self-Determination Theory while empirically operationalizing newer digital mental health frameworks. The computational approach further illustrates how predictive analytics and behavioral segmentation can inform scalable, data-driven mental health tools.
At a time when screen use is increasingly intertwined with work, education, and socialization, this study contributes crucial clarity. It reframes the narrative around digital behavior: not as inherently harmful, but as a system of modifiable risk and resilience factors. The practical implication is that meaningful digital wellness does not come from avoidance but from intentional engagement.
In sum, this research adds both conceptual depth and empirical strength to the discourse on mental health in the digital age. It provides a reproducible model for future studies and a roadmap for developing intelligent, context-aware interventions that support psychological well-being without demonizing the screen.
Funding
The authors received no financial support for the research, authorship, or publication of this article.
Institutional Review Board Statement
This study did not involve human participants and therefore did not require formal ethical approval.
Data Availability Statement
The dataset used in this study is publicly available on Kaggle under the MIT License. It contains responses from 400 participants on screen time, sleep, stress, and wellness. The dataset is titled Screen Time vs Mental Wellness Survey - 2025 and can be accessed at the following link: https://www.kaggle.com/datasets/adharshinikumar/screentime-vs-mentalwellness-survey-2025
Conflict of interest
The authors declare that the research was conducted in the absence of any commercial, financial, or nonfinancial relationships that could be construed as a potential conflict of interest.
References
- World Health Organization. World health statistics 2023: monitoring health for the SDGs. https://www.who.int/publications/i/item/9789240074323. Accessed December 9, 2025.
- Twenge, JM; Campbell, WK. Associations between screen time and lower psychological well-being among children and adolescents: Evidence from a population-based study. Prev Med Rep. 2018, 12, 271–283. [Google Scholar] [CrossRef]
- Keles, B; McCrae, N; Grealish, A. A systematic review: the influence of social media on depression, anxiety and psychological distress in adolescents. Int J Adolesc Youth 2020, 25(1), 79–93. [Google Scholar] [CrossRef]
- Cain, N; Gradisar, M. Electronic media use and sleep in school-aged children and adolescents: A review. Sleep Med. 2010, 11(8), 735–742. [Google Scholar] [CrossRef] [PubMed]
- Carter, B; Rees, P; Hale, L; Bhattacharjee, D; Paradkar, MS. Association between portable screen-based media device access or use and sleep outcomes: a systematic review and meta-analysis. JAMA Pediatr. 2016, 170(12), 1202–1208. [Google Scholar] [CrossRef] [PubMed]
- Montag, C; Walla, P. Carpe diem instead of losing your social mind: beyond digital addiction and why we all suffer from digital overuse. Cogent Psychol. 2016, 3(1), 1157281. [Google Scholar] [CrossRef]
- Przybylski, AK; Weinstein, N. A Large-Scale Test of the Goldilocks Hypothesis. Psychol Sci. 2017, 28(2), 204–215. [Google Scholar] [CrossRef]
- Odgers, CL; Jensen, MR. Annual Research Review: Adolescent mental health in the digital age: facts, fears, and future directions. J Child Psychol Psychiatry 2020, 61(3), 336–348. [Google Scholar] [CrossRef]
- Montag, C; Rumpf, HJ. The Potential of Digital Phenotyping and Mobile Sensing for Psycho-Diagnostics of Internet Use Disorders. Curr Addict Rep. 2021, 8(3), 422–430. [Google Scholar] [CrossRef]
- Huckins, JF; daSilva, AW; Wang, W; et al. Mental Health and Behavior of College Students During the Early Phases of the COVID-19 Pandemic: Longitudinal Smartphone and Ecological Momentary Assessment Study. J Med Internet Res. 2020, 22(6), e20185. [Google Scholar] [CrossRef]
- Twenge, JM; Martin, GN; Spitzberg, BH. Trends in US adolescents’ media use, 1976–2016: the rise of digital media, the decline of TV, and the near demise of print. Psychol Pop Media Cult. 2019, 8(4), 329–345. [Google Scholar] [CrossRef]
- Riehm, KE; Feder, KA; Tormohlen, KN; et al. Associations Between Time Spent Using Social Media and Internalizing and Externalizing Problems Among US Youth. JAMA Psychiatry 2019, 76(12), 1266–1273. [Google Scholar] [CrossRef]
- Exelmans, L; Van den Bulck, J. Bedtime, shuteye time and electronic media: sleep displacement is a two-step process. J Sleep Res. 2017, 26(3), 364–370. [Google Scholar] [CrossRef]
- Hale, L; Guan, S. Screen time and sleep among school-aged children and adolescents: a systematic literature review. Sleep Med Rev. 2015, 21, 50–58. [Google Scholar] [CrossRef]
- Lemola, S; Perkinson-Gloor, N; Brand, S; Dewald-Kaufmann, JF; Grob, A. Adolescents' electronic media use at night, sleep disturbance, and depressive symptoms in the smartphone age. J Youth Adolesc. 2015, 44(2), 405–418. [Google Scholar] [CrossRef] [PubMed]
- Hirshkowitz, M; Whiton, K; Albert, SM; et al. National Sleep Foundation's sleep time duration recommendations: methodology and results summary. Sleep Health 2015, 1(1), 40–43. [Google Scholar] [CrossRef] [PubMed]
- Orben, A; Przybylski, AK. Screens, Teens, and Psychological Well-Being: Evidence From Three Time-Use-Diary Studies. Psychol Sci. 2019, 30(5), 682–696. [Google Scholar] [CrossRef] [PubMed]
- Qin X, Wang X. A sociotechnical framework for addressing the influence of work time and income on work well-being. In: Bhutkar G, et al, eds. Human Work Interaction Design. Artificial Intelligence and Designing for a Positive Work Experience in a Low Desire Society. HWID 2021. IFIP Advances in Information and Communication Technology. Vol 609. Cham: Springer; 2022.
- Sachu, B; Kadeswaran, S; Jayaseelan, R. Shaping childhood in the digital age: parental insights into social media’s personal, behavioral, and environmental impacts. Int J Soc Sci Educ Res. 2025, 7(2), 384–389. [Google Scholar] [CrossRef]
- Fatima, A; Akhter, MS; Kanekar, A; et al. A Scoping Review of the Use and Determinants of Social Media Among College Students. Healthcare (Basel) 2025, 13(17), 2234. [Google Scholar] [CrossRef]
- Alghamdi, FAD; Alghamdi, FAG; Abusulaiman, A; et al. Video Game Addiction and its Relationship with Sleep Quality among Medical Students. J Epidemiol Glob Health 2024, 14(3), 1122–1129. [Google Scholar] [CrossRef]
- Tei, S; Fujino, J; Murai, T. Navigating the self online. Front Psychol. 2025, 16, 1499039. [Google Scholar] [CrossRef]
- Orben, A; Dienlin, T; Przybylski, AK. Social media's enduring effect on adolescent life satisfaction. Proc Natl Acad Sci U S A 2019, 116(21), 10226–10228. [Google Scholar] [CrossRef]
- Ursin, H; Eriksen, HR. The cognitive activation theory of stress. Psychoneuroendocrinology 2004, 29(5), 567–592. [Google Scholar] [CrossRef] [PubMed]
- Walker M. Why We Sleep: Unlocking the Power of Sleep and Dreams. New York, NY: Scribner; 2017.
- Caplan, SE. Theory and measurement of generalized problematic internet use: a two-step approach. Comput Human Behav. 2010, 26(5), 1089–1097. [Google Scholar] [CrossRef]
- Ayyagari, R; Grover, V; Purvis, R. Technostress: technological antecedents and implications. MIS Q 2011, 35(4), 831–A10. [Google Scholar] [CrossRef]
- Folkman S. Stress: appraisal and coping. In: Gellman MD, Turner JR, eds. Encyclopedia of Behavioral Medicine. New York, NY: Springer; 2013.
- Deci EL, Ryan RM. Intrinsic Motivation and Self-Determination in Human Behavior. New York, NY: Springer; 1985.
- LaRose, R; Eastin, MS. A social cognitive theory of internet uses and gratifications: toward a new model of media attendance. J Broadcast Electron Media 2004, 48(3), 358–377. [Google Scholar] [CrossRef]
Figure 1.
Correlation Heatmap of Screen Behavior and Mental Wellness Indicators.
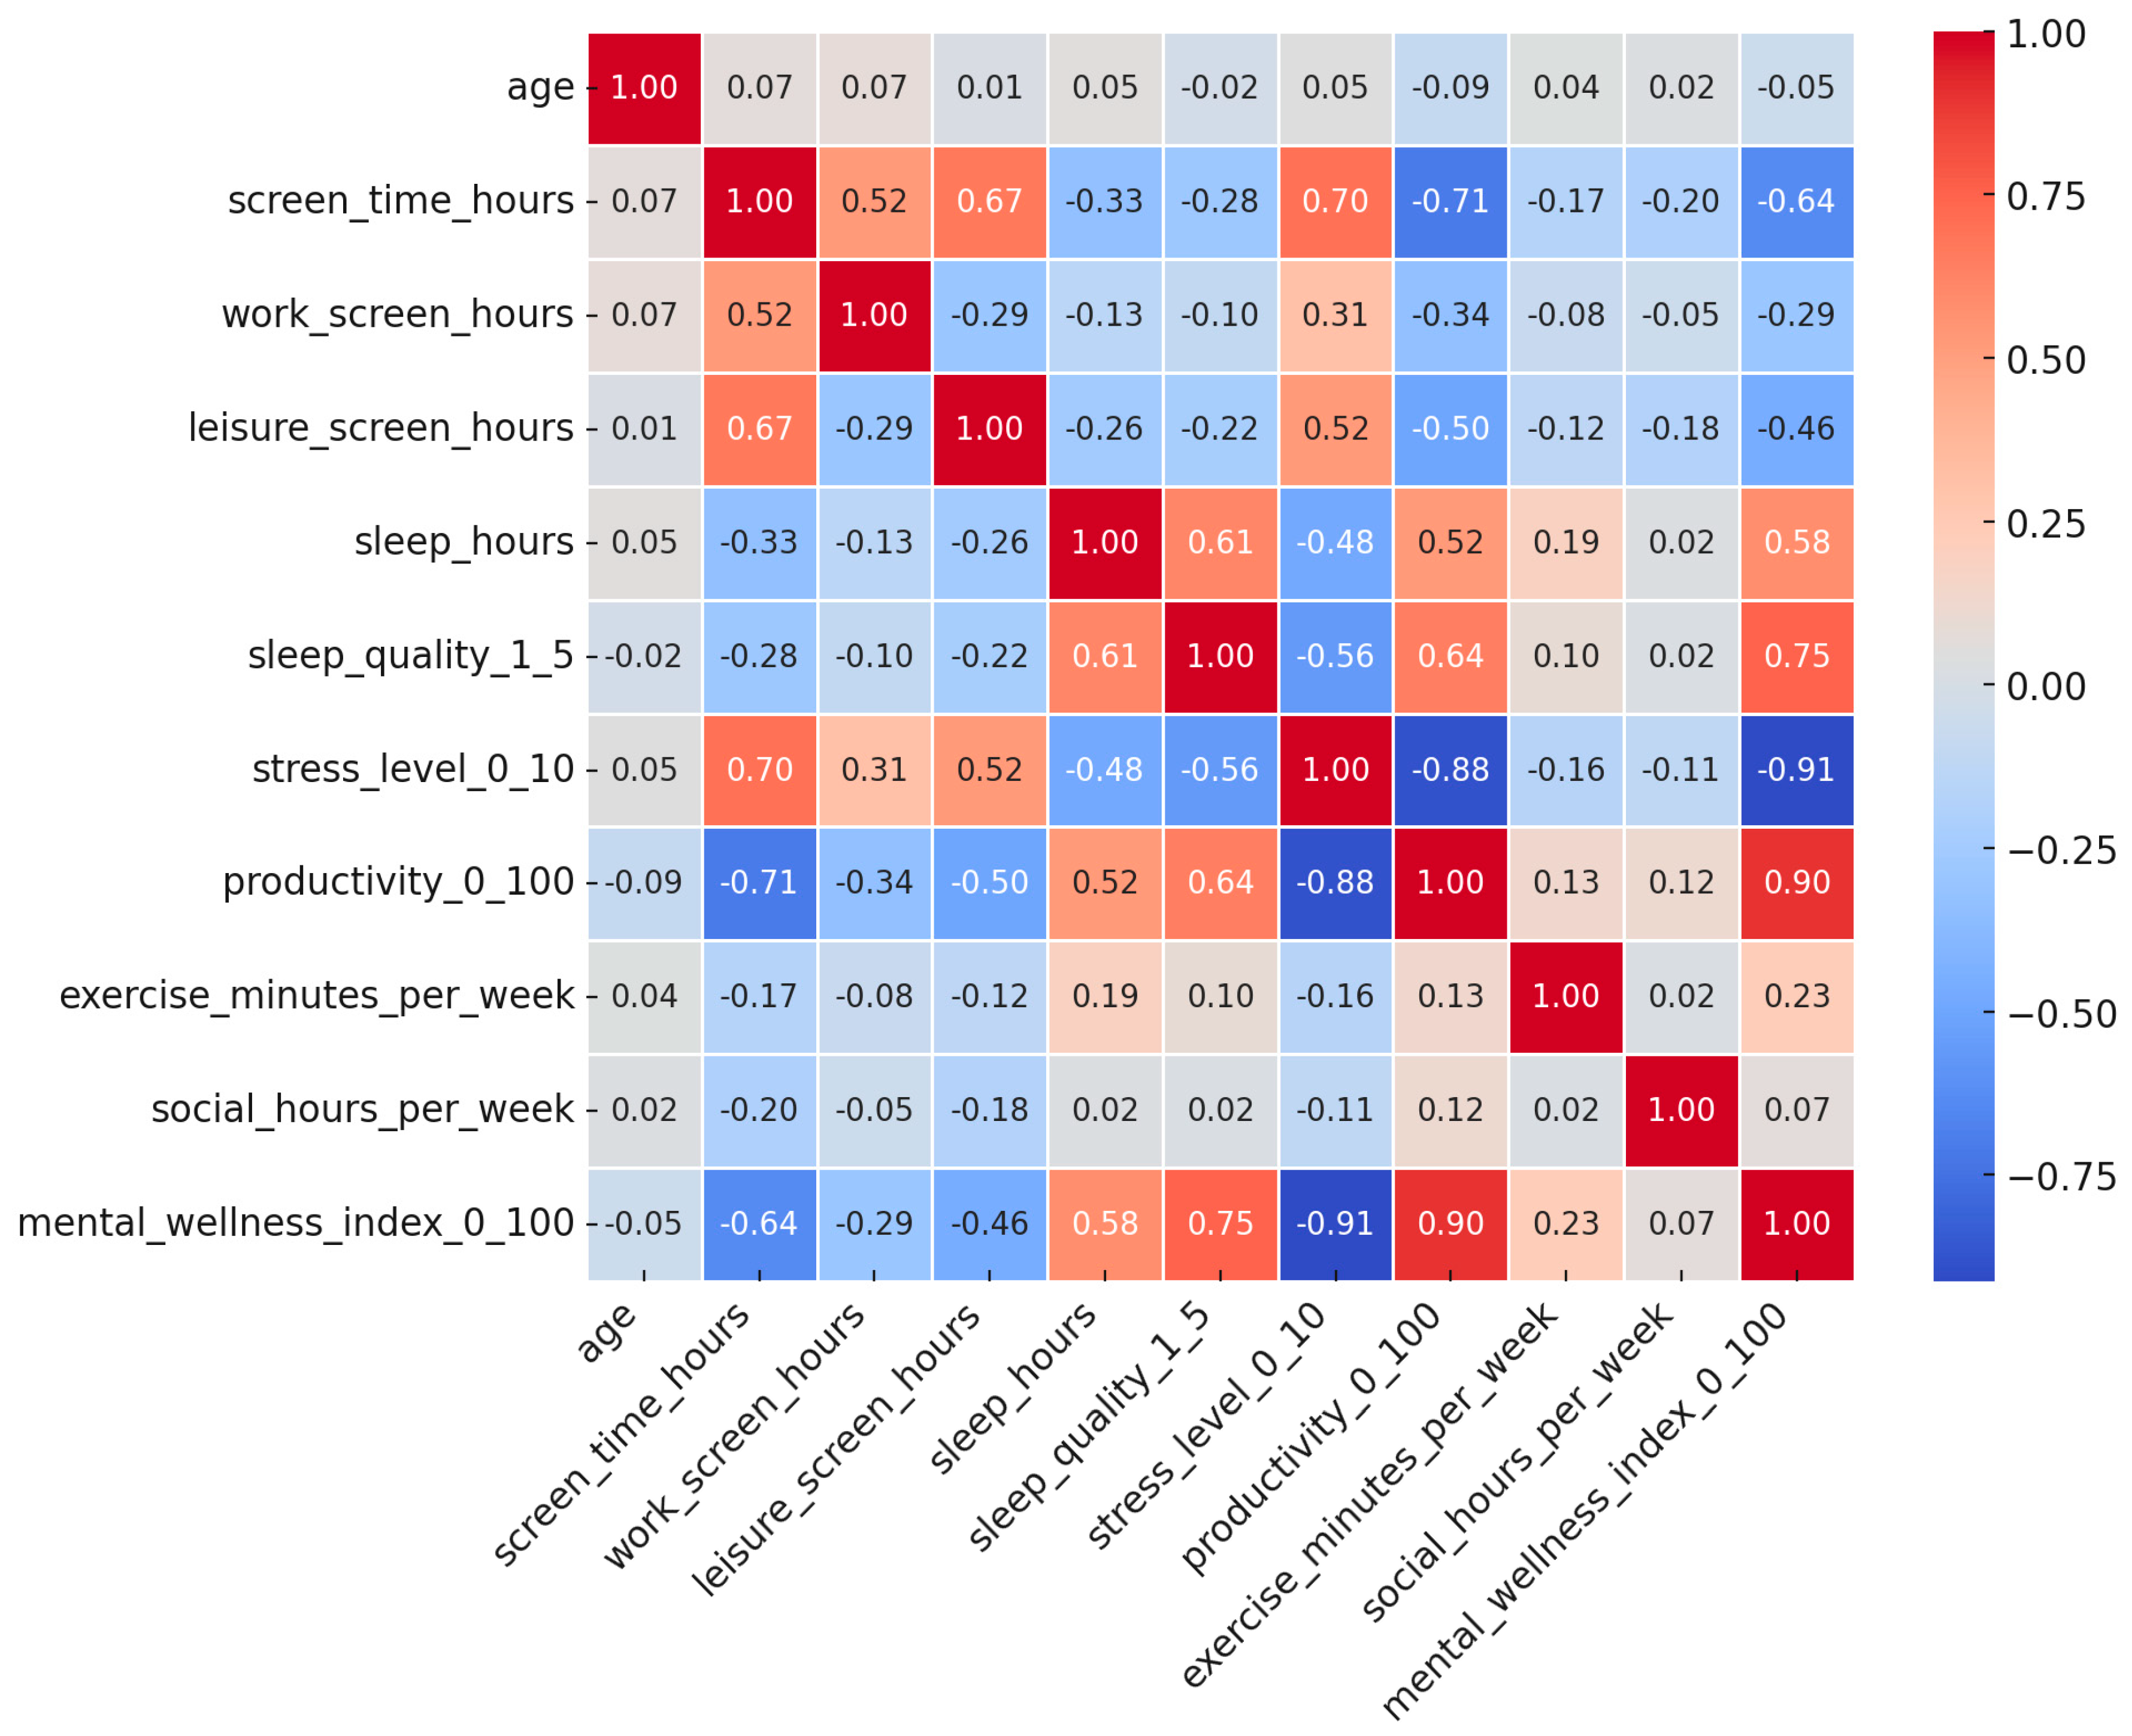
Figure 2.
A shows that students report higher average screen time, with greater variability, confirming the hypothesis that students spend more time with digital devices. B shows a negligible difference in sleep quality between students and employed individuals, which was not statistically significant. C indicates that employed individuals report slightly higher productivity, with statistical significance.
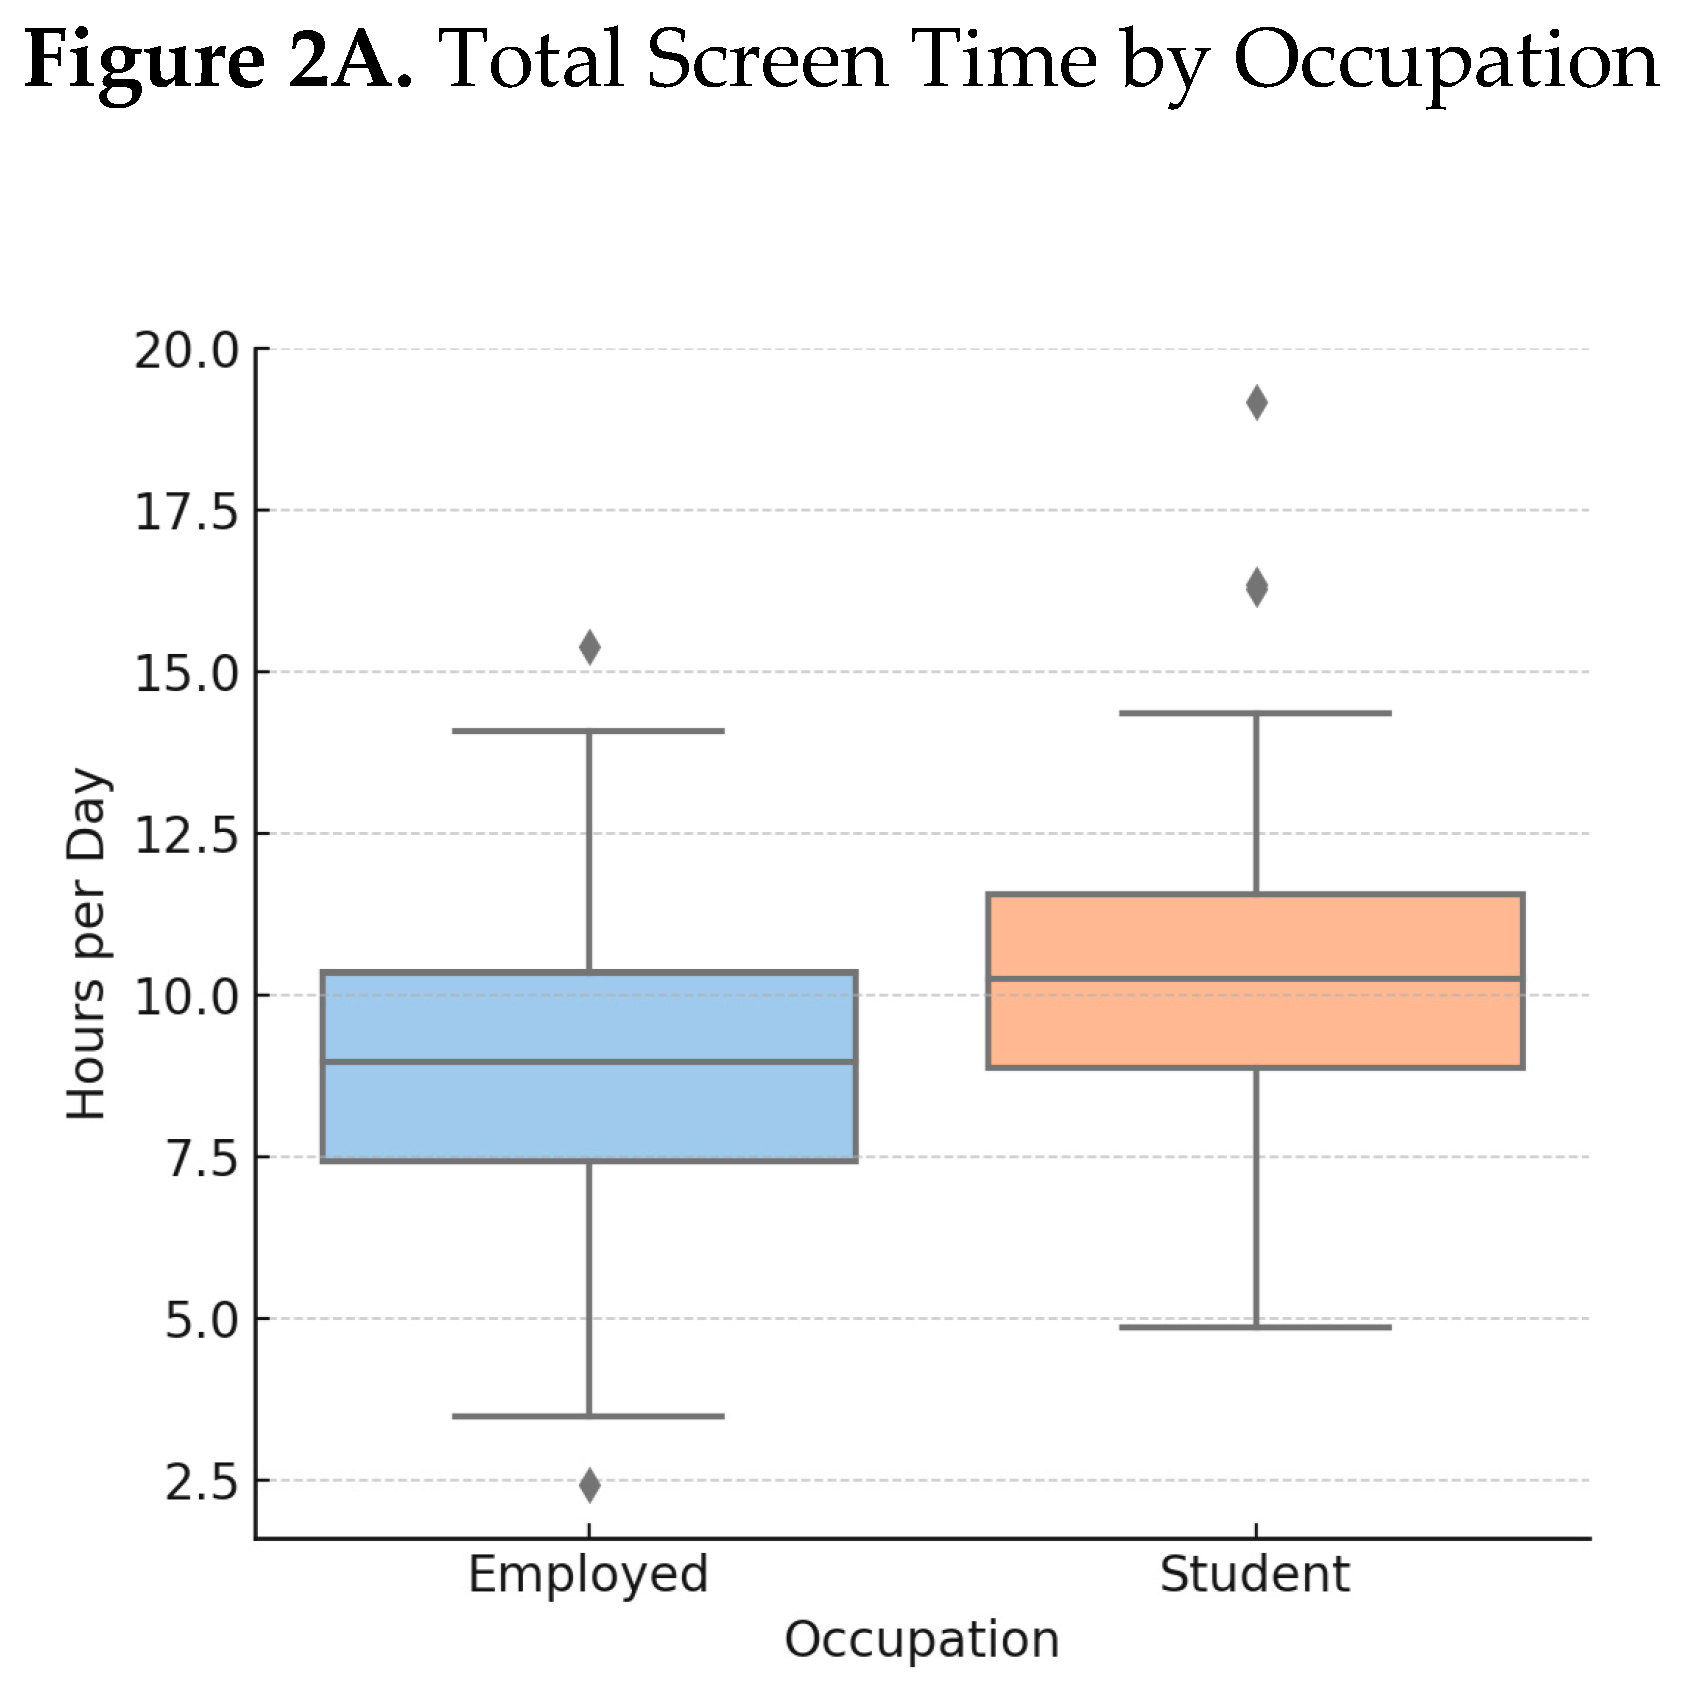
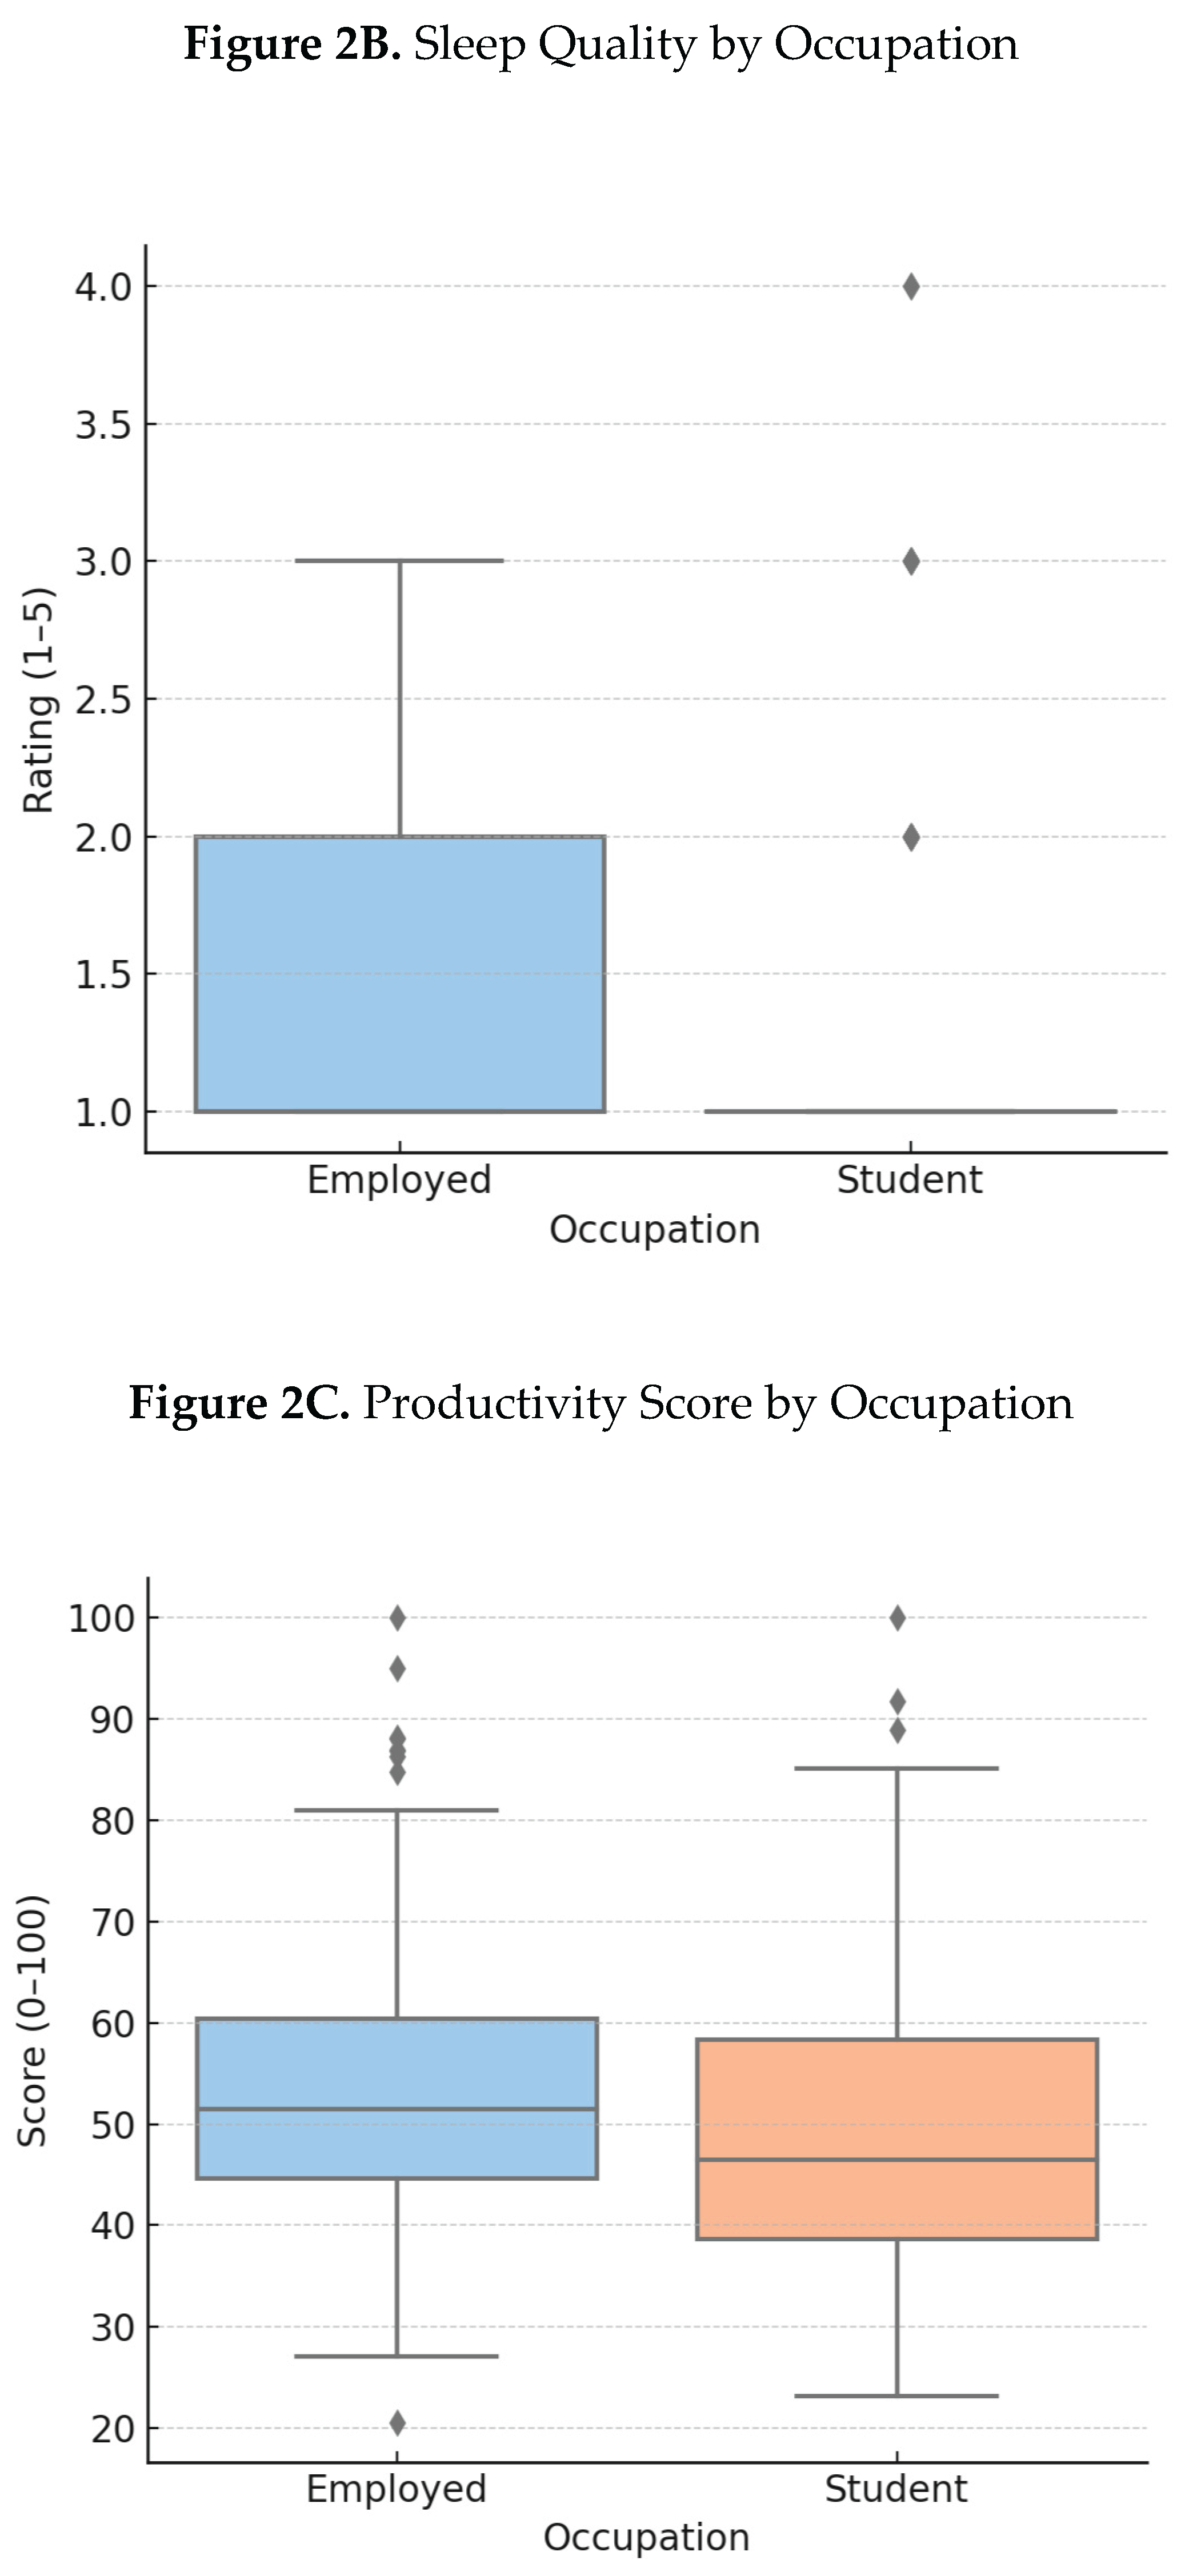
Figure 3.
Standardized Coefficients from Regression Model Predicting Mental Wellness.
Figure 4.
PCA Visualization of Clusters Based on Digital Behavior and Wellness.
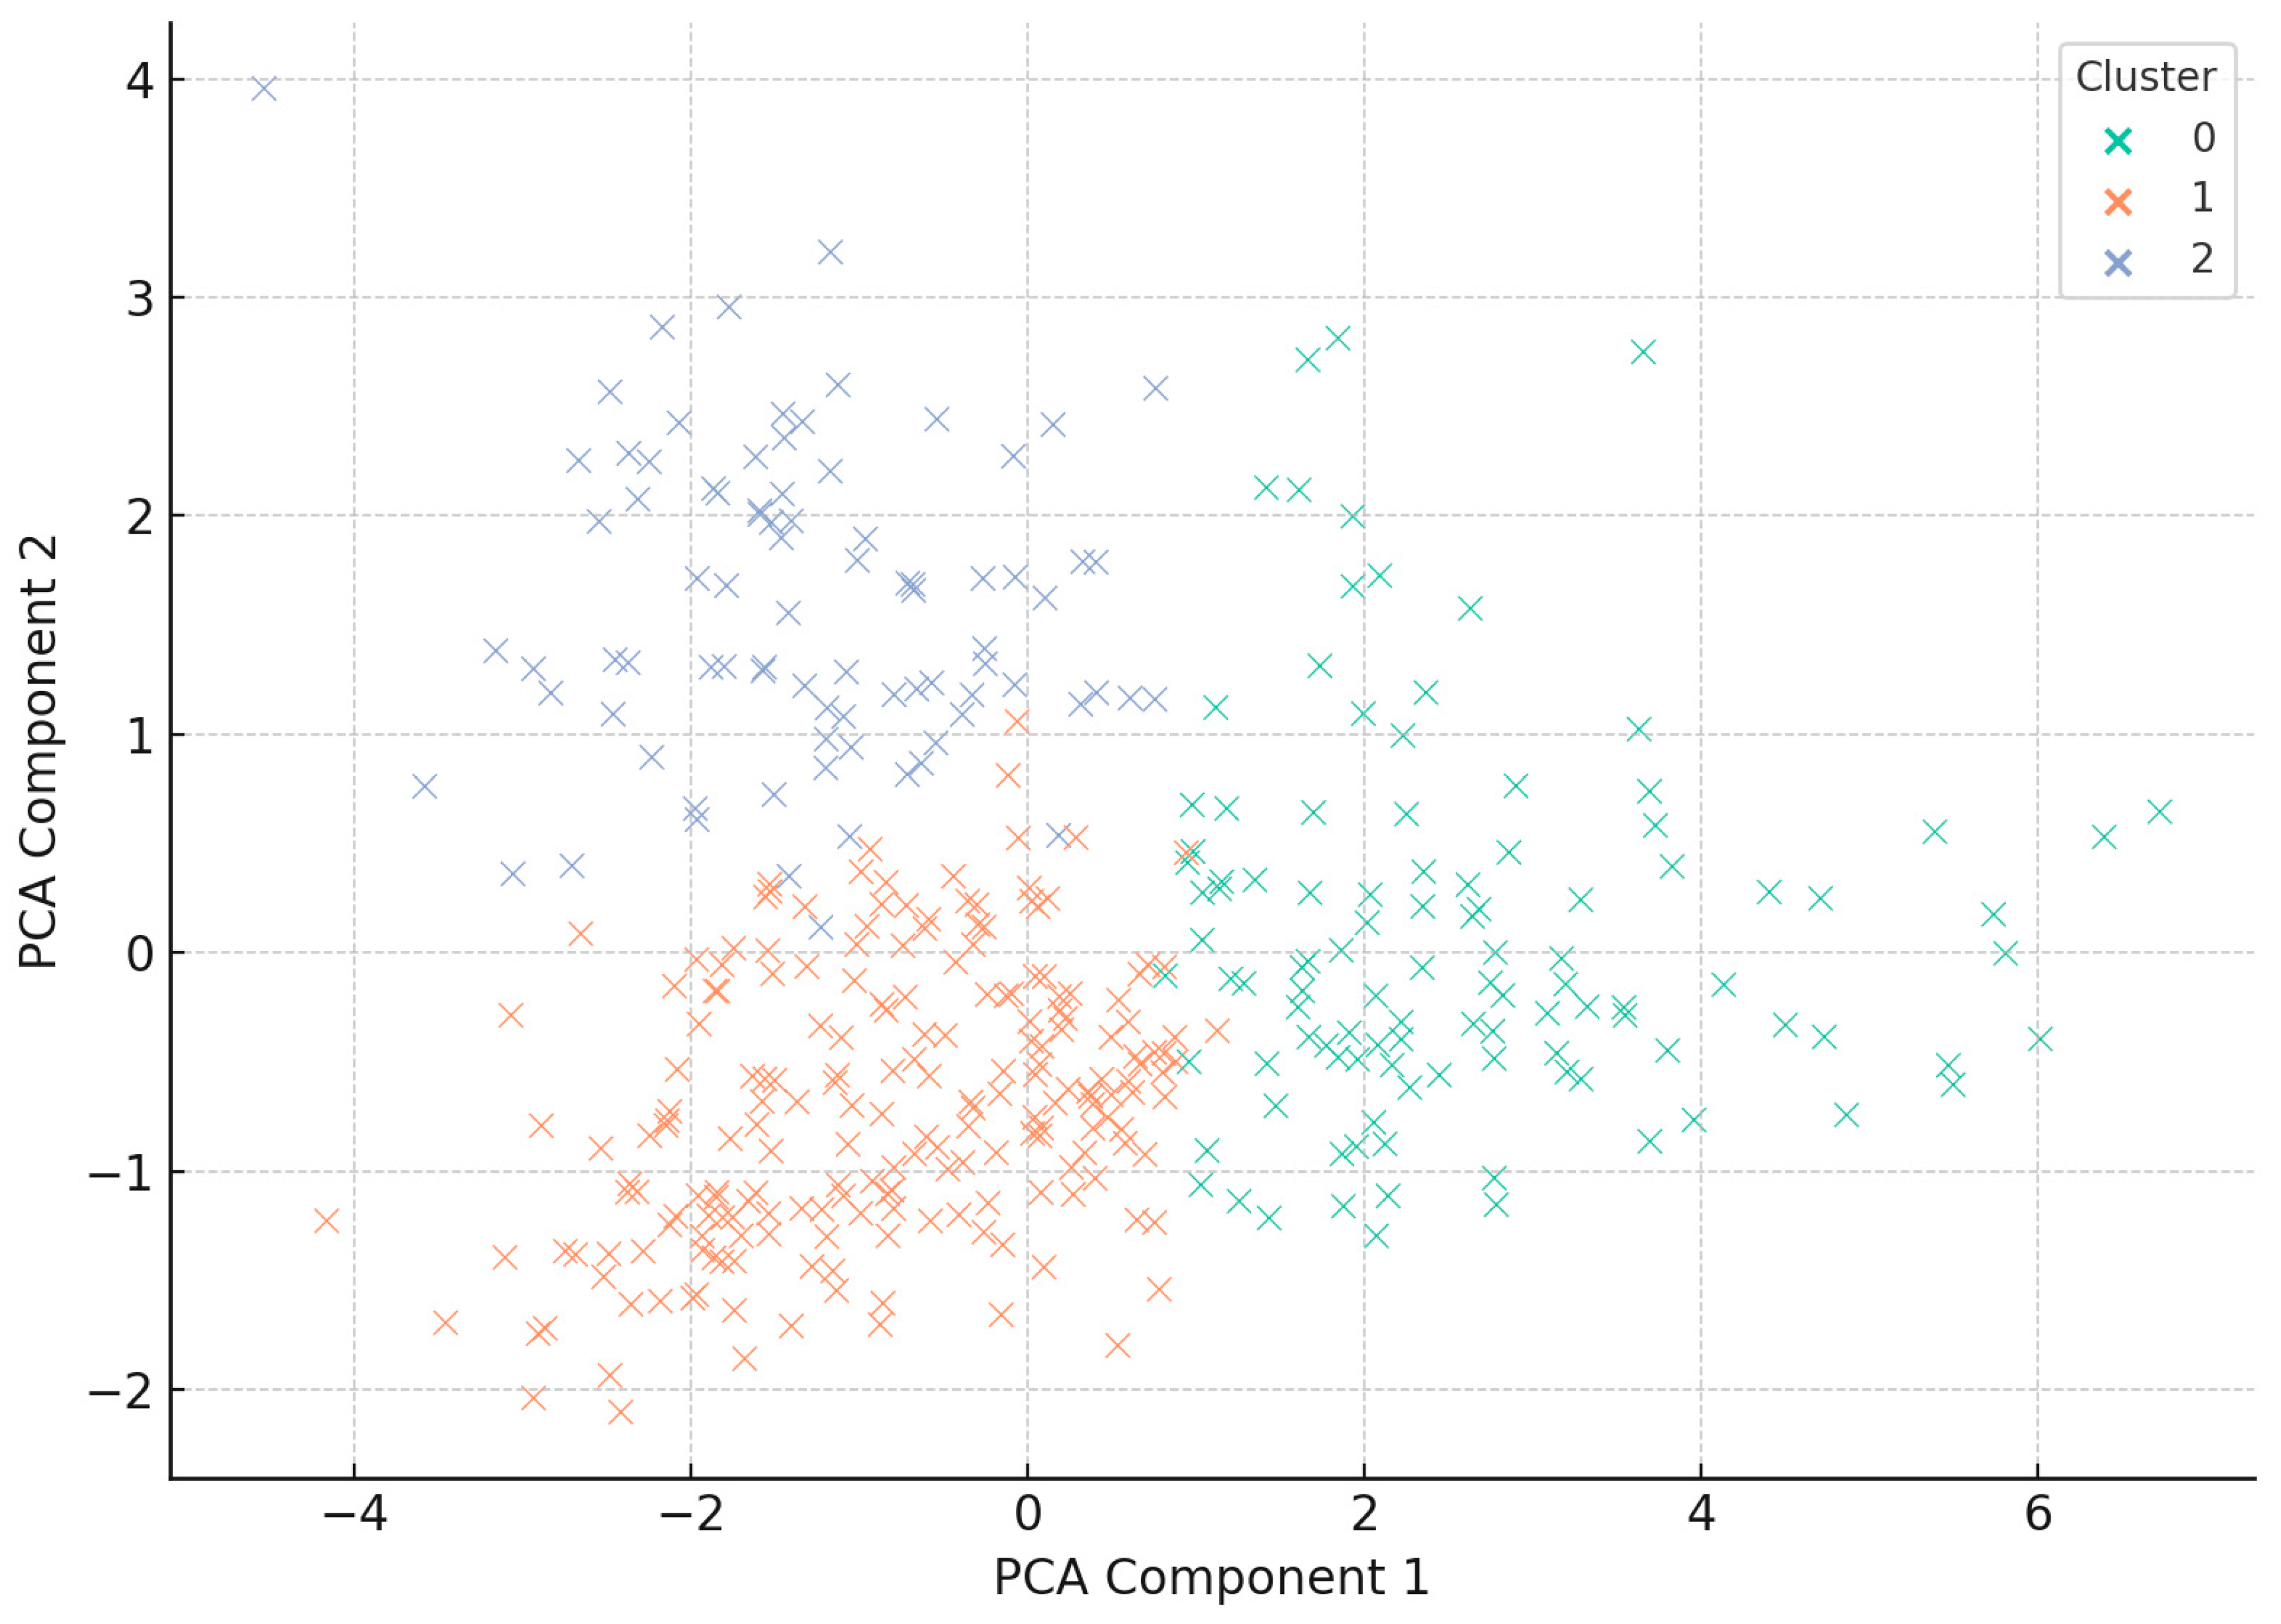
Table 1.
Pearson Correlation Coefficients Among Key Variables.
| Variable | Mental Wellness | Stress Level | Sleep Quality | Productivity | Total Screen | Leisure Screen |
| Mental Wellness Index (0–100) | 1.00 | −0.91 | +0.75 | +0.90 | −0.64 | −0.46 |
| Stress Level (0–10) | −0.91 | 1.00 | −0.68 | −0.79 | +0.70 | +0.49 |
| Sleep Quality (1–5) | +0.75 | −0.68 | 1.00 | +0.60 | −0.28 | −0.22 |
| Productivity Score (0–100) | +0.90 | −0.79 | +0.60 | 1.00 | −0.50 | −0.40 |
| Total Screen Time (hrs/day) | −0.64 | +0.70 | −0.28 | −0.50 | 1.00 | +0.83 |
| Leisure Screen Time (hrs/day) | −0.46 | +0.49 | −0.22 | −0.40 | +0.83 | 1.00 |
Table 2.
Group Mean Comparisons Between Students and Employed Participants.
| Variable | Students (Mean) | Employed (Mean) | t-statistic | p-value | Interpretation |
| Screen Time (hrs/day) | 10.33 | 8.89 | 5.28 | < 0.001 | Significant (H2a supported) |
| Sleep Quality (1–5) | 1.36 | 1.40 | −0.41 | 0.68 | Not Significant |
| Productivity (0–100) | 50.04 | 53.89 | −2.22 | 0.027 | Significant (H2b partially) |
Table 4.
Mean Values by Cluster (Behavior, Wellness, and Lifestyle).
| Cluster | Profile Description | Stress | Sleep Quality | Productivity | Screen Time | Wellness Index |
| Cluster 0 | Balanced and Active Users | 5.5 | 3.1 | 68.2 | 6.6 hrs | 46.4 |
| Cluster 1 | Leisure-Heavy, High-Stress Users | 9.0 | 1.4 | 40.2 | 9.5 hrs | 11.6 |
| Cluster 2 | Burnout-Prone Professionals | 9.5 | 1.3 | 39.4 | 11.0 hrs | 8.1 |
Disclaimer/Publisher’s Note: The statements, opinions and data contained in all publications are solely those of the individual author(s) and contributor(s) and not of MDPI and/or the editor(s). MDPI and/or the editor(s) disclaim responsibility for any injury to people or property resulting from any ideas, methods, instructions or products referred to in the content. |
© 2025 by the authors. Licensee MDPI, Basel, Switzerland. This article is an open access article distributed under the terms and conditions of the Creative Commons Attribution (CC BY) license (http://creativecommons.org/licenses/by/4.0/).
Copyright: This open access article is published under a Creative Commons CC BY 4.0 license, which permit the free download, distribution, and reuse, provided that the author and preprint are cited in any reuse.


