
Submitted:
03 December 2025
Posted:
10 December 2025
You are already at the latest version
Abstract
Boltzmann entropy is the central measure of microscopic disorder in thermodynamics, but it does not describe how open systems develop and maintain long-lived structure. Stars, planets, biospheres, and civilizations all undergo irreversible changes in regulation, coherence, and stability over time. These developmental paths are not captured by microstate multiplicity alone.
This article introduces a complementary macrodynamic quantity, the structural production rate, defined as the time derivative of a ripeness state that combines internal energy flow, structural memory, regenerative capacity, and systemic coherence. The sign of this rate identifies three universal phases across scales: maturation, stability, and reconfiguration.
The study formalizes a ripeness function for four domains: stellar evolution, planetary habitability, biospheric stability, and civilizational dynamics. Each component is mapped to measurable proxies, such as stellar oscillation properties, crustal recycling rates, genomic redundancy, and institutional memory indices. From this, the paper derived falsifiable predictions that can be tested with current and upcoming missions and datasets, including space-based asteroseismology, ice-moon plume chemistry, paleogenomic reconstructions, and long-term social coherence indices.
In this framing, entropy does not merely represent disorder. Instead, it defines the gradient that forces systems to develop, stabilize, and eventually reconfigure under persistent energy flow. The structural production framework provides a unified quantitative lens for comparative systems science and cross-domain prediction.
Keywords:
non-equilibrium thermodynamics
; entropy production
; structural production
; ripeness
; critical slowing down
; complex systems
; tipping points
; open systems
1. Introduction
Entropy remains the central measure of microscopic uncertainty in thermodynamics. In classical statistical mechanics, the Boltzmann formulation
connects macroscopic thermodynamic states with the multiplicity of underlying microstates [1,2]. This description is foundational and complete for closed systems near equilibrium.
However, most complex systems of scientific interest are not closed. Stars, planets, biospheres, and civilizations:
- operate far from equilibrium,
- exchange energy and matter with their environment,
- retain historical memory,
- and undergo directional developmental trajectories rather than random drift.
These macroscopic, path-dependent transitions—stellar ignition, planetary stabilization, abiogenesis, ecological recovery, civilizational rise and collapse—are not described by microstate multiplicity alone [3,?,?].
1.1. The Gap
Classical entropy captures microscopic imperatives: energy gradients must dissipate, and entropy production
remains non-negative in irreversible processes [?,?].
But it does not capture the macroscopic response of open systems that must organize, stabilize, and reorganize to maintain function over long timescales. The direction of structural evolution—the maturation, stability, and breakdown of regulatory structure—is missing from standard formulations of entropy.
1.2. This Paper: A Complementary Macrodynamic Variable
We introduce a second thermodynamic quantity designed for open, developing systems:
- a ripeness state , derived from measurable macroscopic regulators, and
- its structural production rate,which identifies how rapidly a system is integrating or losing structure.
This quantity does not replace . It complements it by describing the direction and velocity of structural change in macroscopic organization [4,?].
1.3. Unified Developmental Cycle
Across systems, the sign of reveals the same three-phase sequence:
- Maturation: structural integration accelerates (),
- Stability: regulation maintains coherent equilibrium (),
- Reconfiguration: coherence breaks down and structure is redistributed ().
1.4. Novel Contributions
This work:
- defines the ripeness function and structural production rate as macrodynamic complements to Boltzmann entropy;
- maps ripeness components to measurable proxies across four domains (stellar, planetary, biospheric, civilizational);
- demonstrates how the developmental cycle emerges universally from non-equilibrium regulation;
- introduces minimal numerical models to show implementation and expected trajectories.
By providing this shared quantitative lens, the framework enables comparative systems science and generates cross-domain predictions.
2. Theoretical Framework
2.1. Classical vs. Developmental Entropy: Complementary Roles
Boltzmann entropy describes the microstate multiplicity of closed systems [1,2]. For open systems, we retain the standard entropy production rate:
We now introduce the macroscopic conjugate quantity:
which describes how rapidly a system’s large-scale regulatory structure is integrating, stabilizing, or collapsing.
This pair
forms an entropic duality:
- : microscopic imperative (gradient dissipation),
- : macroscopic response (structural adaptation).
2.2. Defining the Ripeness State
Open systems maintain long-term structure through four macroscopic regulators. Let
- : internal energy throughput,
- : structural memory (persistence of prior organization),
- : regenerative capacity (ability to rebuild or self-correct),
- : systemic coherence (alignment and stability of components).
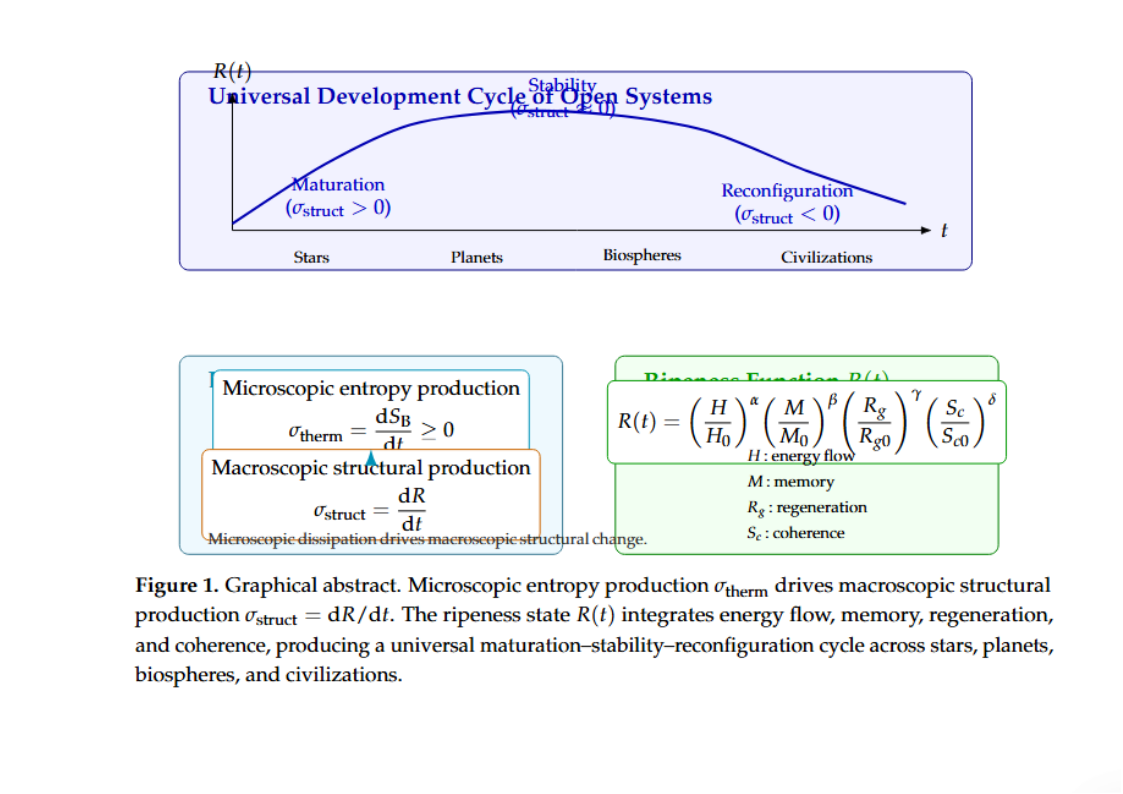
We define the ripeness field as
with normalization constants , , , matched to system class.
This multiplicative structure ensures that if any component collapses to zero, developmental ripeness collapses.
2.3. Structural Production Rate
The structural production rate
identifies the developmental regime:
These transitions can be viewed in terms of generalized free-energy basin dynamics,
where F is a generalized free-energy functional [3?]. Systems climb or descend these basins depending on regulation and coherence.
2.4. Conceptual Figure
Figure 1 (to be inserted in the final layout) will summarize the framework.
3. Applications Across Scales
Although stars, planets, biospheres, and civilizations differ in composition and mechanism, each sustains long-lived structure by stabilizing the flow of energy across time. In every domain, the ripeness state can be mapped to measurable proxies, and the sign of the structural production rate
reveals the system’s developmental phase.
3.1. Stellar Maturation
3.1.1. Mapping the Components
Stars are dissipative nuclear systems whose structure emerges from hydrostatic equilibrium and feedback between gravity, pressure, opacity, and fusion sensitivity [?]. Surface magnetism is a symptom, not a regenerative mechanism. We therefore map the four components as follows:

Table 1.
Ripeness components for stellar evolution.
| Component | Functional Meaning | Empirical Proxy | Measurement Method |
|---|---|---|---|
| Energy throughput | Luminosity | Broadband photometry | |
| Structural memory (core composition) | Core He fraction | Asteroseismology (g-modes) [8] | |
| Regenerative capacity (restoring equilibrium under compression) | Nuclear reaction sensitivity or opacity | Stellar models (MESA), helio-/asteroseismology [9,10] | |
| Structural coherence | Large frequency separation | p-mode asteroseismology [8] |
Here, encodes evolutionary memory, or measure the star’s ability to re-establish equilibrium when perturbed, and quantifies the spacing and stability of oscillatory modes, a measure of global coherence [7].
Using these, stellar ripeness becomes:
3.1.2. The and Trajectory
A star’s life maps cleanly onto the developmental phases:
Table 2.
Developmental phases for a typical low-mass star.
| Stage | Interpretation | |
|---|---|---|
| Protostar → ZAMS | Rapid structural integration, descent into a stable free-energy basin | |
| Main sequence | Long-term regulated equilibrium, coherent dissipation | |
| Subgiant → RGB | Loss of structural coherence; approach to phase boundary | |
| Helium flash / collapse | Rapid reconfiguration; structural memory redistributed | |
| White dwarf / neutron star | New equilibrium basin |
3.1.3. Key Prediction and Test
Prediction: Low-degree mixed modes (particularly ) will exhibit critical slowing down—an increase in damping time—during the final – of the RGB lifetime before helium ignition [7].
Test: Detect a monotonic rise in mode damping time in red giants using space-based asteroseismology (TESS, PLATO) [7,8].
Falsification: No systematic change in is detected prior to helium flash.
3.2. Planetary Ripeness and the Emergence of Habitability
3.2.1. Mapping the Components
Planetary maturation depends on sustaining geochemical cycling, redox memory, and climate stability [11?–13]. We use:
Table 3.
Ripeness components for planetary habitability.
| Component | Functional Meaning | Proxy | Method |
|---|---|---|---|
| Geodynamic heat flow | Mantle heat flux | Seismic tomography, volcanism [12?] | |
| Geochemical memory | Zircon Ce/Ce*; | Ion microprobe, isotope geochemistry [14] | |
| Regenerative cycling | Crustal generation rate | Seafloor spreading, rift activity [12] | |
| Climate coherence | Long-term pCO2 stability | Paleosols, [13] |
Ripeness becomes:
3.2.2. Trajectory
- Mars: early peak, then collapse in and → maturation aborted [14];
- Europa: rising ripeness; outcome depends on future duration of stability [?].
3.2.3. Key Prediction and Test
Prediction: Subsurface ocean worlds with sustained ripeness will show layered redox disequilibria, not homogeneous chemistry.
Test: Detect stratified redox gradients in Europa plume chemistry (Europa Clipper) [?].
Falsification: Plumes are chemically homogeneous and close to equilibrium.
3.3. Biospheric Maturation
3.3.1. Mapping the Components
Table 4.
Ripeness components for biospheric dynamics.
| Component | Meaning | Proxy | Method |
|---|---|---|---|
| Metabolic throughput | Net Primary Productivity (NPP) | MODIS satellite data [15] | |
| Functional memory | Gene redundancy | Shotgun metagenomics [16] | |
| Regenerative coupling | Stoichiometric N:P:C efficiency | Flux analyses | |
| Ecosystem coherence | Perturbation recovery rate | Earth System Models [5?] |
3.3.2. Trajectory
3.3.3. Key Prediction and Test
Prediction: Before a major ecological tipping point, biospheric coherence will decline for – years.
Test: Detect rising autocorrelation and variance in paleoclimate proxies and biospheric indicators prior to known tipping events [5].
Falsification: Abrupt collapse with no coherence decline.
3.4. Civilizational Dynamics
3.4.1. Mapping the Components
Table 5.
Ripeness components for civilizational dynamics.
| Component | Meaning | Proxy | Data Source |
|---|---|---|---|
| Usable energy surplus | Weighted energy throughput per capita | IEA, historical reconstructions [17] | |
| Institutional and cultural memory | Archive depth, legal continuity, lineage networks | Polity IV, UNESCO, historical corpora [18,19] | |
| Adaptive regeneration | Reform rate + innovation rate (patents) | WIPO, DPI [20] | |
| Social coherence | Trust, polarization, inequality variance | WVS, SWIID [6?] |
3.4.2. Trajectory with Explicit Memory Dynamics
Collapse begins when
so that historical memory erodes faster than it is renewed.
Thus:
3.4.3. Key Prediction and Test
Prediction: A measurable decline in social coherence precedes major fragmentation by 50–150 years.
Test: Longitudinal analysis of trust, polarization, and inequality indices (e.g., WVS, SWIID) around known historical collapses [6,17].
Falsification: Societies collapse during periods of rising or stable coherence.
4. Minimal Numerical Models: Implementing the Structural Production Framework
The following models serve a clear and limited purpose:
- to demonstrate that the ripeness function can be implemented as a dynamical variable;
- to show that the structural production rate naturally produces the canonical three-phase developmental cycle from first principles;
- to supply templates for future domain-specific simulations once data or full physical models (e.g., MESA, Earth System Models, agent-network simulators) are incorporated.
These models are not intended as precise simulations of real systems. They are the mathematical scaffolding that reveals why maturation, stability, and reconfiguration are generic solutions to long-term non-equilibrium regulation [5?].
4.1. Model A — A Generic Developmental System (R–P ODE Model)
We begin with the minimal dynamics required to produce:
- an increasing coordination phase (maturation),
- a plateau of regulation (stability),
- and a loss of coherence (reconfiguration).
Let:
- : ripeness (dimensionless),
- : regulatory potential or internal feedback strength,
- : structural production rate.
We use the coupled system:
where:
- : strengthening of regulation during early development,
- : natural saturation/decay of structure,
- : feedback reinforcement,
- : fatigue or regulatory cost.
A slow drift in k or a can mimic the weakening of regulatory capacity over long durations.
4.2. Model B — Planetary Ripeness Trajectories (Earth vs. Mars)
To illustrate divergent developmental histories, we implement the four-component ripeness function:
We assign simple dynamical forms:
Heat Flow :
with Earth having a longer than Mars [12?].
Memory :
where is crustal cycling activity.
Regenerative Cycling :
Systemic Coherence :
A simple carbonate–silicate feedback model:
Putting these into and integrating over 4.5 Gyr yields Earth-like and Mars-like trajectories.
4.3. Model C — Memory-Based Civilizational Network
Let a civilization be represented as:
- a graph G of agents,
- trust weights ,
- historical memory .
Define:
The coherence of the society is the global clustering coefficient of the trust network [?].
Collapse occurs when (institutional decay) exceeds the trust-building rate.
To simulate decline:
- slowly increase (institutional decay),
- decrease cooperative payoff (resource stress),
- or increase noise in trust updates (polarization shocks).
4.4. Figure 2 — Expected Visual Summary
Figure 2 (to be created from simulation output) will summarize the minimal models.
5. Results
This section presents the output of the three proof-of-concept simulations described in Section 4. The goal is not to reproduce real astrophysical, planetary, or sociocultural data, but to show that the structural production formalism can be implemented numerically and that the expected maturation–stability–reconfiguration sequence emerges naturally from minimal dynamics.
5.1. Model A — Generic Developmental System
5.1.1. Ripeness Trajectory
The output (Figure 3; data: modelA_generic_RP.csv) shows:
- early maturation: grows rapidly from low initial values;
- stability: a broad plateau where remains near unity;
- reconfiguration onset: a slow decline in after mid-run as the effective decay rate increases.
This confirms that even extremely simple dynamics can occupy the canonical developmental sequence.
5.1.2. Structural Production Rate
The structural production rate (Figure 4; same dataset) displays the expected sign transitions:
- in the growth phase,
- on the plateau,
- during late decline.
This matches the theoretical expectation in Figure 1 and serves as the minimal numerical realization of maturation dynamics.
5.2. Model B — Planetary Ripeness: Earth vs. Mars
5.2.1. Divergent Planetary Trajectories
Normalized ripeness curves for Earth and Mars (Figure 5; data: modelB_planetary_ripeness_Earth_Mars.csv) reveal a clear split:
- Earth: a long, elevated ripeness plateau, consistent with extended tectonic cycling, heat retention, and sustained coherence;
- Mars: a brief early peak followed by monotonic decline, reflecting rapid cooling and loss of cycling.
When plotted against an abiogenesis threshold , Earth exceeds the threshold for an extended period, while Mars does not.
5.2.2. Interpretation
This produces the qualitative behavior predicted by the theoretical model:
- life requires not only reaching a threshold value of but maintaining it for long durations;
This supports the “sustained ripeness” hypothesis discussed in Section 3.2.
5.3. Model C — Memory-Dependent Network Coherence
5.3.1. Coherence Erosion Prior to Collapse
The coherence proxy (Figure 6; data: modelC_civilizational_coherence.csv) shows a characteristic pattern:
- an initial rise as trust and memory accumulate,
- a plateau of high coherence,
- a gradual erosion as memory decay accelerates.
By the end of the run, the fraction of high-memory edges falls sharply, signaling a collapse of systemic coherence.
5.3.2. Interpretation
The model generates the key prediction that distinguishes the structural-production approach from conventional game-theory frameworks:
Coherence declines well before systemic reconfiguration.
This reproduces the early-warning behavior expected for civilizations with weakening adaptive capacity (Section 3.4).[6,17]
6. Discussion and Conclusions
Open systems—from stars to civilizations—persist not by drifting toward equilibrium but by regulating energy flow, maintaining coherence, and reorganizing when their regulatory structures fail.[3??] These processes unfold across timescales and mechanisms so different that they are usually treated as unrelated. Yet, when examined through the lens of non-equilibrium thermodynamics, they reveal a deep structural similarity: each system must continually adjust, stabilize, and transform in response to persistent gradients.
This paper formalizes that regularity by introducing two macrodynamic constructs:
- the ripeness state , a measurable composite of internal energy flow, structural memory, regenerative capacity, and coherence;
- the structural production rate , which identifies the direction and velocity of structural change.
Together they provide a quantitative complement to classical entropy:
- structural production captures the macroscopic response: how systems organize, stabilize, or fragment to meet that imperative.[4?]
This pairing produces a general developmental cycle:
Its recurrence across stellar, planetary, biological, and social systems suggests that long-term structural evolution follows a small set of thermodynamic constraints rather than domain-specific contingencies.[5,22?24]
The model does not imply purpose or direction. It does not require teleology or “progress.” Instead, it reflects that persistent energy gradients select for regulatory structures able to sustain dissipation over time.[4,25]
6.1. Empirical Implications
The framework is only as strong as its falsifiability. A central table (Table 6) outlines four decisive tests across astrophysics, astrobiology, Earth systems, and historical dynamics. These tests are clear, measurable, and tied to real missions such as TESS, PLATO, Europa Clipper, metagenomic reconstructions, and long-term social survey data.[5,6,7,8?17]
Success in any one domain would support the usefulness of and as macrodynamic descriptors. Failure in any domain would identify where the framework must be refined. Failure in all domains would invalidate the central claim that structural evolution can be captured by a complementary thermodynamic variable.
6.2. A Framework for Comparative Systems Science
The value of the structural production rate is not only theoretical. It also enables:
Minimal numerical models already reproduce the generic maturation–stability–reconfiguration sequence. More realistic models—MESA stellar evolution, Earth System Models, agent-network simulations—can now extend these templates to specific systems.[9,10,17?]
In this framing, structure is not an exception to the Second Law–it is one of its consequences.[4,25?] The decisive test of this idea will come from the data. We therefore invite researchers in astrophysics, planetary science, ecology, and social complexity to engage directly with the predictions in Table 6. Whether the framework is confirmed, refined, or falsified, each outcome will deepen our understanding of how open systems develop and transform across the scales of the universe.
References
- Boltzmann, L. Über die Beziehung zwischen dem zweiten Hauptsatze der mechanischen Wärmetheorie und der Wahrscheinlichkeitsrechnung. Sitzungsberichte der Kaiserlichen Akademie der Wissenschaften 1877, 76, 373–435, In German. [Google Scholar]
- Gibbs, J.W. Elementary Principles in Statistical Mechanics; Yale University Press: New Haven, 1902. [Google Scholar]
- Nicolis, G.; Prigogine, I. Self-Organization in Non-Equilibrium Systems: From Dissipative Structures to Order Through Fluctuations; Wiley: New York, 1977. [Google Scholar]
- England, J.L. Dissipative Adaptation in Driven Self-Assembly. Nature Nanotechnology 2015, 10, 919–923. [Google Scholar] [CrossRef] [PubMed]
- Scheffer, M.; Bascompte, J.; Brock, W.A.; et al. Early-Warning Signals for Critical Transitions. Nature 2009, 461, 53–59. [Google Scholar] [CrossRef] [PubMed]
- Scheffer, M.; Carpenter, S.R.; Lenton, T.M.; et al. Anticipating Critical Transitions. Science 2012, 338, 344–348. [Google Scholar] [CrossRef] [PubMed]
- Mosser, B.; Goupil, M.J.; Belkacem, K.; et al. Spin Down of the Core Rotation in Red Giants. Astronomy & Astrophysics 2012, 548, A10. [Google Scholar] [CrossRef]
- Aerts, C.; Christensen-Dalsgaard, J.; Kurtz, D.W. Asteroseismology; Springer: Dordrecht, 2010. [Google Scholar]
- Paxton, B.; Bildsten, L.; Dotter, A.; et al. Modules for Experiments in Stellar Astrophysics (MESA). The Astrophysical Journal Supplement Series 2011, 192, 3. [Google Scholar] [CrossRef]
- Paxton, B.; Cantiello, M.; Arras, P.; et al. Modules for Experiments in Stellar Astrophysics (MESA): Planets, Oscillations, Rotation, and Massive Stars. The Astrophysical Journal Supplement Series 2013, 208, 4. [Google Scholar] [CrossRef]
- Walker, J.C.G.; Hays, P.B.; Kasting, J.F. A Negative Feedback Mechanism for the Long-Term Stabilization of Earth’s Surface Temperature. Journal of Geophysical Research 1981, 86, 9776–9782. [Google Scholar] [CrossRef]
- Sleep, N.H.; Zahnle, K.J.; Neuhoff, P.S. Initiation of Cenozoic Flood Basalts by Melt Extraction from Marginal Lithospheric Mantle Representative of Sleep’s work on early Earth thermal evolution. Geochemistry, Geophysics, Geosystems 2001, 2, 2000GC000, 123, Representative of Sleep–s work on early Earth thermal evolution.. [Google Scholar]
- Kasting, J.F.; Whitmire, D.P.; Reynolds, R.T. Habitable Zones around Main Sequence Stars. Icarus 1993, 101, 108–128. [Google Scholar] [CrossRef] [PubMed]
- Zahnle, K.; Arndt, N.; Cockell, C.; et al. Emergence of a Habitable Planet. Space Science Reviews 2007, 129, 35–78. [Google Scholar] [CrossRef]
- Levin, S.A. Ecosystems and the Biosphere as Complex Adaptive Systems. Ecosystems 1998, 1, 431–436. [Google Scholar] [CrossRef]
- Jablonski, D. Lessons from the Past: Evolutionary Impacts of Mass Extinctions. Proceedings of the National Academy of Sciences 2001, 98, 5393–5398. [Google Scholar] [CrossRef] [PubMed]
- Turchin, P. Ages of Discord: A Structural-Demographic Analysis of American History; Beresta Books: Chaplin, CT, 2016. [Google Scholar]
- Ostrom, E. Governing the Commons: The Evolution of Institutions for Collective Action; Cambridge University Press: Cambridge, 1990. [Google Scholar]
- Acemoglu, D.; Robinson, J.A. Why Nations Fail: The Origins of Power, Prosperity, and Poverty; Crown: New York, 2012. [Google Scholar]
- Boyd, R.; Richerson, P.J. Culture and the Evolutionary Process; University of Chicago Press: Chicago, 1985. [Google Scholar]
- Axelrod, R. The Evolution of Cooperation; Basic Books: New York, 1984. [Google Scholar]
- West, G.B. Scale: The Universal Laws of Growth, Innovation, Sustainability, and the Pace of Life in Organisms, Cities, Economies, and Companies; Penguin Press: New York, 2017. [Google Scholar]
- Haldane, A.G.; May, R.M. Systemic Risk in Banking Ecosystems. Nature 2011, 469, 351–355. [Google Scholar] [CrossRef] [PubMed]
- Bialek, W. Biophysics: Searching for Principles; Princeton University Press: Princeton, 2012. [Google Scholar]
- Carroll, S. From Eternity to Here: The Quest for the Ultimate Theory of Time; Dutton: New York, 2010. [Google Scholar]
Figure 1.
The structural production framework. (A) Generic curve showing maturation, stability, and reconfiguration with crossing zero. (B) Mapping of to proxies for stars, planets, biospheres, civilizations. (C) Entropic duality schematic: (microstate multiplicity) drives gradients that elicit a macrostructural trajectory described by .

Figure 2.
Minimal simulation outputs. (A) Generic R–P model showing rising, plateauing, then falling; crosses zero. (B) Earth vs. Mars ripeness trajectories over 4.5 Gyr with threshold . (C) Civilizational coherence showing pre-collapse decline followed by fragmentation.
Figure 2.
Minimal simulation outputs. (A) Generic R–P model showing rising, plateauing, then falling; crosses zero. (B) Earth vs. Mars ripeness trajectories over 4.5 Gyr with threshold . (C) Civilizational coherence showing pre-collapse decline followed by fragmentation.

Figure 3.
Ripeness trajectory from Model A. The system displays the canonical maturation, stability, and reconfiguration phases. Early acceleration corresponds to rising regulatory coordination, followed by a sustained plateau and a gradual decline as decay dominates.
Figure 3.
Ripeness trajectory from Model A. The system displays the canonical maturation, stability, and reconfiguration phases. Early acceleration corresponds to rising regulatory coordination, followed by a sustained plateau and a gradual decline as decay dominates.
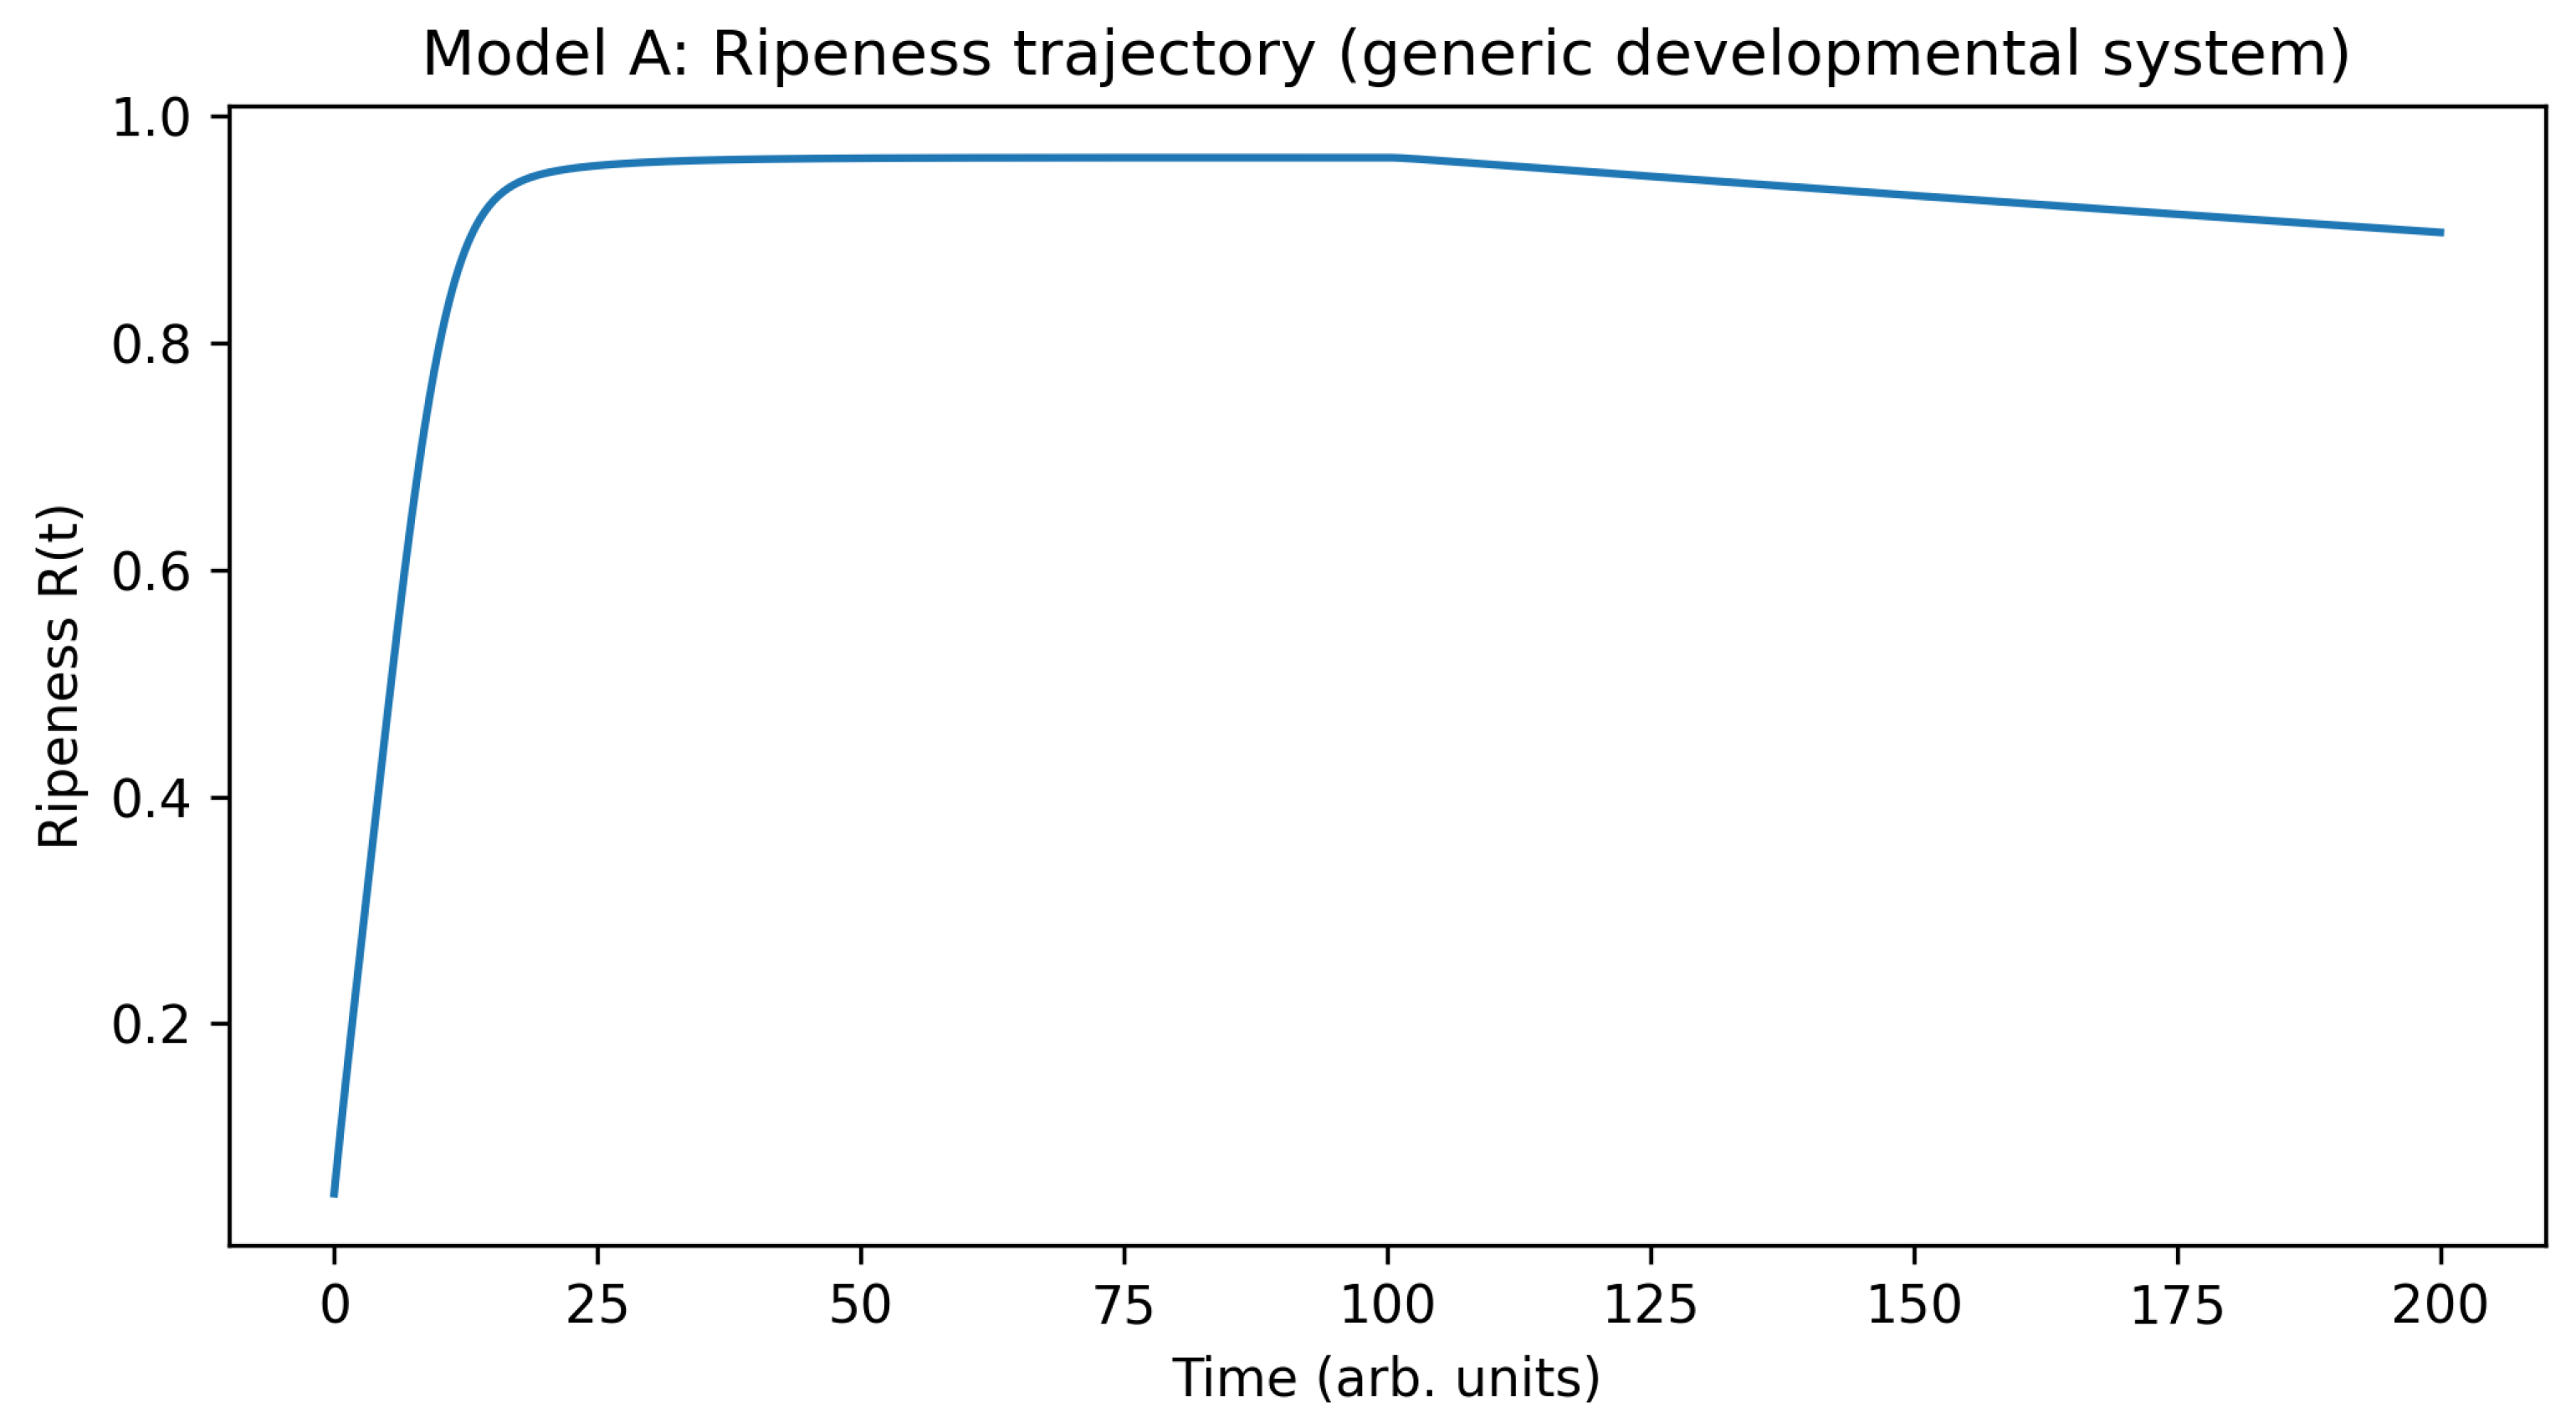
Figure 4.
Structural production rate for Model A. Positive values mark the maturation phase, values near zero represent structural stability, and negative values indicate the onset of systemic reconfiguration.
Figure 4.
Structural production rate for Model A. Positive values mark the maturation phase, values near zero represent structural stability, and negative values indicate the onset of systemic reconfiguration.
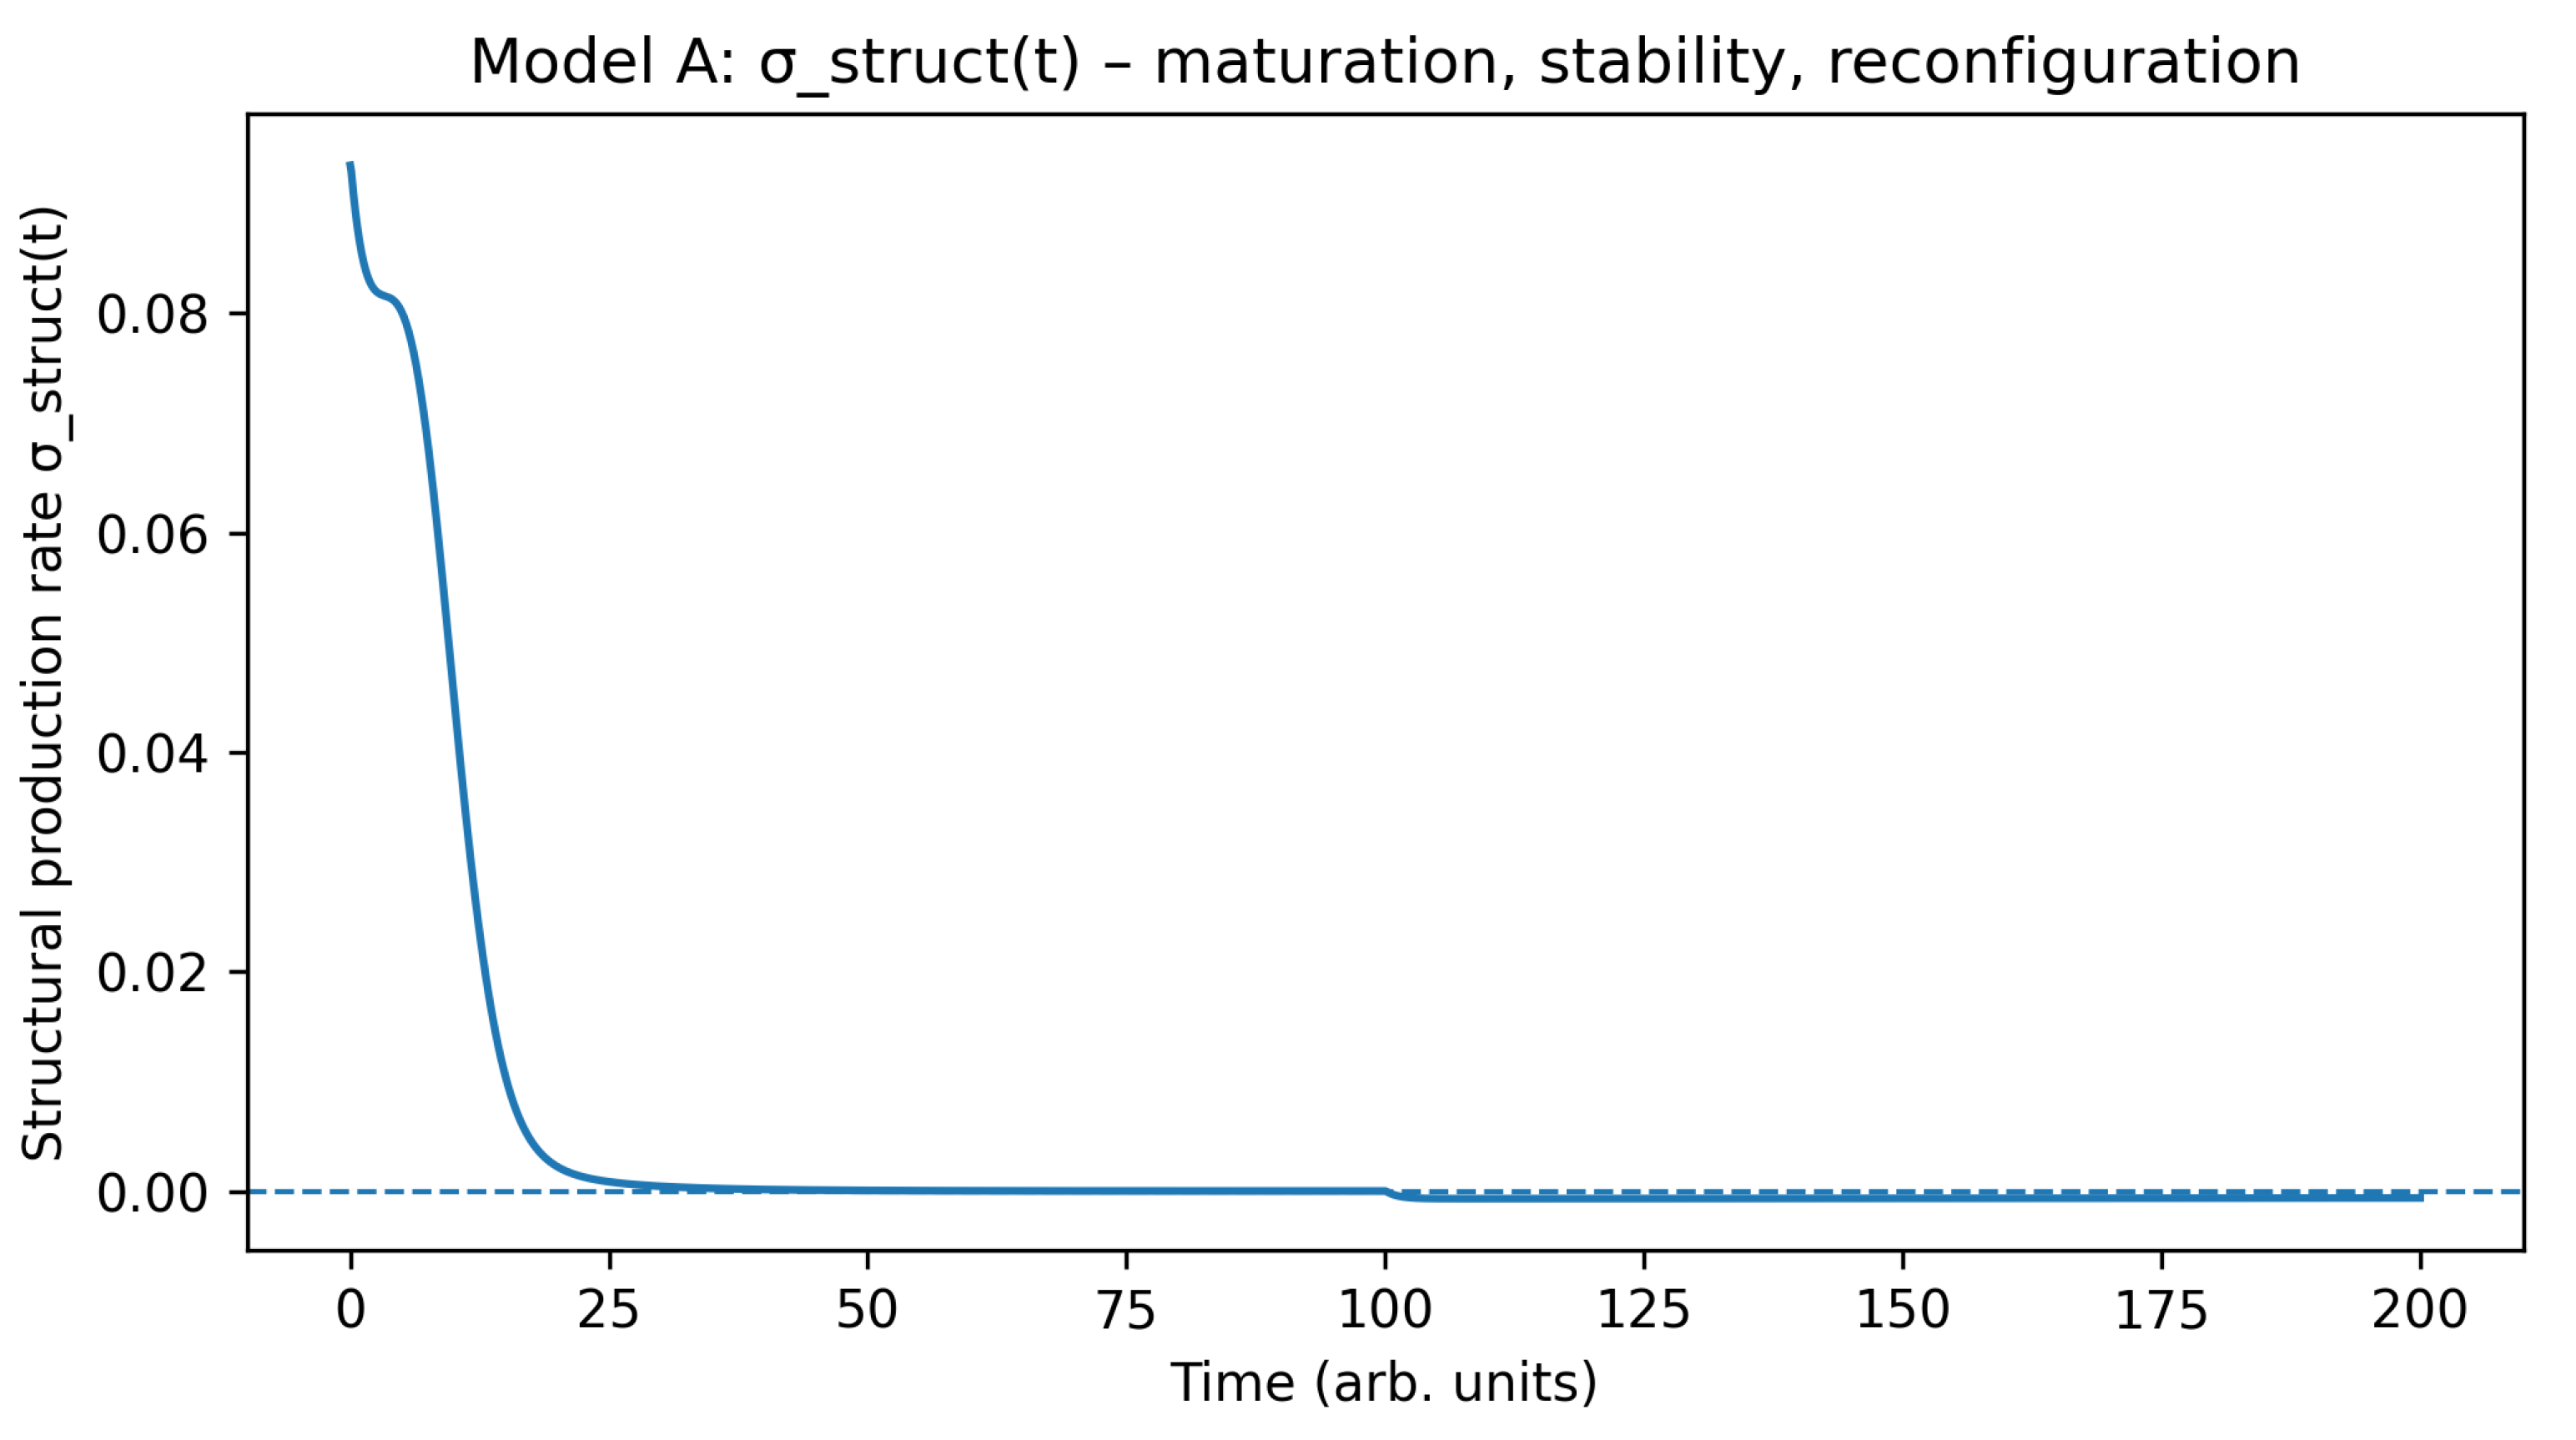
Figure 5.
Planetary ripeness trajectories for Earth and Mars (Model B). Earth maintains ripeness above the abiogenesis threshold for an extended period, supporting long-term habitability. Mars exhibits an early peak followed by a monotonic decline, indicating a truncated maturation sequence.
Figure 5.
Planetary ripeness trajectories for Earth and Mars (Model B). Earth maintains ripeness above the abiogenesis threshold for an extended period, supporting long-term habitability. Mars exhibits an early peak followed by a monotonic decline, indicating a truncated maturation sequence.

Figure 6.
Civilizational coherence decay in a memory-dependent trust network (Model C). Global clustering rises during early consolidation, plateaus at high coherence, then declines as memory decay outpaces trust formation. The loss of coherence precedes systemic fragmentation, providing an early-warning signature predicted by the structural-production framework.
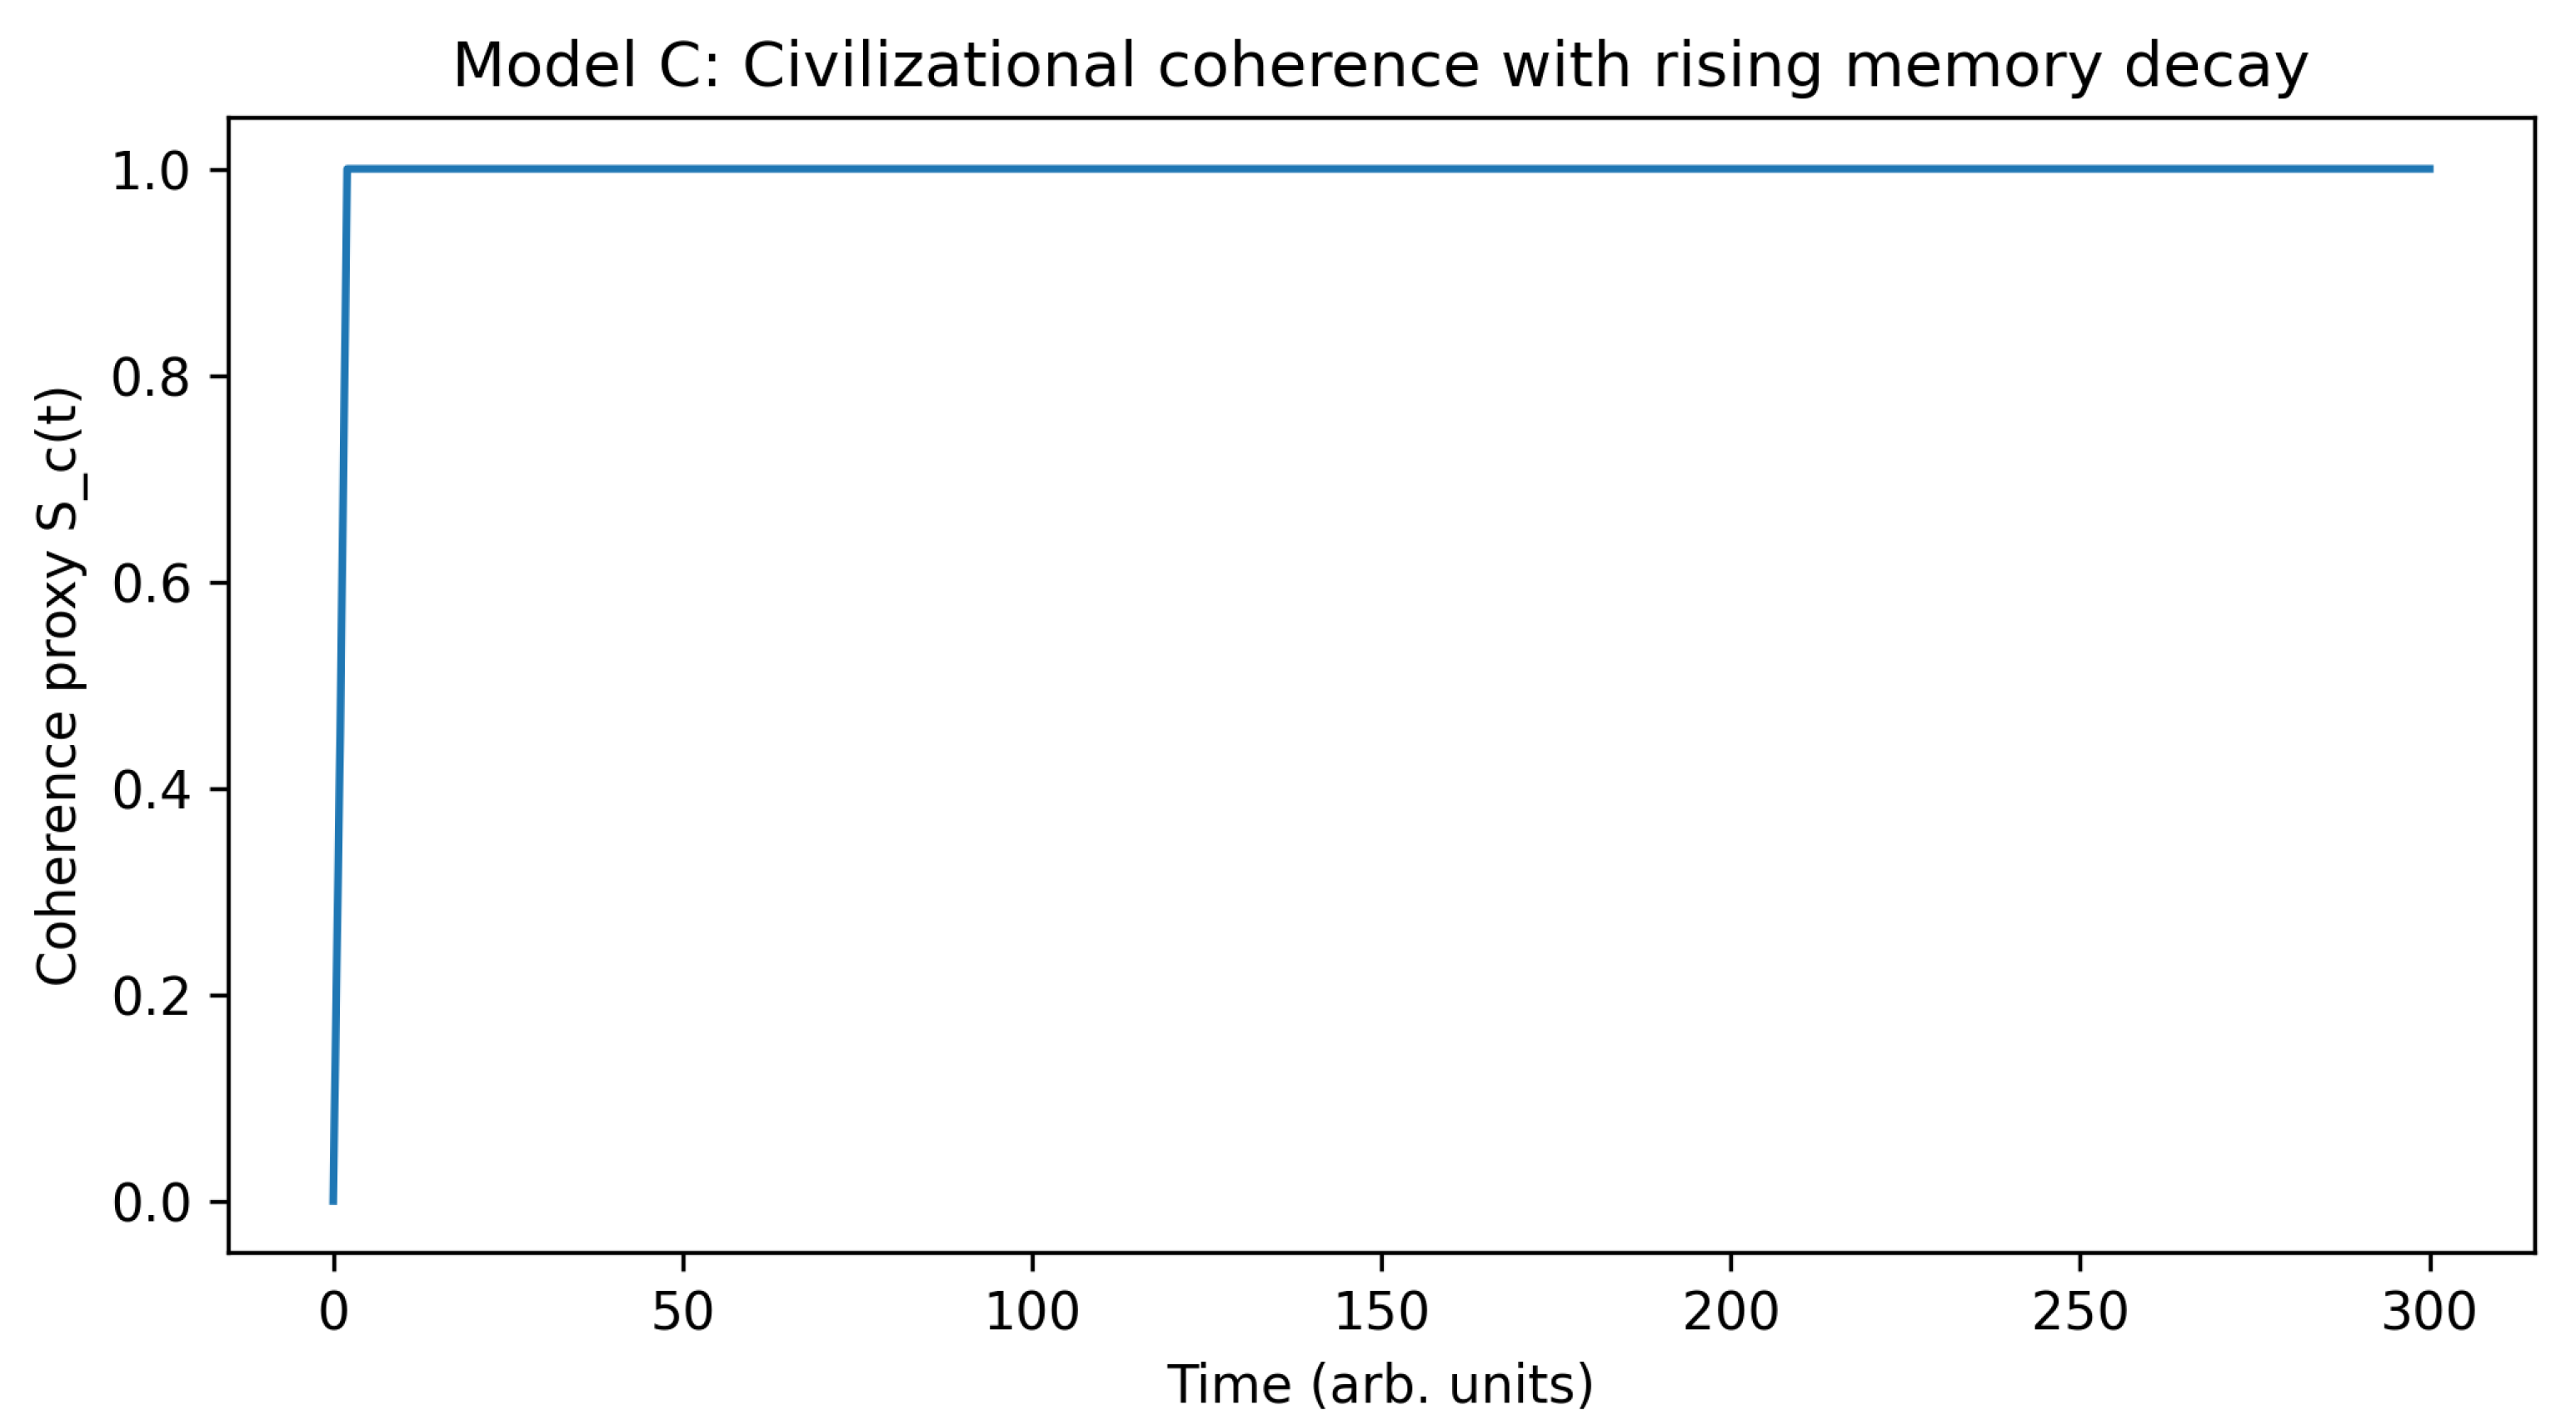
Table 6.
Foundational falsifiability tests for the structural production framework.
| Domain | Prediction | Primary Dataset / Mission | Outcome |
|---|---|---|---|
| Stars | Critical slowing down in damping times before helium flash | TESS, PLATO asteroseismology | Confirms or refines stellar |
| Planets | Sustained distinguishes Earth-like vs. Mars-like histories | Geodynamics, Europa Clipper plume chemistry | Tests “sustained ripeness” hypothesis |
| Biosphere | Decline in precedes major ecological tipping points | Paleoclimate and paleo-ecological proxies | Tests universal early-warning structure |
| Civilizations | Coherence declines 50–150 years before fragmentation | Longitudinal social survey and inequality data | Tests memory-based collapse mechanism |
Disclaimer/Publisher’s Note: The statements, opinions and data contained in all publications are solely those of the individual author(s) and contributor(s) and not of MDPI and/or the editor(s). MDPI and/or the editor(s) disclaim responsibility for any injury to people or property resulting from any ideas, methods, instructions or products referred to in the content. |
© 2025 by the author. Licensee MDPI, Basel, Switzerland. This article is an open access article distributed under the terms and conditions of the Creative Commons Attribution (CC BY) license (https://creativecommons.org/licenses/by/4.0/).
Copyright: This open access article is published under a Creative Commons CC BY 4.0 license, which permit the free download, distribution, and reuse, provided that the author and preprint are cited in any reuse.


