Submitted:
05 December 2025
Posted:
08 December 2025
You are already at the latest version
Abstract
Mitochondrial dysfunction and impaired mitophagy are hallmark features of Parkinson’s disease (PD), especially in patients with mutations in the PINK1 gene. Peroxiredoxin 6 (Prx6) is a bifunctional antioxidant enzyme known for its protective roles under oxidative stress, but its effects on mitochondrial dynamics and mitophagy remain poorly understood. In this study, we investigated the impact of recombinant Prx6 on mitochondrial function, reactive oxygen species (ROS) production, and mitophagy in both wild-type (WT) and PINK1-mutant fibroblasts. We further assessed the expression of genes related to mitochondrial quality control in neuroblastoma SH-SY5Y cells.Prx6 treatment significantly reduced ROS production and preserved mitochondrial membrane potential under oxidative stress in both WT and PINK1-mutant fibroblasts. It enhanced basal mitophagy but dampened excessive mitophagic activation induced by H₂O₂. In SH-SY5Y cells, Prx6 upregulated multiple genes associated with mitochondrial fission/fusion (drp1, mfn2), mitophagy (parkin, pink1, optn), and cell survival (bcl2, nrf2).Our findings suggest that Prx6 promotes mitochondrial homeostasis and cellular resilience in PINK1-deficient conditions by modulating oxidative stress responses and mitophagy-related pathways. These results highlight the potential of Prx6 as a therapeutic candidate for PD and other neurodegenerative disorders involving mitochondrial dysfunction.
Keywords:
peroxiredoxin 6 (Prx6)
; PINK1
; oxidative stress
; mitophagy
; fibroblasts
Introduction
Mitochondrial dynamics – the processes of mitochondrial fusion, fission, trafficking, and mitophagy – play a crucial role in maintaining cellular homeostasis [1,2]. Disruption of these tightly regulated mechanisms contributes to mitochondrial dysfunction and the pathogenesis of neurodegenerative diseases such as Parkinson’s disease (PD). Although reactive oxygen species (ROS) and oxidative stress have long been implicated in mitochondrial damage, the interplay between redox regulation and mitochondrial dynamics remains incompletely understood.
Peroxiredoxin 6 (Prx6) is a unique bifunctional enzyme belonging to the antioxidant peroxiredoxin family. It is ubiquitously expressed in mammalian tissues and is known for its dual enzymatic activity: glutathione peroxidase and Ca²⁺-independent phospholipase A2 [3,4]. Prx6 is involved in a wide range of cellular processes, including the neutralization of hydrogen peroxide, modulation of inflammatory responses, lipid metabolism, and protection of cellular membranes from oxidative damage. Although peroxiredoxins were discovered relatively recently, accumulating evidence highlights their critical physiological and pathological roles [3,5,6]. In particular, recombinant and modified forms of Prx6 have shown promise as therapeutic agents capable of penetrating eukaryotic cells and mitigating oxidative injury [7].
Nevertheless, despite its potential therapeutic relevance, the mechanisms underlying the protective effects of Prx6 remain largely unexplored. Specifically, data on its impact on mitochondrial network dynamics, mitophagy, and functional mitochondrial integrity are still limited [6,8]. Addressing this gap is essential to uncovering novel redox-based strategies for modulating mitochondrial quality control.
Previously, we demonstrated that fibroblasts derived from patients carrying mutations in the PINK1 gene – a key regulator of mitophagy – exhibit increased ROS production and impaired mitochondrial network morphology [9]. These pathological features make the PINK1-mutant fibroblasts a suitable model for studying oxidative damage and mitochondrial resilience.
In this study, we investigate the effects of recombinant Prx6 on mitophagy activation, ROS generation rate, mitochondrial membrane potential (ΔΨm) and cell survival in wild-type (WT) and PINK1-deficient fibroblasts exposed to hydrogen peroxide-induced oxidative stress. Furthermore, we explore whether preincubation with Prx6 modulates the expression of genes involved in mitochondrial dynamics and mitophagy in SH-SY5Y neuroblastoma cell model. Our results provide novel insights into the protective mechanisms of Prx6 and its role in maintaining mitochondrial integrity under oxidative conditions.
Materials and Methods
Cell Culture
Primary human skin fibroblast lines were obtained from patients with genetically confirmed PD carrying a homozygous p.Try90Leufs*12 mutation in the PINK1 gene, as well as from age-matched healthy donors (WT group). Fibroblast lines were kindly provided by Prof. A. Y. Abramov (UCL Institute of Neurology, University College London, UK).
Cells were cultured in high-glucose Dulbecco’s Modified Eagle Medium (DMEM; Gibco) supplemented with 10% fetal bovine serum (FBS, Gibco), 2 mM L-glutamine, and 1 mM sodium pyruvate, at 37 °C in a humidified atmosphere with 5% CO₂. Cells were seeded on 25 mm glass coverslips for imaging experiments and passaged at 80–85% confluence. Only cells within 18 passages were used to ensure consistency.
In addition, SH-SY5Y human neuroblastoma cells were used for gene expression analyses. Cells were cultured in DMEM medium supplemented with 10% FBS, 2 mM L-glutamine, and maintained under identical conditions.
Treatments
Recombinant human peroxiredoxin 6 (Prx6) was obtained via bacterial expression and subsequent purification as described in our previous papers [10,11].
Cells were treated with Prx6 at a final concentration of 150 µg/mL, using two incubation protocols: a short-term exposure (2 h) and a long-term exposure (24 h) prior to oxidative stress induction.
Hydrogen peroxide (H₂O₂) was used to induce oxidative stress following Prx6 preincubation. For most assays, including ROS production, Δψm, and mitophagy analysis, cells were exposed to 150 µM H₂O₂ for 1 h. For the cell viability assay, a higher dose of 300 µM H₂O₂ for 2 h was used to ensure measurable cytotoxic effects within a 2-hour exposure window.
All treatments were performed in phenol red-free DMEM or HBSS, as appropriate, and medium replacement steps were carefully timed to maintain consistency between experimental conditions.
Measurement of Reactive Oxygen Species (ROS)
To assess cytoplasmic ROS production, cells were incubated with the fluorescent probe H₂DCFDA (10 μM, Thermo Fisher) for 40 minutes at room temperature, then washed with HBSS. Fluorescence was detected using an inverted fluorescence microscope equipped with a 20× objective and a FITC filter set (excitation: 494 ± 10 nm; emission: 535 ± 10 nm). All images were acquired under identical conditions using minimal exposure settings to avoid probe photobleaching and phototoxicity.
Time-lapse imaging was performed for 5 minutes with one frame every 15 seconds. For quantification, fluorescence intensities were normalized to the baseline (F₀) at the beginning of acquisition. The ROS production rate was calculated by linear approximation of the fluorescence increase over time, and the slope of this curve was used as an indicator of ROS accumulation rate. Data were further normalized to untreated WT fibroblasts to allow cross-condition comparison.
Measurement of Mitochondrial Membrane Potential (ΔΨm)
Mitochondrial membrane potential (ΔΨm) was assessed using the potentiometric fluorescent dye tetramethylrhodamine methyl ester (TMRM, Thermo Fisher). Cells were incubated with 25 nM TMRM diluted in HBSS for 40 minutes at room temperature. Imaging was performed using a confocal laser scanning microscope equipped with a 63× oil-immersion objective.
During acquisition, TMRM remained present in the extracellular medium to ensure steady-state conditions. To minimize phototoxicity, excitation intensity was kept low, using only 0.1-0.2% of the maximum laser power. TMRM was excited with a 561 nm laser line, and fluorescence emission was collected above 580 nm. All imaging parameters were kept constant across experimental conditions to ensure comparability of signal intensity.
Assessment of Cell Viability
Cell viability was assessed using a double-staining method with Hoechst 33342 (5 μM, Thermo Fisher) and propidium iodide (PI, 20 μM, Thermo Fisher) in HBSS for 45 minutes at room temperature. Hoechst 33342 stains the nuclei of all cells, while PI selectively penetrates only cells with compromised plasma membrane integrity, marking necrotic and early apoptotic cells.
As dead cells tend to detach from the substrate and may not be captured during microscopic imaging, we additionally accounted for cell culture density prior to treatment. This allowed normalization of viability data to initial seeding conditions, providing a more accurate estimate of treatment-induced cell loss.
Fluorescence imaging was performed using an inverted fluorescence microscope with appropriate filter sets (Hoechst: excitation 350 nm / emission 461 nm; PI: excitation 535 nm / emission 617 nm). Cell counts were performed manually or with automated software to determine the proportion of PI-positive cells and relative culture density.
Assessment of Mitophagy via Mitochondrial-Lysosomal Colocalization
Mitophagy was assessed by evaluating the degree of colocalization between mitochondria and lysosomes using confocal fluorescence microscopy. Cells were stained with MitoTracker Green (0.3 μM, Thermo Fisher) and LysoTracker Red (0.1 μM, Thermo Fisher) in serum-free medium for 40 minutes at 37 °C in a CO₂ incubator. Mitochondrial labeling with MitoTracker Green was performed prior to treatment with mitophagy-inducing agents, whereas LysoTracker Red staining was performed immediately after the experimental treatments to optimize visualization of mitochondria-lysosome interaction.
Fluorescence excitation was achieved using an argon laser (488 nm) for MitoTracker and a helium-neon laser (543 nm) for LysoTracker. Emission signals were collected at 525 ± 25 nm for green fluorescence and 665 ± 35 nm for red fluorescence. Images were acquired using identical acquisition settings across all groups to ensure comparability.
RNA Extraction and Quantitative Real-Time PCR
Total RNA was extracted from SH-SY5Y neuroblastoma cells using a commercial RNA isolation kit (Evrogen, Russia) according to the manufacturer’s instructions. RNA concentration and purity were assessed spectrophotometrically at 260/280 nm using a Nanodrop spectrophotometer (Thermo Fisher).
Complementary DNA (cDNA) was synthesized from 1-2 µg of total RNA using MMLV reverse transcriptase (Moloney Murine Leukemia Virus Reverse Transcriptase, Evrogen). The 20 µL reaction mix contained 20 µM oligo(dT) primers, 10 mM dNTPs, 20 mM DTT, and 100 U of reverse transcriptase. Reverse transcription was performed at 40 °C for 45 minutes, followed by enzyme inactivation at 70 °C for 10 minutes.
Quantitative real-time PCR (qPCR) was performed using the resulting cDNA as a template. Each reaction included 3 µL of cDNA, 10 µM gene-specific forward and reverse primers (listed in Table), and SYBR Green-based qPCR master mix with hot-start DNA polymerase (5X qPCRmix-HS SYBR, Evrogen). Amplification was carried out in a DTlite real-time PCR system (DNA-Technology LLC, Russia) using the following protocol: initial denaturation at 95 °C for 5 minutes, followed by 40 cycles of 95 °C for 30 s, primer-specific annealing temperature for 20 s, and extension at 72 °C for 30 s.
Negative control reactions lacking reverse transcriptase were included to monitor for potential genomic DNA contamination; no amplification signal was detected in these controls.
Relative gene expression was normalized to two housekeeping genes, GAPDH, and calculated using the 2^–ΔΔCt method as appropriate [14].
| gene | forward primer | reverse primer | product size |
| GAPDH | 5’-aggtgaaggtcggagtca | 5’-cgttctcagccttgacggt | 186bp |
| BAX | 5’-aggatcgagcagggcgaatg | 5’-ccaatgtccagcccatga | 330bp |
| BCL2 | 5’-tgtgtggagagcgtcaacc | 5’-tcaaacagaggccgcatg | 161bp |
| CASP3 | 5’-gcgaatcaatggactctgga | 5’-tgctccttttgctgtgatct | 267bp |
| NRF2 | 5’-gcgacggaaagagtatgagc | 5’-acgtagccgaagaaacctca | 296bp |
| DPR1 | 5’-agaaaatggggtggaagcaga | 5’-aggcaccttggtcattcctg | 220bp |
| FIS1 | 5’-tgtccaagagcacgcagt | 5’-gccttgtcaatgagccgct | 262bp |
| MFN1 | 5’-tgaagcactttgtgctggct | 5’-ccgagatagcacctcacca | 197bp |
| MFN2 | 5’-cgttgtaccagcttcctgg | 5’-gctcaaacttggtcttcactgc | 241bp |
| OPA1 | 5’-ggaaatgattgcccaagctc | 5’-atggtctcagggctaacggt | 231bp |
| PINK1 | 5’-tcaatcccttctacggccagg | 5’-atttgcggctactcgggca | 167bp |
| PRKN | 5’-ttccaaaccggatgagtggtg | 5’-cgatcattgagtcttgtcacacag | 262bp |
| BNIP3 | 5’-taaacacccgaagcgcac | 5’-agctatgttgcaagctcaga | 244bp |
| NIX | 5’-aatgtcgtcccacctagtcg | 5’-gaggatggtacgtgttccagc | 189bp |
| FUNDC1 | 5’-cccaagactatgaaagtgatgacg | 5’-gaaagccaccacctactgca | 228bp |
| P62 | 5’-tgtggtaggaacccgctac | 5’-agtttcctggtggaccca | 215bp |
| OPTN | 5’-agacctgttgggcatcgtgt | 5’-ccagtggagactgttctcgtgg | 159bp |
Statistical Analysis
All data are presented as mean ± standard deviation (SD) or as boxplots indicating the median and interquartile range, unless otherwise specified. Statistical analysis was performed using Origin and R (v4.3.1). For comparisons between two groups, unpaired two-tailed Student’s t-test was used for normally distributed data, and the Mann-Whitney U test was used for non-parametric data. For multiple group comparisons, one-way ANOVA followed by Tukey’s post hoc test was employed for parametric data, or Kruskal-Wallis test followed by Dunn’s post hoc test for non-parametric data. Normality was assessed using the Shapiro-Wilk test. A p-value < 0.05 was considered statistically significant. All experiments were performed with at least three independent biological replicates. The number of cells or samples used for quantification is indicated in the corresponding figure legends.
1. Results
1.1. Prx6 Improves Survival of PINK1-Mutant Fibroblasts Under Oxidative Stress and Modulates Apoptosis-Related Gene Expression in Neuroblastoma Cells
To investigate whether preincubation with Prx6 affects cell survival under oxidative stress conditions, we performed double-staining viability assays with Hoechst 33342 and PI, allowing visualization of nuclei (blue) and membrane-compromised, dying cells (red) in WT and PINK1-deficient fibroblasts (Figure 1A). The number of viable cells was quantified as a percentage relative to the initial seeding density.
Fibroblasts were treated with 300 µM H₂O₂ for 2 hours, either alone or following preincubation with 150 µg/mL Prx6 for 2 or 24 hours. As expected, exposure to H₂O₂ for 2 hours significantly reduced cell viability in both cell types (Figure 1B), with a more pronounced effect observed in PINK1-mutant fibroblasts (26.9 ± 7.8%) compared to WT fibroblasts (74.4 ± 8.6%). A 2-h preincubation with 150 μg/mL Prx6 did not significantly affect survival rates under oxidative stress in either WT (91.2 ± 14.3%) or PINK1 (41 ± 6%) fibroblasts (Figure 1B).
In contrast, 24-h preincubation with Prx6 markedly increased the survival of PINK1-mutant cells under oxidative stress, with viability rising to 78.4 ± 14.2% (p< 0.001), which was comparable to the WT group (Figure 1B). WT fibroblasts also showed a modest increase in survival to 90.5 ± 18.2% after 24-h Prx6 treatment (Figure 1B). These results suggest that short-term Prx6 exposure is insufficient to confer protective effects, whereas prolonged preincubation significantly improves cell resistance to oxidative damage. Based on these findings, we used the 24-h preincubation protocol in subsequent experiments.
To assess whether Prx6 modulates the expression of genes involved in apoptosis and oxidative stress response, we analyzed mRNA levels of bax, bcl2, casp3, and nrf2 in SH-SY5Y neuroblastoma cells using rt-PCR (Figure 1C).
Treatment with Prx6 for 24 h significantly upregulated bcl2 expression by 10.2-fold and nrf2 by 10.6-fold compared to untreated controls. Interestingly, exposure to 150 μM H₂O₂ alone also increased nrf2 expression (6.2-fold), while having a weaker effect on bcl2 (2.6-fold). Co-treatment with Prx6 and H₂O₂ resulted in a moderate nrf2 increase (3.5-fold), but bcl2 remained relatively low (2.9-fold). Expression of bax and casp3 showed smaller or no significant changes under the tested conditions.
These data demonstrate that Prx6 preconditioning enhances the antioxidant and anti-apoptotic gene response in neuroblastoma cells and supports its protective role under oxidative stress in PINK1-deficient fibroblasts.
1.2. Prx6 Modulates ROS Production Rate in Wild-Type and PINK1-Mutant Fibroblasts
Given that Prx6 is a known antioxidant enzyme, we aimed to assess its direct impact on the rate of reactive oxygen species (ROS) production in fibroblasts. To this end, we employed a quantitative imaging approach using H₂DCF-DA fluorescence to monitor ROS accumulation in real time (Figure 2A). We examined both WT and PINK1-mutant fibroblasts. Cells were preincubated with recombinant Prx6 at a concentration of 150 µg/mL for 24 h, followed by exposure to oxidative stress induced by H₂O₂ (150 µM, 1 h). Fluorescence imaging revealed a time-dependent increase in H₂DCF-DA signal, reflecting intracellular ROS accumulation.
Quantitative analysis of fluorescence intensity over time demonstrated distinct ROS kinetics between WT and PINK1 cells (Figure 2B). The slope of fluorescence increase in PINK1 fibroblasts was significantly higher (6.1 ± 0.06 × 10⁻⁴) compared to WT cells (2.0 ± 0.07 × 10⁻⁴), indicating a more rapid ROS accumulation in the mutant background.
To allow direct comparison, we calculated the rate of ROS production as a percentage relative to the baseline value of control WT cells (set at 100%). As shown in Figure 2C, untreated PINK1 fibroblasts exhibited significantly (p < 0.001) elevated basal ROS levels, reaching 321 ± 184%, whereas WT cells remained at baseline (100 ± 34%). Preincubation with Prx6 for 24 h significantly reduced the elevated basal ROS production in PINK1 fibroblasts to 131 ± 48% (p < 0.001). In WT cells, Prx6 treatment had no marked effect on baseline ROS levels.
Upon exposure to oxidative stress (H₂O₂ 150 µM, 1 h), the rate of ROS production markedly increased in both cell types (p < 0.001). In WT fibroblasts, ROS production rose by 5.2-fold to 510 ± 148%, and in PINK1 cells by 2.3-fold to 737 ± 140%, compared to their respective untreated controls. Importantly, pre-treatment with Prx6 effectively suppressed this excessive ROS production in both WT and PINK1 backgrounds. In WT cells, Prx6 reduced ROS production under stress to 146 ± 16% (p < 0.001), and in PINK1 fibroblasts to 344 ± 61% (p < 0.001), demonstrating a robust protective effect (Figure 2C).
These results indicate that Prx6 preincubation significantly attenuates both basal and stress-induced ROS production in PINK1-deficient fibroblasts, and also protects WT fibroblasts from excessive ROS accumulation under oxidative challenge.
1.3. Prx6 Preserves Mitochondrial Membrane Potential in Fibroblasts Under Oxidative Stress and Modulates Mitochondrial Dynamics Gene Expression in Neuroblastoma Cells
Mitochondrial membrane potential (ΔΨm) is a key indicator of mitochondrial health and bioenergetic capacity. PINK1-deficient cells are known to have impaired mitochondrial function, making them more vulnerable to oxidative damage. We therefore assessed whether Prx6 could preserve mitochondrial membrane potential under conditions of oxidative stress (Figure 3).
PINK1-mutant fibroblasts and WT were stained with TMRM and imaged under control conditions or after treatment with 150 µM H₂O₂ for 1 h, with or without preincubation with 150 µg/mL Prx6 for 24 h (Figure 3A). In both WT and PINK1 cells, H₂O₂ induced a pronounced decrease in TMRM fluorescence intensity (to 66.8 ± 12.6% and 50.7 ± 20.7% of initial values, respectively; p < 0.001), indicative of mitochondrial depolarization. As expected, PINK1-mutant cells showed a more profound loss of Δψm compared to WT cells (Figure 3B-C).
Preincubation with Prx6 for 24 h did not significantly affect basal Δψm in either genotype. However, a slight but measurable decrease was observed: to 96.2 ± 11% in WT and to 88.6 ± 27% in PINK1 fibroblasts compared to untreated controls.
Under oxidative stress conditions, however, Prx6 exhibited a protective effect. In WT fibroblasts, Prx6 significantly preserved Δψm at 71.6 ± 9.6% compared to 66.8 ± 12.6% in H₂O₂-only treated cells (p = 0.011). In PINK1 fibroblasts, the protective effect was also evident: Prx6 increased Δψm to 50.8 ± 20.7% from 40.5 ± 19.3% in the H₂O₂ group (p = 0.033) (Figure 3B-C).
To further explore the mechanism underlying this protective effect, we assessed the expression of genes involved in mitochondrial dynamics – namely fusion and fission – in SH-SY5Y neuroblastoma cells following a 24 h treatment with Prx6 (150 µg/mL), with or without H₂O₂ (150 µM, 1 h) (Figure 3D).
Under basal conditions, Prx6 strongly upregulated both fission- and fusion-related genes: drp1 (7.1-fold), mfn1 (8.7-fold), mfn2 (4.7-fold), and opa1 (9.3-fold), while fis1 showed only a mild increase (1.2-fold). H₂O₂ alone also induced drp1 (3.6-fold) and mfn2 (6.3-fold), but had limited effects on other genes.
Interestingly, the combined treatment with Prx6 and H₂O₂ presented a coordinated increase in both fusion and fission markers: drp1 (4.6-fold), mfn1 (4.2-fold), and opa1 (4.2-fold), suggesting that Prx6 not only counters stress-induced loss of Δψm, but also promotes balanced mitochondrial remodeling in response to oxidative injury.
Together, these findings demonstrate that Prx6 protects mitochondrial function under oxidative stress and induces transcriptional changes that may support mitochondrial dynamics and integrity.
1.4. Prx6 Enhances Basal Mitophagy but Limits Stress-Induced Mitophagy in WT and PINK1-Deficient Fibroblasts
Mitophagy is a selective autophagic process responsible for the removal of damaged or dysfunctional mitochondria, serving as a key mechanism of mitochondrial quality control. PINK1 is a central regulator of PINK1/Parkin-dependent mitophagy, and loss-of-function mutations in PINK1 impair this pathway, contributing to mitochondrial dysfunction and degeneration.
To evaluate the role of Prx6 in mitophagy regulation, we used a two-step staining protocol based on MitoTracker Green (MTG) and LysoTracker Red (LTR) to assess the degree of colocalization between mitochondria and lysosomes in WT and PINK1-mutant fibroblasts (Figure 4A). MTG was applied before oxidative stress, followed by 24 h Prx6 treatment and subsequent LTR staining after H₂O₂ exposure to visualize lysosomes.
Representative confocal images (Figure 4B) show an increase in mitochondrial-lysosomal colocalization after Prx6 treatment, and after H₂O₂-induced stress. Quantitative analysis revealed that under basal conditions, Prx6 significantly increased colocalization in both WT fibroblasts (from 10.1 ± 1.6% to 23.7 ± 2.7%; p < 0.001) and PINK1-mutant fibroblasts (from 6.7 ± 2.5% to 16.6 ± 3.1%; p < 0.001), indicating a Prx6-driven enhancement of basal mitophagy (Figure 4C).
When treated with 150 µM H₂O₂ for 1 h, both WT and PINK1 cells showed increased mitophagy compared to control: colocalization increased to 17.1 ± 1.9% (p < 0.01) in WT and to 18.7 ± 1.5% (p < 0.001) in PINK1-mutant fibroblasts (Figure 4D). Surprisingly, Prx6 pre-treatment (24 h) partially reversed this increase, reducing colocalization to 13.5 ± 2.9% in WT (p < 0.01 vs. H₂O₂) and to 12.7 ± 3.6% in PINK1 fibroblasts (p < 0.001 vs. H₂O₂), suggesting that Prx6 may limit excessive stress-induced mitophagy.
To gain insight into the molecular changes underlying this response, we assessed the expression of mitophagy-related genes (Figure 4E). In SH-SY5Y cells treated with Prx6 for 24 h, we observed transcriptional upregulation of parkin (9.2-fold), optineurin (8.3-fold), p62 (6.6-fold), nix (4.9-fold), bnip3 (2.9-fold), and others, with pink1 increasing modestly (1.7-fold). H₂O₂ alone induced a similar upregulation of p62 (7.4-fold), optineurin (5.2-fold), and parkin (5.0-fold), whereas pink1 increased to 2.0-fold. In the combined Prx6 + H₂O₂ group, the expression of parkin and optineurin remained elevated (4.3-fold and 5.2-fold respectively), while pink1 decreased to 1.4-fold. Other mitophagy genes were modestly upregulated (Figure 4E).
Taken together, these results suggest that Prx6 promotes basal mitophagy and primes cells for mitochondrial turnover under non-stress conditions. However, under acute oxidative stress, Prx6 appears to suppress excessive mitophagic flux, possibly by preventing mitochondrial damage upstream and thereby limiting mitophagy induction.
Discussion
In this study, we investigated the cytoprotective and regulatory effects of recombinant Prx6 in cellular models of oxidative stress, focusing on its ability to preserve Δψm, attenuate ROS, modulate gene expression, and regulate mitophagy. Our findings provide new insight into how Prx6 supports mitochondrial homeostasis in both physiological and pathological contexts, particularly in PINK1-deficient fibroblasts – cells that model early-onset PD and are characterized by elevated oxidative stress and impaired mitophagy [9].
Limited Effect After Short-Term Exposure; Cytoprotection Requires Prolonged Incubation
Despite Prx6’s well-documented antioxidant and membrane-stabilizing properties [3], short-term (2 h) preincubation with recombinant protein failed to improve cell viability or membrane integrity under oxidative stress (Figure 1B). This suggests that Prx6 requires time to be internalized and to exert transcriptional and metabolic effects, such as upregulation of cytoprotective genes or modulation of mitochondrial pathways [4,5,15]. Only after a 24-h incubation did we observe improved survival, particularly in PINK1-deficient cells. This effect was paralleled by elevated expression of bcl2 and nrf2 (Figure 1C), genes involved in anti-apoptotic signaling and redox regulation [16]. These data imply that Prx6 acts not merely as a direct ROS scavenger, but as a delayed-response regulator, possibly through transcriptional reprogramming or mitochondrial remodeling.
Prx6 Attenuates ROS Production Under Basal and Stress Conditions
ROS are key mediators of oxidative damage in neurodegeneration, and their accumulation is particularly detrimental in cells with impaired mitochondrial quality control, such as those lacking functional PINK1 [17,18]. Our data show that Prx6 significantly reduces both basal and H₂O₂-induced ROS levels in PINK1-deficient fibroblasts (Figure 2D). The reduction was especially pronounced in cells with elevated basal ROS, suggesting a context-sensitive action where Prx6 preferentially acts under redox imbalance. Notably, in WT cells, Prx6 suppressed ROS production rate during stress without disturbing basal redox status, highlighting its role as a conditional antioxidant that minimizes oxidative bursts without impairing physiological ROS signaling.
Prx6 Preserves Δψm and Modulates Mitochondrial Remodeling Programs
The Δψm is crucial for ATP synthesis, calcium buffering, and mitophagy induction. As expected, H₂O₂ exposure reduced Δψm in both WT and PINK1-mutant cells, with greater vulnerability observed in the latter. Prx6 pre-treatment preserved Δψm in both backgrounds, supporting a protective effect against mitochondrial depolarization (Figure 3C-D).
Interestingly, even in the absence of stress, Prx6 slightly reduced Δψm (Figure 3B-C). This subtle depolarization may reflect mild uncoupling of the inner mitochondrial membrane – possible adaptive mechanism known to reduce ROS production by lowering proton motive force and electron leak at respiratory complexes. Such controlled uncoupling has been described for other protective agents and is thought to serve as an early checkpoint in mitochondrial quality control [19]. Alternatively, Prx6 may initiate mitochondrial remodeling to prepare for mitophagy, in line with observed upregulation of drp1, opa1, mfn1, and mfn2 (Figure 3D), indicating balanced modulation of both fission and fusion pathways [20].
Dual Effect of Prx6 on Mitophagy: Stimulation Under Basal Conditions, Suppression Under Stress
Mitophagy serves as a selective mitochondrial quality control system, clearing dysfunctional organelles through PINK1/Parkin and Bnip/Nix pathways – both of which are compromised in neurodegenerative disorders such as PD [21]. In our study, Prx6 promoted basal mitophagy, as reflected by increased mitochondrial-lysosomal colocalization in WT and PINK1-deficient fibroblasts (Figure 4C-D). This suggests that Prx6 may help maintain mitochondrial integrity by enhancing basal clearance of mildly damaged mitochondria.
Under oxidative stress, however, Prx6 attenuated the stress-induced mitophagy rise (Figure 4C-D). This effect may result from upstream ROS suppression, leading to reduced damage signaling, or from modulation of mitophagy thresholds via transcriptional feedback. It is also plausible that Prx6 limits autophagic flux during acute stress to avoid depletion of mitochondrial pools and prevent overactivation of catabolic processes [8,20]. This finely tuned regulation – enhancing quality control in health and restraining excessive clearance during injury – suggests a possible homeostatic role for Prx6 in mitochondrial turnover.
Prx6 Modulates Mitophagy-Related Gene Expression
Gene expression analysis further supports this model. Under basal conditions, Prx6 robustly upregulated parkin, p62, and optn, essential components of the PINK1/Parkin pathway and selective autophagy adaptors (Figure 4E). Upon H₂O₂ challenge, expression of these genes increased, but co-treatment with Prx6 surprisingly dampened their transcription, especially p62 (Figure 4E). This may reflect a negative feedback loop activated by restored redox balance or mitophagy saturation. Alternatively, Prx6 could interfere with transcription factors such as NF-κB or Nrf2, which regulate autophagy genes in response to oxidative cues [22].
Although mitophagy can be triggered by various nonspecific stimuli, including intracellular acidification [23,24], there remains a need to identify agents capable of fine-tuning this machinery to prevent excessive mitophagic activity under stress conditions and simultaneously influence mitochondrial dynamics [25]. In this context, Prx6 preserved mitochondrial membrane potential and prevented excessive activation of mitochondrial fission, suggesting its role in maintaining balanced mitochondrial quality control. Such transcriptional plasticity aligns with Prx6’s dual role: under basal conditions, it primes cells for mitophagy via gene activation; under oxidative stress, it suppresses excessive gene induction and flux, possibly preserving mitochondrial content and energy balance.
Integrated Model and Implications
Collectively, our findings position Prx6 as a context-sensitive modulator of mitochondrial health (Figure 5). It acts through multiple interconnected mechanisms: antioxidant defense, preservation of Δψm, regulation of mitochondrial dynamics, and dual modulation of mitophagy. Importantly, these effects are retained in PINK1-deficient fibroblasts, supporting the idea that Prx6 may bypass or compensate for dysfunctional quality control pathways.
Given the central role of mitochondrial dysfunction in PD and related disorders, Prx6 emerges as a promising candidate for cytoprotection and disease modification. Future studies should clarify the precise molecular mechanisms of Prx6 uptake and signaling, its interactions with ROS and mitophagy sensors, and its therapeutic efficacy in vivo.
Limitations and Future Directions
Despite the promising findings, several limitations of this study should be acknowledged. First, while human dermal fibroblasts provide a genetically stable and ethically accessible model for investigating mitochondrial dysfunction and redox signaling, they do not fully recapitulate the metabolic and functional complexity of neurons, particularly midbrain dopaminergic neurons affected in PD. Nevertheless, fibroblasts derived from patients with monogenic neurodegenerative disorders have been extensively used to study mitochondrial phenotypes [26,27], given that many key regulatory pathways – such as those involving PINK1/Parkin – are active in these cells. Moreover, our earlier work showed that fibroblasts exhibit higher sensitivity to mitochondrial depolarization compared to neurons, potentially due to an increased pro-apoptotic Bax/Bcl2 ratio [28]. This may exaggerate mitochondrial responses and oxidative vulnerability in vitro, and thus findings in fibroblasts should be interpreted with caution when extrapolated to neuronal systems.
Second, the precise intracellular pathways by which Prx6 modulates ROS, Δψm, and mitophagy remain unclear. Interactions with regulators such as PINK1/Parkin and Nrf2 require further elucidation.
Third, due to limited viability of fibroblasts under stress, SH-SY5Y cells were used for gene expression analysis. While relevant, their tumor origin may not fully reflect neuronal physiology.
Finally, all findings were obtained in vitro. Future in vivo studies are needed to evaluate the bioavailability and therapeutic efficacy of Prx6 under PD-related chronic oxidative stress.
Conclusions
Our study demonstrates that recombinant Prx6 exerts multifaceted cytoprotective effects in cellular models of oxidative stress, particularly in PINK1-deficient fibroblasts that mimic aspects of early-onset PD. Through the modulation of reactive oxygen species, stabilization of mitochondrial membrane potential, fine-tuning of mitophagy, and regulation of stress-responsive gene expression, Prx6 acts as both a redox buffer and a mitochondrial homeostasis regulator. Notably, its dual behavior – enhancing basal mitophagy while suppressing stress-induced mitophagic overload – suggests context-sensitive regulation of mitochondrial quality control. These findings highlight the therapeutic potential of Prx6 or its derivatives in conditions characterized by mitochondrial dysfunction and impaired mitophagy. Future work should aim to clarify the molecular mechanisms underlying Prx6 activity and explore its application in more disease-relevant models, including neurons and in vivo systems.
Fundings and acknowledgments
Supported by the Russian Science Foundation (grant no. 25-24-00455, https://rscf.ru/en/project/25-24-00455/). The authors thank Optical Microscopy and Spectrophotometry core facility of ICB RAS at the Federal Research Center “Pushchino Scientific Center for Biological Research of the Russian Academy of Sciences” (http://www.ckp-rf.ru/ckp/670266/) for technical support.
Ethics statement
Not applicable
Data statement
The original data generated in this study are included in the article/supplementary material, and further inquiries can be directed to the corresponding authors.
Declaration of competing interest
The authors declared no potential conflicts of interest with respect to the research, authorship and/or publication of this article.
References
- Bertholet, A.; Delerue, T.; Millet, A.; Moulis, M.; David, C.; Daloyau, M.; Arnauné-Pelloquin, L.; Davezac, N.; Mils, V.; Miquel, M.; et al. Mitochondrial fusion/fission dynamics in neurodegeneration and neuronal plasticity. Neurobiol. Dis. 2016, 90, 3–19. [Google Scholar] [CrossRef] [PubMed]
- Chen, W.; Zhao, H.; Li, Y. Mitochondrial dynamics in health and disease: mechanisms and potential targets. Signal Transduct. Target. Ther. 2023, 8, 333. [Google Scholar] [CrossRef] [PubMed]
- Fisher, A.B. Peroxiredoxin 6 in the repair of peroxidized cell membranes and cell signaling. Arch. Biochem. Biophys. 2017, 617, 68–83. [Google Scholar] [CrossRef]
- Sharapov, M.G.; Goncharov, R.G.; Parfenyuk, S.B.; Glushkova, O.V.; Novoselov, V.I. The Role of Phospholipase Activity of Peroxiredoxin 6 in Its Transmembrane Transport and Protective Properties. Int. J. Mol. Sci. 2022, 23, 15265. [Google Scholar] [CrossRef]
- Jia, W.; Dong, C.; Li, B. Anti-Oxidant and Pro-Oxidant Effects of Peroxiredoxin 6: A Potential Target in Respiratory Diseases. Cells 2023, 12, 181. [Google Scholar] [CrossRef]
- Pacifici, F.; Della-Morte, D.; Capuani, B.; Coppola, A.; Scioli, M.G.; Donadel, G.; Andreadi, A.; Ciccosanti, F.; Fimia, G.M.; Bellia, A.; et al. Peroxiredoxin 6 Modulates Insulin Secretion and Beta Cell Death via a Mitochondrial Dynamic Network. Front. Endocrinol. 2022, 13, 842575. [Google Scholar] [CrossRef]
- Sharapov, M.G.; Gudkov, S.V.; Lankin, V.Z.; Novoselov, V.I. Role of Glutathione Peroxidases and Peroxiredoxins in Free Radical-Induced Pathologies. Biochem. (Moscow) 2021, 86, 1418–1433. [Google Scholar] [CrossRef] [PubMed]
- Ma, S.; Zhang, X.; Zheng, L.; Li, Z.; Zhao, X.; Lai, W.; Shen, H.; Lv, J.; Yang, G.; Wang, Q.; et al. Peroxiredoxin 6 Is a Crucial Factor in the Initial Step of Mitochondrial Clearance and Is Upstream of the PINK1-Parkin Pathway. Antioxidants Redox Signal. 2015, 24, 486–501. [Google Scholar] [CrossRef]
- Kritskaya, K.A.; Fedotova, E.I.; Berezhnov, A.V. Impaired Mitochondrial Network Morphology and Reactive Oxygen Species Production in Fibroblasts from Parkinson’s Disease Patients. Biomedicines 2024, 12, 282. [Google Scholar] [CrossRef]
- Sharapov, M.G.; Novoselov, V.I.; Ravin, V.K. Cloning, expression and comparative analysis of peroxiredoxin 6 from different species. Mol. Biol. 2009, 43, 465–471. [Google Scholar] [CrossRef]
- Sharapov, M.G.; Novoselov, V.I.; Fesenko, E.E.; Bruskov, V.I.; Gudkov, S.V. The role of peroxiredoxin 6 in neutralization of X-ray mediated oxidative stress: effects on gene expression, preservation of radiosensitive tissues and postradiation survival of animals. Free. Radic. Res. 2017, 51, 148–166. [Google Scholar] [CrossRef]
- Berezhnov, A.V.; Soutar, M.P.; Fedotova, E.I.; Frolova, M.S.; Plun-Favreau, H.; Zinchenko, V.P.; Abramov, A.Y. Intracellular pH modulates autophagy and mitophagy. J. Biol. Chem. 2016, 291, 8701–8708. [Google Scholar] [CrossRef]
- Fedotova, E.I.; Dolgacheva, L.P.; Abramov, A.Y.; Berezhnov, A.V. Lactate and Pyruvate Activate Autophagy and Mitophagy that Protect Cells in Toxic Model of Parkinson’s Disease. Mol. Neurobiol. 2022, 59, 177–190. [Google Scholar] [CrossRef]
- Kozera, B.; Rapacz, M. Reference genes in real-time PCR. J. Appl. Genet. 2013, 54, 391–406. [Google Scholar] [CrossRef]
- Liu, M.; Zuo, S.; Guo, X.; Peng, J.; Xing, Y.; Guo, Y.; Li, C.; Xing, H. The Study of Overexpression of Peroxiredoxin-2 Reduces MPP+-Induced Toxicity in the Cell Model of Parkinson’s Disease. Neurochem. Res. 2023, 48, 2129–2137. [Google Scholar] [CrossRef]
- Dinkova-Kostova, A.T.; Abramov, A.Y. The emerging role of Nrf2 in mitochondrial function. Free. Radic. Biol. Med. 2015, 88, 179–188. [Google Scholar] [CrossRef] [PubMed]
- Abramov, A.Y.; Gegg, M.; Grunewald, A.; Wood, N.W.; Klein, C.; Schapira, A.H.V. Bioenergetic consequences of PINK1 mutations in parkinson disease. PLOS ONE 2011, 6, e25622. [Google Scholar] [CrossRef] [PubMed]
- Gandhi, S.; Wood-Kaczmar, A.; Yao, Z.; Plun-Favreau, H.; Deas, E.; Klupsch, K.; Downward, J.; Latchman, D.S.; Tabrizi, S.J.; Wood, N.W.; et al. PINK1-Associated Parkinson's Disease Is Caused by Neuronal Vulnerability to Calcium-Induced Cell Death. Mol. Cell 2009, 33, 627–638. [Google Scholar] [CrossRef]
- Zorov, D.B.; Andrianova, N.V.; Babenko, V.A.; Pevzner, I.B.; Popkov, V.A.; Zorov, S.D.; Zorova, L.D.; Plotnikov, E.Y.; Sukhikh, G.T.; Silachev, D.N. Neuroprotective Potential of Mild Uncoupling in Mitochondria. Pros and Cons. Brain Sci. 2021, 11, 1050. [Google Scholar] [CrossRef]
- Frank, M.; Duvezin-Caubet, S.; Koob, S.; Occhipinti, A.; Jagasia, R.; Petcherski, A.; Ruonala, M.O.; Priault, M.; Salin, B.; Reichert, A.S. Mitophagy is triggered by mild oxidative stress in a mitochondrial fission dependent manner. Biochim. et Biophys. Acta (BBA) - Mol. Cell Res. 2012, 1823, 2297–2310. [Google Scholar] [CrossRef] [PubMed]
- Palikaras, K.; Lionaki, E.; Tavernarakis, N. Mechanisms of mitophagy in cellular homeostasis, physiology and pathology. Nat. Cell Biol. 2018, 20, 1013–1022. [Google Scholar] [CrossRef] [PubMed]
- Sharapov, M.G.; Glushkova, O.V.; Parfenyuk, S.B.; Gudkov, S.V.; Lunin, S.M.; Novoselova, E.G. The role of TLR4/NF-κB signaling in the radioprotective effects of exogenous Prdx6. Arch. Biochem. Biophys. 2021, 702, 108830. [Google Scholar] [CrossRef] [PubMed]
- Komilova, N.R.; Angelova, P.R.; Berezhnov, A.V.; Stelmashchuk, O.A.; Mirkhodjaev, U.Z.; Houlden, H.; Gourine, A.V.; Esteras, N.; Abramov, A.Y. Metabolically induced intracellular pH changes activate mitophagy, autophagy, and cell protection in familial forms of Parkinson's disease. FEBS J. 2021, 289, 699–711. [Google Scholar] [CrossRef]
- Nadeev, A.D.; Kritskaya, K.A.; Fedotova, E.I.; Berezhnov, A.V. One Small Step for Mouse»: High CO2 Inhalation as a New Therapeutic Strategy for Parkinson’s Disease. Biomedicines 2022, 10, 2832. [Google Scholar] [CrossRef]
- Georgakopoulos, N.D.; Wells, G.; Campanella, M. The pharmacological regulation of cellular mitophagy. Nat. Chem. Biol. 2017, 13, 136–146. [Google Scholar] [CrossRef]
- Mantey, I.; Langerscheidt, F.; Durmaz, Ç.Ç.; Baba, N.; Burghardt, K.; Karakaya, M.; Zempel, H. The POLG Variant c.678G>C; p.(Gln226His) Is Associated with Mitochondrial Abnormalities in Fibroblasts Derived from a Patient Compared to a First-Degree Relative. Genes 2025, 16, 198. [Google Scholar] [CrossRef]
- Vinokurov, A.Y.; Palalov, A.A.; Kritskaya, K.A.; Demyanenko, S.V.; Garbuz, D.G.; Evgen’eV, M.B.; Esteras, N.; Abramov, A.Y. Cell-Permeable HSP70 Protects Neurons and Astrocytes Against Cell Death in the Rotenone-Induced and Familial Models of Parkinson’s Disease. Mol. Neurobiol. 2024, 61, 7785–7795. [Google Scholar] [CrossRef]
- Kritskaya, K.A.; Stelmashchuk, O.A.; Abramov, A.Y. Point of No Return—What Is the Threshold of Mitochondria With Permeability Transition in Cells to Trigger Cell Death. J. Cell. Physiol. 2025, 240, e31521. [Google Scholar] [CrossRef] [PubMed]
Figure 1.
Prx6 improves survival of PINK1-mutant fibroblasts under oxidative stress and modulates apoptosis-related gene expression in neuroblastoma cells. (A) Representative images of wild-type (WT) and PINK1-mutant fibroblasts stained with Hoechst 33342 (blue) and propidium iodide (PI, red), after exposure to 300 µM hydrogen peroxide (H₂O₂, 2 h) with or without prior incubation with 150 µg/mL Prx6 (2 h or 24 h). Scale bar: 50 µm. (B) Quantification of viable cells (% of untreated control) in WT and PINK1 fibroblasts after H₂O₂ (300 µM, 2h) exposure with or without 150 µg/mL Prx6 pretreatment (2 h or 24 h). n=9 coverslips of cells in 3 independent experiments. Boxplots show median, interquartile range, and individual data points; p < 0.001 by one-way ANOVA with Tukey’s post hoc test. (C) Heatmap showing fold change (mean from 3 independent experiments) in expression of apoptosis- and survival-related genes (bax, bcl2, casp3, nrf2) in SH-SY5Y neuroblastoma cells treated with 150 µg/mL Prx6 (24 h), H₂O₂ (150 µM, 1 h), or both. Expression values were normalized to GAPDH and are presented as relative fold change.
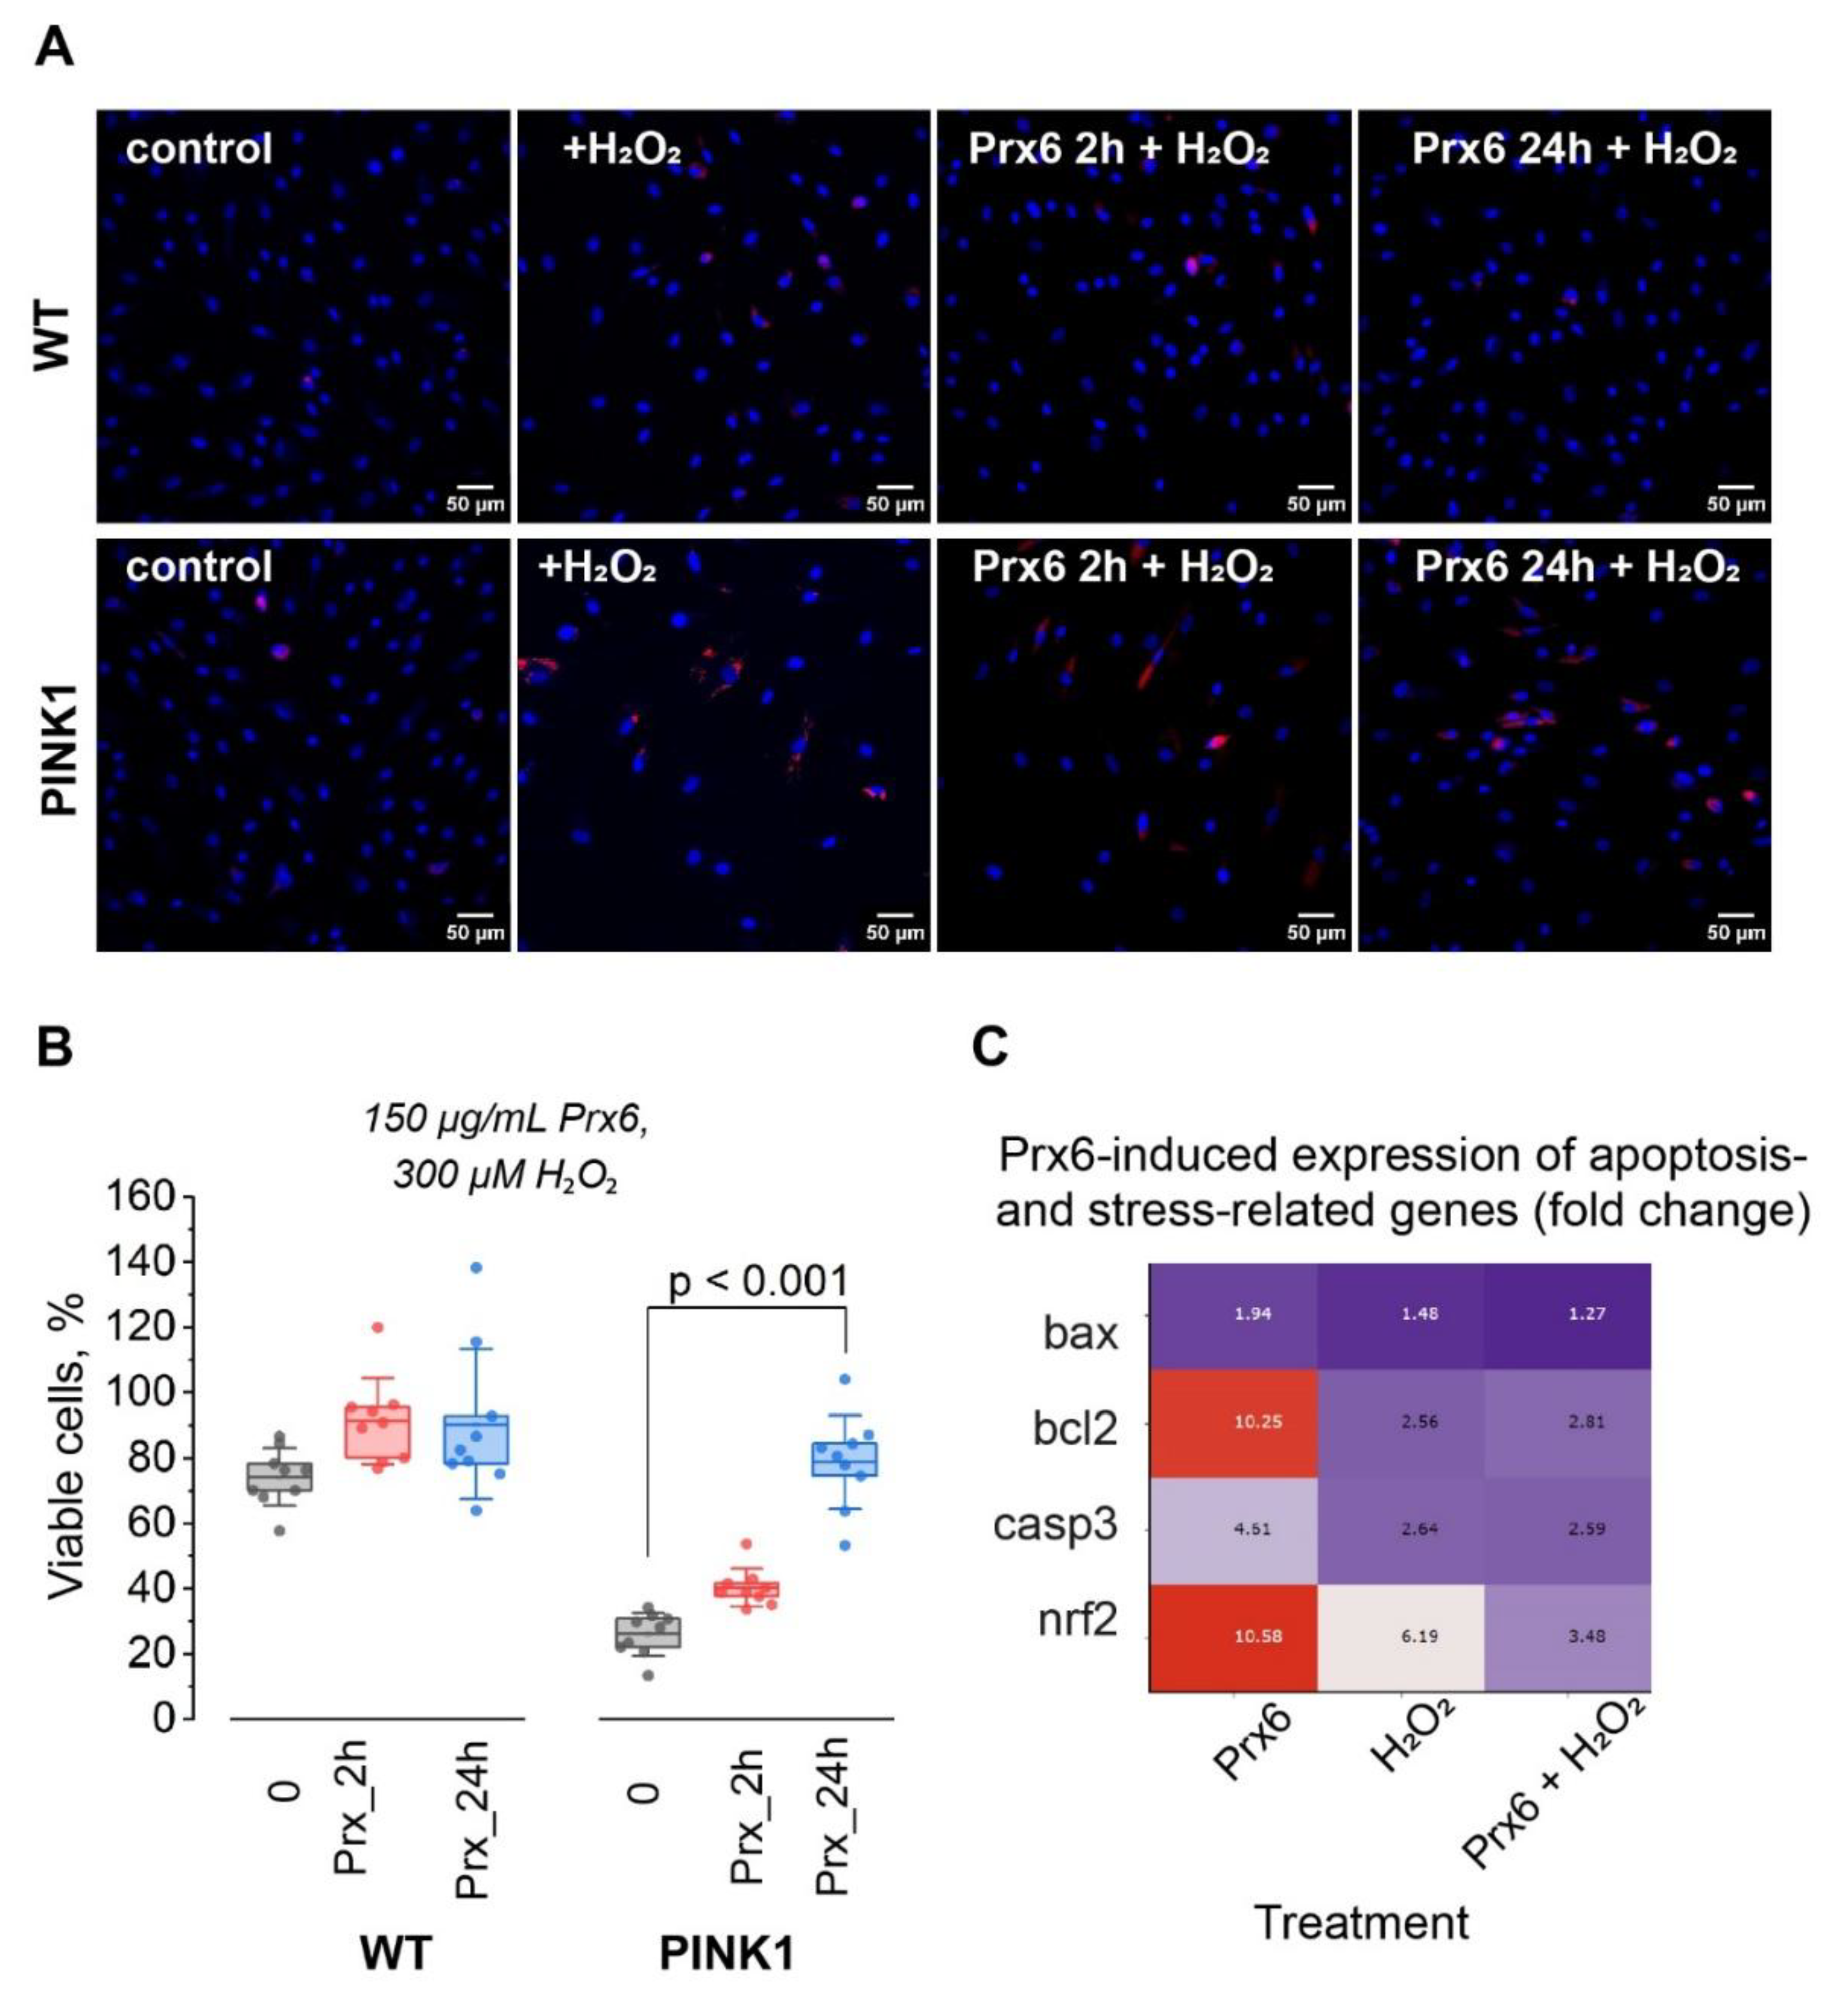
Figure 2.
Prx6 modulates ROS production rate in wild-type and PINK1-mutant fibroblasts. (A) Representative fluorescence images of H₂DCF-DA-loaded wild-type (WT) and PINK1-mutant fibroblasts at the beginning of acquisition and after 5 minutes of imaging (1 frame every 15 s). (B) Kinetics of ROS accumulation in WT and PINK1 fibroblasts. Data are presented as normalized fluorescence intensity (Fₙ/F₀) over time. Linear regression lines are shown to illustrate the difference in ROS production rate. (C) Quantification of ROS production rate under various treatment conditions in WT and PINK1 fibroblasts. Cells were treated 150 µg/mL Prx6 (24 h), with or without subsequent H₂O₂ (150 µM, 1 h) exposure. ROS production was normalized to the basal rate in untreated WT cells. Data are presented as boxplots; each dot represents an individual cell. For each condition n = 40 cells in 4 independent experiments. Statistical significance was assessed using one-way ANOVA followed by Tukey’s post hoc test; p < 0.05 was considered significant.
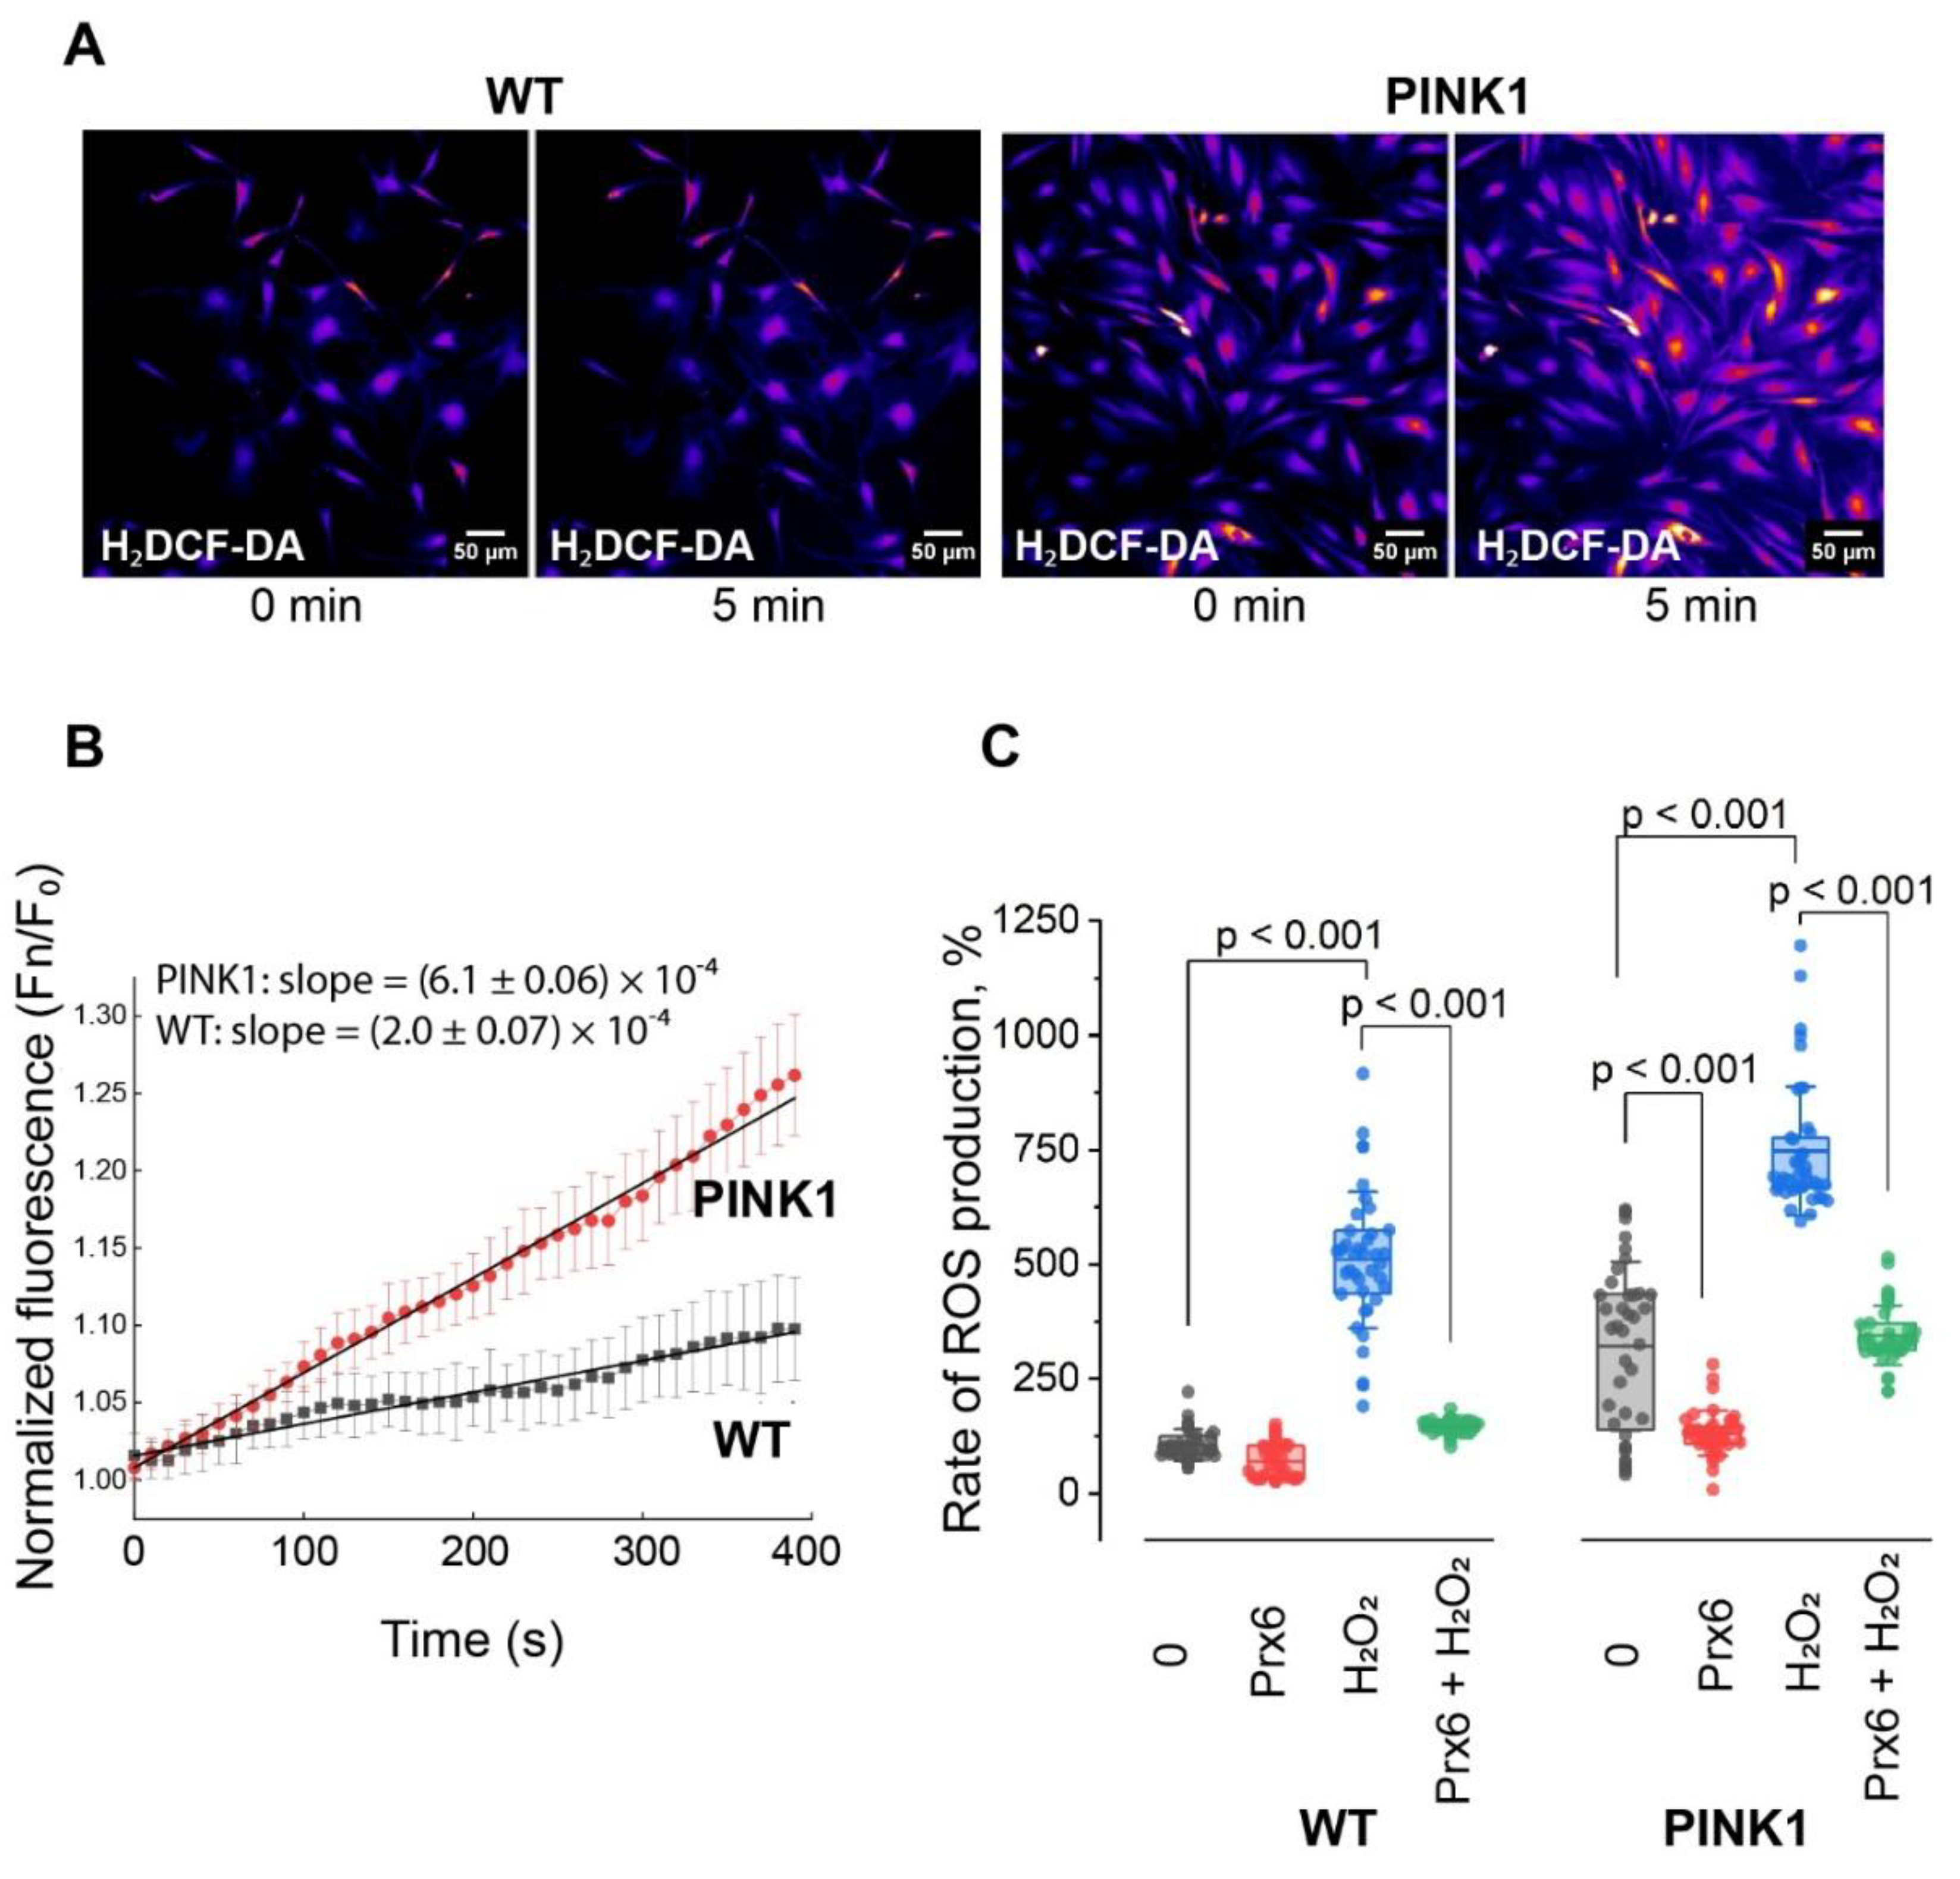
Figure 3.
Prx6 preserves mitochondrial membrane potential in fibroblasts under oxidative stress and modulates mitochondrial dynamics gene expression in neuroblastoma cells. (A) Representative images of wild-type (WT) and PINK1-mutant fibroblasts stained with TMRM under control conditions and after treatment with µM 150 H₂O₂ (1 h), with or without Prx6 preincubation (24 h), scale bar: 10 µm. (B, C) Quantification of mitochondrial membrane potential in WT (B) and PINK1-mutant (C) fibroblasts after 150 µM H₂O₂ exposure (1 h), with or without preincubation with Prx6 (150 µg/mL, 24 h). Gray bars: no H₂O₂ (control), pink bars: +H₂O₂ (oxidative stress). Data are presented as boxplots; each dot represents an individual cell. n = 16 cells per condition in 3 independent experiments. (D) Heatmap showing fold change (mean from 3 independent experiments) in expression of genes related to mitochondrial fission (drp1, fis1) and fusion (mfn1, mfn2, opa1) in SH-SY5Y neuroblastoma cells exposed to 150 µg/mL Prx6, 150 µM H₂O₂ for 1 h, or their combination. Expression values were normalized to GAPDH and are presented as relative fold change.
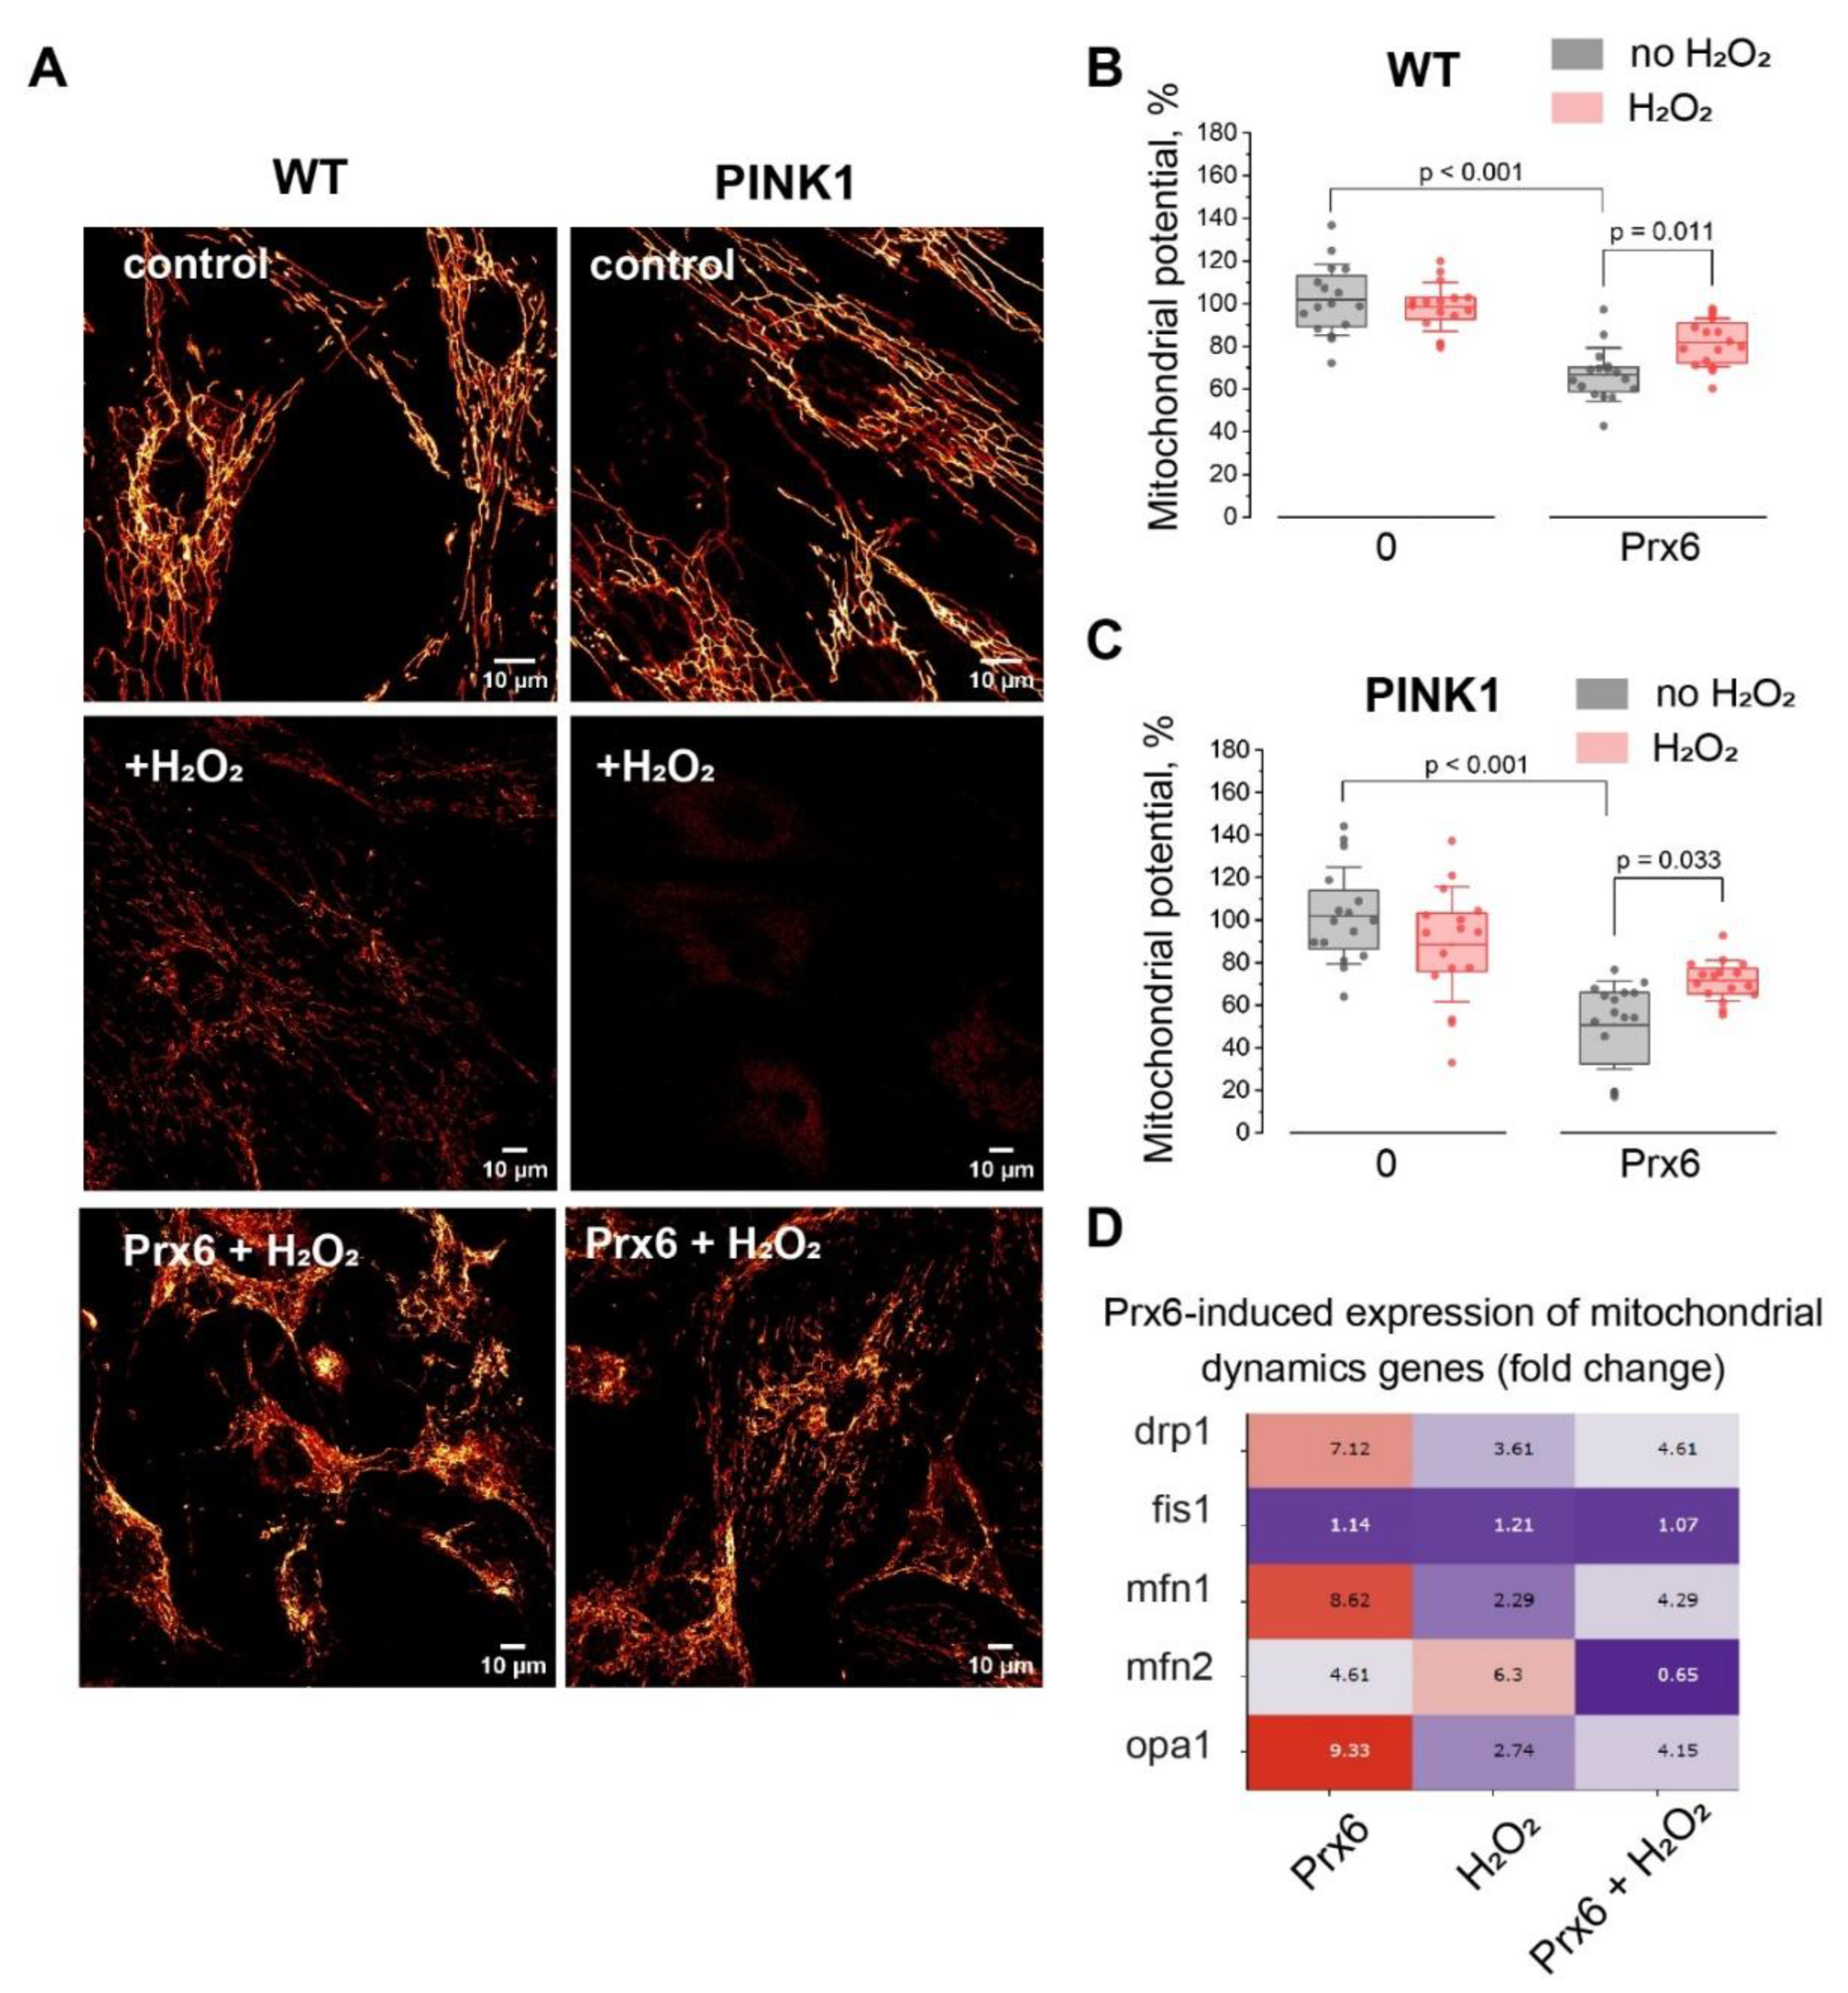
Figure 4.
Prx6 enhances mitophagy under basal conditions and attenuates it under oxidative stress in WT and PINK1-mutant fibroblasts, and modulates and mitophagy-related gene expression in neuroblastoma cells. (A) Schematic illustration of the experimental protocol. Numbers indicate the sequential steps: MitoTracker Green (MTG) staining was performed prior to oxidative stress induction (H₂O₂), while LysoTracker Red (LTR) staining was applied after the stress to allow optimal visualization of mitochondrial-lysosomal colocalization. (B) Representative images of wild-type (WT) and PINK1 fibroblasts stained with MTG (green) and LTR (red) under indicated conditions (scale bar: 10 µm). (C, D) Quantification of colocalization between mitochondria and lysosomes in WT and PINK1 fibroblasts under basal conditions (C) or after exposure to 150 µM H₂O₂ for 1 h (D). Prx6 increases basal mitophagy (C), but reduces mitophagic activity under oxidative stress (D) in both genotypes. Statistical analysis was performed using the Mann-Whitney U test. Data are presented as boxplots; each dot represents cells coverslip; n > 10 cells coverslips group from 3 independent experiments. p-values < 0.05 were considered statistically significant. (E) Heatmap showing fold change (mean from 3 independent experiments) in expression of mitophagy-related genes (pink1, parkin, bnip3, nix, fundc1, p62, optn) in SH-SY5Y neuroblastoma cells treated with Prx6, H₂O₂, or both. Expression values were normalized to GAPDH and are presented as relative fold change.
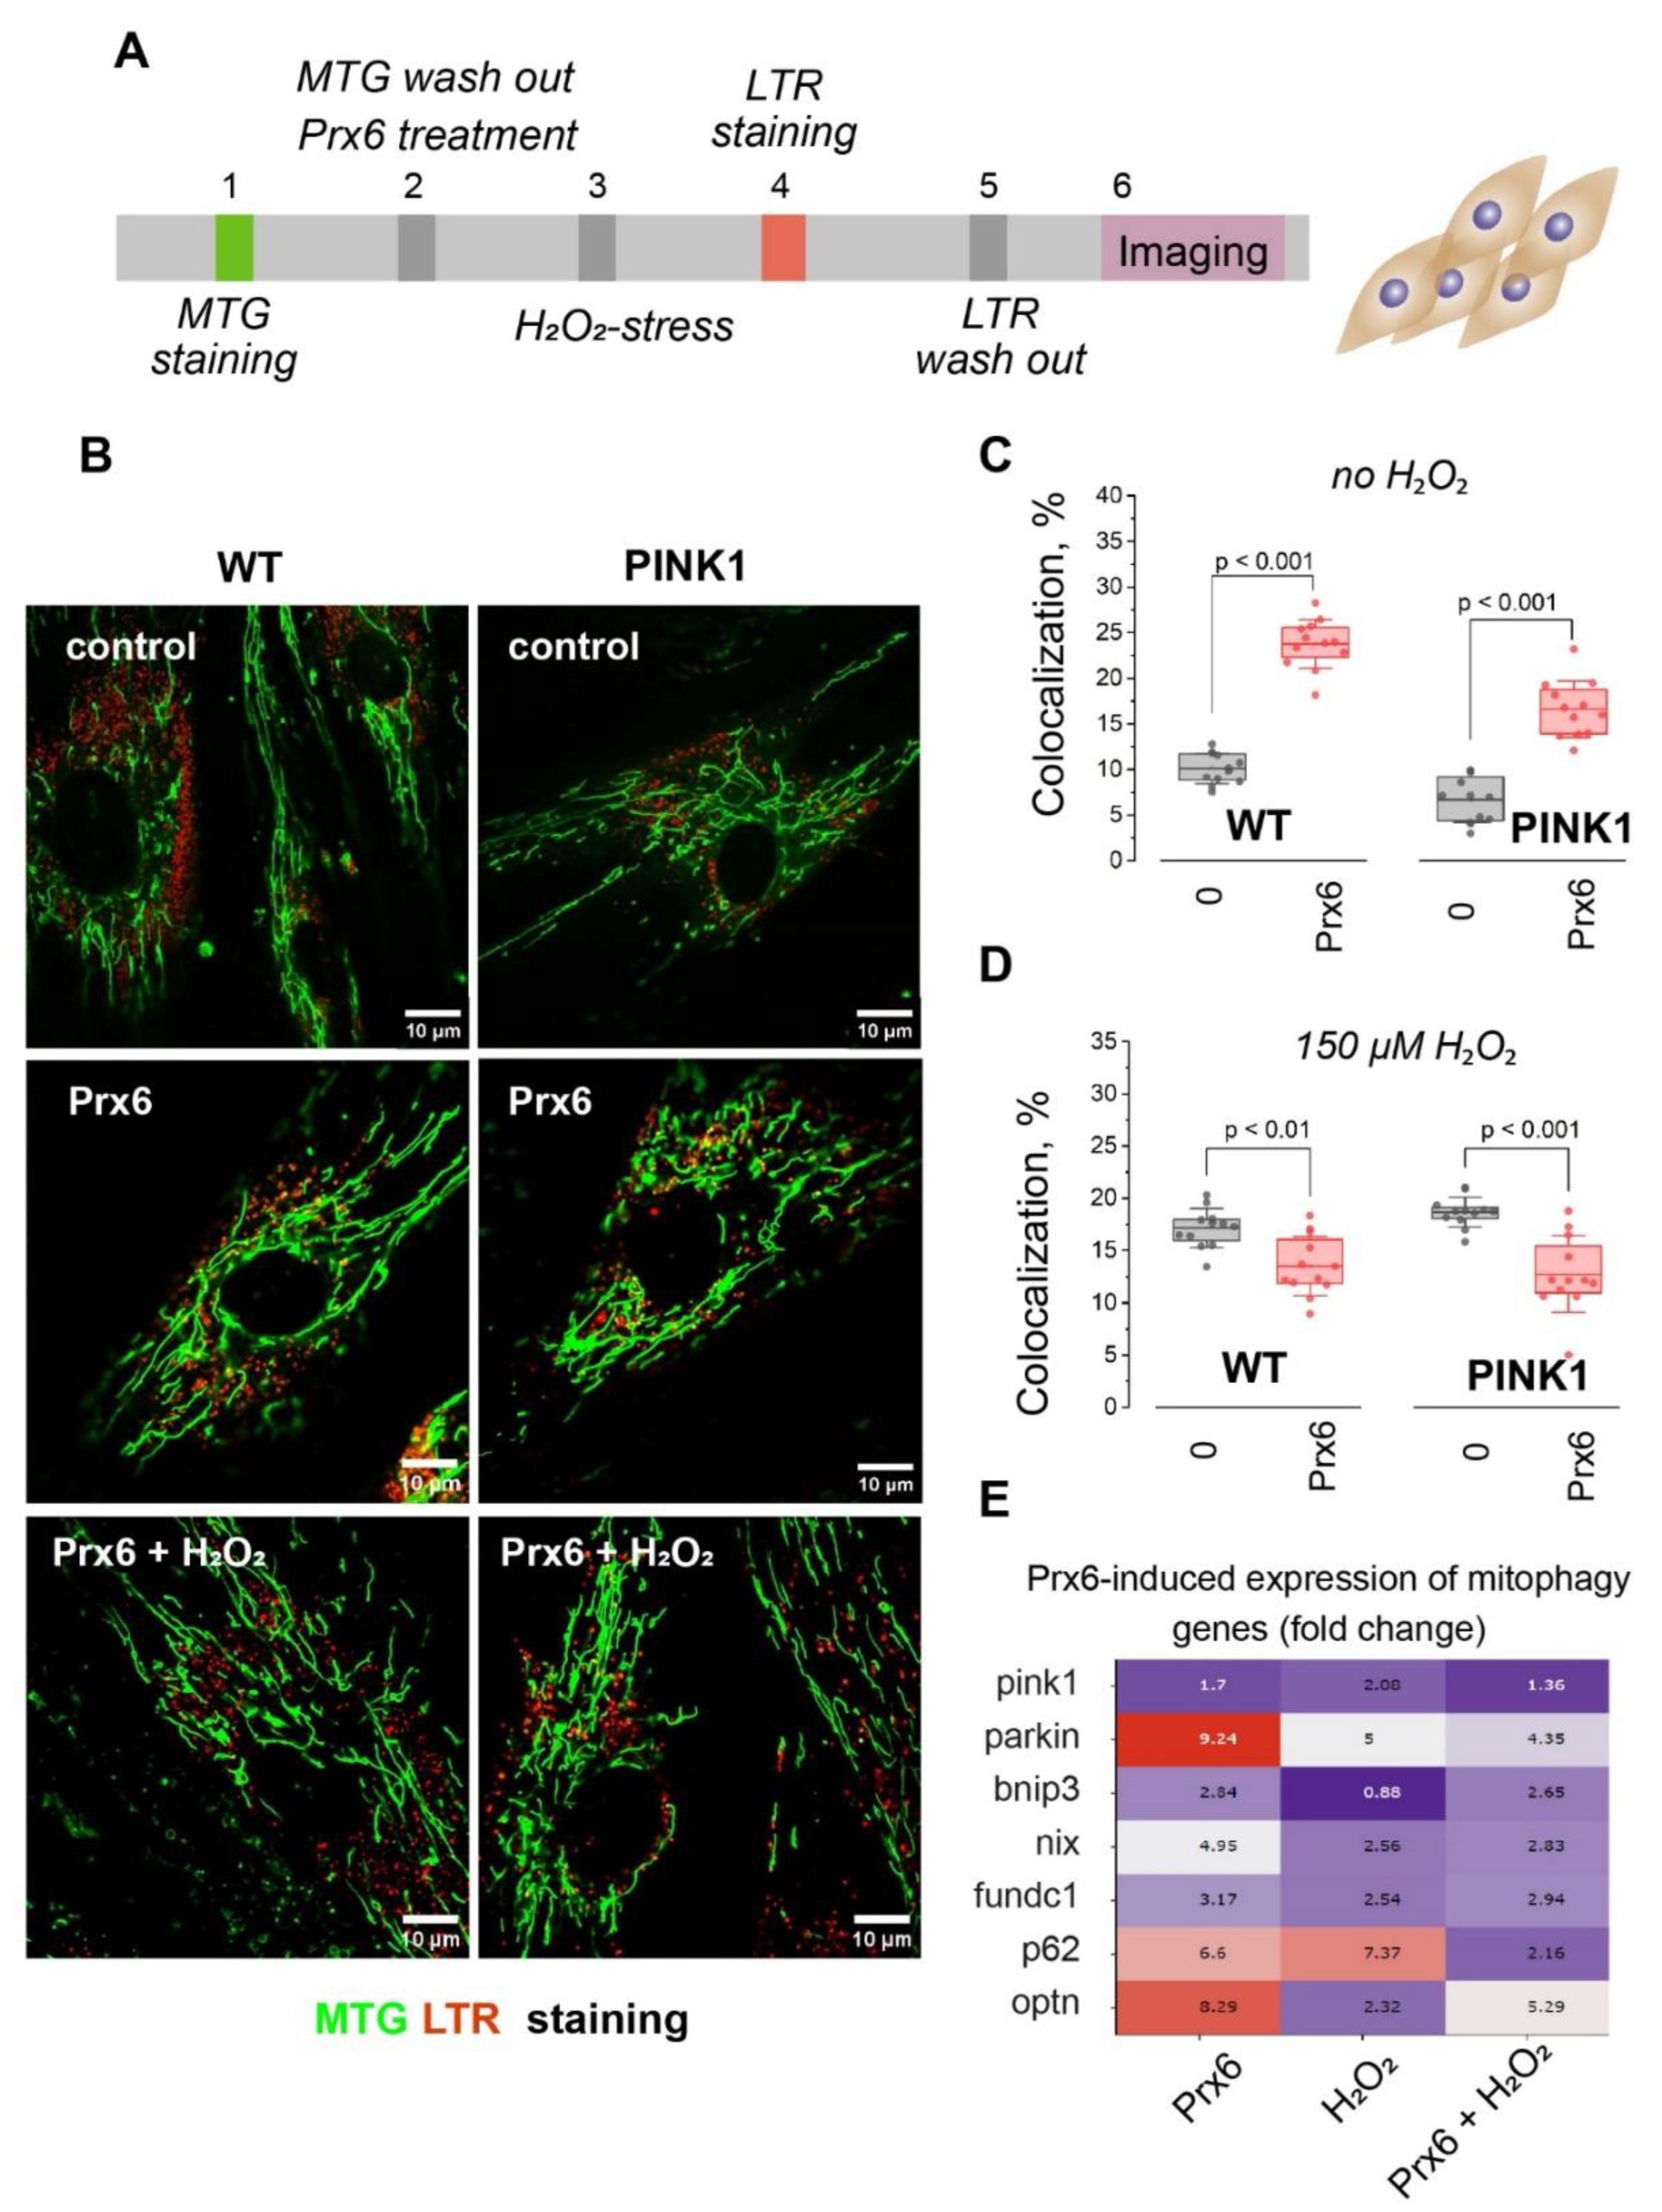
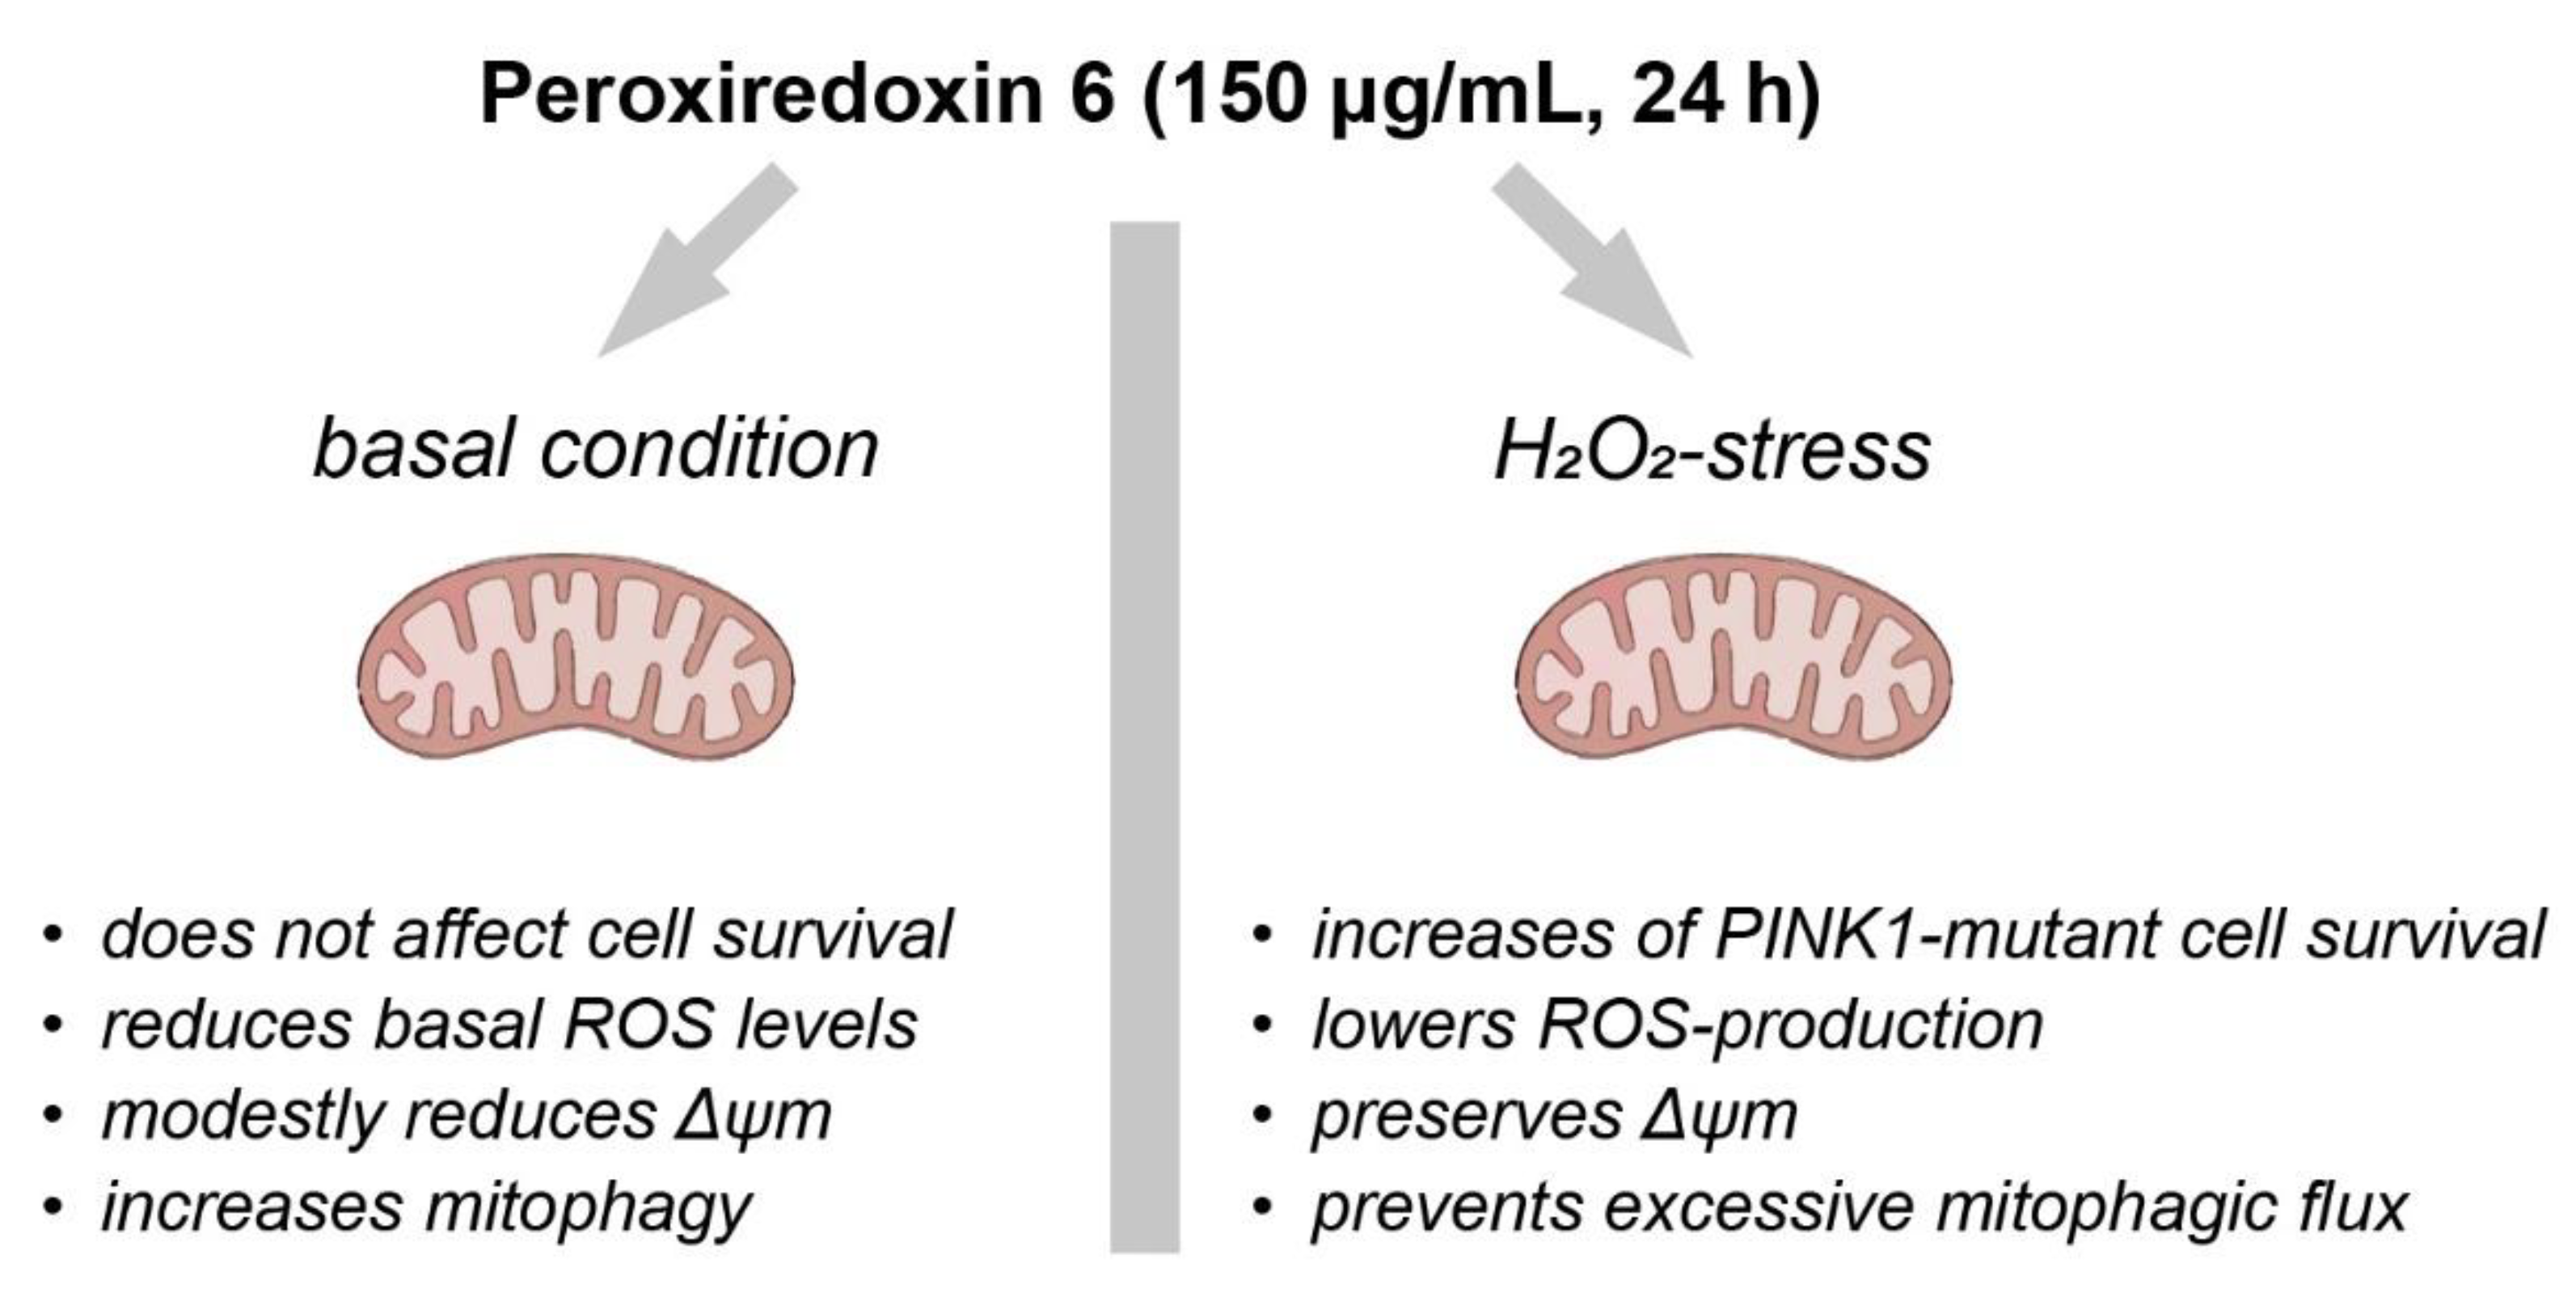
Figure 5.
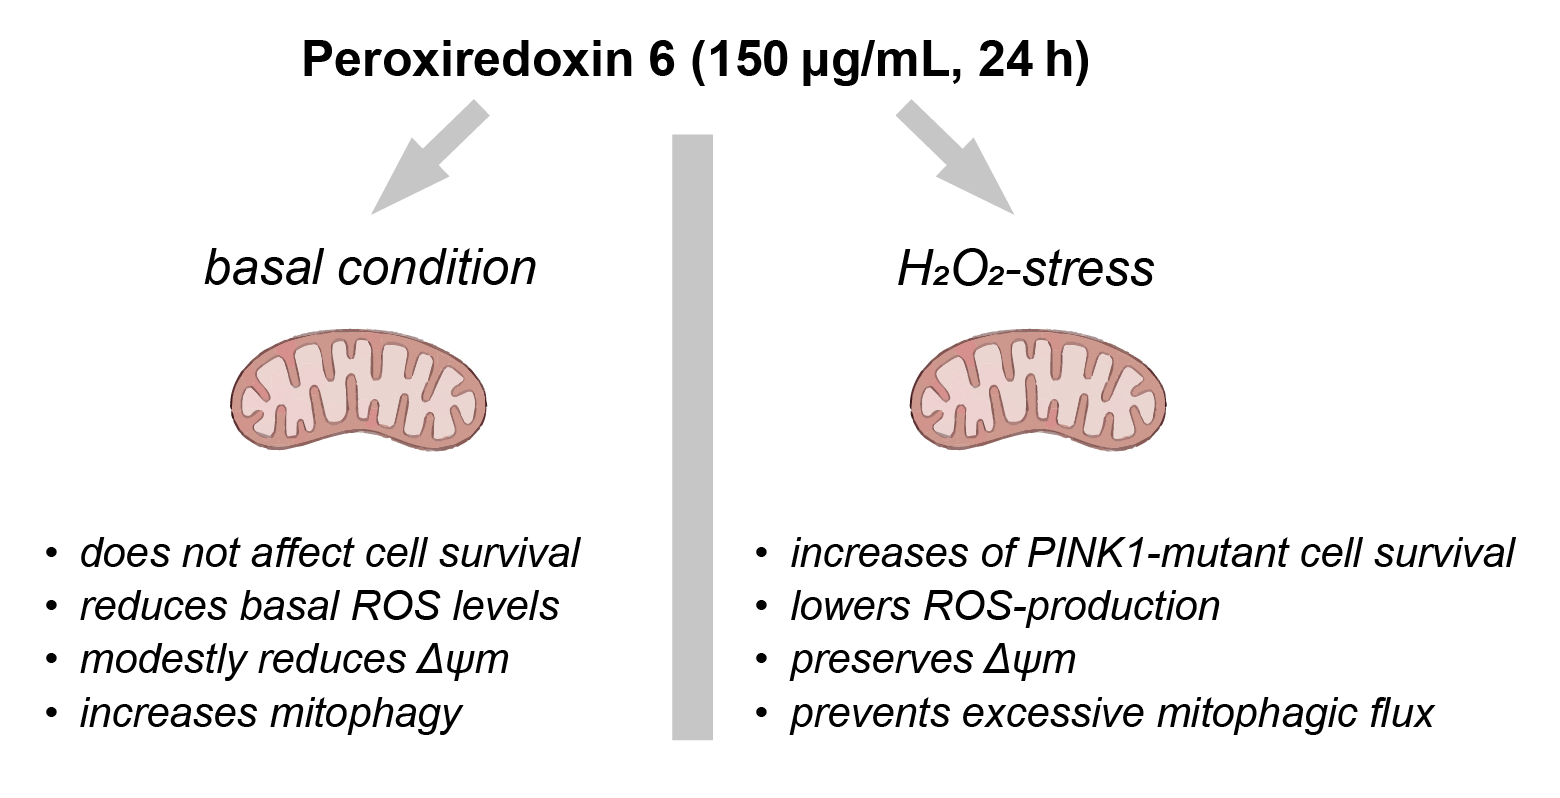
Summary of Prx6 effects in fibroblasts under normal and oxidative stress conditions. Schematic summary of the effects of Prx6 (150 μg/mL, 24 h) on mitochondrial homeostasis in fibroblasts under physiological (left) and oxidative stress (right) conditions. Under basal conditions, Prx6 slightly decreases reactive oxygen species (ROS) levels and mitochondrial membrane potential (ΔΨm), while enhancing mitophagy, without affecting cell viability. In contrast, under H₂O₂-induced stress (150 μM for 1h or 300 μM for 2 h), Prx6 exerts cytoprotective effects by improving cell survival in PINK1-deficient fibroblasts, lowering ROS production, Δψm, and preventing excessive mitophagic flux. Together, these findings support a dual role for Prx6 in regulating mitochondrial homeostasis: promoting basal turnover while preventing overactivation of mitophagy under stress conditions.
Figure 5.
Summary of Prx6 effects in fibroblasts under normal and oxidative stress conditions. Schematic summary of the effects of Prx6 (150 μg/mL, 24 h) on mitochondrial homeostasis in fibroblasts under physiological (left) and oxidative stress (right) conditions. Under basal conditions, Prx6 slightly decreases reactive oxygen species (ROS) levels and mitochondrial membrane potential (ΔΨm), while enhancing mitophagy, without affecting cell viability. In contrast, under H₂O₂-induced stress (150 μM for 1h or 300 μM for 2 h), Prx6 exerts cytoprotective effects by improving cell survival in PINK1-deficient fibroblasts, lowering ROS production, Δψm, and preventing excessive mitophagic flux. Together, these findings support a dual role for Prx6 in regulating mitochondrial homeostasis: promoting basal turnover while preventing overactivation of mitophagy under stress conditions.
Disclaimer/Publisher’s Note: The statements, opinions and data contained in all publications are solely those of the individual author(s) and contributor(s) and not of MDPI and/or the editor(s). MDPI and/or the editor(s) disclaim responsibility for any injury to people or property resulting from any ideas, methods, instructions or products referred to in the content. |
© 2025 by the authors. Licensee MDPI, Basel, Switzerland. This article is an open access article distributed under the terms and conditions of the Creative Commons Attribution (CC BY) license (http://creativecommons.org/licenses/by/4.0/).
Copyright: This open access article is published under a Creative Commons CC BY 4.0 license, which permit the free download, distribution, and reuse, provided that the author and preprint are cited in any reuse.


