
Submitted:
04 December 2025
Posted:
05 December 2025
You are already at the latest version
Abstract
This study examines the effects of hydrothermal and oleothermal treatments on the physical, mechanical, and colorimetric properties of Dabema wood. Samples were heated at 100, 160, and 220 °C for 2, 3.5, and 5 hours under both processing conditions. The physical properties changed markedly after treatment. The equilibrium moisture content decreased from 13.16% in the untreated wood to 7.50% after hydrothermal treatment at 160 °C for 5 hours, and to 4.80% after oleothermal treatment at 220 °C for 5 hours. Water absorption declined from 78% to 39% and then to 17%. Hydrothermal treatment darkened the wood, whereas oleothermal treatment preserved a lighter color. Mechanical performance improved. The modulus of elasticity (MOE) in compression increased from 33332.76 MPa to 70836.53 MPa after oleothermal treatment at 220 °C for 5 hours. Flexural strength reached 56 to 58 MPa. In tension, the MOE increased from 4271 MPa to 5527 MPa, and the maximum tensile strength reached 88 MPa. PCA and RSM analyses indicate that oleothermal treatment at 160 °C for 3.5 to 5 hours offers the most effective conditions for enhancing stiffness while controlling color variation. Thermogravimetric analyses (TG/DTG) show that hydrothermal treatment promotes hemicellulose degradation, whereas oleothermal treatment stabilizes the cellulose–lignin network. Overall, hydrothermal treatment improves dimensional stability, while oleothermal treatment provides an optimal balance between stiffness and color stability. Deep color differences arise from furanic resin formation in hydrothermal treatment, suppressed by oil in oleothermal processing.
Keywords:
thermal modification
; oleothermal treatment
; hydrothermal processing
; mechanical performance
; color stability
1. Introduction
Natural wood is valued for its high strength-to-weight ratio, attractive grain, and good workability [1,2]. Moreover, its biodegradability and renewability make it a widely used material in furniture and construction [3]. However, as a raw material, wood is sensitive to environmental conditions, particularly humidity, which can cause warping, cracking, and dimensional instability, thereby limiting its practical applications [4,5,6,7]. Tropical species such as Dabema (Piptadeniastrum africanum) are particularly vulnerable to these variations, and their physical, hygroscopic, colorimetric, and mechanical properties can be significantly modified by thermal or oil-based treatments [1,8,9].
To address these limitations, various treatments have been developed. Hydrothermal, or wet-heat, treatments improve dimensional stability by reducing hygroscopicity through partial hemicellulose degradation and decreased hydroxyl groups [10,11]. Prolonged exposure or high temperatures, however, can reduce mechanical strength, particularly the modulus of rupture (MOR) and modulus of elasticity (MOE), as observed by [8] on tropical woods and by [12] on temperate species, confirming that thermal degradation affects flexibility and ductility.
Oil-heat (oleothermal) treatments combine heat and lipid impregnation, partially filling microvoids and stabilizing the cellulose-lignin network. [13] demonstrated that this technique increases rigidity and limits compression deformation in bamboo, while [14] reported warmer, more saturated wood hues with improved color retention under light exposure. These effects are attributed to the protection of cellulose microfibrils by oil and reduced polysaccharide chain mobility, stabilizing the wood mechanically and dimensionally [15,16]. Moreover, as [17] highlighted, the presence of oil during heating limits the hydrolysis of hemicellulose acetyl groups, thereby strongly restricting the formation of dark, water-repellent furanic resins, which are otherwise generated under hydrothermal conditions and contribute to intense darkening and microstructural changes.
Despite these advances, the combined effects of temperature and duration on the physical, hygroscopic, colorimetric, and mechanical properties of Dabema remain insufficiently elucidated in a direct comparative study. Previous work often focused on a single treatment type or a limited number of properties, precluding a comprehensive comparison. [18] reported that hydrothermal treatment greatly reduces water absorption while increasing brittleness in Afrormosia and Newtonia, whereas [8] observed that oleothermal treatment enhances internal cohesion and stabilizes color in tropical species. Systematic comparisons under identical experimental parameters remain lacking, limiting objective evaluation of the advantages and drawbacks of each treatment for this species. Based on the literature, moderate oleothermal treatments are expected to simultaneously improve mechanical strength and dimensional stability, whereas hydrothermal treatments primarily increase rigidity and darken the wood, potentially reducing flexibility at high temperatures [19,20,21,22]. These hypotheses, however, require rigorous experimental verification for Dabema.
In order to fill these gaps, this study aims to systematically characterize and compare the effects of hydrothermal and oleothermal treatments applied across a controlled range of temperatures and durations on the mechanical properties of Dabema. Simultaneous evaluation of physical, hygroscopic, colorimetric, and mechanical properties will provide an integrated understanding of the material’s behavior [23,24]. TG/DTG will elucidate underlying mechanisms by linking property changes to chemical transformations [25,26].
Finally, optimal treatment conditions will be identified using advanced statistical tools. PCA will cluster samples based on similarities in mechanical properties [27,28], while RSM will model and optimize treatment parameters to maximize mechanical performance while controlling color variations. By integrating hydrothermal and oleothermal treatments with multivariate analysis of mechanical properties, this study aims to demonstrate that controlled and optimized treatments can balance dimensional stability, hydrophobicity, and mechanical performance of Dabema. The results will provide a solid, quantitative scientific foundation for developing energy-efficient industrial processes and support the sustainable utilization of Dabema in high-value applications such as furniture and construction.
2. Material and Methods
2.1. Raw Materials
Wood used in this study was heartwood of Dabema (Piptadeniastrum africanum, family Fabaceae), a tropical tree native to Central and West Africa, commonly employed in carpentry and local construction. At 12 % moisture content, the heartwood exhibited a density of 0.70-0.85 g/cm³, a total tangential shrinkage of 8.5 %, a radial shrinkage of 3.8 %, and moderate natural durability against lignicolous fungi causing brown and white rot [9,29]. Wood is characterized by a straight to slightly interlocked grain, a fine to medium texture, and a light to reddish-brown color, with a clearly distinguishable, lighter-colored sapwood. Its mechanical properties support structural applications, with a modulus of rupture (MOR) of 60-100 MPa, a modulus of elasticity (MOE) of 8-12 GPa, and axial compression strength of 40-60 MPa [1]. Distilled water, neutral (pH ≈ 7), particle-free, and with negligible mineral content, was used for hydrothermal treatment to ensure reproducibility and uniform thermal modifications. Mayor peanut oil (Cameroon) was employed for oleothermal treatment; its typical properties are a density of 0.88-0.91 g·cm3 at 20 °C, kinematic viscosity of 30-60 mm2/s at 40 °C, free fatty acid content <0.5 % FFA, peroxide value <10 meq O2/kg, smoke point of 180-230 °C, and flash point >200 °C. Oil was verified prior to use for homogeneity and absence of oxidation, ensuring stable and controlled experimental conditions.
2.2. Hydrothermal and Oleothermal Modification of Dabema
Heartwood specimens of Dabema, conditioned at 12% moisture content, were subjected to hydrothermal and oleothermal treatments in an autoclave installed in an electric oven (HERAEUS D-6450 Hanau) following the same thermal cycle. A total of 285 specimens were processed for each treatment method, corresponding to 15 specimens for each combination of temperature and duration. For hydrothermal treatment, the specimens were placed in the autoclave containing water to generate a saturated steam atmosphere, whereas for oleothermal treatment, they were immersed in vegetable oil preheated to 50 °C, with an initial vacuum application (-0.08 MPa, 30 min), gentle agitation (≈ 60 rpm, 20 min), and an additional one-hour immersion at 50 °C to enhance oil penetration. In both cases, heating was performed from 50 °C to the target temperature (100-220 °C) at a rate of 5 °C/min, followed by an isothermal holding period of 2 h, 3.5 h, or 5 h, and then a controlled cooling at 10 °C/h down to 70 °C, before natural cooling to 50 °C. The autoclave provided a controlled, low-oxygen atmosphere, saturated with steam for hydrothermal treatment and filled with oil for oleothermal treatment, thereby preventing oxidation. The selected temperature and duration ranges align with recommendations for studying thermal modifications in tropical woods and for observing the progressive degradation of hemicelluloses as well as the resulting physical and mechanical changes in the wood [8].
2.3. Colorimetric and Physical Properties of Modified Wood
Wood samples measuring 80 × 20 × 10 mm3 (Figure 2) for colorimetric tests and 20 × 20 × 20 mm3 (Figure 1) for the evaluation of physical properties were prepared to investigate the effects of hydrothermal and oleothermal treatments, temperature (100, 160, and 220 °C), and treatment duration (2, 3.5, and 5 h) on the chromatic and physical characteristics. After treatment, the samples were conditioned at 28 ± 2 °C and 80 ± 5 % relative humidity until reaching a constant weight. Colorimetric measurements (L*, a*, b*) were performed using an SC30 colorimeter (Figure 2) on each tangential face, with four repetitions per face. Color variations (ΔE*), chroma (C*), and hue angle (h) were calculated according to the CIELab model:
Changes followed [30,31]. Physical properties, including hygroscopic equilibrium density (HED), equilibrium moisture content (EMC), volumetric shrinkage and swelling (VSH, VSW), and water absorption (WA), were determined after oven-drying the samples at 103 ± 2 °C, based on dry and saturated masses and volumes using the Archimedes method and in accordance with NF B 51-005 (1985). Each test was conducted on five (05) samples to ensure reliability of the results.
where M (g) represents the mass of the specimen, while V (cm³) represents its volume.
where W1 represents the oven-dry weight (g), while W2 represents the constant weight after reconditioning (g).
where VS is the volume in cm3 of the saturated specimen, and V0 is the volume in cm3 of the oven-dry specimen.
where VS is the volume in cm3 of the saturated sample, and V0 is the volume in cm3 of the oven-dry specimen.
where Ms (g) represents the saturated mass of the test piece, while Mo (g) represents its anhydrous mass.
2.4. Morphology of Wood Before and After Modification
Surfaces of the reference samples as well as those subjected to hydrothermal and oleothermal treatments of Dabema were examined using a binocular microscope (Olympus SZ51). Prior to observation, samples from the nineteen (19) experimental groups (G1 to G19) were prepared by microtome sectioning to obtain smooth and comparable surfaces. Analyses were conducted at a magnification corresponding to a 100 μm field of view. For each section, three (03) independent observations were performed, allowing for a qualitative assessment of the effects of the applied treatments on the wood microstructure, in comparison with the reference samples.
2.5. Mechanical Properties of the Modified Wood
Mechanical tests were carried out in accordance with the Chinese standards GB/T 1935–2009, GB/T 1936-2009, and GB/T 1938–2009 (Figure 3), corresponding to the evaluation of compression, bending, and tensile properties, respectively. A three-point bending configuration was adopted for the flexural tests. Prior to testing, all specimens were conditioned at 25 ± 2 °C and 82 ± 5% RH for 24 h. A total of (285) specimens were prepared for each mechanical test (compression, three-point bending, and tensile), corresponding to (15) replicates for each combination of treatment temperature and duration. Mechanical characterization was conducted in Bamenda (5° 57' 34.92" N; 10° 08' 45.49" E) using a LARYEE universal testing machine (model UE3450-300 kN), featuring a precision of ±0.5% and a crosshead speed of 2 mm·min⁻¹, ensuring stable and reliable loading conditions.
2.6. Multivariate Analysis (PCA, HCA) and RSM Optimization of Dabema Wood Treatments (Piptadeniastrum africanum)
Study focused on Dabema wood, including reference samples as well as samples treated hydrothermally or oleothermally at three temperatures (100, 160, and 220 °C) and three treatment durations (2, 3.5, and 5 h). Data from mechanical tests (compression, bending, and hardness) were centered and scaled to eliminate the influence of differences in variable scales [32], using the transformation:
zi, xi, Sx, and represent, respectively, the standardized value, the original value, the standard deviation, and the mean.
2.6.1. Principal Component Analysis (PCA)
PCA was applied to group and visualize the samples based on their mechanical properties. The correlation matrix R was used, with coefficients calculated as follows:
The eigenvalues λk and their associated eigenvectors were used to extract the components that maximize the explained variance [28]. The selected axes followed the Kaiser criterion (λk) and a cumulative inertia threshold to ensure a reliable representation. Contributions, variable–axis correlations, and cos2 values were used to interpret the distribution of samples, whether reference or treated, on the factorial planes.
2.6.2. Hierarchical Cluster Analysis (HCA)
To complement the analysis, an HCA was performed on the factor coordinates derived from the PCA, which enhances the robustness of the classification by eliminating redundancy among variables [27]. The similarity between two samples, j and k, was evaluated using the Euclidean distance:
The resulting dendrogram allowed for the characterization of natural groupings among the samples and distinguished the effects related to hydrothermal and oil-heat treatments, as well as the reference state, according to the treatment temperature and duration.
2.6.3. Statistical Analysis and RSM
Data were processed using Microsoft Excel 10, SPSS 2.0, and Design-Expert (2021, version 13.05.0*64). A two-way ANOVA was performed to evaluate the effects of temperature and treatment duration on mechanical properties. Dunnett’s test was used to compare treated samples with reference samples. Normality and homogeneity of variances were verified using the Shapiro-Wilk and Bartlett tests at a 5% significance level, with α = 0.05 applied [3]. Following this analysis, The Response Surface Methodology (RSM) was implemented using a Central Composite Design (CCD) to optimize the combined effects of treatment temperature and duration on the mechanical properties of Dabema wood. The CCD included two factors (temperature and time) at five levels each, coded as –α, –1, 0, +1, and +α, to capture both linear, quadratic, and interaction effects. The design consisted of four factorial points, four axial points, and five center points, providing a total of 13 experimental runs per mechanical property. The selection of axial and center points ensured adequate estimation of curvature and reproducibility of the measurements. The following polynomial model was used:
where β0 is the model constant, β1 and β2 represent the linear effects of temperature and duration, β11 and β22 capture the quadratic (nonlinear) effects of each factor, β12 corresponds to the interaction effect between temperature and duration, and ε is the model residual error.
Y = β0 + β1T + β2t + β11T2 + β22t2 + β12Tt + ε
2.7. TG/DTG Thermogravimetric Analyses
Thermogravimetric analysis (TGA) coupled with differential thermogravimetry (DTG) was performed on Dabema (Piptadeniastrum africanum) powder samples to evaluate thermal stability and decomposition behavior. Approximately 10 mg of oven-dried, sieved powder (<100 µm) were heated from 30 °C to 900 °C at a rate of 10 °C/min under a nitrogen atmosphere (50 mL/min) using a NETZSCH STA 449 F3 analyzer. Mass loss curves and their derivatives were analyzed with Proteus software to identify characteristic degradation stages, including moisture loss, hemicellulose depolymerization, cellulose pyrolysis, and lignin decomposition, consistent with patterns observed for lignocellulosic materials [11,25,26]. Triplicate measurements and the use of an empty crucible ensured reproducibility and baseline correction [11].
3. Results and Discussion
3.1. Colorimetric and Physical Properties of Modified Wood
Hydrothermal and oil-heat treatments induce significant colorimetric changes in Dabema wood, as evidenced by variations in L*, a*, b*, ΔE*, C*, and h° parameters (Table 1). Lightness (L*) decreases sharply compared to the control sample, which measured 62.14. After hydrothermal treatment, L* ranges from 32.56 to 39.40, and after oil-heat treatment from 33.44 to 50.36. This decrease indicates pronounced darkening, typical of deep thermal transformations of the lignocellulosic structure. These observations are consistent with [18], who reported that heating wood in air or oil significantly reduces L*, especially at high temperatures.
For the red-green axis (a*), the responses differ according to the treatment. Hydrothermal treatment results in negative values, from -0.84 to -0.16, indicating a shift toward cool, greenish to bluish tones, particularly between 160 and 220 °C. Oil-heat treatment enhances red tones, with values ranging from 6.00 to 12.08. This intensification of warm hues is related to the decomposition of cell wall components and oxidation of extractives, as noted by [8]. On the yellow-blue axis (b*), hydrothermal treatment markedly reduces yellow tones, from 11.94 in the control to 1.08-7.36. Oil-heat treatment maintains or slightly enhances warm hues at low temperatures, before decreasing at high temperatures. These results align with [14], who observed a decrease in b* at high temperatures during oil treatments of tropical woods.
Overall color changes (ΔE*) confirm the magnitude of these transformations. Hydrothermal treatment produces very high ΔE* values, from 30.37 to 32.75, indicating drastic color shifts. Oil-heat treatment causes significant but more moderate changes, from 15.65 to 25.76, consistent with [14], who reported increasing ΔE* with treatment temperature and duration. Hue angle (h°) illustrates the chromatic divergence of the two treatments (Table 1), with low or negative values, from -32.47 to -3.01°, observed under hydrothermal treatment corresponding to dark, cool tones, while high values, from 31.91 to 59.23°, in oil-heat treatment indicate warm, saturated hues.
These profound chromatic differences are closely linked to underlying chemical reactions. Under hydrothermal conditions, the acidic environment generated by the hydrolysis of acetyl groups in hemicelluloses catalyzes the formation of furanic compounds through the rearrangement and degradation of hemicelluloses [17]. These furanic compounds subsequently condense into dark, water-repellent furanic resins, explaining the pronounced darkening of hydrothermally treated specimens as well as the sharp reduction in their equilibrium moisture content (EMC) [3,14]. The formation of these resins also contributes to the development of microcracks within the cell walls due to structural rearrangements (Figure 4). In contrast, during oil-heat treatment, the presence of oil limits the hydrolysis of acetyl groups by preventing direct water-wood contact and reducing oxygen availability [8]. Consequently, the formation of furanic resins is highly restricted, with only very small amounts forming, resulting in much lighter coloration and more moderate chemical transformations. This protective effect of oil, also observed by [17], highlights that furanic synthesis is favored in aqueous, higher-oxygen environments, whereas oleothermal conditions effectively suppress these reactions.
This contrast is explained by hemicellulose degradation, reduction of hydroxyl groups, and formation of oxidation products, as indicated by [8]. Hydrothermal treatment thus cools and darkens the wood, whereas oil-heat treatment warms and visually stabilizes its color, consistent with [3] on Eyong wood, confirming the structuring effect of hydrothermal treatments on color and density.
Physical and hygroscopic properties are also modified. Density remains stable, between 928 and 1070 kg/m³, showing no major structural degradation (Table 1). A slight increase is observed in some oil-heat treatments, up to 1070 kg/m³, suggesting a lipid impregnation effect and partial filling of anatomical cavities, as reported by [14]. Equilibrium moisture content (EMC) decreases sharply compared to the control, from 13.16 % to 7-10 % at 100 °C, 5-8 % at 160 °C, and 4.8-6.0 % at 220 °C, reflecting reduced hygroscopicity and improved dimensional stability. These trends align with [4,5], who showed that EMC decreases with increasing temperature and treatment duration.
Hydrothermal and oil-heat treatments also improve water stability. Shrinkage indices VSH and VSW confirm these observations. VSH drops from 15.80 % in the control to 6-8 % at 220 °C under hydrothermal treatment and to 4.2-5.5 % under oil-heat treatment. VSW decreases from 20.50 % to 6.7-5.4 %, indicating a significant reduction in volumetric shrinkage. These results are consistent with [18], who noted the hydrophobic effect of fatty acids in oil-treated wood. Water absorption (WA) is strongly limited, decreasing from 78 % in the control to 25-33 % at 220 °C under hydrothermal treatment and 17-23 % under oil-heat treatment. The oil protects the wood by limiting water penetration, as confirmed by [18].
Overall, thermal treatments, particularly oil-heat treatment, confer remarkable dimensional and water stability to Dabema wood. They reduce hygroscopicity, limit water absorption, and enhance durability. These physicochemical modifications are associated with the reduction of hydroxyl groups in the cell wall, contributing to the wood’s resistance and longevity under demanding environmental conditions.
3.2. Morphology of Wood Before and After Modification
Hydrothermal and oil-heat treatments strongly modify the structure and mechanical properties of Dabema wood (Piptadeniastrum africanum). After hydrothermal treatment at 160 °C for 5 h, the vessels appear largely emptied (Figure 4). This phenomenon indicates significant leaching and the removal of parietal contents. At 220 °C-5 h, microcracks form in the cell walls, revealing high hygromechanical stress and thermal degradation of hemicelluloses and the lignocellulosic matrix. [10] observed similar phenomena in various tropical woods. [33] reported for teak (Tectona grandis) a decrease in bending modulus by 10 to 25 % and the formation of microcracks comparable to those observed in Dabema.
Oil-heat treatment at 220 °C-5 h, in contrast, better preserves the structure. The cavities are partially filled with oil, reducing water exchange and limiting microcrack formation [8,17]. The cell walls remain intact. Density reaches 1070 kg/m3 (Oleo160°5 h and Oleo220°5 h). These observations are consistent with [8] for Pinus sylvestris and Quercus robur, and [15] for Populus spp., where density increased by 5 to 12 % after oil treatment. This lipid impregnation reinforces parietal cohesion and mechanical strength.
Water-related properties show significant changes. Equilibrium moisture content (EMC) decreases from 13.16 % for the control to 7-10 % at 100 °C, 5-8 % at 160 °C, and 4.8-6 % at 220 °C after hydrothermal treatment (Table 1). After oil-heat treatment at 220 °C, EMC reaches 4.8-5.8 %. The water stability indices VSH and VSW drop from 15.80 % and 20.50 % to 6-8 % and 6.7 % after hydrothermal treatment, and to 4.2-5.5 % and 5.4 % after oil-heat treatment. Swelling and volumetric shrinkage are thus significantly reduced. Water absorption drops from 78 % (Ref) to 25-33 % after hydrothermal treatment and 17-23 % after oil-heat treatment. These results confirm [18] on Afrormosia elata and Newtonia spp., where oil limits water absorption and stabilizes dimensions.
Hydrothermal treatment induces partial mechanical weakening, vessel emptying, and microcrack formation. Oil-heat treatment, on the other hand, stabilizes the anatomical structure, reinforces parietal cohesion, improves density and mechanical strength, and reduces hygroscopicity [3,14]. These effects are consistent with the findings of [3] on Eyong wood (Eribroma oblonga), which highlight the improvement of physical and water stability after hydrothermal treatment depending on pH.
3.3. Mechanical Properties of the Modified Wood
3.3.1. Multivariate Analysis (PCA, HCA) and RSM Optimization of Dabema Wood Treatments (Piptadeniastrum africanum)
PCA applied to samples subjected to hydrothermal and oil-heat treatments clearly distinguishes their overall mechanical performance. The F1-F2 axes exhibit very high representativity, with 97.97 % for compression, 98.51 % for bending, and 96.97 % for tensile (Figure 5, Figure 6, Figure 7, Figure 8). Axis F1 primarily reflects stiffness and strength (MOE and σ), while axis F2 represents variations in elongation at break (ε) and flexibility (Table 2). [32] demonstrated that PCA effectively extracts dominant factors from complex datasets, explaining the high variance captured by F1. [28], working on groundwater mineralization and pollutants, showed that F1 aggregates the major contributions while F2 isolates secondary effects. Our results follow the same logic of separation between stiffness, strength, and ductility.
Cluster 1 groups moderate oil-heat treatments between 100 and 160 °C. In bending, F-MOR and F-MOE losses remain limited to 10-25 %, with ductility preserved and microstructure intact. In tensile and compression, performance ranges from intermediate to high (Figure 9d, Figure 9e, Figure 9f). Compression elongation varies from 1.95 to 4.96 mm, with an average of 3.03 mm ± 0.97 mm and mean strength of 2292 MPa ± 130 MPa (Table 2, Table 3). Clusters C1-C2 exhibit strong strength reduction (-40 to -70 %), whereas C3-C5 maintain higher stiffness (mean MOE 49461.36 MPa ± 13540.12 MPa). [22] on poplar and beech showed that moderate treatments cause minor MOR and MOE reductions while maintaining mechanical stability. [27] demonstrated that moderate temperatures enhance density, cohesion, and stiffness in thermochemically modified tropical sawdust briquettes, explaining the favorable strength-ductility combination in this cluster. Lignin–cellulose crosslinking and crack reduction enhance internal cohesion.
Cluster 2 includes prolonged hydrothermal treatments or those at lower temperatures (100-160 °C). F-MOR and F-MOE losses reach 40-60 %, while F-ε increases by 50-120 %, reflecting notable plasticization and material weakening. Bending elongation ranges from 1.26 to 2.78 mm (mean 2.10 mm ± 0.42 mm) and strength averages 67.6 MPa ± 10 MPa
Cluster 3 shows intermediate performance, with F-MOR and F-MOE losses limited to 10-25 % and moderate ductility (Figure 9d, Figure 9e, Figure 9f). Some hydrothermal and oil-heat treatments produce properties comparable to the highest-performing clusters (Figure 9a, Figure 9b, Figure 9c). [35] on Western hemlock demonstrated that precise temperature control achieves a solid compromise between stiffness, hardness, and fracture energy despite moderate bending losses, which aligns with Cluster 3 outcomes. This cluster also highlights treatment substitution possibilities; for example, a hydrothermal treatment at 100 °C for 2 h can be replaced by an oil-heat treatment at 160 °C for 3.5 h, achieving similar losses with significant energy savings.
High-performance clusters 4 and 5 include the most severe oil-heat treatments, such as Oleo200°3.5 h, Oleo220°5 h, and Oleo160°5 h. Here, F-MOE remains high (90-110 %), occasionally with gains of 10-20 %, and F-MOR losses are limited, often below 10-20 %. These results indicate maximum stiffness, excellent dimensional stability, and consolidated microstructure (Table 3). [36] on Taurus cedar showed that severe treatments induce pronounced hydrophobization, strong OH group reduction, and notable mechanical stability improvement. [22] indicated that relative lignin densification at high temperature strongly increases stiffness. Observed performances align with these mechanisms.
Overall, moderate oil-heat treatments improve MOR, MOE, and ductility simultaneously, while high-temperature hydrothermal treatments primarily enhance stiffness, sometimes at the expense of strength and flexibility. Prolonged low-temperature treatments and reference samples show the lowest performance, with F-MOR and F-MOE losses of 40-60 % and F-ε increasing 50-120 %. Tensile elongation ranges from 1.56 to 4.67 mm (mean 2.45 mm ± 0.70 mm) and mean strength is 48.6 MPa ± 7.76 MPa (Table 2, Table 3). Clusters C1-C2 are highly sensitive to treatments, losing considerable strength and stiffness (mean MOE 402.8 MPa ± 69.6 MPa). [37] demonstrated that PCA effectively differentiates Chinese wood species by stiffness, density, and strength, confirming that thermal treatments strongly structure property distribution in the factor space. Similarly, [38] showed that fiber cohesion and density directly control mechanical performance in twelve Congo Basin species, explaining the superiority of oil-heat clusters, which maintain more coherent and stable microstructures. These results suggest that combining treatment type, temperature, and duration enables targeted modulation of mechanical properties, offering opportunities for energy-efficient optimization and process substitution depending on application requirements.
3.3.2. Mechanical Behavior Modeling
Quadratic regression models established for compression, bending, and tensile tests on samples subjected to hydrothermal and oil-heat treatments exhibit high coefficients of determination (R²), ranging from 0.90 to 0.93. This indicates a strong explanatory power of the independent variables, particularly temperature (T) and time (t), which account for over 90 % of the observed variability (Figure 10a, Figure 10b, Figure 10c). Two-way ANOVA applied to hydrothermal and oil-heat treatments highlights contrasting effects of temperature and duration depending on the mechanical loading mode (Eq13, Eq14, Eq15, Eq16, Eq17, Eq18). For hydrothermal treatments, treatment duration significantly affects compression and bending, with p-values of 4.7E-2 and 2.7E-2, respectively, and 95 % confidence intervals excluding zero ([1.15; 141.96] for compression and [0.58; 7.08] for bending), confirming a positive influence of prolonged treatment (Table 4, Table 5, Table 6). In contrast, temperature does not significantly affect these properties, as indicated by p-values greater than 0.15 and CIs including zero ([-108.93; 31.88] for compression and [-1.18; 5.31] for bending).
For oil-heat treatments, temperature is the dominant factor, with p-values of 0.0056 and 0.0126 for compression and bending and 95 % CIs not including zero ([13.60; 54.43] and [-11.92; -2.02]), while duration shows no significant effect (CI includes zero). For tensile strength, neither temperature nor duration produces measurable effects, with p-values above 0.15 and 95 % CIs including zero, indicating stability of this property under treatment (Table 4, Table 5, Table 6). These findings suggest that mechanical variations depend on treatment type and loading mode: hydrothermal effects are primarily driven by duration through hydrolysis and cell wall relaxation phenomena [6,10,33], oil-heat effects are mainly temperature-driven via thermo-oxidative reactions [8], while tensile behavior remains stable, reflecting the strength of longitudinal fiber bonds.
In compression, hydrothermal treatment (R² = 0.90) shows a marked influence of temperature (β = -6.97, p = 1.26E-2) and quadratic terms T² (β = -13.61, p = 3.1E-3) and t² (β = -9.07, p = 0.0217), with strength decreasing as treatment conditions deviate from the optimum [3]. Oil-heat compression treatment (R² = 0.91) is mainly influenced by immersion duration (β = 71.55, p = 4.72E-2), and the Tt interaction (β = -139.77, p = 3.15E-2) highlights strong sensitivity under extreme temperature and time combinations [8,15].
In bending, hydrothermal treatment (R² = 0.92) is dominated by temperature (β = 34.01, p = 0.0056) with notable contributions from quadratic terms T² (β = -83.30, p = 3E-4) and t² (β = 79.43, p = 4E-4). Oil-heat treatment (R² = 0.90) shows control by quadratic effects T² and t² (β ≈ -8.16 and -16.84, p ≤ 0.012), governing stress variation [8]. For tensile tests, hydrothermally treated samples (R² = 0.92) display strong dependence on temperature and quadratic effects, whereas oil-heat samples (R² = 0.93) demonstrate markedly higher mechanical stability [3]. This confirms the predominance of quadratic effects, the existence of a narrow optimization window for thermal and temporal parameters, and superior model coherence for oil-heat treatments.
According to [10], hydrothermal treatment modifies the chemical structure of wood, enhancing dimensional stability but reducing strength beyond a critical threshold. [33] demonstrated that combining moist heat and microwaves optimizes teak bending properties by minimizing structural degradation. Oil-heat treatment, combining thermal transfer with lipid compounds, provides a protective effect comparable to tannins described by [2], stabilizing the lignocellulosic matrix. [3] showed that controlling pH and thermal parameters optimizes color and physical properties without compromising strength. Therefore, the combination of heat and lipids is highly effective for improving durability and mechanical performance, relying on well-established chemical and physical mechanisms [16,33].
In addition, the kinetic modelling work of [39] provides further support for this interpretation. Their results demonstrate that lignocellulosic materials exhibit thermal reaction rates that are highly sensitive to the heating regime (isothermal, non-isothermal, or stepwise). Even slight deviations in temperature or exposure time can shift degradation pathways, which is consistent with the strong quadratic responses and the narrow optimization window observed in our hydrothermal and oil-heat treatments.
Y (Hydro.compression) = 2043.52 − 38.53T + 71.55t + 199.32T2 + 117.67t2 − 139.77Tt
Y (Oleo.compression) = 2282.08 − 34.01T − 1.1883t − 83.30T2 + 79.43t2 + 5.65Tt
Y(Hydr;bending) = 80.81 + 2.07T + 3.83t − 9.72T2 − 7.51t2 + 4.21Tt
Y (Oleo.bending) = 88.76 − 6.97T + 2.70t − 13.61T2 − 9.07t2 − 4.08Tt
Y (Hydro.tensile) = 79.88 + 3.44T − 1.48t - 25.98T2 − 2.73t2 − 2.71Tt
Y(Oleo.tensile) = 77.10 + 2.04T − 1.26t − 8.16T2 − 16.84t2 + 0.8425Tt
3.3.3. Mechanostructural Effects of Hydrothermal and Oleothermal Treatment on Mechanical Performance
Compression, three-point bending, and tensile tests reveal that hydrothermal and oil-heat treatments induce distinct mechanical responses (Table S1), closely linked to modifications in the cell wall and lignocellulosic structure. In compression, reference samples exhibit ε = 0.07 mm, σ = 2392.79 MPa, and a MOE of 38674.38 MPa. Hydrothermal treatment produces divergent behaviors: Hyd100°2h reduces MOE to 26092.67 MPa and σ to 2156.04 MPa, whereas Hyd100°5h strongly increases MOE to 46196.71 MPa and σ to 2681.24 MPa (Figure 11a, Figure 11b, Figure 11c, Figure 11d, Figure 11e, Figure 11d). This duality reflects the combined effect of hemicellulose hydrolysis and lignocellulosic reorganization, as shown by [8]. [12] indicate that depending on time and temperature, hydrothermal treatment can either weaken the amorphous matrix or strengthen the cell wall via lignin condensation.
In this context, oil-heat treatment confirms a stabilizing effect. By reducing maximum deformation (ε = 0.03-0.04 mm) and increasing stiffness, it aligns with [13], who observed enhanced compression strength after hot oil impregnation. Oleo220°5h reaches the highest MOE (70836.52 MPa). These findings agree with [19], attributing improvement to relative increases in lignin and cellulose crystallinity, and with stabilizing mechanisms described by [15,16]. The oil limits hygroscopicity and reinforces lignin/cellulose cohesion, contributing to stiffening and reduced deformation. These observations demonstrate that hydrothermal and oil-heat treatments mobilize different but complementary structural processes, explaining the variability in mechanical responses.
In bending, reference samples present ε = 0.02 mm, σ = 65.39 MPa, MOE = 4271.69 MPa, and MOR = 71.56 MPa. Hydrothermal treatment slightly alters these properties (Table S1). Hyd100°2h reduces σ to 57.39 MPa, while Hyd100°5h increases MOR to 80.92 MPa, reflecting limited depolymerization under moderate hydrothermal conditions, as shown by [19,20,21,22,40] confirm that bending is minimally affected when hemicellulose degradation remains low and lignocellulosic rearrangements do not reach a critical threshold (Figure 11a, Figure 11b, Figure 11c, Figure 11d, Figure 11e, Figure 11d).
Conversely, oil-heat treatment consistently increases σ and MOR. For instance, Oleo100°3.5h exhibits σ = 83.51 MPa and MOR = 88.94 MPa, whereas Oleo220°3.5h presents σ = 76.77 MPa and MOR = 83.63 MPa. This confirms the stabilizing action of oil on microfibrils [40]. The combined effect of temperature and time produces a maximum MOE of 5751.59 MPa, consistent with [6] who show that oil-heat treatment reduces microcracking from dry thermal treatments and promotes cell-wall stiffening. These mechanisms are further supported by [13], demonstrating improved internal cohesion and reduced early failure under bending, and by [14], highlighting the role of thermal-lipid interactions in mechanical stabilization. Moreover, this stabilizing trend is strongly reinforced by the Cis (Figure 12), which remain significantly narrower under oil-heat treatment, indicating greater mechanical reliability and reduced structural variability compared with hydrothermal treatment.
In tensile, reference samples show ε = 0.24 mm, σ = 38.44 MPa, MOE = 177.11 MPa, and MOR = 90.65 MPa. Hydrothermal treatment temporarily improves resistance for Hyd220°2h (σ = 63.44 MPa, MOE = 502.11 MPa), but prolonged treatment Hyd220°3.5h reduces σ to 35.58 MPa and MOR to 36.89 MPa. [8,10] report that hydrothermal treatment initially restructures the chemical matrix, enhancing some mechanical properties, but beyond a time/temperature threshold, hemicellulose degradation and cellulose polymer cleavage cause a marked decline in strength.
Oil-heat treatment stabilizes stiffness and reduces maximum deformation (ε = 0.08-0.18 mm). Oleo160°3.5h exhibits σ = 55.00 MPa and MOR = 53.22 MPa, while Oleo220°2h reaches σ = 58.13 MPa and MOR = 69.80 MPa. These effects align with studies showing that oil impregnation combined with heat decreases hygroscopicity, partially fills pores, and limits polysaccharide chain mobility. [13,42] confirm the beneficial impact of oil-heat treatment on mechanical stability in bamboo and wood. Finally, partial cell wall filling and hygro-mechanical stabilization, as reported by [43], correspond with observed values. Impregnation reduces water/matrix exchange and limits hydrolytic weakening, explaining why oil-heat-treated samples retain higher stiffness and lower deformation than prolonged hydrothermally treated samples.
3.4. TG/DTG Thermogravimetric Analyses
Combined TG and DTG analysis of Dabema wood reveals a thermal degradation sequence typical of dense tropical hardwoods. It also highlights features linked to its chemical composition (Figure 13). An initial mass loss of 7.86 % occurs around 68 °C. A pronounced DTG peak confirms that this loss corresponds to the removal of free and bound water, indicating low initial hydration of the material. At 159 °C, the TG curve shows a moderate inflection, accompanied by a subtle DTG signal. This marks the onset of hemicellulose destabilization, a common phenomenon in highly acetylated woods. The release of acetic acid triggers secondary reactions. Between 268 and 287 °C, hemicellulose degradation intensifies. Mass loss reaches approximately 15.02 %, with a pronounced DTG peak, reflecting active polymer decomposition. This stage leads to the release of light volatile compounds and an increase in the wood’s initial porosity. These findings are consistent with [11], who highlight the thermal sensitivity of hemicelluloses and their key role in early mass losses of lignocellulosic biomaterials.
Major degradation phase occurs around 350 °C. TG records a 43.75 % drop, and DTG shows a sharp, intense peak. This indicates rapid cellulose pyrolysis and a high proportion of crystalline cellulose, in agreement with [25]. Between 380 °C and 600 °C, a slow transition is observed. The reduced TG slope and broad DTG shoulder indicate progressive lignin degradation. Lignin is an aromatic polymer that decomposes over a wide temperature range. Isoconversional analyses by [26] show that its variable activation energy results in slower degradation and a higher final residue. Above 600 °C, TG and DTG curves stabilize, corresponding to the formation of thermally stable aromatic char. This char reflects moderate ash content and condensed lignin. Studies on lignin-rich matrices [8,15] confirm that thermal stability persists well above 300 °C, producing dense and homogeneous char. These observations corroborate the kinetics recorded for Dabema wood.
TG/DTG profiles reported by [17] provides complementary insights. Moderate treatments, from 120 °C to 200 °C, cause only limited hemicellulose alteration, which explains the low or short-lived hydrophobicity at these temperatures. In contrast, above 200 °C, TG/DTG curves of beech and fir show strong attenuation of the DTG peak associated with hemicelluloses. This indicates significant polysaccharide degradation and the release of furanic monomers. These monomers can reorganize into thermally stable cross-linked structures. The formation of these furanic networks is the mechanism that imparts Dabema wood treated at high temperatures with durable hydrophobicity and reduced equilibrium moisture content (Figure 14, Figure 15 and Figure 16). The shift of TG curves toward increased stability, also observed by [17], confirms the formation of these structures. They depend on exceeding the critical hemicellulose depolymerization threshold rather than on the wood species. Thus, Dabema wood exhibits mass losses of 7.86 %, 15.02 %, and 43.75 %, with peaks at 68 °C, 159 °C, 268 to 287 °C, and around 350 °C, followed by stabilization above 600 °C. These thermal signatures fully align with established lignocellulosic degradation models. They reflect strong polysaccharide cohesion and a particularly resistant lignin fraction.
4. Conclusion
Hydrothermal and oil-heat treatments applied to Dabema wood (Piptadeniastrum africanum) significantly enhance its dimensional stability and water resistance while modulating its chromatic and mechanical properties. PCA analysis reveals distinct clustering of samples according to treatment parameters, correlated with their mechanical performance. RSM optimization identifies operational conditions that maximize mechanical strength while controlling color variations.These findings highlight the underlying structural mechanisms, including thermal degradation of hemicelluloses and stabilization of the cellulose-lignin network through lipid impregnation, providing a theoretical framework for the development of targeted treatments. This work opens avenues for optimizing thermo-lipidic combinations, extending the approach to other tropical species, and developing predictive behavior models, contributing to the sustainable valorization of Dabema wood in demanding construction and furniture applications.
Author Contributions
John Nwoanjia: Data curation, Writing – original draft, Data curation, Formal analysis, Data analysis, Software. Jean Jalin Eyinga Biwôlé: Data curation, Formal analysis, Data analysis, Software, Writing – original draft, Review and editing. Joseph Zobo Mfomo: Formal analysis, Supervision, Conceptualization, Resources, Validation. Joel Narcisse Bebga: Writing – original draft, Formal analysis, Resources. Desmond Mufor Zy: Formal analysis, Data analysis, Resources. Junior Maimou Nganko: Formal analysis, Data analysis, Resources. Yvan Sandy Nké Ayinda: Formal analysis, Data analysis, Resources. Pierre-Marie Tefack: Formal analysis, Data analysis, Resources. Antonio Pizzi: Project administration, Conceptualization, Resources, Validation. Ioanna A. Papadopoulou: Formal analysis, Supervision, Resources, Validation. Salomé Ndjakomo Essiane: Writing – original draft, Conceptualization, Resources, Validation. Antonios N. Papadopoulos: Writing – original draft, Supervision, Resources, Validation, Review and editing. Achille Bernard Biwolé: Writing – original draft, Supervision, Resources, Validation.
Declaration of Interest Statement
The authors declare that they have no known competing financial interests or personal relationships that could have appeared to influence the work reported in this paper.
Data Availability Statement
Data are contained and presented within the article.
Acknowledgments
The authors would like to thank Doctors Josias Georges Bessike and Benoît Ndiwe as well as Master’s student Gérard Tsida Tchoffo, for their material support during the execution of the experiments conducted for this work.
Conflicts of Interest
The authors declare no conflicts of interest.
References
- Nwoanjia, J.; Biwôlé, J.J.; Mfomo, J.Z.; Fongnzossie, E.F.; Pizzi, A.; Essiane, S.N.; Biwole, A.B. Physical, Mechanical and Chemical Properties as a Decision-Support Tool to Promote Alternative Woods: Case of Dabema (Piptadeniastrum africanum) in Cameroon. J. Renew. Mater. 2025, 13, 1123-1144. [CrossRef]
- Tomasi, I.T.; Santos, S.C.; Boaventura, R.A.; Botelho, C.M. Microwave-Assisted Extraction of Polyphenols from Eucalyptus Bark—A First Step for a Green Production of Tannin-Based Coagulants. Water 2023, 15, 317. [CrossRef]
- Biwôlé, J.J.; Biwôlé, A.B.; Tefack, P.M.; Ncharye, E.N.; Fedoung, E.F.; Bessike, J.G.; Nwoanjia, J.; Mewoli, A.E.; Pizzi, A.; Essiane, S.N.; et al. Eyong Wood (Eribroma oblonga), a Good Candidate for Hydrothermal Treatment: Optimization of Its Physical and Colorometric Properties under the Determinant pH Effect. Bioresour. Technol. Rep. 2025, 102148. [CrossRef]
- Hsieh, M.C.; Hung, K.C.; Xu, J.W.; Chang, W.S.; Wu, J.H. Characterization and Prediction of Physical Properties of Luanta Fir Wood with Vacuum Hydrothermal Treatment. *Polymers 2022, 14, 4374. [CrossRef]
- Gao, Y.; Li, Z.; Zhao, L.; Lyu, J. Effect of Heat Treatment on Hygroscopicity of Chinese Fir (*Cunninghamia lanceolata [Lamb.] Hook.) Wood. Forests 2024, 15, 630. [CrossRef]
- Hill, C.; Altgen, M.; Rautkari, L. Thermal Modification of Wood—A Review: Chemical Changes and Hygroscopicity. J. Mater. Sci. 2021, 56, 6581–6614. [CrossRef]
- Thybring, E.E.; Fredriksson, M.; Zelinka, S.L.; Glass, S.V. Water in Wood: A Review of Current Understanding and Knowledge Gaps. Forests 2022, 13, 2051. [CrossRef]
- Mandraveli, E.; Mitani, A.; Terzopoulou, P.; Koutsianitis, D. Oil Heat Treatment of Wood—A Comprehensive Analysis of Physical, Chemical, and Mechanical Modifications. Materials 2024, 17, 2394. [CrossRef]
- Biyo’o, R.; Biwole, A.B.; Moutou Pitti, R.; Nyobe, C.J.; Ndiwe, B.; Onana, E.J.; Yamb, E. Mode I Cracking of Three Tropical Species from Cameroon: The Case of Bilinga, Dabema, and Padouk Wood. Wood Mater. Sci. Eng. 2024, 19, 1234-1243. [CrossRef]
- Ali, M.R.; Abdullah, U.H.; Ashaari, Z.; Hamid, N.H.; Hua, L.S. Hydrothermal Modification of Wood: A Review. Polymers 2021, 13, 2612. [CrossRef]
- Nurazzi, N.; Asyraf, M.R.; Rayung, M.; Norrrahim, M.N.; Shazleen, S.S.; Rani, M.S.; Shafi, A.R.; Aisyah, H.A.; Radzi, M.H.; Sabaruddin, F.A.; et al. Thermogravimetric Analysis Properties of Cellulosic Natural Fiber Polymer Composites: A Review on Influence of Chemical Treatments. Polymers 2021, 13, 2710. [CrossRef]
- Adewopo, J.B.; Patterson, D.W. Effects of Heat Treatment on the Mechanical Properties of Loblolly Pine, Sweetgum, and Red Oak. For. Prod. J. 2011, 61, 526-535. [CrossRef]
- Hao, X.; Wang, Q.; Wang, Y.; Han, X.; Yuan, C.; Cao, Y.; Lou, Z.; Li, Y. The Effect of Oil Heat Treatment on Biological, Mechanical and Physical Properties of Bamboo. J. Wood Sci. 2021, 67, 26. [CrossRef]
- Suri, I.F.; Kim, J.H.; Purusatama, B.D.; Yang, G.U.; Prasetia, D.; Lee, S.H.; Hidayat, W.; Febrianto, F.; Park, B.H.; Kim, N.H. Comparison of the Color and Weight Change in Paulownia tomentosa and Pinus koraiensis Wood Heat-Treated in Hot Oil and Hot Air. BioResources 2021, 16, 5574-5585. [CrossRef]
- Haseli, M.; Efhamisisi, D.; Abdulkhani, A.; Oladi, R.; Ungerer, B.; Al-musawi, H.; Halmschlager, E.; Müller, U. Effects of Oil Heat Treatment on Poplar Wood Properties: A Pilot Scale Study. Constr. Build. Mater. 2024, 430, 136353. [CrossRef]
- Piao, X.; Zhao, Z.; Guo, H.; Wang, Z.; Jin, C. Improved Properties of Bamboo by Thermal Treatment with Wood Wax Oil. Colloids Surf. A Physicochem. Eng. Asp. 2022, 643, 128807. [CrossRef]
- Zhang B, Petrissans M, Petrissans A, Pizzi A, Colin B. Furanic Polymerization Causes the Change, Conservation and Recovery of Thermally-Treated Wood Hydrophobicity before and after Moist Conditions Exposure. Polymers. 2023 Dec 31;15(1):221. [CrossRef]
- Bessala, L.F.; Gao, J.; He, Z.; Wang, Z.; Yi, S. Effects of Heat Treatment on Color, Dimensional Stability, Hygroscopicity and Chemical Structure of Afrormosia and Newtonia Wood: A Comparative Study of Air and Palm Oil Medium. Polymers 2023, 15, 774. [CrossRef]
- Boonstra, M.J.; Van Acker, J.; Tjeerdsma, B.F.; Kegel, E. Strength Properties of Thermally Modified Softwoods and Its Relation to Polymeric Structural Wood Constituents. Ann. For. Sci. 2007, 64, 679–690. [CrossRef]
- Tjeerdsma, B.F.; Boonstra, M.; Pizzi, A.; Tekely, P.; Militz, H. Characterization of thermally modified wood: Molecular reasons for wood performance improvement. Holz Roh Werkst. 1998, 56, 149–153.
- Broda, M.; Popescu, C.-M.; Poszwa, K.; Mazela, B.; Maciejewski, H. How Thermal Treatment Affects the Chemical Composition and the Physical, Mechanical and Swelling Properties of Scots Pine Juvenile and Mature Wood. Wood Sci. Technol. 2024, 58, 1153–1180. [CrossRef]
- Perçin, O.; Yeşil, H.; Uzun, O.; Bülbül, R. Physical, Mechanical, and Thermal Properties of Heat-Treated Poplar and Beech Wood. BioResources 2024, 19, 7339-7353. [CrossRef]
- Zelinka, S.L.; Altgen, M.; Emmerich, L.; Guigo, N.; Keplinger, T.; Kymäläinen, M.; Thybring, E.E.; Thygesen, L.G. Review of Wood Modification and Wood Functionalization Technologies. Forests 2022, 13, 1004. [CrossRef]
- Christoforo, A.L. Wood Quality and Mechanical Properties. Forests 2024, 15, 1874. [CrossRef]
- Zhang, C.; Chao, L.; Zhang, Z.; Zhang, L.; Li, Q.; Fan, H.; Zhang, S.; Liu, Q.; Qiao, Y.; Tian, Y.; et al. Pyrolysis of Cellulose: Evolution of Functionalities and Structure of Bio-Char versus Temperature. Renew. Sustain. Energy Rev. 2021, 135, 110416. [CrossRef]
- El-Sayed, S.A.; Khass, T.M.; Mostafa, M.E. Thermal Degradation Behaviour and Chemical Kinetic Characteristics of Biomass Pyrolysis Using TG/DTG/DTA Techniques. *Biomass Conv. Bioref. 2024, 14, 17779–17803. [CrossRef]
- Nganko, J.M.; Koffi, E.P.M.; Kane, M.; Gbaha, P.; Yao, K.B. Application of Principal Component Analysis (PCA) to Assess the Influence of Thermochemical Treatment of Tropical Wood Sawdust on the Calorific, Mechanical, Physicochemical, and Combustion Properties of Fuel Briquettes. Biofuels 2024, 15, 1281–1294. [CrossRef]
- Nadjet, Z.; Abdelmonem, M.; Badra, A.; Lakhder, S.; Issam, Z.; Abderrahmane, K.; Nabil, M.; Salim, K.; Boualem, R. Multivariate Analysis of Groundwater Quality Using PCA and HAC: Geochemical Controls on Mineralization, Nitrification, and Pollutant Dynamics in the Southeastern Arid Region of Algeria. Desalin. Water Treat. 2025, 324, 101463. [CrossRef]
- Cirad. The Main Technological Characteristics of 245 Tropical Wood Species. 2017. Available online: https://tropix.cirad.fr/fiches-disponibles (accessed on 27 September 2013).
- HunterLab. Insight in Color. CIE L*, a*, b* Color Space. HunterLab Applications Note 1986, 8, 7.
- Hrčková, M.; Koleda, P.; Barcík, Š.; Štefková, J. Color Change of Selected Wood Species Affected by Thermal Treatment and Sanding. BioResources 2018, 13, 8956-8975. [CrossRef]
- Aït-Sahalia, Y.; Xiu, D. Principal Component Analysis of High-Frequency Data. *J. Am. Stat. Assoc. 2019, 114, 287–303. [CrossRef]
- Huang, D.; Shen, H.; Zhang, J.; Zhuo, X.; Dong, L. Effects of Hydrothermal–Microwave Treatment on Three-Point Bending Properties of Teak in Plantation. Front. Mater. 2024, 11, 1278707. [CrossRef]
- Arriaga, F.; Wang, X.; Íñiguez-González, G.; Llana, D.F.; Esteban, M.; Niemz, P. Mechanical Properties of Wood: A Review. Forests 2023, 14, 1202. [CrossRef]
- Nakagawa, T.; Poulin, E.; Rueppel, T.; Chen, Z.; Swinea, J.; O’Brien, M.; Houser, G.; Wood, G.; Weinheimer, M.; Bahmani, P.; et al. Effects of Thermal Modification on the Flexure Properties, Fracture Energy, and Hardness of Western Hemlock. *Wood Sci. Technol. 2024, 58, 109–133. [CrossRef]
- Tufan, M.Z.; Üner, B. Analysis of Heat-Treated Taurus Cedar (Cedrus libani) Wood Surface Properties with Fourier Transform Infrared (FTIR) Spectroscopy and Contact Angle Measurement. Drvna Ind. 2025, 76, 299-315. [CrossRef]
- Zhu, J.; Peng, H.; Lu, X.; Lyu, J.; Zhan, T. Classification of Principal Wood Species in China Based on the Physiomechanical Properties. J. Renew. Mater. 2023, 11, 1367-1382. [CrossRef]
- Ndiapi, O.; Njankouo, J.M.; Ohandja, L.M.A.; Gerard, J. Characterisation and Statistical Modelling of Shear Strength in 12 Hardwood Timber Species from the Congo Basin. *Bois For. Trop. 2024, 360, 27-40. [CrossRef]
- Fawzy, S.; Osman, A.I.; Farrell, C.; Al-Muhtaseb, A.A.; Harrison, J.; Al-Fatesh, A.S.; Fakeeha, A.H.; Rooney, D.W. Kinetic Modelling for Pyrolytic Conversion of Dedicated Short Rotation Woody Crop with Predictions for Isothermal, Non-Isothermal and Stepwise Heating Regimes. Appl. Energy Combust. Sci. 2022, 9, 100048. [CrossRef]
- Mehrabi, P.; Dackermann, U.; Siddique, R.; Rashidi, M. A Review on the Effect of Synthetic Fibres, Including Macro Fibres, on the Thermal Behaviour of Fibre-Reinforced Concrete. Buildings 2024, 14, 4006. [CrossRef]
- Tomak, E.D. Surface Wettability of Boron and Oil-Treated Wood. Cerne 2022, 28, e103058. [CrossRef]
- Liang, Z.; Jiang, H.; Tan, Y. A Review of Thermal Treatment for Bamboo and Its Composites. Green Process. Synth. 2024, 13, 20230263. [CrossRef]
- Salca, E.-A.; Kobori, H.; Inagaki, T.; Kojima, Y.; Suzuki, S. Effect of Heat Treatment on Colour Changes of Black Alder and Beech Veneers. J. Wood Sci. 2016, 62, 297–304. [CrossRef]
Figure 1.
Schematic of the hydrothermal and oleothermal treatment procedure for Dabema specimens.
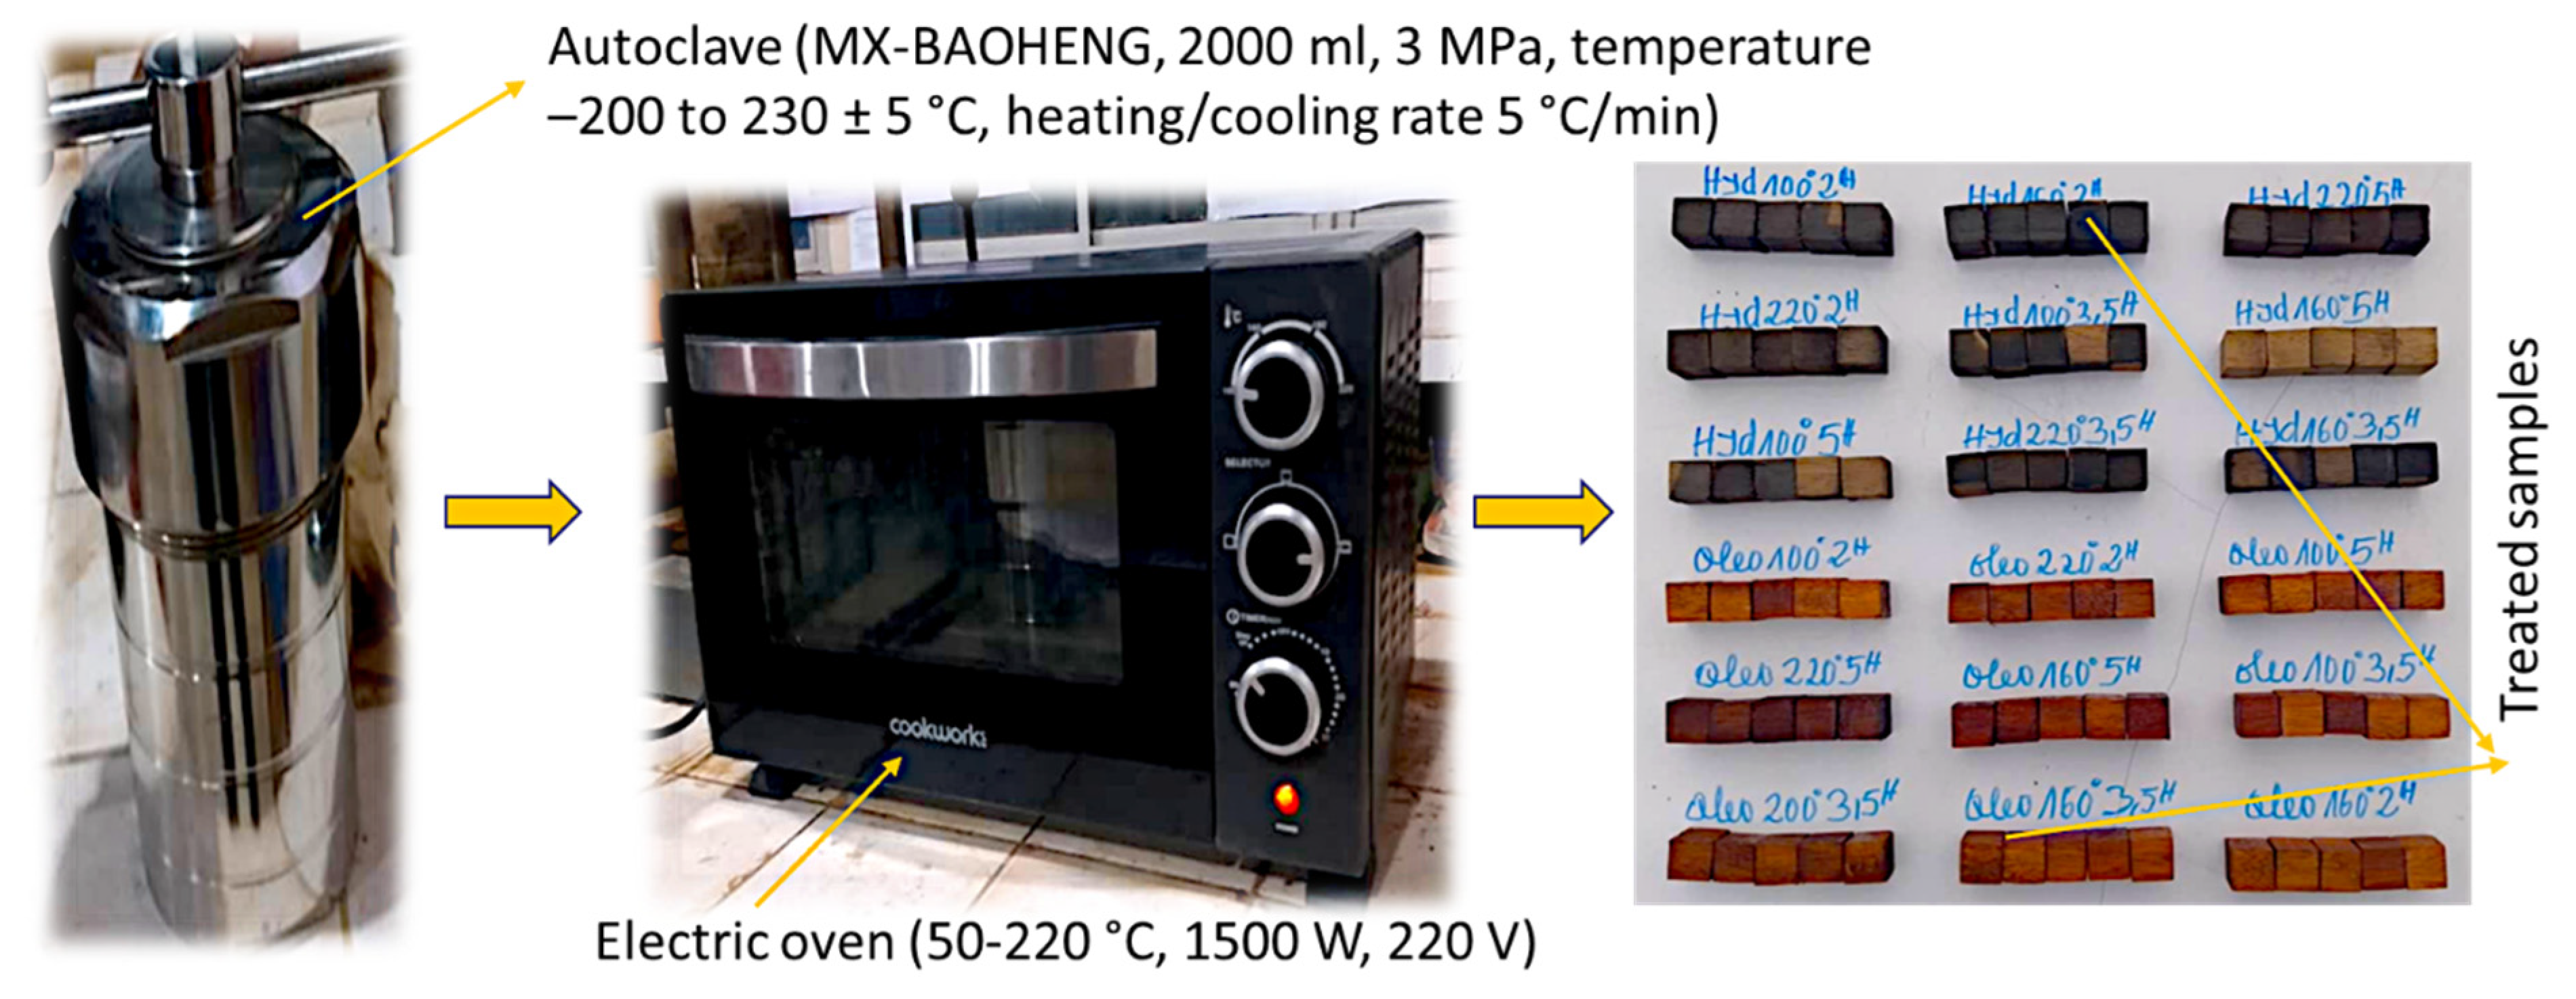
Figure 2.
Experimental setup for CIELab color measurements on treated and untreated Dabema.
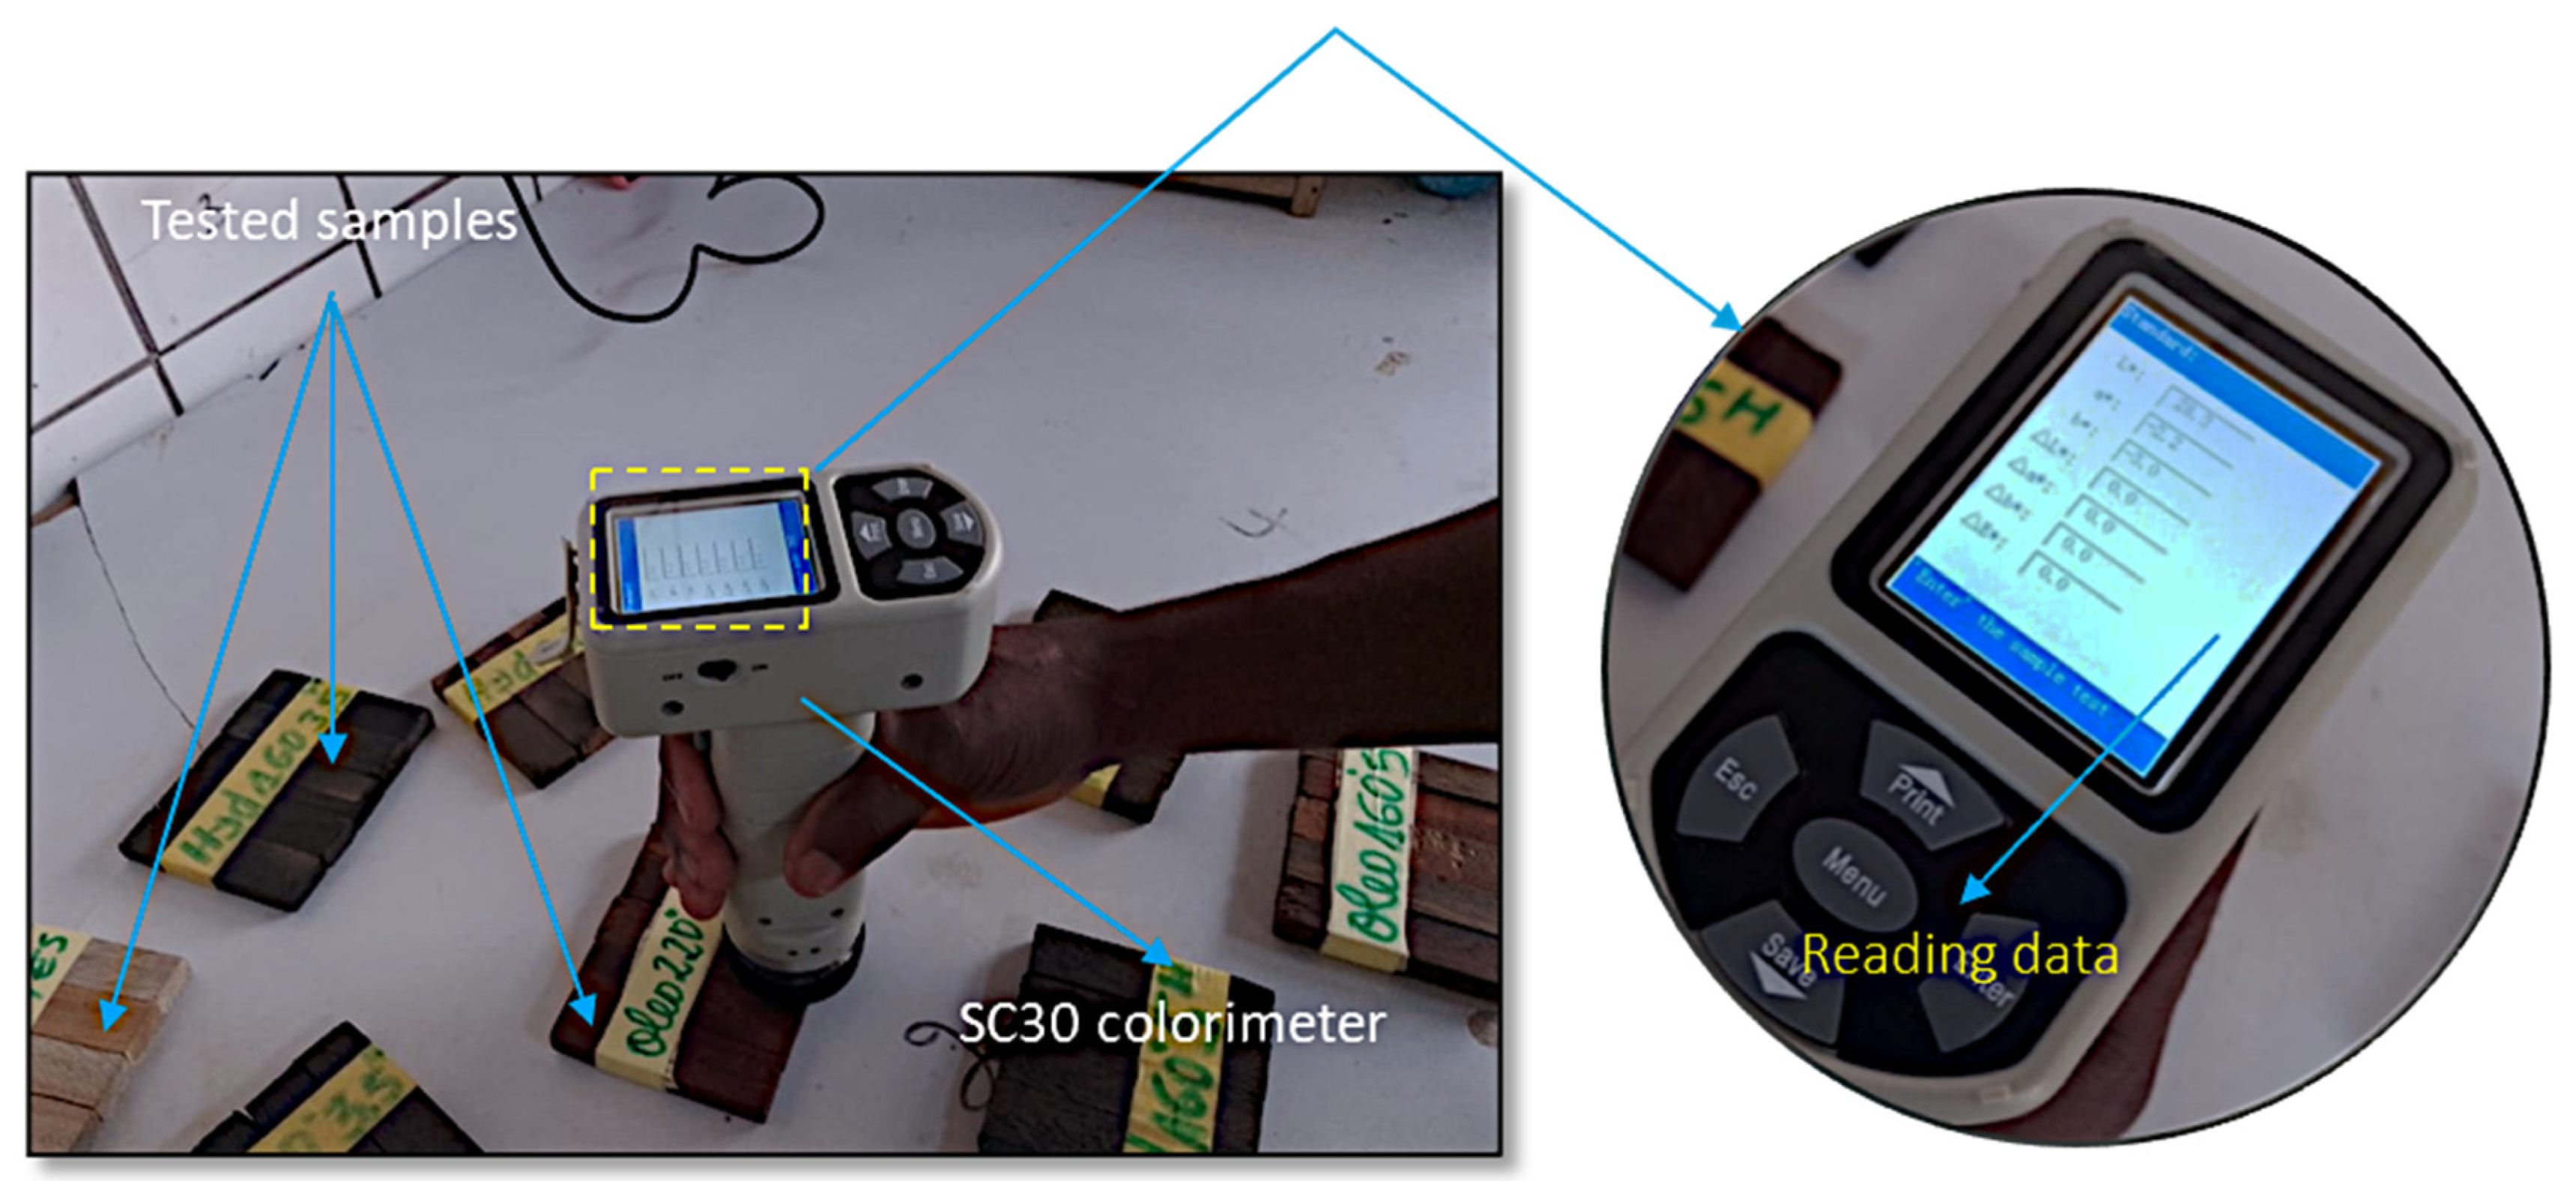
Figure 3.
Schematic illustration of sample dimensions for compression, bending, and tensile tests according to the applicable standards.
Figure 3.
Schematic illustration of sample dimensions for compression, bending, and tensile tests according to the applicable standards.
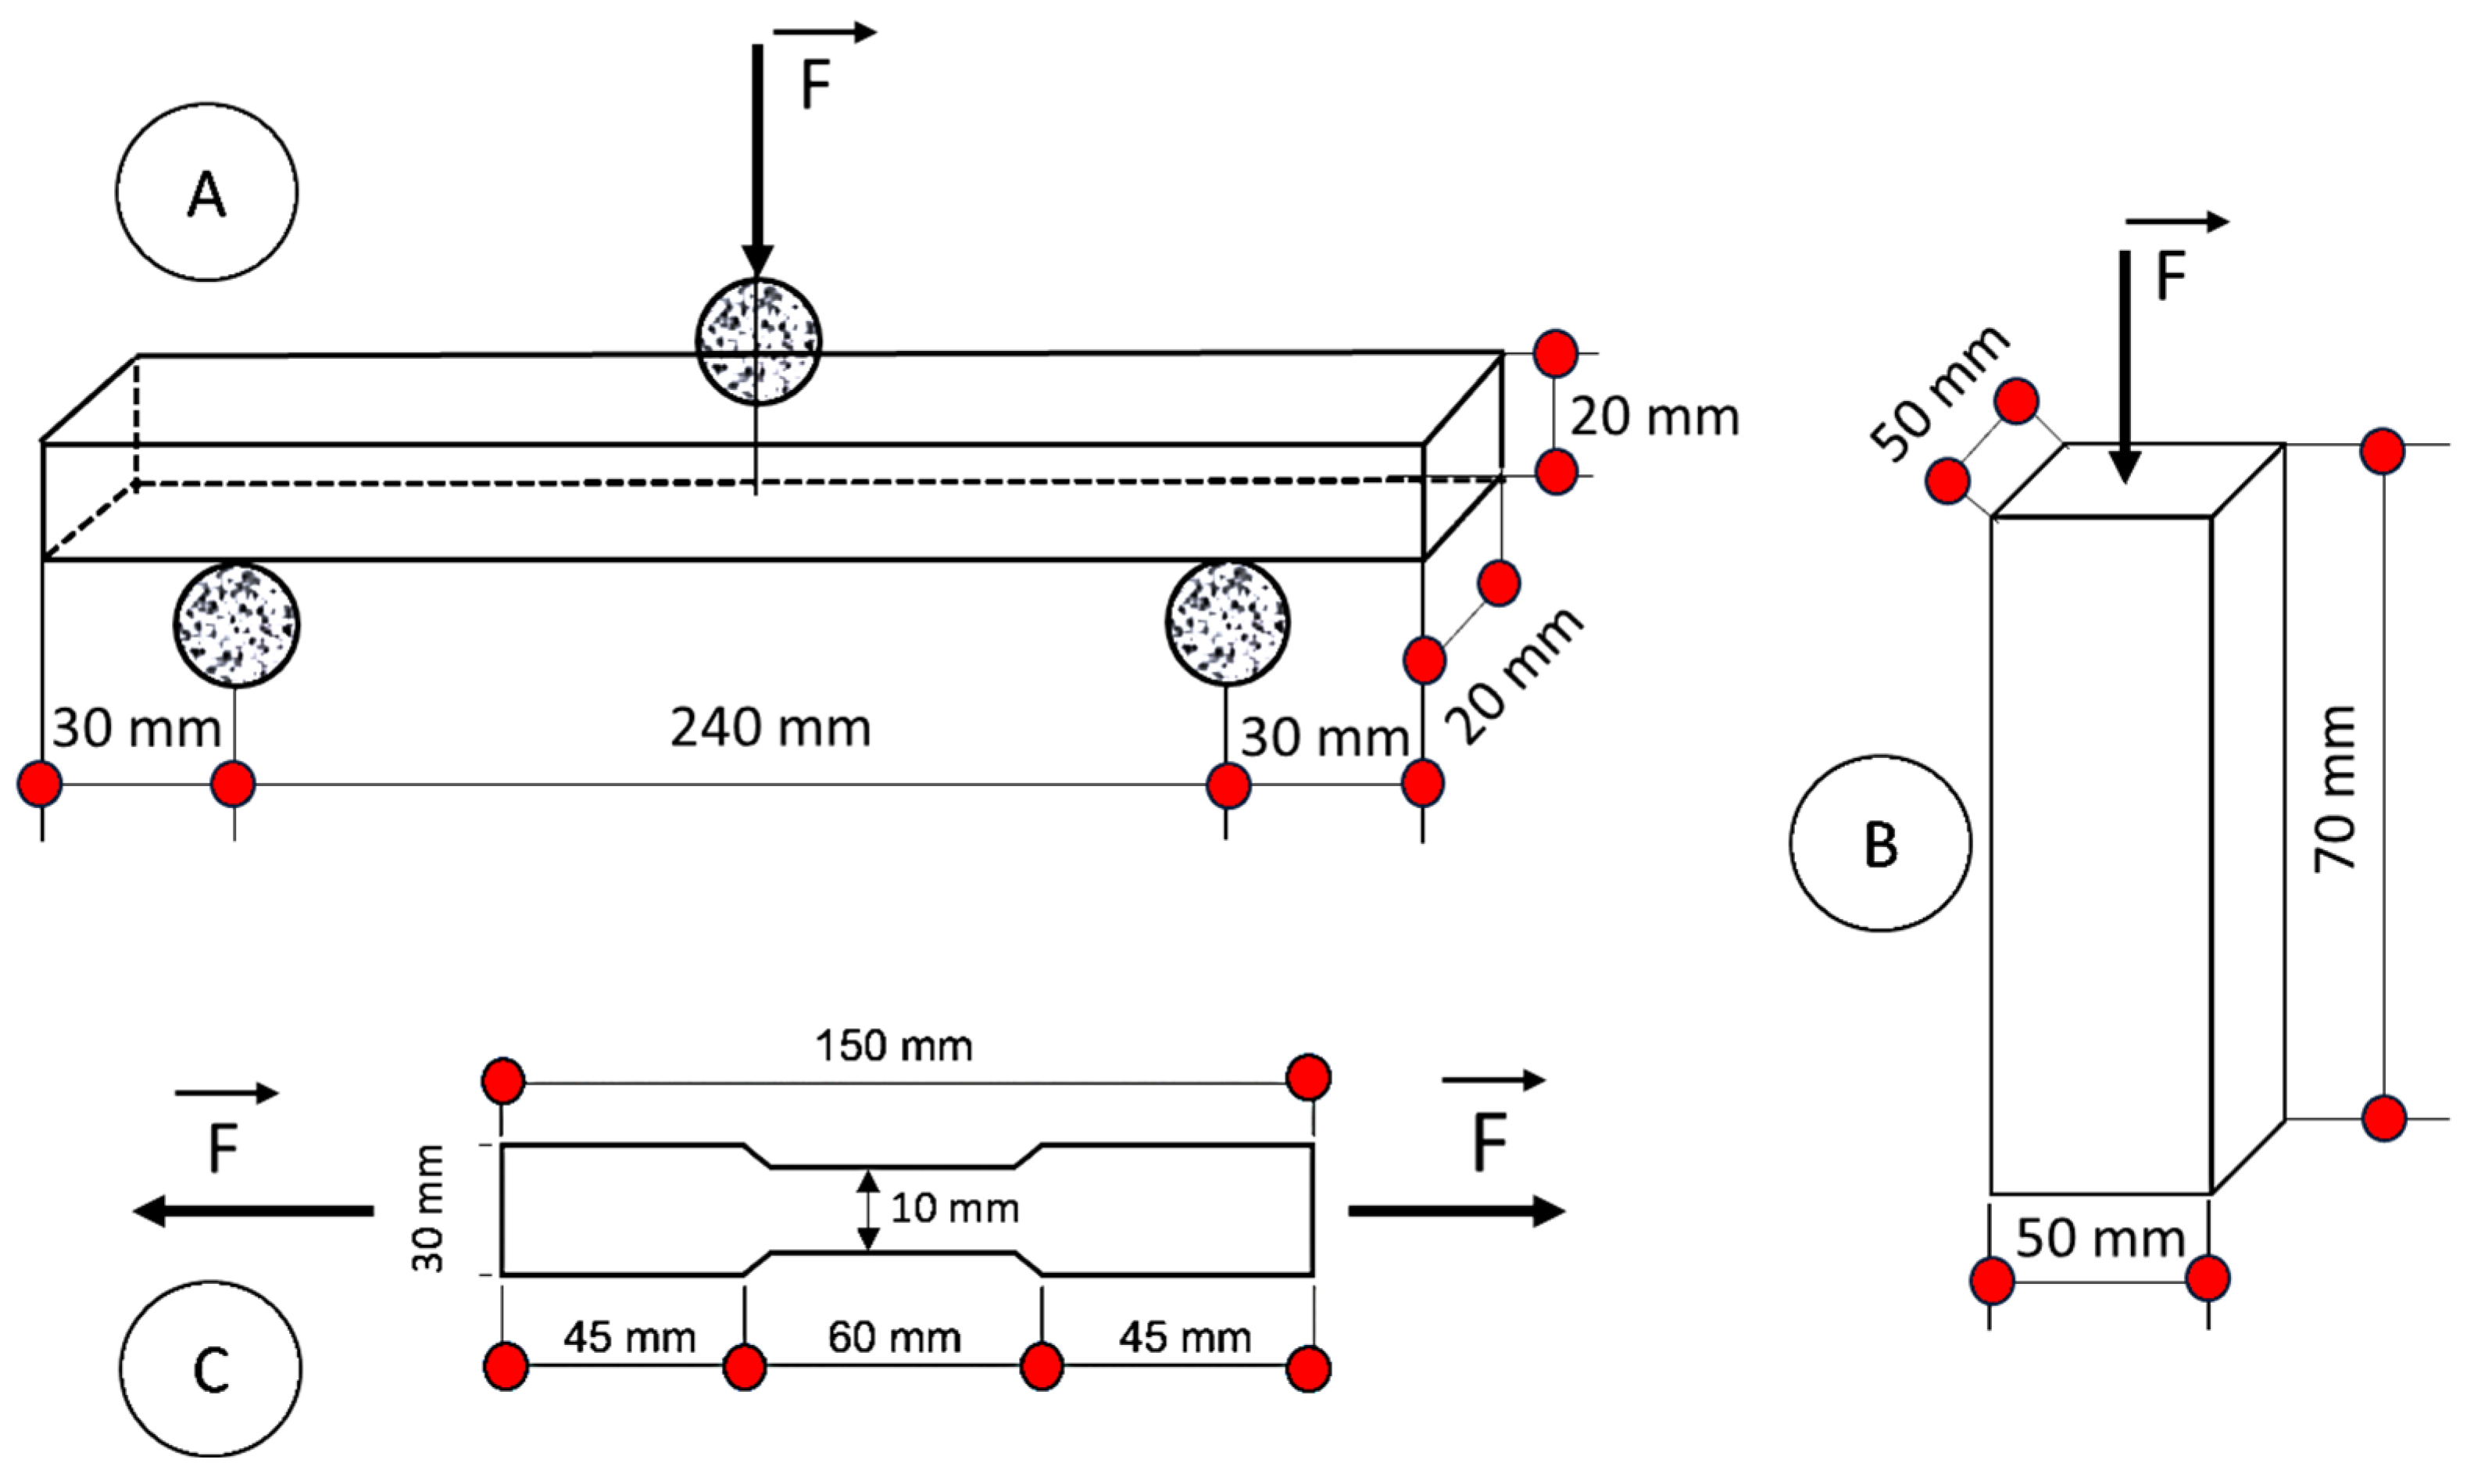
Figure 4.
Comparative structural, mechanical, and hygroscopic responses of Dabema wood (Piptadeniastrum africanum) to hydrothermal and oil-heat treatments at different temperatures.
Figure 4.
Comparative structural, mechanical, and hygroscopic responses of Dabema wood (Piptadeniastrum africanum) to hydrothermal and oil-heat treatments at different temperatures.
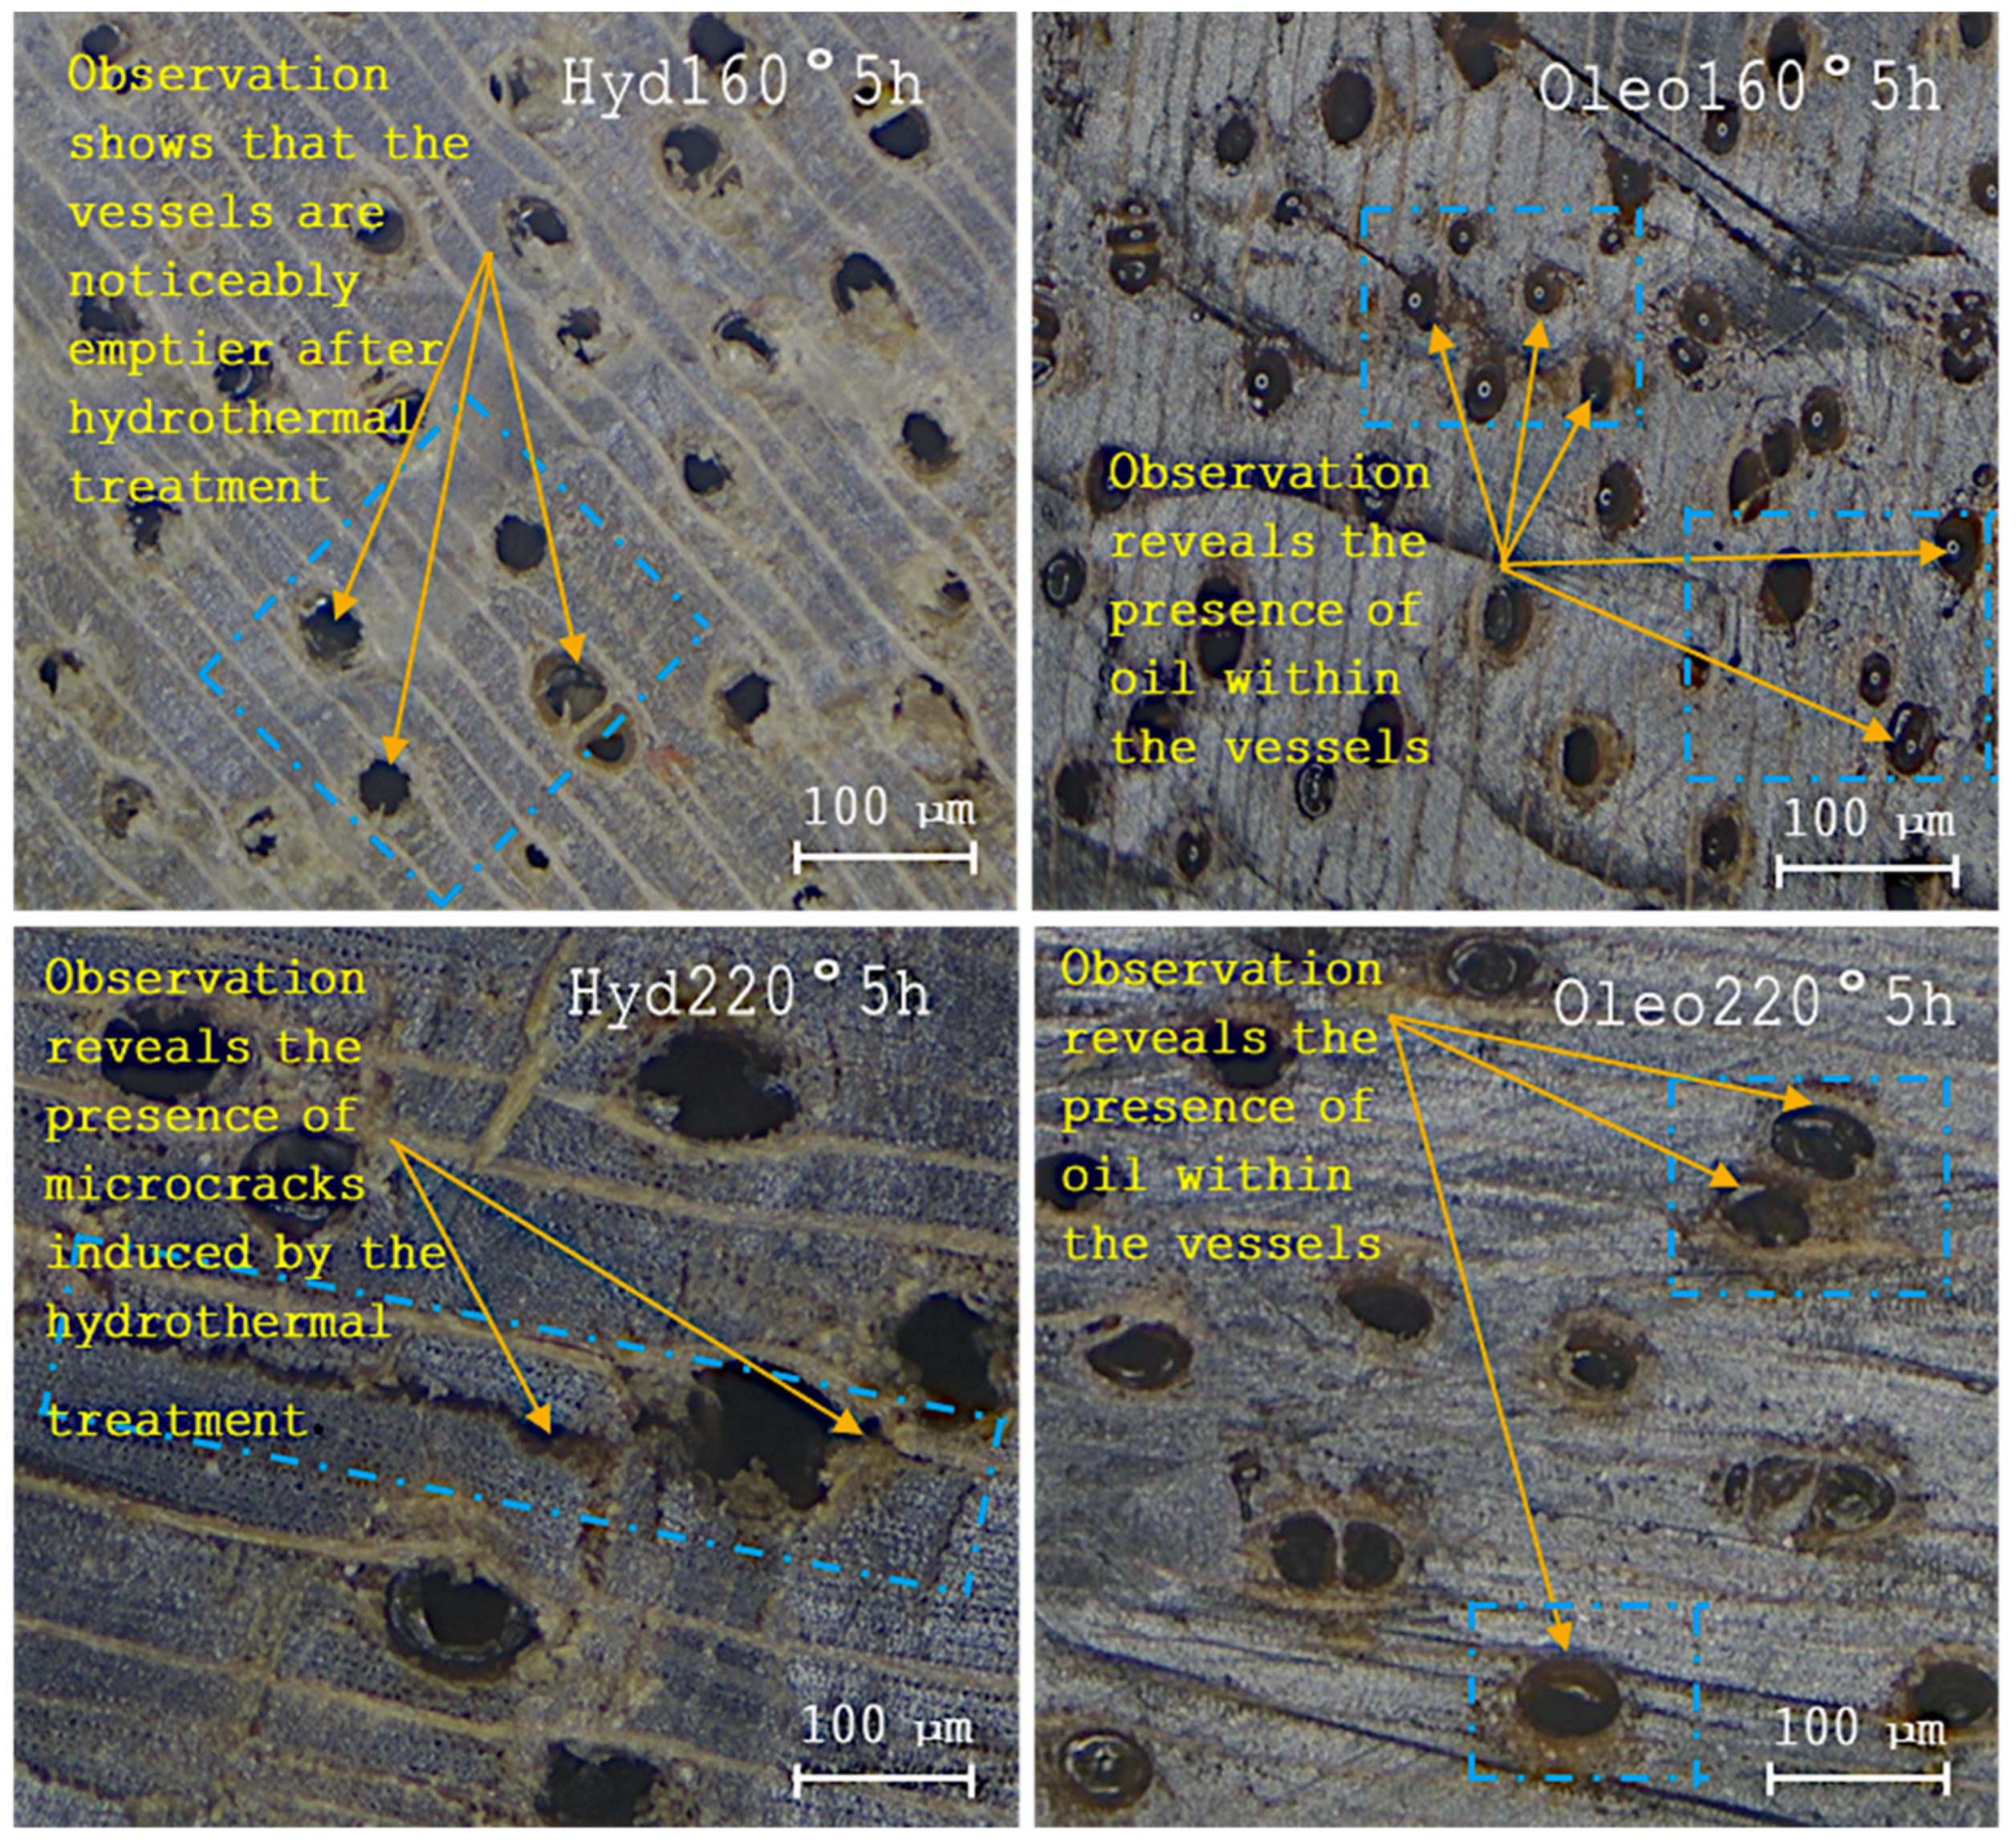
Figure 5.
Scree plots of the eigenvalues derived from the PCA: (a) Compression, (b) three-point bending, (c) tensile.
Figure 5.
Scree plots of the eigenvalues derived from the PCA: (a) Compression, (b) three-point bending, (c) tensile.
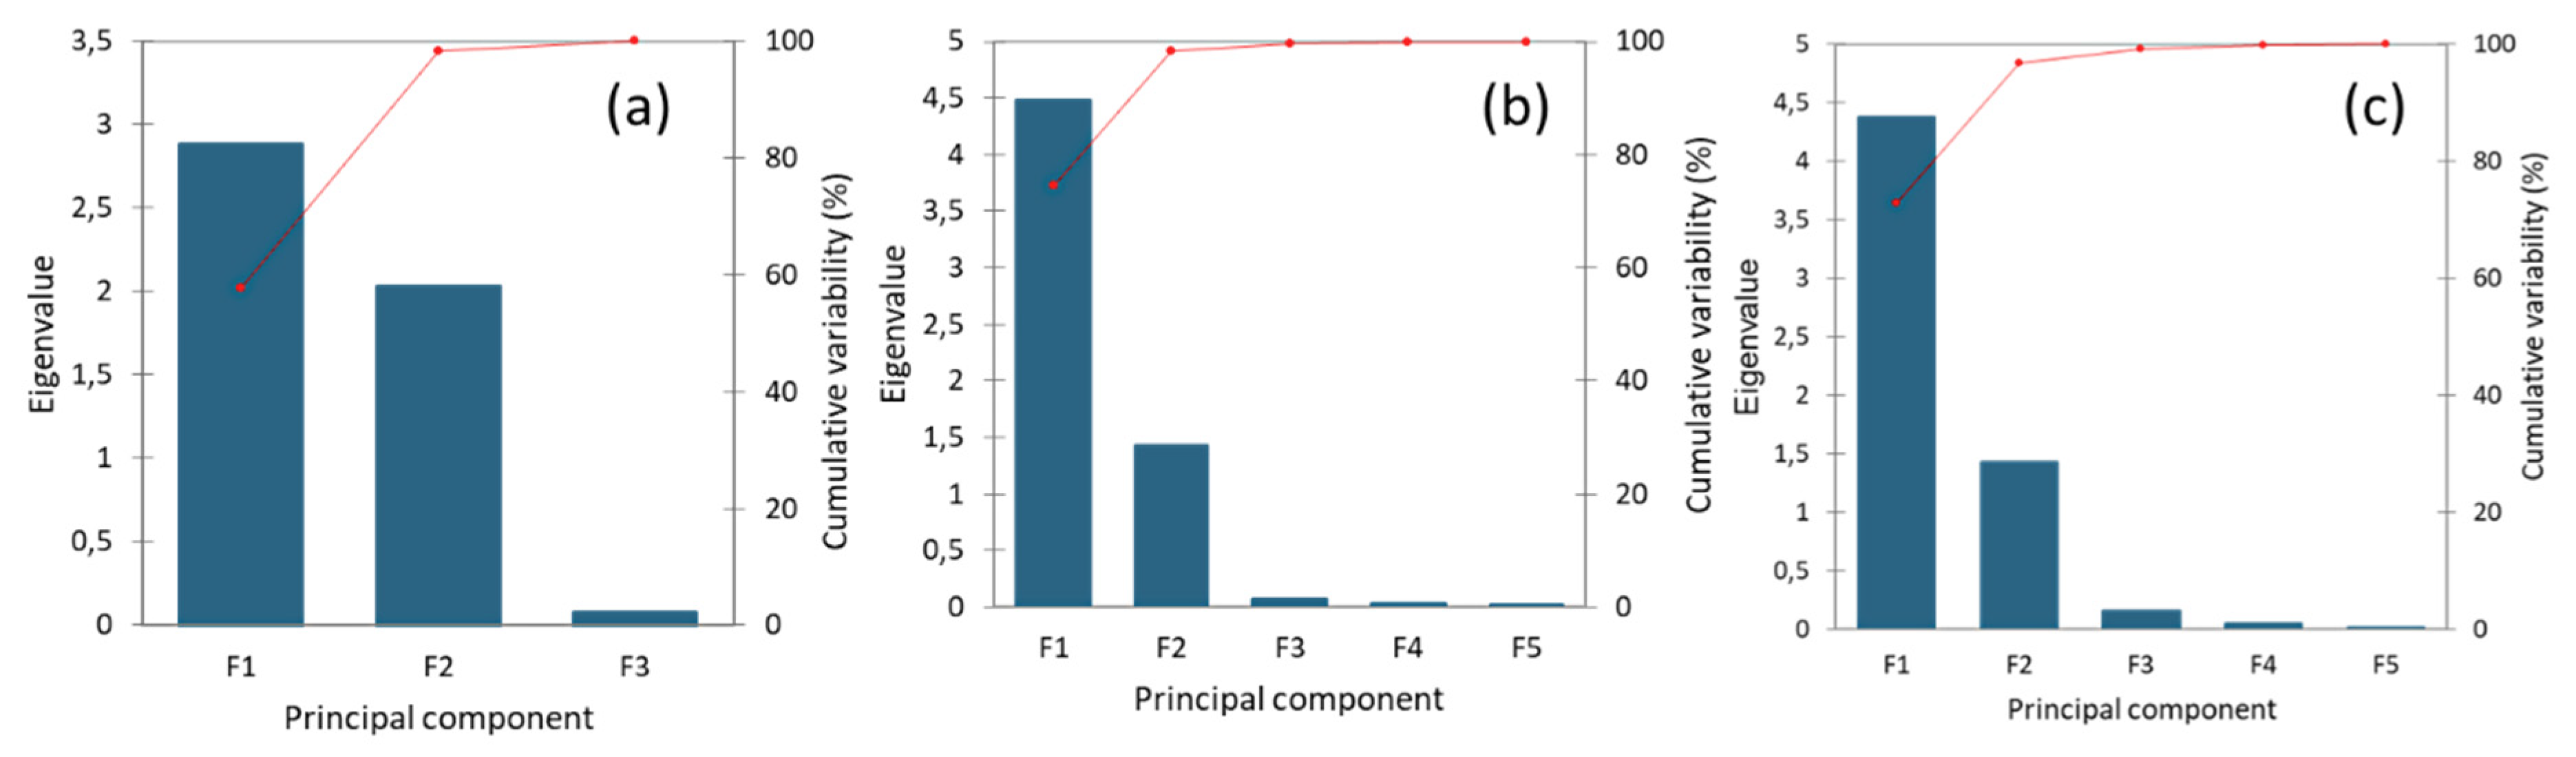
Figure 6.
Hierarchical cluster analysis of sample groups subjected to hydrothermal and oleothermal treatments and subsequently evaluated in compression.
Figure 6.
Hierarchical cluster analysis of sample groups subjected to hydrothermal and oleothermal treatments and subsequently evaluated in compression.
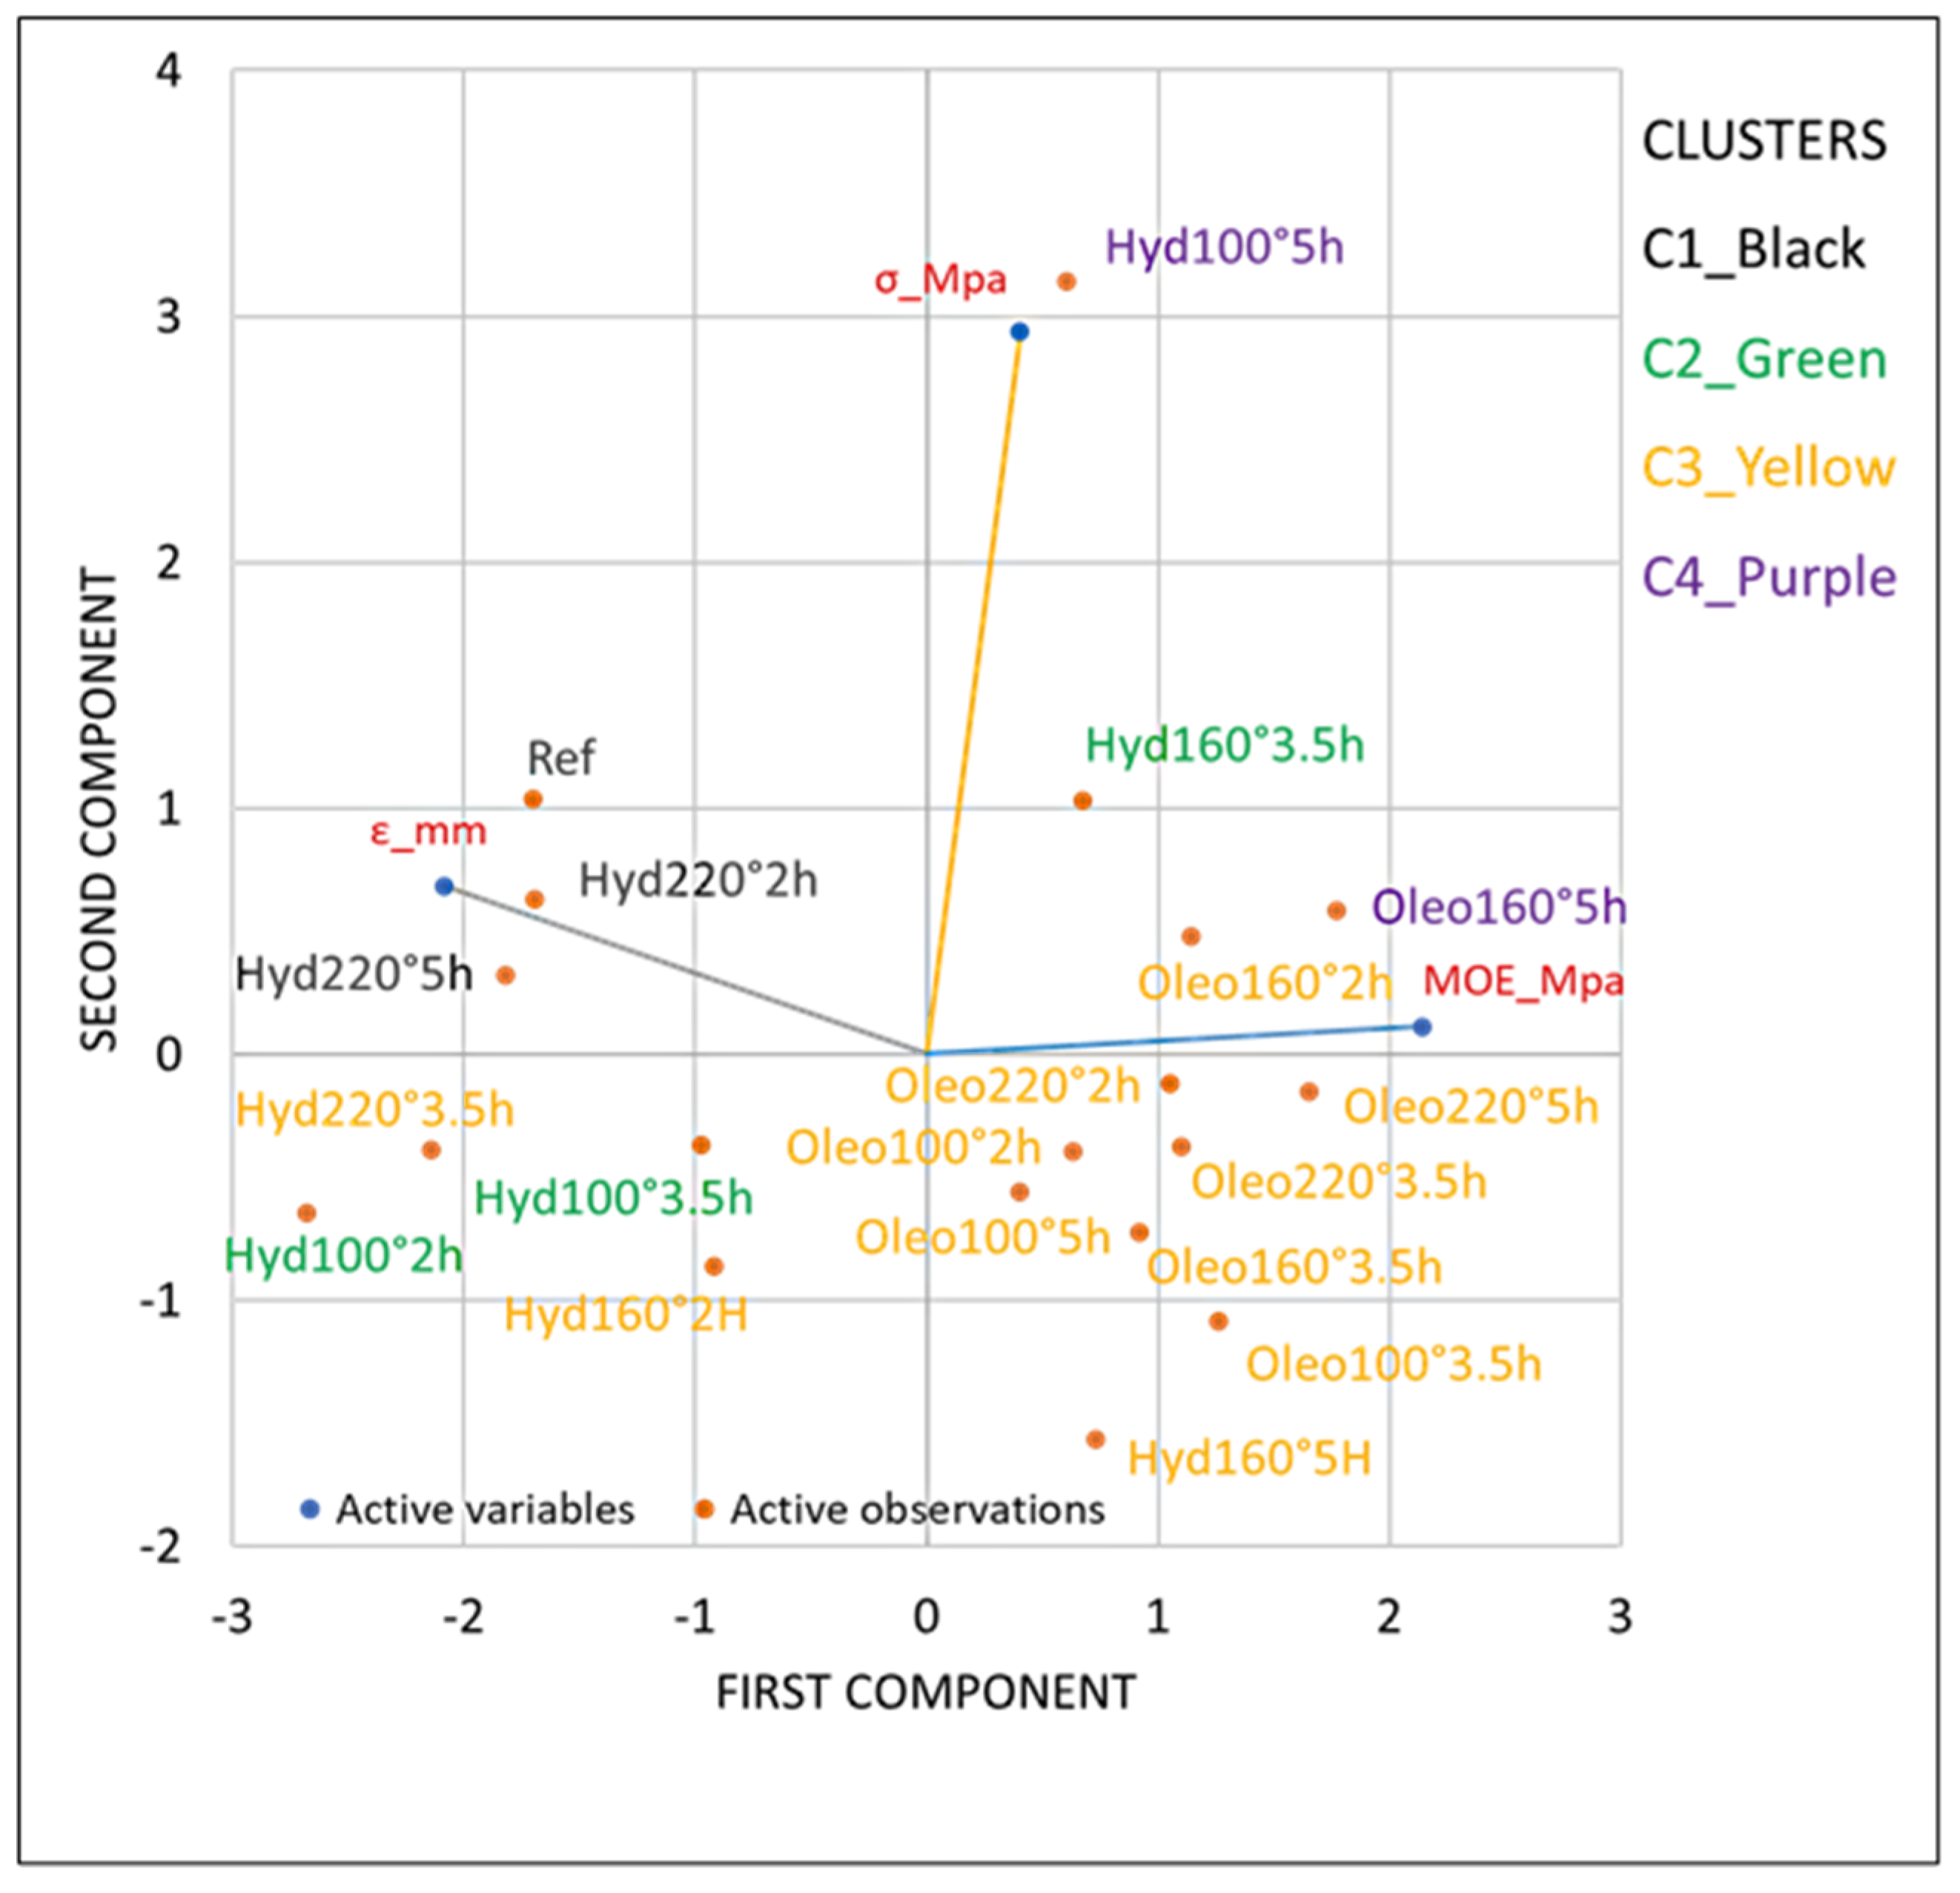
Figure 7.
Hierarchical cluster analysis of sample groups subjected to hydrothermal and oleothermal treatments and subsequently evaluated in three-point bending.
Figure 7.
Hierarchical cluster analysis of sample groups subjected to hydrothermal and oleothermal treatments and subsequently evaluated in three-point bending.
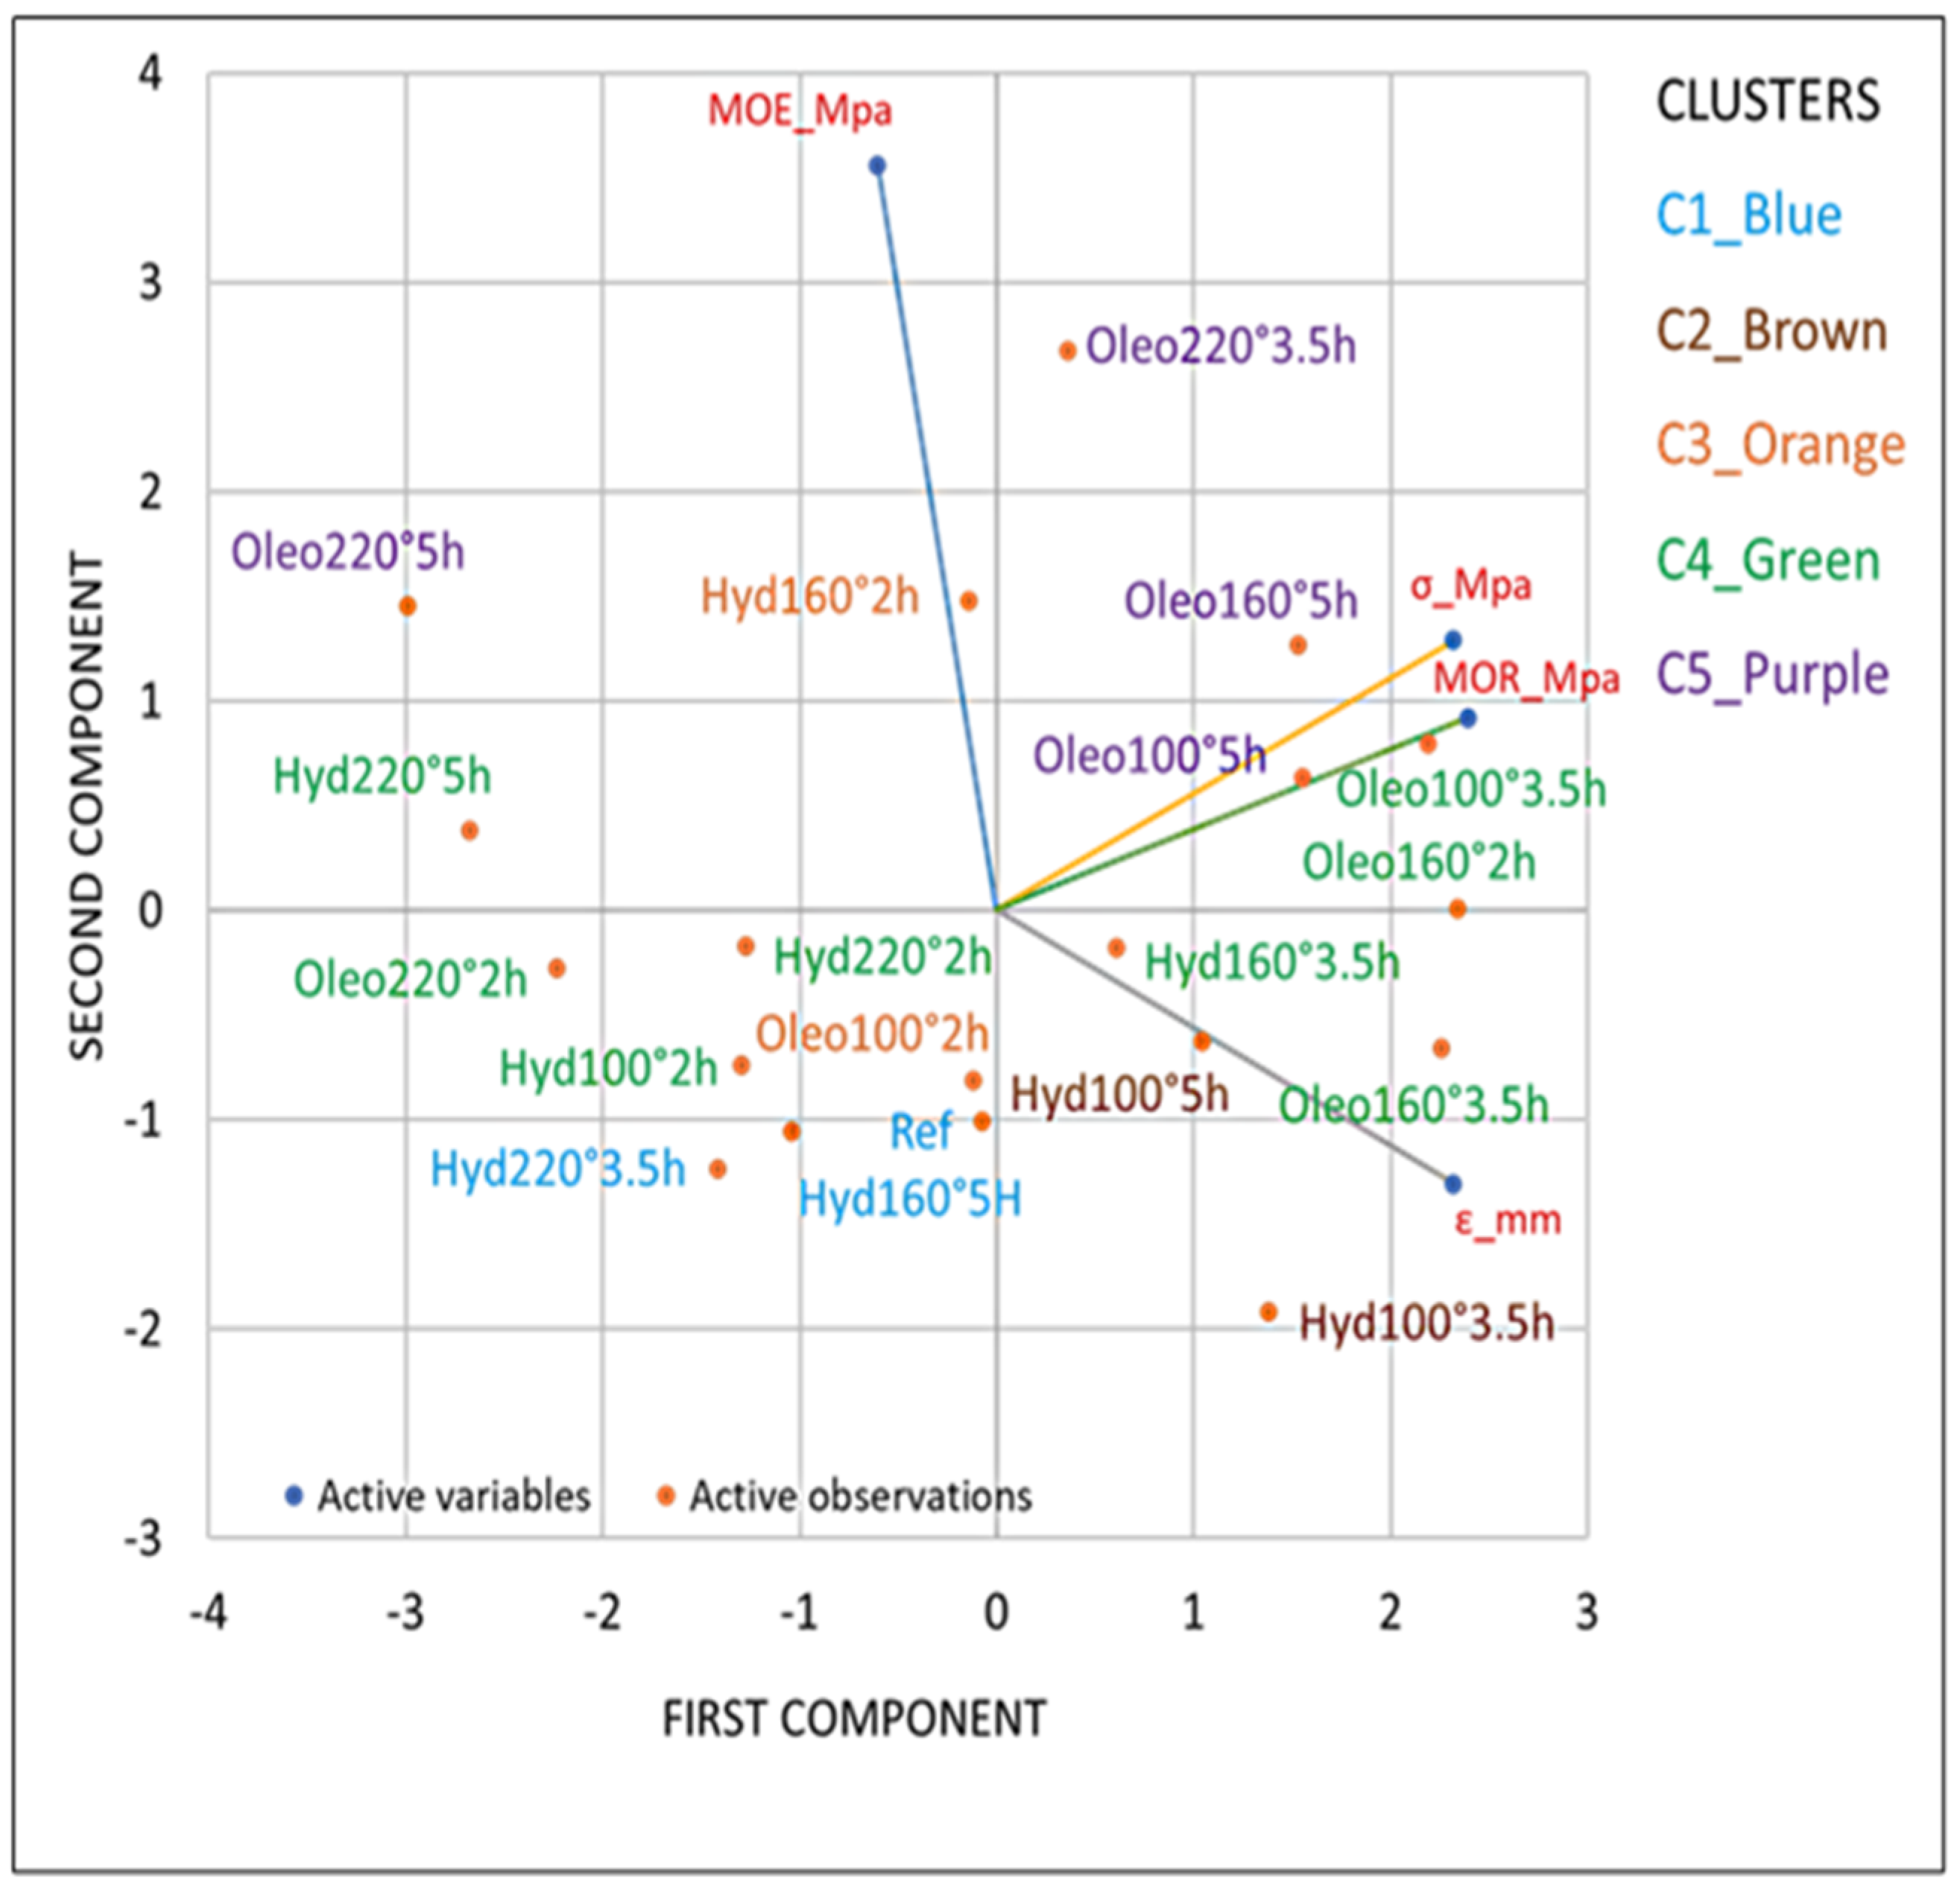
Figure 8.
Hierarchical cluster analysis of sample groups subjected to hydrothermal and oleothermal treatments and subsequently evaluated in tensile.
Figure 8.
Hierarchical cluster analysis of sample groups subjected to hydrothermal and oleothermal treatments and subsequently evaluated in tensile.
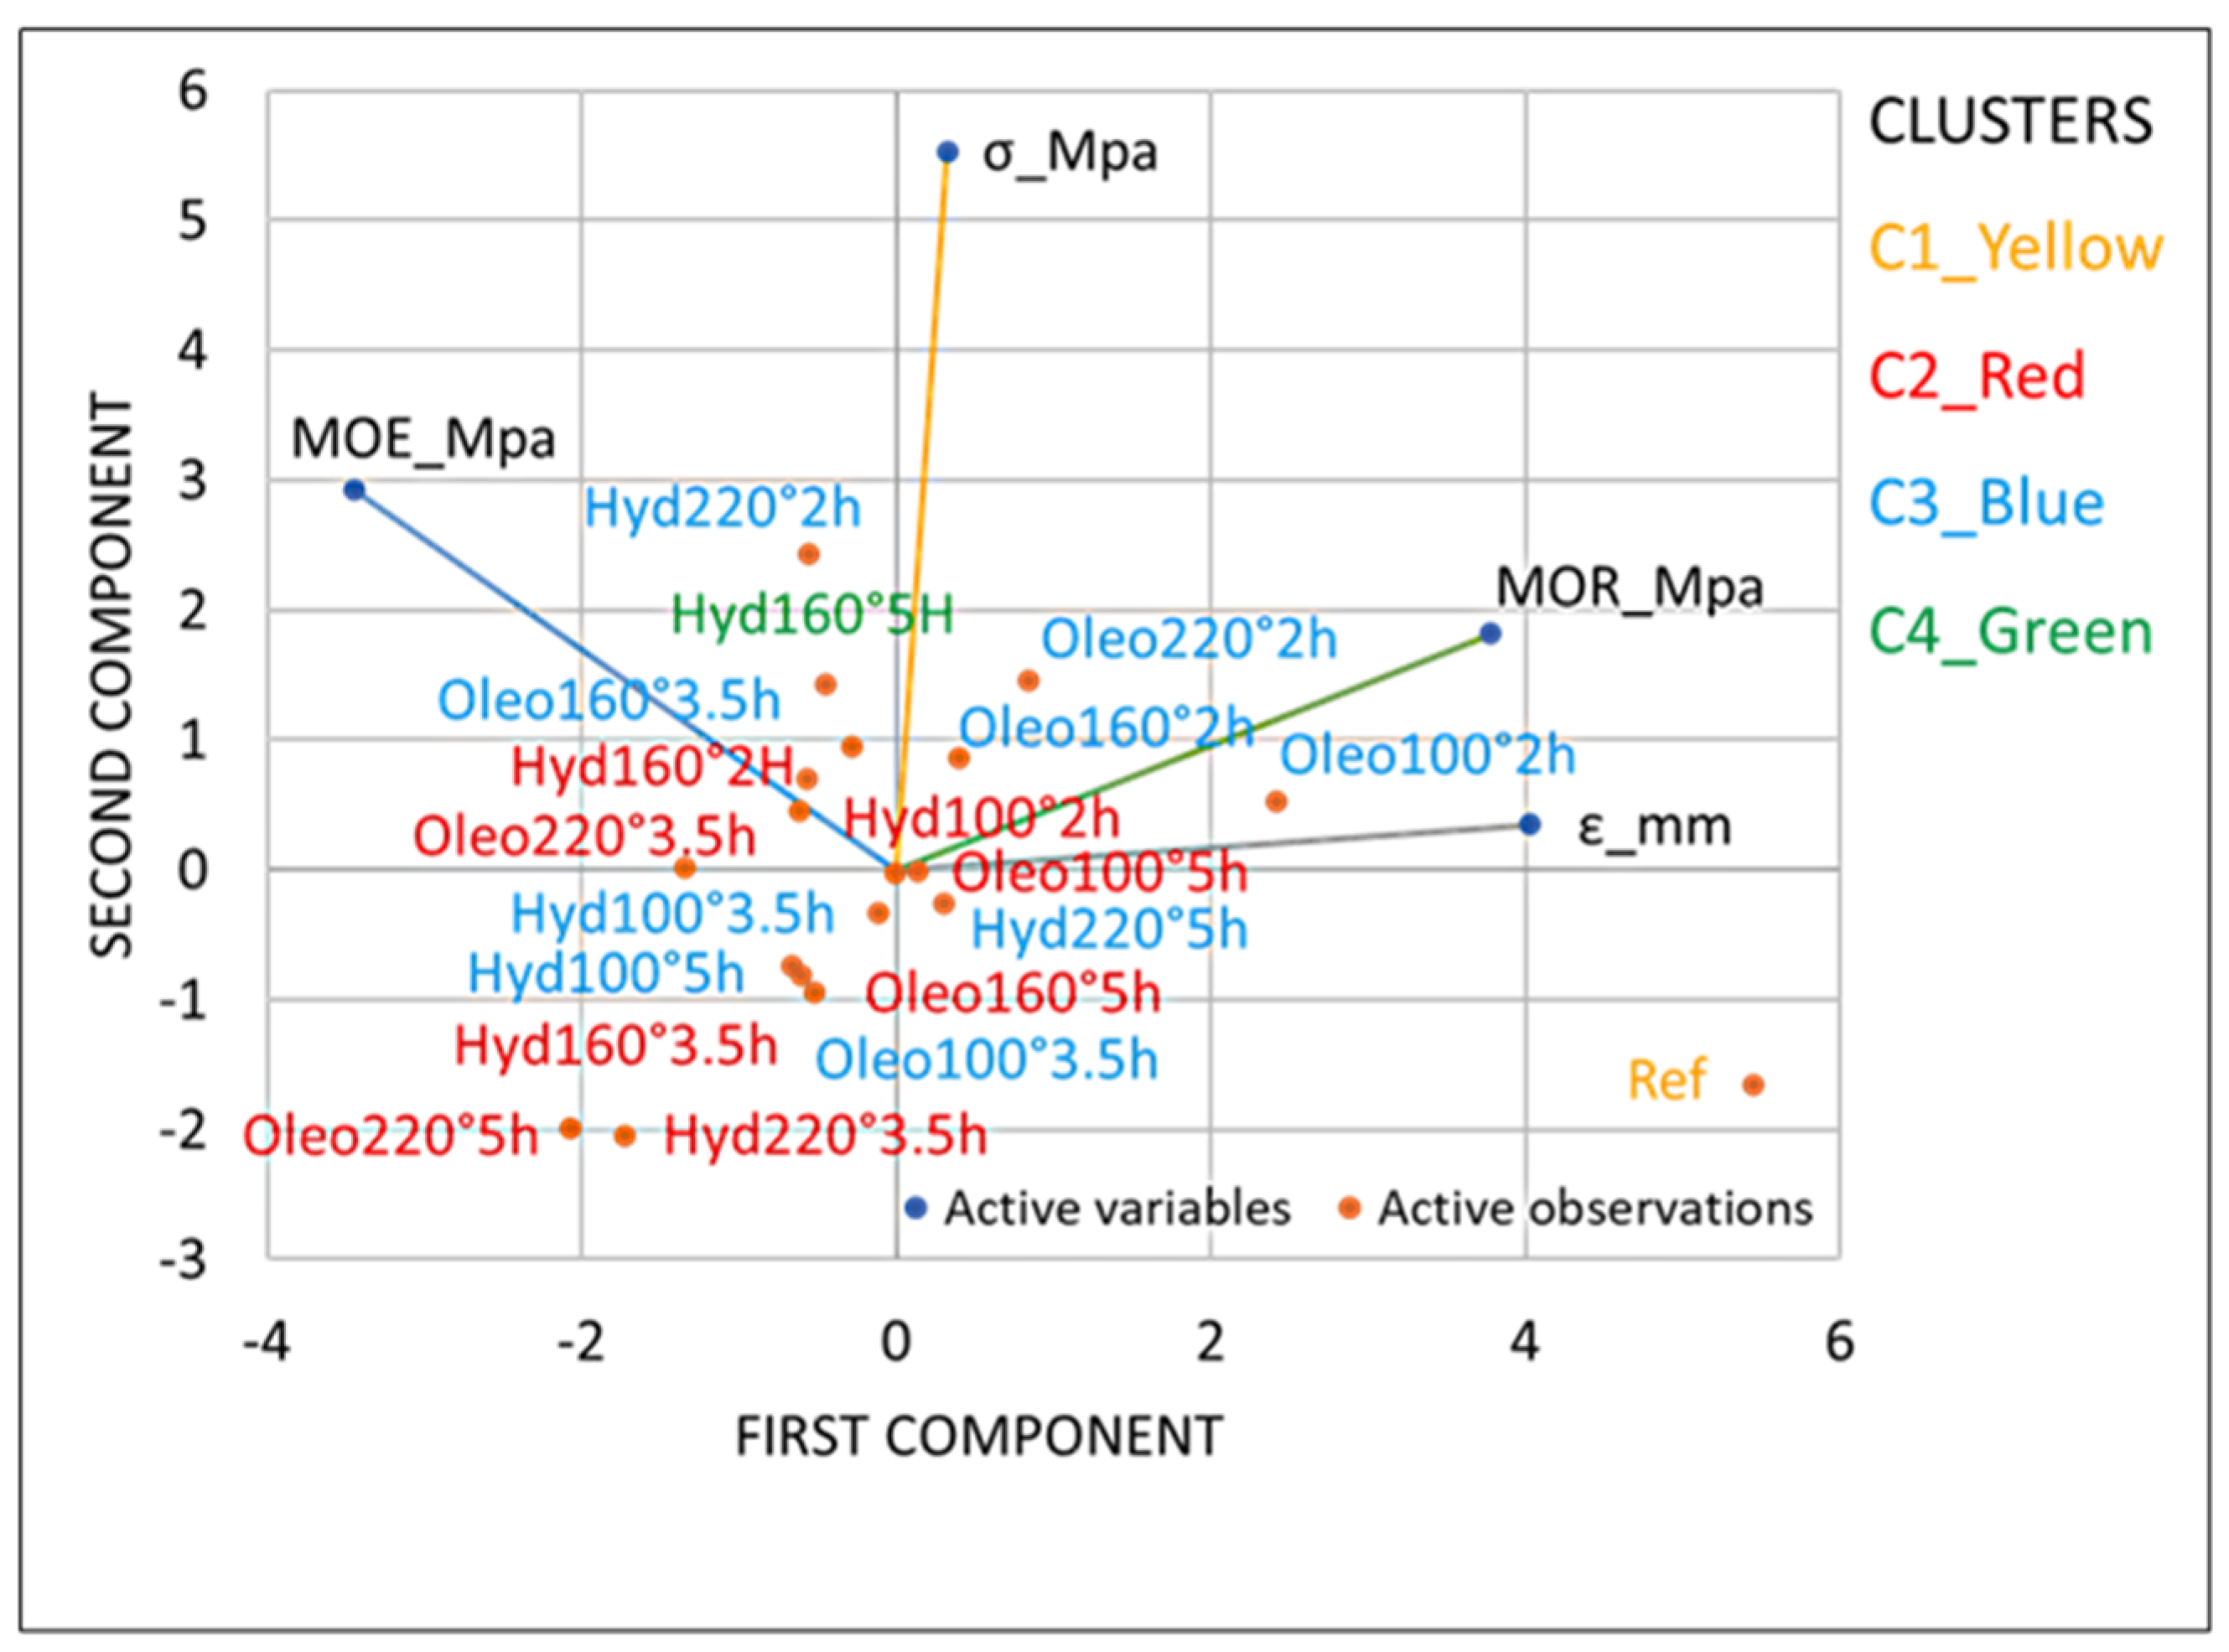
Figure 9.
Hierarchical ascending classification of observations: (a) compression test, (b) bending test, (c) tensile test; and hierarchical ascending classification of variables: (d) compression test, (e) bending test, (f) tensile test.
Figure 9.
Hierarchical ascending classification of observations: (a) compression test, (b) bending test, (c) tensile test; and hierarchical ascending classification of variables: (d) compression test, (e) bending test, (f) tensile test.
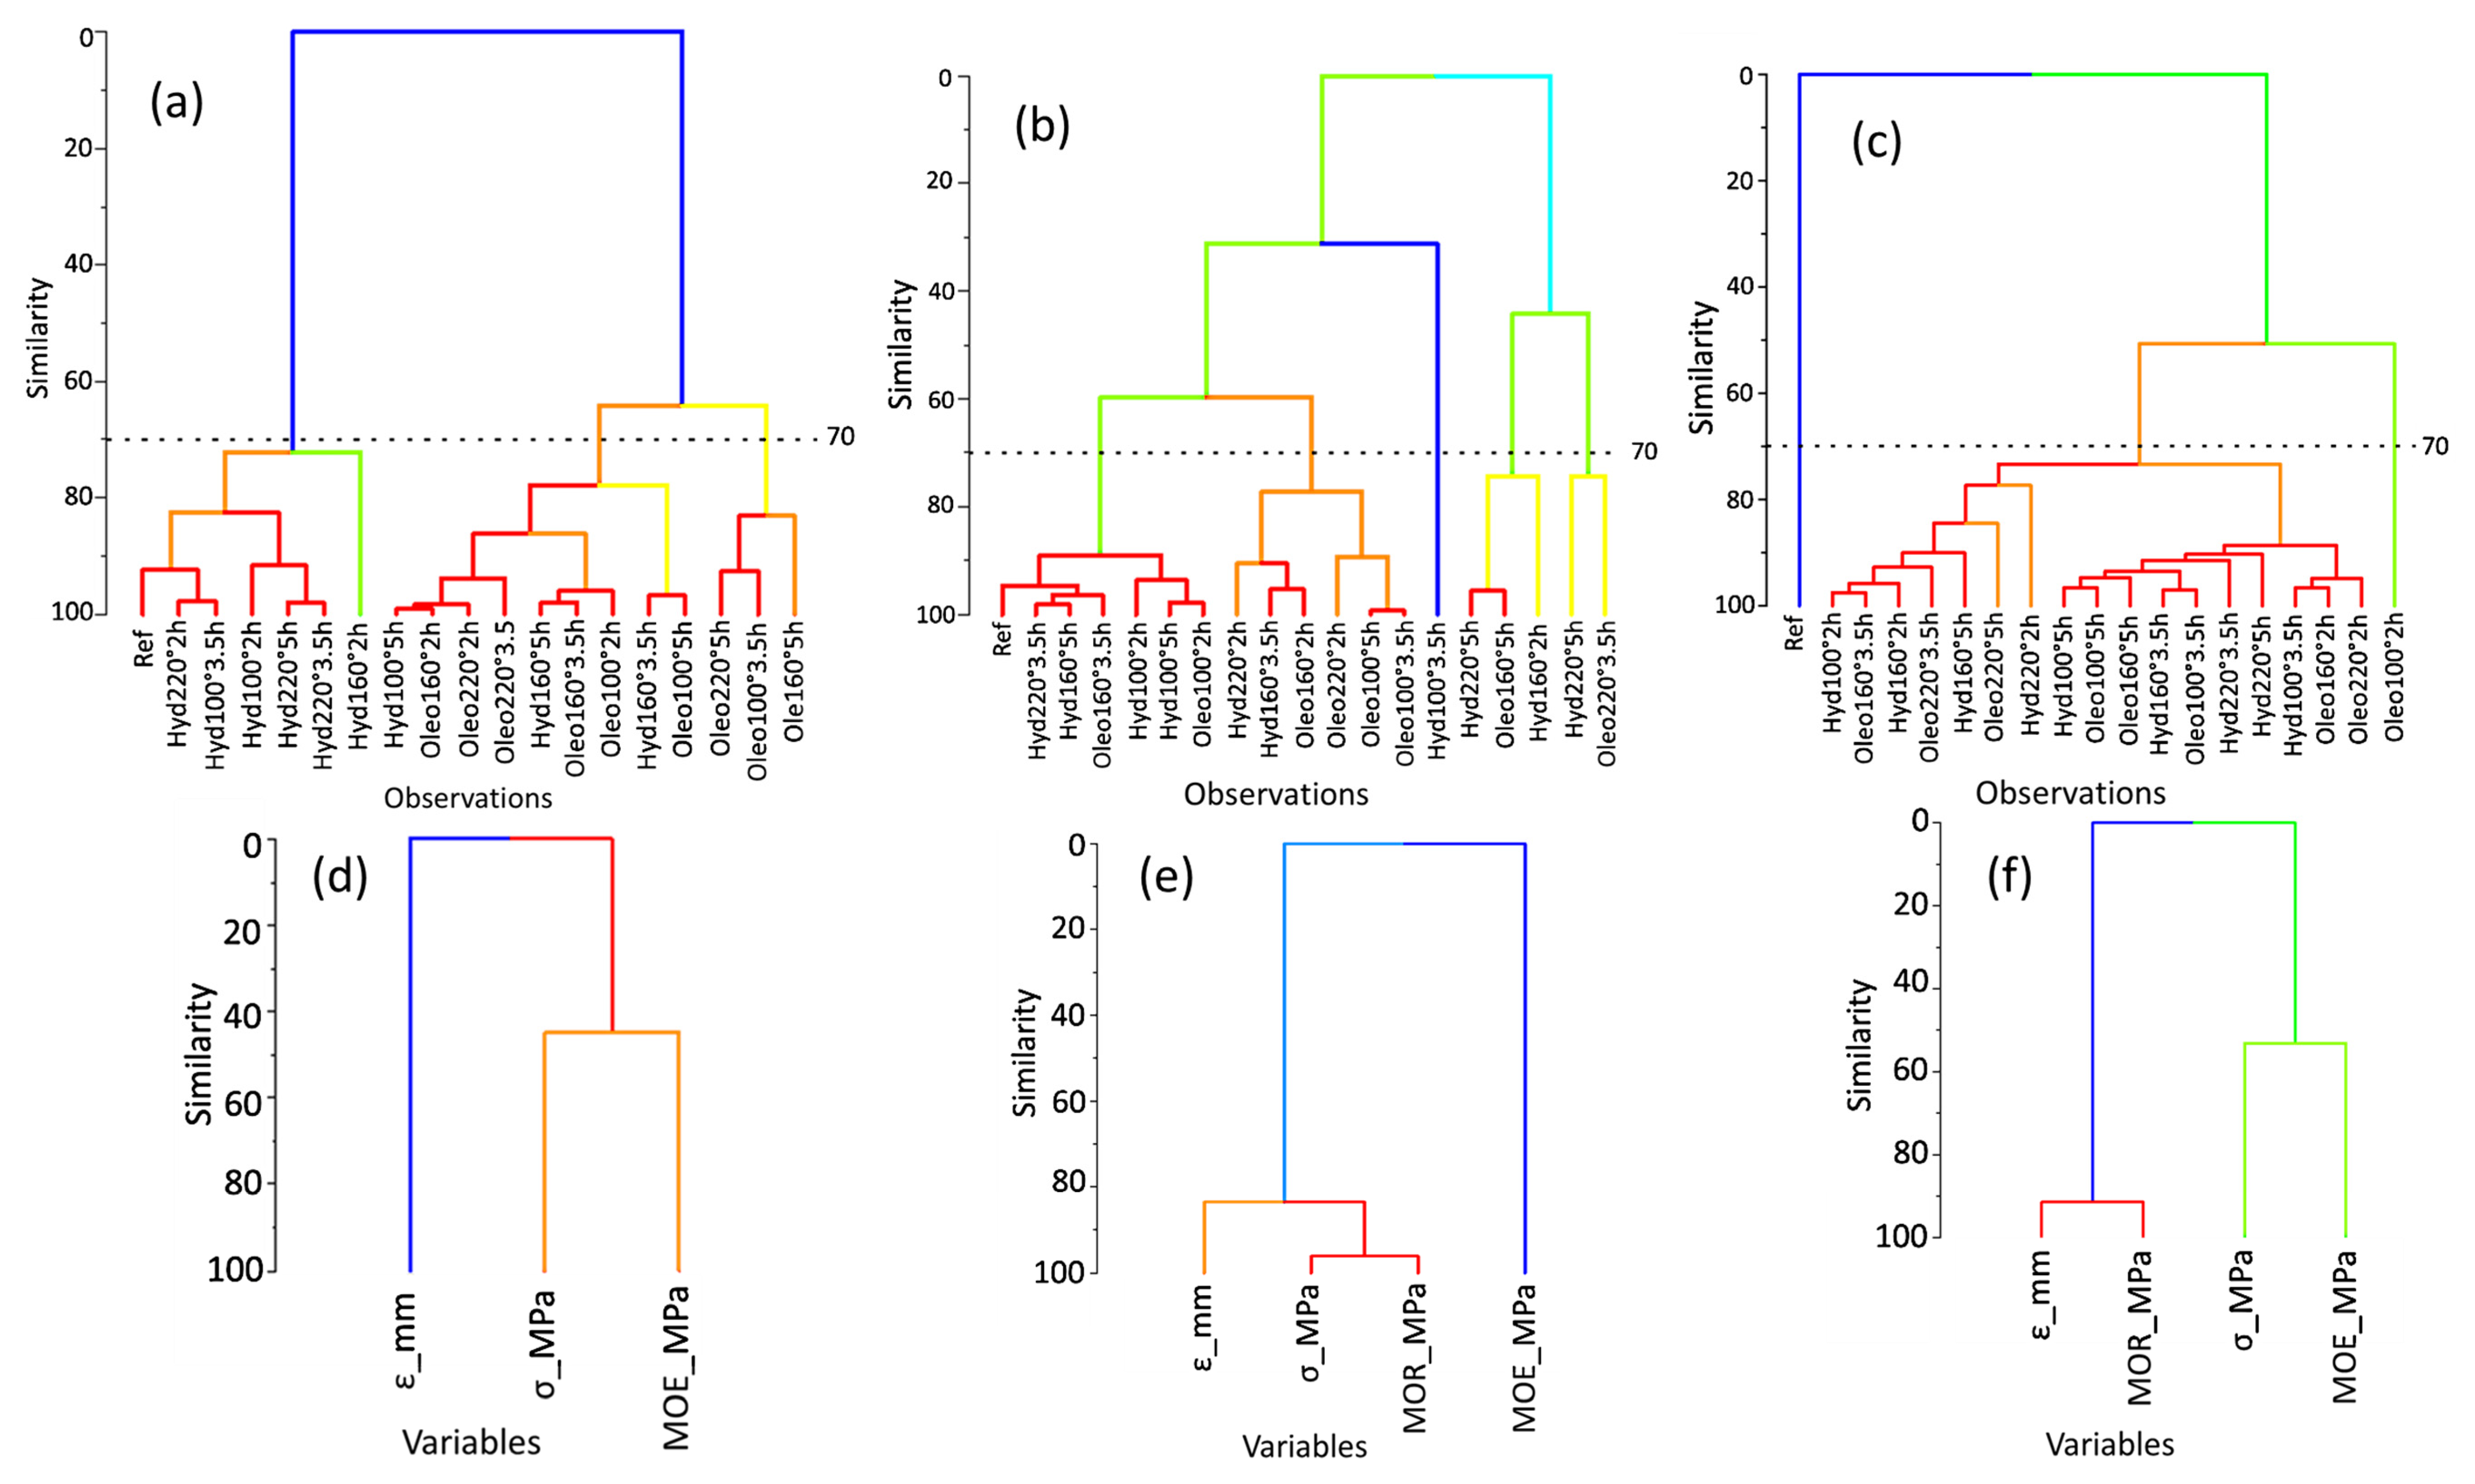
Figure 10.
Experimental results and regression curves for the hydrothermal and oleothermal treatments: (a) compression test, (b) three-point bending test, (c) tensile test.
Figure 10.
Experimental results and regression curves for the hydrothermal and oleothermal treatments: (a) compression test, (b) three-point bending test, (c) tensile test.
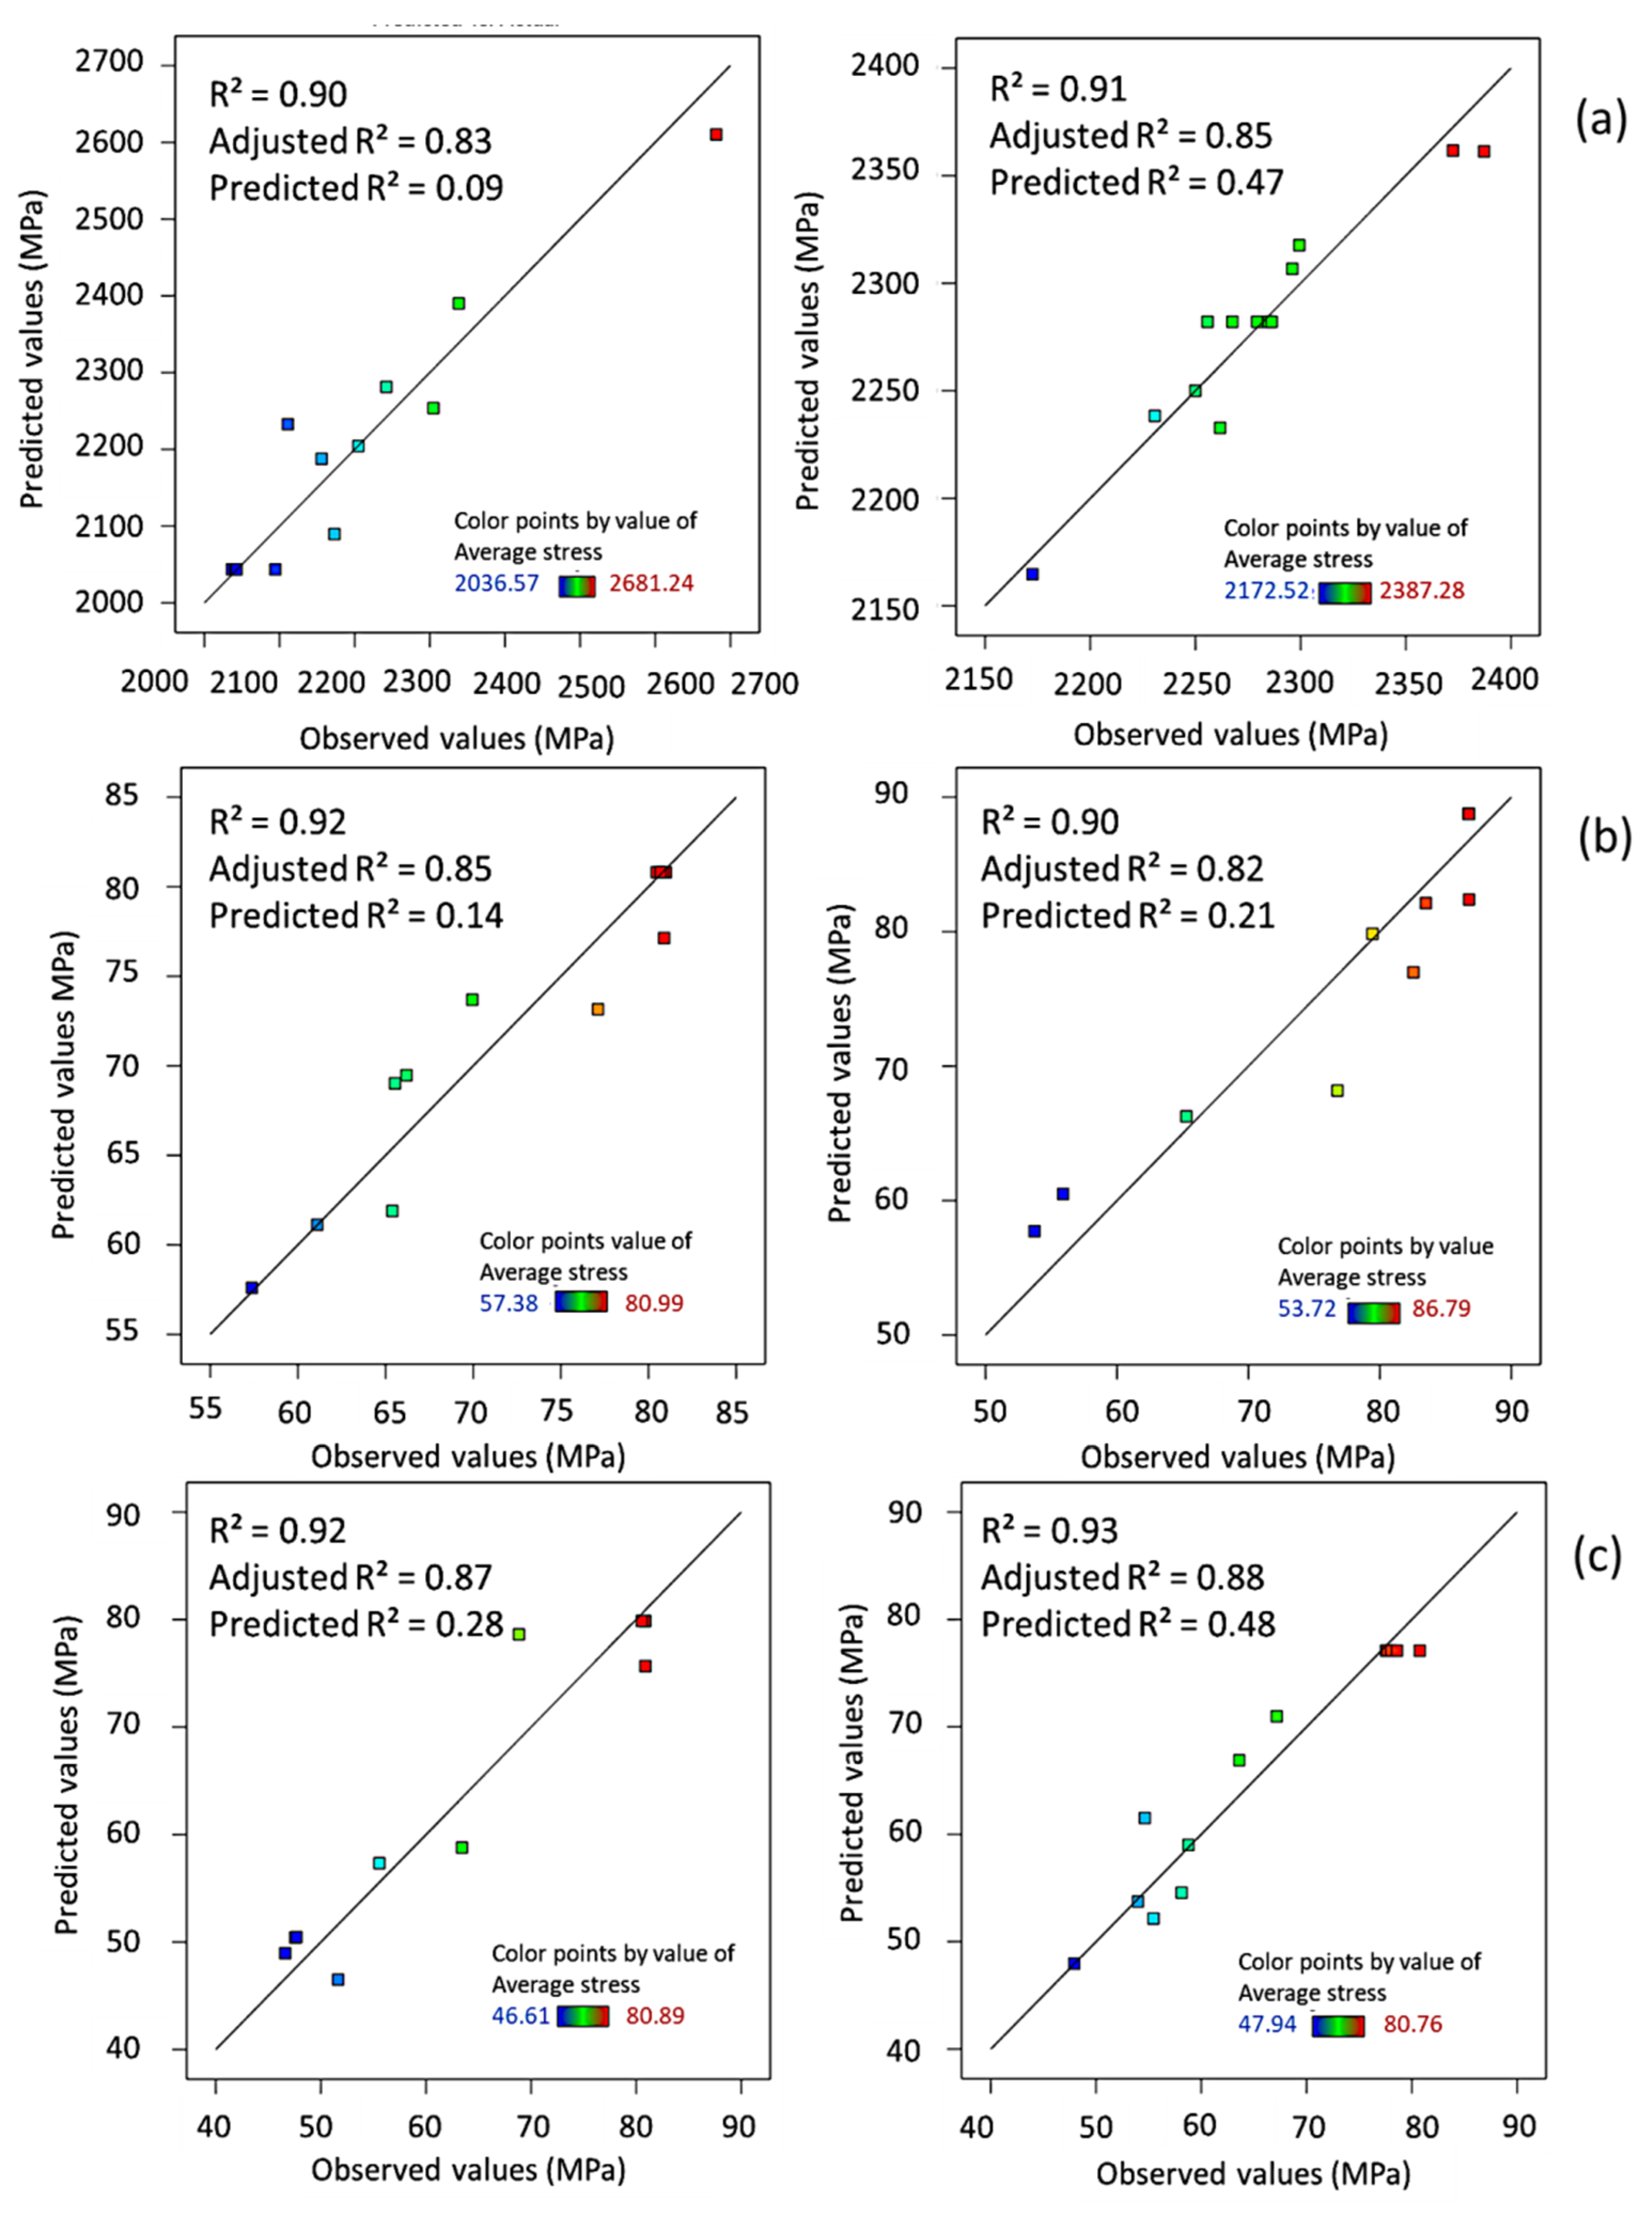
Figure 11.
Interactive effects of temperature and treatment time on the average stress (response surface and contour plots): (A) Hydrothermally treated samples tested in compression; (B) Oleothermally treated samples tested in compression; (C) Hydrothermally treated samples tested in bending; (D) Oleothermally treated samples tested in bending; (E) Hydrothermally treated samples tested in tensile; (F) Oleothermally treated samples tested in tensile.
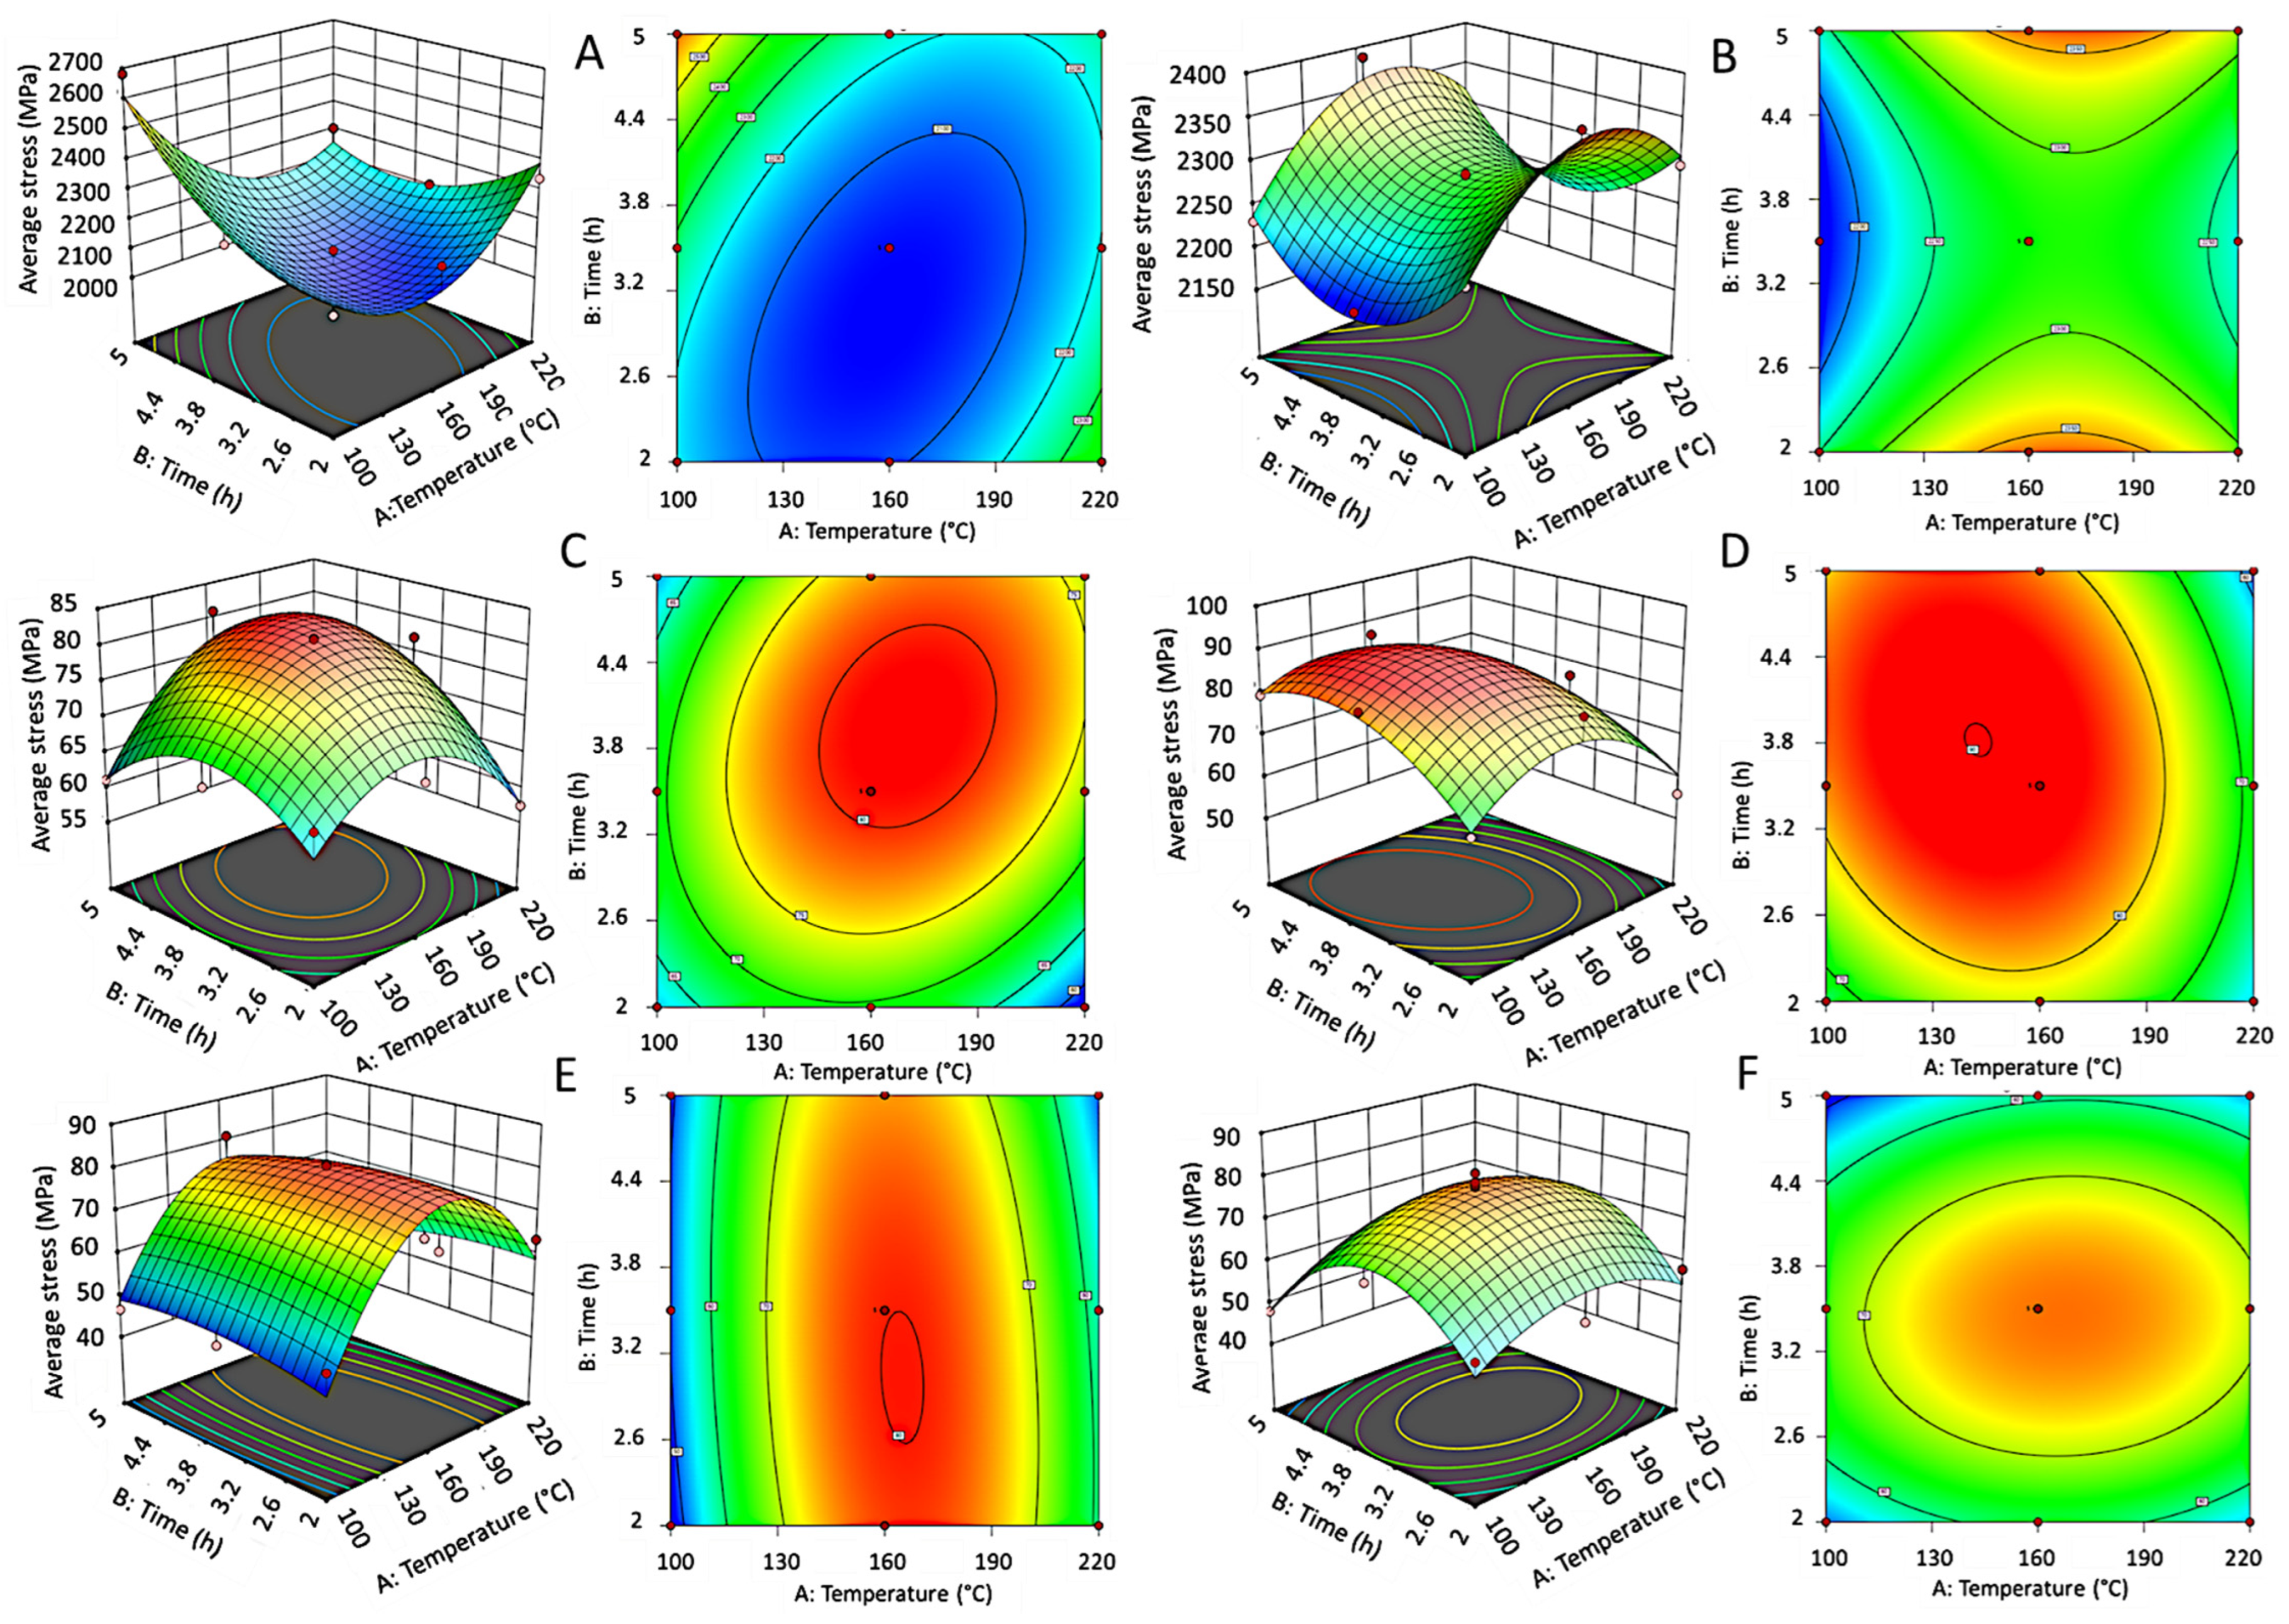
Figure 12.
Effect of temperature and treatment time on average compressive stress, with a 95% confidence interval: (a) hydrothermally treated samples, (b) oleothermally treated samples.
Figure 12.
Effect of temperature and treatment time on average compressive stress, with a 95% confidence interval: (a) hydrothermally treated samples, (b) oleothermally treated samples.
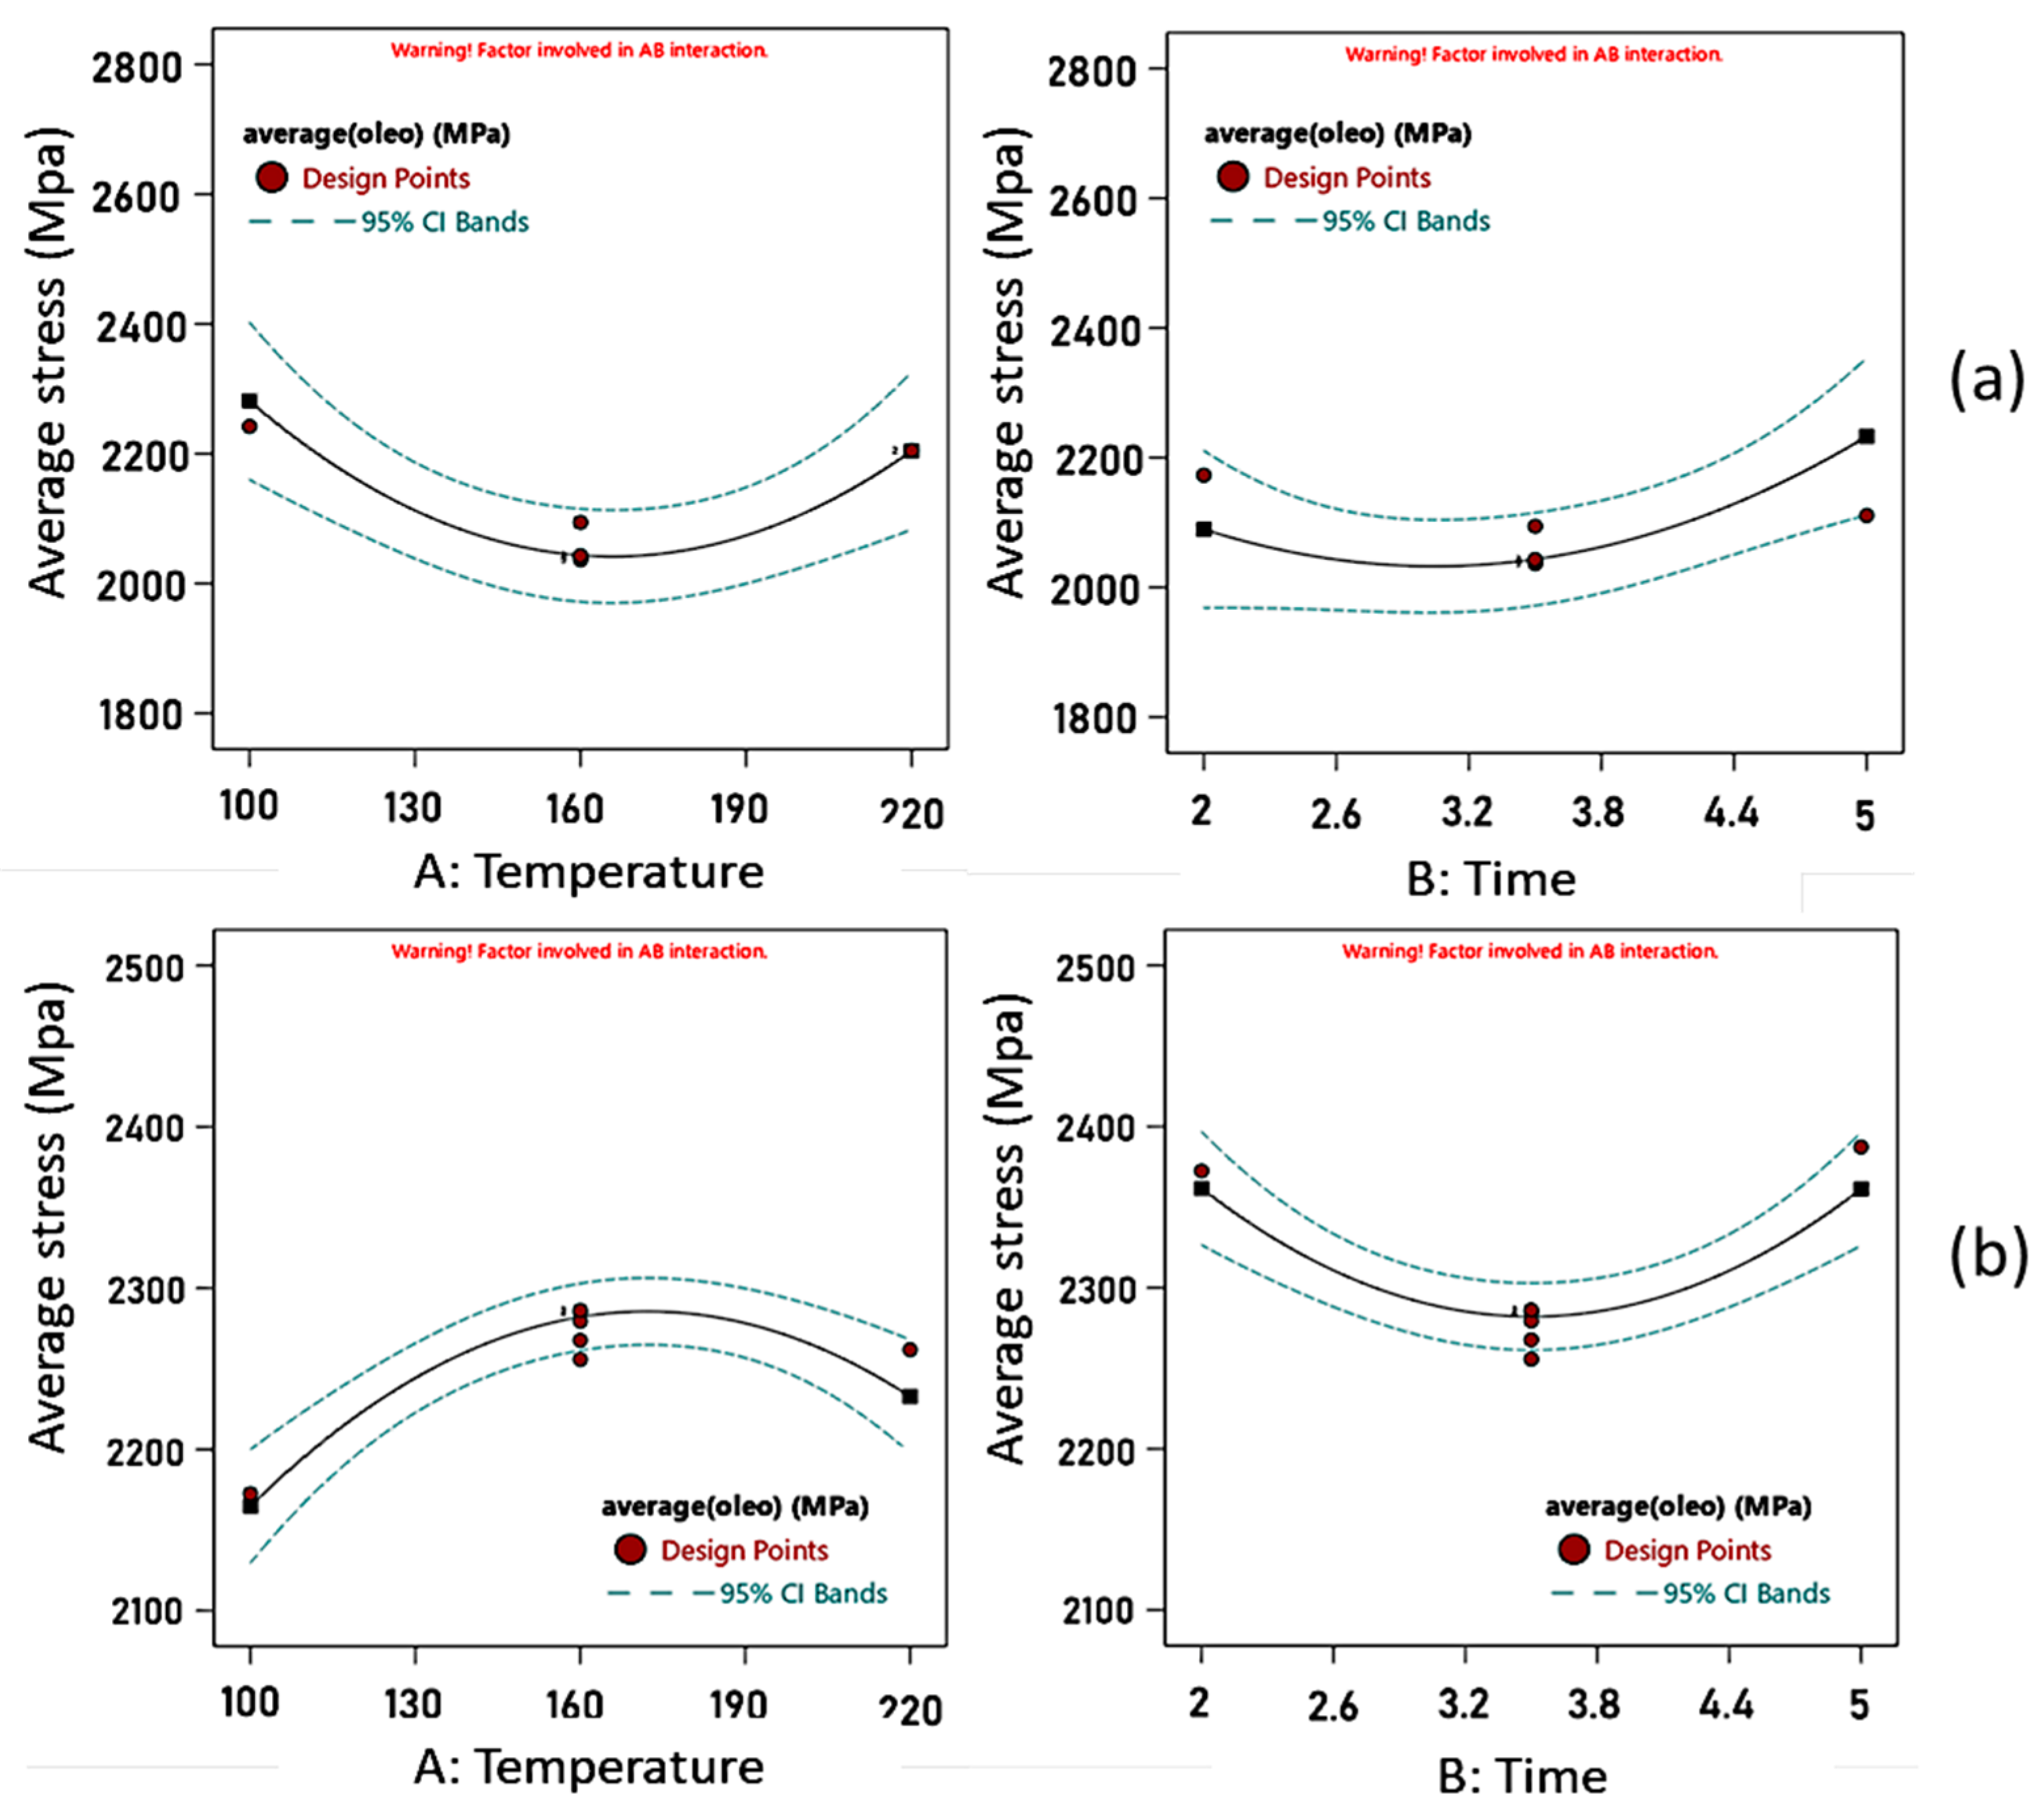
Figure 13.
TG and DTG profiles of Dabema (Piptadeniastrum africanum) illustrating the stages of thermal degradation.
Figure 13.
TG and DTG profiles of Dabema (Piptadeniastrum africanum) illustrating the stages of thermal degradation.
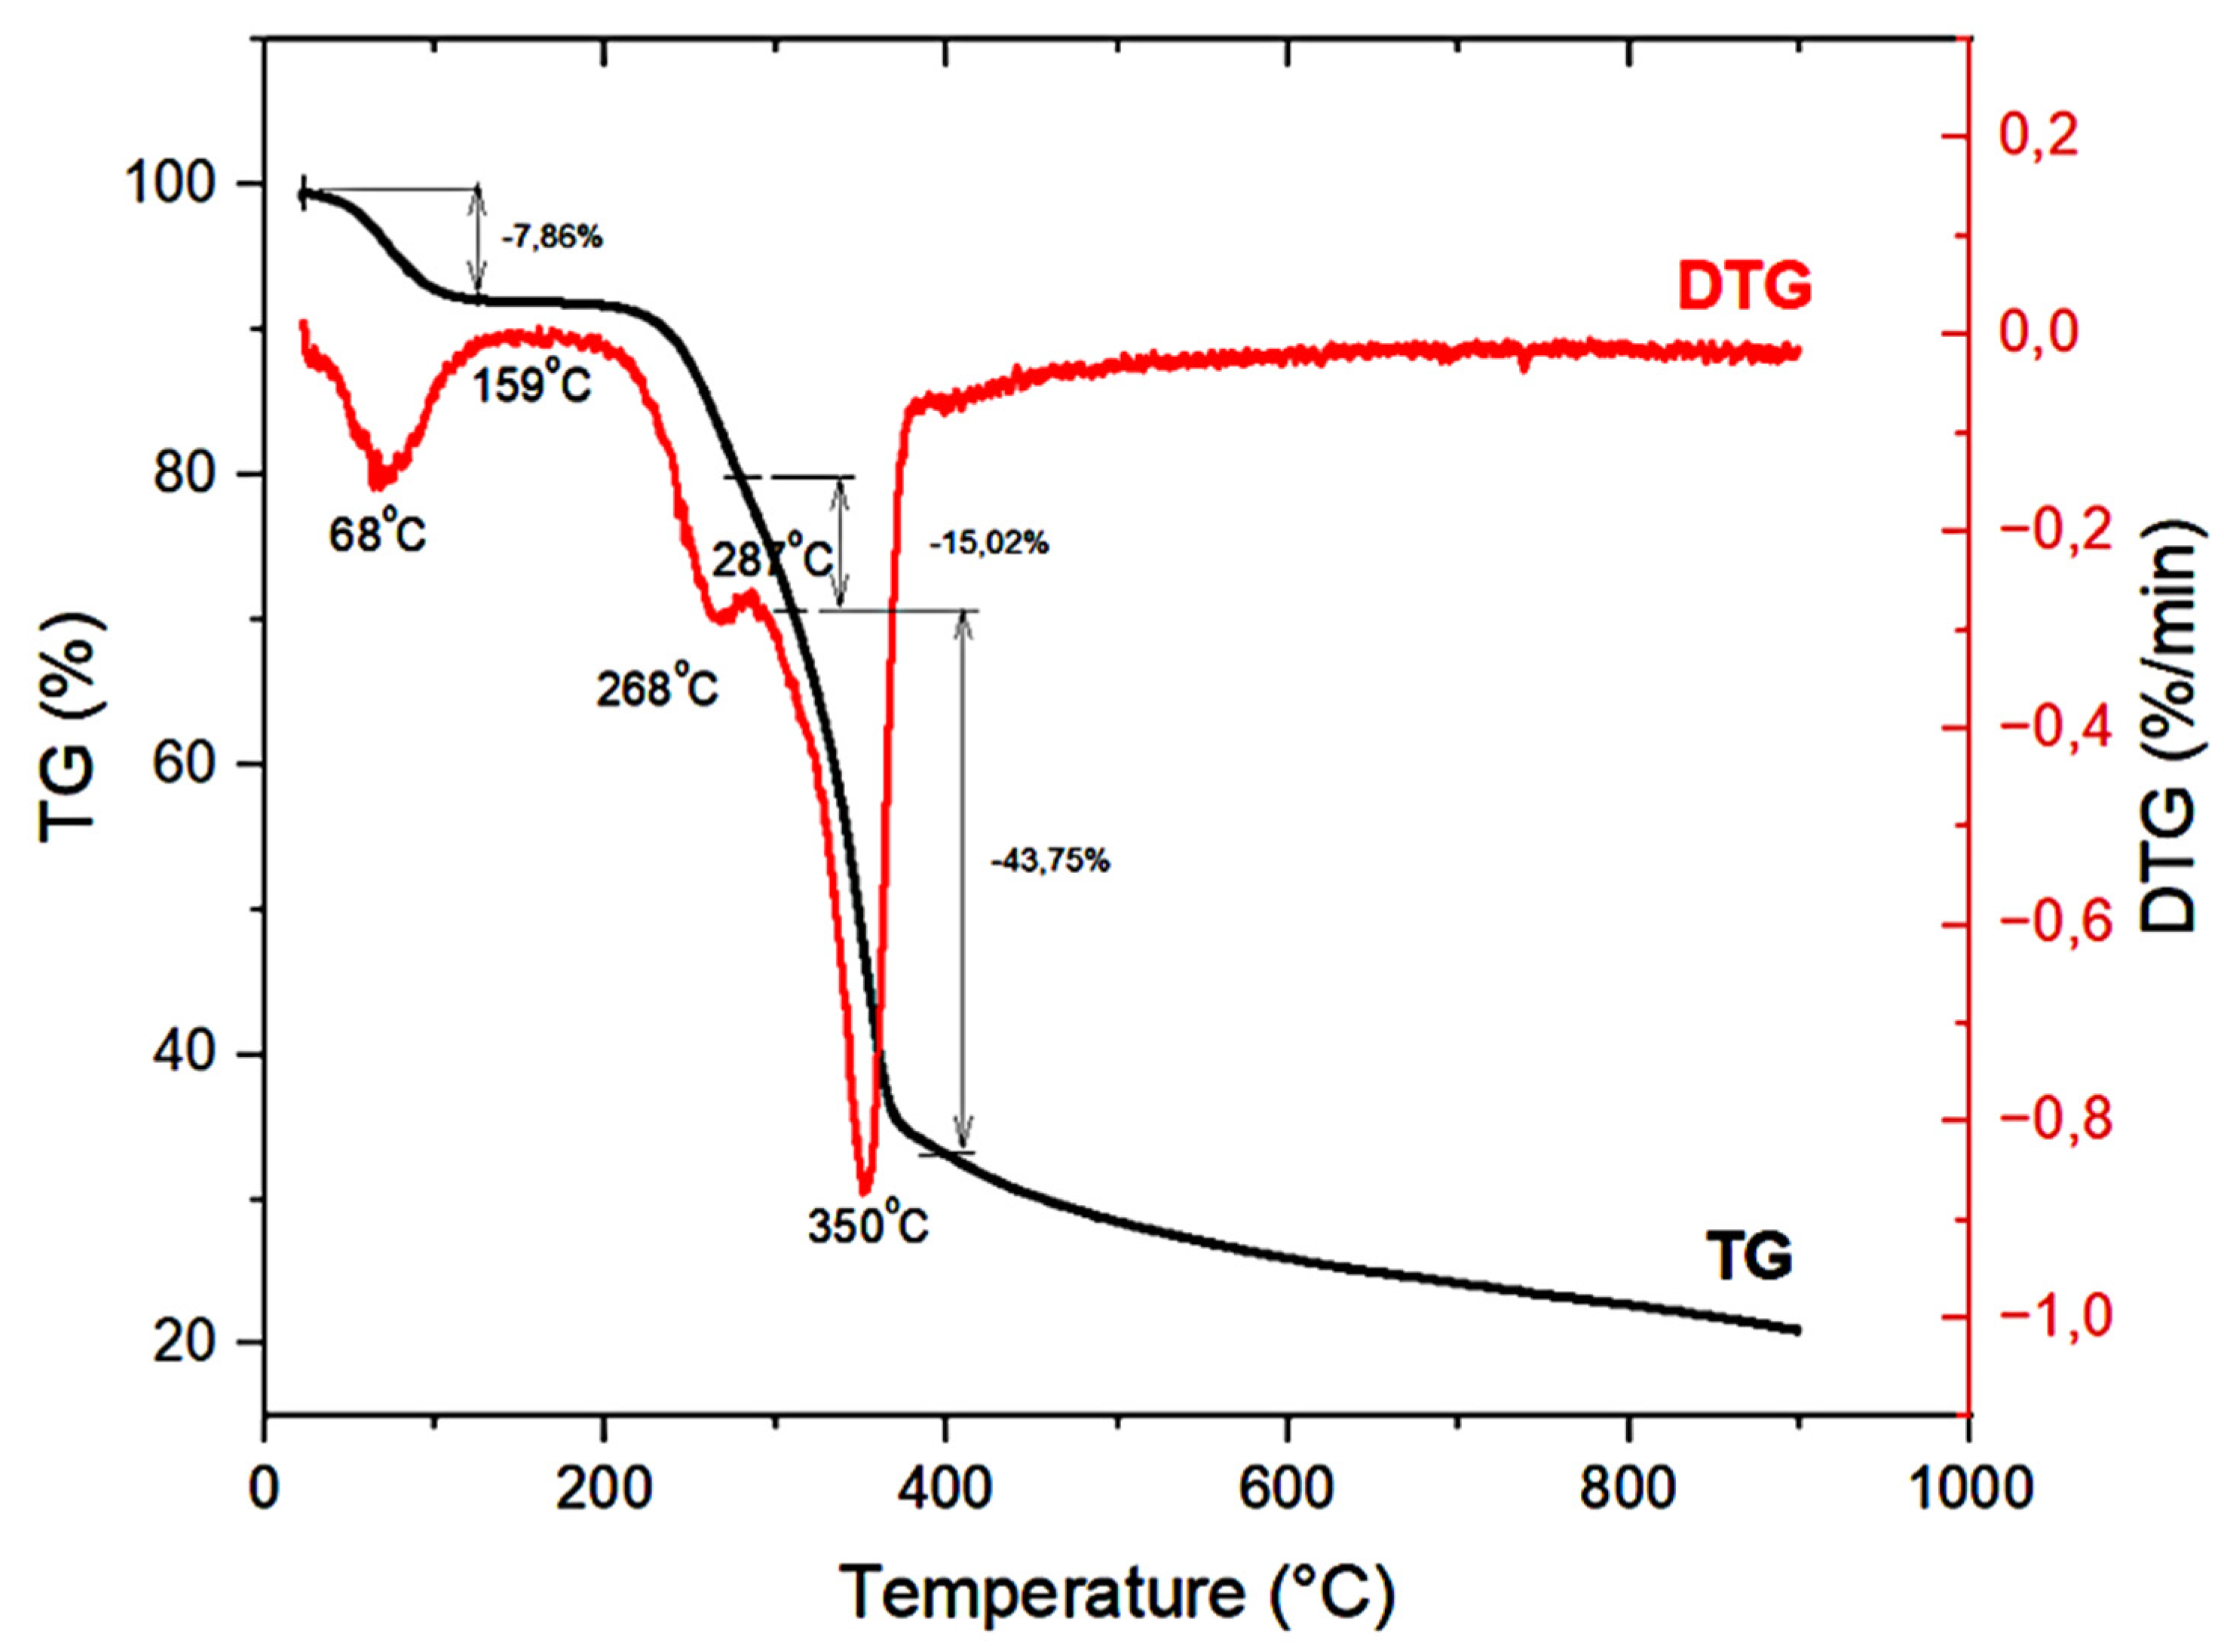
Figure 14.
Thermal analysis of beech wood during heat treatment between 200 and 300 °C: (a) TG curves, representing mass loss as a function of temperature; (b) DTG curves, indicating the rate of mass loss as a function of temperature.
Figure 14.
Thermal analysis of beech wood during heat treatment between 200 and 300 °C: (a) TG curves, representing mass loss as a function of temperature; (b) DTG curves, indicating the rate of mass loss as a function of temperature.
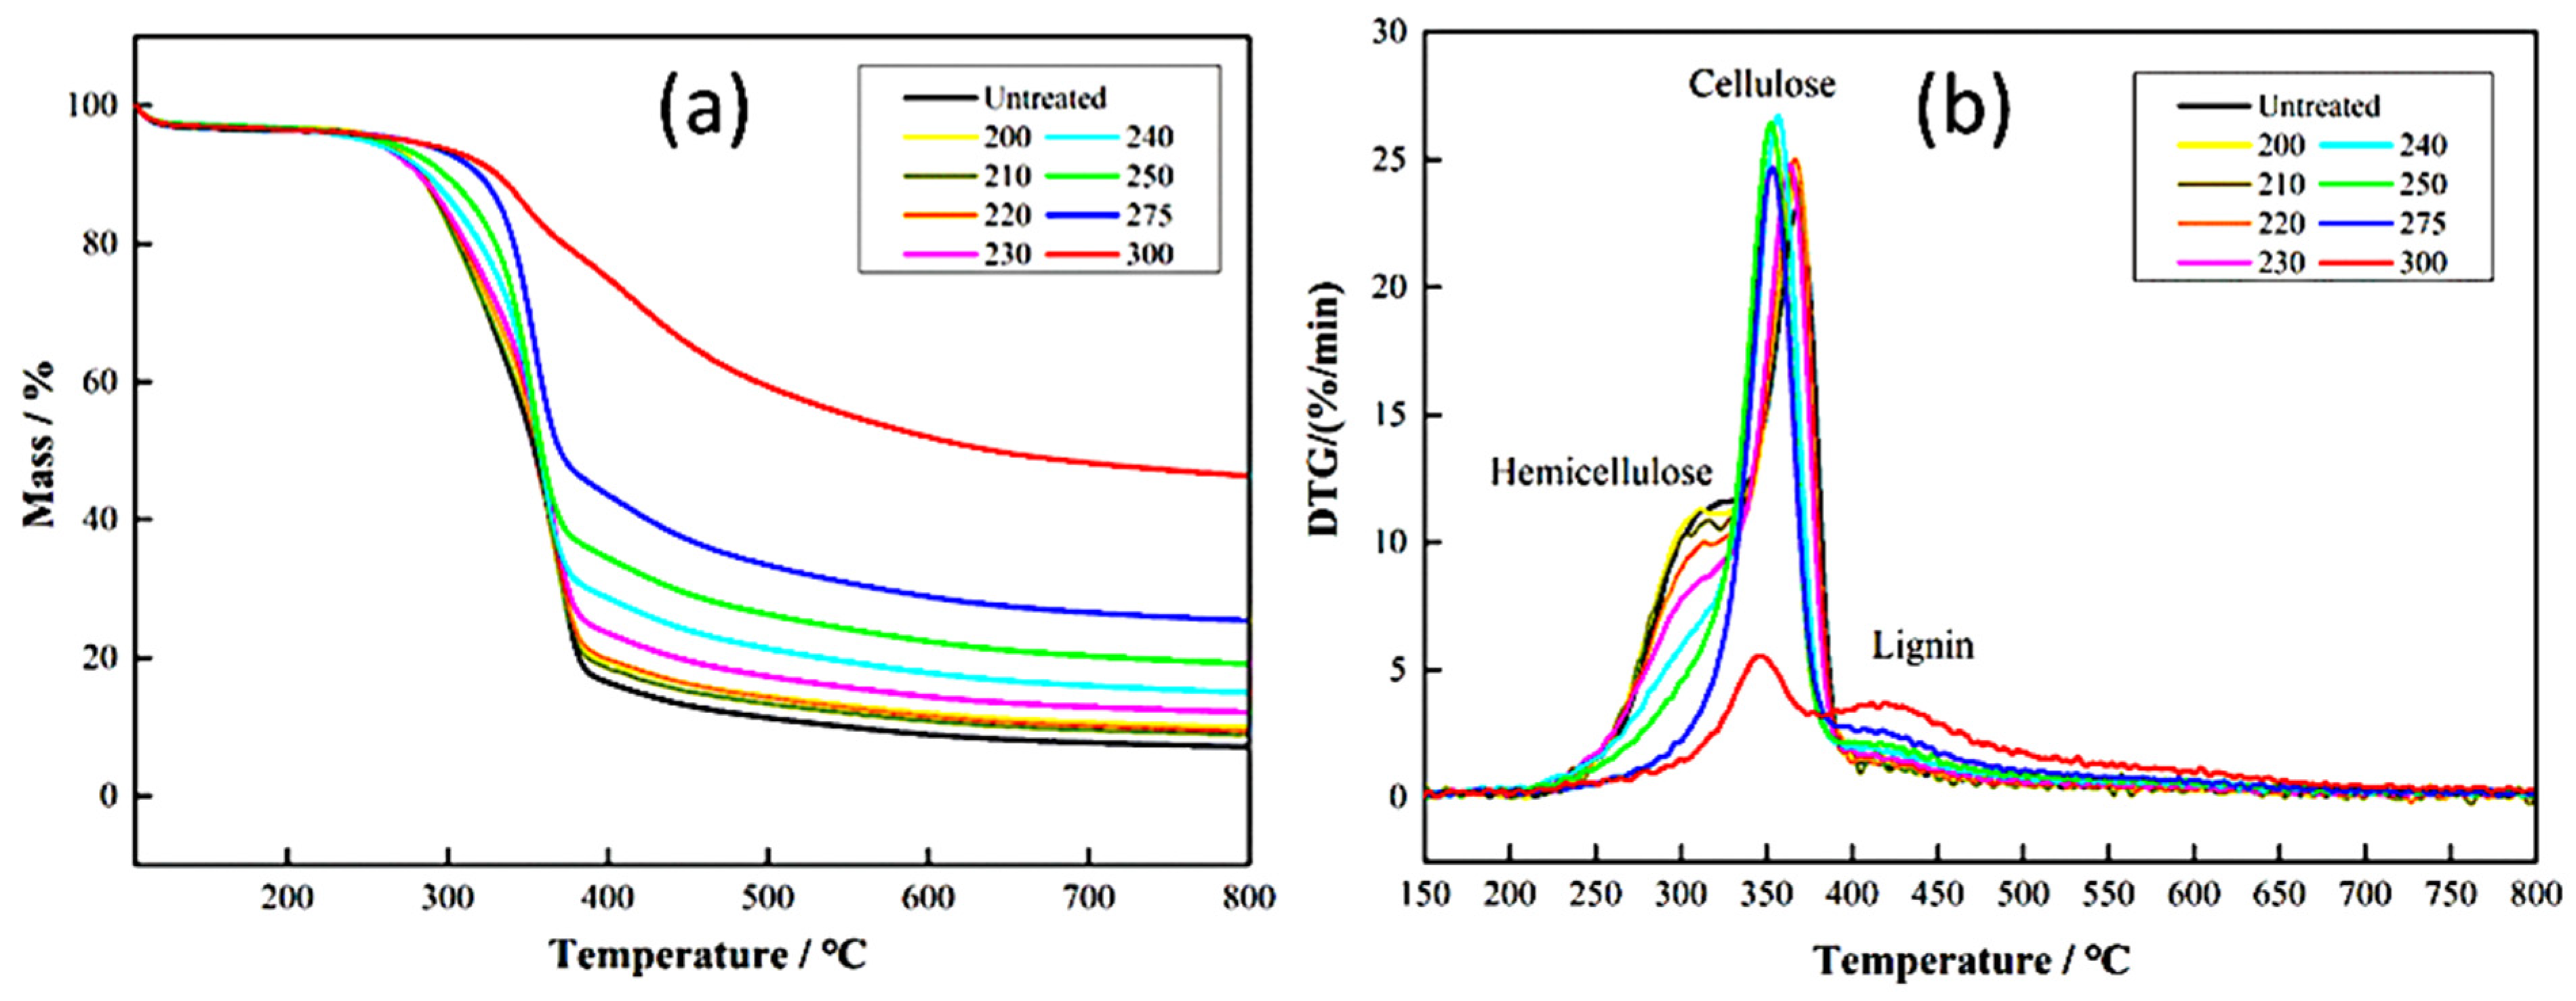
Figure 15.
Thermal analysis of fir during heat treatment from 120 to 200 °C: (a) TG curves, representing mass loss as a function of temperature; (b) DTG curves, showing the rate of mass loss as a function of temperature.
Figure 15.
Thermal analysis of fir during heat treatment from 120 to 200 °C: (a) TG curves, representing mass loss as a function of temperature; (b) DTG curves, showing the rate of mass loss as a function of temperature.
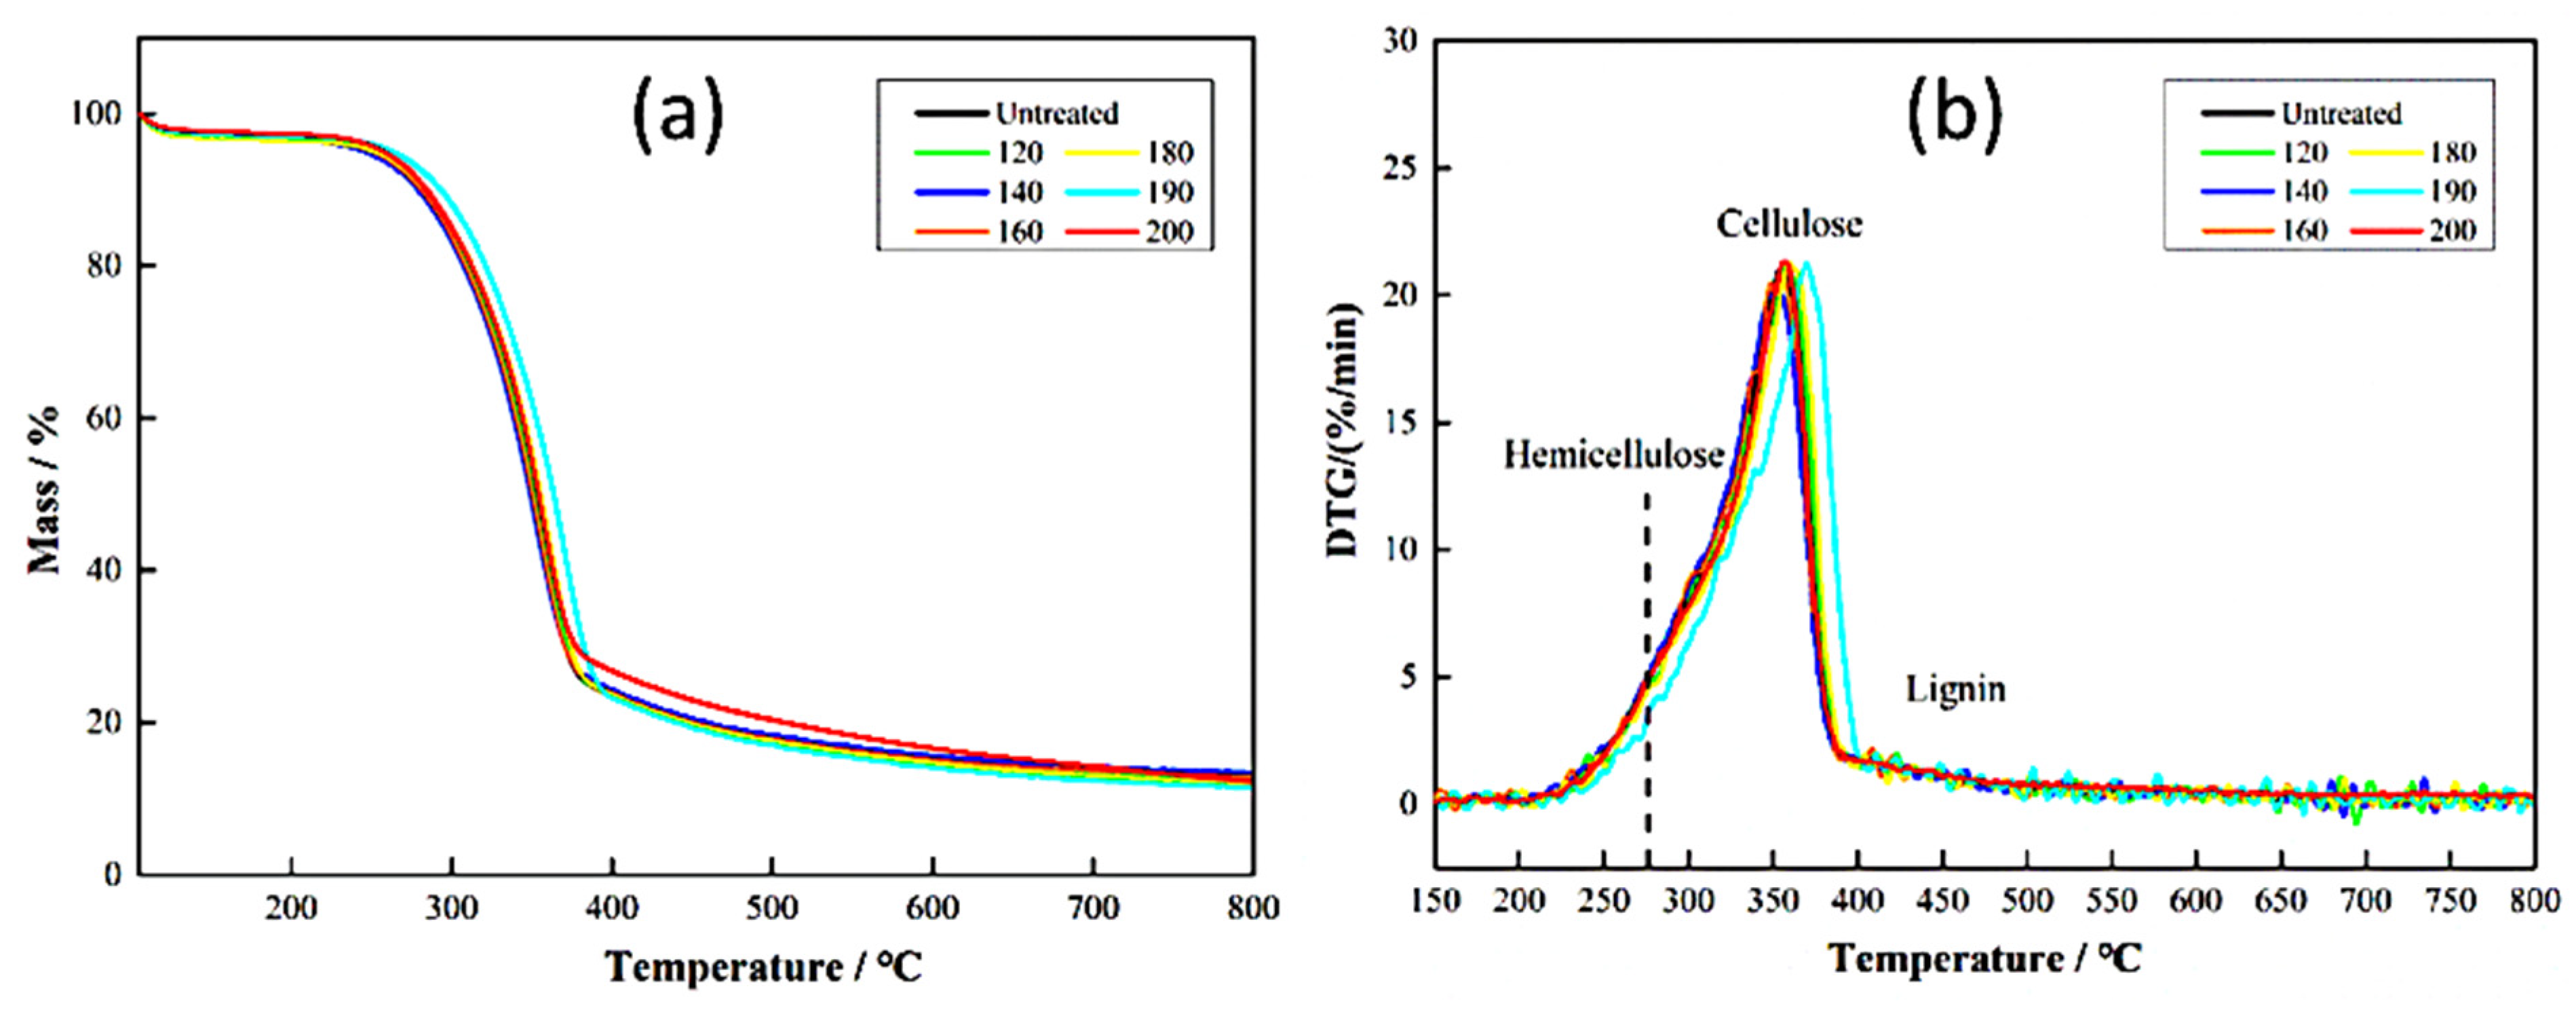
Figure 16.
Thermal analysis of fir during heat treatment from 200 to 300 °C: (a) TG curves, representing mass loss as a function of temperature; (b) DTG curves, showing the rate of mass loss as a function of temperature.
Figure 16.
Thermal analysis of fir during heat treatment from 200 to 300 °C: (a) TG curves, representing mass loss as a function of temperature; (b) DTG curves, showing the rate of mass loss as a function of temperature.
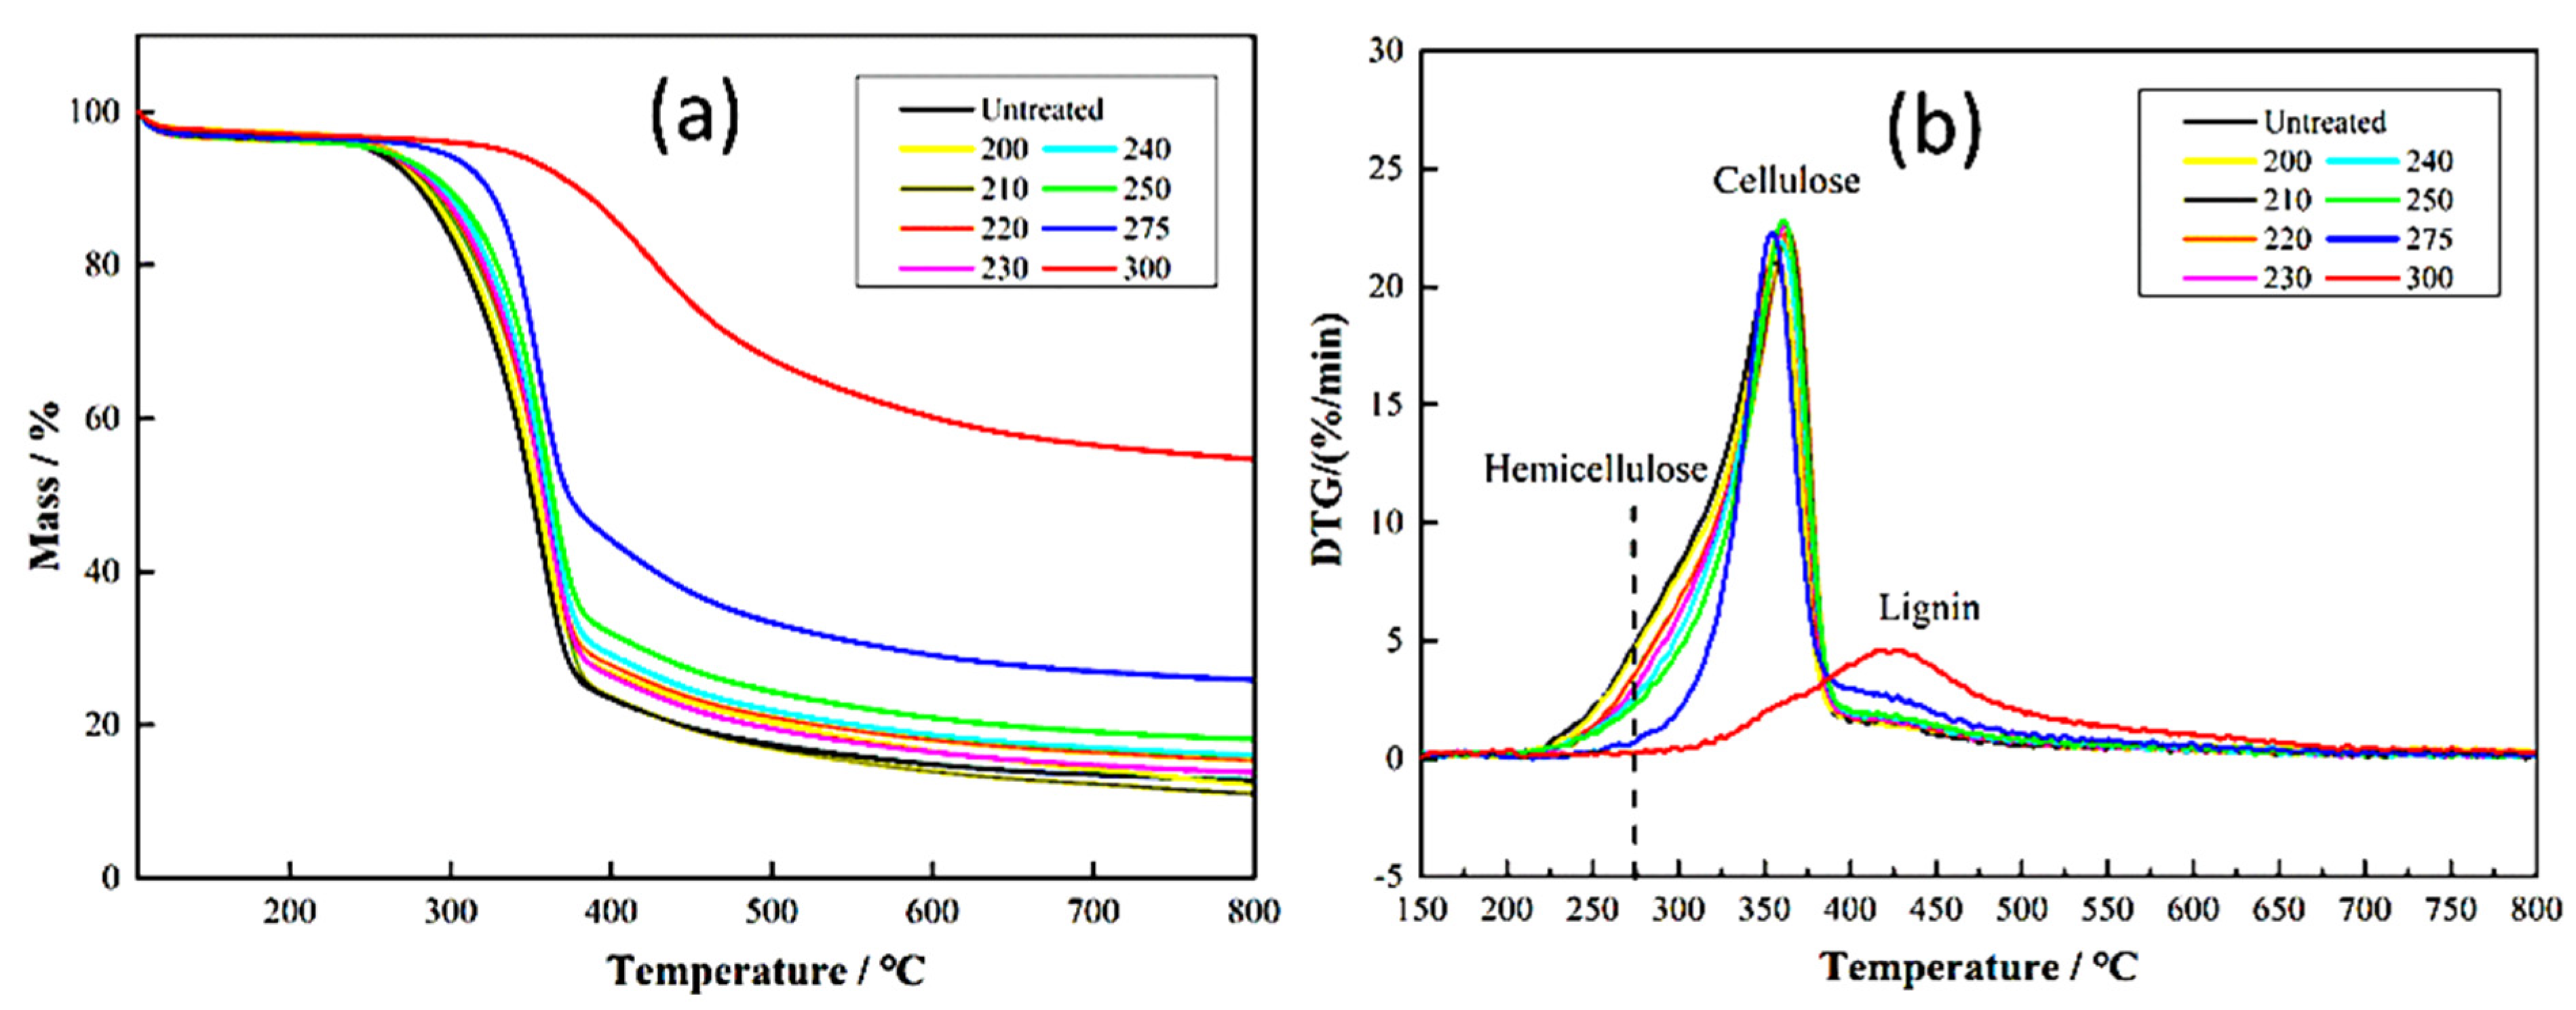

Table 1.
Characterization of physical, hygroscopic, and chromatic transformations of Dabema wood after hydrothermal and oleothermal treatments. Clusters C1-C2 show strongly reduced MOR (Table 3), while C3-C5 retain good stiffness (mean MOE 4,697 MPa ± 473 MPa) and stable MOR (74.9 MPa ± 10.3 MPa). [21] showed that hydrothermal treatment strongly degrades hemicelluloses, decreasing MOR and stiffness while increasing deformability. [34] highlighted that hemicelluloses are the most water- and heat-sensitive polymers, consistent with Cluster 2 behavior.
| Code_Ech |
Density Kg.m-3 |
EMC_%± SD | VSH_% ±SD |
VSW_% ±SD |
WA_% ±SD |
L* | a* | b* | ∆E* | C* | h* (°) |
| Ref | 963 ± 78 | 13.16 ± 0.43 | 15.80 ± 0.60 | 20.50 ± 0.75 | 78.0 ± 5.0 | 62.14 ±1.24 | 4.96 ±0.15 | 11.94 ±0.36 | - | 12.929 ±0.39 | 22.56 ±0.34 |
| Hyd100°2h | 928 ± 47 | 11.50 ± 0.32 | 14.20 ± 0.55 | 18.20 ± 0.70 | 64.0 ± 4.5 | 34.30 ±0.69 | -0.16 ±0.00 | 1.98 ±0.06 | 30 | 1.986 ±0.06 | -4.62 ±0.07 |
| Hyd100°3.5h | 942 ± 98 | 10.80 ± 0.30 | 13.50 ± 0.52 | 17.30 ± 0.68 | 59.0 ± 4.5 | 32.56 ±0.65 | -0.62 ±0.02 | 1.08 ±0.03 | 32 | 1.245 ±0.04 | -29.86 ±0.45 |
| Hyd100°5h | 938 ± 85 | 10.00 ± 0.28 | 12.80 ± 0.50 | 16.50 ± 0.65 | 54.0 ± 4.0 | 32.58 ±0.65 | -0.42 ±0.01 | 1.72 ±0.05 | 31.73 | 1.771 ±0.05 | -13.72 ±0.21 |
| Hyd160°2H | 933 ± 96 | 9.00 ± 0.26 | 11.20 ± 0.48 | 14.50 ± 0.60 | 48.0 ± 4.0 | 33.20 ±0.66 | -0.84 ±0.03 | 1.32 ±0.04 | 31.38 | 1.565 ±0.05 | -32.47 ±0.49 |
| Hyd160°3.5h | 946 ± 86 | 8.20 ± 0.27 | 10.50 ± 0.45 | 13.40 ± 0.55 | 43.0 ± 3.5 | 33.84 ±0.68 | -0.18 ±0.01 | 3.42 ±0.10 | 29.99 | 3.425 ±0.10 | -3.01 ±0.05 |
| Hyd160°5H | 959 ± 89 | 7.50 ± 0.25 | 9.80 ± 0.42 | 12.50 ± 0.50 | 39.0 ± 3.5 | 32.52 ±0.65 | -0.32 ±0.01 | 2.70 ±0.08 | 31.48 | 2.719 ±0.08 | -6.76 ±0.10 |
| Hyd220°2h | 1040 ± 93 | 7.00 ± 0.30 | 8.00 ± 0.40 | 10.50 ± 0.48 | 33.0 ± 3.0 | 39.40 ±0.79 | 2.02 ±0.06 | 7.36 ±0.22 | 23.38 | 7.632 ±0.23 | 15.35 ±0.23 |
| Hyd220°3.5h | 957 ± 49 | 6.00 ± 0.28 | 6.50 ± 0.35 | 8.20 ± 0.40 | 29.0 ± 2.8 | 31.28 ±0.63 | -0.40 ±0.01 | 2.38 ±0.07 | 32.75 | 2.413 ±0.07 | -9.54 ±0.14 |
| Hyd220°5h | 981 ± 97 | 5.20 ± 0.26 | 5.20 ± 0.30 | 6.70 ± 0.35 | 25.0 ± 2.5 | 33.10 ±0.66 | 1.12 ±0.03 | 3.94 ±0.12 | 30.37 | 4.096 ±0.12 | 15.87 ±0.24 |
| Oleo100°2h | 970 ± 69 | 8.34 ± 0.22 | 10.50 ± 0.42 | 13.20 ± 0.55 | 44.0 ± 3.5 | 50.36 ±1.01 | 12.08 ±0.36 | 19.40 ±0.58 | 15.65 | 22.854 ±0.69 | 31.91 ±0.48 |
| Oleo100°3.5h | 940 ± 27 | 7.60 ± 0.22 | 9.80 ± 0.40 | 12.20 ± 0.50 | 40.0 ± 3.2 | 45.26 ±0.91 | 10.54 ±0.32 | 16.00 ±0.48 | 18.24 | 19.160 ±0.57 | 33.37 ±0.50 |
| Oleo100°5h | 990 ± 19 | 7.00 ± 0.20 | 9.20 ± 0.38 | 11.50 ± 0.48 | 37.0 ± 3.0 | 42.30 ±0.85 | 8.38 ±0.25 | 12.38 ±0.37 | 20.14 | 14.950 ±0.45 | 34.09 ±0.51 |
| Oleo160°2h | 960 ± 68 | 7.80 ± 0.25 | 8.00 ± 0.36 | 10.20 ± 0.45 | 34.0 ± 3.0 | 42.10 ±0.84 | 8.04 ±0.24 | 11.92 ±0.36 | 20.27 | 14.378 ±0.43 | 34.00 ±0.51 |
| Oleo160°3.5h | 960 ± 46 | 7.00 ± 0.24 | 7.20 ± 0.33 | 9.30 ± 0.42 | 30.0 ± 2.8 | 40.14 ±0.80 | 6.00 ±0.18 | 7.00 ±0.21 | 22.57 | 9.220 ±0.28 | 40.60 ±0.61 |
| Oleo160°5h | 1070 ± 83 | 6.20 ± 0.22 | 6.50 ± 0.30 | 8.20 ± 0.38 | 27.0 ± 2.6 | 38.86 ±0.78 | 7.36 ±0.22 | 10.40 ±0.31 | 23.45 | 12.741 ±0.38 | 35.29 ±0.53 |
| Oleo220°2h | 1020 ± 96 | 6.00 ± 0.28 | 5.50 ± 0.28 | 7.00 ± 0.35 | 23.0 ± 2.4 | 46.66 ±0.93 | 11.30 ±0.34 | 17.78 ±0.53 | 17.71 | 21.067 ±0.63 | 32.44 ±0.49 |
| Oleo220°3.5h | 990 ± 59 | 5.30 ± 0.26 | 4.80 ± 0.26 | 6.20 ± 0.32 | 20.0 ± 2.2 | 37.02 ±0.74 | 8.62 ±0.26 | 7.58 ±0.23 | 25.76 | 11.479 ±0.34 | 48.67 ±0.73 |
| Oleo220°5h | 1070 ± 96 | 4.80 ± 0.24 | 4.20 ± 0.24 | 5.40 ± 0.30 | 17.0 ± 2.0 | 33.44 ±0.67 | 4.30 ±0.13 | 2.56 ±0.08 | 30.20 | 5.004 ±0.15 | 59.23 ±0.89 |
Table 2.
Cluster classification based on PCA for mechanical performance and recommended applications across compression, Three-point bending, and tensile tests.
Table 2.
Cluster classification based on PCA for mechanical performance and recommended applications across compression, Three-point bending, and tensile tests.
| Cluster | PCA mechanical features | Experimental codes |
Mechanical Response |
Potential applications | Loading mode(s) |
| C1 | Very low mechanical values (σ, MOR, MOE -40 à -70%); fragile; high deformation | Ref; Hyd220°2h; Hyd220°3.5h; Hyd220°5h; Hyd160°5h | Severe thermal degradation (≥160-220°C) → hemicellulose loss, cell collapse, early failure | Non-structural uses: lightweight panels, decorative coverings | Compression, Three-point bending, Tensile |
| C2 | Low strength and stiffness (MOR/MOE -40 à -60%); extreme deformation | Hyd100°2h; Hyd100°3.5h; Hyd100°5h; Hyd160°2h; Hyd160°3.5h; Oleo100°5h; Oleo160°5h; Oleo220°3.5h; Oleo220°5h | High plasticization; reduced stiffness; fibers unable to carry maximum loads | Light structures; low-stress components; shock-absorbing parts | Compression, Three-point bending, Tensile |
| C3 | Intermediate performance (MOR/MOE -10 à -25%); moderate ductility | Oleo100°2h; Oleo100°3.5h; Oleo160°2h; Oleo160°3.5h; Oleo220°2h; Hyd100°5h; Hyd100°3.5h | Moderate treatments → limited mechanical reduction; good ductility | Furniture; semi-structural panels; moderate bending components | Compression, Bending, Tensile |
| C4 | High performance (MOE loss <10-20%); σ stable or maximal; cellular consolidation | Hyd100°2h; Hyd160°3.5h; Hyd220°2h; Hyd220°5h; Oleo100°3.5h; Oleo160°2h; Oleo160°3.5h; Oleo220°2h | Consolidated microstructure; lignin–cellulose crosslinking | Frameworks; beams; structural elements; rigid components | Compression, Three-point bending, Tensile |
| C5 | Very high MOE (10-20% above control); maximum stiffness | Oleo100°5h; Oleo160°5h; Oleo220°3.5h; Oleo220°5h | Strong lignin–cellulose crosslinking; hygroscopic stabilization | Highly stressed bending applications; rigid technical components | Compression, Three-point bending, Tensile |
Table 3.
Mechanical performance of wood samples under compression, bending, and tensile with PCA cluster classification.
Table 3.
Mechanical performance of wood samples under compression, bending, and tensile with PCA cluster classification.
| Loading mode(s) | Variable | Min | Max | Mean | ±SD |
Mechanical Response |
Associated PCA cluster(s) |
| Compression | Elong_mm | 1.948 | 4.958 | 3.032 | 0.974 | Moderate deformation; ductile behaviour under thermal damage | C1-C2 (high ε), C3 (moderate) |
| ε_mm | 0.032 | 0.083 | 0.051 | 0.016 | Ductility sensitive to microstructural collapse | C1-C2 (extreme deformation) | |
| σ_MPa | 2110.94 | 2681.24 | 2291.6 | 129.7 | Stress capacity significantly reduced | C1-C2 (-40-70%), C3 (moderate loss) | |
| MOE_MPa | 26092.67 | 70836.53 | 49461.36 | 13540.12 | Heterogeneous stiffness depending on treatment | C3 (-10-25%), C4 (<10-20%), C5 (10-20%) | |
| Three-point bending | Elong_mm | 1.264 | 2.776 | 2.095 | 0.418 | Bending deformation moderately sensitive | C2 (high), C3-C5 (stable) |
| ε_mm | 0.009 | 0.020 | 0.016 | 0.003 | Small bending strain; degradation amplifies ductility | C1-C2 | |
| σ_MPa | 53.7 | 83.5 | 67.6 | 10.0 | MOR markedly decreases | C1-C2, C3 (moderate), C4-C5 (high MOR) | |
| MOE_MPa | 3903.5 | 5751.6 | 4697.0 | 473.1 | Flexural stiffness relatively stable | C3, C4, C5 | |
| MOR_MPa | 56.9 | 88.9 | 74.9 | 10.3 | Rupture stress follows degradation pattern | C1-C2 < C3 < C4-C5 | |
| Tensile | Elong_mm | 1.561 | 4.667 | 2.451 | 0.700 | Tensile deformation highly sensitive to microstructural damage | C1-C2 |
| ε_mm | 0.076 | 0.244 | 0.124 | 0.036 | High tensile ductility under degraded microstructure | C1-C2 | |
| σ_MPa | 33.99 | 63.44 | 48.55 | 7.76 | Strongly reduced tensile resistance | C1-C2 | |
| MOE_MPa | 177.1 | 502.1 | 402.8 | 69.6 | Significant stiffness loss in tensile | C1-C2 | |
| MOR_MPa | 36.89 | 90.65 | 56.96 | 12.11 | High sensitivity to thermal and hydrothermal degradation | C1-C2 |
Table 4.
Estimation of regression coefficients for hydrothermal and oleothermal treatments applied to the compression test.
Table 4.
Estimation of regression coefficients for hydrothermal and oleothermal treatments applied to the compression test.
| Treatment | Test | Coefficient | β | Df | Ss | Ms | F-value | P-value | CI 95% |
| Hydrothermal | Compression | Intercept | 2043.52 | 1 | - | - | - | - | [1971.92;2115.13] |
| Hydrothermal | Compression | T-temp. | -38.53 | 1 | 8906.59 | 8906.59 | 1.67 | 0.2367 | [-108.93 ;31.88] |
| Hydrothermal | Compression | t-time | 71.55 | 1 | 30717.85 | 30717.85 | 5.78 | 4.72E-2 | [1.15;141.96] |
| Hydrothermal | Compression | T² | 199.32 | 1 | 1.097E5 | 1.097E5 | 20.63 | 6.4E-3 | [95.55;303.09] |
| Hydrothermal | Compression | t² | 117.67 | 1 | 38242.97 | 38242.97 | 7.19 | 2.7E-3 | [13.90;221.44] |
| Hydrothermal | Compression | Tt | -139.77 | 1 | 78145.41 | 78145.41 | 14.69 | 3.15E-2 | [-226.00 ; -53.55] |
| Hydrothermal | Compression | Model | - | 5 | 3.486E5 | 69718.92 | 13.11 | 1.9E-3 | - |
| Hydrothermal | Compression | Lack of fit | - | 3 | 34890.19 | 11630.06 | 19.87 | 7.3E-3 | - |
| Hydrothermal | Compression | Residuals | - | 3 | 37231.90 | 5318.84 | - | - | - |
| Oleothermal | Compression | Intercept | 2282.08 | 1 | - | - | - | - | [2261.32;2302] |
| Oleothermal | Compression | T-temp. | 34.01 | 1 | 6942.12 | 6942.12 | 15.52 | 5.6E-3 | [13.60;54.43] |
| Oleothermal | Compression | t-time | -1.1883 | 1 | 0.2128 | 0.2128 | 5E-4 | 0.9832 | [-20.60 ;20.23] |
| Oleothermal | Compression | T² | -83.30 | 1 | 19165.43 | 19165.43 | 42.85 | 3E-4 | [-113.39 ; -53.21] |
| Oleothermal | Compression | t² | 79.43 | 1 | 17424.37 | 17424.37 | 38.96 | 4E-4 | [49.34;109.52] |
| Oleothermal | Compression | Tt | 5.65 | 1 | 127.69 | 127.69 | 0.2855 | 0.6097 | [-19.35 ;30.65] |
| Oleothermal | Compression | Model | - | 5 | 33584.55 | 6716.91 | 15.02 | 1.3E-3 | - |
| Oleothermal | Compression | Lack of fit | - | 3 | 2463.94 | 821.31 | 4.93 | 0.0788 | - |
| Oleothermal | Compression | Residuals | - | 7 | 3130.74 | 447.25 | - | - | - |
Table 5.
Estimation of regression coefficients for hydrothermal and oleothermal treatments applied to the three-point bending test.
Table 5.
Estimation of regression coefficients for hydrothermal and oleothermal treatments applied to the three-point bending test.
| Treatment | Test | Coefficient | β | Df | Ss | Ms | F-value | P-value | CI 95% |
| Hydrothermal | Bending | Intercept | 80.81 | 1 | - | - | - | - | [77.51;84.11] |
| Hydrothermal | Bending | T-temp. | 2.07 | 1 | 25.67 | 25.67 | 2.27 | 0.1756 | [-1.18 ;5.31] |
| Hydrothermal | Bending | t-time | 3.83 | 1 | 88.01 | 88.01 | 7.79 | 2.69E-2 | [0.5842;7.08] |
| Hydrothermal | Bending | T² | -9.72 | 1 | 261.08 | 261.08 | 23.09 | 2E-3 | [-14.51 ; -4.94] |
| Hydrothermal | Bending | t² | -7.51 | 1 | 155.67 | 155.67 | 13.77 | 7.5E-3 | [-12.29 ; -2.72] |
| Hydrothermal | Bending | Tt | 4.21 | 1 | 70.98 | 70.98 | 6.28 | 4.07E-2 | [0.2372;8.19] |
| Hydrothermal | Bending | Model | - | 5 | 851.84 | 170.37 | 15.07 | 1.3E-3 | - |
| Hydrothermal | Bending | Lack of fit | - | 3 | 78.96 | 26.32 | 601.34 | <1E-4 | - |
| Hydrothermal | Bending | Residuals | - | 7 | 79.14 | 11.31 | - | - | - |
| Oleothermal | Bending | Intercept | 88.76 | 1 | - | - | - | - | [83.72;93.80] |
| Oleothermal | Bending | T-temp. | -6.97 | 1 | 291.62 | 291.62 | 11.09 | 1.26E-2 | [-11.92 ; -2.02] |
| Oleothermal | Bending | t-time | 2.70 | 1 | 43.85 | 43.85 | 1.67 | 0.2377 | [-2.25 ;7.65] |
| Oleothermal | Bending | T² | -13.61 | 1 | 511.50 | 511.50 | 19.45 | 3.1E-3 | [-20.91 ; -6.31] |
| Oleothermal | Bending | t² | -9.07 | 1 | 227.40 | 227.40 | 8.64 | 0.0217 | [-16.37 ; -1.78] |
| Oleothermal | Bending | Tt | -4.08 | 1 | 66.75 | 66.75 | 2.54 | 0.1552 | [-10.15 ;1.98] |
| Oleothermal | Bending | Model | - | 5 | 1570.52 | 314.10 | 11.94 | 2.6E-3 | - |
| Oleothermal | Bending | Lack of fit | - | 3 | 184.13 | 61.38 | 1.427E5 | <1E-4 | - |
| Oleothermal | Bending | Residuals | - | 7 | 184.13 | 26.30 | - | - | - |
Table 6.
Estimation of regression coefficients for hydrothermal and oleothermal treatments applied to the tensile test.
Table 6.
Estimation of regression coefficients for hydrothermal and oleothermal treatments applied to the tensile test.
| Treatment | Test | Coefficient | β | Df | Ss | Ms | F-value | P-value | CI 95% |
| Hydrothermal | Tensile | Intercept | 79.88 | 1 | - | - | - | - | [74.64;85.12] |
| Hydrothermal | Tensile | T-temp. | 3.44 | 1 | 70.86 | 70.86 | 2.48 | 0.1590 | [-1.72 ;8.59] |
| Hydrothermal | Tensile | t-time | -1.48 | 1 | 13.11 | 13.11 | 0.4597 | 0.5195 | [-6.63 ;3.68] |
| Hydrothermal | Tensile | T² | -25.98 | 1 | 1863.63 | 1863.63 | 65.34 | 1E-4 | [-33.58 ; -18.38] |
| Hydrothermal | Tensile | t² | -2.73 | 1 | 20.60 | 20.60 | 1.03 | 0.4235 | [-10.33 ;4.87] |
| Hydrothermal | Tensile | Tt | -2.71 | 1 | 29.32 | 29.32 | 14.69 | 0.3444 | [-9.02 ;3.61] |
| Hydrothermal | Tensile | Model | - | 5 | 2492.04 | 498.41 | 17.47 | <8E-4 | - |
| Hydrothermal | Tensile | Lack of fit | - | 3 | 199.58 | 66.53 | 3563.26 | <1E-4 | - |
| Hydrothermal | Tensile | Residuals | - | 7 | 199.65 | 28.52 | - | - | - |
| Oleothermal | Tensile | Intercept | 77.10 | 1 | - | - | - | - | [73.15;81.06] |
| Oleothermal | Tensile | T-temp. | 2.04 | 1 | 25.09 | 25.09 | 1.55 | 0.2535 | [-1.84 ;5.93] |
| Oleothermal | Tensile | t-time | -1.26 | 1 | 9.45 | 9.45 | 0.5831 | 0.4701 | [-5.14 ;2.63] |
| Oleothermal | Tensile | T² | -8.16 | 1 | 183.94 | 183.94 | 11.35 | 0.0119 | [-13.89 ; -2.43] |
| Oleothermal | Tensile | t² | -16.84 | 1 | 783.32 | 783.32 | 48.33 | 2E-4 | [-22.57 ; -11.11] |
| Oleothermal | Tensile | Tt | 0.8425 | 1 | 2.84 | 2.84 | 0.1752 | 0.6881 | [-3.92 ;5.60] |
| Oleothermal | Tensile | Model | - | 5 | 1507.15 | 301.43 | 18.60 | 6E-4 | - |
| Oleothermal | Tensile | Lack of fit | - | 3 | 106.56 | 35.52 | 20.62 | 6.8E-3 | - |
| Oleothermal | Tensile | Residuals | - | 7 | 113.46 | 16.21 | - | - | - |
Disclaimer/Publisher’s Note: The statements, opinions and data contained in all publications are solely those of the individual author(s) and contributor(s) and not of MDPI and/or the editor(s). MDPI and/or the editor(s) disclaim responsibility for any injury to people or property resulting from any ideas, methods, instructions or products referred to in the content. |
© 2025 by the authors. Licensee MDPI, Basel, Switzerland. This article is an open access article distributed under the terms and conditions of the Creative Commons Attribution (CC BY) license (http://creativecommons.org/licenses/by/4.0/).
Copyright: This open access article is published under a Creative Commons CC BY 4.0 license, which permit the free download, distribution, and reuse, provided that the author and preprint are cited in any reuse.


