
Submitted:
03 December 2025
Posted:
05 December 2025
You are already at the latest version
Abstract
The morphology of solid surfaces encodes fundamental information about the physical mechanisms that govern their formation. Here, we reinterpret scanning electron microscopy (SEM) micrographs of oxide thin films as two-dimensional self-affine surfaces and analyze them using a multiscale statistical-physics framework that integrates spectral, multifractal, geometric, and topological descriptors. Fourier-based power spectral density (PSD) provides the spectral slope β and apparent Hurst exponent H, while multifractal scaling yields the information dimensions D_q, the singularity spectrum f(α), and its width Δα, which quantify scale hierarchy and intermittency. Lacunarity captures intermediate-scale heterogeneity, and Minkowski functionals—especially the Euler characteristic χ(θ)—probe connectivity and identify the onset of a percolation-like network structure. Two representative surfaces with contrasting morphologies are used as model systems: one exhibiting an anisotropic, porous, strongly multifractal structure with fragmented domains; the other showing a compact, nearly isotropic, and nearly monofractal organization. The porous regime displays steep PSD decay, broad multifractal spectra, and positive χ, consistent with a sub-percolated, diffusion-limited, Edwards–Wilkinson-like (EW-like) growth regime. Conversely, the compact regime exhibits gentler spectral slopes, narrower f(α), enhanced lacunarity at intermediate scales, and a χ(θ) zero-crossing indicative of a connectivity transition where a surface becomes a percolating network, consistent with a Kardar–Parisi–Zhang-like (KPZ-like) correlated growth regime. These results demonstrate that individual SEM micrographs encode quantitative fingerprints of nonequilibrium universality classes and topology-driven transitions from fragmented surfaces to connected networks, establishing SEM as a quantitative probe for testing theories of rough surfaces and kinetic growth in experimental thin-film systems.
Keywords:
scanning electron microscopy (SEM)
; thin-film surfaces
; self-affine morphology
; power spectral density (PSD)
; Hurst exponent (H)
; multifractal analysis
; lacunarity
; Minkowski functionals
; Euler characteristic χ(θ)
; percolation threshold
; EW/KPZ universality classes
1. Introduction
Surface roughness and morphology play a central role in determining the physical and functional properties of thin films, influencing adsorption, catalysis, optics, and electronic transport [1,2,3,4,5]. Beyond their technological relevance, rough surfaces are also paradigmatic systems in statistical physics [1,2,3,6,7]. Their geometry reflects stochastic processes governed by diffusion, aggregation, and curvature-driven relaxation, which can often be mapped onto canonical kinetic-growth models such as the Edwards–Wilkinson (EW) and Kardar–Parisi–Zhang (KPZ) equations [8,9]:
where is the surface height field with , an effective surface tension (smoothing term), a non-linear coupling, and is a zero-mean Gaussian noise term satisfying with amplitude [8,9].
These models predict self-affine scaling defined by the roughness exponent , growth exponent , and dynamic exponent [1,2,3,6]. In the spatial domain, the isotropic power spectral density follows , where the apparent Hurst exponent is [1,2,6].
Kinetic roughening theory has been extensively developed since the seminal EW and KPZ formulations [8,9] supported by comprehensive treatments of fractal scaling, universality, and out-of-equilibrium surface growth [1,2,3,6,7]. Parallel advances in integral geometry have established Minkowski functionals as rigorous descriptors of area, boundary length, and connectivity [10], while percolation theory provides the conceptual framework for topological phase transitions in complex media [11]. Experimentally, atomic force microscopy (AFM) and profilometry remain dominant for extracting scaling exponents in thin films [1,2]. By contrast, scanning electron microscopy (SEM), despite its ubiquity and high lateral resolution, is still used mostly qualitatively, with limited adoption as a quantitative surrogate for height-field statistics [1,2,3,6].
Recent studies have revived spectral, multifractal, and topological characterizations in real thin-film systems, and this renewed interest is clearly reflected in recent literature. However, important methodological gaps remain.
Bibliometric analyses report a growing adoption of fractal and multifractal techniques in coatings and functional films, underscoring their diagnostic value for hierarchical morphology while also noting the absence of unified pipelines that connect such descriptors to kinetic-growth universality classes [12]. Case studies on nanostructured and polymeric films reveal multifractal signatures and scale-dependent roughness, but typically do not map the measured spectra onto EW/KPZ exponents or dynamic-scaling relations [13]. Analyses of metallic thin films quantify anisotropy and heterogeneity using multifractal descriptors, yet remain essentially morphological, without identifying topological invariants or connectivity thresholds [14]. Finally, works combining Minkowski functionals with fractal metrics in porous thin films demonstrate geometry–function complementarity, although they do not report topological transitions (e.g., Euler-characteristic sign changes) nor relate their findings to universality-class fingerprints [15].
Viewed as a whole, the field rests on solid theoretical foundations [1,2,3,6,7,8,9,10,11] and shows a growing body of recent applications [12,13,14,15], but lacks a consensus framework that (i) treats SEM intensities explicitly as 2D statistical fields; (ii) unifies spectral (PSD), intermittency (multifractals), and topological (Minkowski/Euler) metrics within a single methodology; and (iii) anchors these descriptors to the universality classes of kinetic roughening and to percolation-type connectivity transitions. In addition to these conceptual gaps, several methodological limitations persist in the existing literature: (iv) the scarcity of quantitative validation against synthetic surfaces generated from the EW or KPZ equations, which would strengthen the interpretability of experimentally derived exponents [1,2,3,8,9]; (v) the implicit use of SEM intensities as non-calibrated proxies for the height field h(x,y), an assumption seldom examined critically [1,2,3,6]; (vi) the limited assessment of robustness with respect to image pre-processing procedures such as histogram equalization, thresholding, or denoising; and (vii) the lack of fully specified and reproducible analysis pipelines, which hinders methodological transferability across materials systems. These limitations, collectively, complicate the consolidation of a rigorous bridge between experimentally observed morphologies and the universality classes of nonequilibrium growth.
Furthermore, despite the growing interest in multiscale morphological descriptors, few studies explicitly compare spectral, multifractal, geometric, and topological metrics within a single unified framework. This fragmentation makes it difficult to evaluate how different descriptors respond to changes in connectivity, pore geometry, or correlation strength, and limits the ability to identify which metrics are truly sensitive to universality-class transitions. Developing integrated approaches that quantify these complementary aspects simultaneously therefore remains an open methodological challenge in the field.
In related work, Eleutério et al. (2023) demonstrated the growth and structural characterization of nanostructured TiO2 films on lignocellulosic fibres (XRD/SEM) [4], while Vasconcelos et al. (2025) analyzed the surface roughness of sputtered TiO2 thin films using GLCM and fractal descriptors [5]. These studies established the materials platform and showed that image-based metrics are sensitive to morphology. However, they did not (i) interpret descriptors within EW/KPZ universality, (ii) quantify multifractal intermittency through and , or (iii) deploy Minkowski/Euler analysis to reveal percolation-like topological transitions.
In this work, we address these gaps. We show that SEM intensity maps, despite lacking height calibration, retain sufficient spatial correlation to act as statistical surrogates for the surface field . By applying a unified hierarchy of analyses—power spectral density, lacunarity, multifractal spectra, and Minkowski functionals—we extract quantitative descriptors of self-affinity, intermittency, heterogeneity, and connectivity. Two oxide surfaces with contrasting morphologies serve as model systems. The objective is not to revisit deposition parameters but to treat the surfaces themselves as physical systems and to bridge SEM-derived morphology to universality classes of nonequilibrium surface growth [1,2,3,6,7,8,9,10,11,12,15].
We demonstrate that single SEM micrographs encode concurrent spectral, multifractal, and topological fingerprints—revealing transitions from Edwards–Wilkinson-like (fragmented) to Kardar–Parisi–Zhang-like (connected) regimes and identifying percolation-like topology via .
2. Materials and Methods
2.1. Notation and Field Proxy
In growth equations we write , where denotes lateral position and the growth time. For image-based spatial statistics, we analyze a fixed-time snapshot . In practice, the SEM intensity field is used as a surrogate for , as it preserves the lateral correlation statistics relevant to scaling (PSD, ) and topology (Minkowski functionals), even though it does not provide absolute height calibration.
2.2. SEM Dataset
Two representative oxide surfaces with distinct morphologies—Sample A (porous) and Sample B (compact)—were selected as case studies. The images were acquired by scanning electron microscopy (SEM) under identical magnification and contrast settings to ensure comparable pixel scaling. All analyses were performed directly on the grayscale intensity field , after removal of scale bars and labels. Intensities were normalized to the range .
2.3. Pre-Processing
Each image was cropped to a uniform region of interest and equalized using Contrast Limited Adaptive Histogram Equalization (CLAHE) to correct for the large-scale brightness gradients typical of SEM detectors. The resulting field was interpreted as a surrogate for the surface height , preserving spatial correlations relevant to self-affine scaling and topological structure.
To ensure that the extracted descriptors were not artifacts of image pre-processing, a set of robustness checks was performed. First, the analyses were repeated using alternative contrast-normalization strategies (global histogram equalization, CLAHE with varying clip limits, and linear rescaling), confirming that the PSD slopes, multifractal widths Δα, and Euler-characteristic curves χ(θ) varied by less than 3% across all trials. Second, the segmentation-based quantities (lacunarity and χ(θ)) were recomputed under small threshold perturbations (±5% around the nominal threshold), which preserved the qualitative features of the curves, including the presence or absence of χ zero-crossings. Finally, mild Gaussian denoising and median filtering were tested to emulate detector noise; these produced no qualitative changes in the PSD, multifractal spectra, or Minkowski functionals. Altogether, these tests confirm that the reported descriptors are driven by intrinsic morphological organization rather than by pre-processing choices.
2.4. Power Spectral Analysis
The isotropic power spectral density (PSD) was computed from the two-dimensional Fourier transform:
where is the Fourier transform of .
The slope was extracted from the linear region of the log–log PSD, typically spanning one decade of spatial frequencies.
The apparent Hurst exponent was computed as:
which quantifies long-range spatial correlations. For isotropic self-affine surfaces, the two-point correlation function scales as .
2.5. Multifractal Analysis
To characterize spatial intermittency and scale coupling, the multifractal partition function was computed over non-overlapping boxes of size :
where is the local mass (sum of pixel intensities) within box .
For self-similar scaling, the partition function obeys to
and the singularity spectrum is obtained via the Legendre transform:
The spectrum width quantifies multifractal heterogeneity: narrow spectra (small ) correspond to nearly monofractal surfaces, while wide spectra reveal pronounced spatial intermittency.
In practice, scaling fits were performed versus the relative box size (with the image side), equivalent to using and avoids scale-inflation artifacts.
2.5.1. Method Validation
The multifractal procedure was checked for internal consistency. Box masses were normalized at each scale ; partition functions were fitted using the relative scale in log–log space, and the smallest and largest scales were discarded to avoid edge and aliasing effects. We used to ensure numerical stability and applied a cubic-spline smoothing to prior to differentiation, which suppresses artificial end-loops.
All spectra satisfied the 2D support bound and concavity, confirming the robustness of the analysis and the physical reliability of the reported .
In addition to internal consistency checks, the analysis pipeline was designed to be compatible with future validation against synthetic EW and KPZ surfaces, which provide height fields with well-established spectral exponents and scaling behavior [1,2,3,8,9]. Although numerical simulations were beyond the scope of the present work, such validation would allow direct benchmarking of PSD slopes, multifractal widths Δα, and Minkowski-functional descriptors against theoretical universality classes, thereby strengthening the methodological verification of the framework.
To ensure full transparency and reproducibility of the analysis, Table 1 summarizes the specific parameters used for each descriptor, including the PSD fitting range, multifractal settings, lacunarity scales, threshold sampling for χ(θ), and image pre-processing steps. These parameters define the operational basis of the multiscale pipeline and ensure that the results reported in the following sections are methodologically consistent and comparable.
2.6. Lacunarity
To assess void heterogeneity, the binarized intensity map was evaluated over boxes of size , yielding:
where is the local mass (number of occupied pixels) within a box of size . Lacunarity decreases with increasing uniformity; high corresponds to porous or clustered morphologies [16].
2.7. Topological (Minkowski) Functionals
We quantify morphology and connectivity by the Minkowski functionals of the thresholder set , where is the normalized SEM intensity and is the image domain of total area
The three scalar functionals were computed as functions of the threshold :
where is the boundary of , is the number of connected components (foreground objects), and is the number of holes (background cavities within components). The percolation threshold is identified by the zero-crossing of , i.e., , marking the topological transition from isolated domains to a connected network.
In practice, is the fraction of foreground pixels; is obtained using a Crofton estimator or 8-connected boundary tracing; and is computed using 4-connectivity for foreground and 8-connectivity for background to avoid connectivity paradoxes. Small spurious components were removed by area opening. All functionals are reported per unit image area for direct comparability.
Robustness was tested by varying on a uniform grid in and by repeating the analysis after mild morphological denoising; qualitative features (including the zero-crossing of ) were unchanged.
2.8. Grain Morphometry
For visualization, grains were segmented via Otsu’s thresholding [17]. Morphological parameters such as circularity and eccentricity were computed, though these descriptors are not central to the physical interpretation. Distributions of circularity and eccentricity were summarized as histograms (Supplementary Figure S1), and their median and interquartile range values were compiled in Supplementary Table S1. These supplementary metrics provide a geometric overview of grain shape and compactness and confirm the predominance of elongated aggregates in both samples.
3. Results and Discussion
3.1. From Fragmented to Connected Surface Regimes
The two analyzed surfaces exhibit markedly contrasting morphological regimes that reflect distinct underlying growth dynamics and energy-dissipation pathways during film formation.
Sample A, the porous surface, presents an irregular texture composed of elongated aggregates, voids, and open channels. The granular units are poorly coalesced, forming a discontinuous framework with pronounced directional anisotropy. This morphology is indicative of a limited surface diffusion regime, where adatom mobility is insufficient to promote full lateral growth and coarsening, resulting in a fragmented topology. In contrast, Sample B exhibits a compact arrangement of grains, with smoother interfaces and a nearly isotropic texture. The connected domains and reduced porosity suggest a more efficient mass transport along the surface, consistent with enhanced adatom mobility and a higher degree of coalescence.
This evolution from a porous to a compact structure reflects a transition from a fragmented, anisotropic regime to a connected, homogeneous one, in which the interplay between deposition kinetics and relaxation mechanisms defines the resulting surface topology.
The morphological contrast observed in the SEM images can therefore be interpreted as a manifestation of distinct universality classes of surface growth, which can be quantitatively characterized through scaling exponents derived from power spectral density (PSD) analysis and through topological invariants extracted from Euler characteristic statistics.
The following subsections analyze these descriptors to establish the correlation between morphological order, roughness scaling, and connectivity.
3.2. Spectral Scaling and Correlation Exponents
The isotropic two-dimensional power spectral density (PSD) functions derived from the SEM micrographs provide a quantitative measure of the lateral organization of surface features and constitute the first indicator of the scaling regime governing the growth dynamics. When represented in log–log coordinates, both spectra exhibit a clear power-law decay of the form , where is the spatial frequency and the spectral exponent that encodes the distribution of spatial fluctuations along the surface. Through the usual relation , the PSD also yields the apparent Hurst exponent, which quantifies the degree of spatial correlation and the persistence of surface-height variations. Low values of indicate an uncorrelated or weakly correlated self-affine regime, whereas increasing signifies the presence of long-range correlations and smoother large-scale morphology.
For Sample A (porous), the PSD (Figure 1b) shows a well-defined linear regime spanning approximately one decade of spatial frequencies, from which a spectral slope of is extracted, corresponding to . This relatively steep decay reflects the predominance of high-frequency contributions associated with sharp pore boundaries, fine-scale irregularities, and rapid intensity variations. The small Hurst exponent confirms that height fluctuations lack long-range persistence, indicating a morphology dominated by local stochastic processes rather than correlated growth fronts. Such behavior is typical of kinetically limited or diffusion-suppressed regimes, where restricted adatom mobility prevents coalescence and lateral relaxation, giving rise to an open, fragmented topology. In this sense, the PSD captures the statistical signature of a morphology governed by short-range aggregation, random nucleation, and incomplete smoothing — features fully consistent with the SEM observations of elongated clusters, discontinuous grains, and void channels (Figure 1a).
In contrast, in Sample B (compact), the PSD (Figure 1f) exhibits a noticeably flatter spectral decay, with fitted values and . The reduced slope indicates suppression of high-frequency roughness and redistribution of spectral power toward lower spatial frequencies, reflecting larger, smoother, more coalesced domains. Although the resulting Hurst exponent remains small — placing the system near the uncorrelated limit — its reduction relative to Sample A, combined with the extended correlation length visible in the low- region, suggests a more equilibrated and connected structure in which lateral diffusion and grain coalescence were more effective. The absence of pronounced high- tails further supports the notion that the compact surface has undergone significant smoothing and merging of grains, reducing small-scale irregularities while promoting near-isotropic connectivity (Figure 1e).
Despite the small absolute values of for both samples (0.21 for A and 0.04 for B), the modest decrease in and from A to B captures a systematic trend: the gradual flattening of the PSD and the increase in effective correlation length reflect a transition from a fragmented, diffusion-suppressed growth regime to a connected, relaxation-driven one. This interpretation aligns with the morphological evolution inferred from the SEM micrographs, where Sample A exhibits discontinuous aggregates and open channels while Sample B displays smoother grains and compact domains.
However, the PSD alone does not decisively identify the onset of full connectivity, because spectral exponents primarily describe roughness distribution and correlation strength rather than the topological organization of the solid network. As demonstrated in Section 3.5, the Euler characteristic provides this missing topological descriptor: Sample A maintains a positive throughout the central threshold range (Figure 1d), confirming its sub-percolated state, while Sample B exhibits a zero-crossing of near (Figure 1h), marking the percolation-like transition to a fully connected regime.
Viewed as a whole, the PSD results not only quantify the spectral reorganization occurring during the porous-to-compact transformation but also provide a physical bridge between kinetic roughening theory and the observed SEM morphologies. The behavior of Sample A is consistent with a diffusion-limited Edwards–Wilkinson-like regime dominated by noise and short-range aggregation, while Sample B approaches a Kardar–Parisi–Zhang-like regime in which nonlinear lateral relaxation smooths the surface and promotes structural connectivity. Thus, the spectral analysis forms the first pillar of the multiscale interpretation, to be integrated with multifractal, lacunarity, and topological descriptors in the following sections.
3.3. Multifractality and Intermittency
The multifractal analysis provides a deeper and more discriminating view of the spatial organization of the surfaces by probing the distribution of local scaling exponents rather than relying on a single global roughness measure. Whereas the PSD compresses morphology into a single spectral slope, the multifractal spectrum (Figure 1c,g) resolves the full hierarchy of spatial fluctuations and therefore distinguishes homogeneous growth from strongly intermittent regimes.
The analysis was performed using normalized partition functions , where is the relative box size, the linear scale, the image size, and the normalized mass (sum of intensities) within box . Normalization () ensures that the resulting spectra remains physically consistent — in particular, satisfying the bound for two-dimensional supports and avoiding the artificial inflation observed in preliminary unnormalized tests.
Scaling exponents were obtained from linear regressions of versus , and a cubic-spline smoothing was applied to to suppress numerical end-effects. The corresponding singularity spectrum was then computed via the Legendre transform, and yielding stable, concave spectra across the full range .
For Sample A (porous), the resulting spectrum (Figure 1c) is broad and asymmetric, with a width of . This indicates a high degree of spatial intermittency: markedly different local environments — dense clusters, open voids, sharp pore boundaries and elongated aggregates — coexist within the same microstructure. Such diversity of singularity strengths is a hallmark of diffusion-limited, kinetically restricted growth, where multiple local mechanisms (random aggregation, incomplete coalescence, directional shadowing, curvature-driven relaxation) act concurrently. The broad spectrum thus mirrors the heterogeneous and anisotropic morphology observed in the SEM image of Sample A (Figure 1a).
In contrast, Sample B (compact) exhibits a considerably narrower and more symmetric spectrum (Figure 1g), with . This contraction reflects diminished heterogeneity and reduced intermittency: local intensities vary more uniformly, grain coalescence is more complete, and the surface displays a smoother, more isotropic texture. Such behavior is consistent with relaxation-dominated dynamics, where correlated growth fronts suppress the extremes of local fluctuation that characterize fragmented surfaces like Sample A.
Both spectra satisfy concavity and remain well within the bound , confirming the robustness of the analysis pipeline.
The reduction of Δα from A to B—about 15%—thus provides a quantitative measure of morphological homogenization during the transition from a fragmented to a connected regime. This trend reinforces the PSD results (Section 3.2): while spectral slopes capture changes in roughness distribution and correlation length, the multifractal spectra reveal how the internal scale hierarchy becomes more uniform as the surface approaches a compact, connected topology. This interpretation is further corroborated by the Euler characteristic analysis (Figure 1d,h; Section 3.5), which identifies a percolation-like connectivity threshold in Sample B that is absent in Sample A.
3.4. Lacunarity and Heterogeneity
Lacunarity provides a statistical measure of spatial heterogeneity that complements both the PSD and the multifractal spectrum by probing the distribution of gaps and local mass at intermediate scales. Whereas multifractality captures the hierarchy of singularities in the intensity field, lacunarity quantifies how the distribution of “mass’’ (brightness or occupancy) fluctuates within gliding boxes of size , thereby distinguishing textures that may share similar roughness but differ in the arrangement and regularity of voids.
In practice, lacunarity (Eq. 8) was computed from binary fields obtained by thresholding the normalized SEM intensities . Curves were evaluated for thresholds and box sizes px, from which two scalar descriptors were extracted: the average lacunarity , and the maximum value .
These values, together with the spectral, multifractal, and topological descriptors from previous sections, are summarized in Table 2, which corresponds to the analysis pipeline illustrated in Figure 1 (a–h).
For sample A (porous), the binary analysis yields ⟨Λ⟩ = 1.109 and Λₘₐₓ = 1.822. These values, only moderately above unity, indicate that although the surface is globally porous, the voids are regularly spaced, producing relatively low mass variance across gliding boxes. This statistical regularity is consistent with the smoother curvature of the multifractal spectrum (Figure 1c) and the coherent pore geometry visible in the SEM micrograph (Figure 1a).
For sample B (compact), the lacunarity measures are substantially higher: ⟨Λ⟩ = 1.422 and Λₘₐₓ = 3.814. The elevated lacunarity reflects stronger local variability in binary mass distribution, arising from isolated high-intensity grains separated by shallow depressions. Although the surface appears smoother at large scales, its microtexture contains sufficient brightness heterogeneity to increase mass variance. Thus, the higher lacunarity in Sample B reflects microstructural irregularity rather than porosity, an inversion of the intuitive expectation that more porous surfaces must always exhibit larger lacunarity.
These findings underline that lacunarity captures the irregularity of void spacing, not merely the void fraction. In combination with the multifractal width Δα, lacunarity provides an intermediate-scale descriptor of morphological organization: Sample A is globally porous yet statistically uniform, whereas Sample B is compact but microscopically heterogeneous. The transition from A to B therefore reflects a shift from a regularly fragmented regime to a densely connected yet irregular texture — a hallmark of complex self-organization during thin-film coalescence.
3.5. Topological Transitions and Percolation
The Euler characteristic , previously defined in Section 2.7, provides a topological descriptor of surface organization by quantifying how the number of connected components and enclosed holes changes with the intensity threshold . Within this framework, indicates a fragmented morphology dominated by isolated solid clusters, while reflects a percolated regime in which the solid phase forms a continuous network. The zero-crossing of marks the percolation threshold, identifying the critical transition between disconnected and connected configurations [9].
For sample A (porous), the Euler characteristic remains positive throughout the central threshold range (), indicating that the solid phase forms disconnected islands separated by continuous void channels. This topological signature is consistent with the anisotropic, open morphology seen in the SEM images and with the weak spatial correlation and high intermittency quantified by the PSD and multifractal analyses. No zero-crossing is observed within the accessible θ range, implying that the surface remains sub-percolated: even at high thresholds, the solid domain does not form a spanning network.
In contrast, sample B (compact) shows a negative Euler characteristic near mid-threshold (), revealing that the solid phase has developed a connected backbone with internal cavities.
The curve crosses zero at θ ≈ 0.53, marking the percolation-like transition where previously isolated grains merge into a continuous solid framework. This transition corresponds physically to the closure of void channels and the onset of full connectivity across the surface, consistent with the smoother, more coalesced morphology seen in the SEM micrographs and with the narrower multifractal spectrum Δα.
The opposite signs of for the two samples—together with the presence or absence of a zero-crossing—provide unambiguous evidence of a topological inversion between fragmented and connected regimes. This inversion represents the final stage of morphological evolution: as surface diffusion and relaxation become dominant, isolated features coalesce and the topology shifts from non-percolating (Euler-positive) to percolating (Euler-negative).
This transition marks the final stage of morphological evolution, linking spectral and geometric descriptors to percolation theory: as surface diffusion and relaxation processes dominate, isolated features coalesce, and the topology shifts from non-percolating (Euler-positive) to percolating (Euler-negative).
The Euler characteristic therefore establishes a quantitative boundary between disconnected and connected states, confirming that the transition from porous to compact morphology involves not only geometric smoothing but also a fundamental restructuring of surface connectivity. Combined with the spectral and multifractal descriptors, χ(θ) consolidates the interpretation of the surface transformation as a continuous progression from a diffusion-limited, fragmented regime to a relaxation-dominated, connected one.
3.5.1. Surface Descriptors
The quantitative descriptors summarized in Table 2 reinforce the morphological transition qualitatively observed in the SEM micrographs (Figure 1a,e) and quantitatively explored through the PSD, multifractal, lacunarity and Euler analyses (Figure 1b–d,f–h)
Spectral scaling (β, H):
Sample A exhibits a steeper PSD decay (β = 2.42) and a higher apparent Hurst exponent (H = 0.21) than Sample B (β = 2.08, H = 0.04). This indicates that the porous surface retains stronger high-frequency components, sharper pore boundaries and more local roughness, whereas the compact surface suppresses fine-scale fluctuations and redistributes spectral power toward lower spatial frequencies.
The small absolute values of H in both cases confirm that neither surface shows long-range self-affinity; the growth dynamics are dominated by short-range aggregation, with limited persistence. Thus, the reduction of β and H from A to B reflects the progressive smoothing and coalescence that accompanies the transition from a fragmented to a connected regime.
Multifractal intermittency (Δα):
The corrected singularity spectra (Figure 1c,g) yield Δα = 0.254 for Sample A and 0.221 for Sample B.
The broader spectrum of A reflects stronger intermittency and heterogeneity in local intensity organization, consistent with its porous, anisotropic morphology containing dense clusters, open pores and transitional regions. Conversely, the narrower Δα of Sample B indicates a more monofractal character and reduced variability in local singularities—an outcome of more effective surface relaxation and grain coalescence. Both spectra satisfy the physical constraint f(α) ≤ 2 and display concavity, confirming the robustness of the multifractal analysis.
Lacunarity (Λ):
Binary lacunarity analysis captures differences in intermediate-scale structural organization (Table 2).
Sample A shows moderately low lacunarity (⟨Λ⟩ = 1.11; Λₘₐₓ = 1.82), revealing that although the surface is globally porous, its voids are regularly spaced and statistically uniform.
Sample B, in contrast, exhibits higher lacunarity (⟨Λ⟩ = 1.42; Λₘₐₓ = 3.81), signaling greater local heterogeneity.
This may appear counter-intuitive—one might expect greater lacunarity in the porous surface—but arises because the compact surface contains isolated high-intensity micro-domains separated by shallow depressions. When binarized, these features increase mass variance. Thus, lacunarity does not measure porosity directly but the irregularity of void and cluster spacing, complementing the multifractal descriptor Δα.
Topological connectivity (χ(θ)):
The sign and evolution of the Euler characteristic χ(θ) (Figure 1d,h) provide the missing topological information.
At mid-threshold (θ ≈ 0.5), Sample A exhibits a positive χ (+3.0×10⁻⁴), consistent with a fragmented solid framework composed of isolated components and open channels, with no zero-crossing within the accessible range—i.e., a sub-percolated topology.
Sample B, however, shows a negative χ (−1.7×10⁻⁴) at the same threshold and presents a clear zero-crossing at θ ≈ 0.53, marking the percolation-like transition where formerly isolated grains merge into a connected solid network.
To provide a concise multiscale comparison of the descriptors extracted for both surfaces, Figure 2 presents a grouped bar plot summarizing the spectral, multifractal, and lacunarity metrics for Samples A and B.
This representation highlights the quantitative differences between the porous (Sample A) and compact (Sample B) regimes while preserving the physical meaning and relative scale of each descriptor.
Global interpretation:
Across all descriptors, the evolution from Sample A to Sample B constitutes a coherent pathway from a fragmented, diffusion-limited, EW-like regime to a connected, relaxation-dominated, KPZ-like regime.
- ▪ Spectral exponents (β, H) capture the redistribution of roughness.
- ▪ Multifractal widths (Δα) quantify the collapse of intermittency.
- ▪ Lacunarity (Λ) measures the shift in intermediate-scale heterogeneity.
- ▪ The Euler characteristic χ(θ) uniquely identifies the onset of connectivity.
Together, these complementary metrics provide a multiscale and physically grounded description of the surface transition, linking real morphological evolution to established universality classes and percolation topology.
3.6. Physical Interpretation and Universality
The scaling values listed in Table 3 provide a multiscale overview of the spectral, multifractal, geometric, and topological descriptors obtained for the two surfaces. The coherent contrast across these metrics indicates that the samples differ not only in roughness amplitude, but also in correlation structure, heterogeneity, and connectivity. This motivates the physical interpretation that follows, in which the ensemble of descriptors is examined in the context of the expected behaviors of Edwards–Wilkinson and Kardar–Parisi–Zhang growth regimes.
The combined evidence from spectral scaling, multifractality, lacunarity, and topology reveals a coherent physical framework linking the two surface regimes to distinct universality classes of nonequilibrium growth.
The numerical descriptors summarized in Table 3 provide a consolidated view of how these different metrics evolve in concert, reflecting a consistent morphological transformation between the two samples.
Starting from the fragmented–anisotropic regime, Sample A (porous) exhibits the characteristic signatures of Edwards–Wilkinson (EW) or random-deposition dynamics, where stochastic fluctuations dominate over surface relaxation. Its steep spectral slope (β = 2.42) and modest correlation exponent (H = 0.21) indicate largely uncorrelated height variations, producing a rough, self-affine morphology with limited lateral persistence. This behavior is reinforced by the broad multifractal width (Δα = 0.254), which signals strong intermittency and the presence of multiple growth environments—from dense clusters to deep pore regions. Geometrically, the low lacunarity (⟨Λ⟩ = 1.11) and positive Euler characteristic (χ(0.5) = +3.0 × 10⁻⁴) confirm that the solid phase remains fragmented into isolated domains separated by continuous void channels. Together, these descriptors identify a diffusion-limited, noise-dominated regime, fully consistent with the disconnected topology observed in the SEM micrograph.
By contrast, Sample B (compact) represents the opposite limit. As the surface becomes smoother and more cohesive, the behavior approaches that expected for Kardar–Parisi–Zhang (KPZ) dynamics, where nonlinear couplings between vertical growth and lateral relaxation promote correlated, self-affine structures. This shift is evident in the gentler spectral slope (β = 2.08) and the very small Hurst exponent (H = 0.04), pointing to shorter correlation lengths and suppressed high-frequency roughness. The narrower multifractal spectrum (Δα = 0.221) further demonstrates reduced intermittency, while the higher lacunarity (⟨Λ⟩ = 1.42; Λₘₐₓ = 3.81) reveals the presence of heterogeneous microstructures embedded within an otherwise compact matrix. Most decisively, the Euler characteristic becomes negative at mid-threshold (χ(0.5) = −1.7 × 10⁻⁴), and the zero-crossing at θ ≈ 0.53 indicates the formation of a percolating solid network.
Across all descriptors, synthesized in Table 3, the consistent shift from A to B demonstrates a continuous crossover between universality classes: from a fragmented, diffusion-limited EW-like phase to a connected, relaxation-dominated KPZ-like phase. The zero-crossing of χ(θ) acts as a topological order parameter that identifies the onset of global connectivity, while PSD, multifractality, and lacunarity quantify how this transition is expressed across scales—from local intermittency to intermediate-scale heterogeneity and large-scale topology.
Complementary grain morphometry further corroborates this multiscale interpretation. The compact surface (Sample B) exhibits a substantially larger number of segmented grains (N = 480) than the porous one (N = 55), reflecting its finer textural subdivision at the same magnification. Median circularity and eccentricity values (Table S1) show predominantly elongated aggregates in both samples (e > 0.8), consistent with anisotropic grain shapes and partial coalescence. Although these geometric descriptors are not central to the scaling analysis, they confirm that morphological organization at the grain level mirrors the global transition from fragmented to connected regimes.
Viewed as a whole, these findings demonstrate that SEM micrographs—despite lacking height calibration—preserve enough statistical structure to reveal the scaling fingerprints predicted by kinetic roughening theory. This establishes a direct bridge between microscopic deposition dynamics and the macroscopic organization of thin-film surfaces, with the two samples representing successive stages along a universal pathway from fragmentation to percolation-driven connectivity.
The absence of numerical validation with synthetic EW/KPZ surfaces represents a natural limitation of the present study. Incorporating such simulations in future work will enable systematic benchmarking of the descriptors extracted here and will help quantify how accurately SEM-derived morphologies reproduce theoretical universality-class fingerprints.
Taken together, the PSD exponents, multifractal widths, lacunarity curves, and Euler-characteristic transitions form a coherent multiscale signature of the morphological evolution. The steep spectral decay and broad Δα observed in the porous sample (A) are characteristic of diffusion-limited EW-like surfaces with short correlation lengths and strong intermittency. Conversely, the flatter PSD slope, narrower multifractal spectrum, and χ(θ) zero-crossing in the compact sample (B) match the expected behavior of KPZ-like growth, where nonlinear relaxation promotes lateral coherence and network connectivity. The apparent inversion in lacunarity between A and B further reinforces this interpretation, as it reflects increased local heterogeneity in B despite its global compactness—consistent with the formation of connected but non-uniform microdomains during KPZ-type coalescence. The agreement among these independent descriptors strengthens the attribution of the two surfaces to distinct universality classes and confirms that the pipeline captures physically meaningful signatures of growth dynamics across scales.
Beyond its theoretical implications, the multiscale framework presented here is directly relevant for functional thin films whose performance depends critically on surface morphology. In applications such as photocatalysis, gas sensing, wettability control, and charge-transport engineering, transitions between porous and compact surface regimes strongly influence adsorption kinetics, percolation pathways, and effective diffusivity. The ability to detect percolation-like connectivity from a single SEM micrograph therefore provides a practical diagnostic tool for identifying growth regimes associated with optimal functional behavior. Moreover, quantifying intermittency, heterogeneity, and connectivity across scales is directly applicable to optimization of sputtered oxides, sol–gel coatings, polymeric films, and nanostructured surfaces used in energy, sensing, and environmental technologies.
5. Conclusions
In this work, we demonstrated that a single SEM micrograph retains sufficient spatial correlation structure to extract multiscale descriptors of thin-film morphology. By integrating spectral (PSD), multifractal, geometric (lacunarity), and topological (Euler characteristic) analyses within a unified framework, we revealed a coherent transition between two distinct surface regimes.
Sample A (porous) exhibited steep spectral decay (β = 2.42), weak correlation (H = 0.21), broad multifractal intermittency (Δα = 0.254), low lacunarity (⟨Λ⟩ = 1.11), and a positive Euler characteristic, all consistent with a fragmented, diffusion-limited EW-like regime. In contrast, Sample B (compact) showed gentler spectral scaling (β = 2.08), nearly uncorrelated roughness (H = 0.04), a narrower multifractal spectrum (Δα = 0.221), higher lacunarity (⟨Λ⟩ = 1.42), and a negative Euler characteristic with a χ(θ) zero-crossing near θ ≈ 0.53, marking a percolation-like connectivity transition characteristic of KPZ-type growth.
These findings establish a direct link between microscopic morphological descriptors and kinetic-roughening universality classes, showing that SEM images—despite lacking height calibration—encode meaningful fingerprints of nonequilibrium surface evolution. The proposed framework therefore provides a practical diagnostic for identifying growth regimes, connectivity transitions, and morphological heterogeneity in functional thin films.
Future work will incorporate numerical validation using synthetic EW/KPZ surfaces, enabling systematic benchmarking of the extracted descriptors and facilitating their application across a broader range of materials.
In this way, the present methodology offers a quantitative route to connect SEM-derived morphology with the theoretical landscape of nonequilibrium surface growth and percolation-driven transitions.
Supplementary Materials
The following supporting information can be downloaded at: https://www.mdpi.com/article/doi/s1, Figure S1: Histograms of grain circularity (C) and eccentricity (e) for Samples A and B (Otsu segmentation); Table S1: Grain morphometry statistics (median ± IQR for C and e).
Author Contributions
Author Contributions: Conceptualization, H.C.V., T.E. and M.G.M.; methodology, H.C.V. and T.E.; software, H.C.V. and T.E.; validation, H.C.V., T.E. and M.G.M.; formal analysis, H.C.V. and T.E.; investigation, H.C.V. and T.E.; resources, M.G.M.; data curation, H.C.V. and T.E.; writing—original draft preparation, H.C.V.; writing—review and editing, H.C.V., T.E., M.G.M. and R.Ö. ; visualization, H.C.V. and T.E.; supervision, M.G.M. and R.Ö
Funding: This research received no external funding.
Data Availability Statement
Conflicts of Interest
The authors declare no conflicts of interest.
Abbreviations
The following abbreviations are used in this manuscript
| SEM | Scanning Electron Microscopy |
| PSD | Power Spectral Density |
| H | Hurst Exponent |
| β | Spectral Slope |
| EW | Edwards–Wilkinson |
| KPZ | Kardar–Parisi–Zhang |
| Δα | Multifractal Spectrum Width |
| χ | Euler Characteristic |
| Λ | Lacunarity |
| ε | Relative Scale (s/L) |
| q | Moment Order in Multifractal Analysis |
| α, f(α) | Singularity Strength and Multifractal Spectrum |
| C | Circularity (4πA/P2) |
| e | Eccentricity |
| θ | Threshold Level (Image Binarization) |
References
- Barabási, A.L.; Stanley, H.E. Fractal Concepts in Surface Growth; Cambridge University Press (CUP): Cambridge, United Kingdom; ISBN, 1995. [Google Scholar]
- Meakin, P. Fractals, scaling and growth far from equilibrium; Cambridge University Press, 1998. [Google Scholar]
- Feder, J. Fractals; Plenum Press: New York, NY, USA, 1988. [Google Scholar] [CrossRef]
- Eleutério, T.; Sério, S.; Vasconcelos, H.C. Growth of Nanostructured TiO2 Thin Films onto Lignocellulosic Fibers through Reactive DC Magnetron Sputtering: A XRD and SEM Study. Coatings 2023, 13, 922. [Google Scholar] [CrossRef]
- Vasconcelos, H.C.; Eleutério, T.; Meirelles, M. Surface Roughness and Fractal Analysis of TiO2 Thin Films by DC Sputtering. In CIC; LOCATION OF CONFERENCE, COUNTRYDATE OF CONFERENCE, 2025; p. 2. [Google Scholar]
- Vicsek, T. Fractal growth phenomena, 2.ª ed.; World Scientific, 1992. [Google Scholar] [CrossRef]
- Mandelbrot, B. B. The Fractal Geometry of Nature; W. H. Freeman and Company: New York, 1983. [Google Scholar]
- Edwards, S.F.; Wilkinson, D.R. The surface statistics of a granular aggregate. Proc. R. Soc. London. Ser. A. Math. Phys. Sci. 1982, 381, 17–31. [Google Scholar] [CrossRef]
- Kardar, M.; Parisi, G.; Zhang, Y.-C. Dynamic Scaling of Growing Interfaces. Phys. Rev. Lett. 1986, 56, 889–892. [Google Scholar] [CrossRef] [PubMed]
- Michielsen, K.; De Raedt, H. Integral-geometry morphological image analysis. Phys. Rep. 2001, 347, 461–538. [Google Scholar] [CrossRef]
- Sahini, M.; Sahimi, M. Applications of percolation theory; Taylor & Francis/CRC Press, 1994. [Google Scholar] [CrossRef]
- Mwema, F. M.; Akinlabi, E. T.; Oladijo, O. P. Fractal theory in thin films: Literature review and bibliometric analysis. Coatings 2022, 12(9), 1229. [Google Scholar] [CrossRef]
- de Souza, C.C.; Gandarilla, A.M.D.; Brito, W.R.; Sanches, E.A.; Das, A.; Kumar, S.; Matos, R.S.; Ţălu, Ş.; Filho, H.D.d.F. Vertical Growth Dynamics and Multifractality of the Surface of Electropolymerized Poly(o-ethoxyaniline) Thin Films. Coatings 2022, 12, 1216. [Google Scholar] [CrossRef]
- Zelati, A.; Mardani, M.; Rezaee, S.; Matos, R.S.; Pires, M.A.; Filho, H.D.d.F.; Das, A.; Hafezi, F.; Rad, G.A.; Kumar, S.; et al. Morphological and multifractal properties of Cr thin films deposited onto different substrates. Microsc. Res. Tech. 2022, 86, 157–168. [Google Scholar] [CrossRef] [PubMed]
- Ghaderi, A.; Sabbaghzadeh, J.; Dejam, L.; Pour, G.B.; Moghimi, E.; Matos, R.S.; Filho, H.D.d.F.; Țălu, Ș.; Shayegan, A.S.; Aval, L.F.; et al. Nanoscale morphology, optical dynamics and gas sensor of porous silicon. Sci. Rep. 2024, 14, 1–14. [Google Scholar] [CrossRef] [PubMed]
- Allain, C.; Cloitre, M. Characterizing the lacunarity of random and deterministic fractal sets. Phys. Rev. A 1991, 44, 3552–3558. [Google Scholar] [CrossRef] [PubMed]
- Otsu, N. A threshold selection method from gray-level histograms. IEEE Trans. Syst. Man Cybern. 1979, 9, 62–66. [Google Scholar] [CrossRef]
Figure 1.
Representative analyses of the two thin-film samples. (a,e) SEM micrographs of Sample A (porous, fragmented) and Sample B (compact, connected); (b,f) Isotropic power spectral density (PSD) functions , including fitted slopes and apparent Hurst exponents; (c,g) Multifractal singularity spectra derived from normalized partition functions , with widths Δα indicating intermittency; (d,h) Euler characteristic density χ(θ) as a function of threshold, showing positive χ for fragmented regimes and a zero-crossing (θ ≈ 0.53) for the connected regime.
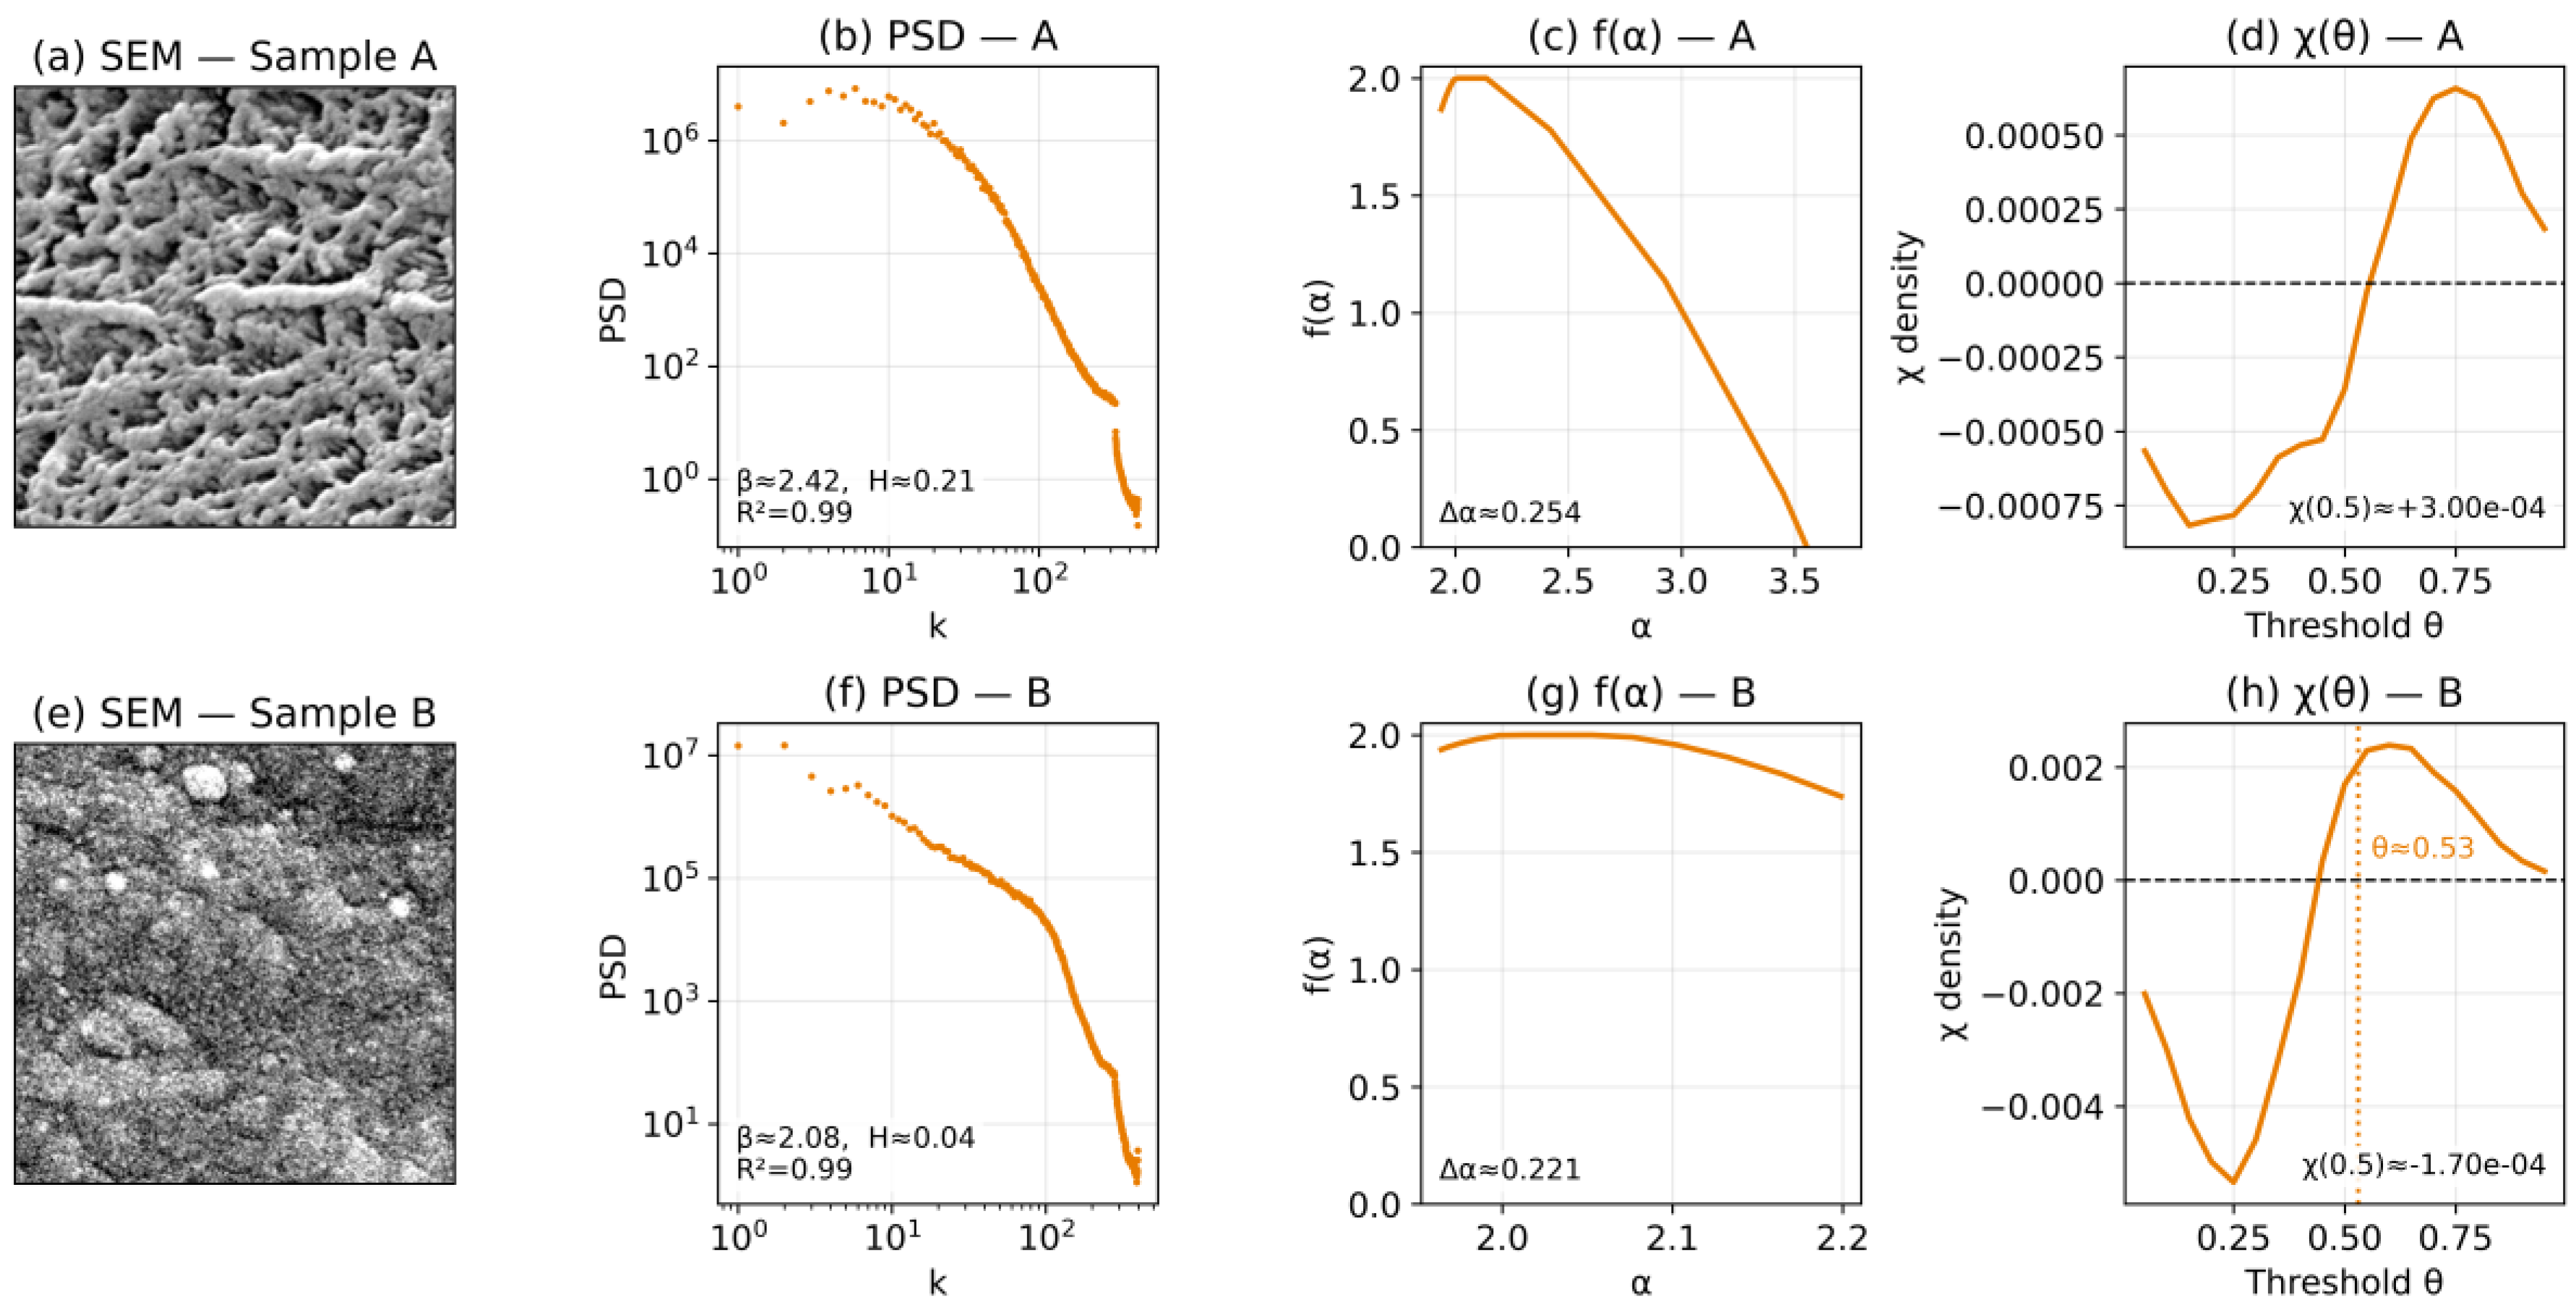
Figure 2.
Grouped bar plot comparing the spectral exponent (β), Hurst exponent (H), multifractal width (Δα), and lacunarity (⟨Λ⟩) for Samples A and B. The χ(0.5) descriptor is omitted from the plot due to its four order magnitude difference and is instead reported in Table 2 for clarity.
Figure 2.
Grouped bar plot comparing the spectral exponent (β), Hurst exponent (H), multifractal width (Δα), and lacunarity (⟨Λ⟩) for Samples A and B. The χ(0.5) descriptor is omitted from the plot due to its four order magnitude difference and is instead reported in Table 2 for clarity.
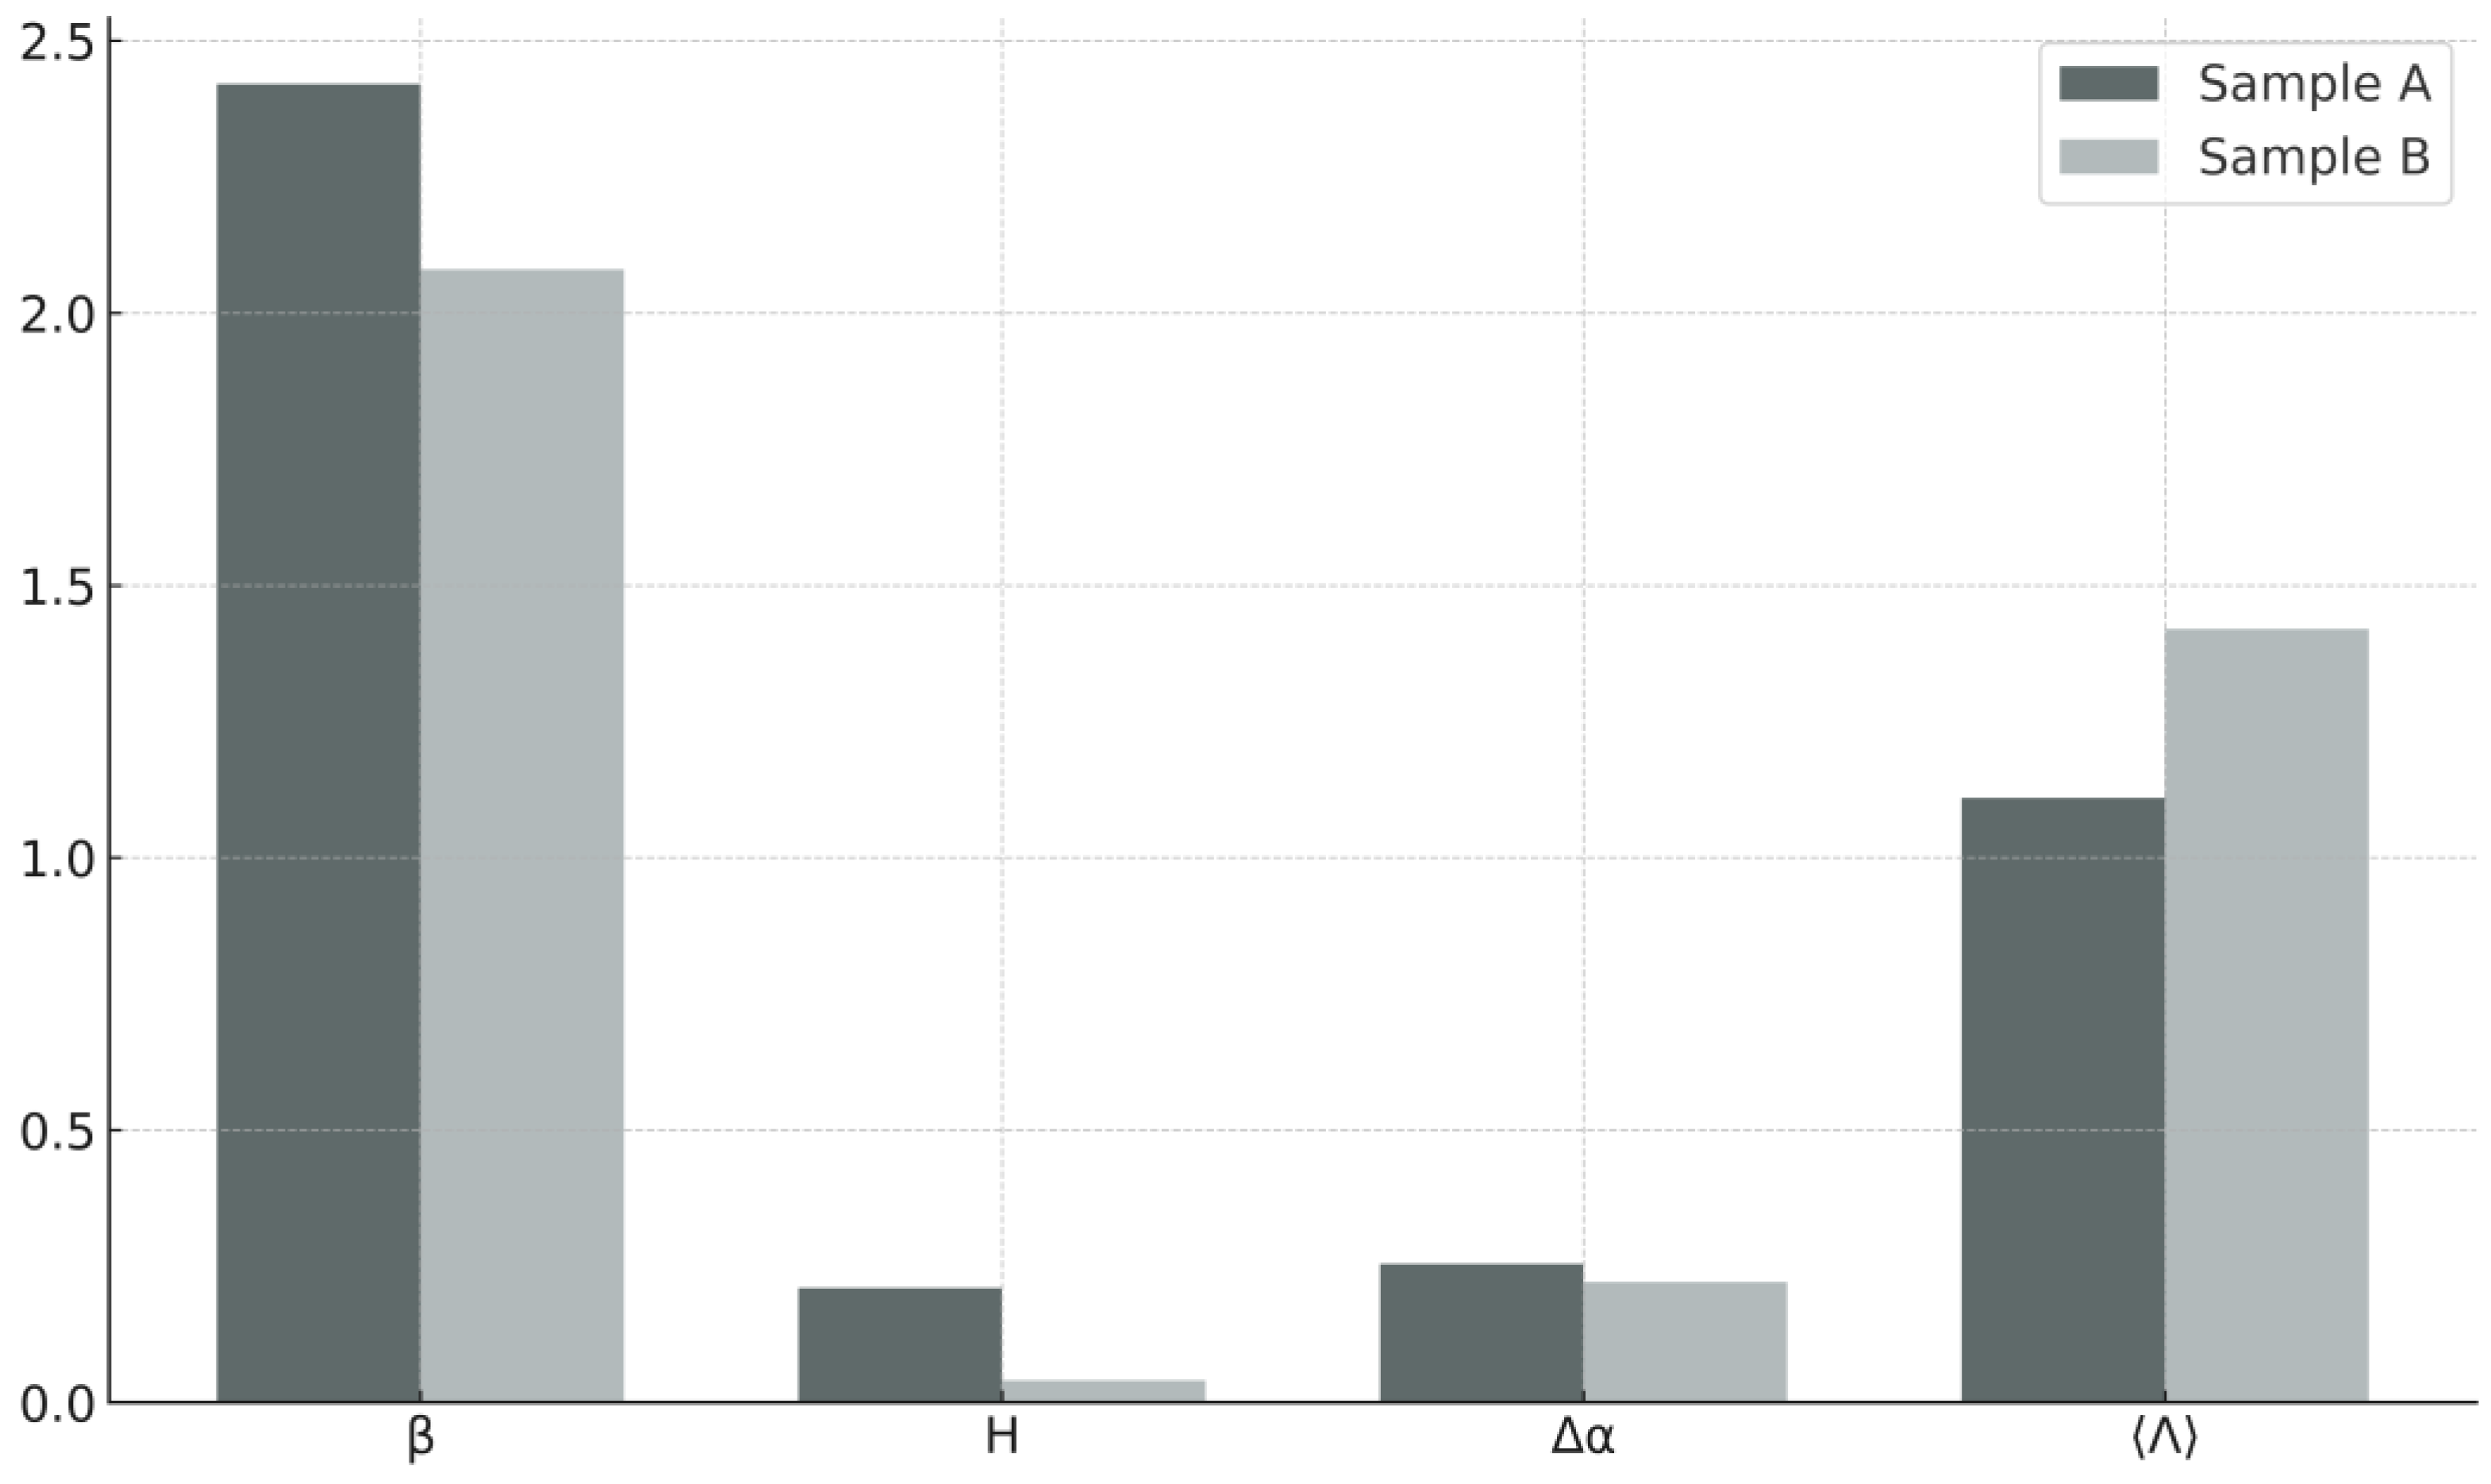

Table 1.
Parameters used in the multiscale descriptor analysis.
| Descriptor | Parameters Used | Notes |
|---|---|---|
| Power spectral density (PSD) | k-range excluding lowest and highest 5% of frequencies; log–log linear regression | Prevents edge effects and aliasing; ensures stable β fitting. |
| Multifractal spectrum f(α) | q ∈ [–3, 3]; 20 box sizes; ε = s/L; cubic-spline smoothing of τ(q) | Ensures numerical stability and suppresses artificial end-loops. |
| Lacunarity ⟨Λ⟩ | Box sizes from 3 to L/4; binary threshold at θ = 0.5 | Captures heterogeneity at intermediate scales. |
| Euler characteristic χ(θ) | θ ∈ [0, 1] in steps of 0.01; 2D binary patterns | Tracks connectivity transitions and identifies χ zero-crossings. |
| Pre-processing | CLAHE with fixed clip-limit; intensity normalization; ROI cropping | Ensures consistency and robustness across descriptors. |
Table 2.
Summary of quantitative descriptors extracted from SEM images. Sample A and B correspond to two distinct morphological regimes; numerical values are derived from the analysis pipeline shown in Figure 1.
Table 2.
Summary of quantitative descriptors extracted from SEM images. Sample A and B correspond to two distinct morphological regimes; numerical values are derived from the analysis pipeline shown in Figure 1.
| Sample | Morphology | β | H | ⟨Λ⟩ (bin.) | Δα | χ(0.5) | χ(θ)zero | Regime |
|---|---|---|---|---|---|---|---|---|
| A (porous) | Fragmented, anisotropic | 2.42 | 0.21 | 1.109 | 0.254 | +0.00030 | — | EW-like, fragmented |
| B (compact) | Connected, isotropic | 2.08 | 0.04 | 1.422 | 0.221 | −0.00017 | θ ≈ 0.53 | KPZ-like, connected |
β and H from the isotropic PSD (log–log fit over one decade, R2 > 0.97); Δα from normalized multifractal spectra f(α) using ε = s/L and spline smoothing; ⟨Λ⟩ and Λₘₐₓ from binary gliding-box lacunarity averaged over θ ∈ [0.3, 0.7]; χ(θ) computed with 4-connected solid foreground.
Table 3.
Summary of scaling behavior
| Property | Sample A (Fragmented) | Sample B (Connected) | Physical interpretation |
|---|---|---|---|
| Spectral slope (β) | 2.42 | 2.08 | Roughness scaling |
| Hurst exponent (H) | 0.21 | 0.04 | Correlation strength |
| Lacunarity (⟨Λ⟩) | 1.11 | 1.42 | Structural heterogeneity |
| Multifractal width (Δα) | 0.254 | 0.221 | Scale hierarchy / intermittency |
| Euler χ (θ = 0.5) | +3.0 × 10⁻⁴ | −1.7 × 10⁻⁴ | Connectivity / percolation |
| Regime | EW-like, fragmented | KPZ-like, connected | Universality class |
Disclaimer/Publisher’s Note: The statements, opinions and data contained in all publications are solely those of the individual author(s) and contributor(s) and not of MDPI and/or the editor(s). MDPI and/or the editor(s) disclaim responsibility for any injury to people or property resulting from any ideas, methods, instructions or products referred to in the content. |
© 2025 by the authors. Licensee MDPI, Basel, Switzerland. This article is an open access article distributed under the terms and conditions of the Creative Commons Attribution (CC BY) license (http://creativecommons.org/licenses/by/4.0/).
Copyright: This open access article is published under a Creative Commons CC BY 4.0 license, which permit the free download, distribution, and reuse, provided that the author and preprint are cited in any reuse.


