
Submitted:
03 December 2025
Posted:
05 December 2025
You are already at the latest version
Abstract
This study discusses the effect of green finance on carbon emission reduction and the mechanism of technological innovation in China, especially analyzes the comprehensive effect of green finance in the process of low-carbon transformation of urban agglomerations in China. Based on the panel data of China city from 2000 to 2023, this study evaluates the impact of green finance on carbon emissions by using various models, such as interaction model and intermediary adjustment model. The results show that both green finance and technological innovation can significantly reduce carbon emissions, and the synergistic effect of them is obviously stronger than that of a single path. The mechanism analysis shows that green finance can achieve coordinated emission reduction by promoting green technology innovation, upgrading industrial structure and improving the level of regional digital economy. Heterogeneity analysis shows that the regional emission reduction effect of Yangtze River Delta urban agglomeration with developed digital economy, high degree of digital transformation and concentrated cities is more significant. This study not only expands the theoretical framework of green financial collaborative governance, but also provides a new empirical basis and policy reference for other international urban agglomerations to achieve high-quality and low-carbon development.
Keywords:
green finance
; digital economy
; carbon emission reduction
; Yangtze River Economic Belt
; synergistic emission reduction effect
; high quality and low carbon development
1. Introduction
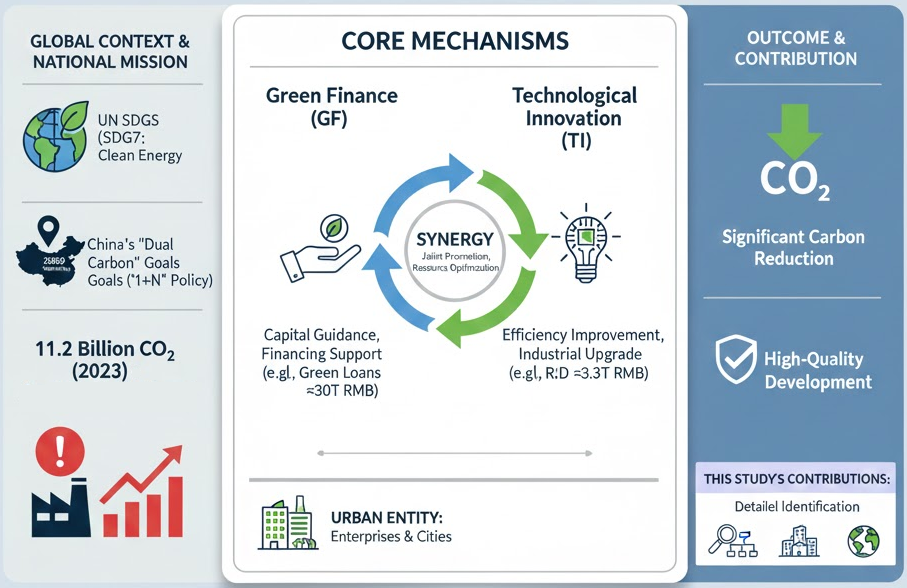
At present, global warming and environmental problems are becoming increasingly prominent, and the United Nations is striving for sustainable development goals (SDGs).[1]The requirements of dealing with climate change are clearly put forward, among which SDG7 takes clean energy and carbon emission reduction as its core objectives, and carbon emission reduction has gradually become an international consensus to achieve sustainable development.
As the largest developing country and carbon emitter in the world, China bears a key responsibility in achieving the goal of peak carbon dioxide emissions and carbon neutrality. Since the China Municipal Government issued the “1+N” policy system of carbon neutrality in peak carbon dioxide emissions in 2021, the national level has systematically planned the path of energy structure adjustment, industrial greening and urban low-carbon transformation.[2]. In the same year, China promoted the systematic development of green finance to the national strategic level, and strengthened financial support for urban green transformation through green credit, green bonds and carbon market construction.[3]. At the same time, China emphasized in a number of national strategy and policy documents that technological innovation, as a key driving force to support China’s green transformation and carbon emission reduction, should promote the economic system to evolve in a green and low-carbon direction by improving the city’s technological innovation capability and innovative resource allocation efficiency.[4,5].
In recent years, China’s economy has maintained sustained growth, and its GDP reached 126 trillion yuan in 2023, laying a solid foundation for green and low-carbon transformation.[6]. The green financial system has been steadily improved. In 2023, the balance of green loans in China increased to 30.08 trillion yuan, a year-on-year increase of 36.5%, and the scale of green bond issuance exceeded 1.3 trillion yuan.[7]. Green finance continuously guides the allocation of capital to clean energy, energy conservation and environmental protection through green credit, green bonds and green investment, and provides financial support for urban low-carbon transformation. The ability of technological innovation has been continuously enhanced, and China’s R&D investment will reach 3,632.68 billion yuan in 2024.[8]Among them, the number of patents related to green technology has remained the world’s leading, and the integration of digitalization, intelligence and green technology has accelerated, providing an important technical impetus for green and low-carbon development.[9,10]. Despite the steady progress of energy structure optimization and green development in recent years, China’s carbon emission level is still at a high level, with energy-related carbon dioxide emissions of about 11.2 billion tons in 2023.[11]The task of achieving the goal of “double carbon” is still very arduous.
Enterprise is the main carrier of economic activities, the basic unit of resource allocation, technological innovation and industrial development, and plays a key role in the operation of national economy. As an important financial tool to promote low-carbon development, green finance plays a significant role in promoting energy conservation and emission reduction of enterprises.[12,13]. By incorporating environmental protection into the principle of resource allocation, green finance can effectively guide social capital to flow to green industries and low-carbon projects, and alleviate the financing constraints faced by enterprises in the process of green transformation.[14,15]. At the same time, financial means such as green credit, green bonds and green investment not only improve the economic return rate and feasibility of carbon emission reduction projects, but also encourage enterprises to adopt energy-saving technologies and optimize energy structure, thus promoting the industry to evolve towards low carbon. With the continuous improvement of the green financial system, its positive effect on carbon emission reduction has gradually emerged, and it plays a key supporting role in the green transformation of the industry.
In recent years, China’s technological innovation capability has been continuously improved, the scale of R&D investment has been steadily expanded, and the innovation achievements have been accelerated in the fields of green energy, clean production and intelligent manufacturing. As a key force to promote economic structure upgrading and green development, technological innovation plays an important role in carbon emission reduction by promoting green technology research and development, improving energy efficiency and optimizing production technology.[16,17]. On the one hand, technological progress promotes the popularization of green production methods and reduces energy consumption and pollution emissions per unit output.[18]; On the other hand, innovation activities can improve the overall green efficiency and low-carbon governance capacity of the city by promoting industrial structure optimization and high-end elements agglomeration.[19,20]. In addition, technological innovation can also promote the development of technology and finance, green investment and environmental governance tools, thus improving the allocation efficiency of green financial resources and providing important support for cities to achieve low-carbon development.[21]. Therefore, technological innovation plays a central role in promoting high-quality economic development and promoting carbon emission reduction.
In this context, how green finance and technological innovation can work together to promote urban low-carbon transformation has become a key issue to promote carbon emission reduction in China. In-depth study of the synergy mechanism between green finance and technological innovation will help to reveal its role path in urban low-carbon transformation, and provide theoretical and practical support for China’s sustainable development. Although the existing research has paid attention to the synergistic relationship and emission reduction effect, there are still some problems such as insufficient mechanism identification, insufficient research at the city level and limited consideration of spatial heterogeneity. Based on this, from the perspective of their coordinated development, this paper systematically analyzes the mechanism and synergistic effect of green finance and technological innovation in promoting the decline of urban carbon emissions in China, and provides new empirical basis and policy enlightenment for the low-carbon transformation at the urban level (Figure 1).
2. Literature Review and Theoretical Analysis
2.1. Green Finance
2.1.1. The Concept and Development Trend of Green Finance
Green Finance refers to the goal of economic growth and environmental improvement by guiding social capital to be allocated for green purposes such as environmental protection, resource conservation, low-carbon transition, circular economy and clean energy through policy tools and market mechanisms (Kumar, B., et al., 2024) (Zhang, Y., 2024).[22,23]. The core of green finance lies in internalizing environmental externalities, and promoting clean project financing, improving energy efficiency and reducing greenhouse gas emissions by means of green credit, green bonds, green funds, green insurance and carbon trading (Nasir, N., & Ahmed, W. ,2024).[24]. Green finance emphasizes environmental responsibility, long-term sustainability and institutionalized norms, which is a structural change of financial function from focusing on capital accumulation to coordinated and sustainable development (Fu, C., et al., 2023).[25].
The European Union, Britain, Japan and other economies have successively introduced green classification standards, information disclosure systems and green bond frameworks, which have promoted the institutionalization and standardization of global green investment. China’s green financial system started late, but it developed rapidly. Since the establishment of a green financial system was formally proposed in 2016, China has gradually formed an institutional framework with green credit, green bonds, green funds and carbon market as its core (China People’s Bank, 2021).
In recent years, with the establishment of the goal of “double carbon” and the deep integration of digital technology, green finance has shown an obvious trend of diversification, integration and digitalization. On the one hand, green financial instruments are increasingly innovative, from green credit and green bonds to green asset securitization, carbon-neutral bonds and financing linked to sustainable development.[26]; On the other hand, the application of digital technology has significantly improved the accuracy and transparency of green finance. Technologies such as big data, blockchain and artificial intelligence are being used in green project identification, environmental risk assessment and information disclosure to promote efficient allocation of green funds.[27,28]. In addition, green finance is deeply integrated with industrial policy, energy transformation strategy and regional sustainable development goals, and has become an important driving force to promote green economic structure and achieve carbon neutrality.[29].
To sum up, green finance has evolved from a traditional policy-oriented tool to a systematic financial system with both market efficiency and sustainable orientation, and its development trend is shifting from scale expansion to quality improvement, and it has formed synergistic interaction with emerging fields such as digital economy and carbon market, providing new kinetic energy and path choice for future low-carbon transformation.
2.1.2. Green Finance and Carbon Emissions
As an important policy tool to promote low-carbon transformation, green finance is generally considered to significantly reduce carbon emissions by optimizing capital allocation and guiding green investment.[30,31,32,33]. Based on the provincial and urban panel data, it is found that the development level of green finance is negatively correlated with carbon emissions.[34,35,36]Based on this, this paper puts forward the following assumptions:
H1:
The development of green finance can significantly reduce the level of regional carbon emissions.
At the mechanism level, green finance promotes carbon reduction through multiple transmission paths. First of all, by reducing the financing cost of green projects and increasing the financing constraints of high-pollution projects, green finance makes the allocation of funds show a clear emission reduction orientation, and urges enterprises to increase investment in green technology research and development, thereby improving the innovation ability of green technology and reducing the carbon emission intensity per unit output (Huang, J.,et al., 2024; Sharif, A.,et al., 2022; Sethi, L.,et al)[37,38,39]. Secondly, green finance relies on differentiated credit and bond policies to guide capital reallocation from high-energy-consuming industries to low-carbon and high value-added industries, promote the transformation of industrial structure to green and advanced, and then strengthen the structural emission reduction capacity of the economic system (Chen, D., et al., 2023; Wang, X., & Wang, Q. 2021)[40,41]. Finally, green finance focuses on supporting new energy, intelligent manufacturing, digital economy and other emerging industries, accelerating the development of future industrial systems, thereby enhancing the long-term green development potential of the region and forming a stable decarbonization path (Lin, H.,et al 2024; Lu, Y., & Xia, Z. 2024; Li, K., et al., 2024)[42,43,44]. The existing research verifies the effect of emission reduction from multiple dimensions, which provides a solid theoretical and empirical support for understanding the key role of green finance in achieving the goal of double carbon.
Therefore, this paper further puts forward the following assumptions:
H2:
Green finance can reduce carbon emissions by promoting green technology innovation, upgrading industrial structure and improving future industrial level.
Generally speaking, green finance has become an important financial force to promote the green economic transformation and achieve the goal of carbon neutrality. It guides capital flow to low-carbon and sustainable areas through market-oriented mechanism, which not only promotes industrial structure optimization and technological innovation, but also achieves a synergistic balance between macroeconomic stability and environmental governance. In the future, green finance will play a more central role in guiding the greening of capital, promoting the optimization of energy structure and improving the efficiency of resource allocation, and provide solid financial support for achieving high-quality and low-carbon development.
2.2. Technological Innovation
2.2.1. The Connotation of Technological Innovation
Technological innovation is the key driving force to promote the green transformation of economic system and realize carbon emission reduction, and its connotation covers multiple dimensions such as digital economy, digital transformation and green technological innovation.[45,46,47,48,49]. These innovative forces jointly promote the evolution of economic activities in the direction of low-carbon and high efficiency by reshaping the structure of production factors, optimizing the allocation of resources and improving energy utilization efficiency. Under the background of increasing carbon emission reduction constraints, the coordinated promotion of multi-dimensional technological innovation has become an important support for achieving green development and long-term emission reduction goals.
Digital economy refers to the production factors and modes with data and digital infrastructure as the core, supported by advanced technologies such as information and communication technology, artificial intelligence, big data, cloud computing and Internet of Things.[50,51,52,53], a new economic form that drives the transformation of industrial structure, optimal allocation of resources and value creation.[54,55]. The core feature of digital economy is to reconstruct the traditional production mode, transaction mode and resource allocation mechanism through digitalization, networking and intelligence. In recent years, with the rapid popularization of digital infrastructure and digital platform, the digital economy has changed from a new phenomenon to an important engine of global economic growth. According to the White Paper on Global Digital Economy 2024, in 2023, the total digital economy of major economies including the United States, China, Germany, Japan and South Korea exceeded 33 trillion US dollars, with a year-on-year growth rate of over 8%. The proportion of industrial digitalization in the digital economy of these countries has reached 86.8%.[56]. Generally speaking, the digital economy has become a key force leading the global economic transformation and innovation. In the future, the digital economy will play a more central role in driving the innovation of production methods, the optimization of industrial structure and high-quality development.
While profoundly reshaping the production mode and resource allocation mechanism, the digital economy has also laid a foundation for broader technological progress and organizational change, and this trend has further spawned a more systematic digital transformation.[57]. Digital transformation refers to the process that enterprises, industries and government departments, driven by the deep application of data elements, systematically integrate digital technology, management processes and business models to realize the comprehensive digitalization, networking and intelligent upgrade of production systems, organizational structures and decision-making mechanisms.[58,59,60]. Different from the digital economy, which focuses on the macro-level industry and technology ecology, digital transformation emphasizes the micro-level and meso-level technology penetration and system remodeling. Its core lies in empowering traditional industries, improving production efficiency, optimizing resource allocation and enhancing organizational resilience by using digital technology.[61,62]. Digital transformation can bring sustained structural improvement to economic and social systems by strengthening information transparency, improving operational efficiency and promoting technological innovation, and play a key role in energy utilization optimization and green low-carbon development.[63,64].
Green technology innovation refers to the technological progress process of realizing low-carbon and sustainable economic activities by developing and applying green technologies such as energy saving, clean production, pollution control and renewable energy with the core goal of reducing resource consumption, reducing pollution emissions and improving environmental performance.[65,66,67]. The basic connotation of green technology innovation lies in bringing environmental externalities into the decision-making system in a market-oriented way through technological improvement and process upgrading, and promoting the transformation of production mode from high resource consumption and high emission path to high efficiency and low emission.[68]. As an important indicator to measure green innovation ability, green patents reflect the output level of green technology research and development and application, and are widely used to measure innovation in energy efficiency, pollution control, renewable energy utilization and other fields.[69,70]. Generally speaking, green technological innovation constitutes an important technical basis for promoting the green transformation of the economic system and realizing deep decarbonization, and is a key supporting force for achieving global climate goals.[71].
2.3. Green Finance, Technological Innovation and Carbon Reduction
As two key forces to promote low-carbon transformation, green finance and technological innovation have attracted great attention in recent years. On the whole, they not only affect carbon emissions through their respective channels, but also form a mutually reinforcing systematic synergistic effect in the dimensions of resource allocation, innovation incentives and industrial upgrading, thus producing a significantly higher emission reduction effect than a single path(Figure 2).
First of all, green finance provides stable and directional resource support for technological innovation through the adjustment of capital cost and capital constraint.[72,73]. On the one hand, financial instruments such as green credit, green bonds and green funds can reduce the financing cost of green technology R&D and cleaner production projects, improve the capital constraint of innovation activities, and enhance the willingness and ability of enterprises to carry out green R&D.[74,75]. On the other hand, by imposing stricter financing constraints on high-pollution industries, green finance has a restraining effect, forcing high-emission enterprises to accelerate technological upgrading to improve their financing environment.[76,77]. As a result, green finance plays a significant role in promoting technological innovation in terms of capital supply and incentive mechanism.
Secondly, technological innovation strengthens the governance effectiveness of green finance by improving energy efficiency, promoting the application of green production technology and optimizing industrial structure.[78]. On the one hand, green technology innovation improves the commercial feasibility and income level of green projects, reduces the risk exposure of green finance, and promotes the continuous expansion of green financial market.[79]; On the other hand, digital and intelligent technologies improve the transparency of environmental information and the ability of carbon emission accounting, and alleviate the information asymmetry problem that green finance traditionally faces, thus enhancing the resource allocation efficiency and risk identification ability of green finance.[80]. Therefore, technological innovation has become an important supporting condition for the effective operation of green finance.
Based on the above synergistic relationship, green finance and technological innovation form a significant synergistic effect in the process of carbon emission reduction. On the one hand, green finance promotes the emergence of green innovation activities through capital guidance mechanism, while technological innovation improves the performance of green finance by improving the output efficiency and emission reduction capacity of green projects, which together reduce the carbon emission intensity of the economic system in a dynamic cycle.[81,82]. On the other hand, the synergy of the two can simultaneously affect multiple emission reduction channels such as energy efficiency, industrial structure upgrading and future industrial cultivation, and build a multi-path superposition emission reduction mechanism.[83,84]. Previous studies have shown that when the level of green finance and technological innovation is improved at the same time, its marginal impact on carbon emissions is significantly higher than that of green finance or technological innovation alone, showing a typical complementary enhancement effect to promote emission reduction.[85,86]. This synergy is reflected in the complementary enhancement of capital elements and technology elements in low-carbon development, and the chain linkage effect of policy incentives, technology diffusion and industrial upgrading.
Based on this, this study puts forward the following assumptions:
H3:
Digital economy and green finance promote each other and develop synergistically, and significantly reduce regional carbon emission reduction.
Generally speaking, the interaction between green finance and technological innovation not only forms a two-way promotion relationship in terms of resource allocation and innovation incentives, but also produces a multi-dimensional coupling effect in the carbon emission reduction mechanism, which constitutes an important institutional basis and technical path to promote long-term decarbonization in regions and countries. Under the background of dual-carbon target, strengthening their coordinated development will be the key strategy to realize high-quality green transformation.
3. Data and Model Setting
3.1. Data Preparation

Table 1.
Description of variables.
| Variable | Explain | Data source |
| CO2 | carbon dioxide | China energy statistics yearbook, IEA, |
| GF | Green finance | China Statistical Yearbook, China National Bureau of Statistics, |
| Dig | digital economy | China Statistical Yearbook, China National Bureau of Statistics, |
| GTI | Green technology innovation | Number of green patents (Lg(x+1)) |
| IS | industrial structure | Added value of secondary industry/tertiary industry |
3.1.1. Core Explained Variable: Urban Carbon Emission
In this paper, the carbon emission coefficient method widely used in the world is used to measure the carbon emission at the city level (Wang, Q., & Zhang, F. 2020; Shan, Y.,et al.2020)[87,88]. Carbon emission is the total amount of greenhouse gas emissions generated in the whole life cycle of production, transportation, use and recycling of products.[87]. In view of the availability and authority of the data, this paper accounts for the carbon emissions of terminal energy consumption in primary, secondary and tertiary industries according to the national greenhouse gas inventory guidelines issued by the Intergovernmental Panel on Climate Change (IPCC) of the United Nations and the carbon emission factors recommended by various provincial levels in China.[88]. The specific calculation model is constructed as follows:
See Table 1 for the specific meanings and assignment descriptions of the variables in Formula (1). Among them, by introducing the molecular weight ratio (44/12), the carbon content is converted into carbon dioxide emissions.
Table 1.
Description of carbon emission measurement variables.
| Variable symbol | Variable definition and assignment basis | Unit |
| EC | Total carbon dioxide emissions from energy consumption | Ten thousand tons () |
| i | Industry category (covering primary, secondary and tertiary industries) | \ |
| Eij | The terminal consumption of the first kind of energy in I industry | Kilogram standard coal () |
| rj | Carbon emission coefficient of the first kind of energy | |
| 44/12 | Molecular weight conversion coefficient from carbon (c) to carbon dioxide (c) | \ |
3.1.2. Core Explanatory Variable: The Construction of Green Financial Indicators
In view of the richness and multidimensional connotation of green finance, it is difficult for a single indicator to comprehensively measure the overall development of urban green finance. This paper refers to scholars such as Feng Zixuan.[89]This paper constructs a comprehensive evaluation index system from the dimensions of green credit, green investment, green insurance, green bonds, green support, green funds and green rights and interests to reflect the development level of green finance.
Specific index selection and measurement methods are shown in Table 2:
As the core financing channel in the green financial system, green credit mainly measures the financial support of the banking industry to the environmental protection industry; Green investment reflects the capital investment intensity of the whole society for environmental governance; Green insurance reflects the financial system’s ability to manage environmental risks; Green bonds measure the strength of the capital market to support green projects through bond tools; Green support reflects the support of government finance in guiding green development; Green fund represents the attention paid to green industry in the field of asset management; Green rights and interests reflect the activity of carbon market and various environmental rights and interests transactions.
In order to eliminate the influence of the dimension and order difference of each index on the evaluation results and avoid the deviation caused by subjective empowerment, this paper uses entropy method to calculate the comprehensive index of green finance. This method can judge the dispersion degree of each index by calculating the information entropy, and then determine the index weight, which can objectively reflect the importance of each index in the evaluation system.
3.1.3. Mechanism Variable: The Development Level of Digital Economy
In view of the characteristics of digital economy, such as strong permeability, wide coverage and fast technical iteration, it is difficult to accurately measure its comprehensive development level with a single indicator. Refer to scholars such as Zhao Tao.[90]Based on the principle of data availability and scientificity, this paper constructs a comprehensive evaluation system with five sub-indicators from two dimensions: Internet development and digital financial inclusion, so as to comprehensively describe the development degree of digital economy at the city level.
Due to the lack of direct accounting data of digital economy at prefecture-level cities, this paper selects the following five main aspects as proxy variables, and the results are shown in Table 3:
Table 3.
| Primary index | Secondary index | Calculation method |
| Digital economy | Digital inclusive finance index | China Digital inclusive finance Index |
| Internet related output | Per capita telecommunications business volume | |
| Internet penetration | Internet users per 100 people | |
| Number of mobile internet users | Number of mobile phone users per 100 people | |
| Number of internet-related employees | Proportion of computer service and software employees |
The Digital inclusive finance Index is measured by the “China Digital inclusive finance Index” issued by the Digital Finance Research Center of Peking University, which integrates multi-dimensional data such as payment, credit and insurance, making up for the blank of traditional statistical data in the field of digital finance; The total telecom business in Internet-related output is the core index to measure the scale of information transmission and data interaction, which reflects the output level of information industry in this region. Internet penetration rate reflects the coverage of urban digital infrastructure and the convenience of residents accessing the Internet. The number of mobile Internet users can effectively reflect the penetration depth of mobile Internet in social groups; The number of Internet-related employees reflects the human capital investment and industrial agglomeration of digital economy-related industries.
In order to eliminate the dimensional differences among the indicators and solve the possible multicollinearity problem among the indicators, this paper uses the method of Zhao Tao et al. (2020) to reduce the dimensions of the above five indicators by principal component analysis (PCA) to calculate the comprehensive development index of digital economy. The larger the index value, the higher the level of digital economy development in this city.
Table 3.
Descriptive statistics.
| variable | variable declaration | N | Min | Max | Average | Std. | Median |
| CO2 | Log10CO2 emission (ton) | 7416 | 4.970 | 8.488 | 7.197 | 0.483 | 7.249 |
| GF | Green financial index | 7320 | 0.013 | 0.719 | 0.286 | 0.113 | 0.280 |
| Dig | Digital economy index | 6653 | 0.000 | 0.940 | 0.039 | 0.066 | 0.012 |
| GDP | Log10 regional GDP | 6576 | 3.013 | 5.132 | 4.181 | 0.456 | 4.202 |
| GDP1 | Log10 added value of primary industry | 6576 | 2.233 | 3.813 | 3.210 | 0.344 | 3.247 |
| GDP2 | Log10 added value of secondary industry | 6576 | 2.592 | 4.755 | 3.823 | 0.462 | 3.864 |
| GDP3 | Log10 added value of tertiary industry | 6576 | 2.565 | 4.879 | 3.818 | 0.494 | 3.817 |
| POP | population size | 6744 | 2.770 | 8.136 | 5.885 | 0.676 | 5.926 |
| URB | Urbanization rate | 6744 | 0.015 | 1.000 | 0.357 | 0.196 | 0.303 |
| RETAIL | Commodity retail | 6744 | 0.077 | 1.013 | 0.360 | 0.101 | 0.349 |
| EDUEXP | Education expenditure level | 6744 | 0.015 | 0.627 | 0.187 | 0.050 | 0.183 |
| MOBPEN | Mobile phone penetration rate | 6744 | 0.000 | 10.166 | 0.769 | 0.765 | 0.692 |
| ISU | Overall upgrading of industrial structure | 6744 | 1.729 | 2.846 | 2.250 | 0.152 | 2.246 |
| OPEN | Level of opening to the outside world | 6744 | 0.000 | 0.032 | 0.003 | 0.003 | 0.002 |
| HC | Human capital level | 6744 | 0.000 | 0.185 | 0.015 | 0.022 | 0.008 |
| FII | Financial investment | 6744 | 0.010 | 41.677 | 5.132 | 3.664 | 4.268 |
| IS | industrial structure | 6744 | 0.085 | 0.849 | 0.397 | 0.095 | 0.388 |
| HCL | Medical and health level | 6744 | 0.051 | 1.377 | 0.387 | 0.182 | 0.363 |
| ED | Economic density | 6744 | 1.115 | 12.063 | 6.677 | 1.497 | 6.707 |
| GIL | Degree of government intervention | 6744 | 0.027 | 1.027 | 0.168 | 0.099 | 0.143 |
| WHR | Harmless treatment rate of domestic garbage (%) | 6744 | -222.000 | 854.000 | 80.112 | 32.826 | 97.000 |
| LgGF | Lg (Green Finance +1) | 7320 | 0.005 | 0.235 | 0.107 | 0.039 | 0.107 |
| SO2 | Log10_ SO2 emission from industrial SO2 (ton) | 5746 | 2.903 | 7.293 | 6.845 | 0.435 | 6.977 |
| LagGF | Lagging the first phase of green finance | 7015 | 0.041 | 0.657 | 0.281 | 0.110 | 0.276 |
| distance | Log10 Hangzhou spherical distance | 7084 | 1.993 | 3.402 | 2.949 | 0.290 | 3.022 |
| AIS | Advanced industrial structure | 6744 | 0.095 | 6.387 | 0.974 | 0.506 | 0.857 |
| FIL | Future industrial level | 4274 | 0.373 | 3.480 | 1.779 | 0.553 | 1.730 |
| GI | The number of green inventions Sqr obtained in that year | 6704 | 0.000 | 75.875 | 3.654 | 5.795 | 2.000 |
Table 3 reports the descriptive statistical results of the main variables, covering the sample mean, standard deviation, minimum value, maximum value and median. From the statistical results, the data distribution of each variable shows significant differences and has good variability, which is suitable for the subsequent panel data econometric regression analysis.
First of all, about the core explanatory variables and interpreted variables. The average value of urban carbon emissions is 7.197, the standard deviation is 0.483, and the minimum value and maximum value are 4.970 and 8.488, respectively, indicating that there are significant gradient differences in the scale of carbon emissions in different cities. As for the core explanatory variables, the average value of green finance index is 0.286, and the standard deviation is 0.113. There is a big difference between the maximum value (0.719) and the minimum value (0.013), which shows that the development level of green finance among cities in China is extremely unbalanced. It is worth noting that the average value of the digital economic index is only 0.039, while the maximum value reaches 0.940, and the median value (0.012) is far below the average value. This remarkable right-leaning distribution shows that the development of digital economy presents an obvious polarization trend. A few head cities have a high level of digital economy development, while most cities are still in their infancy.
Secondly, about control variables. Each control variable also shows discrete characteristics in different degrees. For example, the range of regional GDP is large (3.013 to 5.132), which reflects the huge gap in the level of economic development of sample cities; The average urbanization rate is 0.357 and the standard deviation is 0.196, covering all kinds of urban forms from the initial stage to the mature stage. In addition, the standard deviations of variables such as industrial structure, opening level and financial investment are all within a reasonable range, which shows that the sample is fully representative and helps to control the errors caused by missing variables.
Generally speaking, the statistical characteristics of each variable are in a reasonable range, and the standard deviation indicates that the sample data has a certain degree of dispersion, which can reflect the differences between different samples. At the same time, the existing sample size meets the basic requirements of statistical inference, and the data quality is suitable for subsequent empirical tests.
3.2. Model Assumptions
3.2.1. Benchmark Regression Model
According to the above theoretical analysis, this paper designs a benchmark regression model:
In which CO2it represents the carbon emission intensity of region I in the t year. The core explanatory variable is GF, which represents the Development level of green finance of region I in T year; Controls is the control variable set model, which also controls the time-fixed effect Year and the region-fixed effect Firm; ξit is a random error term.
3.2.2. Interaction Effect Model
In order to deeply explore the impact of digital access level, this paper divides all regions in China into eastern coastal areas and other regions, and at the same time constructs an interactive term (GF×Dig) of regional virtual variables and digital transformation, so as to distinguish the heterogeneous impact of regions on the digital carbon emission reduction effect.
3.2.3. Intermediary Variable Model
To examine the mediating mechanism of the impact of enterprise digital transformation on carbon emissions, this study draws on Abbott, K. W. (2017) and Wilkinson, L. (1979), who estimated intermediate variables using the “stepwise regression method”. Specifically, taking Total factor productivity(TF), innovation level (Inv), and R&D intensity (RD) as intermediate variables, the benchmark regression is tested, and the corresponding research model is constructed.
The mediating variable plays a mediating role when the coefficients in (4 and (3) are significant. When and the coefficient in (4) is significant, it indicates that the mediating effect is partial, and vice versa.,all significant, This means that the mediation variable plays a mediating role.When and in (4)coefficients are significant when, This indicates that the mediation effect is partial mediation effect and otherwise complete mediation effect. , all significant,This means that the mediation variable plays a mediating role.When and in (4) coefficients are significant when,This indicates that the mediation effect is partial mediation effect and otherwise complete mediation effect.
4. Empirical Analysis
4.1. Benchmark Regression
Table 4 reports the benchmark regression results of the impact of digital economy and green finance on urban carbon emissions. After controlling the fixed effect of region and time and related control variables, the results in column (1) and column (2) show that the regression coefficients of digital economy and green finance are -0.108 and -0.184, respectively, and both are significantly negative at the statistical level of 1%. This shows that the development of digital economy and green finance has a significant negative correlation with urban carbon emissions, that is, the improvement of their level can effectively curb urban carbon emissions. In addition, the test values of the model are all significant at the level of 1%, indicating that the overall fitting effect of the model is good. The empirical results support the conclusion that digital economy and green finance have significant carbon emission reduction effects, and verify the H1 hypothesis.
4.2. Robustness Test
In order to test the reliability of the benchmark regression results and eliminate the possible errors caused by model setting, variable measurement and sample structure, this study carried out robustness tests from three aspects: variable transformation, index substitution and sample adjustment. The overall results show that the estimation direction and significance of each alternative model are consistent with the benchmark regression, which further verifies that the inhibitory effect of green finance on urban carbon emissions is highly robust.
4.2.1. Replacing Core Explanatory Variables
In order to verify the reliability of the benchmark regression results and eliminate the estimation bias that may be caused by a single index measurement method, firstly, the substitution index of the core explanatory variables is used for robustness test. Considering the discrete characteristics and potential heteroscedasticity of the original green financial index data, this paper refers to Han Xianfeng et al. (2023).[30]Based on the research paradigm, a new explanatory variable lg(GF+1) is constructed and re-incorporated into the regression model. This processing method aims at smoothing data fluctuation and reducing the interference of extreme values on estimation accuracy, thus providing more rigorous empirical evidence.
The regression results are shown in Table 5. After replacing the explanatory variables, the regression coefficient is -0.471, which remains significant at the statistical level of 1%, and the overall goodness of fit of the model is good. This result shows that even if the measurement form of variables is changed, the significant inhibitory effect of green financial development on urban carbon emissions has not changed, and the sign and significance of coefficients are highly consistent with the benchmark regression. This further confirms the robustness of the core conclusion of this paper, that is, green finance is indeed an important driving force to promote urban low-carbon transformation.
4.2.2. Replace the Interpreted Variable
In order to further eliminate the estimation bias that may be caused by a single explained variable measurement method, and verify the universality of green financial environmental effects, this paper refers to the existing literature, and selects sulfur dioxide () emissions as a substitute indicator of carbon emissions for robustness test.[29,91]. Although the data can accurately reflect the level of urban carbon emissions, there may still be slight differences in energy accounting caliber. In contrast, as a typical air pollutant, it has a strong energy dependence, and its emissions mainly come from the combustion of fossil fuels, which has a high degree of homology with carbon emissions, so it can be used as an important substitute variable to measure the intensity of urban energy consumption and environmental pressure. In the empirical treatment, this paper makes logarithmic treatment of urban emissions () to eliminate the heteroscedasticity of the data and ensure the robustness of the regression results.
Table 6 proves the universality of environmental governance efficiency of green finance. Even if the measurement standard of environmental performance is switched to sulfur dioxide emissions, green finance still shows a strong emission reduction effect, and its regression coefficient is negative (-0.403), which remains highly significant at a confidence level of 1%. This result shows that green finance not only plays a central role in the field of carbon emission reduction, but also has a significant synergistic inhibitory effect in a wider range of pollutant control. The core conclusion has not deviated due to the change of environmental indicators, and this cross-index consistency performance enhances the credibility and universality of the conclusions of this study.
4.2.3. Eliminate Sudden Point Regression
In view of the fact that major public health emergencies often constitute a strong exogenous impact, which has an atypical structural disturbance to economic activities and energy consumption patterns. Specifically, the COVID-19 epidemic (Covid-19) from 2020 to 2022 led to different degrees of shutdown and traffic control. This fluctuation of carbon emissions caused by administrative power may cover up the real market mechanism of green finance. In order to strip off the potential interference of this special period on the estimation results and verify the universality of the research conclusions under the economic normalization operation, this paper removes the observation samples from 2020 to 2022 in order to test the reliability of the benchmark regression through the purification time window.
The regression results based on the adjusted samples are shown in Table 7. Empirical evidence shows that the core explanatory power of green finance is still stable even after excluding the abnormal data interference during the epidemic. The regression coefficient shows that every one unit increase in the development level of green finance will still significantly reduce the level of carbon emissions by 0.163 units, and the inhibition has passed the significance test at the level of 1%. This discovery confirms the previous research judgment, that is, the negative constraint effect of green finance on carbon emissions does not stem from economic shutdown or policy accident in a specific period, but has long-term time stability and internal structural laws.
4.3. Endogenous Problem Handling
In the study of the relationship between green finance and carbon emissions at the city level, there may be endogenous errors caused by reverse causality, missing variables or policy linkage. For example, the decline in carbon emissions may attract more green financial resources to flow into cities, thus making it difficult to distinguish the causal direction between green finance and carbon emissions. In addition, factors such as urban governance capacity, ecological policy intensity and economic structure upgrading, which are difficult to be completely observed, may also affect the development level of green finance and carbon emissions at the same time, resulting in missing variables bias. Therefore, it is necessary to use the tool variable (IV) method to deal with the potential endogeneity.
4.3.1. Tool Variable Method
Although benchmark regression has controlled the multidimensional fixed effect, there may still be endogenous bias between green finance and carbon emissions caused by causal inversion or missing variables. Aiming at this potential measurement problem, this paper adopts two-stage least square method (2SLS) to identify the cause and effect. Limited by the scarcity of strictly exogenous natural experimental tool variables, this paper follows the practice of existing literature and selects the first-order lag term () of the green financial index as the tool variable of the current core explanatory variable (Liu, W., & Zhu, P. 2024; Wu, X. Q.,et al.2024)[30,92,93]. The theoretical legitimacy of this strategy lies in: on the one hand, the development of financial system has obvious characteristics of time inertia and path dependence, and the degree of financial deepening in the previous period has a strong predictive power to the current level, satisfying the hypothesis of correlation of instrumental variables; On the other hand, as a predetermined variable, the green finance that lags behind one period cannot directly affect the current carbon emissions through the current random disturbance term, but can only play a role through a single channel that affects the current green finance level, thus satisfying the exclusive constraints of instrumental variables.
Table 9 reports the two-stage regression results of instrumental variable method. The estimation results of the first stage show that instrumental variable () has a strong explanatory power to endogenous variable (), and the regression coefficient is 0.989, which is significant. At the same time, the statistic of the first stage is 20248.786, which far exceeds the empirical critical value of Stock-Yogo weak identification test of 10, and the problem of weak instrumental variables is ruled out. In the second stage of regression, the regression coefficient of green financial indicators fitted by instrumental variables to urban carbon emissions is -0.285, which remains significant at the level of 1%. This empirical evidence shows that the causal effect of green finance significantly inhibiting urban carbon emissions is still stable after the potential endogenous interference is effectively stripped off, further consolidating the credibility of the core conclusion of this paper.
In order to further enhance the robustness of causal identification and overcome the possible limitations of a single instrumental variable, this paper draws on the ideas of existing literature and constructs the spherical distance from cities to Hangzhou as the second instrumental variable.[94,95]. The economic logic of this tool variable selection lies in: on the one hand, it satisfies the hypothesis of correlation. As the pioneer demonstration area of digital economy and green financial reform in China, such as ANT FOREST and the green financial reform and innovation pilot area, Hangzhou’s financial development model has obvious spatial spillover and demonstration diffusion effects. According to the first law of geography and technology diffusion theory, the closer the geographical distance, the easier it is for cities to undertake the green financial resource overflow, talent migration and policy imitation from Hangzhou, thus showing a higher level of green financial development. On the other hand, it satisfies the hypothesis of externality. The geographical spherical distance between the city and Hangzhou is a natural geographical endowment with strict externality. It does not directly participate in the city’s production function or energy consumption process, and cannot affect carbon emissions through other channels except green finance, thus meeting the exclusive constraints.
The results of 2SLS regression based on this geo-tool variable are shown in Table 10. The first-stage regression results show that the regression coefficient of instrumental variable () is -0.022, which is significant at the level of 1%, indicating that with the increase of geographical distance from Hangzhou, the development level of urban green finance shows a significant decline trend, which strongly verifies the effectiveness of the diffusion mechanism from the center to the periphery. At the same time, the statistic is 411.876, which far exceeds the critical value of weak instrumental variables test, indicating that instrumental variables have strong explanatory power. The second-stage regression results show that the regression coefficient of green finance to carbon emissions is -2.221 after the endogenous components are separated by exogenous geographical distance, and it remains significant at the level of 5%. This result once again confirms that the inhibition of green finance on urban carbon emissions has a steady causal relationship, and the absolute value of its marginal emission reduction effect has increased compared with the benchmark regression, suggesting that ignoring endogenous problems may underestimate the real environmental performance of green finance.
4.4. Mechanism Analysis
In order to further reveal the internal action path of green finance affecting urban carbon emissions, this paper carries out mechanism identification from three channels: advanced industrial structure, future industrial development level and green technology innovation. Based on the regression framework (Table 11, Table 12 and Table 13) in which the mechanism variables are gradually incorporated, the empirical results prove that green finance not only directly reduces urban carbon emissions, but also indirectly exerts the emission reduction effect through multi-dimensional structure and technical mechanisms, forming a systematic and linked low-carbon development logic.
4.4.1. Intermediary Effect
The test results based on the intermediary effect model are shown in Table 11, in which the second and third columns respectively report the influence of green finance on the upgrading of industrial structure and the regression estimation after introducing intermediary variables. First of all, according to the second column of data, the regression coefficient of green finance to the upgrading of industrial structure is positive at the significance level of 1%, which shows that the development of green finance has played a significant role in resource allocation, guiding funds to the tertiary industry and high value-added industries, thus effectively promoting the optimization and upgrading of regional industrial structure. Further observing the third column, after the variables of green finance and industrial structure upgrading are included at the same time, the estimation coefficient of industrial structure upgrading on carbon emissions is significantly negative, indicating that industrial structure optimization and transformation can effectively curb carbon emissions; At the same time, the direct impact coefficient of green finance on carbon emissions is still significantly negative, but it converges compared with the total effect of the first column, which proves that the advanced industrial structure plays a partial intermediary role in the emission reduction effect of green finance. Through the calculation of intermediary effect, it can be known that if other variables are controlled unchanged, each unit of green finance level will indirectly reduce carbon emissions by about 0.136 units by promoting the advanced industrial structure; The indirect effect accounts for about 28.87% of the total effect (-0.471), which indicates that upgrading the industrial structure is an important transmission mechanism for green finance to achieve the goal of urban carbon reduction.
To further investigate the intermediary transmission mechanism of future industrial level in the process of green finance affecting urban carbon emissions, this paper first refers to the research of scholars such as Li Xiangyang and Wei Haishai.[96,97]The number stock of artificial intelligence enterprises and the penetration rate of industrial robots are selected as the core proxy indicators. By calculating the arithmetic average of their natural logarithms, the future industrial development level of the region is comprehensively described from the dual dimensions of industrial scale expansion and technology application depth. The regression results based on this measurement index are shown in the table. According to the observation column (2), the regression coefficient of green finance to the future industrial level is significantly positive () at the level of 1%, which proves that green finance can effectively empower emerging technology industries to gather through capital orientation. Further combined with the analysis in column (3), after introducing intermediary variables, the future industrial level has a significant positive impact on carbon emissions (), which indicates that the future industrial development may be accompanied by an increase in energy demand in the short term. According to this calculation, every unit of green finance will indirectly increase carbon emissions by about 0.026 units by promoting future industrial development; This indirect effect is opposite to the sign of the direct effect (), which constitutes a statistical masking effect. Nevertheless, green finance still effectively offset the environmental pressure brought by industrial expansion, so that the total effect remained at -0.257, and finally achieved the overall carbon reduction goal.
Finally, aiming at the core intermediary channel of green innovation, this paper selects the green invention patent with the most scientific and technological content as the proxy index, because it can better reflect the substantive innovation quality and technological breakthrough; At the same time, in order to smooth the data distribution and correct skewness, the square root of the number of green inventions obtained by prefecture-level cities in that year is used to measure it in the empirical study. Table 13 reports the test results of mediation effect based on this index. Analysis of the data in column (2) shows that the regression coefficient of green finance to the number of green inventions is significantly positive () at the level of 1%, indicating that the precise injection of financial resources has effectively eased the R&D financing constraints of enterprises and significantly stimulated the output of high-quality green technologies. Furthermore, the green innovation variable is included in column (3) of the model, which shows that green invention has a significant negative inhibitory effect on carbon emissions (), which verifies the source control effect of technological progress in pollution control; At the same time, the direct emission reduction coefficient of green finance is still significantly negative (), and the value is slightly less than the total effect (-0.198) in column (1), which confirms the existence of some intermediary effects. It is estimated that, when other conditions are constant, every unit of green finance is increased, the carbon emission can be indirectly reduced by about 0.010 unit by improving the level of green technology innovation; The indirect emission reduction effect produced by this conduction path accounts for about 5.18% of the total effect, which shows that stimulating substantial green innovation is an important technical path for green finance to achieve carbon emission reduction targets.
Based on the test results of the three mechanisms, it can be found that the impact of green finance on carbon emissions is not a single channel, but through optimizing industrial structure, developing future industries, encouraging green technology innovation to form a multi-dimensional conduction chain that complements and strengthens each other, and jointly promoting the city to a low-carbon development model with technology-driven and innovation-led as the core, which proves the H2 hypothesis put forward above.
4.4.2. Synergistic Emission Reduction Effect
To further investigate the synergistic effect of green finance and technological innovation in carbon emission reduction, this paper selects digital economy as the core representation of technological innovation, and constructs the interaction term between green finance and digital economy into the model for testing. The regression results are shown in Table 14. The observation data show that the estimation coefficient of the interaction term is significantly negative at the statistical level of 1%, which preliminarily verifies that the combination of the two has a significant negative driving effect on reducing carbon emissions. In order to deeply analyze the strength of this synergistic mechanism, the interaction effect is compared with the marginal effect of single factor in the benchmark regression in Table 4: in the single regression, the inhibition coefficients of digital economy and green finance on carbon emissions are -0.108 and -0.184 respectively. By comparing the absolute values of the coefficients, it can be found that the emission reduction effect (|-0.339|) generated by the interaction term is not only significantly better than the single effect of the digital economy (|-0.108|), but also greatly exceeds the emission reduction intensity (|-0.184|) when green finance acts alone. This empirical result strongly confirms that there is a significant synergistic strengthening effect between green finance and digital technology, that is, the high permeability of digital economy effectively improves the efficiency of fund allocation and the ability of risk identification of green finance, while the capital supply of green finance provides essential support for the green application of digital technology, and jointly realizes a deeper urban low-carbon governance.
To sum up, the synergistic mechanism of green finance and technological innovation not only effectively expands the marginal effect of green capital emission reduction, but also significantly enhances the transformation ability of urban technological innovation achievements in low-carbon transformation, thus forming a systematic path of emission reduction and efficiency improvement. This result verifies that green finance and technological innovation are not independent policy tools, but can jointly promote the city to achieve higher quality and low-carbon development through interaction and meet the H3 hypothesis.
4.5. Heterogeneity Analysis
In order to further test whether the impact of green finance and technological innovation on urban carbon emissions is heterogeneous due to differences in regional characteristics, digital economy development level and resource endowment, this paper conducts group regression analysis based on urban agglomeration division, digital economy level division and resource-based city classification (Table 15, Table 16 and Table 17). This method is helpful to identify the differences of policy effects in different development stages and different structural conditions, and enhance the external validity of the conclusions.
4.5.1. Grouping Regression
The results of heterogeneity investigation based on the perspective of urban agglomeration are shown in Table 15. The impact of green finance on carbon emissions shows significant spatial heterogeneity in different regions. Specifically, the regression coefficients of urban agglomerations in the Yangtze River Delta and the middle reaches of the Yangtze River are -1.308 and -1.099, respectively, and both of them are significant at least at the level of 5%, indicating that the development of green finance in these two regions has effectively formed an inhibitory effect on carbon emissions. It is worth noting that the absolute value of emission reduction coefficient of Yangtze River Delta urban agglomeration (|-1.308|) is significantly higher than that of the whole sample (|-0.488|) and the middle reaches of the Yangtze River, which shows that the resource allocation efficiency of green finance in this region has reached the optimal level by virtue of its mature financial market system and high technological transformation ability.
However, the estimation results of Beijing-Tianjin-Hebei urban agglomeration are quite different, and its coefficient is significantly positive () at the level of 1%. This abnormal phenomenon may be attributed to the large base of heavy industry in Beijing-Tianjin-Hebei region, and the industrial structure tends to be resource-based. In the initial stage, green financial funds may be used more for equipment renovation of traditional high-energy-consuming enterprises than subversive green technological innovation. This terminal governance model may be accompanied by the rigid increase of energy consumption in the short term, which leads to a temporary increase in carbon emissions. To sum up, the carbon emission reduction dividend of green finance is not evenly distributed, but highly depends on the regional industrial endowment and financial ecological maturity.
In order to investigate the role of digital technology infrastructure in the emission reduction effect of green finance, this paper selects the cities with the top 25% digital economy level as the high digital economy group, and the cities with the bottom 25% as the low digital economy group. The grouped regression results are shown in Table 16. Comparative analysis shows that in the high digital economy group, the estimation coefficient of green finance is negative () at 1% significance level, and its absolute value is much higher than the regression coefficient of the whole sample (|-0.250|). On the contrary, in the low digital economy group, the coefficient of green finance turned from negative to positive and failed the significance test ().
This result shows that the development of digital economy has a magnifying effect in the process of green finance and technological innovation promoting carbon emission reduction: cities with perfect data infrastructure and stronger digital governance capabilities can improve the accuracy of green financial fund allocation and accelerate the transformation efficiency of technological innovation achievements in the field of energy conservation and emission reduction, thus enhancing the overall efficiency of low-carbon governance. On the contrary, cities with weak digital economy foundation have a high degree of information asymmetry and slow technology diffusion, which leads to the limited impact of green finance incentive mechanism and technological innovation on carbon emissions.
According to China government documents [98]. This paper divides the sample into resource-based and non-resource-based cities. The results of grouped regression in Table 17 show that the impact of green finance on carbon emissions is quite different. In resource-based cities, the regression coefficient of GF is -0.350, which is significant at the level of 1%, indicating that green finance effectively inhibits carbon emissions; On the contrary, in non-resource cities, the coefficient of GF is 0.471(p<0.01), which shows that it has a significant positive correlation with carbon emissions. This shows that the carbon reduction effect of green finance has obvious characteristics of resource dependence, which mainly plays the expected role in environmental governance in resource-based cities.
The reason for the above differences may lie in the difference between industrial structure and marginal cost of emission reduction. Resource-based cities are facing the dual pressures of energy-intensive industrial transformation and environmental regulation. Green finance accelerates the technological transformation or withdrawal of heavily polluting enterprises through financing constraints and incentives. Because of its high initial pollution level, the marginal emission reduction benefits are the most significant. In contrast, the industrial structure of non-resource-based cities is relatively clean, and the space for emission reduction is limited. The investment in green finance may mainly trigger the scale effect of promoting economic expansion, but it has not completely offset the increase in energy consumption caused by production expansion. In addition, non-resource-based cities may have fund mismatch caused by vague definition of green projects, which leads to financial deepening and pushes up carbon emissions.
Three types of heterogeneity analysis show that the emission reduction effects of green finance and technological innovation are not homogeneous, but are significantly influenced by regional development foundation, digital economy conditions and resource endowment structure. Generally speaking, cities with high development level, strong digital economy foundation and more flexible industrial structure are more likely to obtain stronger low-carbon benefits brought by green finance and technological innovation. This not only verifies the regional dependence of their emission reduction effects, but also provides an empirical basis for differential formulation of low-carbon policies.
4.6. Quantile Regression
Table 18 reports the regression results of green finance at different quantiles of carbon emissions. The results show that the coefficient of green finance (GF) is negative and significant (p<0.01) at the quantile of 0.100 to 0.900, which proves the robustness of its emission reduction effect. It is worth noting that the marginal inhibition of GF on carbon emissions presents a nonlinear inverted U-shaped feature: with the increase of carbon emission quantile, the absolute value of GF coefficient rises from the fluctuation at the low quantile, reaches the peak at 0.700 quantile (-0.457), and then gradually falls back at the very high quantile (0.800-0.900). This shows that the emission reduction efficiency of green finance is the strongest in cities with medium and high emission levels, but relatively weak in cities with low and very high emissions.
The reason for this trend may lie in the difference between marginal emission reduction cost and resource endowment. For cities with low emission levels, because the environmental efficiency is at a high level, further emission reduction faces the law of diminishing marginal utility, which leads to limited emission reduction benefits brought by various inputs of green finance. With the increase of emission level and the expansion of emission reduction space, green finance can promote technological innovation by alleviating financing constraints, which can produce significant clean effect. However, for the extremely high emission cities at the top of the distribution (0.800-0.900), they often have a heavy industrial structure and a strong Carbon Lock-in effect, and it is difficult for simple financial incentives to overcome the deep structural rigidity, which leads to marginal decline in the marginal efficiency of emission reduction of green finance after reaching the threshold.
5. Conclusions and Policy Recommendations
5.1. Main Conclusions
Based on the actual needs of China’s urban low-carbon transformation, this paper uses the urban panel data from 2000 to 2023 to build a comprehensive econometric model including interaction effect, intermediary effect and quantile regression, and deeply analyzes the independent influence and synergistic mechanism of green finance and technological innovation in carbon emission reduction. Through empirical test, this study draws the following core conclusions:
First, green finance and digital economy are important forces to curb the growth of urban carbon emissions, and their synergy can produce significant emission reduction and efficiency improvement. The research data show that the development level of green finance and the improvement of digital economy can effectively reduce the intensity of urban carbon emissions. More crucially, the test results of interaction items confirm that there is a deep coupling relationship between them. Through the efficient circulation of data elements, the digital economy alleviates the information asymmetry in the process of green investment and financing, and improves the accuracy of fund allocation; Green finance provides the necessary financial support for the green application of digital technology and industrial penetration. This benign interaction between financial capital and technical factors makes the carbon emission reduction effect under the synergistic effect of the two factors significantly better than the simple superposition of single factors, which verifies the effectiveness of digital and green collaborative governance.
Second, green finance can achieve indirect emission reduction by driving technological progress, optimizing industrial structure and cultivating future industries. The test of intermediary mechanism shows that the carbon emission reduction effect of green finance does not exist in isolation, but depends on the structural change of the real economy. First, green finance has eased the financing constraints of enterprises’ R&D, significantly promoted the output of green invention patents, and strengthened the technical support for source emission reduction; Secondly, the capital-oriented mechanism guides the flow of resources to the tertiary industry with high added value, which promotes the overall upgrading of industrial structure, thus reducing the energy consumption level per unit output; Third, although future industries such as artificial intelligence and industrial robots may be accompanied by a certain increase in energy consumption in the initial stage of cultivation, the intervention of green finance has effectively smoothed this process and generally ensured a smooth transition to a low-carbon new economic form.
Third, the emission reduction effect of green finance is limited by regional economic base, digital infrastructure and resource endowment, showing significant spatial heterogeneity. At the regional level, the Yangtze River Delta urban agglomeration, with its highly integrated financial market and mature digital ecology, has the most remarkable emission reduction effect, which is better than the urban agglomeration in the middle reaches of the Yangtze River. However, the Beijing-Tianjin-Hebei region is still under great pressure to reduce emissions in the short term because of its high proportion of heavy chemical industry. At the level of digital infrastructure, the marginal effect of green finance emission reduction in cities with high digital economy level is stronger, which shows that perfect digital infrastructure is an important threshold for green finance to play its environmental benefits. In terms of resource endowment, resource-based cities are more sensitive to green finance, which shows that financial tools can help accelerate the exit and transformation of high-energy-consuming industries and have a special corrective effect on low-carbon transformation in resource-dependent areas.
Fourthly, the restraining effect of green finance on carbon emissions presents nonlinear dynamic characteristics. Quantile regression results show that green finance is the strongest in cities with medium and high carbon emissions. However, in low-emission cities or because of the high marginal cost of emission reduction, very high-emission cities may face carbon locking effect, and the effect of relying solely on market-oriented financial means is relatively limited. This shows that cities in different emission stages have objective differences in their acceptance and response to green finance.
5.2. Policy Recommendations
Based on the above research conclusions, in order to further release the synergy potential of green finance and technological innovation and promote the overall green transformation of economy and society, the following policy suggestions are put forward:
Deepen the integration of digitalization and greening, and build an intelligent green financial service system. In view of the significant amplification of digital economy on the efficiency of green finance, policy-making should focus on breaking the information barrier. It is suggested to use big data, blockchain and artificial intelligence technology to establish a regional enterprise carbon account and environmental benefit evaluation system to realize real-time monitoring and credible traceability of carbon emission data. Financial institutions should rely on financial technology to innovate dynamically linked green credit and bond products, and improve the identification efficiency and risk management and control ability of green projects. By consolidating the digital infrastructure, environmental rights and interests will be transformed into quantifiable and tradable digital assets, thus reducing the customer acquisition cost and operating threshold of green capital and realizing the precise drip irrigation of financial resources in the green and low-carbon field.
Strengthen the dual guidance of innovation drive and structural optimization, and improve the efficiency of entity transformation of green funds. In view of the intermediary transmission mechanism, the government should guide financial resources to tilt towards substantive innovation and structural upgrading. On the one hand, we will set up a special green science and technology guidance fund to support research and development breakthroughs in key areas such as clean energy, energy storage technology and carbon capture, and improve the conversion rate and application rate of green patents. On the other hand, differentiated credit policies and financing tools are used to support the technological transformation and digital upgrading of traditional manufacturing industries, and orderly promote the agglomeration of resource elements to service-oriented manufacturing and high-tech industries. In the process of cultivating future industries, we should pay attention to the constraints of energy efficiency standards, ensure that artificial intelligence and intelligent manufacturing industries achieve low-carbon development while expanding, and avoid emerging industries becoming new emission sources.
Implement differentiated regional promotion strategies to promote the spatial balance of low-carbon development. According to the heterogeneous characteristics of urban agglomeration and resource endowment, we should avoid implementing homogenization policy means. For the Yangtze River Delta and other areas with good economic and digital foundation, we should encourage them to benchmark international standards, carry out green financial product innovation and carbon financial market exploration, and give play to their demonstration radiation effect as the growth pole of regional low-carbon development. For resource-based cities, we should establish a financial support mechanism for transformation, reduce the financing cost of low-carbon transformation of traditional high-carbon industries through discount and guarantee, and help them break the resource curse. For the central and western cities where the development of digital economy is relatively backward, priority should be given to increasing investment in new infrastructure construction and enhancing their ability to undertake green financial resources and technology transfer.
Build a hierarchical financial support system in the whole life cycle and break through the bottleneck of emission reduction in key areas. According to the characteristics of cities with different emission levels, a multi-complementary policy toolbox should be constructed. For cities with medium and high emissions, we should give full play to the decisive role of the market mechanism and use standardized tools such as green credit and green bonds to encourage enterprises to reduce emissions independently. For extremely high emission regions or industries facing carbon lock-in, simple market incentives may fail, so it is necessary to strengthen the positive role of the government and share the costs and risks of deep decarbonization by means of mixed financing and risk compensation. At the same time, explore the establishment of cross-regional carbon inclusive mechanism and ecological compensation mechanism, promote the reasonable sharing of emission reduction costs and benefits among different subjects, and form a low-carbon governance pattern with the participation of the whole society.
Funding
This research received no external funding.
Data Availability Statement
The data was obtained by contacting the corresponding author.
Conflicts of Interest
The authors declare no conflicts of interest.
References
- United Nations. (2015).Transforming our world: The 2030 Agenda for Sustainable Development.https://sdgs.un.org/2030agenda.
- The Central Committee of the Communist Party of China,&the State Council. (2021). Opinions on completely, accurately and comprehensively implementing the new development concept and doing a good job in carbon neutrality in peak carbon dioxide emissions. Chinese Government Network.https://www.gov.cn/zhengce/2021-10/24/content_5644613.htm.
- People’s Bank of China, Ministry of Finance, Development and Reform Commission, Ministry of Environmental Protection, China Banking Regulatory Commission, China Securities Regulatory Commission and China Insurance Regulatory Commission. (2016). Guiding Opinions on Building a Green Financial System. China Government Network.https://www.gov.cn/xinwen/2016-09/01/content_5104132.htm.
- National People’s Congress. (2021). The 14th Five-year Plan for People’s Republic of China (PRC)’s National Economic and Social Development and the Outline of the Long-term Goals in 2035. China Government Network.https://www.gov.cn/xinwen/2021-03/13/content_5592681.htm.
- Ministry of Science and Technology, et al. (2022). The 14th Five-Year National Science and Technology Innovation Plan. China Government Network.https://www.gov.cn/zhengce/content/2022-04/01/content_5682976.htm.
- National Bureau of Statistics. (2024). Statistical Bulletin on National Economic and Social Development in 2023. National Bureau of Statistics Network.https://www.stats.gov.cn/sj/zxfb/202402/t20240228_1947915.html.
- People’s Bank of China. (2024). China Green Finance Development Report in 2023. China People’s Bank Network.http://www.pbc.gov.cn/goutongjiaoliu/113456/113469/5377065/index.html.
- Ministry of Science and Technology, et al. (2025). Statistical Bulletin of National Science and Technology Investment in 2024. Chinese Government Network.Statistical Bulletin of National Science and Technology Investment in 2024-Ministry of Science and Technology of the People’s Republic of China.
- China National Intellectual Property Administration. (2024). Patent Statistics Annual Report of China in 2023 [Data Statistics Column]. China National Intellectual Property Administration Net.https://www.cnipa.gov.cn/col/col61/index.html.
- Ministry of Industry and Information Technology. (2024). China Industrial Green Development Report in 2023 [Interpretation/Release]. Ministry of Industry and Information Technology Network.https://www.miit.gov.cn/jgsj/jns/index.html.
- International Energy Agency (IEA). (2024).CO2 emissions in 2023: A new record high, but is the peak in sight? .https://www.iea.org/reports/co2-emissions-in-2023.
- Li, H.; Chen, C.; Umair, M. Green finance, enterprise energy efficiency, and green total factor productivity: evidence from China. Sustainability 2023, 15(14), 11065. [Google Scholar] [CrossRef]
- Yan, M.; Gong, X. Impact of green credit on green finance and corporate emissions reduction. Finance Research Letters 2024, 60, 104900. [Google Scholar] [CrossRef]
- Lin, Z.; Liao, X.; Jia, H. Could green finance facilitate low-carbon transformation of power generation? Some evidence from China. International Journal of Climate Change Strategies and Management 2023, 15(2), 141–158. [Google Scholar] [CrossRef]
- Chen, M.; Song, L.; Zhu, X.; Zhu, Y.; Liu, C. Does green finance promote the green transformation of China’s manufacturing industry? Sustainability 2023, 15(8), 6614. [Google Scholar] [CrossRef]
- Zhang, M.; Li, B.; Yin, S. Is technological innovation effective for energy saving and carbon emissions reduction? Evidence from China. Ieee Access 2020, 8, 83524–83537. [Google Scholar] [CrossRef]
- Liu, Y.; Tang, L.; Liu, G. Carbon dioxide emissions reduction through technological innovation: Empirical evidence from Chinese provinces. International Journal of Environmental Research and Public Health 2022, 19(15), 9543. [Google Scholar] [CrossRef] [PubMed]
- Zhang, H.; Wang, Y.; Wang, W. Does renewable energy technology innovation achieve the synergistic effect of pollution and carbon reduction? In Renewable Energy; 2025; p. 123329. [Google Scholar]
- Wang, X.; Su, H.; Liu, X. The impact of green technological innovation on industrial structural optimization under dual-carbon targets: The role of the moderating effect of ca rbon emission efficiency. Sustainability 2025, 17(14), 6313. [Google Scholar] [CrossRef]
- Zhu, X. Have carbon emissions been reduced due to the upgrading of industrial structure? Analysis of the mediating effect based on technological innovation. Environmental Science and Pollution Research 2022, 29(36), 54890–54901. [Google Scholar] [CrossRef]
- Zhang, L.; Saydaliev, H. B.; Ma, X. Does green finance investment and technological innovation improve renewable energy efficiency and sustainable development goals. Renewable Energy 2022, 193, 991–1000. [Google Scholar] [CrossRef]
- Kumar, B.; Kumar, L.; Kumar, A.; Kumari, R.; Tagar, U.; Sassanelli, C. Green finance in circular economy: a literature review. Environment, development and sustainability 2024, 26(7), 16419–16459. [Google Scholar] [CrossRef]
- Zhang, Y. Role of green finance, green bonds, public private partnership, and technology innovation in carbon neutrality and sustainable development. Heliyon 2024, 10(18). [Google Scholar] [CrossRef]
- Nasir, N.; Ahmed, W. Green finance initiatives and their potential to drive sustainable development. In InClimate change and finance: navigating the challenges and opportuni ties in capital markets; Springer Nature Switzerland: Cham, 2024; pp. 3–29. [Google Scholar]
- Fu, C.; Lu, L.; Pirabi, M. Advancing green finance: a review of sustainable development. Digital Economy and Sustainable Development 2023, 1(1), 20. [Google Scholar] [CrossRef]
- Nedopil, C., & Song.
- Ahmad, F., Boumaiza, A., Sanfilippo, A., & Al-Fagih, L. (2025). A Detailed Comprehensive Role of Digital Technologies in Green Finance Initiative for Net-Zero Energy Transition.Advanced Energy and Sustainability Research, 2500066.
- Xiao, Y.; Lin, M.; Wang, L. Impact of green digital finance on sustainable development: evidence from China’s pilot zones. Financial Innovation 2024, 10(1), 1–32. [Google Scholar] [CrossRef]
- Liu, W.; Zhu, P. The impact of green finance on the intensity and efficiency of carbon emissions: the moderating effect of the digital economy. Frontiers in Environmental Science 2024, 12, 1362932. [Google Scholar] [CrossRef]
- Xianfeng, Han; Jian, Xiao; Mingfang, Dong. The carbon reduction effect of green finance development. Resource Science 2023, 45(04), 843–856. [Google Scholar]
- Ran, C.; Zhang, Y. The driving force of carbon emissions reduction in China: Does green finance work. Journal of Cleaner Production 2023, 421, 138502. [Google Scholar] [CrossRef]
- Umar, M.; Safi, A. Do green finance and innovation matter for environmental protection? A case of OECD economies. Energy Economics 2023, 119, 106560. [Google Scholar] [CrossRef]
- Wang, Y.; Cui, L.; Zhou, J. The impact of green finance and digital economy on regional carbon emission reduction. International Review of Economics & Finance 2025, 97, 103748. [Google Scholar]
- Chen, Xiaolong; Wang, Guanghui; Liang, Chenlu. Beyond traditional pathways: How green finance drives dual carbon-pollution reduction by heterogeneous innovation and spatial spillovers in Chinese ci ties. Journal of Cleaner Production 2025, 530, 146812–146812. [Google Scholar] [CrossRef]
- Hou, Mengyang; Xie, Yalin; Lu, Weinan; Cui, Xuehua; Xi, Zenglei; Han, Yuxin. Green finance drives the synergy of pollution control and carbon reduction in China: Dual perspective of effect and efficiency. Energy 2025, 330, 136873–136873. [Google Scholar] [CrossRef]
- Wu, G.; Liu, X.; Cai, Y. The impact of green finance on carbon emission efficiency. Heliyon 2024, 10(1). [Google Scholar] [CrossRef]
- Huang, J.; He, W.; Dong, X.; Wang, Q.; Wu, J. How does green finance reduce China’s carbon emissions by fostering green technology innovation? Energy 2024, 298, 131266. [Google Scholar] [CrossRef]
- Sharif, A.; Saqib, N.; Dong, K.; Khan, S. A. R. Nexus between green technology innovation, green financing, and CO2 emissions in the G7 countries: the moderating role of social globalisation. Sustainable Development 2022, 30(6), 1934–1946. [Google Scholar] [CrossRef]
- Sethi, L.; Behera, B.; Sethi, N. Do green finance, green technology innovation, and institutional quality help achieve environmental sustainability? Evidence from the developing economies. Sustainable Development 2024, 32(3), 2709–2723. [Google Scholar] [CrossRef]
- Chen, D.; Hu, H.; Chang, C. P. Green finance, environment regulation, and industrial green transformation for corporate social responsibility. Corporate Social Responsibility and Environmental Management 2023, 30(5), 2166–2181. [Google Scholar] [CrossRef]
- Wang, X.; Wang, Q. Research on the impact of green finance on the upgrading of China’s regional industrial structure from the perspective of sustainable development. Resources Policy 2021, 74, 102436. [Google Scholar] [CrossRef]
- Lin, H.; Chen, J.; Cai, Z. To What Extent Does Green Finance Influence Carbon Intensity: The Role of Green Innovation and Industrial Structure. International Journal of Finance & Economics 2024. [Google Scholar]
- Lu, Y.; Xia, Z. Digital inclusive finance, green technological innovation, and carbon emissions from a spatial perspective. Scientific Reports 2024, 14(1), 8454. [Google Scholar] [CrossRef] [PubMed]
- Li, K.; Lin, W.; Jiang, T.; Mao, Y.; Shi, W. Driving carbon emission reduction in China through green finance and green innovation: an endogenous growth perspective. Environmental Science and Pollution Research 2024, 31(9), 14318–14332. [Google Scholar] [CrossRef]
- Hu, J. Synergistic effect of pollution reduction and carbon emission mitigation in the digital economy. Journal of environmental management 2023, 337, 117755. [Google Scholar] [CrossRef]
- Shang, Y.; Raza, S. A.; Huo, Z.; Shahzad, U.; Zhao, X. Does enterprise digital transformation contribute to the carbon emission reduction? Micro-level evidence from China. International Review of Economics & Finance 2023, 86, 1–13. [Google Scholar] [CrossRef]
- Chen, J.; Guo, Z.; Lei, Z. Research on the mechanisms of the digital transformation of manufacturing enterprises for carbon emissions reduction. Journal of Cleaner Production 2024, 449, 141817. [Google Scholar] [CrossRef]
- Lin, B.; Ma, R. Green technology innovations, urban innovation environment and CO2 emission reduction in China: Fresh evidence from a partially linear functional-coefficient panel model. Technological forecasting and social change 2022, 176, 121434. [Google Scholar] [CrossRef]
- Li, H.; Su, Y.; Ding, C. J.; Tian, G. G.; Wu, Z. Unveiling the green innovation paradox: Exploring the impact of carbon emission reduction on corporate green technology innovation. Technological Forecasting and Social Change 2024, 207, 123562. [Google Scholar] [CrossRef]
- OECD. OECD Digital Economy Outlook 2020; OECD Publishing, 2020. [Google Scholar] [CrossRef]
- Williams, L. D. Concepts of Digital Economy and Industry 4.0 in Intelligent and information systems. International Journal of Intelligent Networks 2021, 2, 122–129. [Google Scholar] [CrossRef]
- Xia, L.; Baghaie, S.; Sajadi, S. M. The digital economy: Challenges and opportunities in the new era of technology and electronic communications. Ain Shams Engineering Journal 2024, 15(2), 102411. [Google Scholar] [CrossRef]
- SHI, Y. Digital economy: Development and future. Bulletin of Chinese Academy of Sciences (Chinese Version) 2022, 37(1), 78–87. [Google Scholar]
- Chang, X.; Yang, Z.; Abdullah. Digital economy, innovation factor allocation and industrial structure transformation—A case study of the Yangtze River Delta city cluster in China. Plos one 2024, 19(4), e0300788. [Google Scholar] [CrossRef]
- Hao, X.; Li, Y.; Ren, S.; Wu, H.; Hao, Y. The role of digitalization on green economic growth: Does industrial structure optimization and green innovation matter? Journal of environmental management 2023, 325, 116504. [Google Scholar] [CrossRef] [PubMed]
- China Institute of Information and Communication. (2024). White Paper on Global Digital Economy (2024).http://www.caict.ac.cn/kxyj/qwfb/bps/202407/t20240705_484245.htm.
- Nosova, S.; Norkina, A.; Makar, S.; Fadeicheva, G. Digital transformation as a new paradigm of economic policy. Procedia Computer Science 2021, 190, 657–665. [Google Scholar] [CrossRef]
- Bresciani, S.; Huarng, K. H.; Malhotra, A.; Ferraris, A. Digital transformation as a springboard for product, process and business model innovation. Journal of Business Research 2021, 128, 204–210. [Google Scholar] [CrossRef]
- Favoretto, C.; Mendes, G. H. D. S.; Filho, M. G.; Gouvea de Oliveira, M.; Ganga, G. M. D. Digital transformation of business model in manufacturing companies: challenges and research agenda. Journal of Business & Industrial Marketing 2022, 37(4), 748–767. [Google Scholar]
- Marcon, É.; Le Dain, M. A.; Frank, A. G. Designing business models for Industry 4.0 technologies provision: Changes in business dimensions through digital transformation. Technological Forecasting and Social Change 2022, 185, 122078. [Google Scholar] [CrossRef]
- Xue, J.; Li, G.; Ivanov, D. Digital transformation in the blockchain era: Balancing efficiency and resilience in operations management. International Journal of Production Economics 2025, 282, 109525. [Google Scholar] [CrossRef]
- He, Z.; Huang, H.; Choi, H.; Bilgihan, A. Building organizational resilience with digital transformation. Journal of Service Management 2023, 34(1), 147–171. [Google Scholar] [CrossRef]
- Chen, J.; Guo, Z.; Lei, Z. Research on the mechanisms of the digital transformation of manufacturing enterprises for carbon emissions reduction. Journal of Cleaner Production 2024, 449, 141817. [Google Scholar] [CrossRef]
- Zhao, Y.; Xia, S.; Zhang, J.; Hu, Y.; Wu, M. Effect of the digital transformation of power system on renewable energy utilization in China. Ieee Access 2021, 9, 96201–96209. [Google Scholar] [CrossRef]
- UNEP. (2018). Inclusive green economy report. United Nations Environment Programme.
- https://www.unep.org/.
- Shan, S.; Genç, S. Y.; Kamran, H. W.; Dinca, G. Role of green technology innovation and renewable energy in carbon neutrality: A sustainable investigation from Turkey. Journal of environmental management 2021, 294, 113004. [Google Scholar] [CrossRef] [PubMed]
- Wang, Z.; Sami, F.; Khan, S.; Alamri, A. M.; Zaidan, A. M. Green innovation and low carbon emission in OECD economies: Sustainable energy technology role in carbon neutrality target. Sustainable Energy Technologies and Assessments 2023, 59, 103401. [Google Scholar] [CrossRef]
- OECD. Green innovation and industrial transition. In Organisation for Economic Co-operation and Development; 2021. [Google Scholar]
- https://www.oecd.org/.
- WIPO. Green technology book: Solutions for climate change; World Intellectual Property Organization, 2022. [Google Scholar]
- https://www.wipo.int/.
- Marín-Vinuesa, L. M.; Scarpellini, S.; Portillo-Tarragona, P.; Moneva, J. M. The impact of eco-innovation on performance through the measurement of financial resources and green patents. Organization & Environment 2020, 33(2), 285–310. [Google Scholar]
- IPCC. (2022). Climate change 2022: Mitigation of climate change. Contribution of Working Group III to the IPCC Sixth Assessment Report. Intergovernmental Panel on Climate Change.
- https://www.ipcc.ch/report/ar6/wg3/.
- Yu, C. H.; Wu, X.; Zhang, D.; Chen, S.; Zhao, J. Demand for green finance: Resolving financing constraints on green innovation in China. Energy policy 2021, 153, 112255. [Google Scholar] [CrossRef]
- Hasan, M. M.; Du, F. Nexus between green financial development, green technological innovation and environmental regulation in China. Renewable Energy 2023, 204, 218–228. [Google Scholar] [CrossRef]
- Wang, T.; Liu, X.; Wang, H. Green bonds, financing constraints, and green innovation. Journal of Cleaner Production 2022, 381, 135134. [Google Scholar] [CrossRef]
- Wang, Y.; Lei, X.; Long, R.; Zhao, J. Green credit, financial constraint, and capital investment: Evidence from China’s energy-intensive enterprises. Environmental Management 2020, 66(6), 1059–1071. [Google Scholar] [CrossRef]
- Hao, Y.; Ye, B.; Gao, M.; Wang, Z.; Chen, W.; Xiao, Z.; Wu, H. How does ecology of finance affect financial constraints? Empirical evidence from Chinese listed energy-and pollution-intensive companies. Journal of Cleaner Production 2020, 246, 119061. [Google Scholar] [CrossRef]
- Gao, J.; Wu, D.; Xiao, Q.; Randhawa, A.; Liu, Q.; Zhang, T. Green finance, environmental pollution and high-quality economic development—a study based on China’s provincial panel data. Environmental Science and Pollution Research 2023, 30(11), 31954–31976. [Google Scholar] [CrossRef]
- Ge, T.; Cai, X.; Song, X. How does renewable energy technology innovation affect the upgrading of industrial structure? The moderating effect of green finance. Renewable Energy 2022, 197, 1106–1114. [Google Scholar] [CrossRef]
- Wang, Y.; Zhao, N.; Lei, X.; Long, R. Green finance innovation and regional green development. Sustainability 2021, 13(15), 8230. [Google Scholar] [CrossRef]
- Kong, T.; Sun, R.; Sun, G.; Song, Y. Effects of digital finance on green innovation considering information asymmetry: An empirical study based on Chinese listed firms. Emerging Markets Finance and Trade 2022, 58(15), 4399–4411. [Google Scholar] [CrossRef]
- Du, M.; Zhang, R.; Chai, S.; Li, Q.; Sun, R.; Chu, W. Can green finance policies stimulate technological innovation and financial performance? Evidence from Chinese listed green enterprises. Sustainability 2022, 14(15), 9287. [Google Scholar] [CrossRef]
- Irfan, M.; Razzaq, A.; Sharif, A.; Yang, X. Influence mechanism between green finance and green innovation: exploring regional policy intervention effects in China. Technological Forecasting and Social Change 2022, 182, 121882. [Google Scholar] [CrossRef]
- Wang, X.; Wang, Q. Research on the impact of green finance on the upgrading of China’s regional industrial structure from the perspective of sustainable development. Resources Policy 2021, 74, 102436. [Google Scholar] [CrossRef]
- Lee, C. C.; Wang, C. S.; He, Z.; Xing, W. W.; Wang, K. How does green finance affect energy efficiency? The role of green technology innovation and energy structure. Renewable Energy 2023, 219, 119417. [Google Scholar] [CrossRef]
- Sharif, A.; Saqib, N.; Dong, K.; Khan, S. A. R. Nexus between green technology innovation, green financing, and CO2 emissions in the G7 countries: the moderating role of social globalisation. Sustainable Development 2022, 30(6), 1934–1946. [Google Scholar] [CrossRef]
- Sethi, L.; Behera, B.; Sethi, N. Do green finance, green technology innovation, and institutional quality help achieve environmental sustainability? Evidence from the developing economies. Sustainable Development 2024, 32(3), 2709–2723. [Google Scholar] [CrossRef]
- Wang, Q.; Zhang, F. Does increasing investment in research and development promote economic growth decoupling from carbon emission growth? An empirical analysis of BRICS countries. Journal of Cleaner Production 2020, 252, 119853. [Google Scholar] [CrossRef]
- Shan, Y.; Huang, Q.; Guan, D.; Hubacek, K. China CO2 emission accounts 2016–2017. Scientific data 2020, 7(1), 54. [Google Scholar] [CrossRef]
- Feng Zixuan, Jiang Guoliang, Xu Yi, Song Jian & Zhao Fang. (2025). Spatial and temporal evolution characteristics and influencing factors of the coupling and coordination of green finance and new energy development. Geographical Science, 45(07), 1536-1548. [CrossRef]
- Zhao Tao, Zhang Zhi & Liang Shangkun. (2020). Digital Economy, Entrepreneurial Activity and Highquality Development -Empirical Evidence from China. Managing the World, 36(10), 65- 76. [CrossRef]
- Yi, M.; Liu, Y.; Sheng, M. S.; Wen, L. Effects of digital economy on carbon emission reduction: New evidence from China. Energy Policy 2022, 171, 113271. [Google Scholar] [CrossRef]
- Liu, W.; Zhu, P. The impact of green finance on the intensity and efficiency of carbon emissions: the moderating effect of the digital economy. Frontiers in Environmental Science 2024, 12, 1362932. [Google Scholar] [CrossRef]
- Wu, X. Q.; Wen, H. X.; Nie, P. Y.; Gao, J. X. Utilizing green finance to promote low-carbon transition of Chinese cities: insights from technological innovation and industrial structure adjustment. Scientific Reports 2024, 14(1), 16844. [Google Scholar] [CrossRef] [PubMed]
- Li Jing, Chen Shu, Wan Guanghua & Fu Chen Mei. (2014). Spatial correlation of regional economic growth in China and its explanation-based on network analysis method. Economic Research, 49(11), 4-16.
- Yu Yongjun, Lu Yuqi. (2005). Study on the Centrality of Provincial Capital Cities. Economic Geography, (03), 352-357. [CrossRef]
- Wei Hai-hai, Zhang Pei-kang & Du Yuhong. (2020). How robots reshape the urban labor market: from the perspective of migration tasks. Economic trends, (10), 92-109.
- Li Xiangyang, Chloe Wang & Zhang Yuxin. (2024). Temporal and spatial evolution pattern and its influencing factors of the development of new quality productivity in the Yangtze River Economic Belt. Resources and Environment in the Yangtze River Basin, 33(05), 909-923.
- The State Council. (2013). National Sustainable Development Plan for Resource-based Cities (2013-2020). https://www.gov.cn/zwgk/2013-12/03/content_2540070.htm.
Figure 1.
Graphical Abstract.
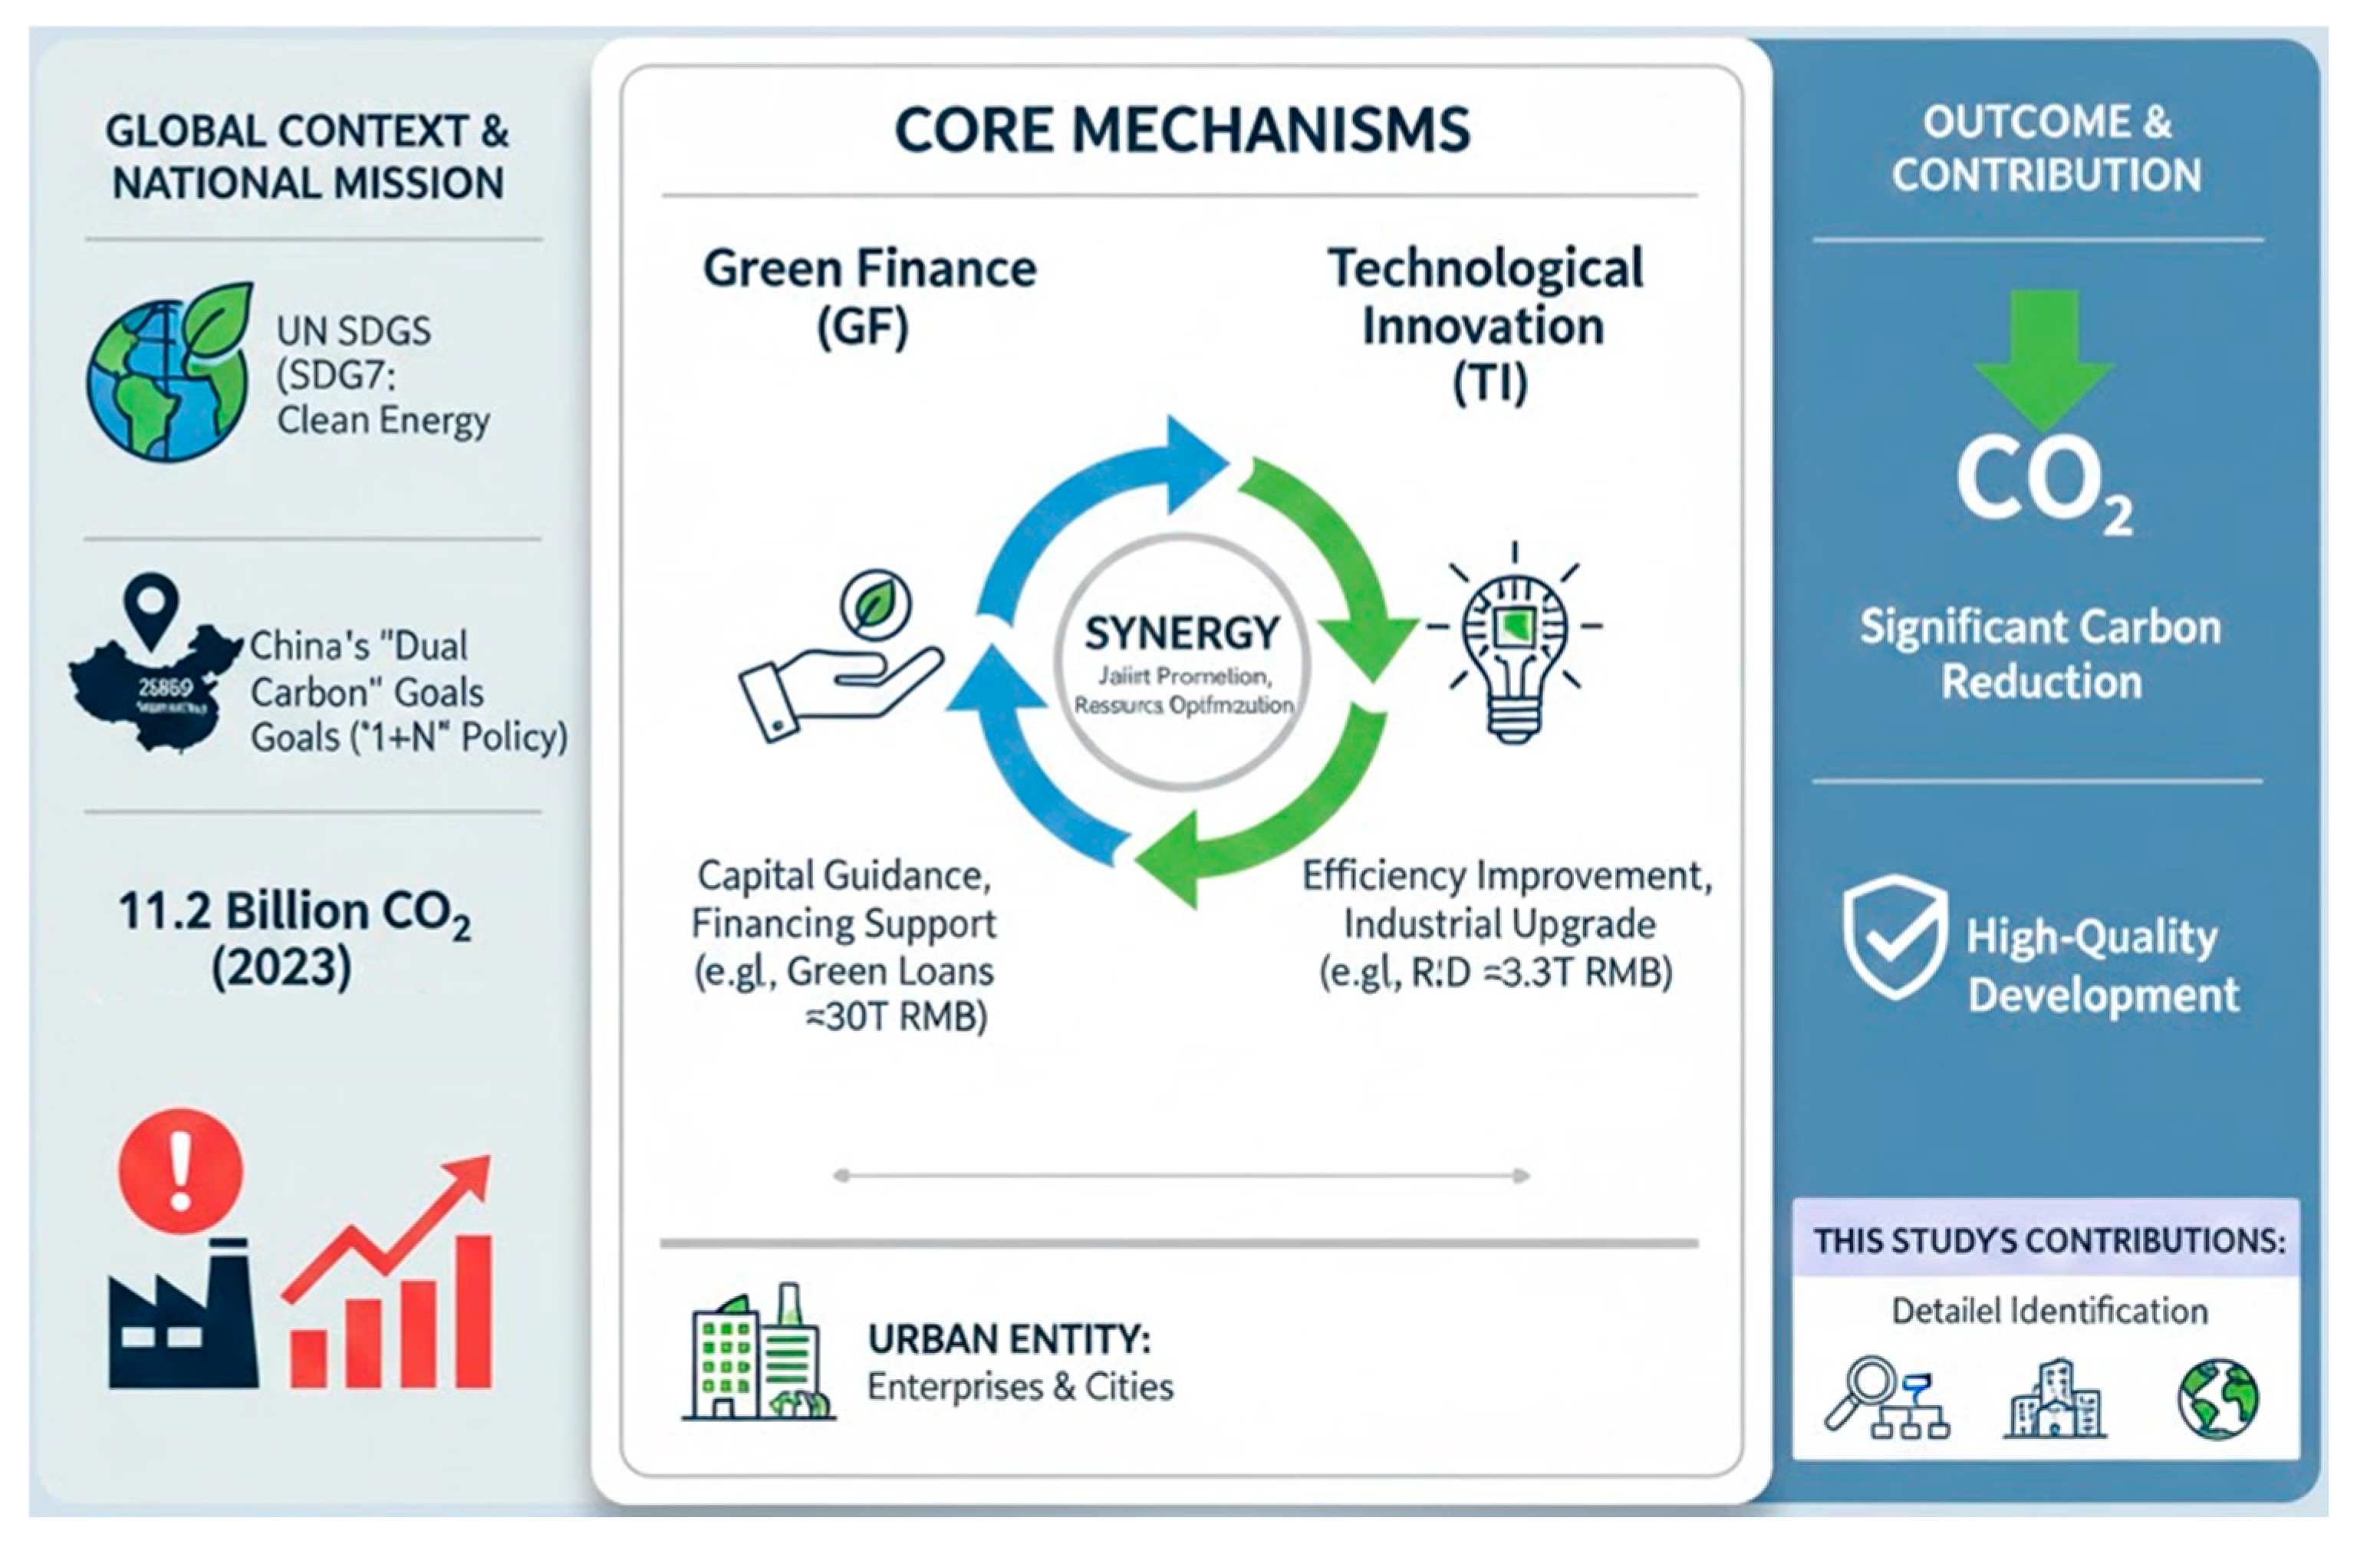
Figure 2.
Conduction mechanism diagram.
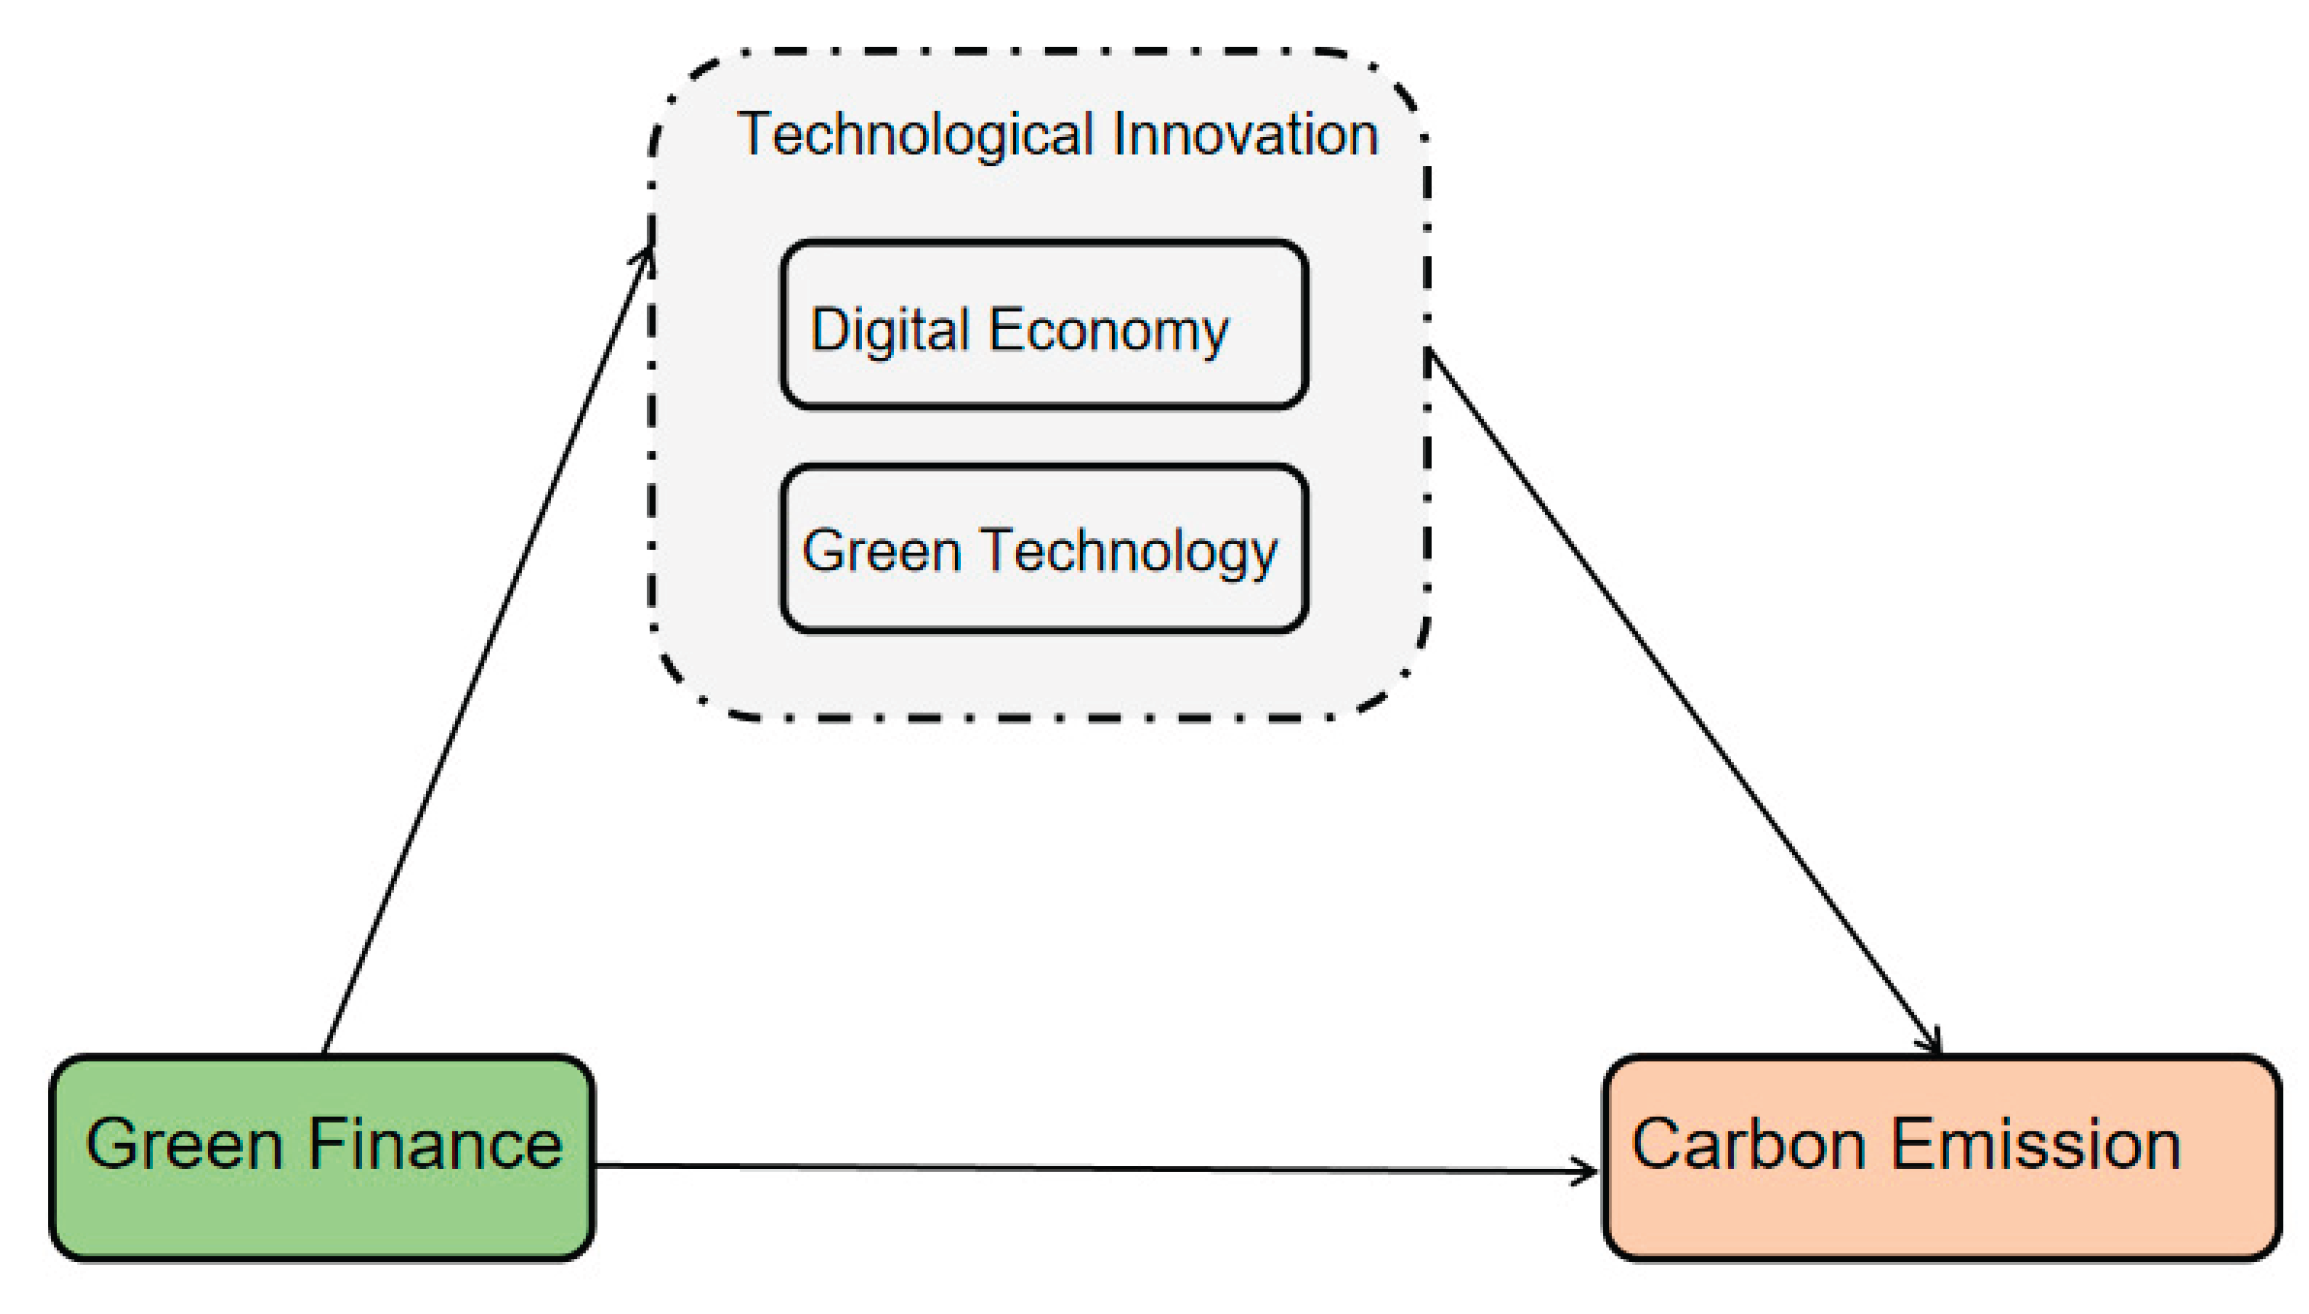
Table 2.
Index Construction.
| Primary index | Secondary index | Calculation method |
| Green finance | Green credit | Total credit of environmental protection projects in this province/total credit of this province. |
| Green investment | Investment in environmental pollution control /GDP | |
| Green insurance | Environmental pollution liability insurance income/total premium income | |
| Green bond | Total amount of green bonds issued/total amount of all bonds issued | |
| Green support | Financial environmental protection expenditure/financial budget expenditure | |
| Green fund | Total market value of green funds/total market value of all funds | |
| Green rights and interests | Total amount of carbon trading, energy use right trading, emission right trading/equity market trading. |
Table 4.
Benchmark Regression Results.
| Variable | CO2 | CO2 |
| (1) | (2) | |
| Cons | 5.943*** (50.536) |
6.289*** (58.166) |
| GF | -0.184*** (-4.366) |
|
| Dig | -0.108*** (-3.580) |
|
| Region and time fixed | YES | YES |
| Control variable | YES | YES |
| R2 | 0.315 | 0.125 |
| N | 6653 | 6648 |
| Test | F(7,6342)=35.643,p=0.000*** | F(5,6343)=31.974,p=0.000*** |
*p<0.05 **p<0.01 ***p<0.001 The value of t is in brackets, the same below.
Table 5.
Logarithmic regression.
| Variable | CO2 |
| Cons | 6.268*** (56.338) |
| lgGF | -0.471*** (-3.468) |
| Control variable | YES |
| Region and time fixed | YES |
| R2 | 0.151 |
| N | 6648 |
| Test | F(7,6341)=24.122,p=0.000*** |
Table 6.
Regression of Replacing Explained Variables.
| Variable | SO2 |
| Cons | 6.614*** (36.517) |
| GF | -0.403*** (-6.068) |
| Control variable | YES |
| Region and time fixed | YES |
| R2 | 0.107 |
| N | 5092 |
| Test | F(11,5060)=71.347,p=0.000*** |
Table 7.
Excluding sudden point regression.
| Variable | CO2 |
| Cons | 6.171*** (49.183) |
| GF | -0.163*** (-3.457) |
| Control variable | YES |
| Region and time fixed | YES |
| R2 | 0.152 |
| N | 5817 |
| Test | F(8,5512)=18.944,p=0.000*** |
Table 9.
First-order Regression Results of Green Finance Lagging.
| Variable | GF (1) |
CO2 (2) |
|---|---|---|
| Cons | -0.338** (-2.716) |
-30.607*** (-18.441) |
| GF | / | -0.285*** (-5.174) |
| LagGF | 0.989*** (240.924) |
/ |
| N | 6371 | 6371 |
| Region and time fixed | YES | YES |
| R2 | 0.941 | 0.330 |
| Test | F(5,6365)=20248.786,p=0.000*** | χ2(5)=3137.772,p=0.000*** |
Table 10.
Spherical Distance from City to Hangzhou.
| variable | GF (1) |
CO2 (2) |
|---|---|---|
| Cons | -18.449*** (-33.539) |
-65.918*** (-4.196) |
| GF | / | -2.221** (-2.705) |
| Distance | -0.022*** (-5.095) |
/ |
| N | 6348 | 6348 |
| R2 | 0.394 | 0.316 |
| Test | F(10,6337)=411.876,p=0.000*** | χ2(10)=4581.182,p=0.000*** |
Table 11.
Intermediary Effect: Advanced Industrial Structure.
| variable | CO2 (1) |
AIS (2) |
CO2 (3) |
|---|---|---|---|
| Cons | -31.701*** (-14.216) |
-24.163*** (-9.016) |
-35.838*** (-16.322) |
| GF | -0.471*** (-9.786) |
0.797*** (13.775) |
-0.335*** (-7.004) |
| AIS | -0.171*** (-17.128) |
||
| Region and time fixed | YES | YES | YES |
| Control variable | YES | YES | YES |
| N | 6648 | 6648 | 6648 |
| R2 | 0.449 | 0.335 | 0.472 |
| Test | F(10,6637)=541.177, p=0.000*** | F(10,6637)=333.737, p=0.000*** | F(11,6636)=540.320, p=0.000*** |
*p<0.05 **p<0.01 ***p<0.001 The value of t is in brackets.
Table 12.
Intermediary Effect: Future Industrial Level.
| Variable | CO2 (1) |
FIL (2) |
CO2 (3) |
|---|---|---|---|
| Cons | 4.994*** (49.598) |
-2.168*** (-14.594) |
5.146*** (50.112) |
| GF | -0.257*** (-5.327) |
0.374*** (5.246) |
-0.283*** (-5.879) |
| FIL | 0.070*** (6.705) |
||
| Region and time fixed | YES | YES | YES |
| Control variable | YES | YES | YES |
| N | 4210 | 4210 | 4210 |
| R2 | 0.401 | 0.315 | 0.408 |
| Test | F(8,4201)=351.902, p=0.000*** | F(8,4201)=241.625, p=0.000*** | F(9,4200)=321.071, p=0.000*** |
*p<0.05 **p<0.01 ***p<0.001 The value of t is in brackets.
Table 13.
Intermediary Effect: Green Invention.
| variable | CO2 (1) |
GI (2) |
CO2 (3) |
|---|---|---|---|
| Cons | -28.993*** (-14.064) |
-204.857*** (-8.249) |
-30.004*** (-14.501) |
| GF | -0.198*** (-4.285) |
2.053*** (3.688) |
-0.188*** (-4.068) |
| GI | -0.005*** (-4.721) |
||
| Region and time fixed | YES | YES | YES |
| Control variable | YES | YES | YES |
| N | 6288 | 6288 | 6288 |
| R2 | 0.476 | 0.630 | 0.478 |
| Test | F(11,6276)=518.302, p=0.000*** | F(11,6276)=972.366, p=0.000*** | F(12,6275)=478.579, p=0.000*** |
*p<0.05 **p<0.01 ***p<0.001 The value of t is in brackets.
Table 14.
Interaction Effect Regression.
| variable | CO2 |
| Cons | 5.996*** (44.896) |
| GF*Dig | -0.339*** (-4.726) |
| Control variable | YES |
| R2 | 0.222 |
| N | 5910 |
| Test | F(7,5631)=24.784,p=0.000*** |
Table 15.
Group Regression: Urban Agglomeration.
| Variable | entirety | Beijing-Tianjin-Hebei Urban Agglomeration | Yangtze river delta urban agglomeration | triangle of central china |
|---|---|---|---|---|
| Cons | 49.023*** (7.762) |
131.236*** (3.351) |
78.833*** (9.765) |
-53.214** (-2.621) |
| GF | -0.488** (-2.736) |
1.496*** (3.459) |
-1.308*** (-4.133) |
-1.099* (-2.205) |
| Region and time fixed | YES | YES | YES | YES |
| Control variable | YES | YES | YES | YES |
| N | 2232 | 264 | 960 | 1008 |
| R2 | 0.190 | 0.236 | 0.383 | 0.108 |
| Test | F(4,2227)=130.367, p=0.000*** | F(4,259)=20.027, p=0.000*** | F(4,955)=148.226, p=0.000*** | F(4,1003)=30.301, p=0.000*** |
*p<0.05 **p<0.01 ***p<0.001.
Table 16.
Group Regression: Digital Economy.
| Variable | entirety | LD | HD |
| Cons | -45.541*** (-14.114) |
-22.107*** (-3.732) |
-11.511* (-2.147) |
| GF | -0.250*** (-3.584) |
0.080 (0.611) |
-0.410*** (-5.491) |
| Region and time fixed | YES | YES | YES |
| Control variable | YES | YES | YES |
| N | 2974 | 1174 | 1800 |
| R2 | 0.514 | 0.451 | 0.409 |
| Test | F(9,2964)=348.161, p=0.000*** | F(9,1164)=106.240, p=0.000*** | F(9,1790)=137.381, p=0.000*** |
*p<0.05 **p<0.01 ***p<0.001.
Table 17.
Group Regression: Resource Endowment.
| Variable | Entirety | RC | NRC |
| Cons | -5.522** (-3.111) |
-28.029*** (-9.986) |
9.154*** (4.154) |
| GF | -0.374*** (-7.560) |
-1.055*** (-13.697) |
0.084 (1.362) |
| Control variable | YES | YES | YES |
| N | 6648 | 2472 | 4176 |
| R2 | 0.433 | 0.385 | 0.504 |
| Test | F(9,6638)=563.387, p=0.000*** | F(9,2462)=171.530, p=0.000*** | F(9,4166)=470.776, p=0.000*** |
*p<0.05 **p<0.01 ***p<0.001.
Table 18.
Quantile Regression Results.
| Variable | 0.100 | 0.200 | 0.300 | 0.700 | 0.800 | 0.900 |
| Cons | -16.625*** (-5.460) |
-19.419*** (-6.960) |
-15.551*** (-6.298) |
-19.157*** (-10.105) |
-20.598*** (-9.477) |
-20.533*** (-9.711) |
| GF | -0.273*** (-3.433) |
-0.255*** (-3.323) |
-0.209** (-3.043) |
-0.457*** (-7.689) |
-0.426*** (-5.990) |
-0.339*** (-4.385) |
| Control variable | YES | YES | YES | YES | YES | YES |
| N | 6648 | 6648 | 6648 | 6648 | 6648 | 6648 |
| R2 | 0.283 | 0.259 | 0.237 | 0.214 | 0.205 | 0.200 |
*p<0.05 **p<0.01 ***p<0.001.
Disclaimer/Publisher’s Note: The statements, opinions and data contained in all publications are solely those of the individual author(s) and contributor(s) and not of MDPI and/or the editor(s). MDPI and/or the editor(s) disclaim responsibility for any injury to people or property resulting from any ideas, methods, instructions or products referred to in the content. |
© 2025 by the authors. Licensee MDPI, Basel, Switzerland. This article is an open access article distributed under the terms and conditions of the Creative Commons Attribution (CC BY) license (http://creativecommons.org/licenses/by/4.0/).
Copyright: This open access article is published under a Creative Commons CC BY 4.0 license, which permit the free download, distribution, and reuse, provided that the author and preprint are cited in any reuse.


