
Submitted:
02 July 2025
Posted:
25 July 2025
You are already at the latest version
Abstract
The SDG goal of the United Nations has defined the concept of green sustainable development. At the same time, with the rapid development of China's economy, the concept of green new development is also an important guiding ideology for economic development. Under this background, how to explore the development mode of environmental green and economic growth has become an important issue in society, and exploring the impact of digital financial development on green economic efficiency has important practical significance for economic green transformation and low-carbon development.This paper selects the panel data of 271 prefecture-level cities in China from 2011 to 2020 as the research sample, and uses the super-efficiency SBM model with unexpected output to measure the green economic efficiency of each city. Analyze the temporal and spatial evolution trend of green economic efficiency and digital finance and reveal the development trend and regional differences. On this basis, the differences between different regions, different levels of digital finance development and different resource-based cities are discussed through group regression. Furthermore, the spatial Dobbin model is constructed to analyze the spatial spillover effect of green economic efficiency driven by digital finance, and the driving reasons are further analyzed by decomposing the green economic efficiency. This paper provides policy basis for green sustainable development.
Keywords:
green economic efficiency
; digital finance
; spatial dobbin model
; super-efficient sbm model
; grouping regression
1. Introduction
At present, China’s economy is developing rapidly. From 2013 to 2024, China’s GDP increased from 59.3 trillion yuan to 134.9 trillion yuan, with an average annual growth rate of more than 5%, making it the second largest economy in the world (https://www.gov.cn/lianbo/bumen/202501/content_6999754.htm(Chinese government website), https://data.worldbank.org.cn/indicator/NY.GDP.MKTP.PP.CD(World Bank official website)). However, behind the rapid development of economy and trade, energy consumption has increased sharply, and environmental pollution has become more and more serious. In 2020, among the top 20 cities in China’s economic GDP, only Shenzhen ranks in the top 20 in urban ambient air quality. Therefore, how to explore the development model of common prosperity of environmental green and economic growth has become an important issue in the current society. The Tenth Five-Year Plan takes the new development concept of innovation, coordination, green, openness and sharing as an important guiding ideology, and reveals that it is necessary to speed up digital development and accelerate the green transformation of development methods, and vigorously develop green economy and green finance.
In recent years, with the advent of the era of big data, digital finance, as a new service and new format that integrates digital technologies such as big data and artificial intelligence with the financial industry and is conducive to the green transformation of the industry, has been improving with the support of policies. The average value of digital inclusive finance has increased from 34.28 in 2011 to 326.44 in 2020, an increase of nearly 9.5 times, and the scale of digital financial services such as mobile payment, peer-to-peer lending and internet insurance has been expanding. The number of users continues to grow, which constantly promotes consumption upgrading and industrial upgrading. In the ranking of digital finance in 2020, among the top 20 cities, Shenzhen, Xiamen, Zhuhai and Fuzhou rank among the top 20 cities in urban environmental air quality. The development of digital finance has really injected new impetus into the green development of the economy. In 2024, the Guiding Opinions on Further Strengthening Financial Support for Green and Low-carbon Development issued by seven departments emphasized the important role of finance in supporting green and low-carbon development and proposed to focus on promoting high-quality development and further strengthening financial support for green and low-carbon development. https://www.gov.cn/lianbo/bumen/202404/content_6944486.htm(Chinese government website). The “Three-year Action Plan for Data Elements ×” (2024-2026) issued by the 17th department in 2023 also pointed out that digital finance, as a technology-driven financial innovation, should support data fusion applications in different fields of financial institutions, thus promoting the development of digital finance and indirectly improving the efficiency of green economy. https://www.gov.cn/lianbo/bumen/202401/content_6924380.htm(Chinese government website). Promoting green economic growth by financial means has become an important development direction of China’s economy and industry. Then, on the basis of leading the world in all aspects, can China’s digital finance ensure the stable and upward development of green economy efficiency? How does the spatial spillover effect of digital finance affect the efficiency of green economy? Will be the focus of this paper.
2. Literature Review
2.1. The Concept of Digital Finance
From internet finance to financial technology, and now to digital finance, people have a deeper understanding of the process of integration and innovation of digital technology and financial services. Scholars generally believe that digital finance is the financial form after the internet, and the concept of digital finance has not been unified. Some scholars believe that digital finance refers to the mode that Internet companies and traditional financial institutions use digital technology to realize financing, payment, investment and other new financial services.[1,2,3,4,5]. Some people also think that digital finance is a new financial field, and define it as traditional financial institutions and technology companies providing financial services by using digital technology, in which digital technology mainly includes hot ICT technologies such as big data, cloud computing and Internet of Things.[6,7,8]. Digital financial formats are divided into five categories: third-party payment, network financing, network investment, digital assets and digital currency, and other digital financial innovations.[9,10,11,12]Changing the financial operation mode, risk management methods and cost control means through the application of digital technology is the key to the high-quality development of finance.[13,14,15,16].
2.2. The Concept of Green Economic Efficiency
In 1989, David Pearce, a pioneer in the field of environmental economics in Britain, put forward the conceptual framework of “green economy” for the first time in his Blueprint for a Green Economy submitted to the British government, marking the formal inclusion of environmental issues in mainstream economic analysis.[17]. With the deepening of the global sustainable development agenda, especially in the face of the realistic pressure of climate change and ecological crisis, the traditional economic efficiency evaluation system has been questioned because it ignores environmental externalities. Under this background, “green economic efficiency” came into being as an innovative evaluation tool.[18,19,20,21]. This index breaks through the limitation of traditional total factor productivity calculation. By constructing multi-dimensional environmental cost accounts including waste gas emission, industrial wastewater treatment, solid waste disposal and carbon emission intensity, natural resource consumption and ecological damage costs are internalized in the economic efficiency accounting system, thus forming a compound evaluation standard that can comprehensively reflect the quality of economic output and environmental performance.
The connotation interpretation of green economic efficiency presents multi-dimensional characteristics: the core consensus is that its essence is an upgraded version of economic efficiency under the constraints of environmental regulations, which requires not only the scarcity constraints of ecological factors such as energy and water resources at the input end of resources, but also the value deduction of pollutant emissions at the output end.[22,23,24]. Some scholars further point out that the index transforms negative environmental externalities into measurable production costs through the shadow price method, and its essence is to build an objective optimization model of economy and environment.[25,26]. On the level of regional practice, the spatial pattern of China presents a distinct gradient difference: the eastern coastal areas continue to lead in the efficiency of green economy by virtue of technological advantages and the first-Mover effect of industrial upgrading; As traditional industrial bases, the six provinces in central China are faced with the dual constraints of heavy industrial structure and lagging environmental protection technology, and their efficiency values fall into a trough; Although the western region has obtained policy inclination under the ecological compensation mechanism, it is still weak in overall efficiency improvement due to the shortcomings of infrastructure and talent technology gap. It is worth noting that the study of urban scale reveals the nonlinear correlation characteristics. When the per capita GDP crosses a certain threshold, the investment in environmental governance and the return on technological innovation form a positive feedback, which promotes the green economic efficiency to show a “U-shaped” growth. This inflection point effect is particularly significant in the central urban agglomeration, reflecting the time and space mismatch between the painful period of industrial transformation and the release period of ecological dividends.[27,28,29,30,31,32]. At present, China is exploring the governance path to break the imbalance of regional development through institutional arrangements such as the construction of carbon emission trading market, green financial innovation and ecological product value realization mechanism, so as to provide China’s plan for the global green economy transformation.[33,34,35].
2.3. The Development of Green Economic Efficiency Measurement Methods
At present, the measurement methods of green economic efficiency mainly include the construction of index system and the selection of measurement model. In the construction of index system, the key lies in the two dimensions of input and output; When choosing the measurement model, the entropy weight method is currently covered.[36,37,38]Projection pursuit evaluation model [39,40,41], data envelopment analysis [42,43,44]And other methods. In the process of determining indicators, labor, resources and energy are usually regarded as input indicators to measure the cost of economic development; Economic benefits as expected output indicators; Environmental factors may be regarded as input indicators to evaluate the consumption of environmental resources by economic activities, or as unexpected output indicators to reflect the negative impact of economic activities on the environment. In the selection of measurement model, the technical route of multi-method cross-validation is presented. With the advantage of objective weighting, entropy weight method shows excellent performance in processing multi-source heterogeneous data. It determines the index weight through the information entropy value, effectively avoids subjective judgment deviation, and identifies the significant influence of industrial solid waste treatment efficiency on regional efficiency in the green assessment of the Yangtze River Economic Belt. Projection pursuit evaluation model is good at high-dimensional data processing, and the internal structure of data is mined by constructing projection index function. Data Envelopment Analysis (DEA) and its derivative models (such as SBM and VRSDEA) constitute the mainstream of measurement methodology, in which SBM model breaks through the radial assumption of traditional DEA and directly deals with unexpected output by introducing slack variables, which can depict the dynamic migration trajectory of urban efficiency frontier. In particular, the innovative application of coupling analysis method, through nonlinear coupling of the measured results of ecological efficiency and economic efficiency, constructs a green economic efficiency index reflecting the system synergy. This method accurately captures the leverage effect of innovation input on coupling efficiency in Guangdong-Hong Kong-Macao Greater Bay Area empirical study. In the specific measurement practice, methodological innovation presents three major trends: First, the deepening of spatio-temporal heterogeneity analysis, by introducing geographically weighted regression (GWR) and other technologies.[45,46], revealing the spatial spillover effect and time lag characteristics of green efficiency; The second is the construction of dynamic evaluation system, using Malmquist-Luenberger index to decompose the change of total factor productivity.[47]In the study of the Yangtze River Economic Belt, it is found that technological progress is the leading factor to improve efficiency; The third is multi-scenario simulation and prediction, which uses system dynamics model to simulate the efficiency evolution path under the constraint of carbon neutrality target, and provides scientific basis for policy making.[48]. Some studies began to explore the application of digital twin technology in calculation. By constructing urban digital mirror image, real-time monitoring of resource flow and dynamic evaluation of efficiency are realized. This technology integration marks that the efficiency calculation of green economy is moving towards a new stage of intelligence.[49].
2.4. The Impact of Digital Finance on the Efficiency of Green Economy
The influence of digital finance on the efficiency of green economy in cities is restricted by urban resource endowments such as economic development level, Internet penetration rate and traditional financial development level. Only after these factors cross the threshold value can digital finance play a positive role. The total index of digital finance can improve the efficiency of green economy, and the level of urbanization has a moderating effect on the efficiency of digital finance and green economy. Some studies believe that there is a “U” curve relationship between economic agglomeration and green economic efficiency, which is “first decreasing-then increasing”.[50,51]. Some studies have also found that the development of digital finance will increase the gap between groups of green development and aggravate the inequality of green development.[52,53]. More research shows that financial technology can improve the efficiency of green economy, and the influence of financial technology on the efficiency of green economy has a chain intermediary effect of “financial technology-technological innovation-optimizing industrial structure”. At the same time, the influence of financial technology on the efficiency of green economy has regional heterogeneity, and the digital economy has a positive spatial spillover effect on the efficiency of green economy in neighboring cities [52,53,55,56].
2.5. Research Review
By combing the existing research, we can find that the attention of green economic efficiency and digital finance is increasing year by year, and green economic efficiency has become an important standard to measure the development level between regions. However, the existing research conclusions are quite different, and most of them use provincial panel data to analyze the efficiency of digital finance and green economy, which is inconsistent with the actual situation of uneven economic development among regions in China. Based on the above literature research, this paper aims to explore the influence of digital finance on the efficiency of green economy and its mechanism from the urban level, and open the “black box” of digital finance affecting the efficiency of green economy. In view of this, this paper makes the following improvements and innovations:
1.In terms of research methods, this paper starts with the fact that digital finance can break the time-space limitation and compress the geographical distance to radiate the economic activities between regions, and uses the spatial Dobbin model to deeply study the spatial effect of digital finance on the efficiency of green economy.
2.In the research content, most predecessors compared resource-based cities with non-resource-based cities to explore the heterogeneity of resources. This paper divides resource-based cities into four categories: growth, maturity, decline and regeneration, aiming at exploring the role of resource endowment in the mechanism of digital finance on the efficiency of green economy in more detail.
3.In the scope of research, most literatures use provincial panel data to study the interaction between digital finance and green economic efficiency, and this paper uses city-level data with richer dimensions as the research object.
3. Index System Construction, Data Selection and Model Setting.
3.1. Digital Finance Index System Construction
3.1.1. Measurement of Digital Finance
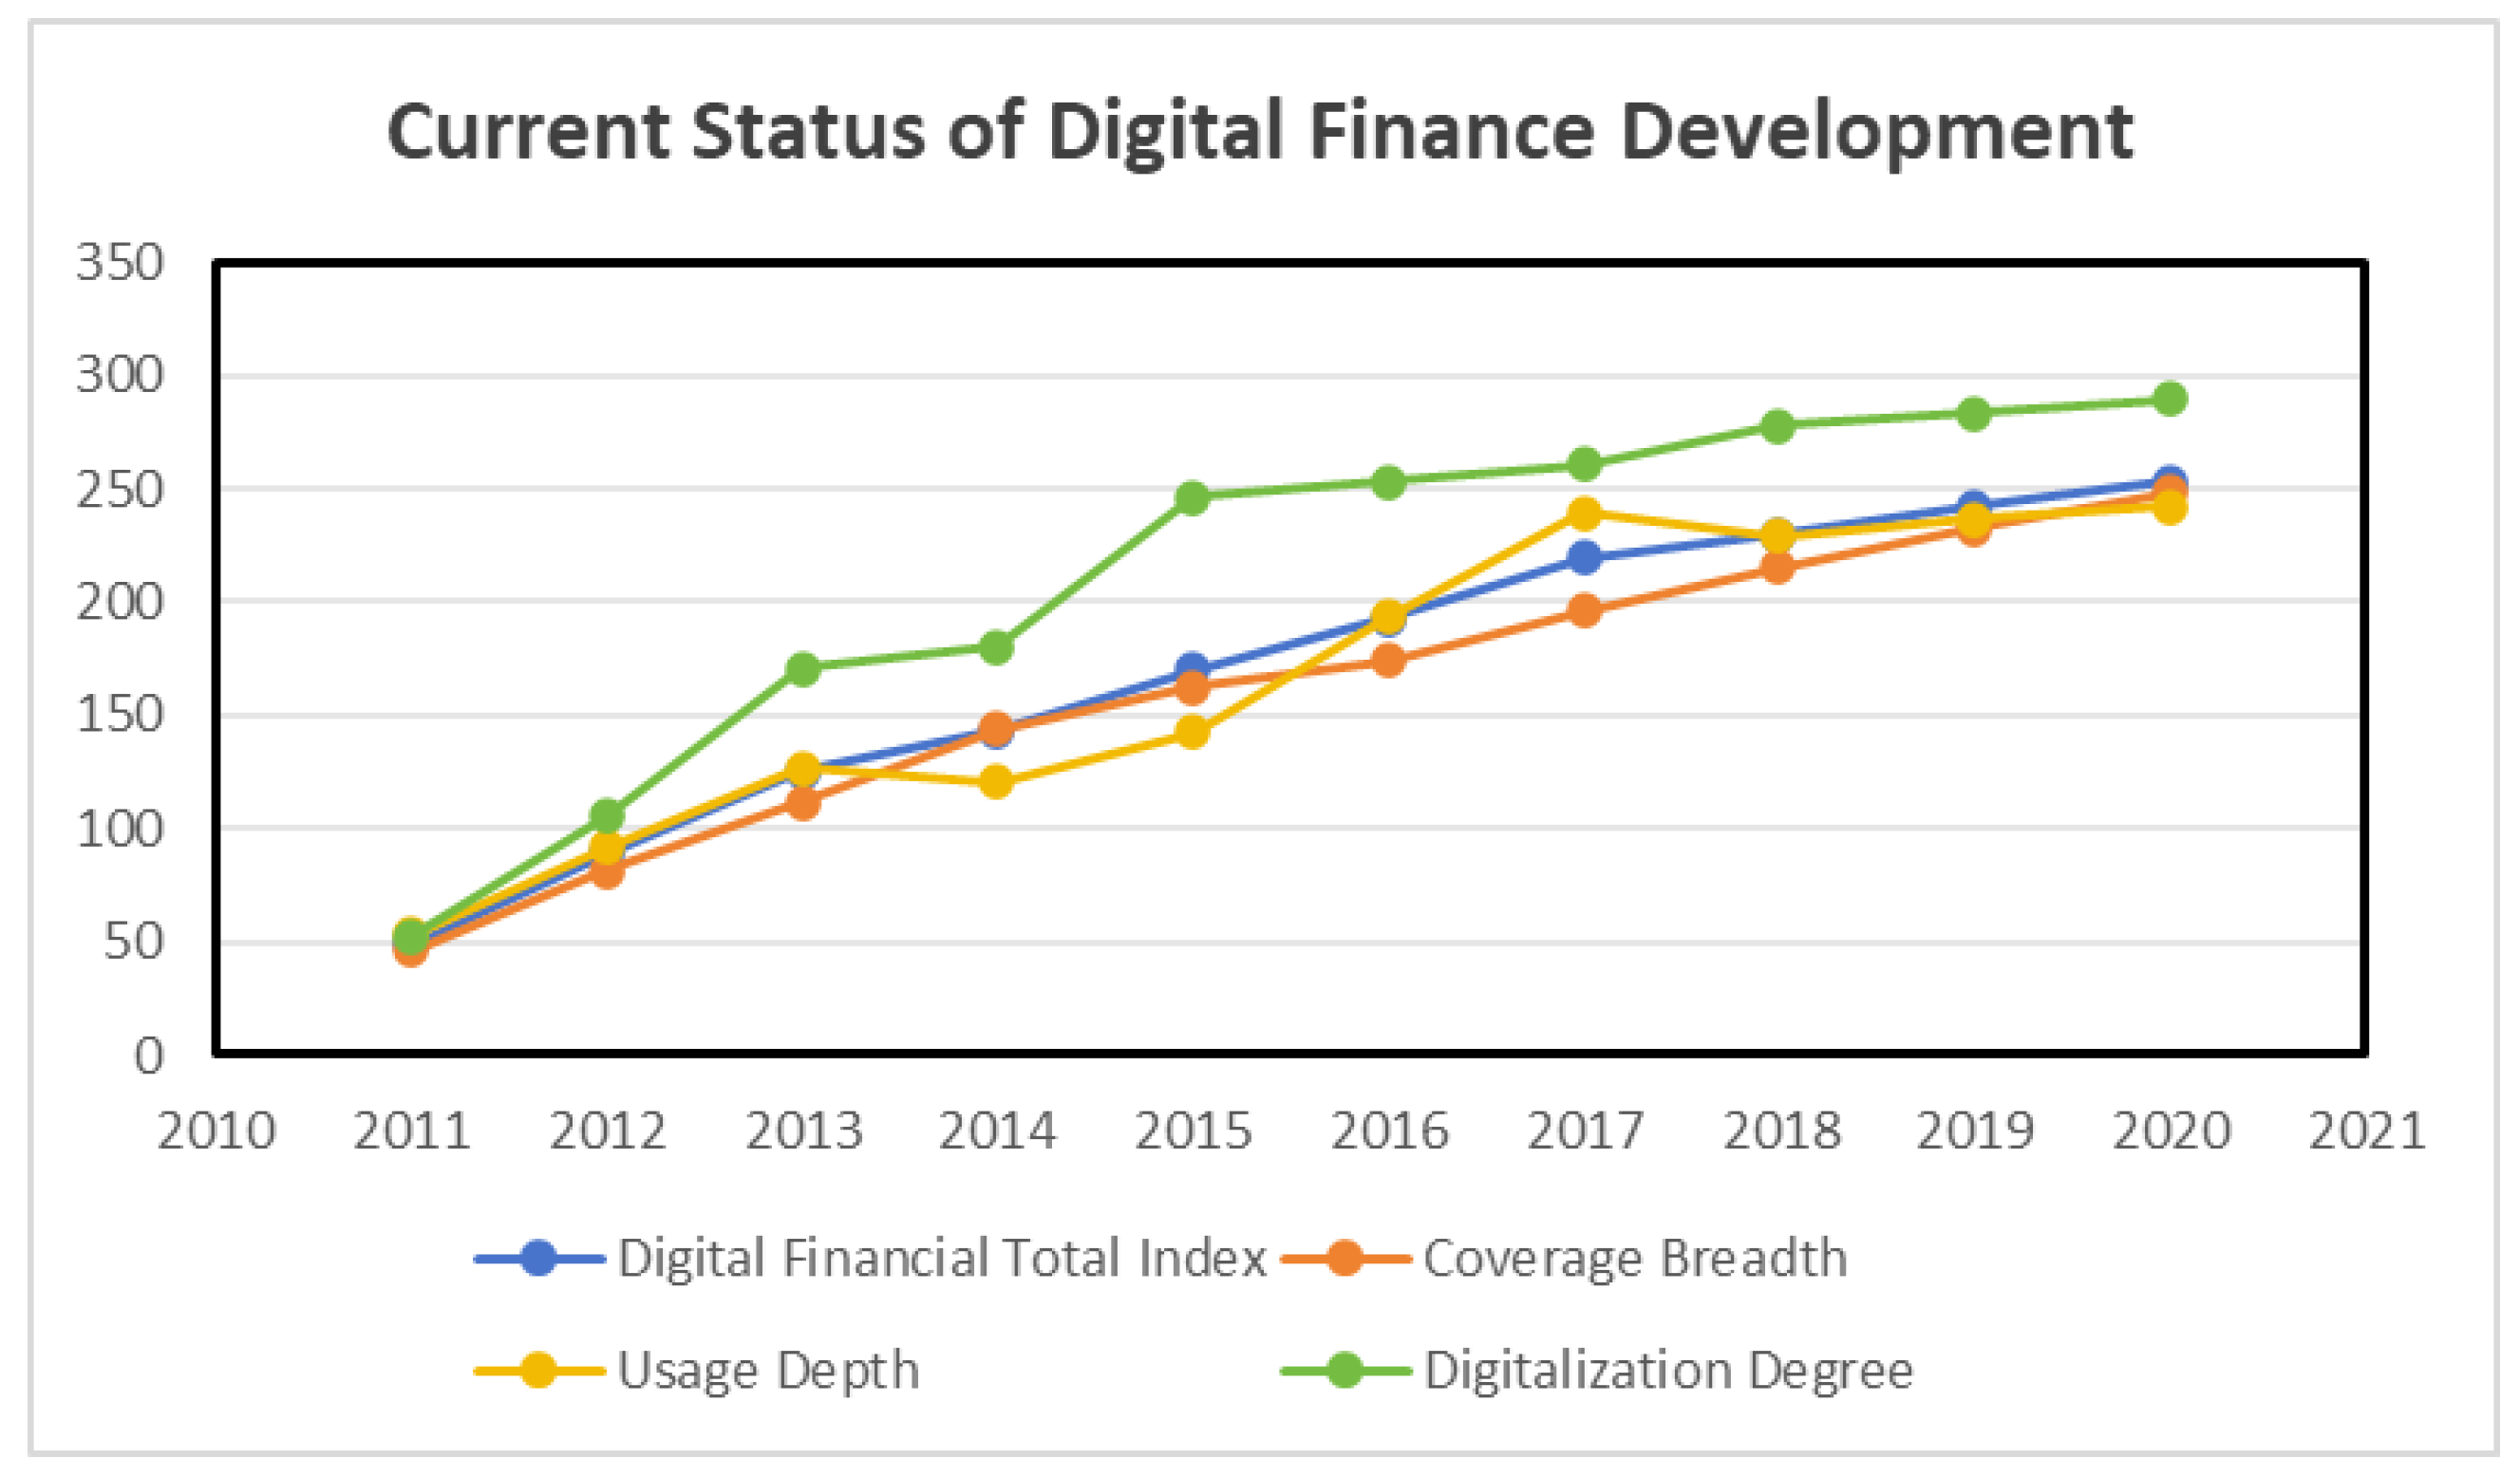
Digital finance refers to new products, new services and new formats generated by applying digital technologies such as Internet, blockchain, big data and artificial intelligence to the financial industry, and financial institutions such as banks and insurance companies apply digital technologies to process transformation and product innovation. Referring to the existing research, this paper selects the Digital Finance Index (dig) published by Digital Finance Research Center of Peking University to measure the development level of digital finance in each city, which is jointly compiled by Digital Finance Research Center of Peking University and Ant Financial Group. According to the weight vector calculated by Digital Finance Research Center of Peking University, it can be concluded that digital finance index =54% digital finance coverage +29.7% digital finance usage depth +16.3% digital finance digitization degree, which fully reflects the acceptance, availability and convenience of digital finance from three dimensions: coverage breadth, usage depth and digitization degree. The data comes from the fourth issue of Peking University Digital inclusive finance Index (2011- 2022). https://idf.pku.edu.cn/yjcg/zsbg/513800.htm(Official website of Peking University Digital Finance Research Center).
3.1.2. Development Status of Digital Finance
Describing the total index of digital finance and the average values of the three sub-dimensions during 2011-2020, we can find that the growth rate of each index is very fast during 2011-2017, but it has slowed down in recent years, and the trend of rapid convergence between different regions has also slowed down; Although the usage depth declined slightly in 2018 due to policy restrictions and other reasons, it still showed a steady upward trend in general, indicating that China Digital inclusive finance is developing well in terms of infrastructure, coverage and active users.
Figure 1.
Development trend of digital finance.
3.2. Measurement of Green Economic Efficiency
In this paper, the green economic efficiency of each city is measured by software and model. By referring to the existing literature, fixed capital stock, total energy consumption and number of employees are taken as inputs, GDP is expected output, and industrial smoke and dust emissions, wastewater emissions and sulfur dioxide emissions are unexpected outputs. See Table 1 for the index system. The index data mainly come from China Energy Statistics Yearbook, China City Statistics Yearbook, EPS China City Database and relevant statistical yearbooks of cities from 2011 to 2020.
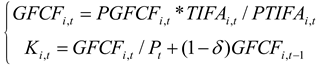
When estimating the capital stock, this paper refers to the research method of Zhang Jun (2004). Firstly, the total fixed capital formation of prefecture-level cities is estimated by multiplying the share of prefecture-level cities in the total fixed assets investment of the province (/) by the total fixed assets formation of the province (); Then, the estimated total amount of fixed capital formation is converted and added by using the perpetual inventory method to get the capital stock of the prefecture-level city in the current year. In this process, the current price index () of this province is selected as the price index of fixed assets, and the depreciation rate () is 9.6%. The specific calculation formula is as follows:
A Super-SBM model considering unexpected output is
as follows:
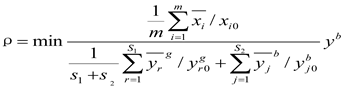
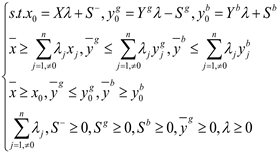
In the above formula, ρ is the efficiency value of green economy; , respectively, input, expected output and unexpected output; the number of indicators representing input, expected output and unexpected output; ,are the slack of the three, and are the weight vectors.
3.3. Selection of Other Variables and Data Sources
3.3.1. Control Variables
By referring to the articles of other relevant scholars and combining with the research needs of this paper, the selection significance of each control variable is as follows:
Foreign investment (open) and loans from financial institutions (loan) are important components of economic development, and their development is conducive to economic growth. The highway passenger volume (passv) and the number of hospital beds (sec) are used to measure the infrastructure level and social security level of the region, respectively. The agglomeration of population (popd) has two-sided effects on the green economic efficiency. On one hand, in places with a high population density, the intensity of economic activities is high and environmental pollution is relatively serious; on the other hand, it can effectively reduce the repeated construction of infrastructure, improve the efficiency of resource utilization to reduce environmental pollution, and thus affect the green economic efficiency. The proportion of college students (hum) reflects the agglomeration degree of high-level talents to measure human capital. Its improvement is conducive to the upgrading of regional industries and the increase in the utilization rate of high and new technologies, attracting more high-quality resources to form an agglomeration effect. Education expenditure (edu), science and technology expenditure (tech), fiscal expenditure (fiscal), and urbanization rate (urban) comprehensively measure the development, construction, and the level of various major expenditures of a region.
This paper finally selects 10 control variables, and the specific definitions of the variables are shown in Table 2.
3.3.2. Data Sources
Considering the availability and completeness of data, this paper selects 271 prefecture-level cities with a time span of 2011-2020 as research samples. The data mainly come from Peking University Digital inclusive finance Index (2012-2019), China City Statistical Yearbook (2001-2021), official data of local statistics bureau and statistical yearbooks of various prefecture-level cities, etc. Some missing values are linear interpolation and linear interpolation. Among them, the average value of green economic efficiency is quite different from the maximum value, indicating that the general development level is low, and the green economic efficiency in many areas needs to be developed.

Table 3.
Descriptive statistics of related variables.
| Variable type | variable | average/mean value | standard deviation | minimum value | median | maximum | Observational measurement |
| Explained variable | 0.3363 | 0.1265 | 0.1584 | 0.3115 | 1.0064 | 2710 | |
| Explanatory variable | 175.53 | 67.9769 | 35.54 | 185.685 | 296.09 | 2710 | |
| Control variable | 0.0215 | 0.026 | -0.0803 | 0.0152 | 0.1297 | 2710 | |
| 0.018 | 0.02 | 0.0009 | 0.0108 | 0.0986 | 2710 | ||
| 0.0051 | 0.002 | 0.0004 | 0.0048 | 0.0154 | 2710 | ||
| 0.0001 | 0.0001 | 0 | 0.0001 | 0.0004 | 2710 | ||
| 7.30E+03 | 1.00E+04 | 139 | 4.20E+03 | 7.10E+04 | 2710 | ||
| 0.1763 | 0.038 | 0.0908 | 0.1751 | 0.271 | 2710 | ||
| 0.0166 | 0.0152 | 0.0014 | 0.0117 | 0.0795 | 2710 | ||
| 0.5697 | 0.1443 | 0.2886 | 0.5482 | 0.9498 | 2710 | ||
| 478.0212 | 499.2681 | 23.2172 | 344.2498 | 3.40E+03 | 2710 | ||
| 0.0025 | 0.0011 | 0.0009 | 0.0022 | 0.0063 | 2710 |
4. Digital Finance and Green Economy Efficiency Model Design
4.1. OLS Regression Model Design
According to the research on the correlation between the development level of digital finance and the efficiency of green economy, this paper puts forward the following assumptions: the development level of digital finance has a positive impact on the efficiency of green economy. A preliminary model is established:
Where I represents the year (I = 1,2,10) and J represents the prefecture-level city (J = 1,2,271); It represents the efficiency of green economy, the development level of digital finance, the regression coefficient of digital finance, a group of control variables and the corresponding regression coefficient of control variables. In addition, because the factors that can’t be observed by data visualization will interfere with the relationship between the development level of digital finance and the efficiency of green economy, the time-fixed effect β, which does not change in individual dimension but changes in time dimension, and the individual fixed effect γ, which does not change in time dimension but changes in individual dimension, can effectively reduce the errors caused by related factors. Finally, ε is set as other interference terms.In order to make the panel data more stable, reduce collinearity and heteroscedasticity, and thus better meet the OLS regression model, this paper chooses to carry out logarithmic processing on the data of each variable and adjust the model to:
4.2. Digital Finance’s Spatial Dobbin Model Design for Green Economic Efficiency
① Spatial autocorrelation test
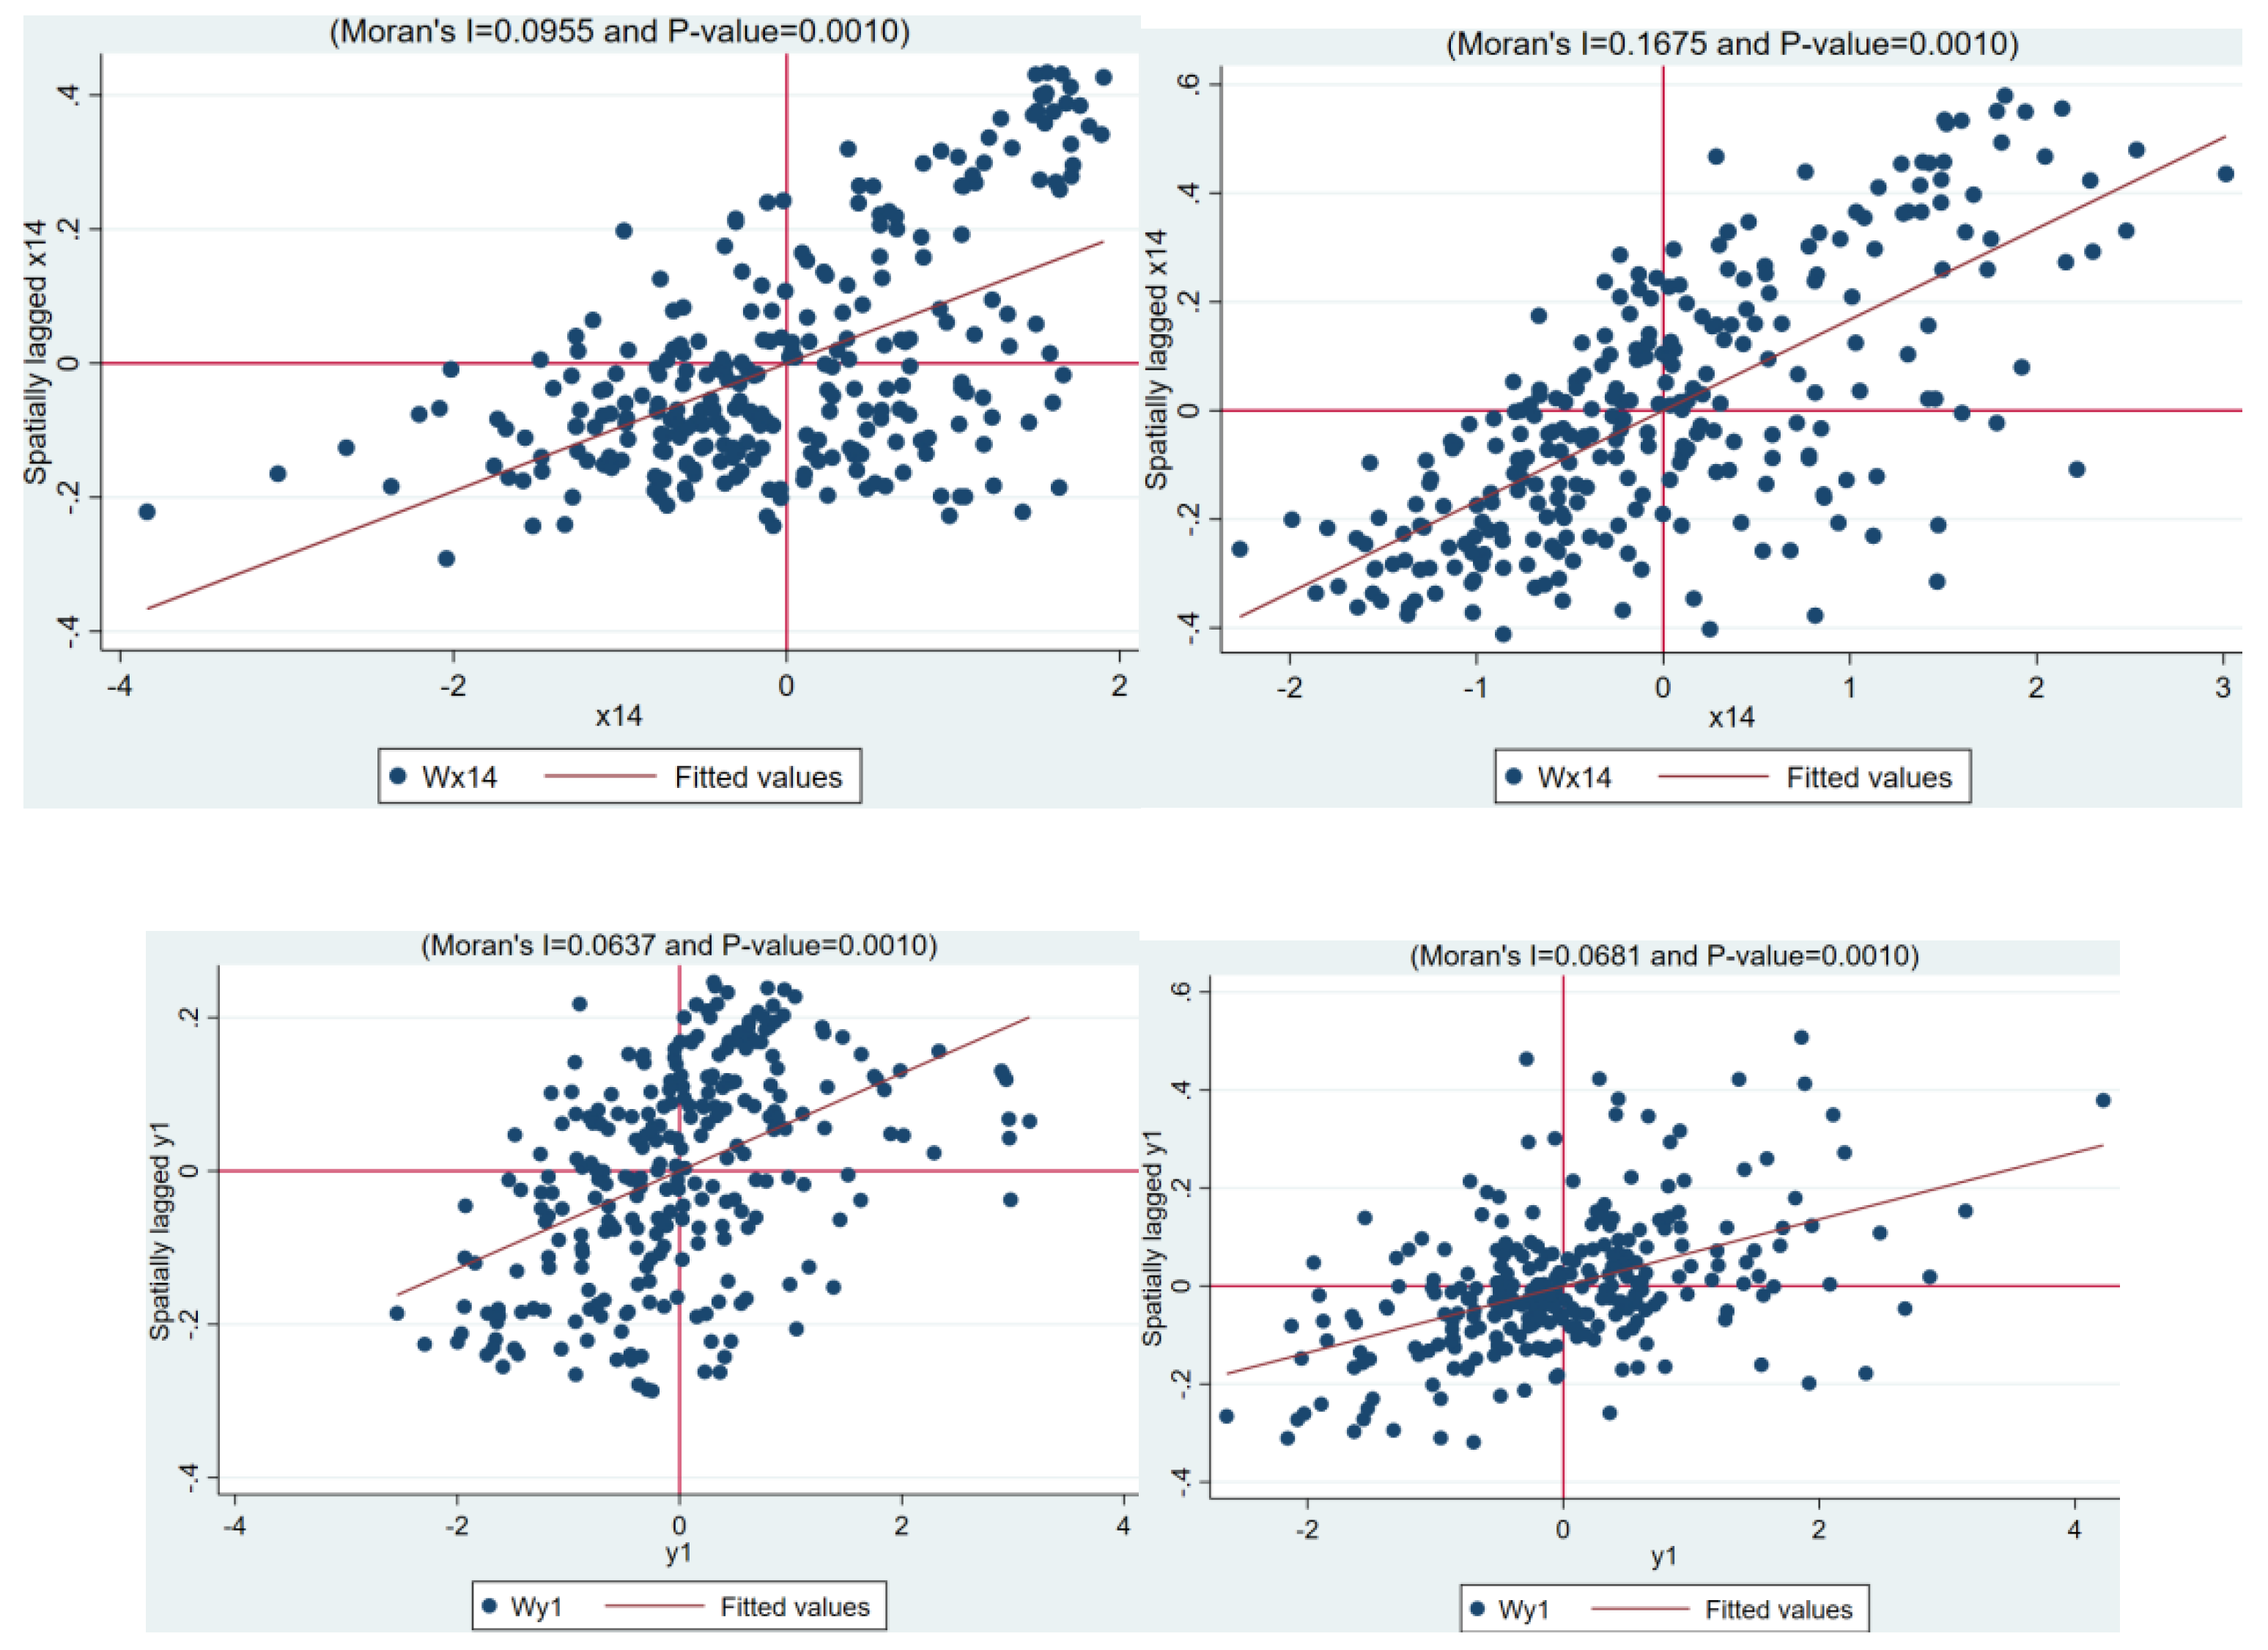
In order to further explore whether there is spatial autocorrelation between digital financial development level and green economic efficiency, the global Moran index of digital financial development level and green economic efficiency from 2011 to 2020 is calculated respectively, and the results are shown in Table 4. The results showed that the Nemorin index was positive during the study period, and all the years passed the significant test at 99% confidence level. It shows that the development level of digital finance and the efficiency of green economy are not in a state of spatial random distribution, but have obvious spatial correlation during the sample year.
In order to further explore the local correlation between the development level of digital finance and the efficiency of green economy, the local scatter charts of the development level of digital finance and the efficiency of green economy in 2011 and 2020 are selected to represent the local change trend of the two. It can be seen from the local Moran scatter diagram of the two that the development level of digital finance and Moran index of green economic efficiency in most cities are located in the first quadrant and the third quadrant, showing positive spatial correlation, that is, HH-type aggregation and LL-type aggregation.
Figure 2.
Moran scatter chart of green economic efficiency from 2011 to 2020.
② Selection test of spatial econometric model
Before the analysis of spatial measurement, the model form of spatial measurement is determined by LM test. The statistics of,, and are significantly positive at the level of 1%, so there are two forms of spatial error () and spatial autocorrelation. In this paper, the spatial Dobbin model () including both forms is selected for spatial econometric analysis. In addition, both the test and LR test pass the significance test at the level of 1%, which indicates that the spatial Dobbin model () will not degenerate into the spatial error model () and the spatial autocorrelation model (). Finally, the fixed effect model should be used through inspection, and the fixed effect model with double fixed use time should be determined through LR test.
Table 5.
Test results of spatial econometric model.
| Statistical test method | Statistical value | P value |
| 86.187 | 0.000 | |
| 841.581 | 0.000 | |
| 711.109 | 0.000 | |
| 238.867 | 0.000 | |
| 108.395 | 0.000 | |
| 93.80 | 0.000 | |
| 84.53 | 0.000 | |
| 93.80 | 0.000 | |
| 89.02 | 0.000 | |
| 638.60 | 0.000 | |
| 45.62 | 0.001 | |
| 4330.11 | 0.000 |
③ Construction of spatial econometric model
Based on the above test, this paper uses the spatial Dobbin model with double fixed time individuals to study the spatial correlation and influence effect between digital finance and green economic efficiency in China, and establishes the spatial econometric model as follows:

In formula (6), it represents the efficiency of green economy and belongs to the explained variable; Represents digital finance, which is the core explanatory variable; Represents the control variables of the model; , respectively, represent the fixed effect of the individual thought and time term of the model; Represents a random interference term; Represents the interface dimension of provinces and cities and the time dimension.
④ Construction of spatial weight matrix
In order to study the spatial spillover effect, this paper establishes a spatial weight matrix for spatial analysis. The construction principle of spatial weight matrix is based on the first law of geography, and the closer the distance, the closer the relationship between cities will be. In this paper, the geographic distance weight matrix is constructed, and its expression is as follows:
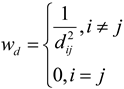
In the formula (7), Euclidean distance (i.e. straight line distance) or spherical great circle distance is represented. In this paper, the spherical great circle distance is adopted, as shown in Formula (8):

In Formula (8), the great circle distance between two spatial positions represents radius of the earth, and,, are sine, cosine and anti-cosine functions respectively; And the geographic latitude and longitude of the capital city center of each province, autonomous region and municipality.
5. Empirical Analysis
5.1. Descriptive Statistics
5.1.1. Spatial and Temporal Evolution Analysis of Green Economic Efficiency
In order to visually show the evolution process of green economic efficiency in time dimension and the difference in space dimension, this paper selects the cross-sectional data of prefecture-level cities in 2011, 2015 and 2020 for visual display.
Figure 3.
Green economic efficiency of prefecture-level cities in 2011 Figure 4 Green economic efficiency of prefecture-level cities in 2015.
Figure 3.
Green economic efficiency of prefecture-level cities in 2011 Figure 4 Green economic efficiency of prefecture-level cities in 2015.
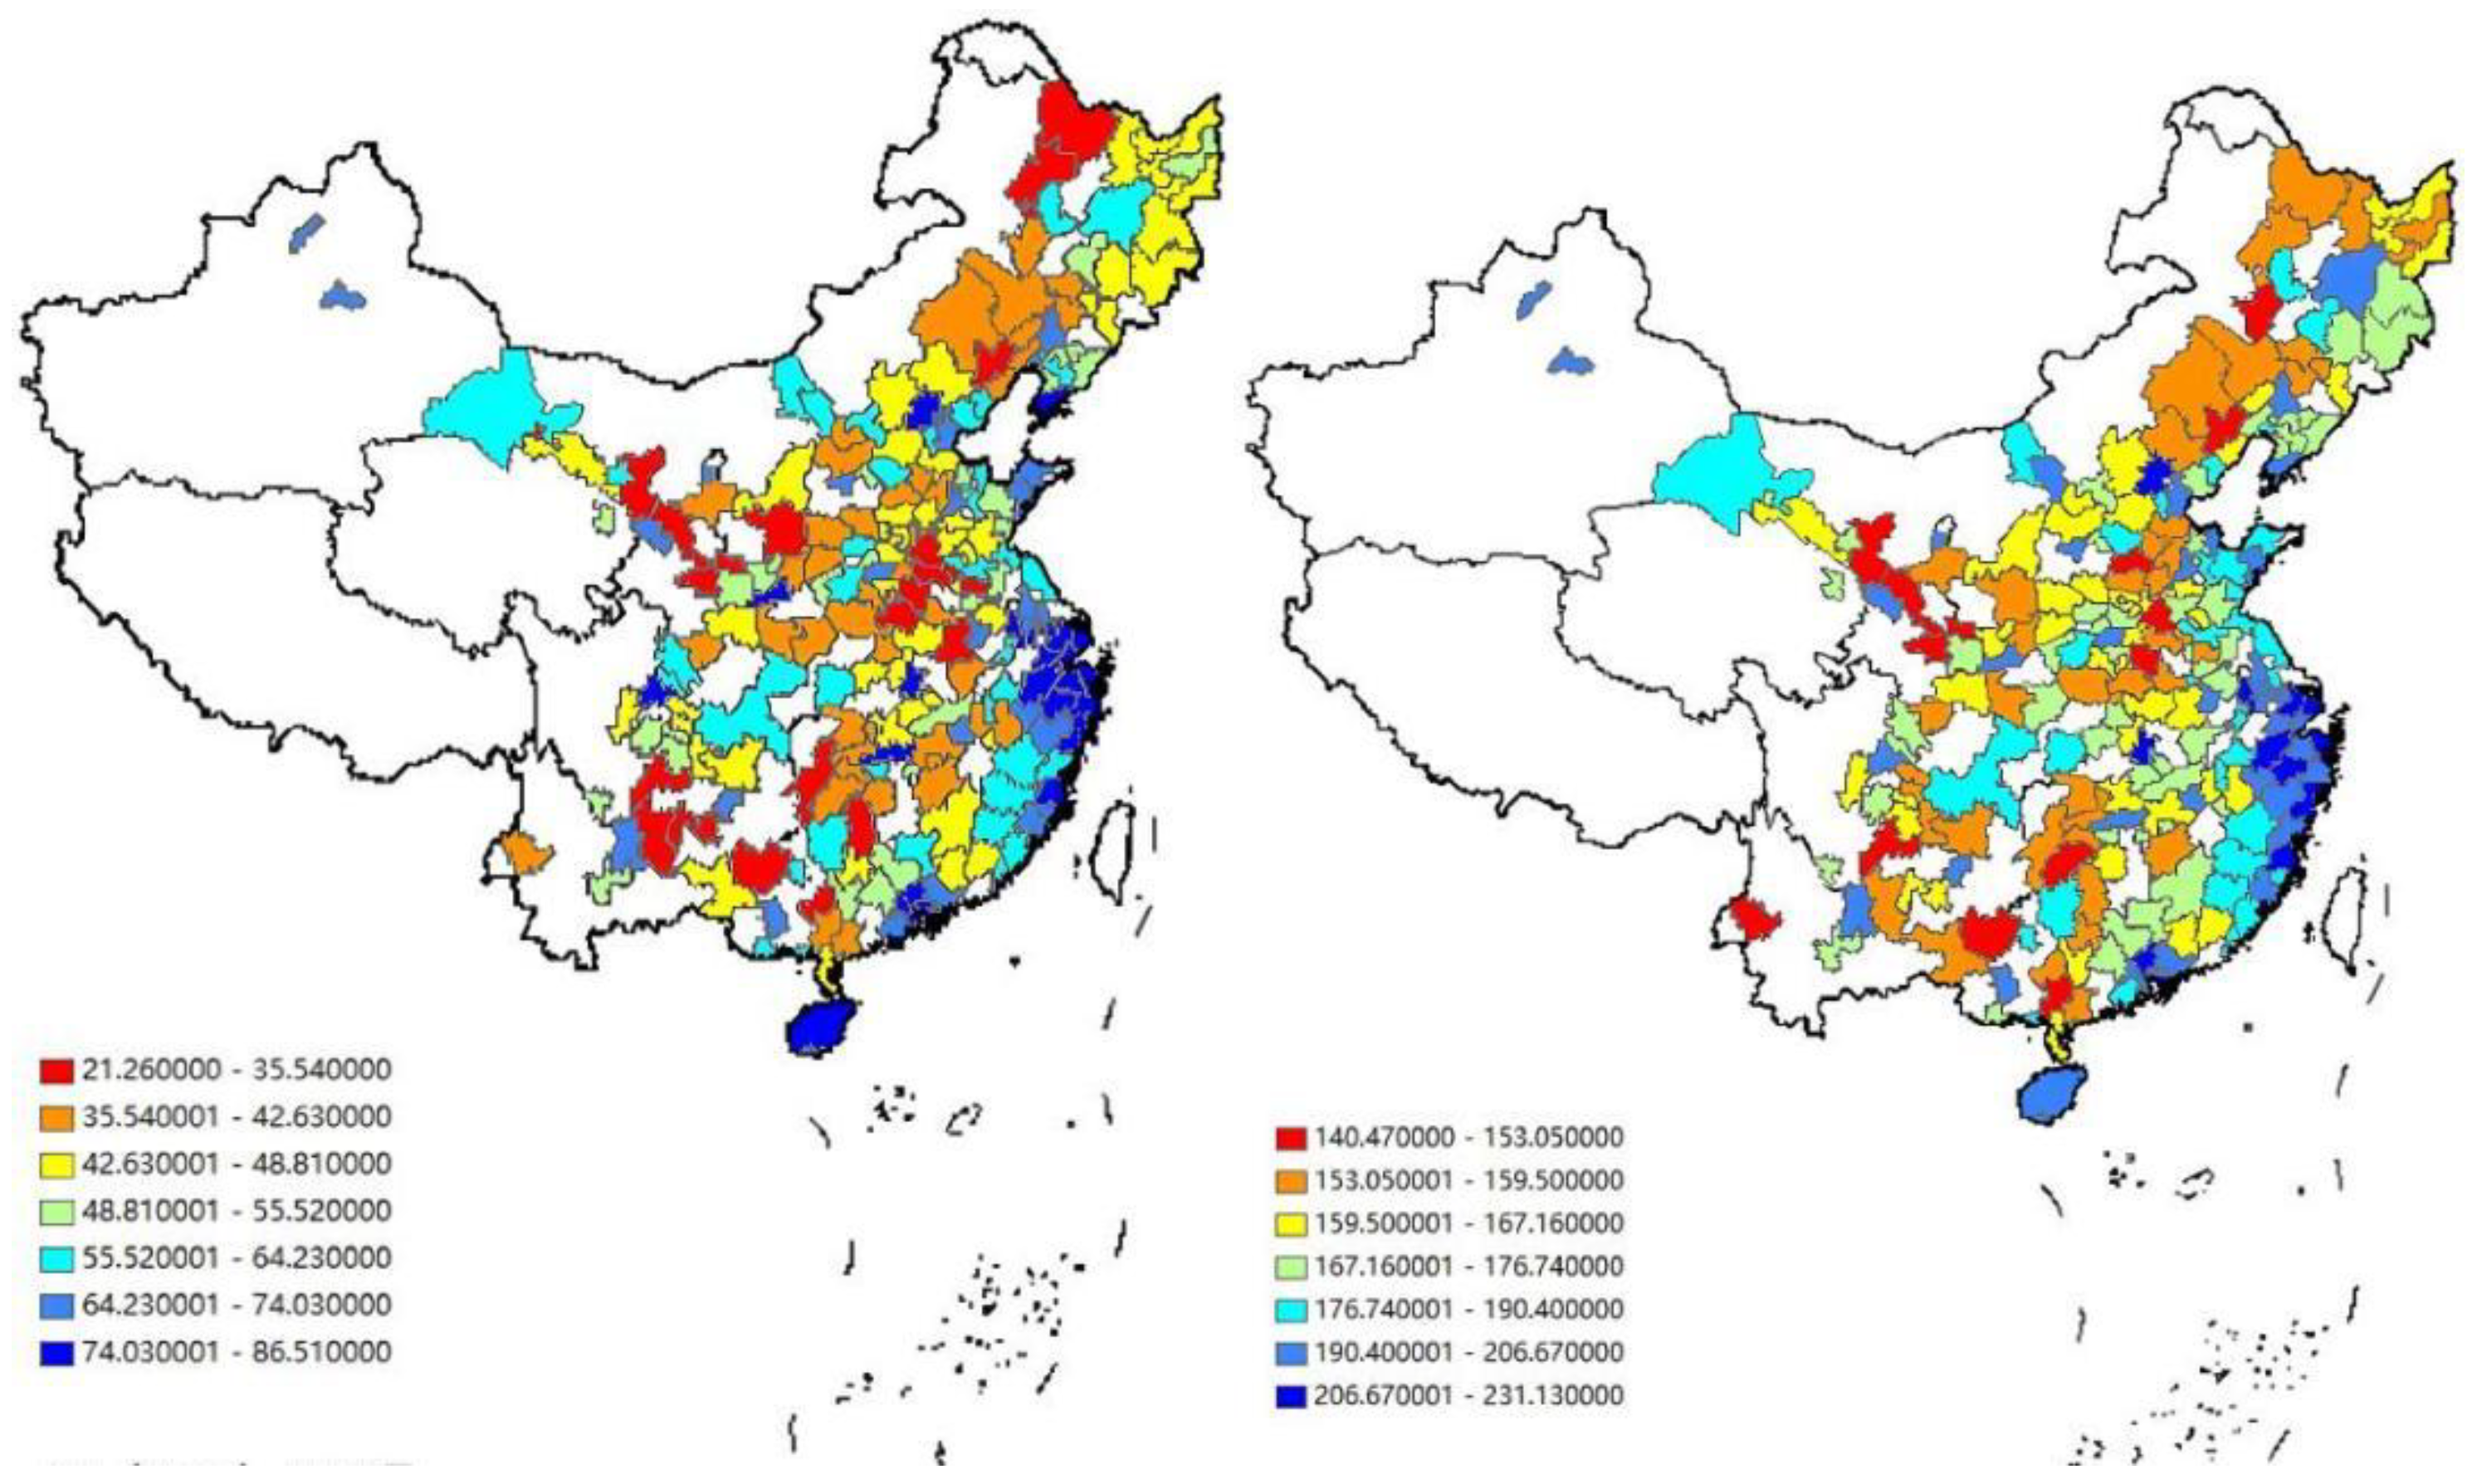
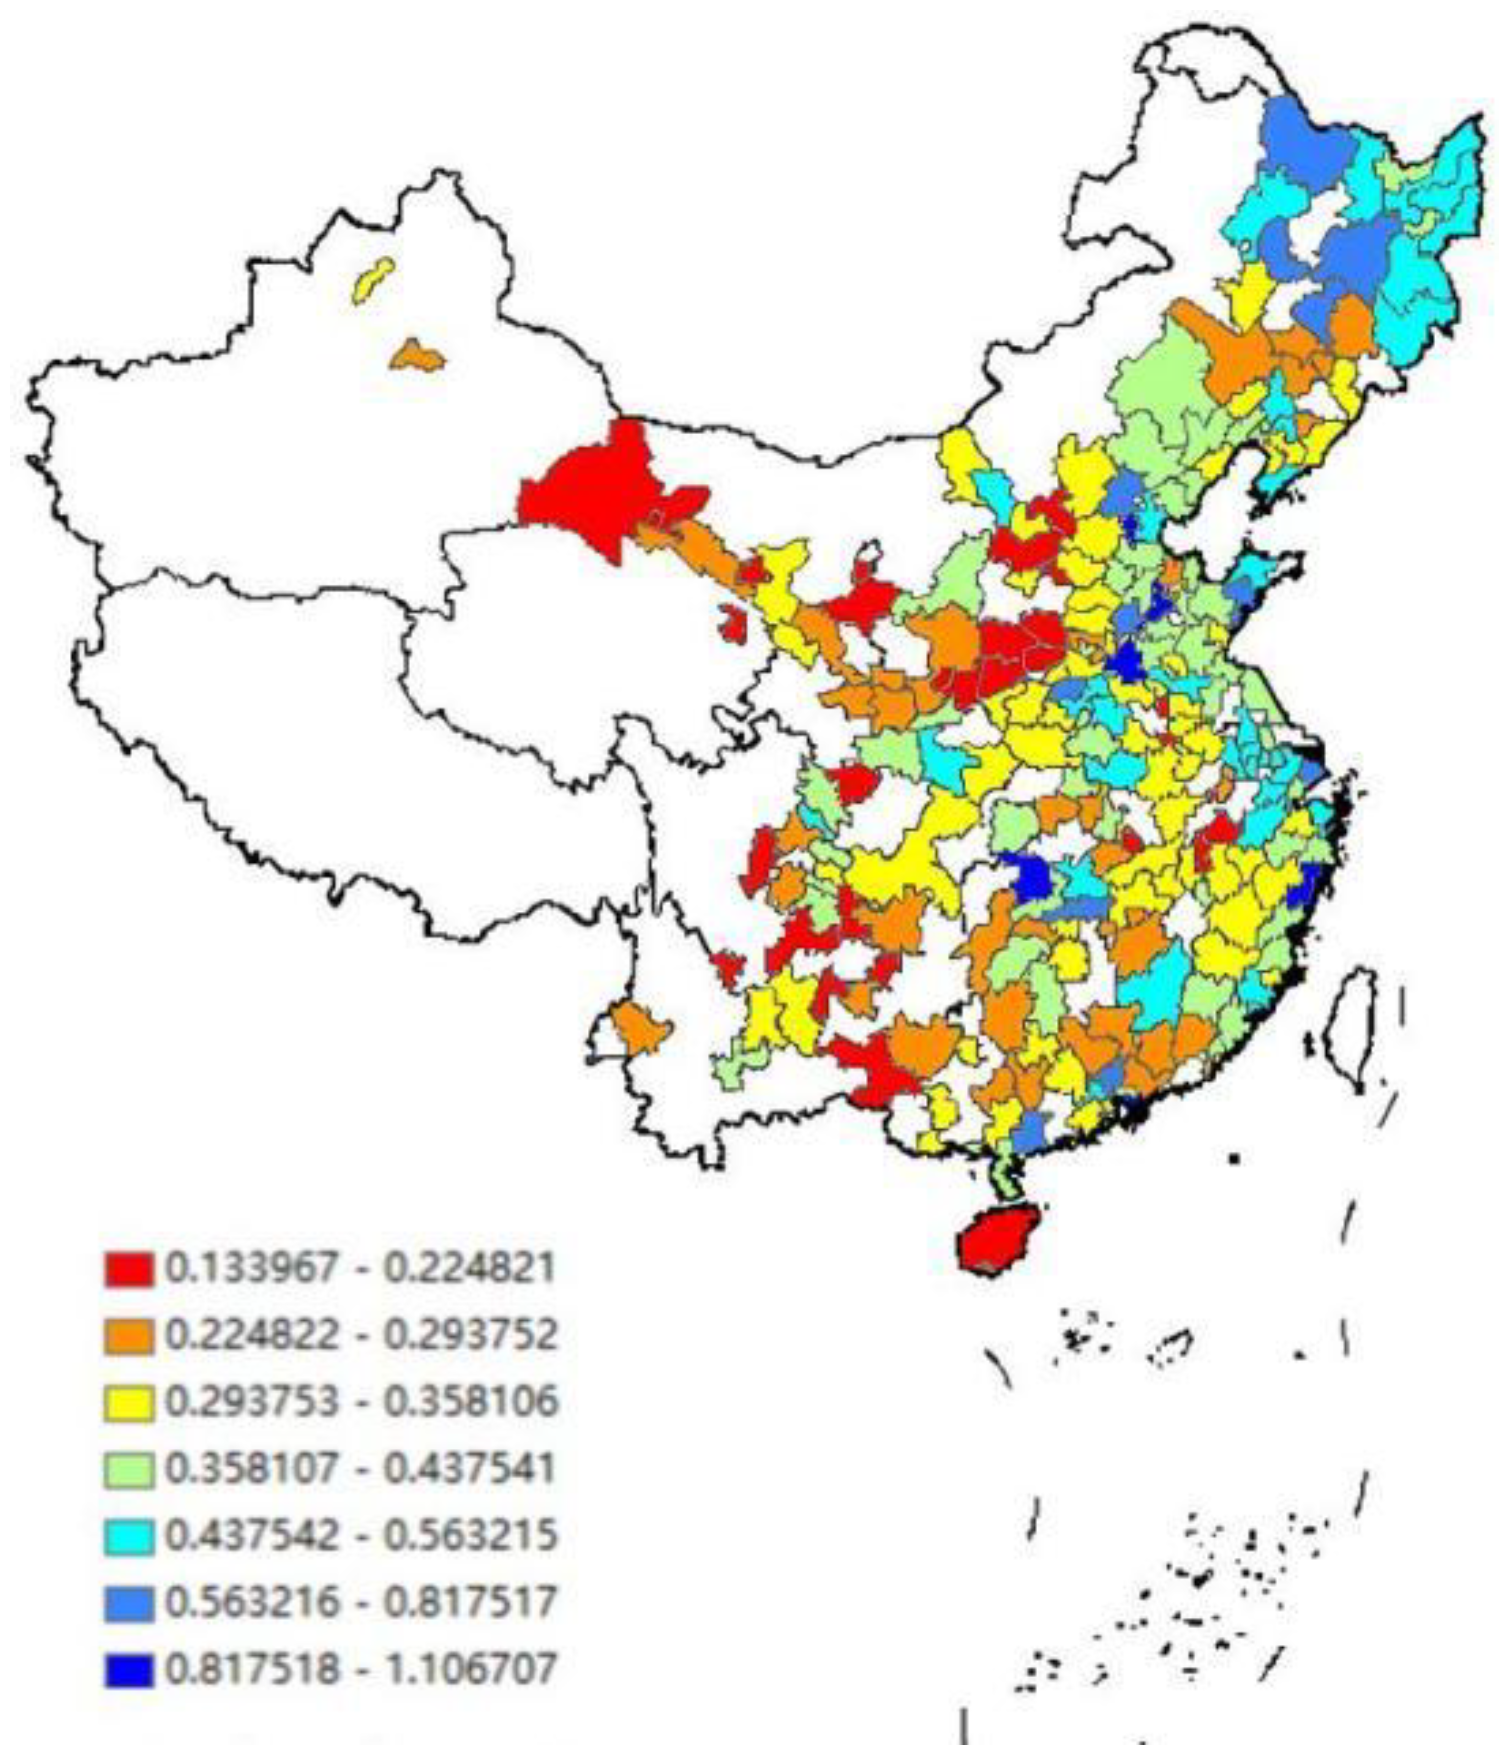
Figure 5.
Green Economic Efficiency of Prefecture-level Cities in 2020.
By analyzing the spatial distribution map of green economic efficiency in the above three years, in the time dimension, the green economic efficiency of most cities has improved from 2011 to 2020; In the spatial dimension, Shenzhen, Maoming, Changde, Daqing, Guangzhou and Jieyang have maintained high green economic efficiency during these three years.
By analyzing the spatial dimension, the areas with high green economy efficiency are mostly located in the southern region. This is because the southern region, as a relatively developed region, is often easier to implement green economy policies and technologies, has more resources and technical support, and is also more capable of investing in environmental protection and sustainable development to promote the development of green economy.
5.1.2. Temporal and Spatial Evolution Analysis of Digital Finance
In order to visually show the evolution process of digital finance level in time dimension and the differences in space dimension, this paper selects the cross-sectional data of prefecture-level cities in 2011, 2015 and 2020 for visual display.
Figure 6.
Digital Finance Level of Prefecture-level Cities in 2011 Figure 7 Digital Finance Level of Prefecture-level Cities in 2015.
Figure 6.
Digital Finance Level of Prefecture-level Cities in 2011 Figure 7 Digital Finance Level of Prefecture-level Cities in 2015.
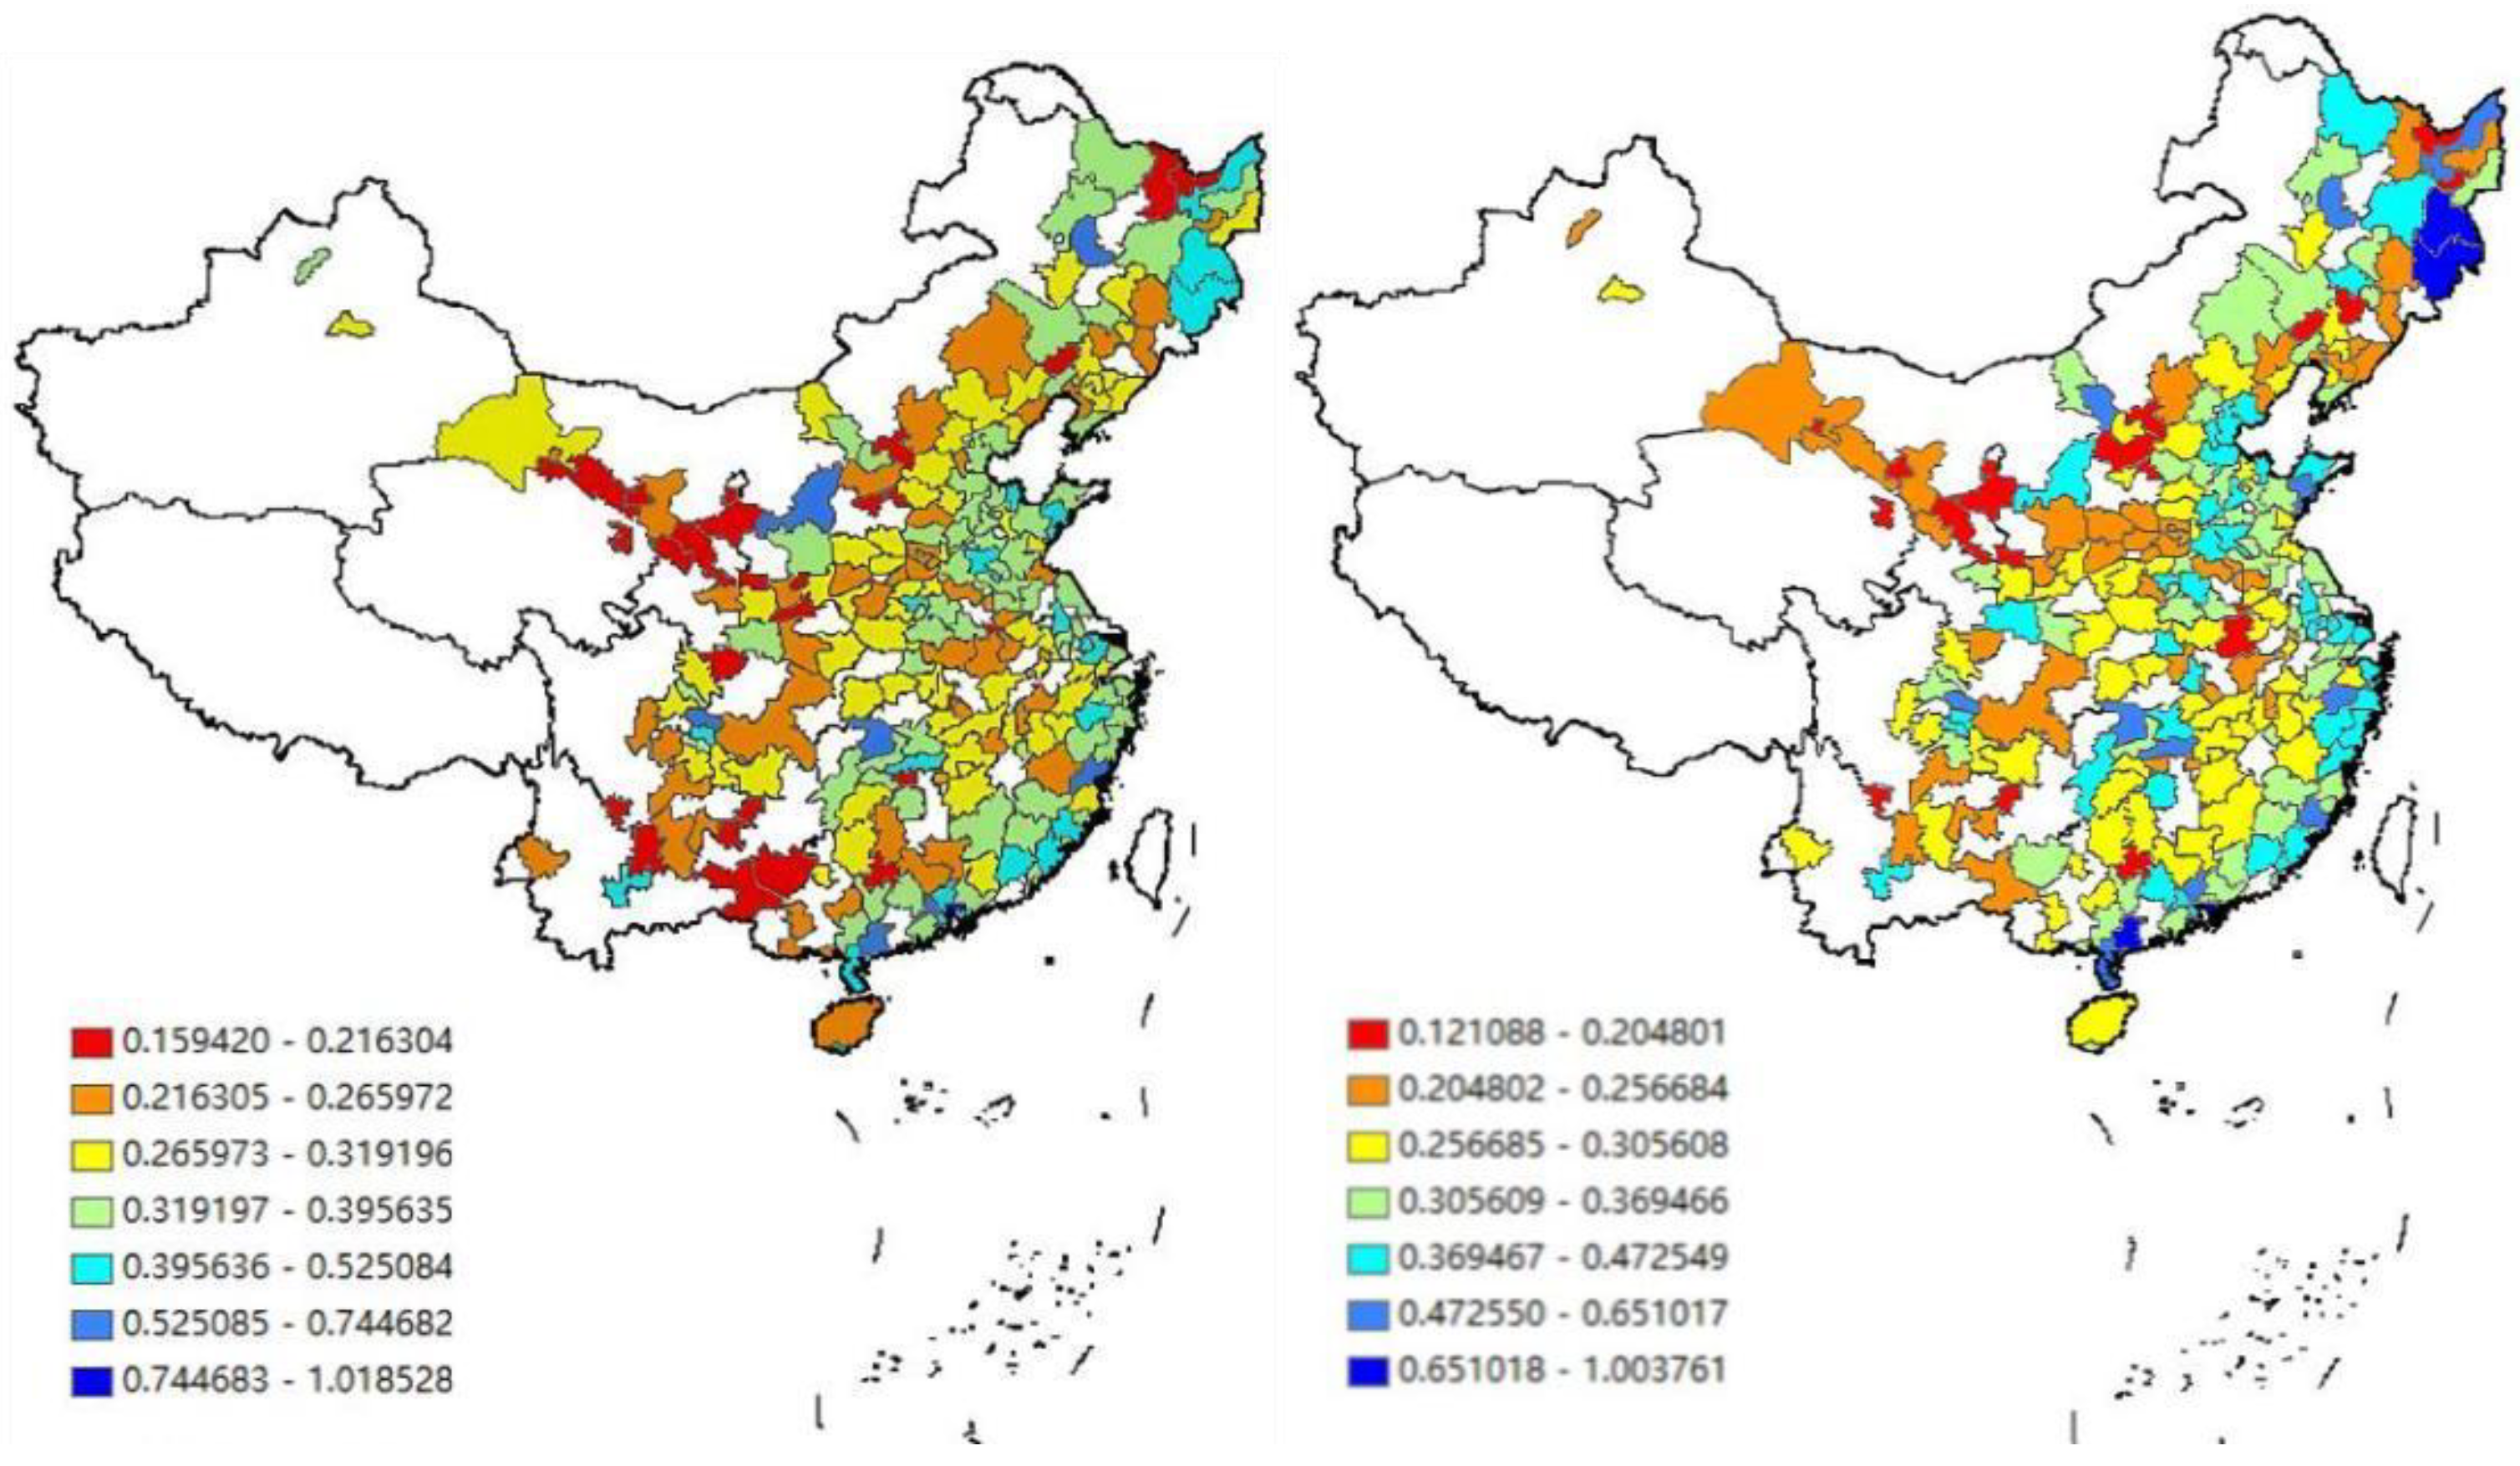
Figure 8.
Digital Finance Level of Prefecture-level Cities in 2020.
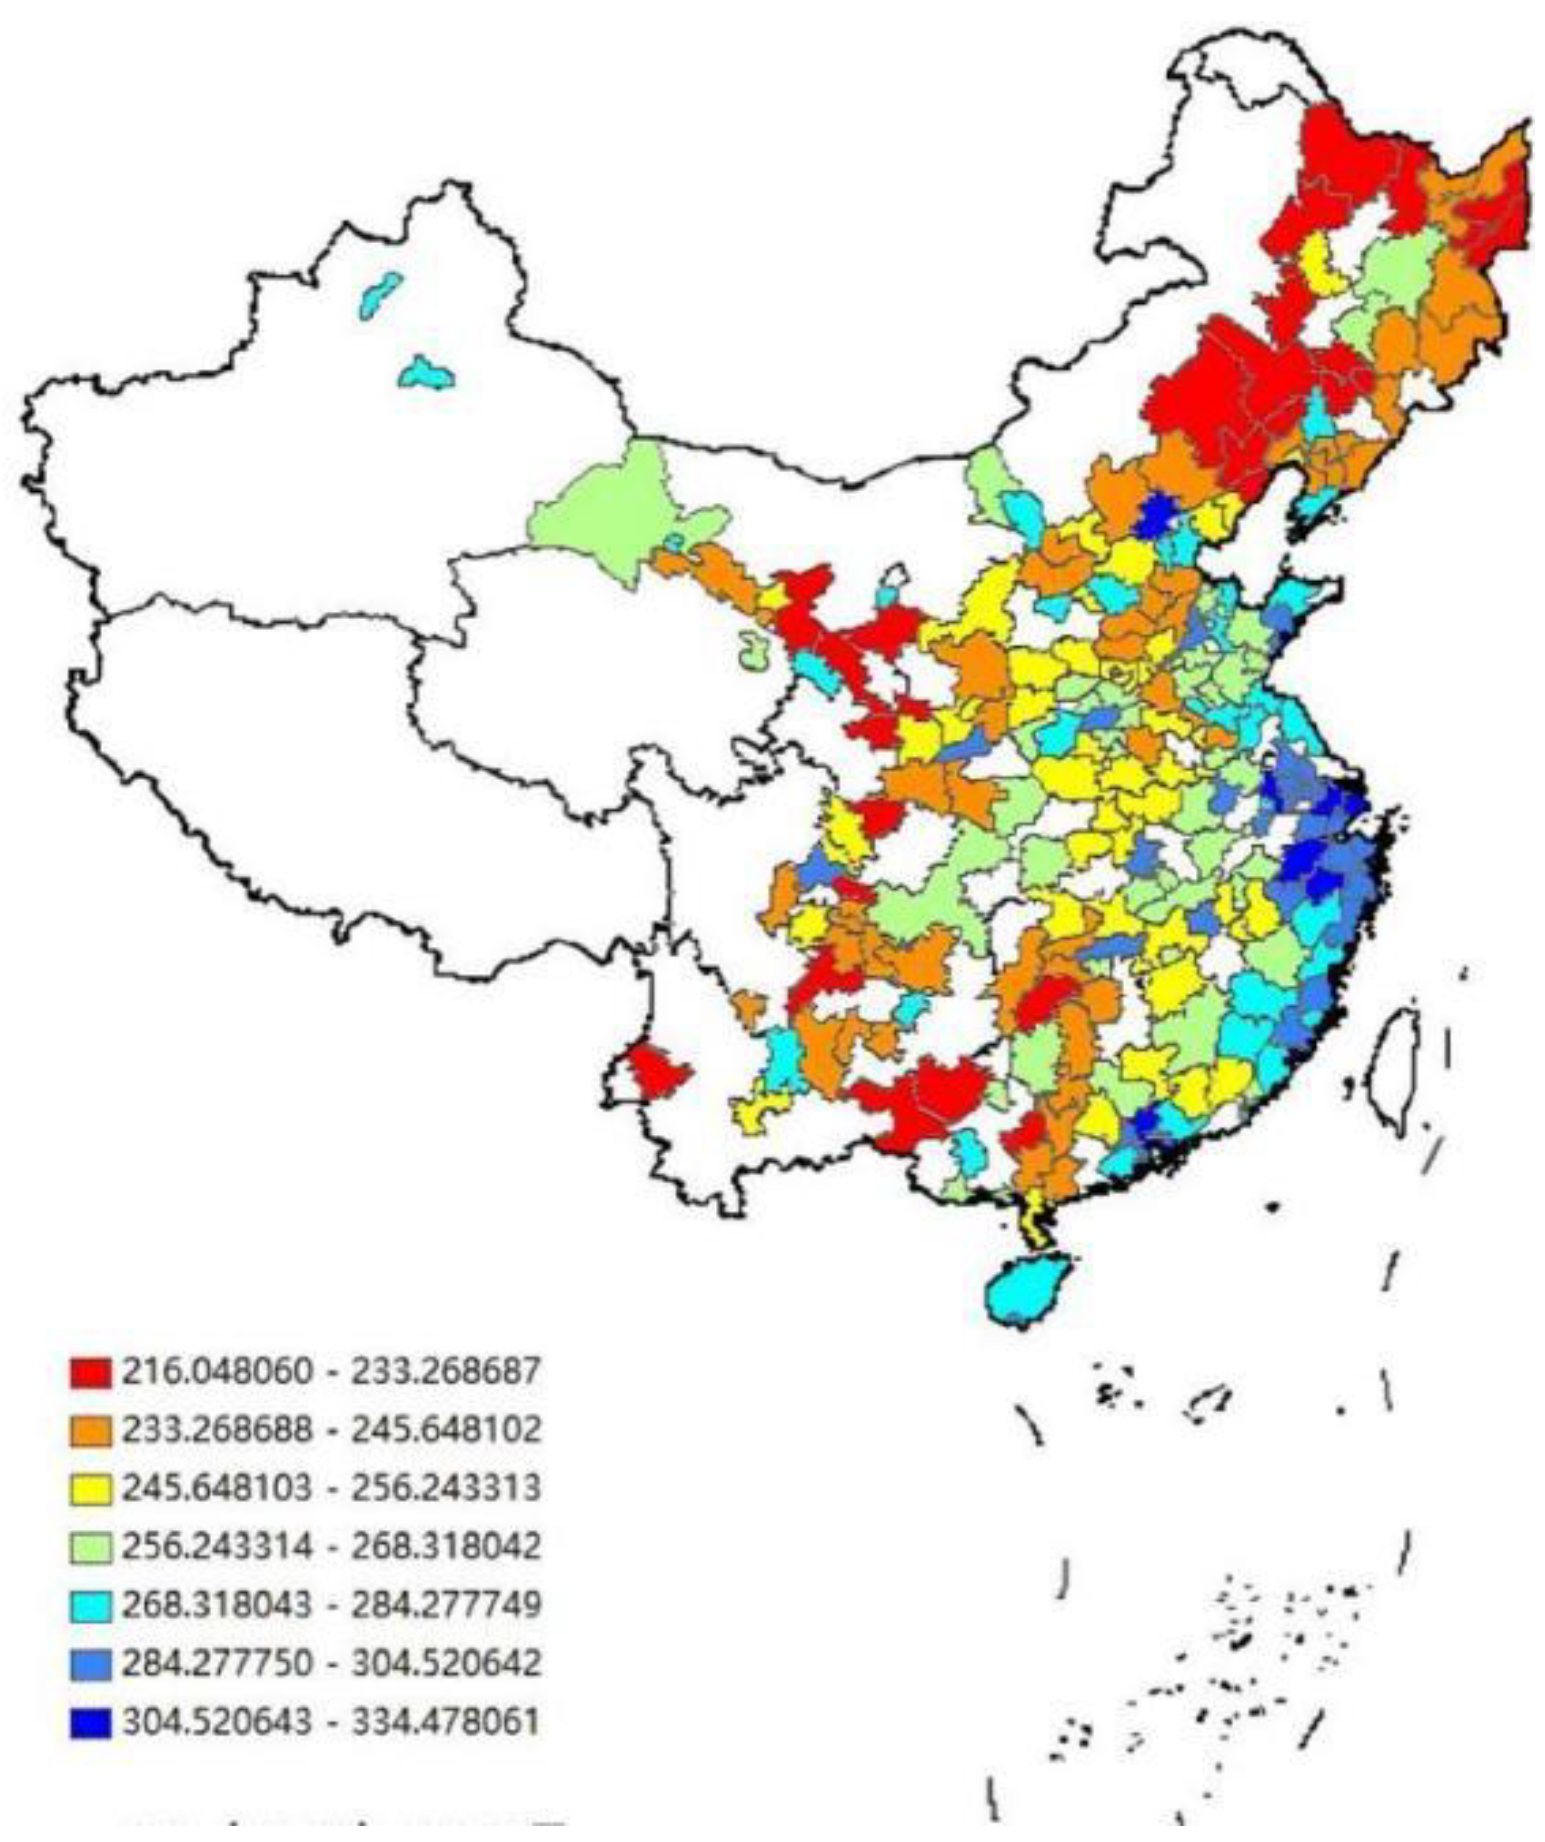
By analyzing the spatial distribution map of digital finance level in the above three years, from the time dimension, with the passage of time, the digital finance level of most cities has improved significantly in the earlier years; From the spatial dimension, Hangzhou, Shenzhen, Shanghai, Beijing, Guangzhou and Xiamen have maintained high economic efficiency during these three years.
By analyzing the spatial dimension, the level of digital finance in the eastern coastal areas is relatively high. Because of its high level of economic development, it has a relatively perfect industrial base, scientific and technological level and talent pool, which has promoted the rapid development of digital finance. Moreover, consumers in the eastern coastal areas generally have high financial literacy and acceptance of emerging financial service models, which provides a broad market space for the development of digital finance, and also enables digital finance to better meet the diversified and personalized needs of consumers. In recent years, the level of digital finance in the central region has shown a significant upward trend, mainly due to the fact that governments at all levels have attached great importance to the development of digital finance, encouraged financial institutions to increase their investment in digital finance, and at the same time, the industrial structure has been continuously optimized and upgraded, providing strong economic support for the development of digital finance.
5.1.3. Nuclear Density Diagram Analysis of Green Economic Efficiency
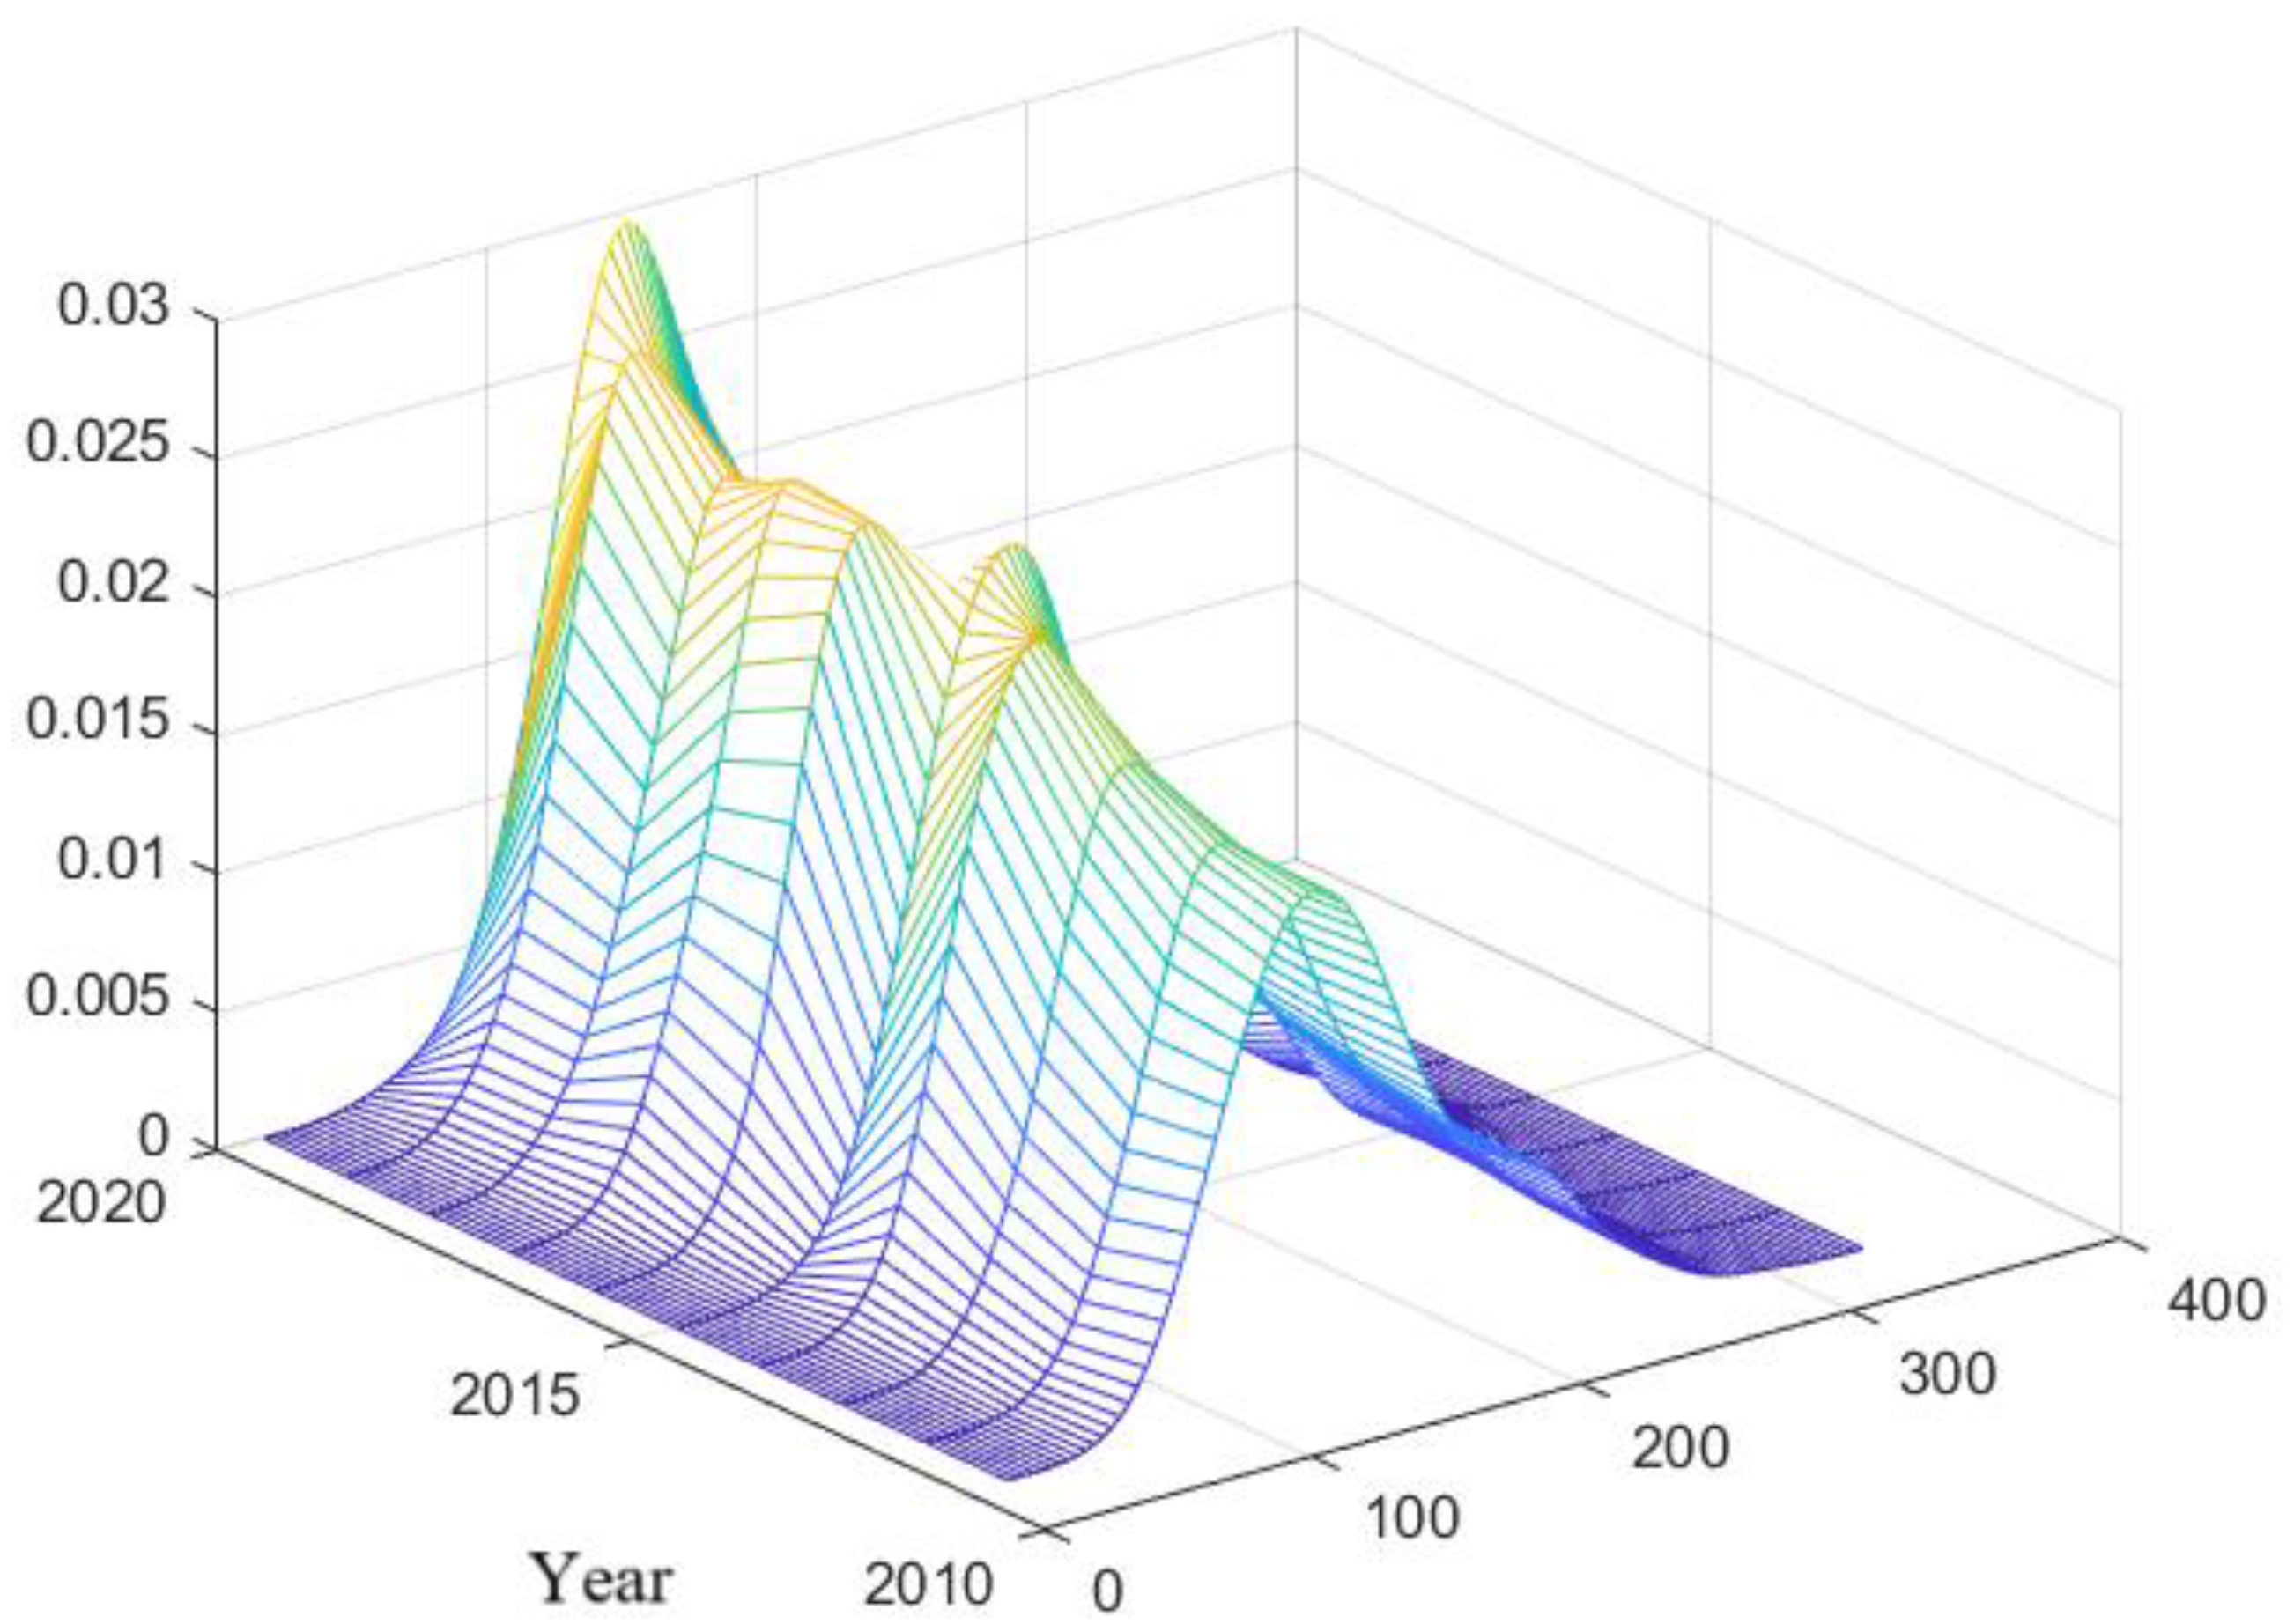
In order to intuitively reflect the spatial distribution and concentration of different efficiency levels, the three-dimensional kernel density diagram is used to show the changing trend of green economic efficiency with time from 2011 to 2020. As shown in the figure, the horizontal axis represents the year, the vertical axis represents the efficiency value, and the curve shows a fluctuating trend, reflecting the change of green economy efficiency in these years. From the characteristics of peak value, the peak value of green economic efficiency distribution in cities across the country gradually moves to a higher efficiency value, indicating that the overall green economic efficiency is improving; The shape of the peak gradually narrows, from a broad peak to a peak, indicating that the gap between the development levels of green economic efficiency in different regions of the country is narrowing; The nuclear density curve presents a single peak distribution, which shows that the digital economic efficiency has no obvious polarization characteristics and the development level is relatively balanced.
Figure 9.
Three-dimensional nuclear density diagram of green economic efficiency.
5.2. The Correlation Between the Level of Digital Finance and the Efficiency of Green Economy
5.2.1. Benchmark Regression
In order to explore the relationship between the level of digital finance and the efficiency of green economy, this paper makes a regression analysis, and the regression results are as follows.
Table 6.
Regression results
| variable | one | 2 | three |
|---|---|---|---|
| coefficient of regression | 0.505*** (9.491) |
0.912*** (15.338) |
0.915*** (15.467) |
| Control variable | no | be | be |
| Time-fixed effect | no | no | be |
| Individual fixation effect | no | no | be |
| N | 2710 | 2710 | 2710 |
| R2 | 0.031 | 0.335 | 0.368 |
Note: Values are in brackets, the same below.
As shown in the above table, the control variables, time and individual fixed effect were not taken into account in the first regression, and the regression coefficient of the development level of digital finance was 0.505 at the significance level of 1%. It is concluded that there is a positive correlation between the development level of digital finance and the efficiency of green economy. Because other variables will have an impact on the efficiency of green economy at the same time as the development level of digital finance, the control variables are included in the consideration of the second regression, and the second regression is carried out without considering the fixed effects of time and individuals, and the regression coefficient of the development level of digital finance is 0.912 at the significance level of 1%, which further confirms the above conclusion. As time goes by, the economic situation fluctuates, and the geographical location, economic environment and industrial structure of each city will have a certain impact on the efficiency of green economy. Therefore, on the basis of the second regression, the third regression takes time and individual fixed effect into account, and analyzes the correlation between the development level of digital finance and the efficiency of green economy again, and obtains the regression coefficient of 0.915 at the significance level of 1%. After considering the control variables, time fixed effect and individual fixed effect, it is found that there is still a significant positive relationship between the development level of digital finance and the efficiency of green economy. Through the above three regressions, it can be inferred that if the development level of digital finance is improved by one unit, the efficiency of green economy will be improved by 0.915 unit.
5.2.2. Endogenous Test
In order to avoid endogenous problems caused by two-way causality and missing variables, this paper refers to the method adopted by Fu Qiuzi and Huang Yiping (2018), and uses the geographical distance () of each city to Hangzhou as a tool variable of digital finance. The research shows that because the digital financial carrier Alipay and other software originated in Hangzhou, the farther away from Hangzhou, the more difficult it is to promote (Guo Feng et al., 2017); On the other hand, the geographical distance between cities and Hangzhou is not directly related to other financial variables and model disturbance terms, which shows that the variable is exogenous and meets the requirements of tool variable selection. Considering that the tool variable of geographical distance is cross-sectional data and has no time dimension, Yu Jintao is used for reference.Error! Reference source not found.And so on, interact with the time series variable of the national average value of digital finance except this city, because the national digital finance development level must be related to the digital finance development level of each city, but it will not be obviously affected by the green economic efficiency level of a certain city, and at the same time satisfy the correlation and exclusiveness, thus forming panel data, and regressing it with regression model, and the results are shown in Table 7.
It can be seen that in the results of the first stage of regression, the regression coefficient of instrumental variables to digital finance is significantly negative at 1% confidence level, which is in line with expectations; At the same time, the value of 43.2568 in the one-stage weak tool variable test is much greater than 10, which shows that the tool variable selection is effective and there is no weak tool variable. In the second stage of regression results, the impact of digital finance on the efficiency of green economy is still significantly positive at 1% confidence level after selecting instrumental variables, which shows that the level of digital finance can still significantly affect the efficiency of green economy after considering endogenous problems, and the regression results remain stable.
5.2.3. Robustness Test
In order to verify the stability and reliability of the regression model results, the robustness of the same type of variables is tested, and whether the model results have changed significantly is compared and observed.
① robustness test of green economy efficiency dimension
In the benchmark model, the green economic efficiency measured by super-efficiency is used as the key explanatory variable. In the first test, it is replaced by the green economic efficiency value measured by super-efficiency, and the model is used to regress. The results show that, although the coefficients of the two are different in value, it can be concluded that there is a positive correlation between the development level of digital finance and the efficiency of green economy, and both of them are significant at the level of 1%. In addition, the significance of other control variables remains basically unchanged. Therefore, it can be inferred that the model is robust and its conclusion is not affected by the choice of specific variables.
② Robustness test of digital finance development level dimension
In the benchmark model, the development level of digital finance is used as the key explanatory variable. In the second test, the development level of digital finance is replaced by the development level of digital economy, and the regression is carried out again. The regression results show that although the regression coefficients before and after are different in value, it can be concluded that there is a positive correlation between the development level of digital finance and the efficiency of green economy, and both of them are significant at the level of 1%. Therefore, it can be inferred that the model is robust and its conclusion is not affected by the choice of specific variables.
Table 8.
Robustness Test Results.
| variable | one | 2 |
|---|---|---|
| coefficient of regression | 0.067** (8.989) |
0.479** (3.508) |
| 2710 | 2710 | |
| 0.143 | 0.146 |
5.3. Heterogeneity Analysis-Grouping Regression
5.3.1. Regional Heterogeneity
With the development of the new era, the economic differentiation between the north and the south of China has intensified, and its economic differences have become a major theoretical and practical problem for China’s development. Therefore, this paper divides the sample cities into two groups, the southern and northern regions, for regression analysis. As can be seen from the following table, there is a significant positive correlation between the level of digital finance and the efficiency of green economy in the south and the north, but the northern part is slightly weaker than the southern part, and the coefficient difference is small. The reasons are as follows: (1) In the time span of this paper, the economic development in the north is rapidly lagging behind that in the south from 2015 to 2020. Among the top 20 cities in digital finance in the north, only four cities are Beijing, Jinan, Tianjin and Qingdao, and the rest are southern cities; (2) Heavy industry cluster in Northeast China, with high energy consumption and high pollution industries accounting for a relatively high proportion, which restricts the development and transformation of its green economy and may lead to the offset of the role of digital finance; (3) Some southern coastal cities have close foreign trade communication, and their digital finance industry can get more foreign digital investment to improve their digital capabilities and accelerate regional innovation and green development; (4) The digital infrastructure construction in the northern and western regions is lagging behind, and it is still in the initial stage of digital development, and it lags behind the southern cities in terms of digital coverage, depth and other reasons, and the efficiency effect of digital finance on green economy is weaker than that in the south.
Table 9.
Regional Heterogeneity.
| variable | (1) upstate |
(2) Southern region |
| 0.0368** (2.43) |
0.0512*** (3.13) |
|
| Control variable | control | control |
| Fixed time | Yes | Yes |
| Individual fixation | Yes | Yes |
| 1360 | 1350 | |
| 33.32 | 16.27 | |
| 0.198 | 0.108 |
5.3.2. Heterogeneity of Digital Finance Development
According to the development level index of digital finance in cities from 2011 to 2020, the high-level and low-level regions are divided into groups according to their 50% quantiles, and the results are shown in Table 10. It is found that there is a significant positive correlation between the development level of digital finance and the efficiency of green economy in both high-level and low-level areas of digital finance, but it plays a greater role in promoting the efficiency of green economy in areas with higher development level of digital finance. This result can be attributed to the good economic development, digital industry and talents gathering, strong economic and policy support and high resource allocation efficiency in the high-level areas of digital finance development, which can give full play to the role of digital finance in promoting the efficiency of green economy.
5.3.3. Resource-Based Heterogeneity
Resource-based cities refer to cities whose leading industries are the mining and processing of natural resources such as minerals and forests in the region. According to the comprehensive classification of resource-based cities in the National Sustainable Development Plan for Resource-based Cities (2013-2020), they are divided into four categories: growth, maturity, decline and regeneration, and the heterogeneity of non-resource cities is analyzed respectively to explore the influence of digital finance on the green economic efficiency of different resource-based cities in detail. The results are shown in Table 10. Among them, the resource development of mature resource-based cities is in a stable stage, with strong resource support ability, and the level of economic and social development is higher than that of non-resource-based cities. Therefore, digital finance affects its green economic efficiency development under the significance test of 1% confidence level, and the regression coefficients are 0,105 and 0.0925 respectively; However, the declining and regenerative resource-based cities are in the stage of economic and industrial transformation and upgrading respectively, and the promotion of digital finance is weak; However, it is superior to the growing resource-based cities, and its resource development is on the rise, and it is highly dependent on resources, so the development of digital finance has no significant impact on its green economic efficiency.
Table 11.
Resource Heterogeneity.
| variable | (1) | (2) | (3) | (4) | (5) |
| Growth type | Maturity | Recession type | Regenerative type | Non-resource type | |
| 0.00709 | 0.105*** | 0.0409* | 0.0824* | 0.0925*** | |
| (0.14) | (3.33) | (1.79) | (1.97) | (6.16) | |
| Control variable | control | control | control | control | control |
| Fixed time | Yes | Yes | Yes | Yes | Yes |
| Individual fixation | Yes | Yes | Yes | Yes | Yes |
| 130 | 570 | 230 | 130 | 1650 | |
| 1.268 | 7.500 | 5.788 | 10.55 | 50.48 | |
| 0.106 | 0.276 | 0.103 | 0.497 | 0.255 |
5.4. Analysis of the Spatial Spillover Effect of Digital Finance on the Efficiency of Green Economy
5.4.1. Spatial Dobbin Model Regression
Through the spatial autocorrelation test,,, test and test, the spatial Dobbin model is finally used to analyze under the geographical distance matrix, and the regression results are shown in Table 12.
The results show that the direct effect of digital finance is negative, the indirect effect and the total effect are positive, and remain significant at the level of 1%. The direct effect results show that the development of digital finance has a negative impact on the efficiency of green economy in this region. At present, the development of digital finance in some areas is still in the initial stage, mainly focusing on business expansion and efficiency improvement in the traditional financial field; The development of digital finance may not realize the optimal allocation of resources, but more flows to traditional industries with high pollution and high energy consumption, so the direct support for green economy is still insufficient. The results of indirect effects show that digital finance has a significant positive impact on the efficiency of green economy in other surrounding areas, which shows that the development of digital economy has a strong radiation-driven role, which can promote the technological innovation and industrial structure optimization of neighboring cities by promoting capital flow and information sharing, thus improving the efficiency of green economy. The total effect results show that the development of digital finance has a positive impact on the overall green economic efficiency. Although digital finance has a certain negative impact on the green economic efficiency in some areas, the positive spillover effect on the surrounding areas is more significant, which in turn promotes the overall green economic efficiency.
5.4.2. Spatial Effect Decomposition of Green Economic Efficiency
The value of green economic efficiency based on Super-SBM model can be decomposed into pure technical efficiency and scale efficiency. Pure technical efficiency is a measure of a city’s technical application and management level when using various resource elements, which directly reflects the effective utilization of resource elements by the city. Scale efficiency focuses on the level of production scale that a city can achieve when using these resource elements for production, that is, the ability of a city to improve the efficiency of resource utilization by expanding production scale. In this paper, the decomposed variables are used to replace the efficiency of green economy, and then regression is made again to explore the influence of digital finance on the efficiency of green economy. The results are shown in Table 13.
The results show that the direct effect of digital finance on pure technical efficiency is negative, while the indirect effect and total effect on pure technical efficiency are positive. The direct effect of digital finance on scale efficiency is positive, while the scale efficiency of indirect effect and total effect is negative. In some areas, the development of digital finance may be ahead of the local technology application level, thus making the new technology unable to be fully applied and affecting the pure technology efficiency. However, the development of digital finance has a positive spillover effect on the pure technical efficiency of surrounding areas, which promotes the technology diffusion and network connection with surrounding areas; The successful application of digital finance in this region can also provide a demonstration for the surrounding areas, so that the surrounding areas can get in touch with new technologies faster. The development of digital finance has promoted the scale efficiency of the region to a certain extent. The development of digital finance has provided enterprises with more convenient financing channels, reduced financing costs and helped enterprises expand their production scale. At the same time, the risk management tools and technologies brought by digital finance help enterprises to better control risks and reduce operational risks, thus improving scale efficiency. The development of digital finance has a negative spillover effect on the scale efficiency of the surrounding areas. The development of digital finance may attract the funds and resources of the surrounding areas to gather in the local area, leading to the reduction of the production scale of the surrounding areas and the “siphon effect”; The convenience service it brings may aggravate the competition among regions, and make enterprises in surrounding areas face greater pressure in financing and market expansion, thus affecting their scale efficiency.
5.4.3. Robustness Test
① Excluding the data of municipalities directly under the Central Government
Considering that the municipality directly under the central government may have significant differences with other cities in the development of digital finance because of its unique policy and resource advantages, it may have an impact on the analysis results of digital finance on the efficiency of green economy. In order to ensure the robustness of the conclusion, this paper re-examines the influence of digital finance on the efficiency of green economy without the data of municipalities directly under the central government. As shown in columns (1) to (3) in Table 14. After reanalysis, we find that the direct effect of digital finance on the efficiency of green economy is still significantly negative, while the indirect effect and total effect are significantly positive, indicating that the empirical results of this paper are not affected by the samples from municipalities directly under the central government, and the research results are robust.
② Replace the spatial weight matrix
Considering that different factors such as economic development level, industrial structure and policy environment in different regions may have an impact on the relationship between digital financial development and green economic efficiency, the economic distance weight matrix is used to replace the geographical distance weight matrix for regression, and the results are shown in columns (4)~(6) in Table 14. According to the results, it can be seen that the direct effect of digital finance on the efficiency of green economy is obviously negative, and the indirect effect is obviously positive, so the conclusion of this paper is still valid.
③ Tail shrinking treatment method
Because whether the sample data is stable or not will have a significant impact on the model, and the tail-shrinking processing can solve the extreme value of the sample. Therefore, in this paper, the method of tail-shrinking is adopted, and the extreme values of 1% at both ends of the data are subjected to tail-shrinking processing and are brought into the model regression again, so as to reduce the regression deviation, as shown in columns (7)~(9) of Table 14. The results show that the regression results of the truncated samples are basically consistent with the expectations of the model, indicating that there is no obvious bias in the original data, and the robustness of the model is effectively guaranteed.
6. Conclusions and Recommendations
Based on the literature research, this paper uses the model to measure the efficiency of green economy to evaluate the development trend of green economy, and makes an empirical analysis based on the panel data of 271 cities in China from 2011 to 2020 to explore the influence effect, heterogeneity and spatial spillover effect of digital finance on the development of green economy. The main conclusions are as follows:First, the regression shows that the development of digital finance has a significant positive impact on the efficiency of green economy. At the same time, the indicators of digital finance in many cities, the total index of digital finance and the efficiency of green economy have shown a steady upward trend, and the gap between the development levels of green economy efficiency in various regions of the country has narrowed year by year and tends to be balanced.Secondly, from the regression results of heterogeneity test, the positive effect of digital finance on the efficiency of green economy in the south is better than that in the north; The higher the development level of digital finance, the more significant the positive promotion of green economic efficiency, and the higher the resource allocation rate in high-level areas, which can better promote the efficiency of urban green economy, while the low-level areas limited by the late start of digital finance are lagging behind in this respect; The less the leading industries depend on natural resources, the more significant the positive impact of digital finance on the efficiency of green economy. The above research results also indirectly show that industrial transformation and upgrading, effective resource allocation and digital guidance play a major role in the impact of digital finance on the development of green economy.
Third, the development of digital finance in general, the region and neighboring regions can promote the efficiency of green economy in different dimensions. From the regression results of spatial Dobbin model, it can be seen that digital finance has a negative impact on the efficiency of green economy in this region, but it has significantly promoted the development of green economic efficiency in neighboring regions. On the whole, digital finance still promotes the efficiency of regional green economy. After further decomposing the green economic efficiency into pure technical efficiency and scale efficiency, it is found that the green economic efficiency driven by digital finance mainly affects other regions by improving pure technical efficiency; However, when the local digital finance forms a certain scale, the “siphon effect” will make it have a negative spillover effect on the green economic efficiency of the surrounding areas.
According to the research conclusions summarized above, specific policy suggestions are put forward as follows:
Pay attention to deepening the construction of digital infrastructure. All regions should continue to optimize the business environment of the digital economy, reduce the operating costs and market access threshold of enterprises, simplify the administrative examination and approval process, and improve the efficiency of government services, so as to expand the scale of digital financial infrastructure construction. At the same time, increase policy support for digital infrastructure, such as setting up a special fund for green technology research and development and achievement transformation, and guiding social capital to invest in the green economy through financial incentives such as tax relief and loan interest subsidies.
1.Formulate policies and guidelines for different regions to promote the coordinated development of regional digital finance and green economy efficiency. In view of the southern region and the region with a high degree of digital finance development, strengthen the supervision of its green financial market, standardize the business behavior of green finance, and ensure the effective operation of green funds. In view of the northern region and the low-level regions where the development of digital finance started late, we will actively guide financial capital to better serve the real economy and use digital finance to promote the integration of urban and rural industries. For areas where leading industries depend heavily on natural resources, the competitiveness and added value of traditional industries will be enhanced through technological transformation, merger and reorganization, and the deep integration of rural primary, secondary and tertiary industries will be promoted.
2.Financial institutions in cities should actively use the Internet and 5G technology to strengthen the publicity of green finance, encourage the public to actively participate in green financial investment and consumption activities, and form a good atmosphere for the whole society to jointly promote the development of green economy. Since the efficiency of green economy driven by digital finance mainly affects other regions by improving pure technical efficiency, technological innovation is an important way to improve pure technical efficiency. The government can promote the innovation and application of digital finance technology by increasing investment in scientific research and development. Secondly, enterprises should accelerate the pace of digital transformation, optimize production processes through digital management, intelligent manufacturing and other means, reduce energy consumption and emissions, and then improve the efficiency of green economy; Enterprises can jointly develop and apply digital financial technology through industrial consortia to realize resource sharing and complementary advantages, so as to improve technical efficiency. At the same time, regarding the siphon effect on the surrounding areas caused by the development of digital finance, corresponding policy guidance measures should be formulated to encourage digital finance enterprises to set up branches or R&D centers in the surrounding areas to promote regional coordinated development; By building a digital financial science and technology park, some digital financial business resources will be tilted to the surrounding areas; Establish a digital financial resource sharing platform, realize cross-regional sharing of information, technology and talents, and promote the scale efficiency of surrounding areas.
References
- Zhu, X. , Song, B., Ni, Y., Ren, Y., Li, R., Zhu, X.,... & Li, R. (2016). Digital finance—from traditional finance to digital and internet finance. Business Trends in the Digital Era: Evolution of Theories and Applications, 161-190.
- Gomber, P.; Koch, J.-A.; Siering, M. Digital Finance and FinTech: current research and future research directions. J. Bus. Econ. 2017, 87, 537–580. [Google Scholar] [CrossRef]
- Chen, Z.; Li, Y.; Wu, Y.; Luo, J. The transition from traditional banking to mobile internet finance: an organizational innovation perspective - a comparative study of Citibank and ICBC. Financial Innov. 2017, 3, 1–16. [Google Scholar] [CrossRef]
- Li, C.; Wang, Y.; Zhou, Z.; Wang, Z.; Mardani, A. Digital finance and enterprise financing constraints: Structural characteristics and mechanism identification. J. Bus. Res. 2023, 165. [Google Scholar] [CrossRef]
- Li, G.; Zhang, R.; Feng, S.; Wang, Y. Digital finance and sustainable development: Evidence from environmental inequality in China. Bus. Strat. Environ. 2022, 31, 3574–3594. [Google Scholar] [CrossRef]
- Claessens, S.; Glaessner, T.; Klingebiel, D. Electronic Finance: Reshaping the Financial Landscape Around the World. J. Financial Serv. Res. 2002, 22, 29–61. [Google Scholar] [CrossRef]
- Zhao, S.; Hao, D.; Yua, B. Digital trade and common prosperity: evidence from China Province. Cogent Econ. Finance 2025, 13. [Google Scholar] [CrossRef]
- Zhao, S.; Deng, H.; Cao, J.; Gustaf, M. Digital transformation of construction enterprises and carbon emission reduction: evidence from listed companies. Front. Environ. Sci. 2025, 13, 1570182. [Google Scholar] [CrossRef]
- Ketterer, J. A. (2017). Digital finance: New times, new challenges, new opportunities.
- Lin, L.-H.; Lin, F.-C.; Lien, C.-K.; Yang, T.-C.; Chuang, Y.-K.; Hsu, Y.-W. Electronic Payment Behaviors of Consumers under Digital Transformation in Finance—A Case Study of Third-Party Payments. J. Risk Financial Manag. 2023, 16, 346. [Google Scholar] [CrossRef]
- Zhu, X. , Song, B., Ni, Y., Ren, Y., Li, R., Zhu, X.,... & Li, R. (2016). Digital finance—from traditional finance to digital and internet finance. Business Trends in the Digital Era: Evolution of Theories and Applications, 161-190.
- Morgan, P.J. Fintech and Financial Inclusion in Southeast Asia and India. Asian Econ. Policy Rev. 2022, 17, 183–208. [Google Scholar] [CrossRef]
- Chorzempa, M.; Huang, Y. Chinese Fintech Innovation and Regulation. Asian Econ. Policy Rev. 2022, 17, 274–292. [Google Scholar] [CrossRef]
- Fang, F.; Ventre, C.; Basios, M.; Kanthan, L.; Martinez-Rego, D.; Wu, F.; Li, L. Cryptocurrency trading: a comprehensive survey. Financial Innov. 2022, 8, 1–59. [Google Scholar] [CrossRef]
- Bollaert, H.; Lopez-De-Silanes, F.; Schwienbacher, A. Fintech and access to finance. J. Corp. Finance 2021, 68. [Google Scholar] [CrossRef]
- Hendershott, T.; Zhang, X. (.; Zhao, J.L.; Zheng, Z.(. FinTech as a Game Changer: Overview of Research Frontiers. Inf. Syst. Res. 2021, 32, 1–17. [Google Scholar] [CrossRef]
- Loiseau, E.; Saikku, L.; Antikainen, R.; Droste, N.; Hansjürgens, B.; Pitkänen, K.; Leskinen, P.; Kuikman, P.; Thomsen, M. Green economy and related concepts: An overview. J. Clean. Prod. 2016, 139, 361–371. [Google Scholar] [CrossRef]
- Ghisellini, P.; Cialani, C.; Ulgiati, S. A Review on Circular Economy: The Expected Transition to a Balanced Interplay of Environmental and Economic Systems. J. Clean. Prod. 2016, 114, 11–32. [Google Scholar] [CrossRef]
- Beder, S. Environmental economics and ecological economics: the contribution of interdisciplinarity to understanding, influence and effectiveness. Environ. Conserv. 2011, 38, 140–150. [Google Scholar] [CrossRef]
- Mundaca, L.; Neij, L.; Worrell, E.; McNeil, M. Evaluating Energy Efficiency Policies with Energy-Economy Models. Annu. Rev. Environ. Resour. 2010, 35, 305–344. [Google Scholar] [CrossRef]
- Kozluk, T. , & Zipperer, V. (2014). Environmental policies and productivity growth-a critical review of empirical findings. OECD Journal. Economic Studies, 2014(1), 155.
- Loiseau, E.; Saikku, L.; Antikainen, R.; Droste, N.; Hansjürgens, B.; Pitkänen, K.; Leskinen, P.; Kuikman, P.; Thomsen, M. Green economy and related concepts: An overview. J. Clean. Prod. 2016, 139, 361–371. [Google Scholar] [CrossRef]
- Zuo, J.; Zhao, Z.-Y. Green building research–current status and future agenda: A review. Renew. Sustain. Energy Rev. 2014, 30, 271–281. [Google Scholar] [CrossRef]
- Bianzino, A. P. , Chaudet, C., Rossi, D., & Rougier, J. L. (2010). A survey of green networking research. IEEE Communications Surveys & Tutorials, 14(1), 3-20.
- Jelinek, M.; Smircich, L.; Hirsch, P. Introduction: A Code of Many Colors. Adm. Sci. Q. 1983, 28, 331. [Google Scholar] [CrossRef]
- Zhang, X. Green real estate development in China: State of art and prospect agenda—A review. Renew. Sustain. Energy Rev. 2015, 47, 1–13. [Google Scholar] [CrossRef]
- Liu, Y.; Dong, F. How technological innovation impacts urban green economy efficiency in emerging economies: A case study of 278 Chinese cities. Resour. Conserv. Recycl. 2021, 169. [Google Scholar] [CrossRef]
- Ma, L.; Long, H.; Chen, K.; Tu, S.; Zhang, Y.; Liao, L. Green growth efficiency of Chinese cities and its spatio-temporal pattern. Resour. Conserv. Recycl. 2019, 146, 441–451. [Google Scholar] [CrossRef]
- Shuai, S.; Fan, Z. Modeling the role of environmental regulations in regional green economy efficiency of China: Empirical evidence from super efficiency DEA-Tobit model. J. Environ. Manag. 2020, 261, 110227. [Google Scholar] [CrossRef]
- Li, J. , Chen, L., Chen, Y., & He, J. (2022). Digital economy, technological innovation, and green economic efficiency—Empirical evidence from 277 cities in China. Managerial and Decision Economics, 43(3), 616-629.
- Zhao, P.-J.; Zeng, L.-E.; Lu, H.-Y.; Zhou, Y.; Hu, H.-Y.; Wei, X.-Y. Green economic efficiency and its influencing factors in China from 2008 to 2017: Based on the super-SBM model with undesirable outputs and spatial Dubin model. Sci. Total. Environ. 2020, 741, 140026. [Google Scholar] [CrossRef] [PubMed]
- Lv, L.; Zhang, P. Unlocking green potential: How open government data enhances green economic efficiency in China? J. Environ. Manag. 2025, 380, 125043. [Google Scholar] [CrossRef] [PubMed]
- Zhou, K.; Li, Y. Carbon finance and carbon market in China: Progress and challenges. J. Clean. Prod. 2019, 214, 536–549. [Google Scholar] [CrossRef]
- Zhou, F.; Wang, X. The carbon emissions trading scheme and green technology innovation in China: A new structural economics perspective. Econ. Anal. Policy 2022, 74, 365–381. [Google Scholar] [CrossRef]
- Liu, L. , Chen, C., Zhao, Y., & Zhao, E. (2015). China׳ s carbon-emissions trading: Overview, challenges and future. Renewable and Sustainable Energy Reviews, 49, 254-266.
- Sun, L.-Y.; Miao, C.-L.; Yang, L. Ecological-economic efficiency evaluation of green technology innovation in strategic emerging industries based on entropy weighted TOPSIS method. Ecol. Indic. 2017, 73, 554–558. [Google Scholar] [CrossRef]
- Sun, X. Green city and regional environmental economic evaluation based on entropy method and GIS. Environ. Technol. Innov. 2021, 23. [Google Scholar] [CrossRef]
- Ma, X.-F.; Zhang, R.; Ruan, Y.-F. How to Evaluate the Level of Green Development Based on Entropy Weight TOPSIS: Evidence from China. Int. J. Environ. Res. Public Heal. 2023, 20, 1707. [Google Scholar] [CrossRef]
- Ouyang, X.; Wang, J.; Chen, X.; Zhao, X.; Ye, H.; Watson, A.E.; Wang, S. Applying a projection pursuit model for evaluation of ecological quality in Jiangxi Province, China. Ecol. Indic. 2021, 133. [Google Scholar] [CrossRef]
- Chang, L.; Mohsin, M.; Hasnaoui, A.; Taghizadeh-Hesary, F. Exploring carbon dioxide emissions forecasting in China: A policy-oriented perspective using projection pursuit regression and machine learning models. Technol. Forecast. Soc. Chang. 2023, 197. [Google Scholar] [CrossRef]
- Wang, C.-N.; Nguyen, T.T.-V.; Chiang, C.-C.; Le, H.-D. Evaluating renewable energy consumption efficiency and impact factors in Asia-pacific economic cooperation countries: A new approach of DEA with undesirable output model. Renew. Energy 2024, 227. [Google Scholar] [CrossRef]
- Liu, X.; Guo, P.; Guo, S. Assessing the eco-efficiency of a circular economy system in China's coal mining areas: Emergy and data envelopment analysis. J. Clean. Prod. 2019, 206, 1101–1109. [Google Scholar] [CrossRef]
- Lee, S. K. , Mogi, G., & Hui, K. S. (2013). A fuzzy analytic hierarchy process (AHP)/data envelopment analysis (DEA) hybrid model for efficiently allocating energy R& D resources: In the case of energy technologies against high oil prices. Renewable and Sustainable Energy Reviews, 21, 347-355.
- Mardani, A.; Zavadskas, E.K.; Streimikiene, D.; Jusoh, A.; Khoshnoudi, M. A comprehensive review of data envelopment analysis (DEA) approach in energy efficiency. Renew. Sustain. Energy Rev. 2017, 70, 1298–1322. [Google Scholar] [CrossRef]
- Wang, Y.; Li, X.; Kang, Y.; Chen, W.; Zhao, M.; Li, W. Analyzing the impact of urbanization quality on CO2 emissions: What can geographically weighted regression tell us? Renew. Sustain. Energy Rev. 2019, 104, 127–136. [Google Scholar] [CrossRef]
- Hwang, Y.K.; Díez, Á.S. Renewable energy transition and green growth nexus in Latin America. Renew. Sustain. Energy Rev. 2024, 198. [Google Scholar] [CrossRef]
- Zhang, N.; Zhou, P.; Kung, C.-C. Total-factor carbon emission performance of the Chinese transportation industry: A bootstrapped non-radial Malmquist index analysis. Renew. Sustain. Energy Rev. 2015, 41, 584–593. [Google Scholar] [CrossRef]
- Li, J.; Ho, M.S.; Xie, C.; Stern, N. China's flexibility challenge in achieving carbon neutrality by 2060. Renew. Sustain. Energy Rev. 2022, 158. [Google Scholar] [CrossRef]
- Xu, W.; Liu, S. Novel economic models for advancing urban energy management and transition: Simulation of urban energy system in digital twin. Sustain. Cities Soc. 2023, 101. [Google Scholar] [CrossRef]
- Liu, W.; Yang, X.; Zhang, J.; Wu, X.; Wan, L. The spatiotemporal evolution of the effect of industrial agglomeration on industrial green economic efficiency: empirical evidence from pollution-intensive industries in China. Environ. Dev. Sustain. 2023, 26, 9945–9972. [Google Scholar] [CrossRef]
- Yuan, W.; Li, J.; Meng, L.; Qin, X.; Qi, X. Measuring the area green efficiency and the influencing factors in urban agglomeration. J. Clean. Prod. 2019, 241. [Google Scholar] [CrossRef]
- Safi, A.; Kchouri, B.; Elgammal, W.; Nicolas, M.K.; Umar, M. Bridging the green gap: Do green finance and digital transformation influence sustainable development? Energy Econ. 2024, 134. [Google Scholar] [CrossRef]
- Li, G.; Zhang, R.; Feng, S.; Wang, Y. Digital finance and sustainable development: Evidence from environmental inequality in China. Bus. Strat. Environ. 2022, 31, 3574–3594. [Google Scholar] [CrossRef]
- Tian, Y. The heterogeneous dynamic effect of financial development and environmental regulation on Chinese urban green technology management efficiency. Environ. Sci. Pollut. Res. 2022, 29, 32032–32053. [Google Scholar] [CrossRef]
- Si, R.; Wang, Y.; Cao, M.; Wen, H. Does green technology innovation promote green economic growth? –Examining regional heterogeneity between resource-based and non-resource-based cities. Int. Rev. Econ. Finance 2024, 94. [Google Scholar] [CrossRef]
- Ding, J.; Liu, B.; Shao, X. Spatial effects of industrial synergistic agglomeration and regional green development efficiency: Evidence from China. Energy Econ. 2022, 112. [Google Scholar] [CrossRef]
Table 1.
Index System of Green Economic Efficiency.
| Indicator type | Primary index | Secondary index | unit |
| invest | Capital factor | Fixed capital stock | ten thousand yuan |
| Resource elements | Total energy consumption | Ten thousand tons of standard coal | |
| Labor elements | Number of employees | ten thousand people | |
| Output index | Expected output | real gdp | ten thousand yuan |
| Unexpected output | Industrial sulfur dioxide emission | Wan t | |
| Industrial smoke and dust emission | Wan t | ||
| Industrial wastewater discharge | Wan t |
Table 2.
Variable Selection.
| Variable type | variable | symbol | Measurement method |
| Explained variable | Green economic efficiency | Green economy index | |
| Explanatory variable | Digital finance | Digital financial index | |
| Control variable | opening up to the outside world | Proportion of foreign actual investment in GDP | |
| manpower capital | Proportion of students in colleges and universities to the total population of the region | ||
| social security | Number of hospital beds per capita | ||
| Financial development | Proportion of total loan surplus of financial institutions to GDP at the end of the year | ||
| infrastructure | Highway passenger volume | ||
| expenditure on education | Proportion of education expenditure to fiscal expenditure | ||
| Science and technology expenditure | Proportion of science and technology expenditure to fiscal expenditure | ||
| urbanization | Urbanization rate | ||
| Population aggregation | population density | ||
| fiscal expenditure | Percentage of general budget expenditure of local government to local GDP |
Table 4.
Global Moran Index.
| Development level of digital finance | Green economic efficiency | |||||
| age | I value | |||||
| 2011 | 0.095 | 18.412 | 0.000 | 0.068 | 13.362 | 0.000 |
| 2012 | 0.116 | 22.211 | 0.000 | 0.058 | 11.580 | 0.000 |
| 2013 | 0.116 | 22.239 | 0.000 | 0.044 | 8.968 | 0.000 |
| 2014 | 0.101 | 19.367 | 0.000 | 0.051 | 10.244 | 0.000 |
| 2015 | 0.108 | 20.736 | 0.000 | 0.060 | 11.857 | 0.000 |
| 2016 | 0.106 | 20.410 | 0.000 | 0.051 | 10.100 | 0.000 |
| 2017 | 0.124 | 23.704 | 0.000 | 0.061 | 12.078 | 0.000 |
| 2018 | 0.152 | 28.935 | 0.000 | 0.055 | 10.940 | 0.000 |
| 2019 | 0.158 | 29.968 | 0.000 | 0.063 | 12.413 | 0.000 |
| 2020 | 0.167 | 31.758 | 0.000 | 0.064 | 12.528 | 0.000 |
Table 7.
Regression Results of Endogenous Test.
| Variable name | ||
| First stage regression | Second stage regression | |
| -0.0908423*** (-6.58) |
||
| 0.03479588*** (12.91) |
||
| Control variable | control | control |
| Fixed time | Yes | Yes |
| Individual fixation | Yes | Yes |
| 2710 | 2710 | |
| 0.2738 | 0.1500 | |
| First stage statistics | 43.2568 |
Table 10.
Heterogeneity of Digital Finance Development Level.
| variable | (1) | (2) |
| High-level area | Low-level areas | |
| 0.0519*** (3.06) |
0.0339** (2.33) |
|
| Control variable | control | control |
| Fixed time | Yes | Yes |
| Individual fixation | Yes | Yes |
| 1355 | 1355 | |
| 37.96 | 17.25 | |
| 0.251 | 0.131 |
Table 12.
Regression Results of Spatial Dobbin Model.
| variable | Direct effect | Indirect effect | Total effect |
| -0.192*** | 3.033*** | 2.841*** | |
| (0.0447) | (1.014) | (1.011) | |
| Control variable | Yes | Yes | Yes |
| Time-fixed effect | Yes | Yes | Yes |
| Individual fixation effect | Yes | Yes | Yes |
| 2710 | 2710 | 2710 |
Table 13.
Spatial Effect Decomposition Regression Results.
| variable | Pure technical efficiency | Scale efficiency | ||||
| Direct effect | Indirect effect | Total effect | Direct effect | Indirect effect | Total effect | |
| -0.177** | 0.488*** | 0.311** | 0.401*** | -0.760*** | -0.358*** | |
| (0.0796) | (0.171) | (0.151) | (0.0690) | (0.137) | (0.121) | |
| Control variable | Yes | Yes | Yes | Yes | Yes | Yes |
| Time-fixed effect | Yes | Yes | Yes | Yes | Yes | Yes |
| Individual fixation effect | Yes | Yes | Yes | Yes | Yes | Yes |
| 2710 | 2710 | 2710 | 2710 | 2710 | 2710 | |
Table 14.
Robustness Test Results.
| variable | Green economic efficiency | ||||||||
| Excluding municipalities directly under the central government | Substitution space matrix | Tail shrinking treatment | |||||||
| direct effect |
indirect effect |
Total effect | direct effect |
indirect effect |
Total effect | direct effect |
indirect effect |
Total effect | |
| (1) | (2) | (3) | (4) | (5) | (6) | (7) | (8) | (9) | |
| -0.185 *** |
3.057 *** |
2.872 *** |
-0.195 *** |
0.286 *** |
0.0906 | -0.262 *** |
3.599 *** |
3.337 *** |
|
| (0.045) | (0.976) | (0.972) | (0.0485) | (0.0904) | (0.0825) | (0.0511) | (1.135) | (1.131) | |
| Control variable | control | control | control | control | control | control | control | control | control |
| Fixed time/region | Yes | Yes | Yes | Yes | Yes | Yes | Yes | Yes | Yes |
| observed value | 2670 | 2670 | 2670 | 2710 | 2710 | 2710 | 2710 | 2710 | 2710 |
| 0.008 | 0.008 | 0.008 | 0.181 | 0.181 | 0.181 | 0.008 | 0.008 | 0.008 | |
Disclaimer/Publisher’s Note: The statements, opinions and data contained in all publications are solely those of the individual author(s) and contributor(s) and not of MDPI and/or the editor(s). MDPI and/or the editor(s) disclaim responsibility for any injury to people or property resulting from any ideas, methods, instructions or products referred to in the content. |
© 2025 by the authors. Licensee MDPI, Basel, Switzerland. This article is an open access article distributed under the terms and conditions of the Creative Commons Attribution (CC BY) license (http://creativecommons.org/licenses/by/4.0/).
Copyright: This open access article is published under a Creative Commons CC BY 4.0 license, which permit the free download, distribution, and reuse, provided that the author and preprint are cited in any reuse.


