
Submitted:
24 April 2025
Posted:
24 April 2025
You are already at the latest version
Abstract
The study investigates the complex relationship between green development and digital finance, first emphasizing China and a subsequent extension to the G20 nations. Using qualitative and quantitative methods to examine provincial data from 2015 to 2023, the research shows how digital money may promote ecologically sustainable development. It highlights the importance of education, economic structure, research and development, and governmental initiatives in boosting the alignment between digital finance and sustainability while identifying regional variations and threshold effects. The interaction of digital finance with technological innovation, environmental protection, and energy transition policy across G20 nations was thoroughly analyzed, providing insightful viewpoints for sustainable development. The study’s quantitative analysis reveals that digital finance has a statistically significant positive impact on technological innovation and environmental sustainability in G20 economies. Empirical results indicate a 0.163% increase in green development for every 1% rise in digital finance adoption. Findings further highlight regional disparities, emphasizing the need for policy-driven financial inclusion strategies. In addition, the study offers practical suggestions for using digital finance to promote technological innovation, environmental preservation, and the creation of energy transition policies within the framework of the G20. Ultimately, the study emphasizes how urgent it is for stakeholders and governments to incorporate digital finance strategies with sustainable development goals, especially in light of international climate agreements, to create a more just, resilient, and ecologically sustainable future.
Keywords:
digital finance
; technological innovation
; environmental protection
; energy transition
Introduction
In a world where the urgency of ecological sustainability has never been more pronounced, the findings of this research serve as a clarion call for action. It represents a crucial global gathering where nations come together to address climate change challenges. By illuminating the transformative potential of digital finance in driving green growth, the study offers a roadmap toward a more sustainable future (Hillerbrand, 2018). It inspires us to reimagine the role of technology in addressing environmental challenges and underscores the power of innovation in forging a path toward sustainability. As we stand at the precipice of global climate agreements, this research ignites a fire within us (C. Zhao et al., 2024), urging governments, businesses, and individuals alike to seize the opportunity presented by digital finance to enact meaningful change. Let us harness the power of technology, embrace collaboration across borders (Nordin et al., 2024), and commit ourselves to integrating digital finance strategies with sustainable development agendas. Together, we can pave the way for a future that is not only prosperous and equitable but also in harmony with the delicate balance of our planet (Di Foggia & Beccarello, 2024).
Objectives of the Study
- To examine the impact of digital finance on environmental protection in G20 economies.
- To assess how digital finance contributes to energy transition policies and sustainable technological innovation.
- To identify key economic and policy factors that influence the relationship between digital finance and sustainability.
In the wake of China's unprecedented financial development over the past decade, which has captivated global interest, the imperative for sustainable development has become increasingly urgent (Deeney et al., 2021). China's former financial development model, characterized by short-term gains and excessive resource consumption leading to environmental degradation, is no longer sustainable. Consequently, there is a pressing need for a fundamental shift towards environmentally friendly and sustainable development pathways, not only in China but also in many other nations grappling with similar challenges. Simultaneously, the rise of digital finance has revolutionized economic landscapes across the globe, presenting unique opportunities to redefine traditional growth paradigms (Baruk & Goliszek, 2023). The convergence of sustainable development goals with the transformative potential of digital finance forms a nexus of inquiry with profound implications for global economies and environmental sustainability (Baczkiewicz & Watróbski, 2022).
Research embarks on a rigorous examination of this intricate relationship, employing a comprehensive methodology that integrates qualitative insights with quantitative analyses. Drawing from a diverse array of scholarly perspectives and empirical data, our study seeks to unravel the multifaceted impacts of digital finance on key domains such as Technological Innovation adoption, environmental conservation (Readiness, n.d.), and the formulation of robust energy transition policies within the dynamic context of G20 economies. Through an expansive dataset encompassing varied socio-economic contexts, regulatory landscapes, and technological infrastructures, we endeavor to elucidate the transformative potential of digital finance in driving sustainable energy transitions. Central to our findings is the recognition of digital finance as a linchpin for mobilizing capital towards Technological Innovation projects, nurturing innovation ecosystems (Schnabel, 2022), and facilitating the seamless flow of investments critical for acceler.
Research Question and Hypotheses
This study aims to address the following research questions:
How does digital finance contribute to environmental sustainability in G20 economies?
What is the relationship between digital finance and energy transition policies?
Does technological innovation mediate the impact of digital finance on green development?
Based on these questions, we propose the following hypotheses:
H1: Digital finance positively influences environmental sustainability in G20 economies.
H2: Digital finance significantly impacts energy transition policy adoption.
H3: Technological innovation acts as a mediator between digital finance and green development
ating the adoption of clean energy solutions Moreover, Research underscores the indispensable role of digital finance initiatives in environmental preservation endeavors. We highlight their capacity to mitigate carbon emissions, optimize resource allocation, and foster the widespread adoption of sustainable development practices (Ackermann et al., 2023), thereby contributing to global efforts to combat climate change. Furthermore, our study delves into the intricate interplay between digital finance and the formulation of energy transition policies, shedding light on synergies, challenges, and potential pathways for leveraging digital finance to expedite the transition toward low-carbon economies. Through a nuanced examination of regulatory frameworks, institutional mechanisms, and stakeholder engagements, we offer actionable recommendations for policymakers (Košnjek et al., 2024), financial institutions, and other stakeholders to harness the transformative potential of digital finance effectively. As G20 economies navigate the complexities of energy transition, underscore the imperative of integrating digital finance strategies into national energy policies and climate action plans. By harnessing the synergies between digitalization and Technological Innovation, countries can advance towards their emission reduction targets while fostering economic growth and resilience. In essence, our research seeks to enrich the ongoing discourse surrounding the role of digital finance in shaping the trajectory of sustainable energy transitions. By providing empirical evidence, theoretical insights, and pragmatic solutions, we aim to empower stakeholders to navigate the complexities of this evolving landscape, thereby fostering a more resilient, equitable, and environmentally sustainable future for G20 economies and beyond.
This research makes a significant contribution to our understanding of the intersection between digital finance and green growth, offering valuable insights for policymakers, practitioners, and researchers alike. By synthesizing qualitative and quantitative analyses of provincial data from China and extending its scope to the G20 economies, the study unveils the intricate relationship between digital finance and sustainability. The identification of regional disparities, threshold effects, and key influencing factors such as education, economic structure, and governmental interventions provides a nuanced understanding of the mechanisms through which digital finance can drive environmentally friendly progress. Moreover, by offering actionable recommendations for leveraging digital finance to spur Technological Innovation innovation, environmental protection, and energy transition policy formulation, the research equips stakeholders with practical strategies for advancing sustainability goals within the global framework. Ultimately, the study underscores the imperative for governments and stakeholders to integrate digital finance strategies into sustainable development agendas, thereby catalyzing a transition towards a more resilient, equitable, and environmentally sustainable future on a global scale. Effective energy transition policies are essential for harnessing the full potential of digital finance in advancing Technological Innovation innovation and environmental protection. Policymakers within G20 economies must prioritize the development of regulatory frameworks that promote the integration of digital finance into sustainable energy projects while safeguarding investor interests and maintaining financial stability. Furthermore, international cooperation and knowledge-sharing mechanisms, as exemplified, are crucial for harmonizing energy transition policies and accelerating global efforts towards a low-carbon future.
Literature Review
The intertwined dynamics of green growth are evident, where governmental support to state-owned enterprises (SOEs) for economic growth often conflicts with environmental objectives. This juxtaposition underscores a pivotal challenge (Effectiveness, n.d.): while striving for GDP targets, conventional heavy sectors reliant on natural resources exacerbate environmental degradation. Policymakers, scientists, activists, and stakeholders collaborate to negotiate and implement strategies aimed at mitigating climate change and promoting sustainable development. This discordance underscores the indirect impact on green growth, highlighting a need for alignment between strategy and execution (Ahmed et al., 2023).Conversely, the fusion of economics and digital technology, epitomized by digital finance, presents a transformative avenue. Digital finance, leveraging advanced technologies, offers unprecedented opportunities for sustainable economic development. From streamlining operations to reducing carbon footprints, its influence spans various facets, promoting innovation, clean energy adoption, and environmentally friendly investments (Chen et al., 2022).
The amalgamation of digital finance and sustainability catalyzes profound shifts across critical sectors worldwide. Recognized as a linchpin in driving progress, digital finance mobilizes capital for Technological Innovation projects and mitigates financing barriers, accelerating the transition towards sustainable energy solutions (Biagini et al., 2014). Moreover, its role extends to environmental preservation, fostering efficient resource management, and directing investments toward eco-friendly endeavors (Pinar, 2023). Delving deeper, scholarly inquiries explore the regulatory landscape and institutional dynamics, unraveling synergies and challenges for leveraging digital finance in shaping energy transition policies (Hossin et al., 2023).In essence, the synthesis of literature underscores the pivotal role of digital finance in steering sustainable development within G20 economies. From advancing Technological Innovation adoption to shaping policy frameworks, digital finance emerges as a catalyst for resilience and equity in fostering a greener future. The world has witnessed a gradual escalation in the severity and frequency of climate-related events. From extreme weather patterns to rising sea levels, the need for decisive action has never been more pressing. It builds upon the outcomes of previous conferences, aiming to accelerate progress toward meeting the objectives set forth in international agreements like the Paris Agreement. However, it calls for continued research to unlock its full potential and devise strategies for maximizing its positive impact on sustainable development goals (Aquilas & Atemnkeng, 2022).
The utilization of digital economics facilitates the progression of environmentally sustainable growth. The essence of green growth is rooted in the enduring viability of the atmosphere, which should also embrace the enhancement of social well-being, the improvement of human health, the promotion of employment, the effective utilization of resources, and the transformation of ingesting patterns (Tao et al., n.d.-b). The notion of green growth is intricately linked to human existence, encompassing the utilization of low-carbon, environmentally friendly energy sources such as energy, natural gas, and solar energy. It also involves the adoption of clean kitchen equipment and the promotion of eco-friendly modes of travel. Indeed, these are determined by the benchmark of consumption.
Furthermore, green growth includes:
The sustainable energy sector.
The advancement of new energy technologies.
The enforcement of pertinent environmental regulations.
This paper does not address the Clean Act or environmental restrictions. Instead, it concentrates on the well-being of consumers and the environmentally sustainable growth of businesses (C. Zhao et al., 2024).
As said before, the lack of access to electricity for communities not only hinders long-term economic development but also worsens the environmental atmosphere. Therefore, by alleviating energy deficiency amongst household occupants, we may enhance the educational and healthcare advantages for populaces and promote sustainable growth (Wątróbski et al., 2022). It is important to consider people's preferences and readiness to buy clean energy. However, the main obstacle to changing their energy consumption habits in developing nations is the low economic level of the population. Regarding this matter, inclusive finance is considered to be an effective approach for increasing the wealth of inhabitants. (Tao et al., n.d.-a) argue that inclusive finance in China promotes agrarian cover and creative loans for people with low incomes, addressing their financing needs for production and entrepreneurship.
Additionally, it aims to increase income by accumulating financial capital, thereby enhancing the affordability of clean energy for low-income individuals and supporting green development. Research has shown that the advancement of financial systems has a beneficial impact on diminishing energy poverty and facilitating the shift towards low-carbon practices (Richards et al., 2021). We assert that the key to achieving a low-carbon transition and alleviating family energy poverty is to enhance consumption capacity (Sun et al., n.d.). Furthermore, we contend that increasing levels of environmental awareness necessitate corresponding increases in social welfare. The achievement of green development is not feasible within a limited time frame, especially when it is disconnected from continuous economic expansion (Ahamed et al., 2024).
The development of the green economy is greatly aided by green credit, an essential component of green finance. Studies have demonstrated numerous benefits of green credit programs. These regulations provide greater credit resources to companies that prioritize eco-friendly efforts over those that contribute to pollution, and they reward environmentally detrimental organizations for adopting sustainable practices. Additionally, they help to reduce pollution in the manufacturing sector and motivate developing nations to transition to a more sustainable future, which in turn fosters maintainable financial growth (Erickson et al., 2015).This is mostly due to the influence of green credit regulations, which encourage commercial banks to lend money to businesses that place a high priority on environmental sustainability (Abdouli & Hammami, 2017) examine how China's green credit incentive affects output and well-being using an energetic stochastic general equilibrium (DSGE) model. The findings show that productivity, the situation, health, and utility welfare are significantly impacted by green credit depending on both quantity and price. These impacts foster a win-win relationship between production and the environment, helping to strengthen China's industrial structure in an environmentally sustainable manner. Numerous academics have studied inclusive finance, including (D. Zhao et al., 2021).They contend that inclusive financing can increase the efficacy of green economic growth by easing the credit constraints faced by companies that produce large amounts of pollution. The financial accelerator idea, first put forth by Bernanke and Gentler in 1989, states that a corporation's net assets will increase or decrease in response to positive or bad economic developments, amplifying the impact on the environment and the economy as a whole. Thus, in order to reduce economic volatility, it is imperative to thoroughly assess borrower data in order to alleviate the information imbalance generated by financial hurdles. Research indicates that advancements in technology enhance the effectiveness of firms in acquiring credit market data, hence reducing information asymmetry (NAIR, n.d.).
Digital finance, which symbolizes technological advancement and innovation, is the fusion of finance and technology. It not only increases the efficiency of loan distribution but also successfully lowers the risk of unethical behavior and information imbalance. Taking a more comprehensive view, digital finance can help stabilize green credit and provide funds to underfunded technology sectors. Additionally, it enhances resource utilization efficiency, fosters business innovation, and positively influences green growth (Fang, 2021)claimed that increasing the output of Technological Innovation while simultaneously reducing investment and financing volatility in Technological Innovation, as well as green credit, is essential to improving long-term environmental quality and fostering sustainable economic development.
Data and Method
Sample Data
Three main sources of information are used in this article. The initial data component uses macro characteristics specific to Chinese provinces to capture regional differences in economic development. The data's second component is made up of development indicators for digital finance (DGF). Ultimately, it serves as a platform for collective action and solidarity in the fight against the existential threat of climate change. The index system comprises 33 variables. (Luderer et al., 2016) offer a thorough evaluation of China's state of digital financial development. Green development indicators are covered in detail in the study's last section. Early studies frequently focused on a single measure, which hampered their ability to capture the concept of green development completely despite the fact that there are different interpretations of green development and techniques to evaluate it (“Handb. Green Financ.,” 2019). Green development is more than just environmental friendliness and growth together. According to the OECD's 2009 definition, it is a purposeful effort to attain economic growth and development through the effective management of environmental hazards and the guarantee of long-term, sustainable economic growth. This study employs the Super SBM model, which accounts for unexpected output, to evaluate China's degree of green development while taking into consideration the unique conditions of the nation. This study investigates the relationship between green development statistics and the digital financial development index using a sample of Chinese province panel data from 2015 to 2023. The WIND database and the China Statistical Yearbook are the primary sources of the data. Thirty provinces and municipalities had their data saved after the relevant provinces with missing data were removed. (Table 1) contains the descriptive statistics for the pertinent variables.
Selections of Variables and Their Definitions
Control Variables
The process of selecting control variables, particularly at the local level, is the main focus of this work. Openness, often known as skill honesty, is measured as the percentage of total imports and exports to the GDP of each province. The average default rate of commercial bank institutions within each province is used to calculate the commercial bank default rate (Default). This acts as a stand-in variable. Targets for reducing emissions, adoption of Technological Innovation (Ben Amar, 2021),climate finance, and adaptation plans. Delegates from all across the world gather to discuss and work together on ways to address climate change, with scientific evidence highlighting the need for immediate and drastic action. The fixed asset investment in each province is measured by the adjusted proportion of fixed asset investment (FIX_ratio). An increase in capital investment in fixed assets can improve a region's appeal to capital. The logarithmic form of the corresponding scale represents the yearly foreign direct investment (FDI) in each province. The ratio of value added in the third industry to value added in the second industry in each province serves as the indicator of the economic structure (Eco Structure). An increase in this ratio frequently denotes a shift in the economic landscape, which fosters innovation, the creation of jobs, and adjustments in consumer behavior. The percentage of people in each province's labor force who have completed high school or more determines the education level indicator (Education). Communication, environmental preservation, and innovation are all positively impacted by higher education. The amount of money invested in research and development in each province determines the innovation indicator (R&D).
Mechanism Variables
Consumption volatility (Consume) was calculated using the HP filtering approach to isolate the trend term from provincial consumption expenditure data. The volatility term that resulted was then used to measure consumption volatility. Similarly, the same methodology was used to evaluate the volatility of green credit (Credit) using provincial green credit expenditure data. The volatility term's absolute value effectively captures the range of green credit variability and consumption swings.
Dependent Variable
The Super Slacks-Based Measure (SBM) model evaluates the Green Development Indicators (Green_L). This model includes unfavorable outputs and thoroughly analyzes economic green development. The following outlines the process for choosing particular methods and related indicators:
The super SBM model created by adding undesirable outputs to the model is as follows, and it is based on Tone's (2001) work:

Table 2.
Provides a detailed explanation of the process used to select elements for the creation of green growth indicators.
Table 2.
Provides a detailed explanation of the process used to select elements for the creation of green growth indicators.
| Categories | Standard Metrics | Elements | |
| Input elements | Employed population at year-end | Labour | |
| Capital stocks at year-end | Capital | ||
| Total energy consumption at year-end | Energy | ||
| output elements | Real GDP at year-end | Economic output | |
| Industrial wastewater discharges Industrial exhaust emissions |
Dewatering | ||
| Emissions | |||
| Solid wastes | |||
Three sources provided the data used in this study: the "China Statistical Yearbook" (which covered the years 1998 to 2020), the "China Energy Statistical Yearbook," and the "China Environmental Statistical Yearbook." This study evaluates China's degree of green development between 1997 and 2019 using a sample of 30 provinces, cities, and autonomous areas from mainland China (Scrucca et al., 2023), excluding Tibet, to address the Tibetan region's data shortage. The eastern region has a higher index than the western and central regions. Furthermore, it is imperative to scrutinize if the impact of digital money on sustainable development differs based on specific components of sustainable development. This investigation will make it easier to formulate development policies that match accurately.
Testing of Model
We developed an econometric model to analyze the influence of digital economics on green growth in the following manner:
When analyzing how digital money affects green development, two important factors come into play. First, we need to discuss the idea of reverse causality. This implies that green development and digital finance are positively correlated, with new developments in green initiatives facilitating the development of digital financial infrastructure and increasing the uptake of digital finance (Hassan & Lee, 2015). This reciprocal connection characterizes reverse causality. Second, even though this study takes into account a number of control variables, it is still possible that unanticipated events will affect the results. If such situations are ignored, prejudice may be introduced. Three strategies are used to counteract this: replacing the primary explanatory factors, applying the double-difference method, and using dynamic panel system GMM and differential GMM estimates to prevent indigeneity coming from excluded variables. The goal of these techniques is to make the analysis more robust. Additionally, for thorough testing, the Difference-in-Differences (DID) model is employed, offering further insights into the relationship between digital finance and green development in various contexts:
If the advancement of digital economics mitigates variations, then the coefficients and should have negative values. Thus, equations (5) and (6) will determine if the advancement of digital banking may aid in promoting green growth by mitigating pertinent variations.
Results and Discussion
Benchmark Regression
Table 3) columns (1) through (5) provide a full breakdown of the estimations' outcomes. The development of digital banking holds the potential for advancing ecologically sustainable economic growth. Political forces heavily influence the results of COP-28. Some countries prioritize economic growth and development, while others push for strict controls and reductions in emissions. Achieving a cohesive approach toward climate resilience requires diplomatic finesse and compromise in order to balance these divergent objectives. At the 1% statistical level, the outcomes of a pooled regression analysis without control variables in Column (1) show a significantly positive coefficient of DGF. The coefficient of DGF shows a modest reduction in value, but it still stays considerably positive at the 1% level in Column (2), which incorporates all control factors and temporal effects. A panel fixed effects model with individual effect controls is presented in Column (3), which displays a statistically significant coefficient for the DGF variable. To compare results with the panel fixed effects regression, we also use Driscoll-Kraay standard error regressions and panel feasible generalized least squares (FGLS). The outcomes show that the DGF coefficients for each of these approaches are almost aligned. A 1% rise in DGF in Column (5) translates into a 0.163% expansion in green development, offering important new information about the connection between green economic growth and digital finance.
Our main concern with regard to the control factors was the outcomes shown in columns (3) through (5). The levels of statistical significance stayed mostly constant despite differences in the sizes of the coefficient values for each variable that we saw. Notably, our study revealed a negative relationship between green development and commercial bank default rates. Economic swings were exacerbated by commercial banks' adoption of a more conservative lending approach towards the real sector as a result of higher default rates. Furthermore, the predicted results for the following variables met our expectations: living environment (Park), education level (Education), economic structure (Eco Structure), external openness (Open), and phone number (phone number). This implies that advances in global trade and the spread of information from non-exporting industries support the development of technological innovation and human capital capabilities. In the context of the figure, the model is fit to the data points in order to determine the relationship between the DGF-FCLS, FDI, and some other variables (Figure 1).
Robustness Test Analysis
While digital banking has a big impact on green growth, it's important to remember that financial technology innovation can also affect green development. Growing green growth will probably mean more attention will be paid to financial technology innovation, which could lead to more advancements in this field. This raises the possibility of an indigeneity problem between the advancement of green growth and the monetary skill revolution. This section uses three techniques to handle potential indigeneity issues in econometric models: changing the control variables and green development level index to alternative variables (Chang et al., 2022) and then regressing the findings to reanalyze the benchmark data. Assessing the causal effects of policy changes pertaining to digital finance on the target variable through the application of the Difference-in-Differences (DID) model.
This research intends to create a meter for digital economic development strategies in order to assess their impact on green economic growth, given the well-established correlations among the expansion of the digital economy, digital finance, and the advancement of Technological Innovation. The study uses Python software to segment text on government job reports. It counts the frequency of terms related to the digital economy to determine how much help the government provides. This collection includes terms like big data, blockchain, cloud computing, smart manufacturing, smart cities, and more (Wei et al., 2021). The results of changing the explanatory factors and control variables in columns (1) and (2), respectively, while maintaining the same DGF coefficients, are shown in (Table 4). Taking into account the possible delayed effects of other policies on the development of the green economy, Column (3) shows the results following the inclusion of the digital economic policy variable. The study improves the analysis in Column (4) by adding a variable of one period behind digital economic policy. The data in (Table 4's) columns (3) and (4) show that, in keeping with the baseline regression results, digital financial development still has a positive effect on green economic growth even after taking into consideration factors related to digital economic policy. Green economic development benefits greatly from the lagged one-period effect of digital economic policy, which is statistically significant at the 1% level. Using a difference-in-differences model for estimate, the results from Column (5) show that the combined effect of temporal and regional dummy factors is represented by the interaction term Post*Treated, which has a coefficient of 0.094 that is statistically significant at the 1% level. This finding implies that the impact of digital finance on environmentally friendly growth in the central and western regions has greatly improved after the G20 High-level Principles for Digital Financial Inclusion were adopted.
Contributory Variable Regression Test
To address indigeneity-related difficulties, we use a variety of panel Generalized Method of Moments (GMM) methodologies in our study, such as 2-step GMM, dynamic panel difference GMM, and system GMM. We use two different kinds of instrumental variables to examine the impacts of digital finance. First of all, recognize that the growth of digital money is mostly due to Internet usage (Guan et al., 2023). We take into consideration province Internet penetration rates and provincial per capita postal services as instrumental variables since China's domestic mail service offers fixed telephone services that are closely related to network services. As an additional tool in our study, we use the mean value of digital finance from provinces other than our home province.
For estimation in columns (1) and (2), (Table 5) uses a two-step Generalized Method of Moments (GMM) technique. The results of the statistical analysis show that the instrumental variables passed the validity test with success. At the 1% level of statistical significance, the coefficient of DGF continues to be considerably positive. The involvement of civil society organizations and young people brings new energy and views to the COP-28 discussions. These stakeholders, who range from grassroots movements to creative projects, expect international leaders to take responsibility and decisive action to protect the environment for the coming generations. In order to somewhat alleviate indigeneity concerns, the dynamic panel model is also commonly estimated using the differential generalized method of moments (GMM) and systematic GMM, which incorporate lag terms of the explanatory variables. The results of the dynamic panel difference between the GMM and system GMM estimates are shown in columns (3) through (4). The panel Generalized Method of Moments (GMM) analysis results show that the initial regression results hold up well even after considering potential endogeneity issues. As a result, the study's hypothesis H11 has been verified.
The tool used in Column (2) is the mean value of digital finance in provinces other than our own. The difference between the GMM and system GMM estimates, respectively, is shown in Columns (3) to (4), along with Arellano-Bond tests to determine whether autocorrelation is absent in first-differenced errors. There is no significant autocorrelation, as shown by the p-values of the second-order autocorrelation test (AR (2)), which are 0.684 and 0.791, respectively. Additionally, passing the Sargan test attests to the legitimacy of the instrument. The results for the first lagged variable should be included.
Heterogeneity Test
Based on several stages of digital finance's expansion, this study observes changing links between digital finance and green development. This study divides the original sample into four intervals, representing each 25% quantile of the digital finance level. A further criterion for sample division is the average level of digital finance; numbers above the average represent a "high level of digital finance," while values below the average represent a "low level of digital finance. (Table 6's) subsample regressions reveal that digital finance's influence on green development is not statistically significant when its value is below the median. However, the coefficient of DGF is 0.619 and statistically significant at the 1% level when digital finance falls between the median and 75th percentile. These results are consistent with those from the sample that was above the 75th percentile.
Further segmenting the sample into Panel E and Panel F according to the DGF mean yields consistent findings from the quantile analysis. In particular, digital finance shows a strong and favorable impact on economic green development when the DGF exceeds the mean. This result emphasizes the presence of a threshold effect in the way digital finance influences the course of environmentally sound economic growth. This implies that, at less developed stages, digital finance would only partially capitalize on its advantages in terms of cost and technology.
This study conducted a regression analysis after classifying China's 30 provinces into the East, Central, and West primary economic zones in order to examine the regional factors. (Table 7) columns (1)– (3) present the results of the regression analysis for the eastern, western, and central regions. The results show that the degree of environmentally friendly growth is positively impacted by the development of digital banking in China's east and central regions. Digital money does not, however, statistically significantly affect green development in the Western region (Ge et al., 2023). These results imply that depending on the region, digital banking may have varying effects on green growth in China. Two elements can be considered as probable reasons for this variance: First, China's western regions have somewhat less developed initial resource allocation than its central and eastern provinces. China's geographical distribution is defined by rich economic zones in the east, less developed areas in the center region, and impoverished areas in the western region. This distribution was achieved due to the execution of reform and opening-up policies. The Western region is well behind in terms of infrastructural and financial advancement. In addition, the East Coast regions of China constitute the epicenter of digital finance, with the Western regions being located further inland and having relatively lesser levels of advancement in this area. As a result, digital banking has little effect on green growth in the West.
Table 7 displays the impact of digital finance sub-indices on green development in columns (4) through (6). The results show that green development is highly influenced by the degree of digitization and the breadth index of digital financial coverage. The coefficient of DGF_depth, however, shows no discernible change. The DGF_digital index emphasizes the cost and convenience of financial services when compared to conventional ways by primarily measuring the availability of digital financial support services. It emphasizes diversity and the application of financial technologies—like big data, blockchain, and cloud computing—to advance the digitization of financial infrastructure, boost market effectiveness, and encourage ecologically sustainable growth. However, the ability of digital financial services to reach a wide variety of customers is shown by the digital financial coverage breadth index (DGF_breadth). As a key weapon in the fight against climate change, technological innovation expands the reach of services to a wider range of recipients. The DGF_depth index highlights the relationship between the range of available digital financial goods and services and their actual demand by concentrating on the demand side of the industry. There is a clear correlation between this alignment and increased financial literacy. As a result, initiatives should focus on supporting sustainable economic growth, improving the relevance and purposefulness of financial services for consumers, and increasing public knowledge of financial and environmental issues.
Evaluation of the Mechanism
The assimilation of fintech into conventional banking has resulted in a significant expansion of the financial services portfolio, meeting the varied demands of both individuals and enterprises while expediting the digitization of financial information. China's overall objective of attaining sustainable development, which includes both environmental sustainability and economic resilience, is inextricably linked to its pursuit of green development. We use metrics of green credit volatility (Credit_v) and consumption volatility (Consume_v) to characterize shocks in the green financial sector and the economy. (Table 8's) columns (1) through (2) examine how digital finance might be used to lessen variations in consumption and green credit. The large impact of DGF on Consume_v and Credit_v is highlighted by the findings, which are significant at the 5% level (Chishti & Patel, 2023).These findings suggest that the expansion of digital finance may mitigate the volatility of consumption and green credit.
Additionally, we investigate how volatility affects green development in columns (3) through (4), using the green development index (Green_L) as the dependent variable and the volatility levels of green credit and consumption as predictors. The findings highlight the detrimental effects of Consume_v and Credit_v on green growth, implying that by reducing consumption and green credit fluctuations, the emergence of digital finance could support China's green development. Moreover, we rigorously examine the mechanism analysis using the 2-step GMM technique. The consistency of the results in columns (1)–(4) and (5)–(8) highlights how reliable the investigation's conclusions are. The mechanism analysis's conclusions hold and are trustworthy even after endogeneity has been taken into consideration, supporting hypotheses H12 and H13.
Considering the direct relationship among feasting, credit, and financial cycles, could digital economics have distinct impacts on these two variables as a result of alterations in traditional financial cycles? (Table 9) examines the influence of digital finance on the volatility of green credit in both the financial downturn and upturn cycles, as seen in columns (1) and (2) correspondingly (Arif et al., 2021). The findings indicate that the influence of digital finance on the volatility of green credit is negative throughout both periods of financial decline and growth. However, this impact is only statistically significant during the period of financial decline. During a financial downturn, conventional financial institutions typically restrict credit and increase credit requirements. This is not favorable for initiative bankrolling. However, digital finance can enhance the distribution of green credit resources by leveraging big data and low costs. This helps alleviate the limited availability of bank credit caused by information imbalances and minimizes the negative impact on green growth, as observed in old-style monetary downturns. On the other hand, during a period of financial growth, when lending policies are relaxed, the influence of digital finance on green credit needs to be clarified and, consequently, not substantial.
It is important to highlight that the negative impact of digital financial development on consumption fluctuation is considerable throughout periods of financial decline and growth. However, the influence of digital economics on consumption instability is more pronounced during economic slumps than during upturns. This implies that digital banking helps individuals better manage their consumption and financial decisions during economic downturns, leading to a decrease in the variability of their consumption patterns. In general, digital money has a notable impact on reducing volatility, especially during periods of financial depression.
Discussion
This study departs from earlier research, which mostly concentrated on the ways that corporate financing and technology innovation enable digital finance to be transmitted to green development. Rather, it looks into the viability of green development and shows how digital finance may successfully lower the volatility of green loans as well as consumption. Furthermore, by reducing the volatility of green lending and consumption, digital finance helps lessen swings in the green economy. Digital finance can lessen these swings because the volatility of green credit and consumption both significantly contribute to the overall volatility of the economy. This viewpoint reaffirms our earlier findings and highlights how digital finance both raises and lowers the degree of environmentally friendly development while offering key decision-makers a thorough foundation for formulating policies.
Furthermore, can digital finance offer greater benefits than traditional finance, given its capacity to support green development? Answering this question would support the study's conclusions and offer useful insights that would benefit decision-makers (Mastini et al., 2021). At the heart of the talks of COP-28 is the idea of climate justice and equity. Delegates stress the significance of justice and solidarity in climate action, acknowledging that underprivileged people suffer the brunt of climate impacts despite contributing the least to global emissions. Using the HP filtering technique, we measured the volatility of green development in each Chinese province by taking the absolute value of the green growth cycle term in Column (1) of (Table 10). With a significance threshold of 1%, the coefficient of DGF is extremely negative, as predicted.
Interestingly, we found that there was a negative association between the coefficients of traditional financial variables when we integrated various conventional financial measuring indicators. This finding suggests that conventional finance can only partially replace digital finance as a means of promoting environmentally responsible growth. In particular, conventional financial mechanisms hurt green development. They appear to say "ECO structure" and "Default education Figure 3. It also underscores the fact that there are other driving forces behind green development besides traditional financing.
Additional Examination
The shift to a green economy has become a crucial goal for governments and businesses globally in response to urgent global concerns, including climate change and environmental degradation. At the same time, digital finance is revolutionizing traditional financial systems by bringing simplicity, efficiency, and inclusivity to them. There is a complex and multifaceted relationship between digital finance and the expansion of the green economy (Ali et al., 2021). The application of digital finance in green economic models is encouraged by the correlation between higher education levels, a preference for sustainable development, and increased environmental awareness. Furthermore, the proficient use of digital financial tools requires a certain level of education and skill. Prior research has indicated a relationship between a country's higher educational attainment and lower carbon emissions.
Furthermore, economies that place a high priority on the service and high-technology industries are typically more open to incorporating digital money. It is projected that higher research and development (R&D) spending will hasten the creation of digital financial instruments that support the advancement of green economic growth. However, in order to fully take advantage of digital finance's potential benefits for green economic development, economies that rely mostly on industrial or unsustainable agriculture sectors could need more assistance. The effectiveness of digital financial technologies, especially when it comes to funding green initiatives, may be compromised by government actions, especially those related to fiscal policies, which can cause market inefficiencies and disturbances in the distribution of resources.
We will explore in more detail how government participation, economic structure, research and development (R&D), and educational attainment affect the relationship between digital finance and green economic growth in the following sections. In addition to advancing the use of digital finance in the growth of the green economy, this investigation seeks to provide policymakers with important information. Moreover, (Table 11's) Column (3) moderating effect is also positive. Column 4, however, shows that the moderating effect of governmental action is negative. Prioritizing economic structural transformation and augmenting technology research and development expenditures are crucial for policymakers to harness digital finance and advance the green economy. To prevent roadblocks to the green economy's sustainable development, they should also thoroughly review and modify their digital finance intervention plans.
At the 5% significance level, the relationship between digital finance and educational attainment is represented by the coefficient of DGF_Edu, which is statistically significant in the positive direction with respect to Column (1) of (Table 11). These findings imply that the relationship between digital finance and the growth of ecologically friendly economic development is positively impacted by higher educational attainment. Raising educational attainment improves financial literacy while also raising public understanding of sustainable development. The anticipated coefficients for the moderating effect of the economic structure are shown in (Table 11's) second Column. The association between digital finance and the green economy is positively influenced by economic structure, as indicated by the statistically significant coefficient for Eco structure at the 10% level.
Conclusion
Integrating digital finance, technological innovation, and green development creates a complex environment full of potential and problems, as evident from the insightful information presented in Conclusions 1 and 2. Combining these findings gives us a sophisticated picture of how technological innovation-driven digital finance may encourage environmentally friendly economic growth. Climate financing challenges persist, with wealthier nations being encouraged to keep promises to poor countries to offer financial support. Sufficient financing must be mobilized to support technology transfer, capacity development, and adaptation initiatives in vulnerable areas. Studies highlight how technology innovation and digital finance may drive environmentally friendly advancement in a revolutionary way, especially when considering China and the G20 economies. Using extensive examination of factual data, including province data from over ten years, we unveil the complex correlation between digital money and sustainability. Important factors, including economic structure, education, R&D, and government interventions, have become focus areas for stakeholders and policymakers looking to improve the interplay between the digital economy, technological innovation, and green development.
Furthermore, the results clarify the regional differences in the influence of digital finance on green development. The less developed western provinces provide particular chances and difficulties, although the eastern and central areas have greater degrees of influence. To fully realize the promise of digital banking in these areas, tailored regulations and focused actions are necessary to support the growth of infrastructure, financial literacy, and environmentally responsible consumer habits. Our study has led to policy suggestions that support a comprehensive strategy combining sustainable development goals with digital finance. Governments need to move quickly on regulatory measures to encourage the growth of the digital financial sector while reducing the risks involved. To fully use digital finance for green growth, the economy must be restructured, research and development must be funded, and innovation must be encouraged. Participants from the G20 economies came together to discuss creative solutions for the urgent problems of energy transition and climate change. The discussions focused on using digital finance to overcome obstacles that prevent the adoption of technological innovation, such as market fragmentation, regulatory uncertainty, and capital availability.
It is recommended that financial institutions, businesses, and professionals use digital finance technologies and platforms to maximize the efficiency of green lending programs and reduce investment risks. Organizations may customize methods to optimize effect and guarantee long-term sustainability by recognizing regional differences and keeping up with digital finance developments. Ultimately, the path to sustainable development has to be resilient, inclusive, and entwined with economic growth. Research provides China with valuable insights and acts as a lighthouse for other countries undergoing digital and economic transition. Acknowledging the mutually beneficial connection between digital finance and green development, we can create a path toward a more ecologically sustainable, fair, and resilient future worldwide.
Ethics approval/declaration
Not applicable.
Consent to participate
Not applicable.
Consent for publication
Not applicable.
Acknowledgment
Not applicable.
Conflict of interest
The authors declare no conflict of interest.
Data availability
Data will be available upon reasonable request from corresponding author.
Authors contribution
Write here.
References
- Abdouli, M.; Hammami, S. The Impact of FDI Inflows and Environmental Quality on Economic Growth: an Empirical Study for the MENA Countries. Journal of the Knowledge Economy 2017, 8, 254–278. [Google Scholar] [CrossRef]
- Ahamed, S.; Galford, G.L.; Panikkar, B.; Rizzo, D.; Stephens, J.C. Carbon collusion: Cooperation, competition, and climate obstruction in the global oil and gas extraction network. Energy Policy 2024, 190. [Google Scholar] [CrossRef]
- Ahmed, R.; Chen, X.H.; Kumpamool, C.; Nguyen, D.T.K. Inflation, oil prices, and economic activity in recent crisis: Evidence from the UK. Energy Economics 2023, 126. [Google Scholar] [CrossRef]
- Ali, E.B.; Anufriev, V.P.; Amfo, B. Green economy implementation in Ghana as a road map for a sustainable development drive: a review. Scientific African 2021, 12. [Google Scholar] [CrossRef]
- Aquilas, N.A.; Atemnkeng, J.T. Climate-related development finance and renewable energy consumption in greenhouse gas emissions reduction in the Congo basin. Energy Strategy Reviews 2022, 44. [Google Scholar] [CrossRef]
- Arif, M.; Hasan, M.; Alawi, S.M.; Naeem, M.A. COVID-19 and time-frequency connectedness between green and conventional financial markets. Global Finance Journal 2021, 49. [Google Scholar] [CrossRef]
- Baczkiewicz, A.; Watróbski, J. Multi-Criteria Temporal Assessment of Afordable and Clean Energy Systems in European Countries Using the DARIA-TOPSIS Method. Procedia Computer Science 2022, 207, 4442–4453. [Google Scholar] [CrossRef]
- Baruk, A.I.; Goliszek, A. The ways of interpreting green energy by young Polish individual recipients vs. their gender. Energy Strategy Reviews 2023, 50. [Google Scholar] [CrossRef]
- Ben Amar, A. (2021). Economic growth and environment in the United Kingdom: robust evidence using more than 250 years data. In Environmental Economics and Policy Studies (Vol. 23, Issue 4, pp. 667–681). [CrossRef]
- Biagini, B.; Bierbaum, R.; Stults, M.; Dobardzic, S.; McNeeley, S.M. A typology of adaptation actions: A global look at climate adaptation actions financed through the Global Environment Facility. Global Environmental Change 2014, 25, 97–108. [Google Scholar] [CrossRef]
- Chen, C.; Pinar, M.; Stengos, T. Renewable energy and CO2 emissions: New evidence with the panel threshold model. Renewable Energy 2022, 194, 117–128. [Google Scholar] [CrossRef]
- Chishti, M.Z.; Patel, R. Breaking the climate deadlock: Leveraging the effects of natural resources on climate technologies to achieve COP26 targets. Resources Policy 2023, 82. [Google Scholar] [CrossRef]
- Deeney, P.; Nagle, A.J.; Gough, F.; Lemmertz, H.; Delaney, E.L.; McKinley, J.M.; Graham, C.; Leahy, P.G.; Dunphy, N.P.; Mullally, G. End-of-Life alternatives for wind turbine blades: Sustainability Indices based on the UN sustainable development goals. Resources, Conservation and Recycling 2021, 171. [Google Scholar] [CrossRef]
- Di Foggia, G.; Beccarello, M. European roadmaps to achieving 2030 renewable energy targets. Utilities Policy 2024, 88, 101729. [Google Scholar] [CrossRef]
- Effectiveness, G. (n.d.). Heliyon Evaluating the Effects of Renewable Energy , Government Effectiveness , Digitalization , and Sustainable Mineral Policy Management on Russia ’ s Economic Well-Being.
- Erickson, P.; Kartha, S.; Lazarus, M.; Tempest, K. Assessing carbon lock-in. Environmental Research Letters 2015, 10. [Google Scholar] [CrossRef]
- Fang, Y. Influence of foreign direct investment from China on achieving the 2030 Sustainable Development Goals in African countries. Chinese Journal of Population Resources and Environment 2021, 19, 213–220. [Google Scholar] [CrossRef]
- Ge, P.; Liu, T.; Huang, X. The effects and drivers of green financial reform in promoting environmentally-biased technological progress. Journal of Environmental Management 2023, 339. [Google Scholar] [CrossRef]
- Guan, L.; Li, W.; Guo, C.; Huang, J. Environmental strategy for sustainable development: Role of digital transformation in China’s natural resource exploitation. Resources Policy 2023, 87. [Google Scholar] [CrossRef]
- Handbook of Green Finance. (2019). Handbook of Green Finance. [CrossRef]
- Hassan, A.M.; Lee, H. The paradox of the sustainable city: definitions and examples. Environment, Development and Sustainability 2015, 17, 1267–1285. [Google Scholar] [CrossRef]
- Hillerbrand, R. Why affordable clean energy is not enough. A capability perspective on the sustainable development goals. Sustainability (Switzerland) 2018, 10. [Google Scholar] [CrossRef]
- Hossin, M.A.; Alemzero, D.; Wang, R.; Kamruzzaman, M.M.; Mhlanga, M.N. Examining artificial intelligence and energy efficiency in the MENA region: The dual approach of DEA and SFA. Energy Reports 2023, 9, 4984–4994. [Google Scholar] [CrossRef]
- Luderer, G.; Bertram, C.; Calvin, K.; De Cian, E.; Kriegler, E. Implications of weak near-term climate policies on long-term mitigation pathways. Climatic Change 2016, 136, 127–140. [Google Scholar] [CrossRef]
- Mastini, R.; Kallis, G.; Hickel, J. A Green New Deal without growth? Ecological Economics 2021, 179. [Google Scholar] [CrossRef]
- Nordin, I.; Elofsson, K.; Jansson, T. Cost-effective reductions in greenhouse gas emissions: Reducing fuel consumption or replacing fossil fuels with biofuels. Energy Policy 2024, 190, 114138. [Google Scholar] [CrossRef]
- Pinar, M. Green aid, aid fragmentation and carbon emissions. Science of the Total Environment 2023, 870. [Google Scholar] [CrossRef] [PubMed]
- Readiness, F.S. (n.d.). Heliyon Strategies for Financing Natural Resource Efficiency : Enhancing Green Floating Bonds and Financial Sector Readiness.
- Richards, C.E.; Lupton, R.C.; Allwood, J.M. Re-framing the threat of global warming: an empirical causal loop diagram of climate change, food insecurity and societal collapse. Climatic Change 2021, 164. [Google Scholar] [CrossRef]
- Schnabel, I. (2022). Finding the right mix : monetary-fiscal interaction at times of high inflation Isabel Schnabel , Member of the ECB ’ s Executive Board Keynote speech at Bank of England Watchers ’ Conference Rubric. November.
- Scrucca, F.; Ingrao, C.; Barberio, G.; Matarazzo, A.; Lagioia, G. On the role of sustainable buildings in achieving the 2030 UN sustainable development goals. Environmental Impact Assessment Review 2023, 100. [Google Scholar] [CrossRef]
- Sun, H.; Shen, Z.; Shen, Z.; Sun, H.; Iqbal, N.; Mohsin, M. (n.d.). Resources Policy Unlocking Market Dynamics : The Impact of Carbon Taxation on Digital Strategies and Energy Efficiency in Natural Resource Management under Digital Government.
- Tao, Q.; Tao, Q.; Tao, Q.; Haroon, M. (n.d.-a). Heliyon Enhancing Financial Development for Sustainable Resource Efficiency : Cultivating Green Growth in Natural Resource Markets QiangTao made substantial contributions to this research project and writing of the paper . He was.
- Tao Tao, Q.; Tao, Q.; Haroon, M. (n.d.-b). Heliyon Enhancing Financial Development for Sustainable Resource Efficiency : Cultivating Green Growth in Natural Resource Markets QiangTao made substantial contributions to this research project and writing of the paper . He was.
- Wątróbski, J.; Bączkiewicz, A.; Sałabun, W. pyrepo-mcda — Reference objects based MCDA software package. SoftwareX 2022, 19. [Google Scholar] [CrossRef]
- Zhao, C.; Dong, K.; Wang, K.; Nepal, R. How does artificial intelligence promote renewable energy development? The role of climate finance. Energy Economics 2024, 133, 107493. [Google Scholar] [CrossRef]
- Zhao, D.; Liu, J.; Sun, L.; Ye, B.; Hubacek, K.; Feng, K.; Varis, O. Quantifying economic-social-environmental trade-offs and synergies of water-supply constraints: An application to the capital region of China. Water Research 2021, 195. [Google Scholar] [CrossRef]
Figure 1.
The relation between DGF and FGLS with change in FDI.
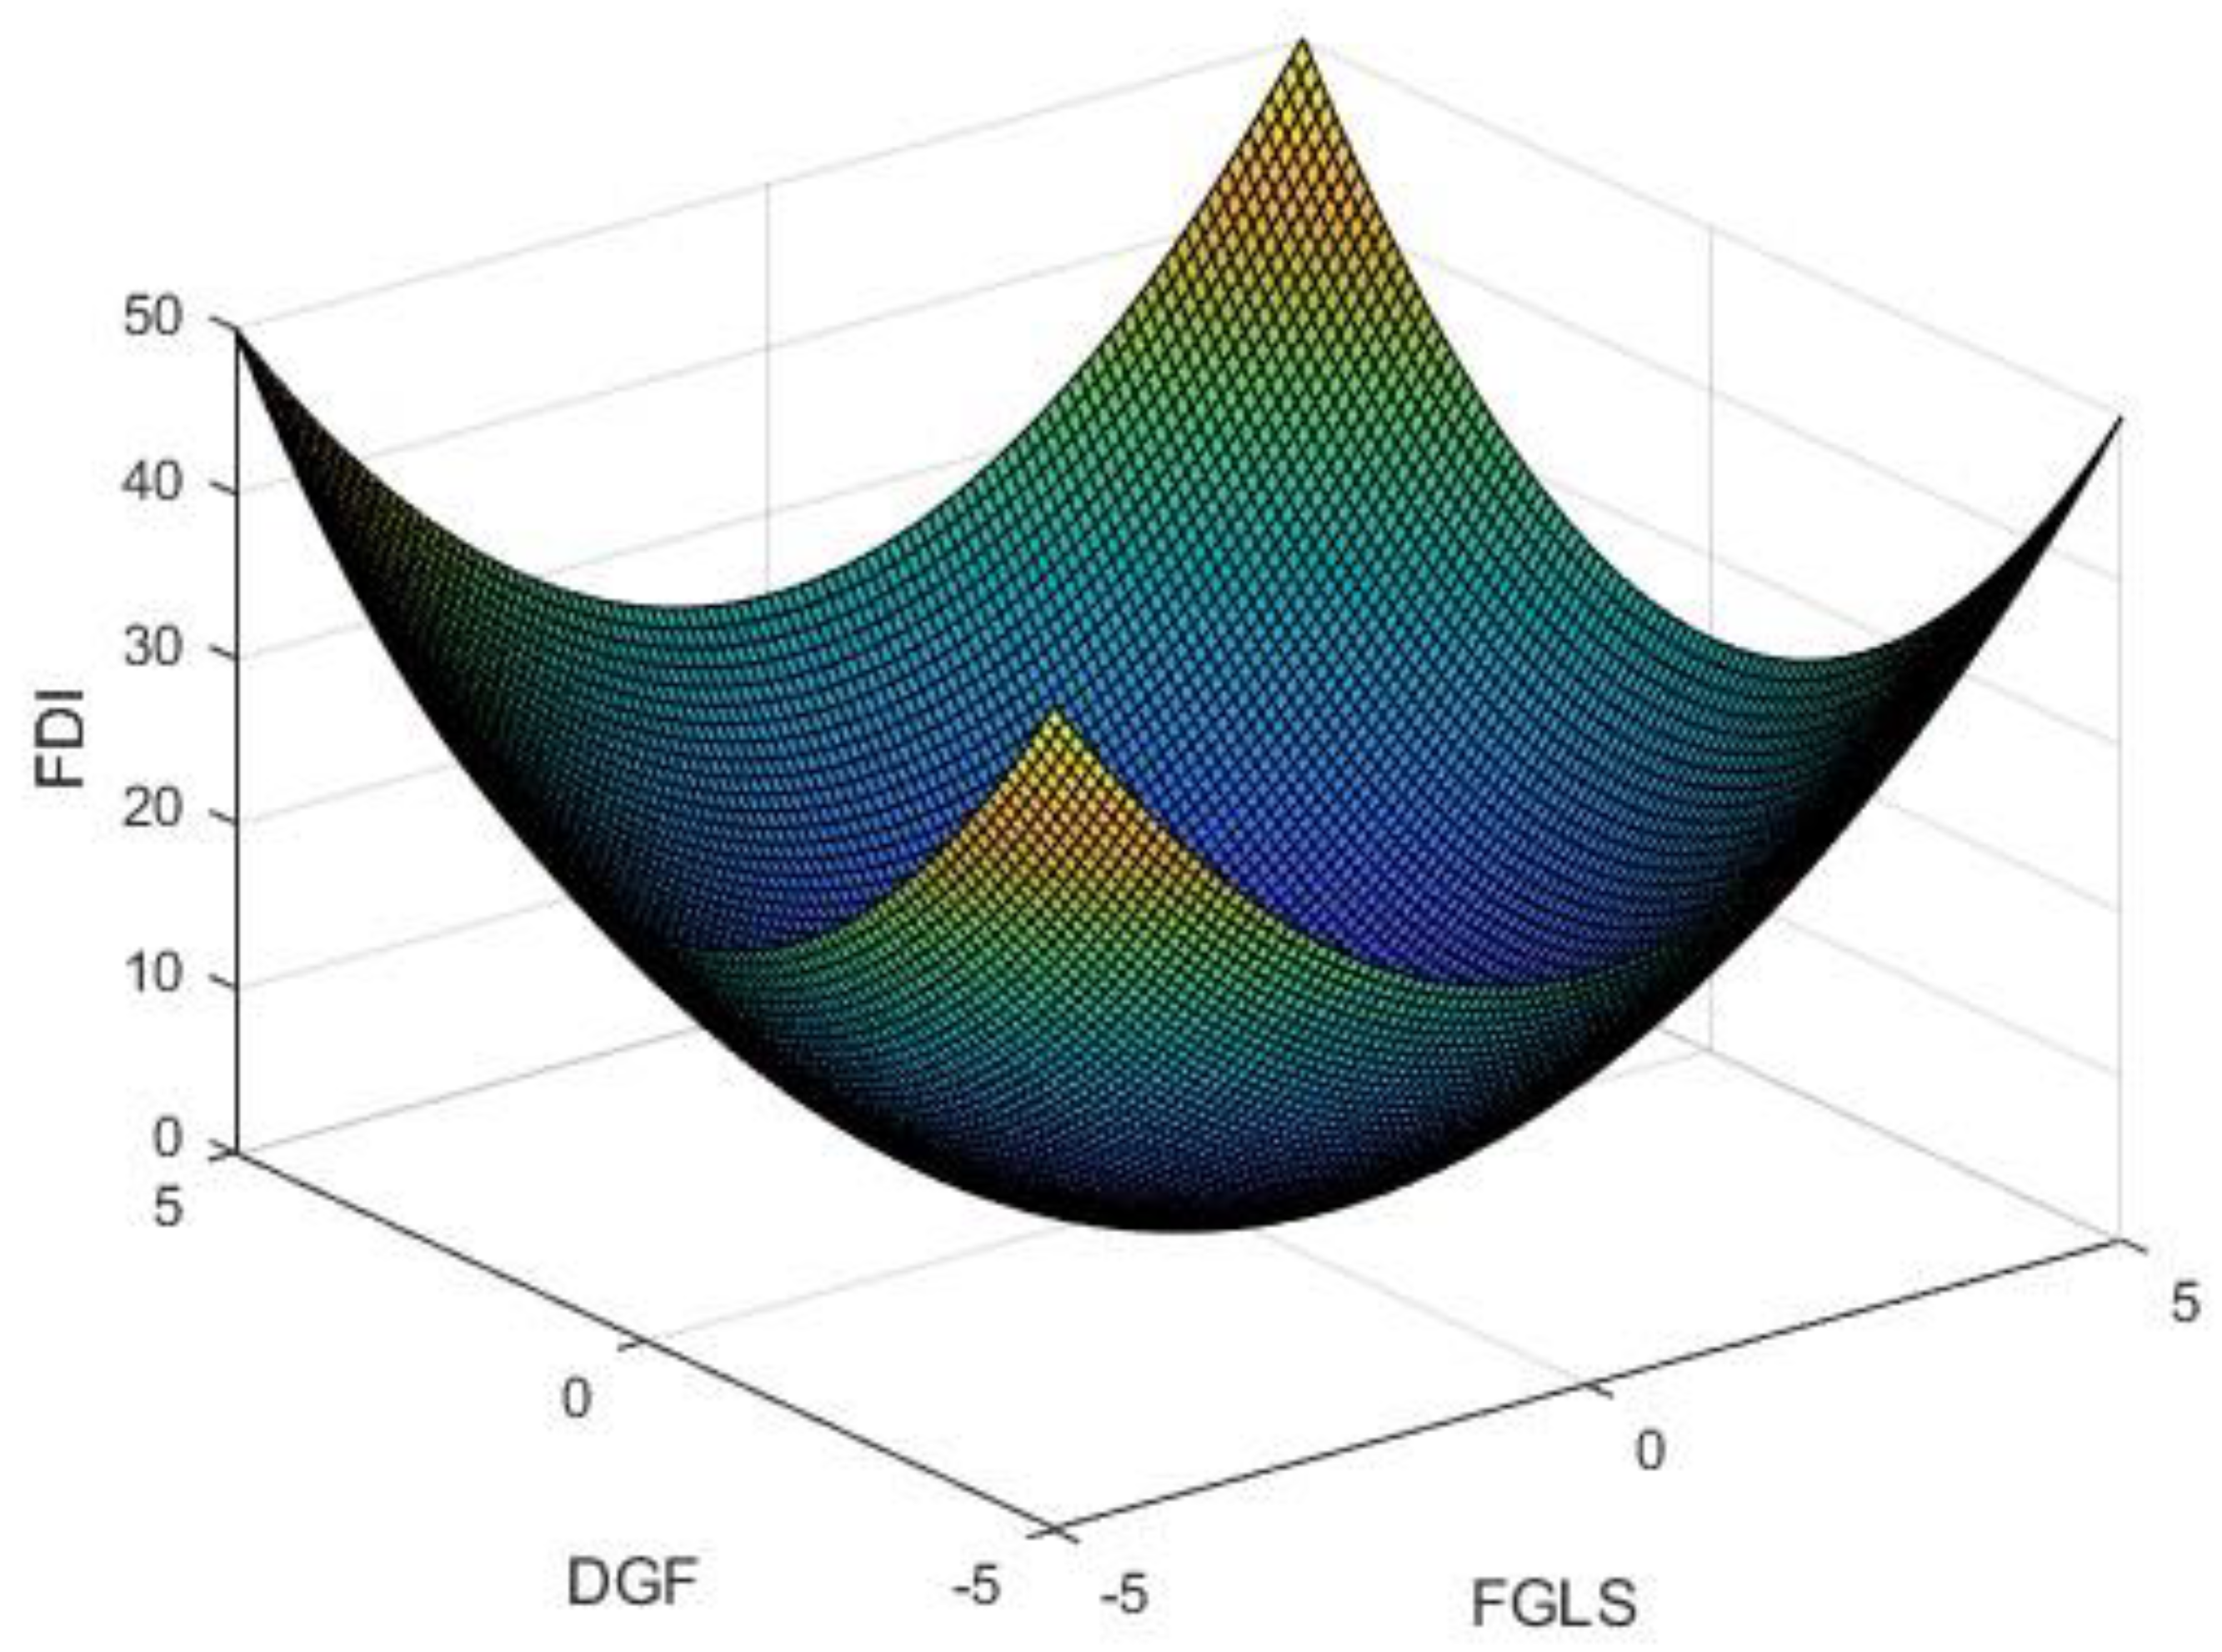
Figure 2.
The difference between the GMM and system GMM estimates.
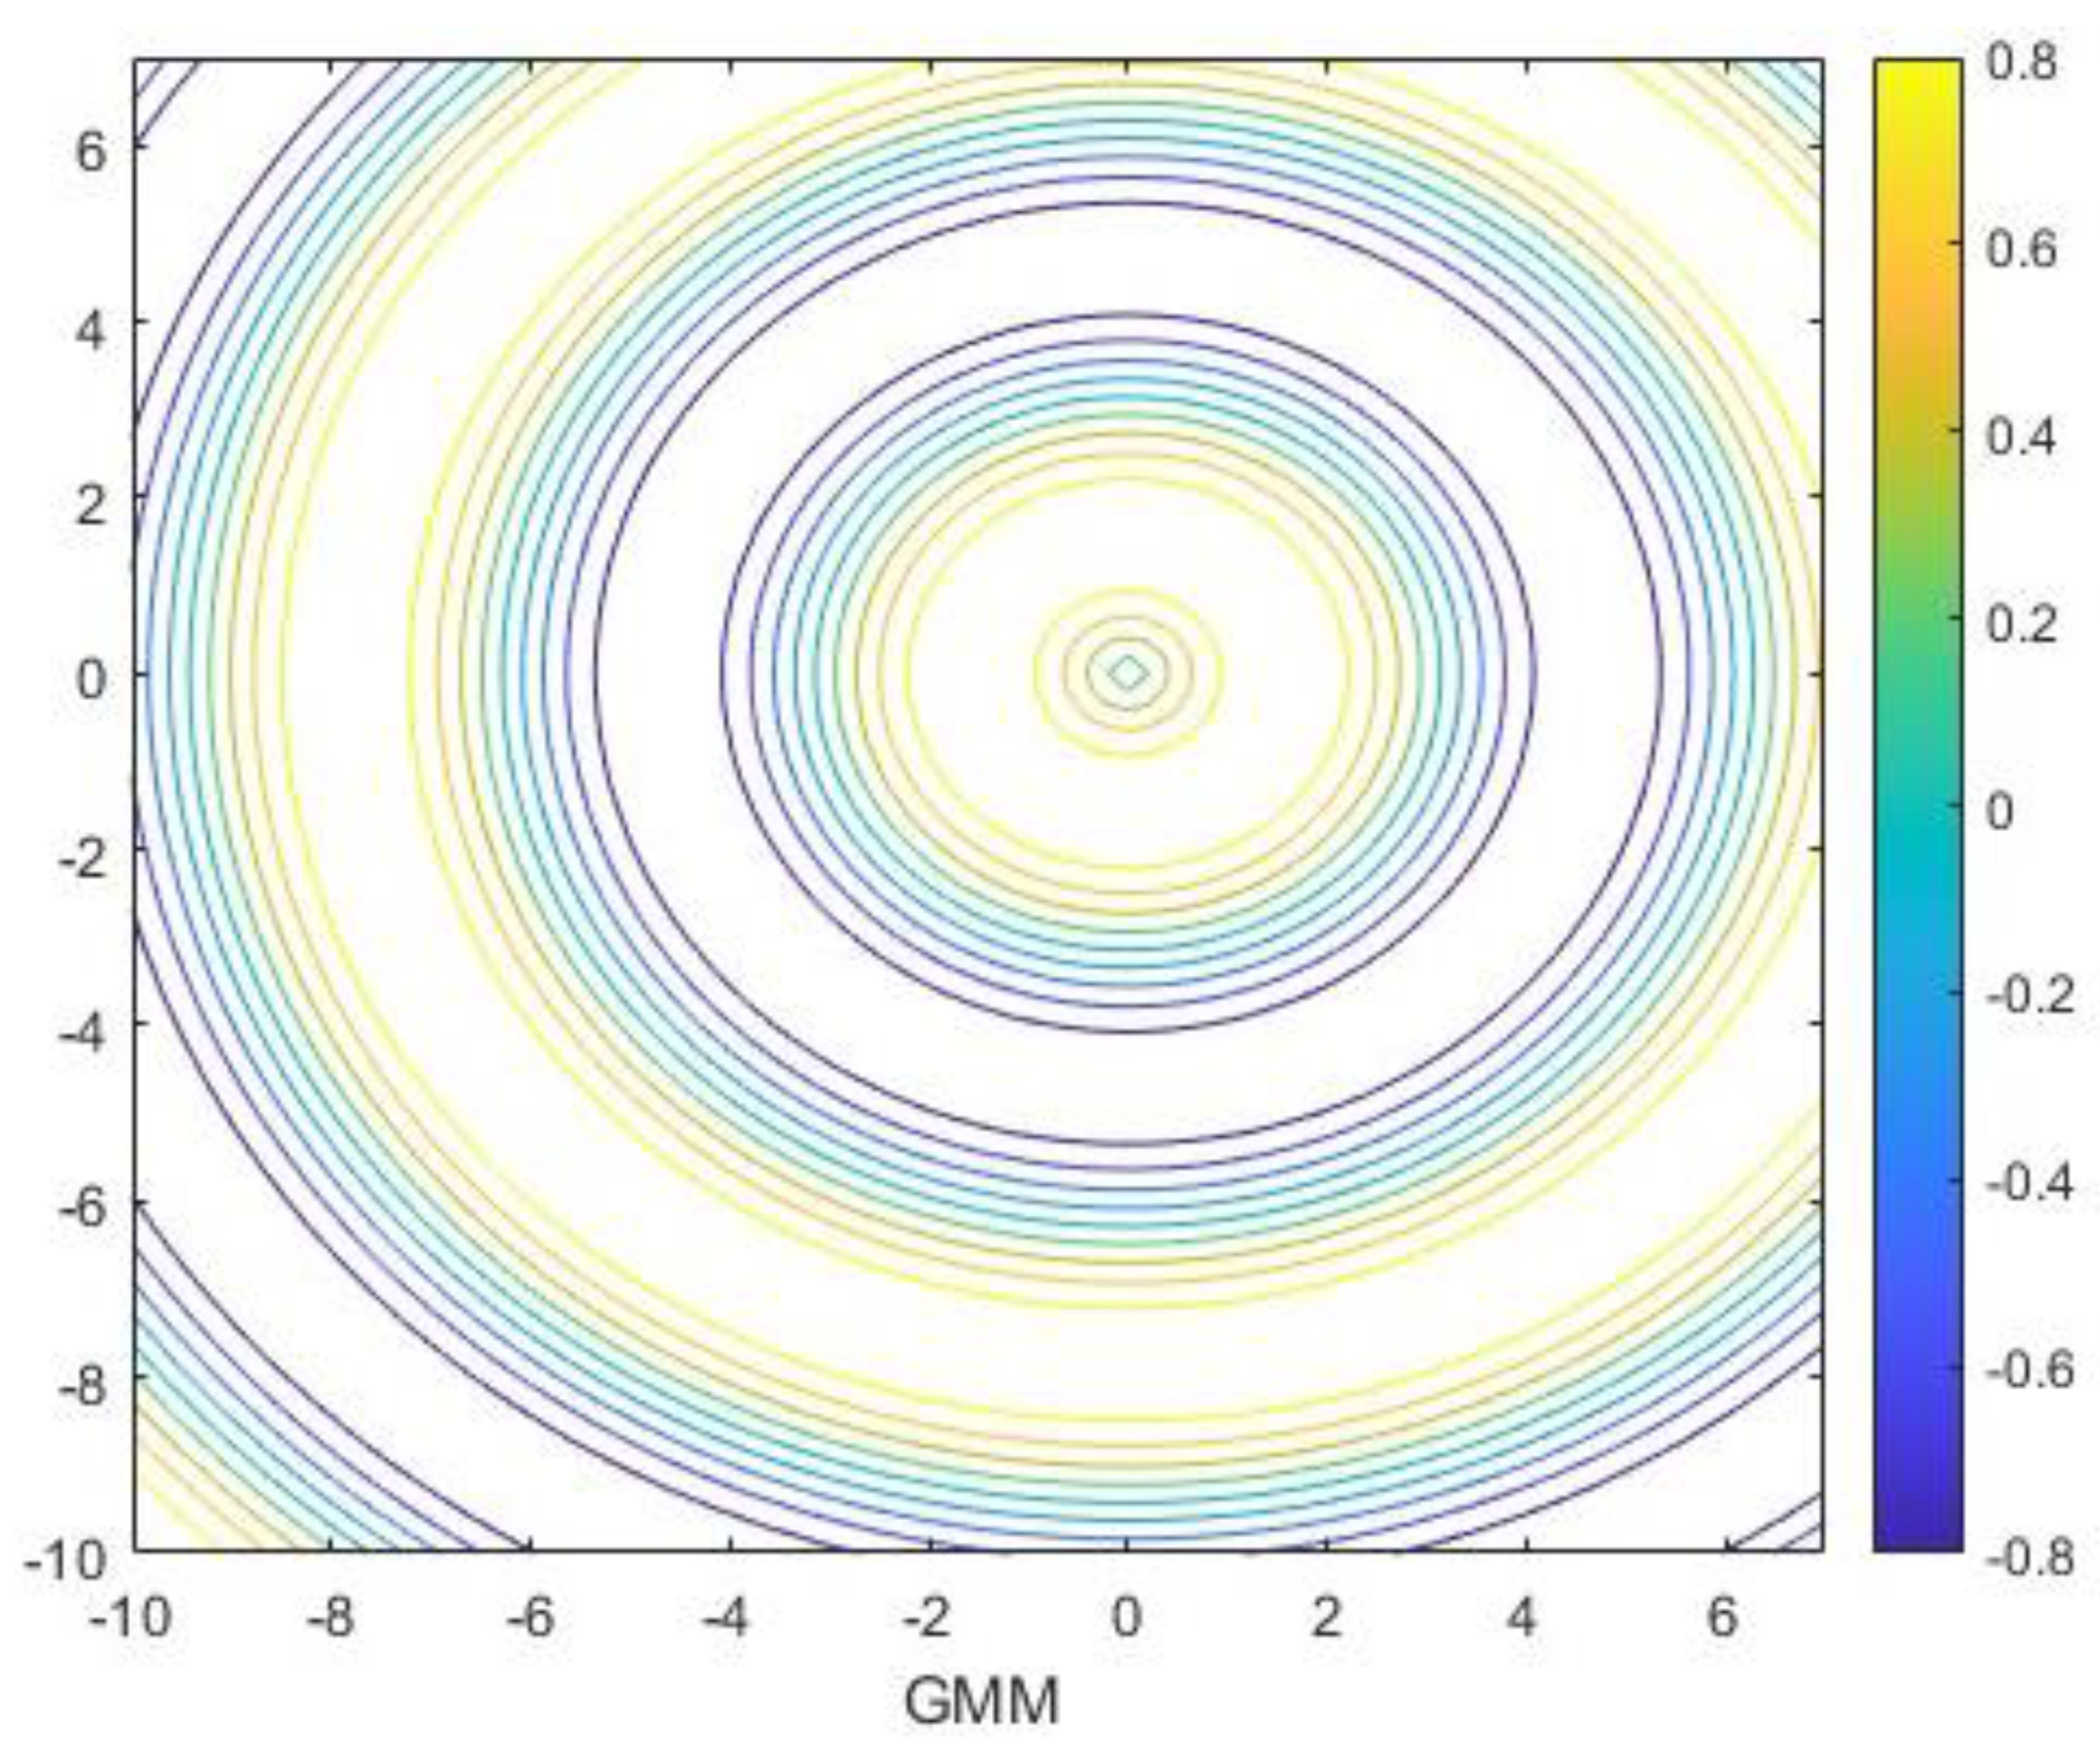
Figure 3.
The coefficients of independent variables in the panel Eco-structure.
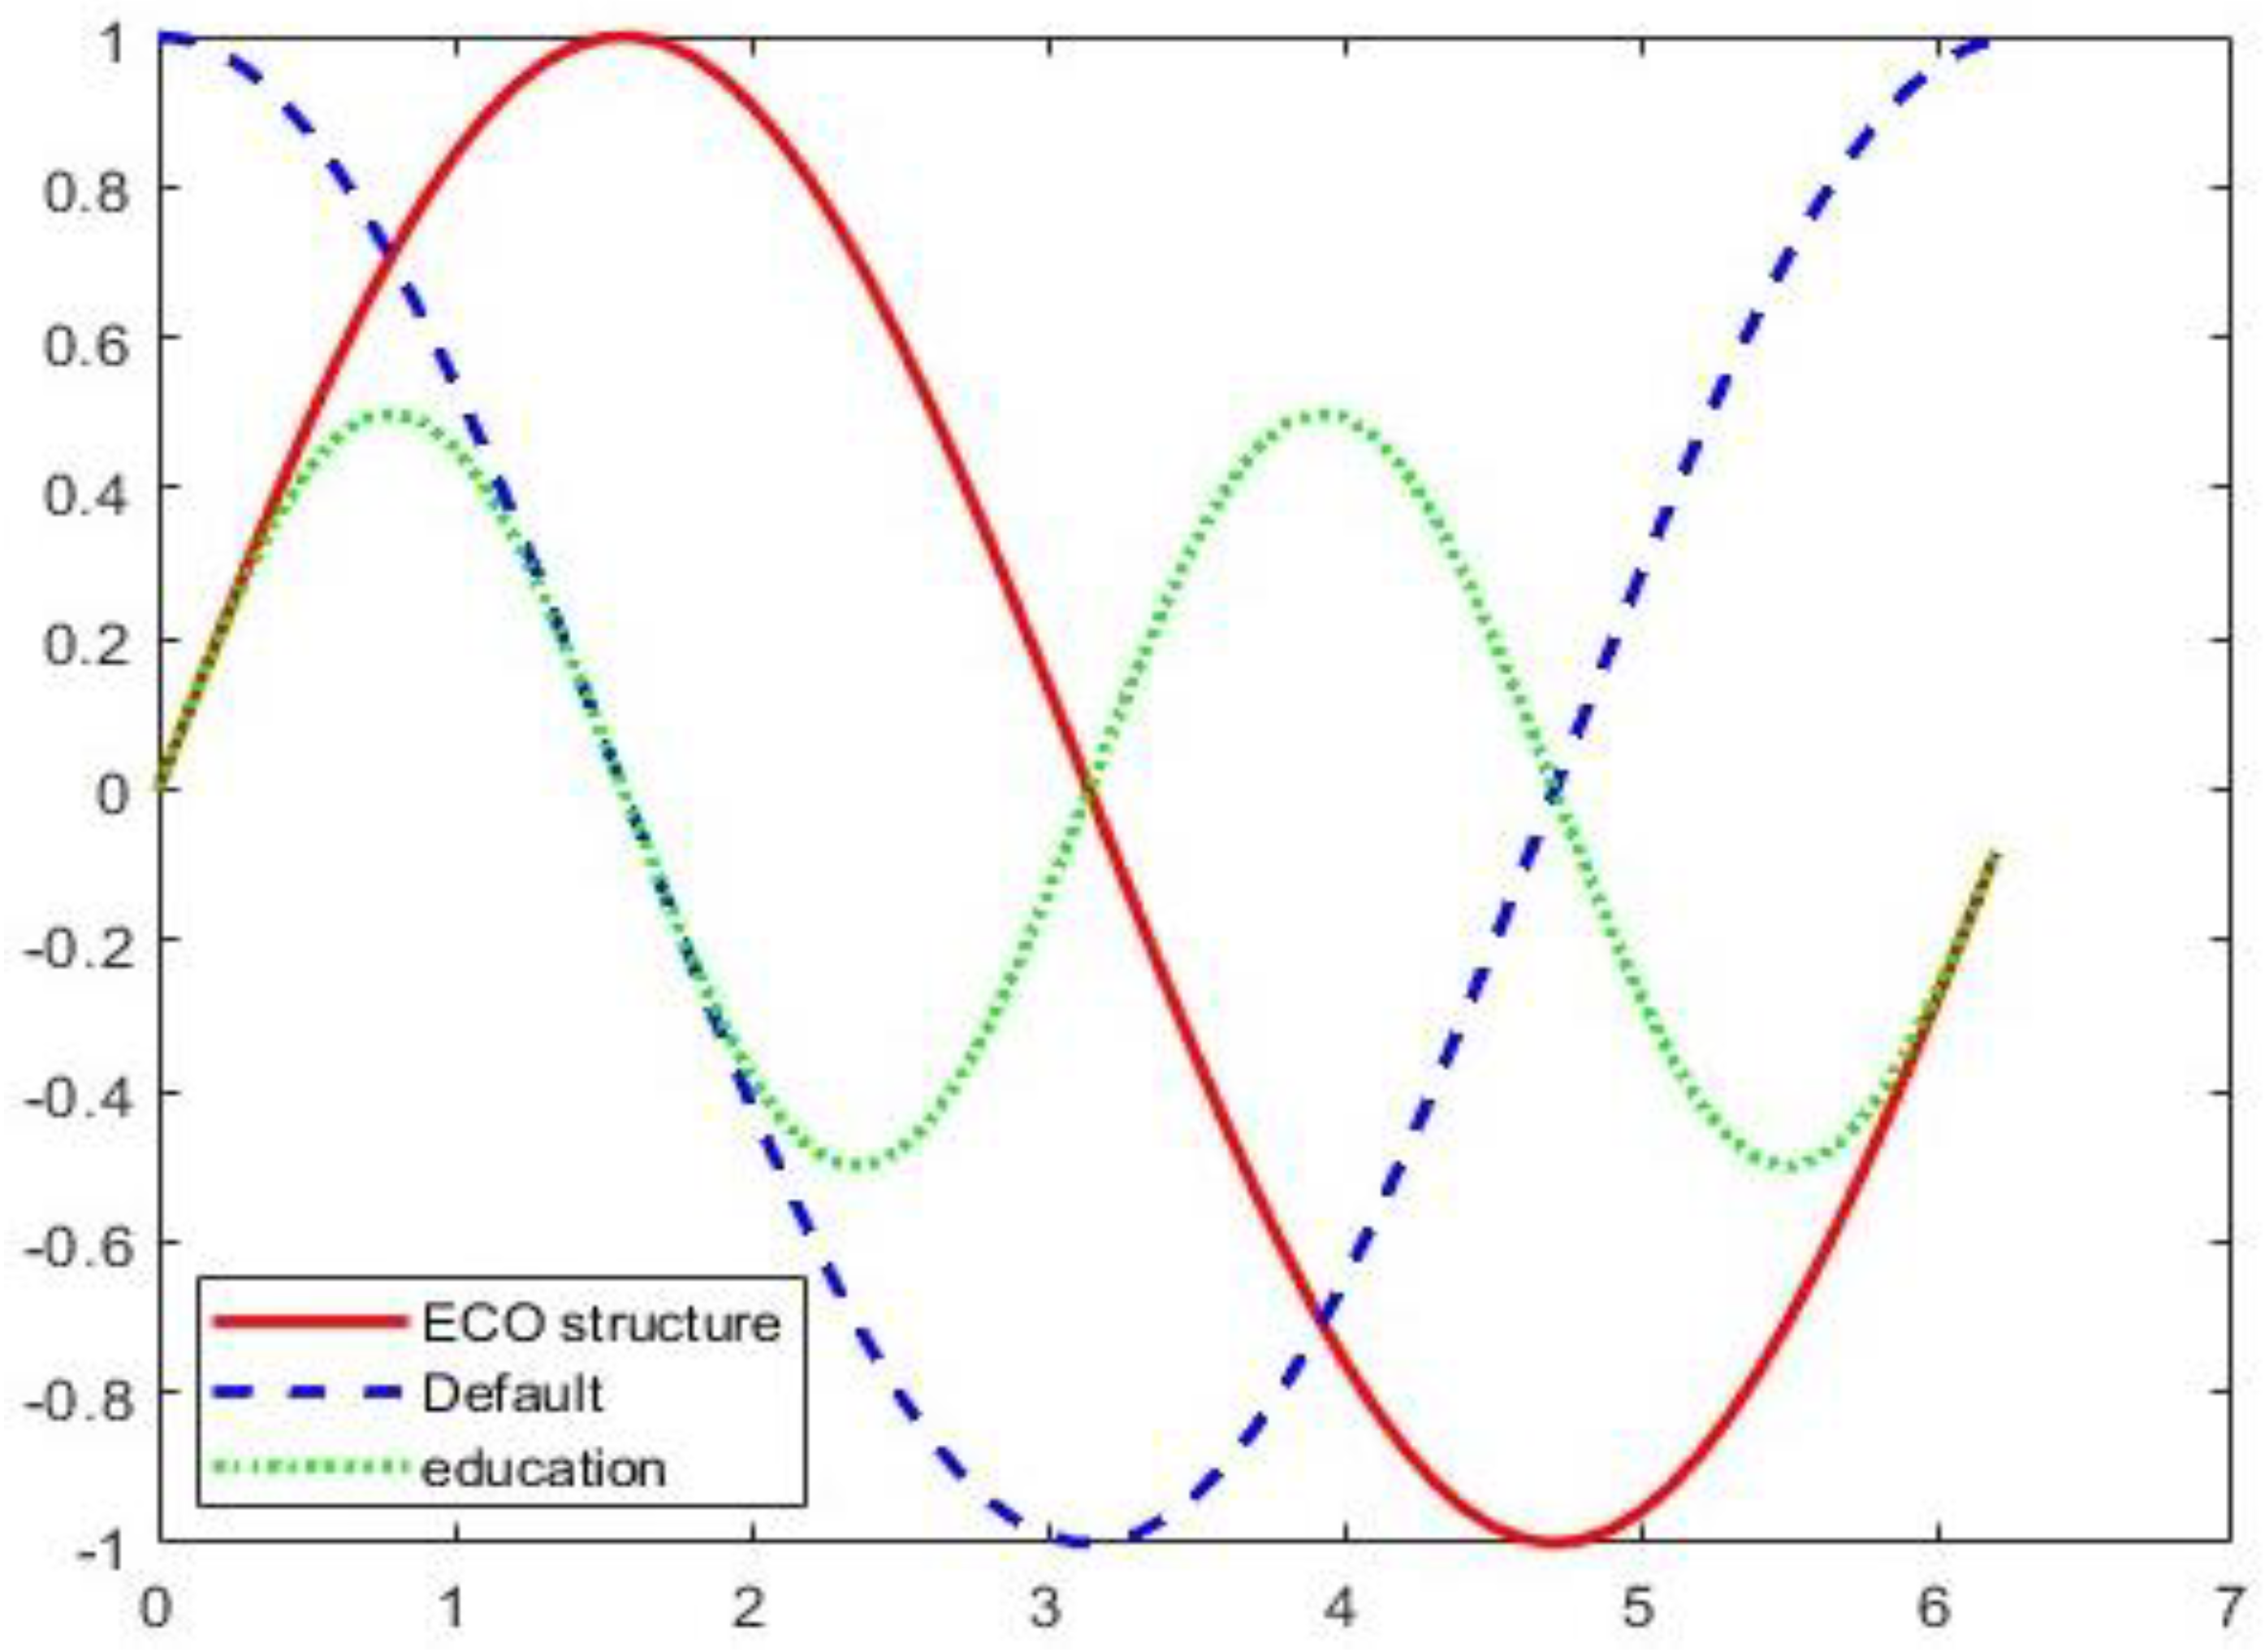
Table 1.
Presents the descriptive statistics.
| Variables | Obv | Mean | St.D | Min | Max |
| Credit_v | 270 | 0.031 | 0.026 | 0.001 | 0.145 |
| Consume | 270 | 0.015 | 0.013 | 0.001 | 0.068 |
| FIX | 270 | 8.011 | 2.516 | 2.047 | 14.69 |
| Green_L | 270 | 0.504 | 0.313 | 0.0661 | 1.242 |
| ROAD | 270 | 38.15 | 23.72 | 5.129 | 142.0 |
| Government_inter | 270 | 2.490 | 1.025 | 1.101 | 6.284 |
| R&D | 270 | 23.49 | 1.344 | 20.17 | 26.17 |
| DGF | 270 | 2.034 | 0.916 | 0.183 | 4.103 |
| Pgdp | 270 | 107.5 | 4.343 | 96.82 | 119.9 |
| Phone number | 270 | 17.56 | 7.515 | 5.920 | 43.78 |
| Unemployment | 270 | 3.252 | 0.645 | 1.200 | 4.500 |
| PARK | 270 | 12.95 | 2.765 | 7.010 | 21.05 |
| EDU | 270 | 13.45 | 0.799 | 10.73 | 14.66 |
| Eco structure | 270 | 16.80 | 41.14 | 1.621 | 278.3 |
| OPEN | 270 | 0.271 | 0.306 | 0.0127 | 1.548 |
| Default | 270 | 1.598 | 0.920 | 0.350 | 7.090 |
| FDI | 270 | 26.86 | 1.379 | 23.61 | 30.23 |
Note: Explain abbrivation used in the tables.
Table 3.
displays the outcomes of the benchmark regression.
| VARIABLES | (1) | (2) | (3) | (4) | (5) |
| Green_L | Green_L | Green_L | Green_L | Green_L | |
| DGF | 0.802*** | 0.451*** | 0.148*** | 0.149*** | 0.163** |
| (0.054) | (0.165) | (0.049) | (0.029) | (0.088) | |
| Default | 0.003 | −0.065*** | −0.089*** | −0.044*** | |
| (0.020) | (0.019) | (0.019) | (0.009) | ||
| FDI | 0.053* | −0.128*** | −0.140*** | −0.047** | |
| (0.030) | (0.046) | (0.046) | (0.022) | ||
| Open | −0.074 | 0.442** | 1.037*** | 0.425*** | |
| (0.112) | (0.201) | (0.206) | (0.124) | ||
| Eco Structure | 0.001 | 0.003*** | 0.007*** | 0.002*** | |
| (0.001) | (0.001) | (0.002) | (0.000) | ||
| Education | 0.347*** | 0.561** | 0.530*** | 0.845*** | |
| (0.059) | (0.220) | (0.180) | (0.118) | ||
| Park | 0.017*** | 0.059*** | 0.047*** | 0.047*** | |
| (0.005) | (0.013) | (0.008) | (0.006) | ||
| Phone number | 0.004 | 0.021*** | 0.014*** | 0.013*** | |
| (0.004) | (0.006) | (0.004) | (0.001) | ||
| Per_gdp | 0.382* | −0.161 | −0.083 | −0.328** | |
| (0.177) | (0.208) | (0.175) | (0.134) | ||
| Per_gdp2 | −0.002* | 0.000 | −0.000 | 0.001* | |
| (0.001) | (0.001) | (0.001) | (0.001) | ||
| Unemployment | 0.013 | 0.013 | 0.071 | −0.018 | |
| (0.026) | (0.043) | (0.037) | (0.024) | ||
| R&D | −0.188*** | 0.057 | 0.164*** | 0.027** | |
| (0.037) | (0.073) | (0.044) | (0.044) | ||
| Government_inter | 0.174*** | 0.061 | 0.029 | 0.166** | |
| (0.048) | (0.060) | (0.044) | (0.061) | ||
| Road | −0.002* | 0.001 | 0.005 | 0.003 | |
| (0.001) | (0.005) | (0.003) | (0.002) | ||
| N | 270 | 270 | 270 | 270 | 270 |
| Adjusted-R2 | 0.532 | 0.643 | 0.567 | 0.825 | 0.632 |
| Province fixed effects | NO | NO | YES | YES | YES |
| Year fixed effects | NO | YES | NO | NO | YES |
Note: The symbols *, **, and *** denote significance levels of 10%, 5%, and 1%, respectively.
Table 4.
displays the outcomes of the robustness assessments.
| VARIABLES | (1) | (2) | (3) | (4) | (5) |
| Green L | Green L | Green L | Green L | Green L | |
| POST*TREATED | 0.094*** | ||||
| (0.019) | |||||
| DGF | 0.119*** | 0.166* | 0.151*** | 0.166** | |
| (0.072) | (0.090) | (0.044) | (0.083) | ||
| Digital policy | −0.001 | −0.000 | |||
| (0.001) | (0.001) | ||||
| Control variables | YES | YES | YES | YES | YES |
| Year fixed effects | YES | YES | YES | YES | YES |
| Province fixed effects | YES | YES | YES | YES | YES |
| N | 270 | 269 | 270 | 270 | 270 |
| Digital_policyt-1 | 0.003*** | ||||
| (0.001) |
The symbols *, **, and ***, reflect the significance levels of 10%, 5%, and 1%, respectively.
Table 5.
displays the outcomes of the robustness assessments.
| VARIABLES | (1) | (2) | (3) | (4) |
| Green_L | Green_L | Green_L | Green_L | |
| Control variables | YES | YES | YES | YES |
| Year fixed effects | YES | YES | YES | YES |
| N | 270 | 270 | 210 | 270 |
| AR (2) | 0.684 | 0.791 | ||
| AR (1) | 0.067 | 0.078 | ||
| Sargan statistic | 0.533 | 0.363 | 0.896 | |
| Cragg-Donald Wald F statistic | 77.290 | 2684.430 | ||
| Anderson canon. corr. LM statistic | 98.255 | 221.516 | ||
| Province fixed effects | YES | YES | YES | YES |
| DGF | 0.235*** | 0.002*** | 0.468*** | 0.160*** |
| (0.083) | (0.000) | (0.056) | (0.052) |
Table 6.
Outcomes of subsample reversions.
| VARIABLES | Panel A | Panel B | Panel C | Panel D | Panel E | Panel F |
| ≤ 25%] | (25% 50%] | (50% 75%] | > 75% | ≥ median | <median | |
| Green_L | Green_L | Green_L | Green_L | Green_L | Green_L | |
| Control variables | YES | YES | YES | YES | YES | YES |
| Year fixed effects | YES | YES | YES | YES | YES | YES |
| Province fixed effects | YES | YES | YES | YES | YES | YES |
| Adjusted-R2 | 0.633 | 0.656 | 0.792 | 0.793 | 0.583 | 0.152 |
| N | 67 | 68 | 67 | 68 | 152 | 118 |
| DGF | −0.062 | 0.146 | 0.619*** | 0.509*** | 0.343** | −0.012 |
| (0.108) | (0.208) | (0.197) | (0.153) | (0.137) | (0.117) |
Table 7.
displays the outcomes of the regressions conducted on sub regional and sub-index data.
| VARIABLES | (2) | (6) | (4) | (1) | (5) | (3) |
| WEST | Depth | Level | EAST | Breadth | CENTRAL | |
| Green_L | Green_L | Green_L | Green_L | Green_L | Green_L | |
| DGF | 0.154 | 0.200** | 0.302*** | |||
| (0.118) | (0.080) | (0.090) | ||||
| DGF_digital | 0.001*** | |||||
| (0.000) | ||||||
| DGF_breadth | 0.002*** | |||||
| (0.001) | ||||||
| Control variables | YES | YES | YES | YES | YES | YES |
| Year fixed effects | YES | YES | YES | YES | YES | YES |
| Province fixed effects | YES | YES | YES | YES | YES | YES |
| Adjusted-R2 | 0.664 | 0.551 | 0.590 | 0.686 | 0.564 | 0.687 |
| N | 99 | 270 | 270 | 99 | 270 | 72 |
| GDF_depth | −0.000 | |||||
| (0.000) |
The symbols *, **, and *** reflect the significance levels of 10%, 5%, and 1% correspondingly.
Table 8.
displays the outcomes of the mechanism analysis.
| VARIABLES | (1) | (2) | (8) | (6) | (7) | (5) | (3) | (4) |
| Consume_v | Credit_v | Green_L | Credit_v | Green_L | Consume_v | Green_L | Green_L | |
| DGF | −0.023** | −0.040** | −0.080*** | −0.025*** | ||||
| (0.006) | (0.006) | (0.012) | (0.007) | |||||
| Consume_v | −1.484* | −1.284** | ||||||
| (0.803) | (0.472) | |||||||
| Cragg-Donald Wald F statistic | 145.414 | 171.361 | 145.414 | |||||
| Anderson canon. Corr. LM statistic | 17.656 | 50.844 | 15.547 | 50.844 | ||||
| Control variables | YES | YES | YES | YES | YES | YES | YES | YES |
| Province fixed effects | YES | YES | YES | YES | YES | YES | YES | YES |
| Adjusted-R2 | 0.191 | 0.114 | 0.517 | 0.076 | 0.518 | 0.151 | 0.525 | 0.526 |
| N | 270 | 270 | 270 | 270 | 270 | 270 | 270 | 270 |
| Credit_v | −0.669* | −0.746** | ||||||
| (0.371) | (0.290) |
Table 9.
displays the outcomes of the regular examination.
| VARIABLES | (1) | (2) | (3) | (4) |
| Credit_v | Credit_v | Consume_v | Consume_v | |
| Control variables | YES | YES | YES | YES |
| Year fixed effects | YES | YES | YES | YES |
| Province fixed effects | YES | YES | YES | YES |
| Adjusted-R2 | 0.196 | 0.257 | 0.317 | 0.218 |
| N | 129 | 141 | 129 | 141 |
| financial cycle | Down | UP | DOWN | UP |
| DGF | −0.055*** | −0.005 | −0.032*** | −0.006** |
| (0.006) | (0.017) | (0.006) | (0.002) |
Table 10.
displays the outcomes of the conversation.
| VARIABLES | (1) | (3) | (2) |
| Green_V | Green_L | Green_L | |
| DGF | −0.076*** | 0.560** | 0.592** |
| (0.038) | (0.263) | (0.245) | |
| Finance | −1.078** | ||
| (0.535) | |||
| Cragg-Donald Wald F statistic | 76.385 | 14.107 | 15.140 |
| Control variables | YES | YES | YES |
| Year fixed effects | YES | YES | YES |
| Province fixed effects | YES | YES | YES |
| Sargan statistic (P value) | 0.424 | 0.134 | 0.141 |
| Anderson canon. corr. LM statistic | 97.056 | 25.807 | 28.594 |
| N | 270 | 240 | 240 |
| Loan | −0.606 | ||
| (0.452) |
Table 11.
displays the outcomes of additional examination.
| VARIABLES | (1) | (2) | (3) | (4) |
| Green_L | Green_L | Green_L | Green_L | |
| DGF_Edu | 0.163** | |||
| (0.074) | ||||
| DGF_Structure | 0.233* | |||
| (0.141) | ||||
| DGF_R&D | 0.017** | |||
| (0.007) | ||||
| DGF_Government_inter | −0.079*** | |||
| (0.007) | ||||
| Observations | 270 | 270 | 270 | 270 |
| Province fixed effects | YES | YES | YES | YES |
| Year fixed effects | YES | YES | YES | YES |
| Control variables | YES | YES | YES | YES |
Disclaimer/Publisher’s Note: The statements, opinions and data contained in all publications are solely those of the individual author(s) and contributor(s) and not of MDPI and/or the editor(s). MDPI and/or the editor(s) disclaim responsibility for any injury to people or property resulting from any ideas, methods, instructions or products referred to in the content. |
© 2025 by the authors. Licensee MDPI, Basel, Switzerland. This article is an open access article distributed under the terms and conditions of the Creative Commons Attribution (CC BY) license (http://creativecommons.org/licenses/by/4.0/).
Copyright: This open access article is published under a Creative Commons CC BY 4.0 license, which permit the free download, distribution, and reuse, provided that the author and preprint are cited in any reuse.


