Submitted:
26 July 2025
Posted:
28 July 2025
You are already at the latest version
Abstract
This research examines the combined effect of technological innovation and green finance on economic performance in 73 developing economies from 2012 to 2021 by using econometric estimation such as quantile analysis. The research demonstrates that green financing substantially enhances financial effectiveness, as quantile-based evaluation reveals, especially in the mid- to upper quantiles, with a threshold of 0.70. Nonetheless, the benefits diminish above this threshold, suggesting a decrease in receptivity at higher income tiers. This indicates that the benefits of green financing are unequally distributed across varying degrees of economic success. The results urge developing economies to augment expenditure in sustainable green projects rather than conventional, unsustainable initiatives. Long-term growth and resiliency rely on the adaptation of economic strategies that promote sustainable investments. This encompasses the incorporation of green economics into both monetary and non-banking portfolios. Advocating for eco-conscious economic structures may foster stable, inclusive, and ecologically viable growth. This outcome further corroborates the conclusions of the long-term economic research over the majority of quantiles, except for some higher quantiles (0.8, 0.9, and 0.95); the majority of percentiles for environmental financing and mitigating financing exhibit favorable correlations with industry values addition. Nonetheless, a rise in funding adaptability diminishes the economic value contributed across all quantiles.
Keywords:
Green Financing
; Economic Performance
; Quantile Regression
; Sustainable Investment
; Developing Economies
1. Introduction
A major challenge identified is the need to
integrate green financial principles with traditional socioeconomic laws and
procedures. This is a significant barrier to attaining a more environmentally
viable society. This study primarily aims to investigate the dynamic and
frequency-based relationships between oil costs, energy self-sufficiency,
financial sustainability, eco-friendly technology development, and fluctuations
in the economic cycle. Ongoing environmental deterioration and increasing
worldwide temperatures have consistently presented significant concerns
worldwide. In response, international structures such as the Paris Climate
Agreement and the United Nations' 2030 Agenda have been established to
facilitate immediate environmental recovery and foster collaborative
initiatives for sustainability development. Recent research emphasizes that
promoting sustainable technology provides a more comprehensive and efficient
approach to achieving Sustainability Economic Goals. A primary constraint of
traditional technical methods is their emphasis on optimizing economic gains,
often at the detriment of ecological stability and social welfare. This
disparity substantially hinders progress toward achieving the United Nations'
sustainable development goals. The study comprehensively examines global
warming and emphasizes the necessity for enduring, sustainable measures to
mitigate its effects on ecosystems and the economy. The impact of the financial
cycle on the expansion of ecologically sustainable products and activities is a
topic of debate. The study emphasizes the need for developing creative
financial strategies for sustainable firms and argues that additional economic
support is essential for environmentally friendly operations.
As a result, there has been a significant rise in
the advancement of new eco-friendly technology, with countries transitioning
from the conventional "harming growth pattern" to the less ecological
"green development model". (Coban et al., 2023) describe "green
technology" as technical breakthroughs that are environmentally benign and
facilitate reuse, energy preservation, pollution control, and productivity
improvements. A defining characteristic of sustainable technologies is its
careful consideration of ecological impacts throughout all phases of production
(W. Zhu et al., 2021). Approximately 66.7% of nations globally are motivated to
invest in and advocate for Greenhouse Technological Improvement (GTI), which
seeks to integrate economic advancement with environmental conservation (M. Yu
et al., 2022). The number of charters related to ecologically environmentally
conscious endeavors has been increasing consistently throughout the years, at
an annual rate of approximately 11.5%. By 2023, the World Industrial Property
Organization predicts that there will be 5 million patent applications
submitted globally. Companies' engagement with and commitment to GTI
initiatives may fluctuate across the financial cycle. From a favorable cyclical
standpoint, businesses maintain a strong financial position during
macroeconomic growth, characterized by substantial revenues and attractive
fixed-income investments that can serve as security (Kouakou & Soro, 2024).
(He & Huang, 2021) assert that businesses are increasingly inclined to
engage in GTI to improve productivity and financial effectiveness. Despite
enterprises potentially facing diminished efficiency during financial
recessions, the anti-cyclical perspective indicates that R&D investments
may indeed be curtailed (Khan et al., 2022). Authorities would proactively
enhance the sector via monetary support and other strategies, providing
increased opportunities for businesses to engage in GTI initiatives and recover
from the downturn (Huang & Shen, 2024). The evolution of GTI may
significantly impact the energy sector. Numerous advantages can be derived
from Gas-to-Infrastructure (GTI).
Consequently, green power generation capacity is
increased, energy usage and pollution are reduced, and sustainable solutions to
the global energy issue are provided (P. Wang et al., 2023). The continuous
advancement of eco-friendly technologies has concurrently reduced the expenses
associated with renewable energy sources (Baruk & Goliszek, 2023). The GTI
influences the power economy in two ways. Consequently, traditional power
resources exhibit greater efficiency, while green power alternatives are
becoming increasingly cost-effective.
The attainment of sustainability development, the
modulation of the financial phase, and the promotion of the switch to renewable
power are all contingent upon the degree of innovation in environmental
technologies. Our research has enhanced our understanding of the relationships
between various components. The study presents a multifaceted network model to
examine the interconnections among several sectors, including power, ecological
creation, financial fluctuations, and environmentally acceptable innovation.
Despite extensive studies on GTI in isolation, there have been limited studies
that integrate the four aforementioned elements into a unified paradigm and
examine their interconnections. This report primarily addresses the existing
gap in information or investigation within this specific topic.
This research employed a time-varying variable
vector autoregressive (TVP-VAR) framework to examine the communication impacts
between green technological creativity, oil prices, carbon emissions,
sustainability growth, and the financial cycle. The investigation aims to
discern the characteristics of these relationships across both short- and
long-term perspectives. The findings are delineated over three principal
aspects. Preliminary static evaluations suggest that the interrelationships
between the factors were more pronounced in the near term compared to the long
term. Healthy growth was identified as a significant source of impact, although
the financial cycle was the primary beneficiary. The static findings indicate
that the degree and location of spillover impacts vary based on the period and
frequency analyzed. Following the COVID-19 pandemic, worldwide initiatives
have focused on financial recovery, including the introduction of supplementary
regulatory safeguards to mitigate societal risk. Green technological growth was
primarily influenced by oil prices and the economic cycle in the long run,
establishing it as a beneficiary of external shocks in both directional and
bilateral linkages. Furthermore, green technological innovation is increasingly
aligned with the parameters established by carbon footprint reduction and
sustainability growth metrics.
The contributions of this work are delineated as
follows. Initially, considering that previous research in this domain is
predominantly centered in 73 emerging economies, our investigation, which
emphasizes a substantial sample of emerging economies, constitutes a notable
addition to the existing research. Thus, I enhance the knowledge of sustainable
financing and its macroeconomic significance with a novel sample. Secondly, I
employ various metrics to estimate the impact of green finance. I explicitly
examine the influence of green financing on industry output in emerging
countries through various proxies of greener financing. To our understanding,
no previous research has assessed green financing utilizing diverse metrics as
I have. The utilization of many green finance indicators underscores the
stability of our investigation findings, a characteristic not present in all
prior studies within the same domain. Third, regarding method, our research
offers a rigorous approach by comparing three distinct estimation methods
qunatitle analysis to analyze the influence of various green financing
variables on manufacturing efficiency, a technique not previously employed in
past research to our knowledge.
This study is structured as follows. The second
element consists of an extensive research review and a detailed assessment of
prior articles. The final part explains the facts and the methodology used. The
fourth section comprises an assessment. The last segment is completed.
2. Literature Review
2.1. Advancement in Eco-Friendly Innovations and Enduring Sustainability
Achieving responsible economic goals and mitigating
adverse environmental impacts necessitates the Reduction of Global Temperature
Increase (GTI). Green Technology Innovation (GTI), as stated by Xu et al.
(2022), is essential for the development of eco-friendly products and,
consequently, for enhancing corporate stability. (Shen et al., 2023).
emphasized the significance of GTI in mitigating ecological costs and fostering
long-term viability, noting its integration of environmental and technological
considerations. The use of GTI enhances sustainable development, as evidenced
by (Xin et al., 2023).Avia augmented energy productivity, optimized economic
procedures, and reduced polluting discharges. (Mohammed et al., 2023).have
emphasized the significance of GTI in helping firms achieve their green
development goals and improve their environmental performance. Ludwikowska and
Tworek (2022) highlighted GTI as a crucial strategic decision that promotes the
transition to low-carbon activities and ensures the long-term sustainability of
businesses. The application of green technology (GTI) can reduce ecological
footprints and yield substantial improvements in environmental quality, both in
the short and long term (Su et al., 2024).GTI enhances ecological stability by
substituting obsolete equipment with more sustainable and cost-efficient
alternatives, as demonstrated by (X. Zhao et al., 2022). Government action, as
stated by (Raza et al., 2023)), will promote Green Technology Innovation (GTI),
compelling firms to prioritize the environment and accelerate the transition to
a sustainable economy.
2.2. The Correlation Between Advancements in Sustainable Technologies and Finacial Expansion
The correlation between GTI and GDP growth has been
examined from two primary viewpoints thus far. The Global Terrorism Index
(GTI) exhibits a strong correlation with macroeconomic growth and success.
Although GTI has sustained consistent industrial expansion with minimal
environmental impact, (M. Zhu et al., 2023) identified that Singapore's rapid
expansion has led to considerable ecological degradation. (Hailemariam et al.,
2022)found that GTI's ecological attributes might substantially enhance the
city's sustainability image. This is expected to strengthen both its
comparative advantage and socioeconomic growth, according to a study by (Hossin
et al., 2023). The BRICS nations might substantially reduce their energy
consumption with the implementation of Green Technology Innovation (GTI). This
may facilitate the advancement of economic growth from its initial stages to
subsequent ones. According to (Yang et al., 2023)), GTI has a significant
influence on environmental pollution and financial prosperity at the local
level. However, the link between GTI and economic development is low. As
stated by (Ngoc et al., 2024b), enterprises ought to prioritize their
environmental obligations over monetary, managerial, and technical factors
while implementing Green Technologies Innovations (GTI). Due to shifts in
cognition and resource availability, financial effectiveness may decline as a
result of this transformation. The protracted duration necessary for GTI to
yield profits, as noted by Li et al. (2022), exposes shareholders to financial
losses and impedes socioeconomic progress. As stated by (Abbas et al., 2020),
GTI incurs higher expenses and greater unpredictability, thereby dissuading
investments and hindering economic progress.
2.3. The Correlation Between the Advancement of Sustainable Technologies and the Increase in Energy Costs
The influence of fuel expenses on GTI has been the
focus of a growing amount of research studies. The majority of these
experiments have demonstrated a robust and straightforward association between
energy expenditures and GTI. (D. Zhang et al., 2021)assert that sustainable
power firms are more inclined to engage in Green Technology Innovation (GTI)
during periods of rising oil prices. Energy prices substantially influence
China's advancement in sustainable power development, as noted by (Jahanger et
al., 2023). However, when disparities in energy prices increase, this effect
diminishes in significance. The mean value significantly influences China's
Global Terrorism Index (GTI), as identified by (R. Wang et al., 2023).Businesses
may be incentivized to engage in Green Technology Innovation (GTI) to reduce
their dependence on oil and safeguard against price sensitivities in the event
of rising oil prices, as noted by (Feng et al., 2023). Conversely, recent
research indicates that GTI's elevated energy expenses may hinder its adoption.
According to (W. Yu et al., 2024), oil cost shocks affected enterprises' gross
total income (GTI) in two ways: the first related to more stringent
environmental regulations and the second to improved fuel economy. Persistent
elevated oil prices, as noted by (Hunjra et al., 2024), might profoundly
influence the Global Technological Index (GTI), especially for advances
designed to address environmental change. As stated by (Li et al., 2024),
rising energy costs have deterred gasoline and petroleum purchases, which has
adversely affected the Gas Trade Index (GTI) in European countries.
2.4. Research Hypotheses
The primary aim of this research is to examine the
interconnections between the electrical industry, ecological sustainability,
financial phases, and innovations in green technologies. Although previous
studies have primarily focused on the relationship between green technology
development and factors like energy pricing and ecological financing, they
often lack a comprehensive methodology that unifies these interrelated
components. This study fills the gap by using a thorough analysis method to
examine the relationships among green creativity, economic networks, and
ecological frameworks. The research employed time-frequency domain analyses to
distinguish between short-term and long-term effects. It further delineates the
degree to which diverse components function as either generators or receivers
of environmental and financial repercussions. The premises suggest that
authorities and corporations respond to financial fluctuations by adopting
sustainable behaviors and integrating new environmental technologies. The study
highlights the importance of integrating ecological finance into macroeconomic
planning to foster sustainable growth. This study builds upon prior work by
examining the role of banking organizations in promoting environmental
technology and facilitating climate change prevention.
The majority of prior research on GTI's
sustainability has focused on its connection to fuel expenses and ecological
economy. This research primarily focuses on regions requiring further
improvement. A cohesive methodology for investigating the relationship between
GTI, sustainable growth, the economy, and fuel is absent. This research aims to
integrate various components into a comprehensive system to analyze their
structural characteristics and dynamic evolutionary trends. It is essential to
distinguish the impact of the parts over time. This article employs
time-frequency domain research to examine the immediate and overtime
performance of the factors. It also differentiates between the roles of
broadcaster and recipient.
The research investigates existing knowledge
regarding climatic warming and its detrimental effects on habitats and the
economy. This article analyses the responses of authorities and corporations to
financial cycles through the adoption of sustainability behaviors and
eco-friendly technologies. A recent study suggests that economic policies
should incorporate environmental and financial principles to promote
sustainability and prosperity. This analysis builds beyond previous research by
emphasizing the significance of technological invention in addressing
environmental warming and enhancing economic growth. This study highlights the
crucial role of financial institutions in promoting green initiatives and
enhancing ecological resilience by integrating data from multiple sources.
This article analyses the responses of authorities
and corporations to the macroeconomic cycle through the adoption of
sustainability policies and eco-friendly technologies. Previous research
indicates that economic policies should incorporate environmental financing
principles to promote sustainable development. This study builds upon earlier
research by emphasizing the significance of technological invention in
addressing environmental warming and enhancing socioeconomic growth. This
study, which integrates information from multiple reports, underscores the
importance of economic networks in promoting green initiatives and fostering
ecological stability.
3. Data and Methodology
3.1. Data
This study seeks to examine the impact of
environmental financing on industry efficiency (industry value added as a
percentage of GDP) in 73 emerging nations from 2000 to 2019. The pertinent data
are sourced from the World Bank (2024a). To quantify our principal variable of
passion, environment financing, I employ three classifications of climate
funds: (i) worldwide environment cash, (ii) recipients nations environment
changes fun, (iii) environment reduction cash ( (iv) worldwide environment
cash as a percentage of GDP (v) environment prevention funds as a
percentage of GDP (vi) recipients nation environment adapting funds as a
percentage of GDP. The pertinent data are sourced from the OECD (2024).The
model incorporates three control variables: (i) person GDP, (ii) urbanized
populace as a percentage of the overall populace, and (iii) finance growth
quantified by foreign lending to the commercial sectors as a percentage of GDP.
The pertinent statistics are sourced from the World Bank (2024b).
3.2. The CS-ARDL Methodology Proposed by Chudik and Pesaran (2015)
This research employs the empirical approach
established by Chudik and Pesaran in 2015 to examine the short-term reactions
and long-term effects of ecological investments on decreasing patterns over
time. This method is deemed superior to other prevalent strategies, such as the
enhanced mean group estimation, the commonly associated impacts of average
group estimation, and the aggregated means group estimated. The primary
rationale for choosing this strategy is its capacity to identify longitudinal
dependency and offer reliable long-term outcomes. Furthermore, it considers
architectural problems, temporal fluctuations throughout diverse groups, and
the existence of unobserved shared factors. The across-regions augmented
self-regressive distribution lag Theory is expressed in the following
operational form:
3.3. Panel Generalized Method of Moments (PGMM) Estimations
The panel's generalized technique of minutes
addresses difficulties related to variability, measurement errors, unexplained
variation, and missing factor bias. Consequently, I employ this strategy to
provide impartial and effective outcomes (Machhirake et al., 2024). It may be
expressed
In this model, the subscript i represents
individual countries, ranging from 1 to n, while t denotes time periods,
ranging from 1 to m.
3.4. MM-QREG Methodology by Rios-Avila (2020)
I employ the MM-QREG methodology established by (Josaiman
et al., 2021). to assess the influence of environmental financing on industry
production cycles at the bottom, medium, and top segments of the organization's
distributions symmetrically. The primary benefit of (Colenbrander et al.,
2023).Measure Research is that it accommodates numerous constant variables in
the least squares quantile regression models. It utilizes regeneration and
analysis of standard deviations. It evaluates the impacts of locality and size
by modifying the degrees of variation among quantiles. This is a GMM predictor
that permits resilient and clustering normal deviations. The MM-QREG equation
can be expressed as follows:
In this specification, Y represents the dependent
variable, while X́ denotes a differentiable transformation vector that can be
derived from the ratio of Z transposed to Z, which is proportionally related to
a combination of parameters including beta, delta, gamma, and certain
unidentified components. The vector Z is a known vector with k elements and is
defined as a function P of the standard deviation applied to the sum of delta
and the transposed Z multiplied by gamma. The unspecified or unobservable
influences within the model are denoted by U. Accordingly, Equation (3) can be
reformulated as follows:
3.5. Panels Cointegration Test Accommodating Longitudinal Dependency
The primary reason for employing panels
cointegration is the provision of strong findings in the presence of
cross-sectional dependence (CSD). To evaluate the sustainability of our
results, I employed the bootstrapping panels integration test introduced by (Xie et al., 2022).
3.6. Dynamic Panel Threshold Regression
I employ the static thresholds model proposed by (Qi
et al., 2024). to analyze the correlation between environmental funding
allocations and production oscillations. This is an extended model of the
cutoff analysis developed by (Feng et al., 2023). and (DasGupta & Roy,
2023). According to the thresholds approach proposed by (Rafique et al., 2021),
conversion methods cannot be employed to negate the distributional hypotheses
established by Hansen (1999) and Caner and Hansen (2004) for nation-specific
impacts. The primary benefit of the static thresholds approach is its ability
to identify sequential correlations in the converted mistakes. Secondly, it
elucidates the quadratic relationship between carbon funding allocations and
fluctuations in industry output. Third, it incorporates a smoothness
requirement by introducing a threshold parameter. Ultimately, it accommodates
various functional shapes for robust outcomes in complex information
frameworks. The subsequent examples can articulate the relationship among these
factors:
The model presented is a single barrier approach,
positing the presence of a single barrier in industry production cycle.
4. Empirical Findings and Discussion
4.1. Summarize Stats and Relationships
Table 1's
descriptive statistics elucidate the essential structure and attributes of the
factors under question. All data are exchanged in exponential form for initial
and over-time economic studies. The average variation of the adaption financing
money is the greatest amongst the factors. Nonetheless, the variances in all
other factors are likewise significant, rendering our findings credible. The
economic research assesses the volatility of dependent factors in response to
changes in free factors
Table 2
presents the bilateral relationship. All explaining variables, except for
socioeconomic development and urbanization, have a negative correlation with
increased manufacturing value. Climate, change, and reduction funding are
quantified in totals. The correlations between financial metrics, expressed as
a proportion of GDP, are anticipated to have significant favorable
relationships. Indeed, one observes the association values among CF and CFGDP,
AF and AFGDP, as well as MF and MGGDP. The significant correlation scores
between the parameters render them appropriate for advanced
economic analysis.
4.2. Initial Economic Assessments
Before utilizing economic instruments for long-term
economic research, it is crucial to verify the existence of and the
prerequisites for such studies. Table 3
displays the outcomes derived from the cross-section-dependent analysis (Ahmad
et al., 2022). The table indicates that all factors exhibit longitudinal
dependence. A basic conclusion derived from longitudinal dependency is that
specific similar socioeconomic characteristics exist among the longitudinal
units (countries), influencing both the dependent and uncontrolled factors in
question. The second-generation economic approaches are dependable for
addressing longitudinal reliance, as immigrant approaches fail to account for
it.
The CIPS method for sequential unit root testing is employed, and the findings are presented in Table 4 below. The factors may exhibit conflicting levels of integration. All aspects, except for macroeconomic development and manufacturing value-added, are averaged at zero, I(0), or fixed at specific levels. The heterogeneous sequence of integration among the factors is appropriate for assessing cooperation among all.
Likewise, economic uncertainty over adaption is present in industrialized nations (Y. Zhao et al., 2024). The discourse around adaptive financing in industrialized nations remain unresolved when the business economy is taken into account. Differences persist over the goal and method of corporate industry engagement in adapting finance inside affluent nations. The profit-driven commercial economy confronts a compromise between capital returns and ecological costs. Conversely, less assistance has been provided to date, notwithstanding the substantial commitments made by affluent nations as adaptation funding for developing nations (Muzayanah et al., 2022). This inadequate sum is sufficient to have a significant economic and environmental impact in underdeveloped nations.
Table 6 indicates that abatement money is positively correlated with industry-added value, similar to environmental financing. In other words, enhanced mitigating financing promotes the enhancement of economic value. The outcomes can be ascribed to both socioeconomic and psychological variables. Similar to environmental funding, mitigating financing may enhance the capital influx to industries that generate less environmentally damaging goods or factories that release minimal amounts to achieve their output. Output. Remediation funding facilitates the allocation of resources from pollution-intensive industries to environmentally sustainable output. Thus, mitigating money exerts a scaled impact on industry productivity by enhancing the creation of fewer polluting items.
4.3. Evaluation of Linear Long-Term Associations
Table 6 displays the outcomes of the long-term economic study. Environmental financing exhibits a substantial favorable correlation with economic sector addition. This discovery is environmentally advantageous. It serves as the equilibrium nexus between economics and the environment. The favorable correlation between the parameters can be ascribed to two primary explanations. Firstly, environmental financing can immediately and beneficially generate expenditure and production opportunities in green and renewable sectors (Gyamfi et al., 2020). Secondly, climate financing can mitigate the impacts of environmental alteration on development outcomes while ensuring that overall development remains unimpeded (Ahmed et al., 2024).
Moreover, investing in weather resiliency enhances future financial development potential, draws new capital possibilities, and increases industry output. Recently, environmental financing has gained prominence due to its potential to provide financial flexibility and social stability in the past. Climate financing has been allocated to the sustainable and greener energy industry. This sector offers both financial opportunities and environmental benefits. Investment in the green electricity industry yields substantial machinery for the generation and distribution of power.
Likewise, energy storage systems require substantial academic and technological expertise to ensure power safety. This elevates the output capacity in the associated economic areas and enhances the economic value added. Environmental financing also embodies climate awareness. The emotional and psychological elements enhanced by environmental funding stem from optimistic projections for sustained financial development. A climate-conscious culture is more likely to attain environmentally balanced growth. This can facilitate a steady increase in business value. Fischer (2017) asserts that global financing is expanding in response to the threat of climate change. While the primary objective of international funding is not financial growth, its beneficial influence on global change mitigation can yield favorable economic outcomes. This effect extends beyond the nations getting financial aid. The fiscal repercussions can extend to donating states about international trade with neighboring countries. Consistent with our findings, Román et al. (2018) identified four parameters that measure the macroeconomic impact of climate financial planning: extra value quantity, domestic multiplier, foreign multiplier, and trade structure.
Unexpectedly, I discovered an inverse correlation between adaptation financing and economic revenue addition. A rise in weather adaptation financing deters the enhancement of economic output. This result can be attributed to the fact that the climate adaptation system remains in a state of decline. The prevailing view among activists that the climate warming dilemma may be addressed through output reduction or positive development aligns with the findings (Victor, 2012). Adapting to climatic warming through economic measures necessitates significant changes in the economic sector, particularly in output. The issues associated with global warming necessitate fossil independence and a cap on fossil production. A clear and favorable correlation between emissions levels and output levels is frequently observed in the business sector (Sachan et al., 2025). Green advocates for lowering emission levels by implementing production reductions. This may consequently diminish the total industrial value added.
Likewise, not all economic areas are climate-adaptive, as they need study and education to transition to climate-resilient manufacturing methods. The nascent environmental sector may experience output reductions as a result of implementing climate change adaptation strategies, thereby diminishing its economic value. Likewise, an additional economic point regarding accessibility might be presented. Initially, the high costs of climate adaptation technology may restrict economic units with limited financial capabilities from scaling up their output in their plants. This may also lead to decreased manufacturing; hence, the stated manufacturing appreciation may be restricted.
Moreover, mitigating financing offers an optimistic financial perspective for future green development initiatives (Zheng et al., 2024). This enhances entrepreneurs' trust in establishing new economic output facilities and increasing the output of current ones. This thereby enhances the total industrial value produced. Likewise, augmented mitigation funding signifies a pursuit of healthy socio-economic growth (Y. Zhang et al., 2024). Producers identify opportunities for production expansion within an environmentally responsible growth framework, resulting in an average rise in economic worth. The beneficial effect of abatement funding on industry value addition is linked to the criteria established for obtaining such financing from wealthy nations, as noted by (Zheng et al., 2025). The analysis indicates that rising nations characterized by carbon-intensive manufacturing methods diminished average national income and appropriate
Our study identified significant correlations between macroeconomic development and phases of industry efficiency. This conclusion is anticipated, considering the prevailing research and foundational macroeconomic principles regarding national income accounting. Economic volume contributed constitutes a segment of national income. An increase in per-person income resulting from an increase in national income can significantly enhance manufacturing value addition (Abid et al., 2021) In the cyclical circulation of revenue within an economy, the augmented income is allocated to commercial and industry entities. If the family money (per capita income) surpasses use, the surplus income is preserved. A proficient financial system channels savings into worthwhile commercial endeavors. This subsequently leads to increased investments, work, and production. The consequent effects of aggregate productive expansion and heightened manufacturing value addition are attributable to socioeconomic development.
Table 6 indicates a favorable correlation between urbanization and industry value addition. The heightened urbanization of a society amplifies its industrial worth. Cities typically possess superior infrastructure, elevated family income, and a greater desire for products and activities compared to rural regions. It is accurately stated that increased urbanisation stimulates heightened financial activities in both output and spending. A steady increase in demand-driven production is essential to maintain a specific level of life (Lei et al., 2022). The need for city facilities generates opportunities for investments and economic expansion, with financial resources transferring from the city populace to industry manufacturing facilities. Consequently, steady and constant metropolitan demographic growth may enhance economic viability.
Our study identified significant correlations between macroeconomic development and cycles of industry efficiency. This conclusion is anticipated, considering the prevailing research and foundational macroeconomic principles regarding national income reporting. Economic value contributed constitutes a segment of national income. An increase in per-person revenue resulting from a rise in national income can directly enhance manufacturing value-added (Álvarez-Piñeiro et al., 2024). In the cyclical flow of revenue within a financial system, the increased revenue is allocated to commercial and industrial entities. If the family money (per capita income) surpasses use, the surplus money is preserved. A proficient finance structure channels resources into worthwhile socioeconomic endeavors. This subsequently stimulates investment, jobs, and production—the consequential effects of aggregate production expansion and increased industry value attributable to socioeconomic development.
Table 6 indicates a favorable correlation between urbanisation and industry revenue addition. The escalation of urbanization within a civilization amplifies its industrial worth. City regions typically possess superior infrastructure, higher family income, and a greater demand for products and activities compared to rural areas. It is accurately stated that increased urbanization stimulates higher financial activities in both output and spending. A steady increase in demand-driven production is essential to maintain a specific level of life (Tzeremes et al., 2023). The need for city facilities generates opportunities for investments and economic expansion, directing financial resources from the city populace to industry manufacturing facilities. Consequently, steady and constant urban demographic growth may enhance economic productivity.\
Unexpectedly, the majority of estimated findings indicate that personal home credit constrains economic output. This discovery necessitates additional empirical investigation to confirm the connection definitively. Nonetheless, an imbalanced monetary progression inside an economy can diminish the supplementary economic value. Unregulated home loans from lenders, without adequate assessment of the viability of firms and enterprises, lead to the accumulation of ineffective assets, adversely affecting the industry's production cycle. Although credit expands, it does not enhance the economic worth, and manufacturing value-added remains stagnant. Moreover, the accumulation of ineffective loans hinders the lending cycle. The banks are apprehensive about granting mortgages. In such circumstances, the producer's enterprise has limited financial means to increase production. Table 7 presents the findings of the quantile analysis.
In 2021, the European Renewable Energy Association projects that the cost of solar electricity generation will be $0.048 per kilowatt-hour (KWH), offshore wind will be $0.075 per KWH, and domestic wind will be 00$0.033 per KWH. Since last year, there have been decreases of 15%, 10%, and 14% in price. In contrast, GTI is consistently striving to enhance the efficiency of traditional power use (Z. Wang et al., 2025). The objective of this work is to enhance the efficiency of fossil fuel combustion and improve materials circulation (Zheng et al., 2025). According to calculations by Li et al. (2024a), a 1% rise in environmental development activity correlates with a 0.03% decrease in power usage intensity. (Ngoc et al., 2024a)assert that sustainable technologies are widely recognized as an effective means to reduce dependence on natural resources and their consumption.
4.4. Nonlinear Estimation Results
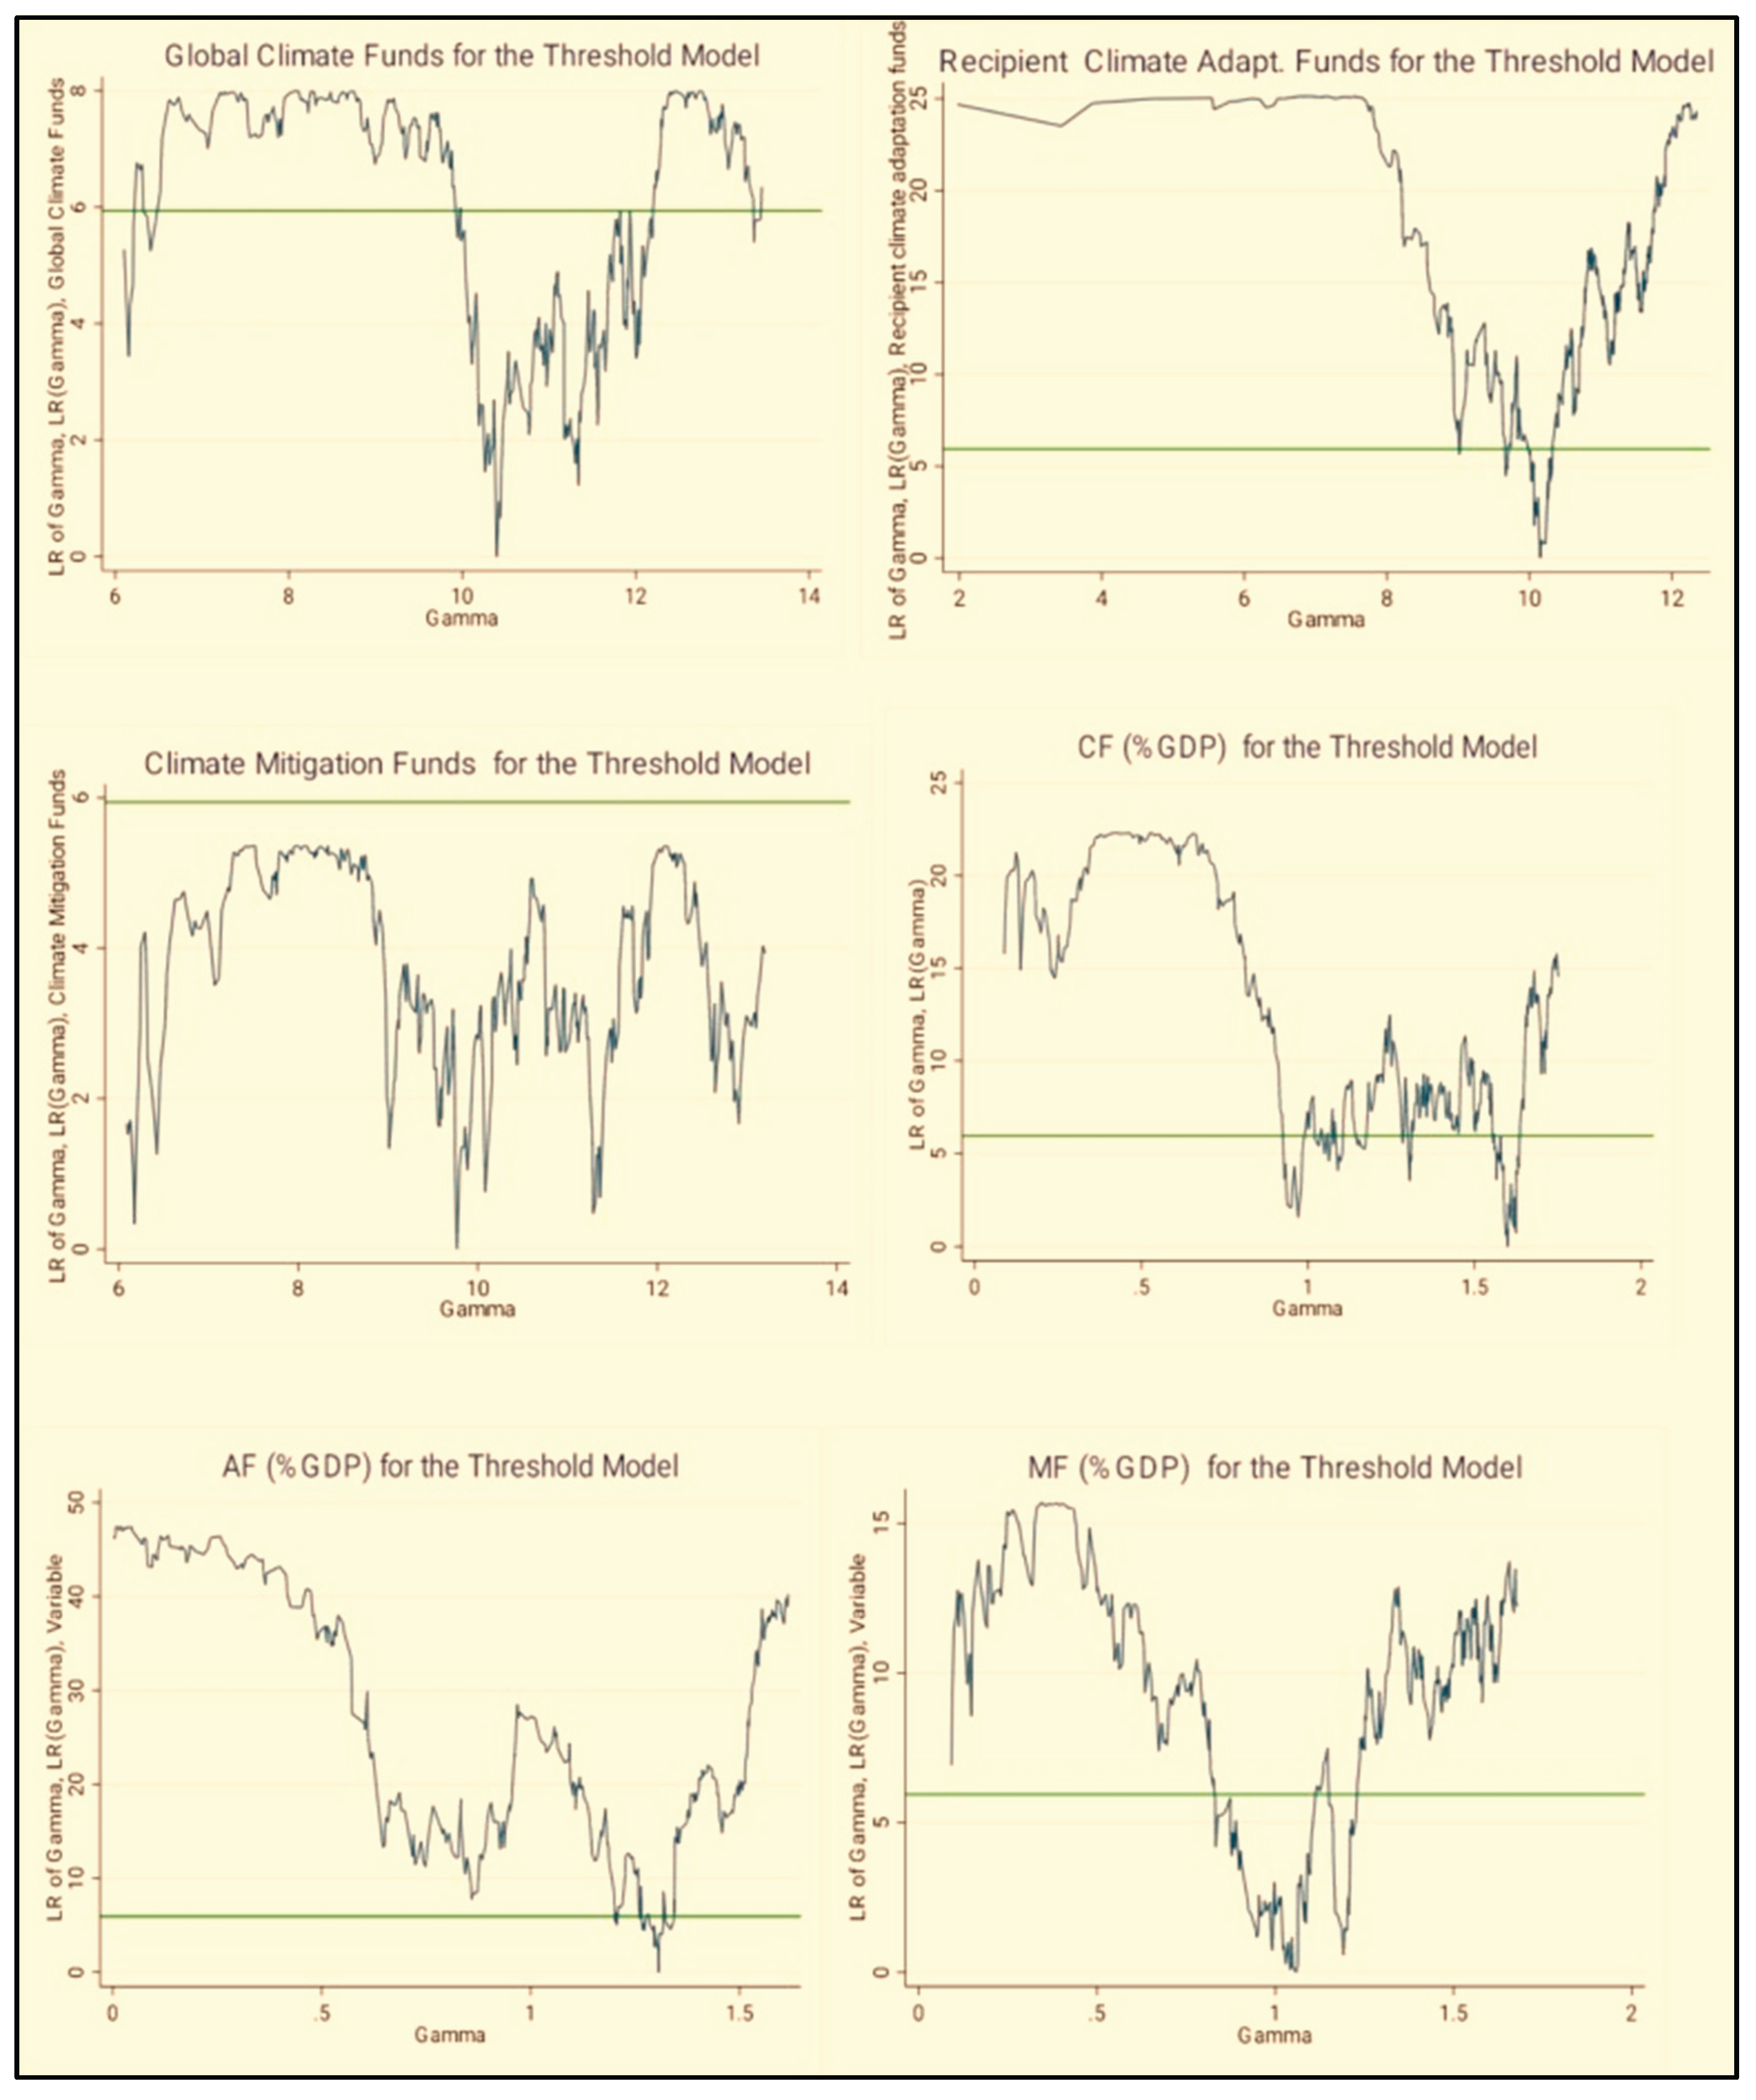
To verify the validity of our prior results, I further employ (i) nonlinear regression techniques and the flexible panel cutoff conduct our study excluding GDP per capita from the equations. This supplementary phase enables us to assess the sensitivities of our findings in scenarios where this factor is excluded, thereby ensuring the robustness of our findings across various model parameters. Table 8 illustrates the nonlinear impacts of business funding, farming funding, and production funding, as well as the percentage of business funding, farming funding, and production funding to gross local items on industrial efficiency using a flexible panel threshold system. The similar threshold principles for these factors are 10.39619 for business funding, 10.15903 for farming funding, 9.766823 for production funding, 1.3069 for both business and farming funding regarding gross local items, and 1.0585 for production funding regarding gross local goods. These criteria are economically relevant at standard relevance levels.
Figure 1.
Likelihood ratio (LR) for thresholds.
Moreover, mitigating financing offers an optimistic financial perspective for forthcoming green development initiatives (M. Wang et al., 2025). This enhances entrepreneurs' trust in establishing new manufacturing facilities and increasing the output of current ones. This, in turn, enhances the total economic value contributed. Likewise, augmented mitigation funding signifies a pursuit of healthy socio-economic growth (Afshan & Yaqoob, 2022). Companies identify opportunities for output expansion within an environmentally responsible growth framework, resulting in an aggregate rise in economic value. The beneficial effect of mitigating funding on industry value addition is linked to the criteria established for obtaining such financing from advanced nations, as noted (Rehman et al., 2023). The analysis indicates that poor nations, characterized by environmentally damaging manufacturing methods, smaller overall national income, and ineffective systems of government, are less likely to receive abatement funds from wealthy nations. The report advocates for the balanced allocation of remediation financing among emerging nations to achieve advantages in both economic and natural domains. In South Asian nations, equitable mitigation money has substantially aided climate change mitigation (Rao et al., 2022).
4.5. Robustness Analysis
To verify the accuracy and trustworthiness of our experimental results, I performed many robustness tests. Initially, I evaluated alternate modeling parameters employing the Completely Modified Ordinary Least Squares (FMOLS) and Dynamic Ordinary Least Squares (DOLS) methodologies. The findings were generally aligned with our basic CS-ARDL, Panel GMM, and MM-QREG designs, verifying the substantial beneficial impact of green financing on economic value-added. Secondly, I examined structure breaks and longitudinal dependency to confirm that the estimates are not skewed by unobserved variability across nations. The use of second-generation unit roots and integration testing corroborates the durability of long-term partnerships. Third, to assess the robustness of our designs, I sequentially eliminated control factors, including urbanization and per capita GDP.

Table 9.
Robustness Results using GMM Estimation.
| 0.268*** | [0.034] | |
| 2.854*** | (0.585) | |
| 0.258*** | (0.325) | |
| 2.584*** | (0.218) | |
| 3.658*** | (0.326) | |
| _cons | −0.365*** | (−3.847) |
| 0.854 | - | |
| 0.001 | - | |
| 0.215 | - | |
To guarantee the dependability of our results, I conducted multiple resilience checks. Other methodologies, such as FMOLS and DOLS, corroborated our primary models, affirming the beneficial impact of sustainable finance on enhancing economic value. I also examined structural fractures and cross-national variations using sophisticated unit root testing, which corroborated the over-time associations. Despite the exclusion of control factors such as urbanization and GDP per capita, the results remained consistent. A lag study further validated the reliability of our results. These assessments bolster confidence in the affirmative correlation between green financing and economic growth in emerging countries.
The results of green financing were strong, indicating little impact of omitted factor bias. Finally, I conducted a lag impact study to evaluate the algorithm's dynamical characteristics, and the fundamental results remained unchanged. These resilience assessments collectively bolster trust in the accuracy of the original results, confirming that green financing has a favorable impact on economic performance in diverse developing nations.
5. Conclusions and Policy Implication
This research examined the influence of sustainable financing on the addition of manufacturing volume in 73 emerging nations from 2012 to 2021 . The model's dependent variable is industry efficiency, estimated by adding industry revenue. Economic value addition is determined by the total production of an industry, measured by summing all products and deducting intermediary supplies. The principal dependent factors are worldwide environmental financing (CF), adaptation financing resources, and mitigation financing resources, which denote the financial value of greener financing. Additionally, the analysis includes several control variables, such as metropolitan population, domestic credit to the private sector, and per capita GDP, among others.
This research replicates six long-term systems employing a mix of dependent factors through quantile estimating techniques. Various estimating approaches are used to ensure durability in testing. This research evaluates the models using ten measurement datasets, employing quantile regression to examine the dynamic influence across various quantile levels. Our analysis suggests that sustainable financing has a substantial and beneficial impact on industry efficiency in emerging nations. The majority of models assessed across the three estimating approaches exhibit consistent outcomes. Moreover, our measure analysis reveals that the beneficial effect of greener financing on corporate output is observed in the center up to the 0.70 quantiles. Conversely, the magnitude declines in the higher percentiles exceeding 0.70.
This study has broadened the existing research; however, certain limitations persist that may suggest opportunities for further investigation. The study focuses exclusively on a select group of 73 emerging countries rather than encompassing all emerging countries globally. The precise measurement of sustainable financing is a prospective study area, with further analyses possible at the organizational level. This article primarily examines the fundamental principles of sustainable financing development. Future studies should examine the long-term effects and frameworks of environmental finance on corporate environmental productivity in various emerging countries worldwide. Future research may investigate the endeavors and obstacles faced by emerging countries in achieving improved access to greener financing, developing techniques to promote responsible savings, and advancing climate-related initiatives. Future studies may also identify and eliminate barriers to green money accessibility, develop strategies for overcoming obstacles, and encourage the use of sustainable financing.
This study has broadened the existing research; however, certain limitations persist that may suggest opportunities for further investigation. The study focuses exclusively on a select group of 73 emerging countries rather than encompassing all emerging countries globally. The precise measurement of sustainable financing is a prospective study area, with further analyses possible at the organizational level. This article primarily examines the fundamental principles of sustainable financing development. Future studies should examine the long-term effects and frameworks of environmental finance on corporate environmental productivity in various emerging countries worldwide. Future research may investigate the endeavors and obstacles faced by emerging countries in achieving improved access to greener financing, developing techniques to promote responsible savings, and advancing climate-related initiatives. Future studies may also identify and eliminate barriers to green money accessibility, develop strategies for overcoming obstacles, and encourage the use of sustainable financing.
Policy Implication
Our research indicates that greener finance has a beneficial effect on industry efficiency, regardless of the estimating technique employed or the surrogate used to represent green funding. This means that the beneficial effect is substantial. This beneficial effect also carries inevitable political consequences. Given the significance of environmental finance in enhancing industrial efficiency in emerging economies, it is recommended that authorities in these nations prioritize the allocation of green funds to promote domestic ecological initiatives. Governments and commercial regulators in emerging countries must revise commercial regulations to encourage the expansion of green finance within the loan portfolios of both banks and non-bank financial institutions. The government can also compel institutions to prioritize sustainable finance by integrating it into quality assessment metrics or including it in the inspection schedule.
Secondly, considering the beneficial effects of green funding on industry efficiency, China ought to prioritize friendly initiatives over non-green ones to guarantee sustained growth in the present. This initiative extends beyond banks and should also be applied to the capital markets. The state should incentivize companies to issue additional sustainable stocks to stimulate growth in the sustainable sector. Third, regarding the impact of controlling factors on industry efficiency, the state should promote urbanization by creating additional employment opportunities for laborers migrating from rural areas to city centers. Given the detrimental effect of personal home lending on industry efficiency over time, authorities in emerging countries must implement decisive measures to reduce home finances and ensure long-term financial stability. Ultimately, the results of the decline in measures indicate that in the emerging economy, the beneficial effect of environmental finance on industry production is observed exclusively within the medium to 0.70 quantile range. Conversely, the amplitude becomes positive in the top percentiles exceeding 0.70. Consequently, this finding indicates that government interventions for nations in higher percentiles must vary from those in lesser quantiles as well Secondly, considering the beneficial effects of green funding on industry efficiency, China ought to prioritize friendly initiatives over non-green ones to guarantee sustained growth in the present. This initiative extends beyond banks and should also be applied to the capital markets. The state should incentivize companies to issue additional sustainable stocks to stimulate growth in the sustainable sector. Third, regarding the impact of controlling factors on industry efficiency, the state should promote urbanization by creating additional employment opportunities for laborers migrating from rural areas to city centers. Given the detrimental effect of personal home lending on industry efficiency over time, authorities in emerging countries must implement decisive measures to reduce home finances and ensure long-term financial stability. Ultimately, the results of the decline in measures indicate that in the emerging economy, the beneficial effect of environmental finance on industry production is observed exclusively within the medium to 0.70 quantile range. Conversely, the amplitude becomes positive in the top percentiles exceeding 0.70. Consequently, this finding indicates that government interventions for nations in higher percentiles must vary from those in lesser quantiles as well
The findings indicate that the authorities of emerging nations should prioritize environmental efforts measures over non-green initiatives to foster sustained growth in the present. Emerging countries should amend financial regulations to promote the expansion of greener finance within the loan portfolios of both banking and non-banking financial organizations. The findings of this research facilitate the formulation of a strategy for emerging countries to leverage environmental funding, technological innovation, and financial advancement in economic areas, thereby achieving sustainable growth objectives. The document emphasizes the necessity for comprehensive regulatory frameworks that enhance the accessibility of green funding and the incorporation of environmentally friendly strategies, as green financing has become an essential tool for achieving carbon impartiality, augmenting industrial output, and fostering sustainable financial growth. Countries require reforms within international development organizations, developmental financial structures, and municipal authorities regarding carbon finance. A global strategy is essential for realizing the full potential of sustainable technology and creativity in the development of emerging nations. Utilizing greener money for industrial advancement is crucial, necessitating a robust legislative foundation and committed management frameworks. Adept labor is essential, necessitating investments in practical training and advanced educational courses focused on green technology. Moreover, ecological taxes can serve as a potent mechanism to stimulate sustainable funding for global prevention while simultaneously bolstering local production of renewable fuel technology, reducing prices and generating new employment possibilities . (Hasan et al., 2022) .
Moreover, enhanced local collaboration can facilitate the exchange of best practices, asset collection, and synchronized initiatives to achieve sustainable manufacturing practices. This may entail the establishment of regional centres of competence for greener power study and production or local coalitions to secure more favorable conditions for greener finance. If utilized effectively, these tactical initiatives could significantly aid emerging countries in achieving sustainable industrialization.
Nonetheless, government market initiatives simply are inadequate; thus, green finance methods are crucial for drawing sector investment. Mixed banking, which combines government and commercial assets, offers a means to mitigate risks associated with green funding, facilitating wider involvement. Emerging countries can enhance the greener transformation by establishing specialist finance institutions such as greener banking. To attain green manufacturing, emphasizing sustainable financing, poor countries must mitigate ecological harm while progressing forward a less equitable and sustainable tomorrow. The authors emphasize the significant beneficial influence of greener financing on healthy economic growth, necessitating the formulation of clear definitions, pertinent assessments, and taxation regulations to enhance access to green finance and advance climate change mitigation.
References
- Abbas, Q.; Nurunnabi, M.; Alfakhri, Y.; Khan, W.; Hussain, A.; Iqbal, W. RETRACTED ARTICLE: The role of fixed capital formation, renewable and non-renewable energy in economic growth and carbon emission: a case study of Belt and Road Initiative project. Environ. Sci. Pollut. Res. 2020, 27, 45476–45486. [Google Scholar] [CrossRef]
- Abid, N.; Ikram, M.; Wu, J.; Ferasso, M. Towards environmental sustainability: Exploring the nexus among ISO 14001, governance indicators and green economy in Pakistan. Sustain. Prod. Consum. 2021, 27, 653–666. [Google Scholar] [CrossRef]
- Afshan, S.; Yaqoob, T. The potency of eco-innovation, natural resource and financial development on ecological footprint: a quantile-ARDL-based evidence from China. Environ. Sci. Pollut. Res. 2022, 29, 50675–50685. [Google Scholar] [CrossRef]
- Ahmad, M.; Ahmed, Z.; Yang, X.; Hussain, N.; Sinha, A. Financial development and environmental degradation: Do human capital and institutional quality make a difference? Gondwana Res. 2022, 105, 299–310. [Google Scholar] [CrossRef]
- Ahmed, B.; Wahab, S.; Rahim, S.; Imran, M.; Khan, A.A.; Ageli, M.M. Assessing the impact of geopolitical, economic, and institutional factors on China's environmental management in the Russian-Ukraine conflicting era. J. Environ. Manag. 2024, 356, 120579. [Google Scholar] [CrossRef]
- Álvarez-Piñeiro, L.; Rivera, Y.; Berna-Escriche, C.; Blanco, D. Formulation of best estimate plus uncertainty methodologies for economy decarbonization in high-energy-demand isolated systems: Canary Islands forecasts for 2040. Energy Convers. Manag. 2024, 314. [Google Scholar] [CrossRef]
- Azad, A.K.; Wanke, P.; Raihan, M.Z.; Anwar, S.R.; Mustafa, R. Bank efficiency in Bangladesh revisited: a slack-based network DEA approach. J. Econ. Stud. 2020, 47, 1001–1014. [Google Scholar] [CrossRef]
- Baruk, A.I.; Goliszek, A. The ways of interpreting green energy by young Polish individual recipients vs. their gender. Energy Strat. Rev. 2023, 50. [Google Scholar] [CrossRef]
- Coban, H.H.; Lewicki, W.; Miśkiewicz, R.; Drożdż, W. The Economic Dimension of Using the Integration of Highway Sound Screens with Solar Panels in the Process of Generating Green Energy. Energies 2022, 16, 178. [Google Scholar] [CrossRef]
- Colenbrander, S.; Vaze, P.; Vikas, C.; Ayer, S.; Kumar, N.; Vikas, N.; Burge, L. Low-carbon transition risks for India’s financial system. Glob. Environ. Chang. 2022, 78. [Google Scholar] [CrossRef]
- Das, N.; Bera, P.; Panda, D. Can economic development & environmental sustainability promote renewable energy consumption in India?? Findings from novel dynamic ARDL simulations approach. Renew. Energy 2022, 189, 221–230. [Google Scholar] [CrossRef]
- DasGupta, R.; Roy, A. Firm environmental, social, governance and financial performance relationship contradictions: Insights from institutional environment mediation. Technol. Forecast. Soc. Chang. 2023, 189. [Google Scholar] [CrossRef]
- Feng, Y.; Meng, M.; Li, G. Impact of digital finance on the asset allocation of small- and medium-sized enterprises in China: Mediating role of financing constraints. J. Innov. Knowl. 2023, 8. [Google Scholar] [CrossRef]
- Gyamfi, B.A.; Bein, M.A.; Bekun, F.V. Investigating the nexus between hydroelectricity energy, renewable energy, nonrenewable energy consumption on output: evidence from E7 countries. Environ. Sci. Pollut. Res. 2020, 27, 25327–25339. [Google Scholar] [CrossRef] [PubMed]
- Hailemariam, A.; Ivanovski, K.; Dzhumashev, R. Does R&D investment in renewable energy technologies reduce greenhouse gas emissions? Appl. Energy 2022, 327. [Google Scholar] [CrossRef]
- Han, Y. Promoting green economy efficiency through fiscal decentralization and environmental regulation. Environ. Sci. Pollut. Res. 2022, 30, 11675–11688. [Google Scholar] [CrossRef]
- Hasan, M.M.; Wong, J.B.; Al Mamun, M.A. Oil shocks and corporate social responsibility. Energy Econ. 2022, 107. [Google Scholar] [CrossRef]
- Hassan, Q.; Abdulrahman, I.S.; Salman, H.M.; Olapade, O.T.; Jaszczur, M. Techno-Economic Assessment of Green Hydrogen Production by an Off-Grid Photovoltaic Energy System. Energies 2023, 16, 744. [Google Scholar] [CrossRef]
- He, L.-Y.; Huang, G. How can export improve firms’ energy efficiency? The role of innovation investment. Struct. Chang. Econ. Dyn. 2021, 59, 90–97. [Google Scholar] [CrossRef]
- Hossin, A.; Alemzero, D.; Wang, R.; Kamruzzaman, M.; Mhlanga, M.N. Examining artificial intelligence and energy efficiency in the MENA region: The dual approach of DEA and SFA. Energy Rep. 2023, 9, 4984–4994. [Google Scholar] [CrossRef]
- Huang, W.; Shen, Z. Corporate green innovation and stock price non-synchronicity: Evidence from China. Int. Rev. Econ. Finance 2024, 93, 52–64. [Google Scholar] [CrossRef]
- Hunjra, A.I.; Jebabli, I.; Thrikawala, S.S.; Alawi, S.M.; Mehmood, R. How do corporate governance and corporate social responsibility affect credit risk? Res. Int. Bus. Finance 2023, 67. [Google Scholar] [CrossRef]
- Jahanger, A.; Hossain, M.R.; Usman, M.; Onwe, J.C. Recent scenario and nexus between natural resource dependence, energy use and pollution cycles in BRICS region: Does the mediating role of human capital exist? Resour. Policy 2023, 81. [Google Scholar] [CrossRef]
- Josaiman, S.K.; Faisal, M.N.; Talib, F. Social Sustainability Adoption Barriers in Supply Chains: A Middle East Perspective using Interpretive Structural Modeling. Int. J. Oper. Quant. Manag. 2021, 27, 61. [Google Scholar] [CrossRef]
- Khan, S.A.R.; Yu, Z.; Ridwan, I.L.; Irshad, A.U.R.; Ponce, P.; Tanveer, M. Energy efficiency, carbon neutrality and technological innovation: a strategic move towards green economy. Econ. Res. Istraz. 2022, 36. [Google Scholar] [CrossRef]
- Kouakou, A. K. , & Soro, N. (2024). Is there a rebound effect in the search for energy efficiency in Sub-Saharan Africa? In Handbook on Energy and Economic Growth (pp. 254–276). Edward Elgar Publishing.
- Lei, X.; Alharthi, M.; Ahmad, I.; Aziz, B.; Abdin, Z.U. Importance of international relations for the promotion of renewable energy, preservation of natural resources and environment: Empirics from SEA nations. Renew. Energy 2022, 196, 1250–1257. [Google Scholar] [CrossRef]
- Li, K.; Chen, Z.; Andrikopoulos, A. Capital inflow liberalization and bank credit risk. J. Int. Money Finance 2024, 142. [Google Scholar] [CrossRef]
- Machhirake, N.P.; Vanapalli, K.R.; Kumar, S.; Mohanty, B. Biohydrogen from waste feedstocks: An energy opportunity for decarbonization in developing countries. Environ. Res. 2024, 252, 119028. [Google Scholar] [CrossRef]
- Mohammed, K.S.; Tiwari, S.; Ferraz, D.; Shahzadi, I. Assessing the EKC hypothesis by considering the supply chain disruption and greener energy: findings in the lens of sustainable development goals. Environ. Sci. Pollut. Res. 2022, 30, 18168–18180. [Google Scholar] [CrossRef]
- Muzayanah, I.F.U.; Lean, H.H.; Hartono, D.; Indraswari, K.D.; Partama, R. Population density and energy consumption: A study in Indonesian provinces. Heliyon 2022, 8, e10634. [Google Scholar] [CrossRef]
- Ngoc, N.B.; Xuan, V.N.; Huong, L.M. Nexus between carbon dioxide emissions, population, migration, foreign direct investment, and gross domestic product: New evidence in the context of Vietnam. J. Open Innov. Technol. Mark. Complex. 2024, 10. [Google Scholar] [CrossRef]
- Ngoc, N.B.; Xuan, V.N.; Huong, L.M. Nexus between carbon dioxide emissions, population, migration, foreign direct investment, and gross domestic product: New evidence in the context of Vietnam. J. Open Innov. Technol. Mark. Complex. 2024, 10. [Google Scholar] [CrossRef]
- Qi, R.; Liu, C.; Zhang, Q. Evidence mechanism for promoting natural resources and green recovery through green economy: Sustainable assistance in finance. Resour. Policy 2024, 91. [Google Scholar] [CrossRef]
- Quang, P.T.; Thao, D.P. Analyzing the green financing and energy efficiency relationship in ASEAN. J. Risk Finance 2022, 23, 385–402. [Google Scholar] [CrossRef]
- Rafique, M.Z.; Doğan, B.; Husain, S.; Huang, S.; Shahzad, U. Role of economic complexity to induce renewable energy: contextual evidence from G7 and E7 countries. Int. J. Green Energy 2021, 18, 745–754. [Google Scholar] [CrossRef]
- Rao, F.; Tang, Y.M.; Chau, K.Y.; Iqbal, W.; Abbas, M. Assessment of energy poverty and key influencing factors in N11 countries. Sustain. Prod. Consum. 2022, 30, 1–15. [Google Scholar] [CrossRef]
- Raza, A.; Nadeem, M.I.; Ahmed, K.; Hassan, I.; Eldin, S.M.; Ghamry, N.A. Is Greenfield investment improving welfare: A quantitative analysis for Latin American and Caribbean developing countries. Heliyon 2023, 9, e20703. [Google Scholar] [CrossRef]
- Rehman, F.U.; Islam, M.; Miao, Q. Environmental sustainability via green transportation: A case of the top 10 energy transition nations. Transp. Policy 2023, 137, 32–44. [Google Scholar] [CrossRef]
- Sachan, A.; Pradhan, A.K.; Mohindra, V. Investigating the role of natural resources in BRICS nations: A Path towards sustainable development. Energy Nexus 2024, 17. [Google Scholar] [CrossRef]
- Shen, Q.; Pan, Y.; Meng, X.; Ling, X.; Hu, S.; Feng, Y. How does the transition policy of mineral resource-exhausted cities affect the process of industrial upgrading? New empirical evidence from China. Resour. Policy 2023, 86. [Google Scholar] [CrossRef]
- Su, F.; Guan, M.; Liu, Y.; Liu, J. ESG performance and corporate fraudulence: Evidence from China. Int. Rev. Financial Anal. 2024, 93. [Google Scholar] [CrossRef]
- Tzeremes, P.; Dogan, E.; Alavijeh, N.K. Analyzing the nexus between energy transition, environment and ICT: A step towards COP26 targets. J. Environ. Manag. 2022, 326. [Google Scholar] [CrossRef]
- Wang, M.; Wang, B.; Chen, X.; Mei, T.; Yang, X.; Luo, Q.; Na, F.; Gong, Y. Surgery/non-surgery-based strategies for invasive locally-advanced non-small cell lung cancer in the era of precision medicine. Am. J. Surg. 2024, 240, 116132. [Google Scholar] [CrossRef] [PubMed]
- Wang, P.; Li, H.; Huang, Z. The inter-provincial trade inequality in China: An assessment of the impact of changes in built-up land and carbon storage. Ecol. Econ. 2023, 206. [Google Scholar] [CrossRef]
- Wang, R.; Usman, M.; Radulescu, M.; Cifuentes-Faura, J.; Balsalobre-Lorente, D. Achieving ecological sustainability through technological innovations, financial development, foreign direct investment, and energy consumption in developing European countries. Gondwana Res. 2023, 119, 138–152. [Google Scholar] [CrossRef]
- Wang, Y.; Ye, W.; Jiang, Y.; Liu, X. Volatility prediction for the energy sector with economic determinants: Evidence from a hybrid model. Int. Rev. Financial Anal. 2024, 92. [Google Scholar] [CrossRef]
- Wang, Z.; Imran, M.; Karacan, R.; Xu, J.; Mirzaliev, S.; Wang, L. Advancing the hydrogen economy: Optimizing renewable energy for decarbonization and resilience in net-zero networks. Int. J. Hydrogen Energy 2025, 119, 406–415. [Google Scholar] [CrossRef]
- Xie, Z.; Liu, X.; Najam, H.; Fu, Q.; Abbas, J.; Comite, U.; Cismas, L.M.; Miculescu, A. Achieving Financial Sustainability through Revenue Diversification: A Green Pathway for Financial Institutions in Asia. Sustainability 2022, 14, 3512. [Google Scholar] [CrossRef]
- Xin, L.; Ahmad, M.; Khattak, S.I. Impact of innovation in hybrid electric vehicles-related technologies on carbon dioxide emissions in the 15 most innovative countries. Technol. Forecast. Soc. Chang. 2023, 196. [Google Scholar] [CrossRef]
- Yang, J.; Xing, Y.; Han, Y. Utilization of E-commerce for fossil fuels allocation and green recovery. Resour. Policy 2023, 85. [Google Scholar] [CrossRef]
- Yu, M.; Zhou, Q.; Cheok, M.Y.; Kubiczek, J.; Iqbal, N. Does green finance improve energy efficiency? New evidence from developing and developed economies. Econ. Chang. Restruct. 2021, 55, 485–509. [Google Scholar] [CrossRef]
- Yu, W.; Wang, L.; Liu, X.; Xie, W.; Zhang, M. Can digital inclusive finance promote high-quality rural entrepreneurship? A county-level analysis from China. Finance Res. Lett. 2024, 67. [Google Scholar] [CrossRef]
- Zhang, D.; Wang, H.; Löschel, A.; Zhou, P. The changing role of global value chains in CO2 emission intensity in 2000–2014. Energy Econ. 2021, 93. [Google Scholar] [CrossRef]
- Zhang, Y.; Pi, L.; Chen, Y.; Shi, R. Energy transition policy and Chinese rural revitalization: The roles of industrial upgrading and digital economy. Finance Res. Lett. 2024, 69. [Google Scholar] [CrossRef]
- Zhao, X.; Ma, X.; Shang, Y.; Yang, Z.; Shahzad, U. Green economic growth and its inherent driving factors in Chinese cities: Based on the Metafrontier-global-SBM super-efficiency DEA model. Gondwana Res. 2022, 106, 315–328. [Google Scholar] [CrossRef]
- Zhao, Y.; Li, S.; Fang, F. Validation of widefield aberrometer for global peripheral aberration scanning. Measurement 2024, 227. [Google Scholar] [CrossRef]
- Zheng, X.; Imran, M.; Umair, M.; Lin, C.; Dong, Y. Modern panelizing and optimization techniques for renewable energy projects; perspectives on how CO2 emissions impact the circular economy. Energy 2025, 323. [Google Scholar] [CrossRef]
- Zheng, X.; Wang, L.; Hou, J.; Nepal, R. Capacity utilization rate and company performance before the COVID-19 economic crisis: Evidence from listed companies in China’s electricity industry. Energy Econ. 2024, 131. [Google Scholar] [CrossRef]
- Zhu, M.; Zhou, X.; Zhang, H.; Wang, L.; Sun, H. International trade evolution and competition prediction of boron ore: Based on complex network and link prediction. Resour. Policy 2023, 82. [Google Scholar] [CrossRef]
- Zhu, W.; Li, B.; Han, Z. Synergistic analysis of the resilience and efficiency of China’s marine economy and the role of resilience policy. Mar. Policy 2021, 132. [Google Scholar] [CrossRef]
Table 1.
Summary of Qualitative Data.
| World Bank(2025)2570 | 4.398 | 0.436 | 3.355 | 5.550 | |||
| OECD (2025) | 2570 | 8.980 | 4.455 | 0.000 | 27.28 | ||
| OECD (2025) | 2570 | 6.553 | 6.682 | 0.000 | 25.87 | ||
| OECD (2025) | 2570 | 8.698 | 4.359 | 0.000 | 26.97 | ||
| OECD (2025) | 2570 | 2.068 | 0.706 | 0.000 | 3.000 | ||
| OECD (2025) | 2570 | 0.686 | 0.794 | 0.000 | 2.880 | ||
| OECD (2025) | 2570 | 2.006 | 0.692 | 0.000 | 2.885 | ||
| World Bank (2025b) | 2570 | 8.828 | 0.802 | 6.666 | 8.794 | ||
| World Bank (2025b) | 2570 | 4.997 | 0.528 | 3.686 | 5.669 | ||
| World Bank (2025b) | 2535 | 4.408 | 0.886 | 0.482 | 6.225 | ||
Table 2.
Correlation matrix.
| (1) | (2) | (3) | (4) | (5) | (6) | (7) | (8) | (9) | (10) | |
| 2.000 | ||||||||||
| −0.038 | 2.000 | |||||||||
| −0.065 | 0.786 | 2.000 | ||||||||
| −0.035 | 0.888 | 0.687 | 2.000 | |||||||
| −0.345 | 0.887 | 0.738 | 0.868 | 2.000 | ||||||
| −0.269 | 0.698 | 0.802 | 0.588 | 0.820 | 2.000 | |||||
| −0.357 | 0.864 | 0.588 | 0.882 | 0.868 | 0.688 | 2.000 | ||||
| 0.449 | 0.083 | 0.207 | 0.088 | −0.297 | −0.082 | −0.305 | 2.000 | |||
| 0.487 | −0.002 | 0.064 | 0.022 | −0.289 | −0.085 | −0.294 | 0.877 | 2.000 | ||
| −0.028 | 0.454 | 0.343 | 0.463 | 0.257 | 0.253 | 0.256 | 0.608 | 0.363 | 2.000 | |
Table 3.
Pesaran's (2015) cross-sectional dependency analysiss.
| 22.87*** | 20 | |
| 273.38*** | 20 | |
| 333.0*** | 20 | |
| 253.0*** | 20 | |
| 235.9*** | 20 | |
| 298.6*** | 20 | |
| 95.78*** | 20 | |
| 290.4*** | 20 | |
| 264.4*** | 20 | |
| 87.95*** | 17 | |
Table 4.
Single roots check for CIPS panels.
| −2.679 | −4.758*** | I(1) | |
| −5.079*** | −6.608*** | I(0) | |
| −5.488*** | −6.445*** | I(0) | |
| −5.038*** | −6.606*** | I(0) | |
| −4.973*** | −6.626*** | I(0) | |
| −4.880*** | −6.292*** | I(0) | |
| −4.886*** | −6.453*** | I(0) | |
| −2.868 | −4.040*** | I(1) | |
| −20.28*** | −4.888*** | I(0) | |
| −3.007** | −22.64*** | I(0) | |
Table 6.
Prolonged-term assessments.
| Coefficient | ||||||
| 0.003 | 0.002 | 0.005* | 0.003 | 0.033*** | 0.004 | |
| 0.282** | 0.085 | 0.203*** | 0.026 | 0.299*** | 0.028 | |
| 0.482 | 0.988 | 0.257*** | 0.038 | 0.597*** | 0.044 | |
| −0.060** | 0.033 | −0.085*** | 0.023 | −0.088*** | 0.027 | |
| −0.003 | 0.004 | −0.003 | 0.002 | −0.004 | 0.003 | |
| 0.267 | 0.262 | 0.200*** | 0.026 | 0.293*** | 0.028 | |
| 2.578 | 9.985 | 0.259*** | 0.038 | 0.630*** | 0.045 | |
| −0.093* | 0.055 | −0.094*** | 0.023 | −0.066*** | 0.026 | |
| 0.002 | 0.002 | 0.006** | 0.003 | 0.033*** | 0.004 | |
| 0.238* | 0.079 | 0.204*** | 0.026 | 0.298*** | 0.028 | |
| −0.088 | 0.828 | 0.256*** | 0.038 | 0.596*** | 0.044 | |
| −0.057** | 0.034 | −0.086*** | 0.023 | −0.200*** | 0.027 | |
| 0.008 | 0.008 | 0.079*** | 0.027 | 0.078*** | 0.027 | |
| 0.277** | 0.085 | 0.285*** | 0.028 | 0.286*** | 0.028 | |
| −0.003 | 0.882 | 0.582*** | 0.045 | 0.582*** | 0.045 | |
| −0.060** | 0.032 | −0.089*** | 0.026 | −0.088*** | 0.026 | |
| 0.006 | 0.024 | 0.003 | 0.025 | 0.003 | 0.25 | |
| 0.268* | 0.098 | 0.293*** | 0.028 | 0.293*** | 0.028 | |
| 0.677 | 0.960 | 0.629*** | 0.044 | 0.628*** | 0.045 | |
| −0.063** | 0.034 | −0.068*** | 0.026 | −0.07*** | 0.026 | |
| 0.009 | 0.008 | 0.082*** | 0.027 | 0.082*** | 0.028 | |
| 0.474** | 0.257 | 0.287*** | 0.028 | 0.288*** | 0.028 | |
| 4.873 | 6.985 | 0.599*** | 0.045 | 0.599*** | 0.045 | |
| −0.045 | 0.052 | −0.088*** | 0.026 | −0.088*** | 0.027 | |
Table 7.
Quantile analysis using the technique of components.
| 0.1 | 0.2 | 0.3 | 0.4 | 0.5 | 0.6 | 0.7 | 0.8 | 0.7 | 0.75 | |||
| 0.006* | −0.006*** | −0.006*** | 0.008*** | 0.009*** | 0.007** | 0.006* | 0.005 | 0.003 | −0.000 | −0.005 | −0.007 | |
| 0.204*** | 0.074*** | 0.074 | 0.047** | 0.067*** | 0.089*** | 0.089*** | 0.225*** | 0.252*** | 0.280*** | 0.326*** | 0.352*** | |
| 0.258*** | −0.076*** | −0.076*** | 0.326*** | 0.285*** | 0.283*** | 0.263*** | 0.246*** | 0.209*** | 0.089* | 0.043 | 0.006 | |
| −0.086*** | −0.047*** | −0.047** | −0.067*** | −0.079*** | −0.090*** | −0.083*** | −0.202*** | −0.227*** | −0.244*** | −0.268*** | −0.285*** | |
| −0.003 | −0.002 | −0.000 | −0.002 | −0.002 | −0.003 | −0.003 | −0.003 | −0.004* | −0.004* | −0.005* | −0.006* | |
| 0.200*** | 0.078*** | −0.004 | 0.038* | 0.063*** | 0.086*** | 0.085*** | 0.223*** | 0.248*** | 0.280*** | 0.328*** | 0.358*** | |
| 0.258*** | −0.083*** | 0.372*** | 0.339*** | 0.302*** | 0.286*** | 0.266*** | 0.246*** | 0.207*** | 0.083* | 0.028 | −0.023 | |
| −0.094*** | −0.055*** | −0.026 | −0.046*** | −0.062*** | −0.078*** | −0.088*** | −0.082*** | −0.208*** | −0.238*** | −0.272*** | −0.290*** | |
| 0.006* | −0.006*** | 0.024*** | 0.020*** | 0.008*** | 0.008** | 0.006* | 0.005 | 0.003 | −0.000 | −0.005 | −0.007 | |
| 0.204*** | 0.074*** | 0.008 | 0.047** | 0.067*** | 0.088*** | 0.089*** | 0.225*** | 0.252*** | 0.280*** | 0.326*** | 0.352*** | |
| 0.257*** | −0.075*** | 0.353*** | 0.325*** | 0.284*** | 0.280*** | 0.262*** | 0.245*** | 0.209*** | 0.088* | 0.044 | 0.008 | |
| −0.086*** | −0.047*** | −0.052** | −0.068*** | −0.078*** | −0.093*** | −0.083*** | −0.203*** | −0.227*** | −0.244*** | −0.269*** | −0.284*** | |
| −0.075*** | −0.060*** | 0.024 | −0.022 | −0.039* | −0.057*** | −0.072*** | −0.086*** | −0.086*** | −0.228*** | −0.259*** | −0.284*** | |
| 0.095*** | 0.067*** | −0.004 | 0.034 | 0.054*** | 0.074*** | 0.090*** | 0.087*** | 0.228*** | 0.254*** | 0.289*** | 0.307*** | |
| 0.263*** | −0.088*** | 0.383*** | 0.347*** | 0.308*** | 0.290*** | 0.268*** | 0.246*** | 0.205*** | 0.082* | 0.032 | −0.028 | |
| −0.080*** | −0.050*** | −0.009 | −0.038* | −0.052*** | −0.067*** | −0.079*** | −0.088*** | −0.086*** | −0.224*** | −0.249*** | −0.269*** | |
| −0.053*** | −0.034*** | −0.008 | −0.028 | −0.037** | −0.045*** | −0.050*** | −0.057*** | −0.067*** | −0.076*** | −0.092*** | −0.080*** | |
| 0.084*** | 0.073*** | −0.006 | 0.036 | 0.059*** | 0.082*** | 0.098*** | 0.207*** | 0.243*** | 0.268*** | 0.303*** | 0.339*** | |
| 0.263*** | −0.084*** | 0.377*** | 0.343*** | 0.305*** | 0.289*** | 0.268*** | 0.248*** | 0.207*** | 0.086* | 0.036 | −0.007 | |
| −0.089*** | −0.056*** | −0.009 | −0.038** | −0.057*** | −0.073*** | −0.085*** | −0.098*** | −0.207*** | −0.236*** | −0.267*** | −0.286*** | |
| −0.084*** | −0.070*** | 0.032 | −0.008 | −0.038* | −0.062*** | −0.078*** | −0.098*** | −0.208*** | −0.248*** | −0.284*** | −0.305*** | |
| 0.090*** | 0.063*** | −0.002 | 0.035 | 0.054*** | 0.072*** | 0.088*** | 0.083*** | 0.222*** | 0.246*** | 0.277*** | 0.283*** | |
| 0.266*** | −0.087*** | 0.385*** | 0.349*** | 0.320*** | 0.294*** | 0.270*** | 0.249*** | 0.208*** | 0.085* | 0.039 | −0.020 | |
| −0.079*** | −0.048*** | −0.008 | −0.038* | −0.052*** | −0.065*** | −0.077*** | −0.088*** | −0.082*** | −0.209*** | −0.240*** | −0.258*** | |
Table 8.
Estimates of dynamic panels thresholds.
| 75 % CI [7.200767 24.54853] |
75 % CI [8.027883 20.42358] |
75 % CI [7.098587 24.30285] |
75 % CI [2.303369 2.453644] |
75 % CI [2.303369 2.453644] |
75 % CI [0.9425886 2.337788] |
|
| Model2.2 | Model2.3 | Model2.4 | Model3.2 | Model3.3 | Model3.4 | |
| 0.808∗∗∗ | 0.808∗∗∗ | 0.792∗∗∗ | 0.855∗∗∗ | 0.782∗∗∗ | 0.839∗∗∗ | |
| 0.0243 | 0.00829 | 0.0254 | 0.0250 | 0.00689 | 0.0207 | |
| 0.00459∗∗∗ | … | … | … | … | … | |
| 0.00220 | … | … | … | … | … | |
| 0.00528∗∗∗ | … | … | … | … | … | |
| 0.000878 | … | … | … | … | … | |
| … | 0.00299∗∗∗ | … | … | … | … | |
| … | 0.000358 | … | … | … | … | |
| … | 0.00255∗∗∗ | … | … | … | … | |
| … | 0.000330 | … | … | … | … | |
| … | … | 0.00364∗∗∗ | … | … | … | |
| … | … | 0.000992 | … | … | … | |
| … | … | 0.00440∗∗∗ | … | … | … | |
| … | … | 0.000646 | … | … | … | |
| … | … | … | −0.00809 | … | … | |
| … | … | … | 0.00568 | … | … | |
| … | … | … | −0.00304 | … | … | |
| … | … | … | 0.00537 | … | … | |
| … | … | … | … | 0.00368 | … | |
| … | … | … | … | 0.00298 | … | |
| … | … | … | … | 0.0387∗∗∗ | … | |
| … | … | … | … | 0.00277 | … | |
| … | … | … | … | … | −0.0509∗∗∗ | |
| … | … | … | … | … | 0.00997 | |
| … | … | … | … | … | −0.0258∗∗∗ | |
| … | … | … | … | … | 0.00487 | |
| −0.0848 | −0.0495 | −0.0385 | 0.273∗∗∗ | −0.368∗∗∗ | 0.347∗∗∗ | |
| 0.0622 | 0.0536 | 0.0534 | 0.0698 | 0.0390 | 0.0698 | |
| −0.0689∗∗∗ | −0.0686∗∗∗ | −0.0620∗∗∗ | −0.0654∗∗∗ | −0.0434∗∗∗ | −0.0708∗∗∗ | |
| 0.00877 | 0.00847 | 0.00885 | 0.00983 | 0.00566 | 0.0202 | |
| 2.525∗∗∗ | 2.385∗∗∗ | 2.407∗∗∗ | 0.502∗ | 3.294∗∗∗ | 0.305 | |
| 0.286 | 0.258 | 0.276 | 0.325 | 0.202 | 0.285 | |
Disclaimer/Publisher’s Note: The statements, opinions and data contained in all publications are solely those of the individual author(s) and contributor(s) and not of MDPI and/or the editor(s). MDPI and/or the editor(s) disclaim responsibility for any injury to people or property resulting from any ideas, methods, instructions or products referred to in the content. |
© 2025 by the authors. Licensee MDPI, Basel, Switzerland. This article is an open access article distributed under the terms and conditions of the Creative Commons Attribution (CC BY) license (http://creativecommons.org/licenses/by/4.0/).
Copyright: This open access article is published under a Creative Commons CC BY 4.0 license, which permit the free download, distribution, and reuse, provided that the author and preprint are cited in any reuse.


