
Submitted:
14 February 2025
Posted:
19 February 2025
You are already at the latest version
Abstract
Against the backdrop of global efforts to achieve sustainability and low-carbon development, this study examines the impact of green finance on regional technological innovation in China, with a particular focus on the mediating role of R&D investment. Using panel data from 30 Chinese provinces spanning 2008 to 2021, we employ fixed-effects and mediation models to analyze the relationships. The findings reveal a significant positive correlation between green finance and regional technological innovation, with R&D investment serving as a partial mediator in this relationship. Additionally, regional innovation and entrepreneurship capabilities strengthen the influence of green finance on R&D investment. However, in regions with higher innovation and entrepreneurship capacities, the marginal effect of R&D investment diminishes. Based on these results, the study proposes targeted policy recommendations, including enhancing green finance policies, improving financial institution services, promoting enterprise-led R&D activities, and fostering regional collaboration to achieve balanced innovation development. These insights provide both theoretical and practical implications for leveraging green finance to advance sustainable innovation.
Keywords:
green finance
; regional technological innovation
; fixed effects
; mediating effects
; R&D investment
1. Introduction
Technological innovation serves as a critical driver for high-quality economic development, significantly enhancing regional competitiveness and promoting sustainable progress [1]. In recent years, Chinese regions have intensified their focus on technological innovation, strategically allocating resources to research and development (R&D) and systematically improving innovation frameworks. These efforts have yielded substantial improvements in R&D investment and innovation systems, thereby strengthening regional innovative capabilities. Data from the National Bureau of Statistics reveal remarkable growth in China's technological innovation landscape. The total expenditure on research and experimental development reached 3,327.8 billion yuan in 2023, representing a 233-fold increase from 1991, with an average annual growth rate of 18.6% [2]. Moreover, R&D investment as a percentage of GDP expanded from 0.6% in 1991 to 2.64% in 2023, positioning China 12th globally in this metric [3].
The pursuit of green economic transformation has become a global priority, with nations integrating green growth strategies and positioning regional technological innovation as a fundamental element of sustainable development [4]. Green finance channels capital towards technological innovation, thereby enhancing resource allocation efficiency and strengthening regional innovative potential. Key indicators substantiate this trend. The China Regional Science and Technology Innovation Evaluation Report 2024 indicates that the national comprehensive science and technology innovation index reached 78.43 points, representing a 1.30-point year-on-year improvement [5]. The global green bond market expanded to $587.6 billion in 2023, with a 15% annual growth [6]. In China, green credit increased from 7.59 trillion yuan in 2014 to 30.08 trillion yuan in 2023, demonstrating an average annual growth rate exceeding 29% [7]. Green finance demonstrates remarkable potential in propelling green economic transformation. It provides substantial impetus to regional technological innovation through strategic capital allocation and targeted investment mechanisms.
With the advancement of global sustainable development strategies, green finance has emerged as a key mechanism for driving economic transformation. Its impact on regional innovation mechanisms has attracted significant attention from scholars and policymakers. However, existing studies primarily focus on the environmental effects of green finance, with insufficient research on its role in fostering regional technological innovation. In particular, there is a lack of systematic exploration of the mediating role of R&D investment between green finance and regional innovation, as well as the moderating effect of regional innovation capacity on this process. This study aims to construct a comprehensive theoretical framework and conduct empirical analysis to explore how green finance enhances regional innovation capacity through R&D investment. Furthermore, this study investigates how regional innovation and entrepreneurship capacity moderate the relationship between green finance and regional innovation. The findings provide specific theoretical insights and actionable policy recommendations to foster sustainable regional innovation development.
The contributions of this study are reflected in several key aspects. First, it expands the theoretical framework on the relationship between green finance and regional innovation. Compared to Zhou [8], who focused primarily on the environmental effects of green finance, this study develops a more complex theoretical model. It systematically incorporates regional innovation and entrepreneurial capability as critical moderating variables, deepening the theoretical understanding of the intricate relationships among green finance, R&D investment, and regional innovation capacity. Second, this study reveals the mediating role of R&D investment in depth. Unlike Liu [9], who primarily examined the direct effects of green finance, this research rigorously tests the mediating role of R&D investment. It systematically uncovers the micro-level mechanisms through which green finance fosters regional innovation via R&D investment, significantly advancing empirical knowledge in this field.
Moreover, it offers innovative insights into regional heterogeneity. In contrast to the general perspective of Huang [10], it thoroughly examines variations in the marginal effects of R&D investment across regions with different levels of innovation capacity. This provides a more nuanced understanding of regional innovation dynamics and offers a fresh analytical perspective on regional disparities. Finally, the study proposes policy-oriented recommendations based on empirical analysis. These recommendations aim to optimize regional innovation ecosystems, improve green financing mechanisms, and facilitate sustainable economic transformation. They provide actionable guidance for policymakers, bridging the gap between academic research and practical policy implementation. These contributions offer critical theoretical support and practical insights for promoting sustainable regional innovation and development.
The paper is structured into six sections: Section 2 provides a comprehensive literature review and theoretical framework, establishing the foundation for research hypotheses. Section 3 presents a detailed data analysis, including data sources, variable definitions, and descriptive statistics. Section 4 focuses on model construction and empirical investigation, examining the impact of green finance on regional innovation capacity and the mediating role of R&D inputs. Section 5 conducts a rigorous robustness check to validate the research findings. Section 6 synthesizes the key discoveries, offers policy recommendations, discusses research limitations, and suggests avenues for future research.
2. Literature Review and Theoretical Analysis
2.1. Literature Review
This paper examines the impact of green finance on regional innovation. The relevant literature falls into two main categories. The first focuses on regional innovation, investigating its driving factors, dynamic trends, and contributions to economic development. The second explores green finance, analyzing its evolution, mechanisms, and role in promoting environmental sustainability and economic growth.
Studies on regional innovation primarily emphasize its economic effects and influencing factors. For example, regional innovation enhances innovation capacity and competitiveness by fostering collaboration among enterprises, universities, and research institutions. This collaboration strengthens the flow and integration of knowledge, technology, and resources within a region [11]. Research has shown that regional innovation capacity not only drives economic growth and industrial upgrading, but also plays a vital role in advancing green development and ecological civilization [12]. The development of regional innovation depends on various factors, including investments in R&D, levels of economic development, policy environments, and innovation ecosystems [13]. Moreover, regional innovation interacts closely with the financial environment and industrial structure, where green finance serves as a critical source of support. For instance, the synergy between innovation funding and technological advancements becomes more evident when supported by green finance [14].
The second category of research examines the mechanisms of green finance. Theoretical studies explore the components of green finance, such as green credit, securities, insurance, and investment. Ren [15] developed a green finance index that integrates these elements to support policy implementation and promote non-fossil energy adoption. Empirical research has also uncovered regional disparities in green finance development. Lv [16] used panel data to reveal these disparities and their effects on the efficacy of green finance policies. Green finance's environmental benefits are particularly notable. Meo [17], using quantitative regression, demonstrated its role in promoting green energy and reducing carbon emissions. Similarly, Rasoulinezhad [18] applied the STIRPAT model to show the positive impact of green bonds on reducing emissions and advancing green energy firms. Muganyi [19] found that China's green finance policies significantly reduced industrial gas emissions, enhancing environmental protection. Esposito [20] linked green finance policies to improved environmental governance efficiency, particularly in waste management.
In addition to environmental benefits, green finance supports sustainable economic development [8]. Zhou [21] confirmed that green finance fosters green economic growth, with more pronounced effects in China's eastern regions. Lee [22] identified its significant impact on green total factor productivity, particularly in regions with challenging environmental conditions. Liu [23] observed that green finance pilot zones have advanced regional green development through industrial upgrading and technological innovation, with noticeable regional differences. Bao [24] emphasized the role of green credit in supporting sustainable economic development across all stages of the green transition.
Some studies also examine the relationship between green finance and regional innovation. Deng [25] constructed a comprehensive analytical framework linking green finance with technological innovation and green growth, while considering environmental factors and development quality. Through panel data analysis and mediating effect tests across multiple countries, they validated the significant role of green finance in driving technological innovation. Green financial instruments such as green credit and bonds can ease enterprises' financing constraints, thereby enhancing green technological innovation [26,27]. Li [28] noted that regional green innovation could create a siphoning effect on resources from surrounding areas, affecting the innovation process. This underscores the need for targeted government policies to optimize green financial instruments.
However, there is limited research systematically exploring how green finance influences regional innovation from a regional perspective. This study addresses this gap by investigating the relationship and mechanisms between green finance and regional innovation using comprehensive regional data. It extends the literature on the economic effects of green finance and provides new insights and empirical evidence for promoting high-quality regional innovation in China.
2.2. Theoretical Analysis and Research Hypotheses
Green finance directly promotes green technological innovation and reduces environmental pollution, such as PM2.5 emissions. However, regional differences and enterprise characteristics may significantly influence these effects [29]. Irfan [30], from the perspective of industrial structure and R&D investment, applied the DID method to confirm the positive role of inclusive green finance in green innovation. The study identified industrial restructuring, economic growth, and R&D investment as key mechanisms linking green finance to regional innovation.
R&D investment serves as a vital channel through which green finance fosters regional innovation [31]. Specifically, green finance alleviates corporate financing constraints, thereby increasing R&D investment and enhancing regional innovation capabilities [32]. Further research by Yulin [33] highlights the regional and enterprise-level variations in this relationship, underscoring the critical and complex role of R&D investment in linking green finance to regional innovation.
Based on this analysis, we propose the following research hypotheses:
Hypothesis 1: Green finance (GF) significantly enhances regional innovation capability (RIC).
Hypothesis 2: Green finance (GF) indirectly promotes regional innovation capability (RIC) by increasing R&D investment (RD), with R&D investment serving as a mediating variable between green finance and regional innovation.
Moreover, the impact of green finance on regional innovation is not a single mechanism. In this process, regional innovation and entrepreneurial capabilities influence the efficiency of R&D resource allocation and the transformation of innovation outcomes, amplifying the role of green finance [34]. In addition, green finance instruments such as green insurance and funds provide enterprises with risk protection, encouraging investment in green technology R&D [35]. Policy support and market incentives further facilitate the diffusion and application of green technologies [36]. Green finance also drives industrial upgrading and technological development, contributing to regional innovation capabilities [37].
Drawing on this comprehensive framework, we further propose the following research hypotheses to be tested:
Hypothesis 3: Regional innovation and entrepreneurial capability (IU) moderate the relationship between green finance (GF) and regional innovation capability (RIC) through R&D investment (RD). Enhanced regional innovation and entrepreneurial capabilities strengthen the indirect effects of green finance on regional innovation.
As shown in Figure 1. Impact mechanism pathway diagram, green finance (GF) indirectly affects regional innovation capability (RIC) through R&D investment (RD), with regional innovation and entrepreneurial capability (IU) moderating this mediating effect. The interaction between GF and IU underscores regional heterogeneity in the impact of green finance.
3. Methodological Approach
3.1. Acquisition of Data Sources
This study examines the impact of China’s green finance initiatives on regional innovation capacity over 14 years (2008–2021). Data are collected from official publications and reliable databases, including the China Statistical Yearbook, China Regional Innovation Capacity Evaluation Report, China Financial Statistics Yearbook, China Science and Technology Statistics Yearbook, China Energy Statistics Yearbook, CSMAR, and CCEER. The analysis period begins with the 2007 issuance of the Opinions on Implementing Environmental Protection Policies and Regulations to Prevent Credit Risks, which initiated China's green finance efforts. The sample includes 30 provinces in mainland China (excluding Hong Kong, Macao, Taiwan, and Tibet), totaling 420 observations. Data selection adhered to modeling requirements to ensure precision, representativeness, and reliability.
3.2. Introduction to Variables
3.2.1. Explained Variables
Regional Innovation Capability (RIC) is measured using the provincial "China Regional Innovation Capability Comprehensive Utility Value" from the "China Regional Innovation Capability Evaluation Report (2008-2021)". This indicator is evaluated from five aspects:
Knowledge Creation (15%): Based on Schumpeter's innovation theory [38], it emphasizes original innovation capability and reflects the regional potential for fundamental scientific discoveries and technological breakthroughs.
Knowledge Acquisition (15%): According to the national innovation system theory [39], it highlights inter-regional knowledge flow and embodies the dynamic process of technology diffusion and cross-regional innovation collaboration.
Enterprise Innovation (25%): Following the resource-based view [40], it considers enterprises as the micro-subjects of innovation, focusing on examining enterprise R&D investment, technological innovation capability, and new product development.
Innovation Environment (25%): Referring to the regional innovation system theory [41], it emphasizes the support role of institutions and ecosystems for innovation, including innovation policy, science and technology finance, and talent environment.
Innovation Performance (20%): It reflects the ultimate economic and social value of innovation.
These weights are scientifically determined through expert Delphi method assessment, empirical analysis of historical data, reference to the international innovation index system, and in combination with the characteristics of China's regional innovation. The weight distribution not only reflects the contribution of each dimension to regional innovation capability but also balances theoretical insight and empirical evidence. It is a comprehensive measure of regional innovation capability and is suitable for in-depth empirical analysis (Table 1. Regional innovation capacity indicator system).
3.2.2. Explanatory Variables
The Green Finance Development Index (GFDI) is constructed using the entropy method, aiming to comprehensively and objectively evaluate the multidimensional characteristics of green finance development. This index integrates four core dimensions—green credit, green securities, green insurance, and green investment—to systematically reflect the overall development level of green finance. Specifically, the weight allocation of each dimension is scientifically justified: green credit accounts for 50%, highlighting the strategic role of financial resource allocation in promoting green development [42]; green securities account for 25%, reflecting institutional innovation in the green transformation of capital markets [43]; green insurance accounts for 15%, emphasizing the critical role of risk management in environmental governance [44]; and green investment accounts for 10%, measuring resource inputs into actual environmental governance [45].
The data sources include the China Financial Statistics Yearbook, China Securities Yearbook, China Insurance Statistics Yearbook, and China Regional Green Finance Development Report. The weight allocation follows a rigorous academic rationale: first, it draws on cutting-edge research in green finance development, incorporating the latest theoretical advancements in academia [46]; second, it adopts methodologies from international green finance index construction to align with global standards [47]; and third, it employs the Delphi method, combining expert evaluations with the marginal contributions of each field to green development, ensuring the scientific and systematic nature of the index framework.
The construction of the green finance index using the entropy value method involves the following steps:
Normalization of Indicators: Raw data are standardized to eliminate the effects of differing units and scales. For positive indicators, the normalization formula is:
For negative indicators, the normalisation formula is adjusted to:
where represents the observed value of the ith indicator in the jth region; is the standardised value.
②Calculation of Information Entropy: Based on the standardized values, the entropy for each indicator is computed, reflecting the degree of data variability.
③Assignment of Indicator Weights: Using the calculated information entropy, the weight of each indicator () is determined:
④Synthesis of the Green Financial Development Index: Finally, the composite index is derived by aggregating the weighted standardized values:
where is the standardised value of the ith indicator.
This method yields an objective and comprehensive green finance development index (detailed in Table 2. Green finance development index indicator system), which captures the multidimensional nature of green finance. This index forms a robust explanatory variable for subsequent empirical analysis.
3.2.3. Control Variables
To ensure robust estimation of green finance’s impact on regional innovation, this study incorporates the following control variables: ① Industrial structure (ind): Measured by the ratio of secondary industry value added to GDP, derived from the China Statistical Yearbook, it reflects the impact of the high-tech industry’s proportion on innovation capability [48]. ② Human capital (lnhes): Represented by the number of higher education institutions per province, sourced from the China Science and Technology Statistical Yearbook, it indicates the fundamental element driving regional innovation. ③ Urbanization level (ur): Measured by the urbanization rate from the China Statistical Yearbook, it highlights the role of urbanization in promoting the agglomeration of innovative resources. ④ Emphasis on technology (techi): Proxied by the proportion of fiscal expenditure on science and technology, sourced from the China Science and Technology Statistical Yearbook, it assesses the level of regional support for innovation. ⑤ Carbon emissions (lnco2): Measured using total emissions data from the China Energy Statistical Yearbook, it reflects the role of environmental pressure in promoting green technology innovation [49]. ⑥ Capital investment (capi): Calculated as the ratio of fixed asset investment to GDP, using data from the CSMAR and CCEER Databases, it measures the capacity of capital to support innovative activities. These variables, along with a fixed effects double-cluster model controlling for provincial and time effects, enhance the reliability of the results. Table 3. Variable definitions and descriptions provides detailed information on the variables.
3.2.4. Mediating and Moderating Variables
This study uses R&D investment (RD) as a mediating variable to explore the mechanism of action of green finance on regional innovation. RD, defined as the ratio of R&D expenditure to GDP, signifies regional commitment to innovation-driven development. The innovation diffusion theory [53] and resource-based theory [54] emphasize RD as a catalyst for technological advancement. Previous studies [54] confirm RD’s mediating role between green finance and innovation, especially in resource- and technology-intensive sectors. Therefore, incorporating RD into this study not only helps to clarify the pathways of green finance’s impact on innovation but also fills a research gap in the existing literature.
Simultaneously, regional innovation and entrepreneurship capacity (IU) is selected as a moderating variable to analyze the heterogeneity of the impact of green finance on regional innovation. IU encompasses the capabilities of both enterprises and individuals in innovation, technology advancement, and entrepreneurial activities. According to the innovation diffusion theory, regions with strong innovation and entrepreneurship capacities are more active in technological innovation activities, and the promotional effect of green finance is more pronounced [53]. Therefore, IU regulates the relationship between green finance and regional innovation by enhancing the innovation environment, thereby promoting the development and application of green technologies.
3.3. Data Description
This study applies logarithmic transformation to the variables and removes extreme values from both ends of the continuous variables (top 1%) to reduce the impact of outliers. Based on 420 observations, we conducted descriptive statistical analysis, revealing the key characteristics of the dataset, which forms the foundation for subsequent empirical research.
Regarding regional innovation capacity, the mean logarithmic value (lnric) is 3.359, with a standard deviation of 0.309. This suggests significant regional differences in innovation capacity. The median value is 3.315, which is slightly lower than the mean, indicating that many regions have relatively weaker innovation capacities and require policy intervention to boost their innovation levels.
The average value of the Green Finance Development Index (gf) is 0.152, with a standard deviation of 0.063, showing substantial regional variation. The index ranges from 0.072 to 0.450, with the median slightly below the average, suggesting that the level of green finance development is moderate in most regions.
As for the control variables, indicators such as industrial development (ind), human capital (hes), urbanization rate (ur), and technological maturity (techi) display considerable variability, which may significantly affect regional innovation capacity. Environmental factors, particularly the fluctuations in CO2 emissions, play a crucial role in understanding the impact of green finance on innovation. On the other hand, capital investment (capi) exhibits relatively little variation across regions.
These statistical findings provide valuable insights for the empirical analysis, revealing the distribution characteristics of each variable and their potential impact on the research outcomes. Detailed statistical results are presented in Table 4. Descriptive statistics of variables
This study assesses multicollinearity by calculating the Variance Inflation Factor (VIF) and Tolerance. As shown in Table 5. Multiple covariance test, all variables have VIF values below 3, with the maximum value being 2.93 for the "techi" variable and an average value of 2.01, well below the commonly accepted threshold of 10. Tolerance values are all greater than 0.1, with a minimum of 0.341 for the "techi" variable. These results suggest that multicollinearity among the independent variables is not a concern.
3.4. Empirical Model
To thoroughly examine the influence of green finance on regional innovation capacity, this study employs a fixed effects model, a single mediation model, and a moderated mediation model. Each model is selected based on its suitability for explaining the relationship between green finance and regional innovation capacity, in line with the theoretical framework.
3.4.1. Fixed Effects Model
To address the potential influence of regional heterogeneity and time-invariant factors on regional innovation capacity, this study employs a fixed-effects model. The selection of this model is based on the results of the Hausman test, which indicate its appropriateness for the analysis. This model effectively accounts for individual and temporal fixed effects, mitigating their impact on the dependent variable. Consequently, it allows for a more precise estimation of the effect of green finance on regional innovation capacity. The model is formulated as follow:
which represents regional innovation capacity; represents green finance, and are the control variables, the and represent regional and year control variables, respectively; represents the random error term.
3.4.2. Mediated Effects Model
To explore the mechanism through which green finance influences regional innovation capacity via research and development (RD) investment intensity, the study sets up a system of recursive equations, drawing on the methodological framework of Wen and Ye [55]. This approach allows for an analysis of the internal process linking green finance to regional innovation capacity, by assessing the effects of green finance on RD intensity (path a) and the subsequent effect of RD on innovation capacity (path b). The model is structured as follows:
Path a:Effect of green finance (GF) on mediating variable (RD):
Path b:Effect of mediating variable (RD) on regional innovation capacity (RIC):
where is the mediating variable. Following the research line of Wen and Ye [55], the first step is to verify the coefficient in equation (2) and the coefficient in equation (3).If both coefficients exist, the mediating effect is significant; The subsequent step entails verifying the coefficient in equation (3) , if it is significant, it indicates the existence of partial mediation effect, otherwise it is a full mediation effect; the third step compares and sign, if the same sign, it is a partial mediation effect, the weight of the mediation effect is /.The third step is to compare the signs of . If the sign is different, it is a masking effect, and the proportion of the mediating effect is |/|.
3.4.3. Moderated Mediation Model
To better understand how moderating variables influence the mediation process in the relationship between green finance and regional innovation capacity, this study draws on the research of Wen and Ye [56] to introduce a moderated mediation model .By introducing the moderating variable, Innovation and Entrepreneurship Ability (IU), the model assesses its impact on the relationship between green finance and RD investment. This, in turn, affects the indirect influence of green finance on regional innovation capacity through RD investment. The specific model is given as follows:
Effect of green finance (GF) and the moderating variable(IU) on RD (mediating variable):
Effect of RD (mediating variable) and IU (moderating variable) on regional innovation capacity (RIC):
Based on the test of Wen and Ye [56], we initially examine the coefficient of the interaction term in equation (4). If found significant, it signifies that the moderator variable (IU) exerts an influence on the relationship between the independent variable (GF) and the mediator variable (). Following this, we proceed to verify the coefficient of the interaction term in equation (5). Significance in this context indicates that the moderating variable (IU) also affects the relationship between the mediator variable () and the dependent variable (RIC), thereby confirming the existence of a regulatory mediation effect.
4. Empirical Results
4.1. Benchmark Regression Analysis
This study begins by evaluating the direct impact of green finance (gf) on regional innovation capacity (lnric). Several fixed effects models are employed for this purpose. The results of the baseline regression analysis are summarized in Table 6. Baseline regression results
In Model 1, only the core explanatory variable, green finance (gf), is included. The regression coefficient for gf is 1.315, which is statistically significant at the 1% level. This finding suggests that green finance significantly enhances regional innovation capacity. However, the adjusted R² of Model 1 is 0.067, indicating a limited explanatory power when only green finance is considered.
Model 2 incorporates province and year-fixed effects, building upon Model 1. The coefficient for gf decreases to 0.214 but remains statistically significant at the 1% level. The adjusted R² increases substantially to 0.944, demonstrating that fixed effects significantly improve the model's explanatory power.
Model 3 extends Model 1 by including control variables. With these additional factors, the coefficient for gf drops to 0.148 and loses significance. Nonetheless, variables such as industrial structure, science and technology expenditure, and capital investment show statistically significant positive effects on regional innovation capacity at the 1% level. In contrast, carbon emissions negatively affect innovation capacity at the 5% level. The adjusted R² rises to 0.771, reflecting an improvement in explanatory power.
Model 4 incorporates both fixed effects and control variables. The coefficient for gf is 0.207, remaining statistically significant at the 1% level. This result confirms that green finance exerts a positive influence on regional innovation capacity even after accounting for these factors. The adjusted R² further increases to 0.954, indicating the robustness of the model.
In summary, the baseline regression analysis establishes a statistically significant positive relationship between green finance and regional innovation capacity. This relationship remains robust after controlling for additional variables and fixed effects. The findings highlight the critical role of green finance in fostering regional innovation.
4.2. Analysis of Mediating Effects
The study further explores the mediating role of R&D investment intensity (rd) in the relationship between green finance (gf) and regional innovation capacity (lnric). To test hypothesis 2, a mediation model (Model 7) is developed, as presented in Table 7.
In Model 7, our findings reveal that green finance positively affects R&D investment intensity, with a coefficient of 0.004 (p < 0.1). This indicates that green finance encourages regions to increase their R&D investments. Additionally, R&D investment positively impacts regional innovation capacity, with a coefficient of 9.464 (p < 0.01). The coefficient for gf remains significant at 0.168 (p < 0.05), confirming the presence of a partial mediation effect. The Sobel Z-value is 2.347 (p < 0.05), and the bootstrap Z-value is 2.13 (p < 0.05). The mediation effect accounts for 49% of the total effect, highlighting R&D investment as a critical intermediary.
The study also examines the moderating mediation effect of regional innovation and entrepreneurship capacity (lniu) on the relationship between green finance and regional innovation capacity. A moderating mediation model (Model 8) is constructed, incorporating interaction terms.
In Model 8, the interaction term (gf × lniu) has a coefficient of 0.015 (p < 0.1). This finding suggests that regional innovation and entrepreneurship capacity enhances the positive effect of green finance on R&D investment, thereby amplifying the mediation effect. The impact of R&D investment on regional innovation capacity remains significant, with a coefficient of 11.469 (p < 0.01). The Sobel Z-value and bootstrap Z-value for the moderating mediation effect are 2.103 (p < 0.05) and -1.98 (p < 0.05), respectively. The moderating mediation effect accounts for 39.8% of the total mediation effect.
The analysis further investigates the quartile-based moderating mediation effect. As depicted in Figure 2. Quantile moderation effect plot, at lower quartiles of lniu, R&D investment has a stronger impact on regional innovation. However, as the quartile level increases, the coefficient of R&D investment gradually decreases and becomes insignificant at the 90th percentile. This suggests that regions with higher innovation and entrepreneurship capabilities rely more on other innovation drivers, diminishing the relative importance of R&D investment.
In conclusion, the results underscore the significant moderating role of regional innovation and entrepreneurship capacity in the relationship between green finance and regional innovation capacity through R&D investment. The mediation effect of R&D investment is more pronounced in regions with lower innovation capacity, offering valuable insights for policy design aimed at enhancing regional innovation through targeted support for green finance and R&D activities.
5. Robustness Tests
Table 8. Robustness tests presents the results of four robustness tests evaluating the impact of green finance on regional innovation capacity (lnric). The findings confirm the stability of green finance's positive effect under different analytical approaches, including the Bootstrap method, instrumental variable regression, variable substitution, and a modified sample period. These results demonstrate the model's robustness and reliability.
5.1. Bootstrap Method
The first robustness test uses the Bootstrap method, as shown in column 1. This nonparametric resampling approach minimizes estimation errors and enhances result stability. The regression coefficient for green finance (gf) is 0.207, significant at the 1% level (p<0.01). These findings highlight the persistent and significant positive impact of green finance on regional innovation capacity across repeated sampling, strengthening the credibility of the model. However, it is essential to note that the reliability of the Bootstrap method depends on sufficient sample data and may be biased in cases of small sample sizes.
5.2. Variable Substitution
Robustness is further tested by substituting variables, as shown in columns 2-4:
In column 2, firm-level innovation (lnci) replaces regional innovation capacity as the dependent variable. The coefficient of green finance increases to 0.684 (p<0.01), suggesting that its impact is more pronounced at the micro level.
Column 3, changes to the control variables yield a coefficient of 0.614 (p<0.01), indicating that the effect of green finance remains stable despite adjustments in the model.
Column 4, additional control variables, including openness (od), environmental emphasis (ep), financial development (fd), and region size (lnsize), are introduced. The coefficient for green finance remains significant at 0.573 (p<0.01), demonstrating the model’s robustness under an expanded framework.
5.3. Sample Period Adjustment
A final robustness test narrows the sample period to 2012–2021 (column 5). The regression coefficient increases to 0.773 (p<0.01), suggesting that green finance has a stronger influence on regional innovation capacity within a shorter timeframe. However, given the potential limitations of a restricted period, these results should be interpreted alongside other robustness tests.
5.4. Endogeneity Test
5.4.1. Endogeneity Tests for Relationships Among Variables
To address potential endogeneity issues, this study employs the instrumental variable (IV) approach and conducts two-stage least squares (2SLS) estimation. The regression results are detailed in Table 9, which presents the findings for three sets of variable relationships, each tested using two types of instrumental variables: a single instrument and a combination of two instruments.
Endogeneity Test of Green Finance (GF) and Regional Innovation (RIC):
In column (1), the first-order lag of the green finance index (gfl1) is selected as a single instrumental variable. The estimation results show that the coefficient for green finance is 0.129, which is statistically significant at the 5% level, indicating that green finance continues to significantly enhance regional innovation capacity after addressing endogeneity concerns. To further validate the robustness of the results, column (2) uses both the first-order lag of green finance (gfl1) and the level of regional economic development (lngdp) as instrumental variables. The results reveal that the coefficient for green finance remains positive and significant at 0.118, also at the 5% significance level, further supporting the positive impact of green finance on regional innovation capacity.
Endogeneity Test of R&D Investment (RD) and Regional Innovation (RIC):
In column (3), the first-order lag of R&D investment (rdl1) is used as a single instrumental variable. The estimation results indicate that the coefficient for R&D investment is 2.598, which is statistically significant at the 5% level, suggesting that R&D investment has a significant positive effect on regional innovation capacity after controlling for endogeneity. To enhance the reliability of the findings, column (4) combines the first-order lag of R&D investment (rdl1) with the level of human capital (hep) as instrumental variables. The coefficient remains significant at 2.640, further reinforcing the positive relationship between R&D investment and regional innovation capacity.
Endogeneity Test of Green Finance (GF) and R&D Investment (RD):
In column (5), the first-order lag of green finance (gfl1) is used as a single instrumental variable. The estimation results show that the coefficient for green finance is 0.175, which is statistically significant at the 5% level, indicating that green finance has a positive impact on R&D investment after addressing endogeneity issues. To further test the robustness of the results, column (6) combines the first-order lag of green finance (gfl1) with the level of financial development (fd) as instrumental variables. The coefficient remains significant at 0.170, also at the 5% level, further supporting the positive influence of green finance on R&D investment.
To ensure the validity of the instrumental variables, several statistical tests were conducted. First, the first-stage regression F-statistics in all models are well above 10, indicating a strong correlation between the instrumental variables and the endogenous variables, thus satisfying the relevance condition. Second, the Kleibergen-Paap [57] Wald F-statistics are significantly higher than the Stock-Yogo critical values at the 10% level, rejecting the weak instrument hypothesis. Additionally, the Kleibergen-Paap [57] LM test results are statistically significant, demonstrating that the instrumental variables effectively identify the endogenous variables. Finally, the Hansen J test p-values in columns (2), (4), and (6) are all greater than 0.1, further supporting the exogeneity assumption of the instrumental variables. In summary, the instrumental variables used in this study are valid and reliable, effectively addressing potential endogeneity issues.
5.4.2. Endogeneity Test for Sample Selection Bias
This study systematically examines the issue of endogeneity arising from sample selection bias using three methods—the Heckman two-step approach, propensity score matching (PSM), and weighted least squares (WLS). The detailed results of these tests are presented in Table 10, and the robustness of the core findings is validated.
(1) Heckman Two-Step Approach
The Heckman two-step approach first corrects for sample selection bias through a selection equation. In the selection equation, the variable selected is defined by the proportion of interest expenditure in high-energy-consuming industries (ei). The results show that the coefficient of the core independent variable gf is 0.498 (p < 0.01), indicating that gf significantly increases the probability of firms engaging in R&D innovation. Among the control variables, ind has a coefficient of 10.353 (p < 0.01), and lnhes has a coefficient of 2.164 (p < 0.05), both showing significant effects. The inverse Mills ratio (mills) is -0.007 (p = 0.860), which is not significant, suggesting that sample selection bias has a limited impact on the outcome model.
In the outcome equation, the coefficient of gf decreases to 0.320 (p < 0.05), indicating that the effect of the independent variable on the dependent variable lnric weakens after correcting for selection bias but remains significant. The coefficient of the control variable ind is 0.844 (p < 0.01), continuing to show significance and highlighting the importance of the high-energy-consuming industry context. The R-squared value of the model increases to 0.934, demonstrating that the explanatory power of the model improves significantly after correcting for selection bias.
(2) Propensity Score Matching (PSM)
The PSM method corrects for sample selection bias by matching the treatment and control groups. Before matching, the standardized bias of covariates (e.g., lnhes, ind, techi, etc.) is significant, with a mean exceeding 20% (as shown in Figure13. Standardized percentage bias across covariates before and after matching.). After matching, the standardized bias of all covariates decreases to below 10%, indicating a significant improvement in the balance of the sample distribution.
The average treatment effect (ATT) of the core independent variable gfdummy (a binary variable based on the 75th percentile of rdp) on the dependent variable lnric is 0.090 (p < 0.01), showing that the effect of gfdummy on lnric remains robust after controlling for covariates. Other important variables, such as ind, lnhes, and ur, also exhibit significant effects, further supporting the reliability of the core findings. Sensitivity analysis reveals consistent ATT results across different matching methods, confirming the robustness of the results. However, the reduction in sample size after matching may lead to some loss of information, and extrapolation should be approached with caution.
(3) Weighted Least Squares (WLS)
The WLS method constructs weights using the inverse of the selection probability estimated by a Probit model to correct for sample distribution bias. The regression results show that the coefficient of the core independent variable gfdummy is 0.057 (p < 0.01), indicating a significant positive effect on lnric and suggesting that sample selection bias has a limited impact on the OLS results. Other important variables, such as ind (coefficient 0.584, p < 0.05), techi (coefficient 2.466, p < 0.01), and capi (coefficient 0.508, p < 0.01), also show significant effects, supporting the rationality of the model.
The distribution of WLS weights is reasonable, concentrated between 0.8 and 1.2, with a significant correction effect. The R-squared value reaches 0.960, indicating a good model fit. The results are consistent with those of the Heckman two-step approach and PSM, further validating the robustness of the WLS results. However, the WLS method is sensitive to the accuracy of weights and sample size, necessitating a combination with other methods to comprehensively verify the research conclusions.
The results of the three methods consistently demonstrate that the core independent variable (gf or gfdummy) has a significant and robust effect on the dependent variable lnric, supporting the main conclusions of the study. The Heckman two-step approach corrects for selection bias through the inverse Mills ratio, PSM improves sample balance through matching, and WLS corrects sample distribution through weighting. These methods validate the limited impact of sample selection bias from different perspectives. Although PSM and WLS have certain limitations in terms of sample information loss and weight sensitivity, the consistency of the three methods enhances the credibility of the research findings. In conclusion, this study systematically addresses sample selection bias through multiple methods, providing strong support for the reliability of the core conclusions and offering methodological references for future research.
5.5. Research Discussion
This study demonstrates that green finance has a significant positive effect on regional innovation capability. The findings align with the research Li [28], who also emphasize that green finance enhances regional innovation efficiency by optimizing resource allocation and easing financing constraints. Unlike previous studies, this research provides evidence at the regional level, showing that green finance functions not only as a financial tool supporting green development but also as a crucial mechanism for driving technological innovation. This indicates that the impact of green finance extends beyond environmental governance, highlighting its critical role in advancing regional innovation capability.
The mediation effect analysis confirms that R&D investment serves as a key pathway through which green finance enhances regional innovation capability. This finding supports the conclusions of Xu [58], who argued that green finance pilot policies improve corporate R&D efficiency and reduce resource waste by addressing economic and political constraints. Similarly, Xu [59] and Hossain [60] identified R&D investment as a vital driver of green innovation, while Min [61] emphasized its importance in boosting regional innovation capability. However, systematic exploration of how green finance facilitates regional innovation through R&D investment remains scarce. By constructing a mediation effect model, this study advances the understanding of the mechanism through which green finance indirectly promotes technological innovation via R&D intensity. It provides both theoretical and empirical evidence for this process, offering a fresh perspective for further research.
The study also reveals that regional innovation and entrepreneurial capability significantly moderate the indirect effect of green finance on regional innovation through R&D investment. In regions with stronger innovation capabilities, the impact of green finance on R&D investment is more pronounced, while the marginal effect of regional innovation tends to decline. This observation aligns with Fritsch [62], who highlighted that regions with high innovation capability rely more on knowledge spillover and collaborative networks than on isolated capital investments. This study contributes to the literature by clarifying the dual moderating role of regional innovation capability. On one hand, regions with high innovation capability utilize green finance resources more effectively, amplifying their impact on R&D investment. On the other hand, as innovation capability improves, the marginal effect of R&D investment on technological innovation diminishes. This underscores the need for policy differentiation. In regions with high innovation capability, efforts should focus on strengthening knowledge networks and institutional support. In contrast, in regions with lower innovation capability, green finance should address the shortfall in R&D investment to enhance regional innovation efficiency.
6. Conclusions and Policy Recommendations
6.1. Conclusions
This study uses panel data from 30 Chinese provinces from 2008 to 2021, constructs a green finance development index, and incorporates data on regional innovation capability. By applying fixed effects models, mediation analysis, and a moderated mediation framework, it examines how green finance influences regional technological innovation. The research focuses on the mediating role of R&D investment and the moderating effect of regional innovation and entrepreneurial capacity in this relationship. The results show that green finance significantly promotes regional technological innovation. A portion of this effect operates through increased R&D investment. Furthermore, regional innovation and entrepreneurial capacity enhance the mediating role of R&D investment, amplifying its contribution to innovation. However, in regions with stronger innovation capacity, the marginal effect of R&D investment on innovation diminishes.
6.2. Policy Recommendations
This study offers several policy recommendations to enhance the role of green finance in regional technological innovation. Governments should refine the policy framework for green finance by establishing standardized evaluation systems for green projects and strengthening support from policy banks. Instruments such as green bonds, green credit, and tax incentives should be further promoted to direct private capital towards sustainable sectors. These measures can improve the efficiency of green finance and provide robust financial support for innovation.
Financial institutions should develop diverse green financial products and enhance risk management capabilities. These efforts can lower financing costs for enterprises engaged in green innovation and ensure resources are allocated to high-potential projects.
Enterprises should increase their R&D investment and enhance technological capacity. Partnerships with universities and research institutions should be encouraged to foster collaboration in industry-university-research initiatives. By leveraging green financial resources, firms can accelerate their transition toward sustainable practices.
Societal efforts are equally important. Local governments and communities should promote a culture of innovation through targeted programs and stronger intellectual property protection. These efforts can mobilize public creativity and attract social capital to green innovation projects.
Finally, policies should address regional disparities in innovation capacity. Regions with advanced ecosystems should focus on scaling up high-tech development, while weaker regions should receive targeted support, including additional R&D funding and technical assistance. This differentiated strategy ensures balanced regional development and maximizes the impact of green finance.
While this study enhances the understanding of how green finance fosters innovation, further research is warranted to deepen and broaden these insights. At the enterprise level, firm-level data analysis could offer more nuanced perspectives on how green finance impacts innovation across different sectors and organizational scales. Future studies could also investigate additional mediating and moderating variables, such as human capital and industrial policies, to further refine the theoretical framework. Employing advanced econometric models and multi-level data analysis may provide a more comprehensive understanding of the complex interactions between green finance and technological innovation, thereby contributing to the transition toward a sustainable economy.
Author Contributions
Conceptualization, A.L.; methodology, A.L. and J.L.; software, A.L. and J.L.; validation, A.S. and J.L.; formal analysis, A.S.; investigation, A.L.; resources, J.L.; data curation, A.L.; writing—original draft preparation, A.L. and A.S.; writing—review and editing, A.L. and J.L.; visualization, A.S.; supervision, J.L. All authors have read and agreed to the published version of the manuscript.
Funding
This research received no external funding.
Institutional Review Board Statement
Not applicable.
Informed Consent Statement
Not applicable.
Data Availability Statement
The data presented in this study are available upon request from the corresponding author.
Acknowledgments
This work was assisted by He Fei University.
Conflicts of Interest
The authors declare no conflicts of interest.
References
- Li H, Liu J, Wang H. Impact of green technology innovation on the quality of regional economic development. International Review of Economics & Finance 2024, 93,463-76. [CrossRef]
- National Bureau of Statistics of China. (2023). China Statistical Yearbook 2023. Available online: https://data.stats.gov.cn/easyquery.htm?cn=C01 (accessed on November 17, 2024).
- China's R&D expenditure exceeds 3.3 trln yuan in 2023: minister. Xinhua, 5 Mar 2024. Available online: https://english.news.cn/ 20240305/d3d97f55bdf44d40a49d9ae2224ce0dc/c.html (accessed on 26 September 2024).
- Shayegh S, Reissl S, Roshan E, Calcaterra M. An assessment of different transition pathways to a green global economy. Communications Earth & Environment 2023,4(1),448. [CrossRef]
- China Science and Technology Strategy Research Institute. China Regional Science and Technology Innovation Evaluation Report Beijing, China,2024. (In Chinese).
- Climate Bonds Initiative. Global State of the Market Report 2023. Available online:https://www.climatebonds.net/resources/reports/global-state-market-report-2023 (accessed on 26 September 2024).
- People's Bank of China. (2024). China's green loan balance exceeds 30 trillion yuan. People's Daily Overseas Edition. Available online: https://www.gov.cn/lianbo/bumen/202401/content_6928561.htm (accessed on 26 September 2024). (In Chinese).
- Zhou X, Tang X, Zhang R. Impact of green finance on economic development and environmental quality: a study based on provincial panel data from China. Science and Pollution Research 2020,27,19915-32. [CrossRef]
- Liu, J. Y., Xia, Y., Fan, Y., Lin, S. M., & Wu, J. Assessment of a green credit policy aimed at energy-intensive industries in China based on a financial CGE model. Journal of Cleaner Production 2017, 163, 293-302. [CrossRef]
- Huang, Z., Liao, G., & Li, Z. Loaning scale and government subsidy for promoting green innovation. Technological Forecasting and Social Change 2019, 144, 148-156. [CrossRef]
- Cooke P, Uranga MG, Etxebarria G. Regional innovation systems: institutional and organizational dimensions. Research Policy 1997,26(4-5),475-91.
- Xu L, Shu H, Lu X, Li T. Regional technological innovation and industrial upgrading in China: an analysis using interprovincial panel data from 2008 to 2020. Finance Research Letters 2024,105621. [CrossRef]
- Hu B, Guo P, Gao M. Enhancing high-quality development in regional innovation ecosystems. Physics and Chemistry of the Earth, Parts A/B/C 2023,132,103488. [CrossRef]
- Lin B, Zhang A. Digital finance, regional innovation environment, and renewable energy technology innovation: Threshold effects. Renewable Energy 2024,223,120036. [CrossRef]
- Ren X, Shao Q, Zhong R. Nexus between green finance, non-fossil energy use, and carbon intensity: Empirical evidence from China based on a vector error correction model. Journal of Cleaner Production 2020,277,122844. [CrossRef]
- Lv C, Bian B, Lee CC, He Z. Regional gap and the trend of green finance development in China. Energy Economics 2021,102,105476. [CrossRef]
- Meo MS, Abd Karim MZ. The role of green finance in reducing CO2 emissions: an overview. finance in reducing CO2 emissions: an empirical analysis. Borsa Istanbul Review 2022,22(1),169-78.
- Rasoulinezhad E, Taghizadeh-Hesary F. Role of green finance in improving energy efficiency and renewable energy development. Energy Efficiency 2022,15(2),14. [CrossRef]
- Muganyi T, Yan L, Sun HP. Green finance, fintech, and environmental protection: Evidence from China. Ecotechnology 2021,7,100107. [CrossRef]
- Esposito, P., Dicorato, S. L., & Doronzo, E. The effect of ownership on sustainable development and environmental policy in urban waste management: an explicatory empirical analysis of Italian municipal corporations. Business Strategy and the Environment 2021,30(2), 1067-1079. [CrossRef]
- Zhou G, Zhu J, Luo S. The impact of fintech innovation on green growth in China: Mediating effect of green finance. Ecological Economics 2022,193,107308. [CrossRef]
- Lee CC, Lee CC. How does green finance affect green total factor productivity? Evidence from China. Energy economics 2022,107,105863.
- Liu, S., & Wang, Y. Green innovation effect of pilot zones for green finance reform: Evidence of quasi natural experiment. Technological Forecasting and Social Change 2023, 186, 122079. [CrossRef]
- Bao J, He M. Does green credit promote green sustainable development in regional economies? Empirical evidence from 280 cities in China. PLOS ONE 2022,17(11), e0277569. [CrossRef]
- Deng, W., Kharuddin, S., & Ashhari, Z. M. Green finance transforms developed countries’ green growth: Mediating effect of clean technology innovation and threshold effect of environmental tax. Journal of Cleaner Production 2024, 448, 141642. [CrossRef]
- Jiang S, Liu X, Liu Z, Shi H, Xu H. Does green finance promote enterprises' green technology innovation in China? Frontiers in Environmental Science 2022,10,981013.
- Liu F, Xia Z, Lee CC. Does green credit benefit the clean energy technological innovation and how? The policy catering behavior of enterprises. Journal of Cleaner Production 2024,444,141256. [CrossRef]
- Li L, Ma X, Ma S, Gao F. Role of green finance in regional heterogeneous green innovation: evidence from China. Humanities and Social Sciences Communications 2024,11(1),1-3. [CrossRef]
- Cui Y, Zhong C, Cao J, Guo M. Can green finance effectively mitigate PM2.5 pollution? What role will green technological innovation play? Energy & Environment 2023,0958305X231204030.
- Irfan M, Razzaq A, Sharif A, Yang X. Influence mechanism between green finance and green innovation: exploring regional policy intervention effects in China. Technological Forecasting Technological Forecasting and Social Change 2022,182,121882. [CrossRef]
- Sun H, Luo Y, Liu J, Bhuiyan MA. Digital inclusive finance, R&D investment, and green technology innovation nexus. PLOS ONE 2024,19(1), e0297264. [CrossRef]
- Liu C, Dai C, Chen S, Zhong J. How does green finance affect the innovation performance of enterprises? Evidence from China. Environmental Science and Pollution Research 2023,30(35),84516-36. [CrossRef]
- Yulin W, Yahong Z. Green Finance Development and Enterprise Innovation. Journal of Finance and Economics 2023,49(01),49-62.
- Xiao Y, Shi X, Kong L. From green finance to sustainable innovation: how to unleash the potential of China's high-tech industry. Environmental Science and Pollution Research 2023,30(59),123368-82. [CrossRef]
- Liu, Y., Deng, W., Wen, H., & Li, S. Promoting green technology innovation through policy synergy: Evidence from the dual pilot policy of low-carbon city and innovative city. Economic Analysis and Policy 2024, 84, 957-977. [CrossRef]
- Huang Y, Chen C, Lei L, Zhang Y. Impacts of green finance on green innovation: a spatial and nonlinear perspective. Journal of Cleaner Production. Journal of Cleaner Production 2022,365,132548. [CrossRef]
- Jiang P, Xu C, Chen Y. Can green finance reduce carbon emission? A theoretical analysis and empirical evidence from China. Pollution Research 2024,1-6. [CrossRef]
- Schumpeter, Joseph A., and Richard Swedberg. The theory of economic development. Routledge, 2021.
- Funaba, M. Technology Policy and Economic Performance: Lessons From Japan by Christopher Freeman and Evaluating Applied Research: Lessons From Japan by John Irvine (Book Review). Japan quarterly 1988, 35(3), 326.
- Barney, J. Firm resources and sustained competitive advantage. Journal of management 1991, 17(1), 99-120.
- Cooke, P. Regional innovation systems: competitive regulation in the new Europe. Geoforum 1992, 23(3), 365-382. [CrossRef]
- Volz, U. Fostering green finance for sustainable development in Asia. In Routledge handbook of banking and finance in Asia.Routledge,2018; pp. 488-504.
- Meng, Y., Yu, J., Yu, Y., & Ren, Y. Impact of green finance on green total factor productivity: New evidence from improved synthetic control methods. Journal of Environmental Management 2024, 372, 123394. [CrossRef]
- Surminski, S., & Eldridge, J. Flood insurance in England–an assessment of the current and newly proposed insurance scheme in the context of rising flood risk. Journal of Flood Risk Management 2017, 10(4), 415-435. [CrossRef]
- Geddes, A., Schmidt, T. S., & Steffen, B. The multiple roles of state investment banks in low-carbon energy finance: An analysis of Australia, the UK and Germany. Energy policy 2018, 115, 158-170. [CrossRef]
- Dikau, S., & Volz, U. Central bank mandates, sustainability objectives and the promotion of green finance. Ecological Economics 2021,184, 107022. [CrossRef]
- Schoenmaker, D., & Van Tilburg, R. What role for financial supervisors in addressing environmental risks? Comparative Economic Studies 2016, 58, 317-334.
- Tu, W., Zhang, L., Sun, D., & Mao, W. Evaluating high-tech industries' technological innovation capability and spatial pattern evolution characteristics: Evidence from China. Journal of Innovation & Knowledge 2023, 8(1), 100287. [CrossRef]
- Shi, L., Sun, J., Lin, J., & Zhao, Y. Factor decomposition of carbon emissions in Chinese megacities. Journal of Environmental Sciences 2019,75,209-215. [CrossRef]
- He, F., Feng, Y., & Hao, J. Corporate ESG rating and stock market liquidity: Evidence from China. Economic Modelling 2023, 129, 106511. [CrossRef]
- Cortés, K. R., Demyanyk, Y., Li, L., Loutskina, E., & Strahan, P. E. Stress tests and small business lending. Journal of Financial Economics 2020,136(1), 260-279.
- Freund, L. B., Lee, H., & Rendahl, P. The Risk-Premium Channel of Uncertainty: Implications for Unemployment and Inflation, 2022. [CrossRef]
- Rogers E M. Diffusion of Innovations, 3rd ed.; Free Press: New York, United States,1962; 154–196.
- Wernerfelt B. A resource-based view of the firm. Strategic Management Journal 1984,5(2),171-180.
- Wen Z, Ye B. Analyses of mediating effects: the development of methods and models. Advances in Psychological Science 2014,22(5),731. [CrossRef]
- Wen Z, Ye B. Different methods for testing moderated mediation models: competitors or backups? Acta psychologica sinica 2014,46,49-62.
- Kleibergen, F., & Paap, R. Generalized reduced rank tests using the singular value decomposition. Journal of econometrics 2006, 133(1), 97-126. [CrossRef]
- Xu, M., & Yao, Y. The Impact of Green Finance Policy on Corporate R&D Expenses. Highlights in Business, Economics and Management 2023,15, 286-295. [CrossRef]
- Xu, J., Liu, F., & Shang, Y.R&D investment, ESG performance and green innovation performance: evidence from China. Kybernetes 2021,50(3), 737-756. [CrossRef]
- Hossain, M. R., Rao, A., Sharma, G. D., Dev, D., & Kharbanda, A. Empowering energy transition: green innovation, digital finance, and the path to sustainable prosperity through green finance initiatives. Energy Economics 2024,136,107736. [CrossRef]
- Min, S., Kim, J., & Sawng, Y. W. The effect of innovation network size and public R&D investment on regional innovation efficiency. Technological Forecasting and Social Change 2020,155,119998. [CrossRef]
- Fritsch, M., & Slavtchev, V. Determinants of the efficiency of regional innovation systems. Regional studies 2011,45(7), 905-918. [CrossRef]
Figure 1.
Impact mechanism pathway diagram.
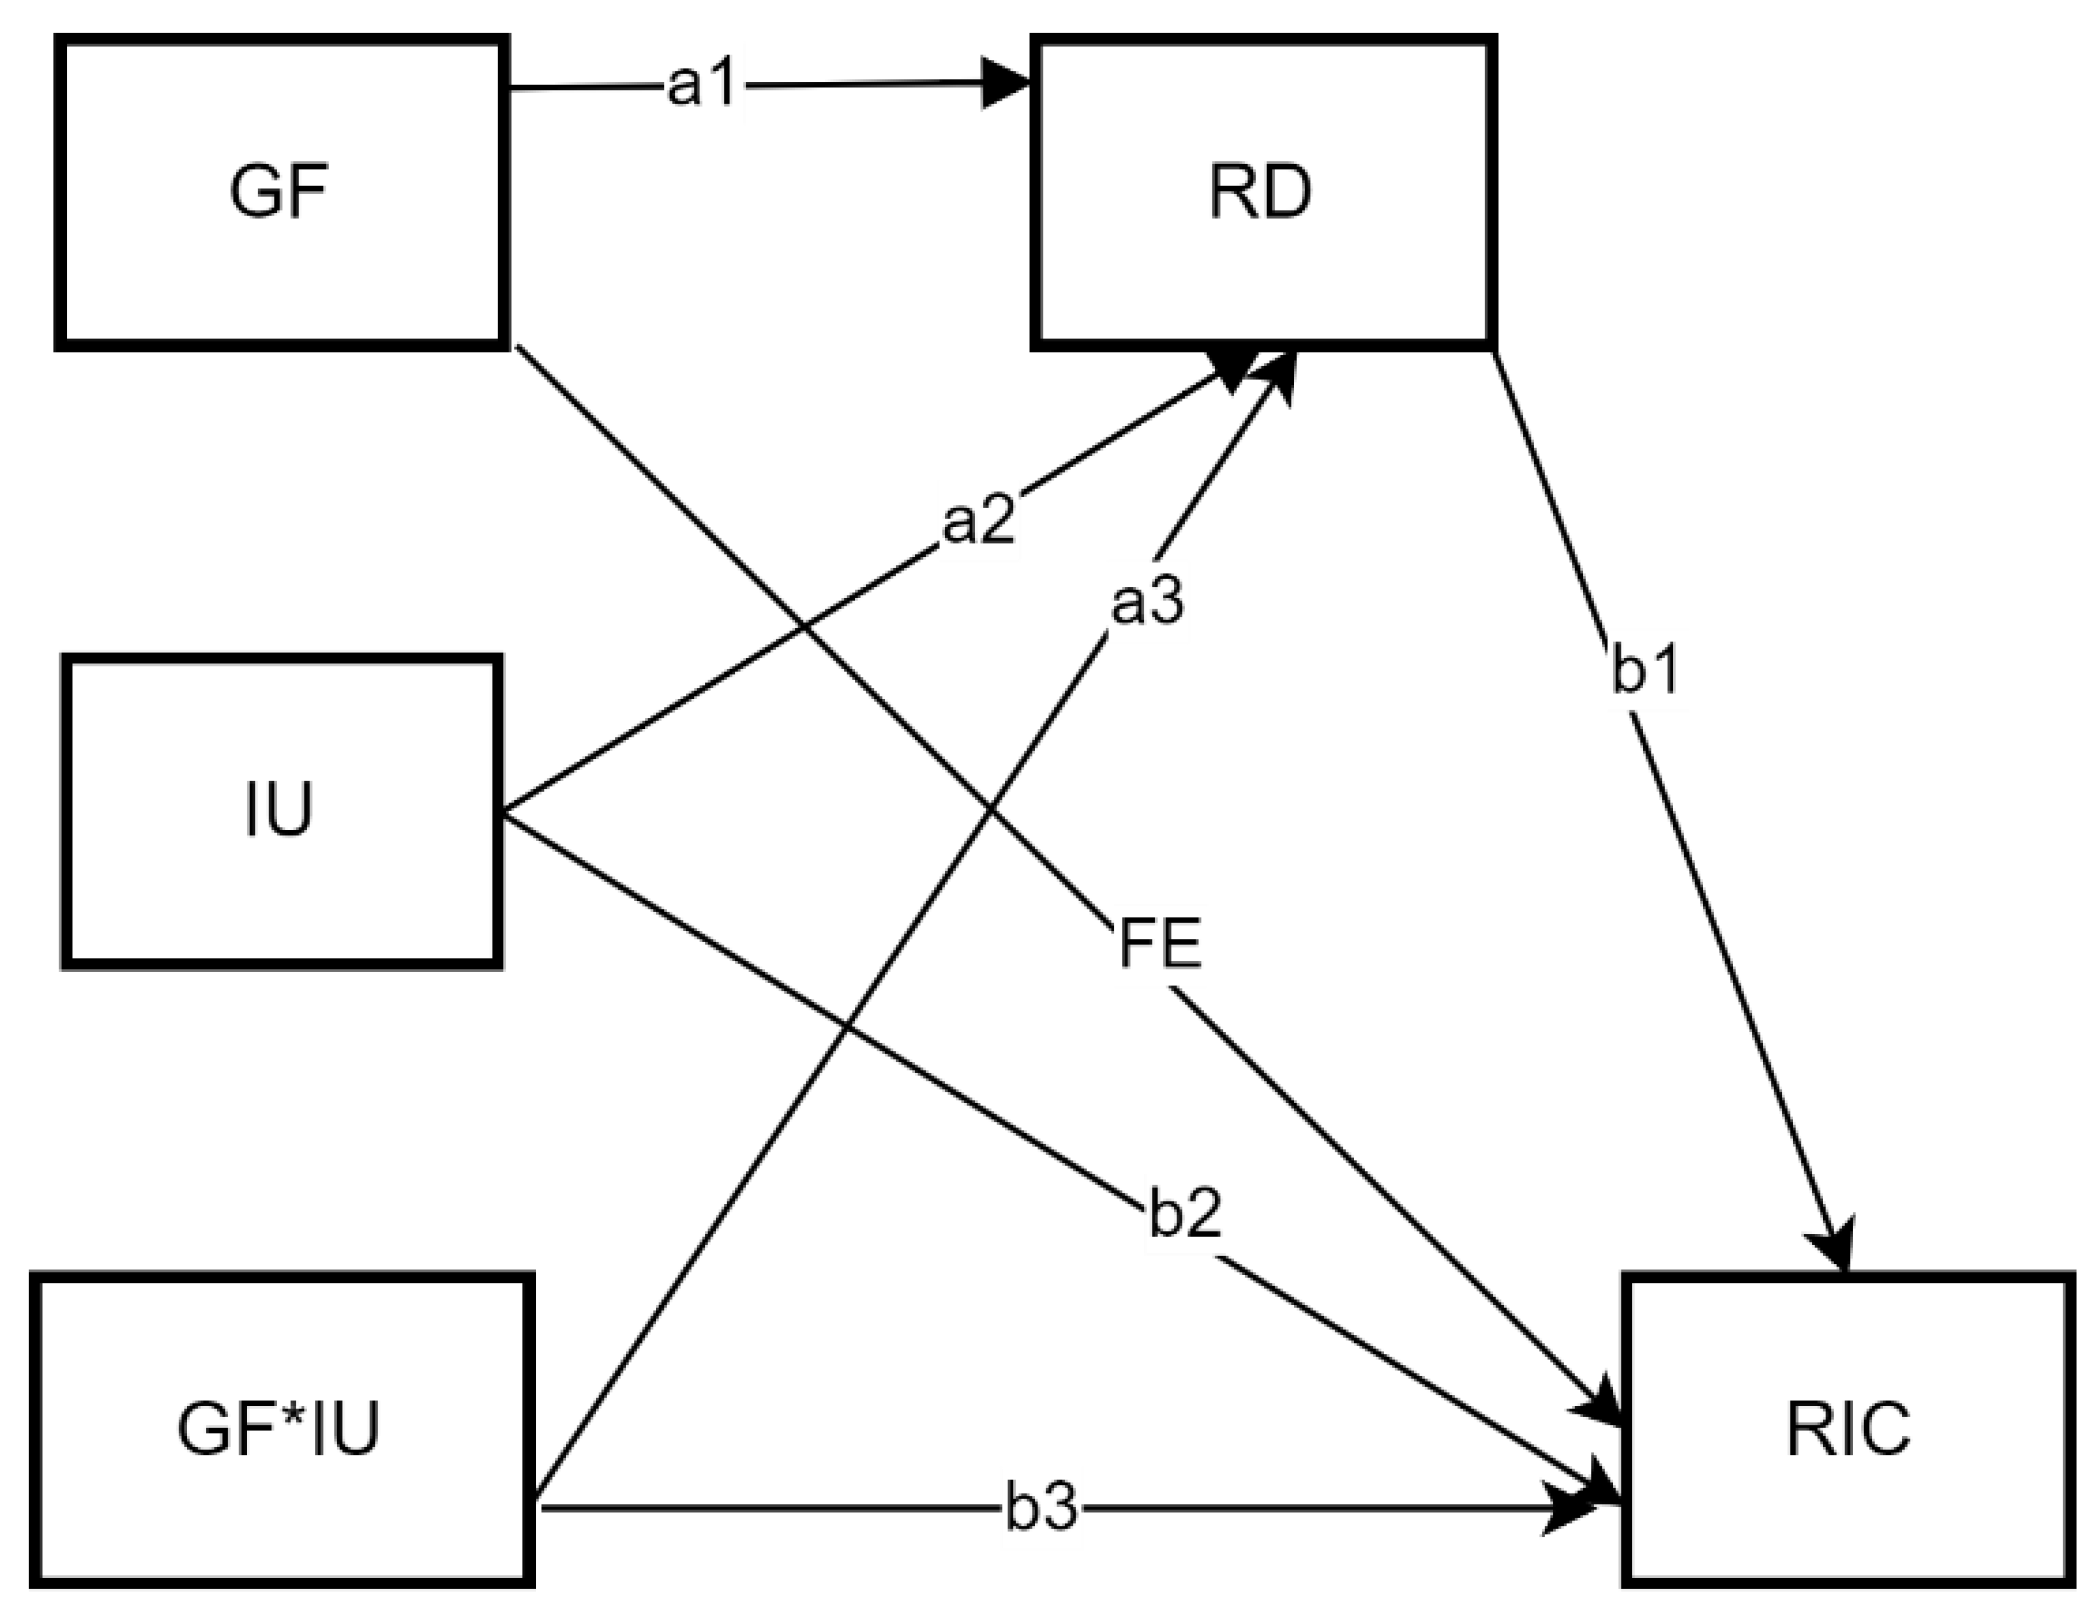
Figure 2.
Quantile moderation effect plot.
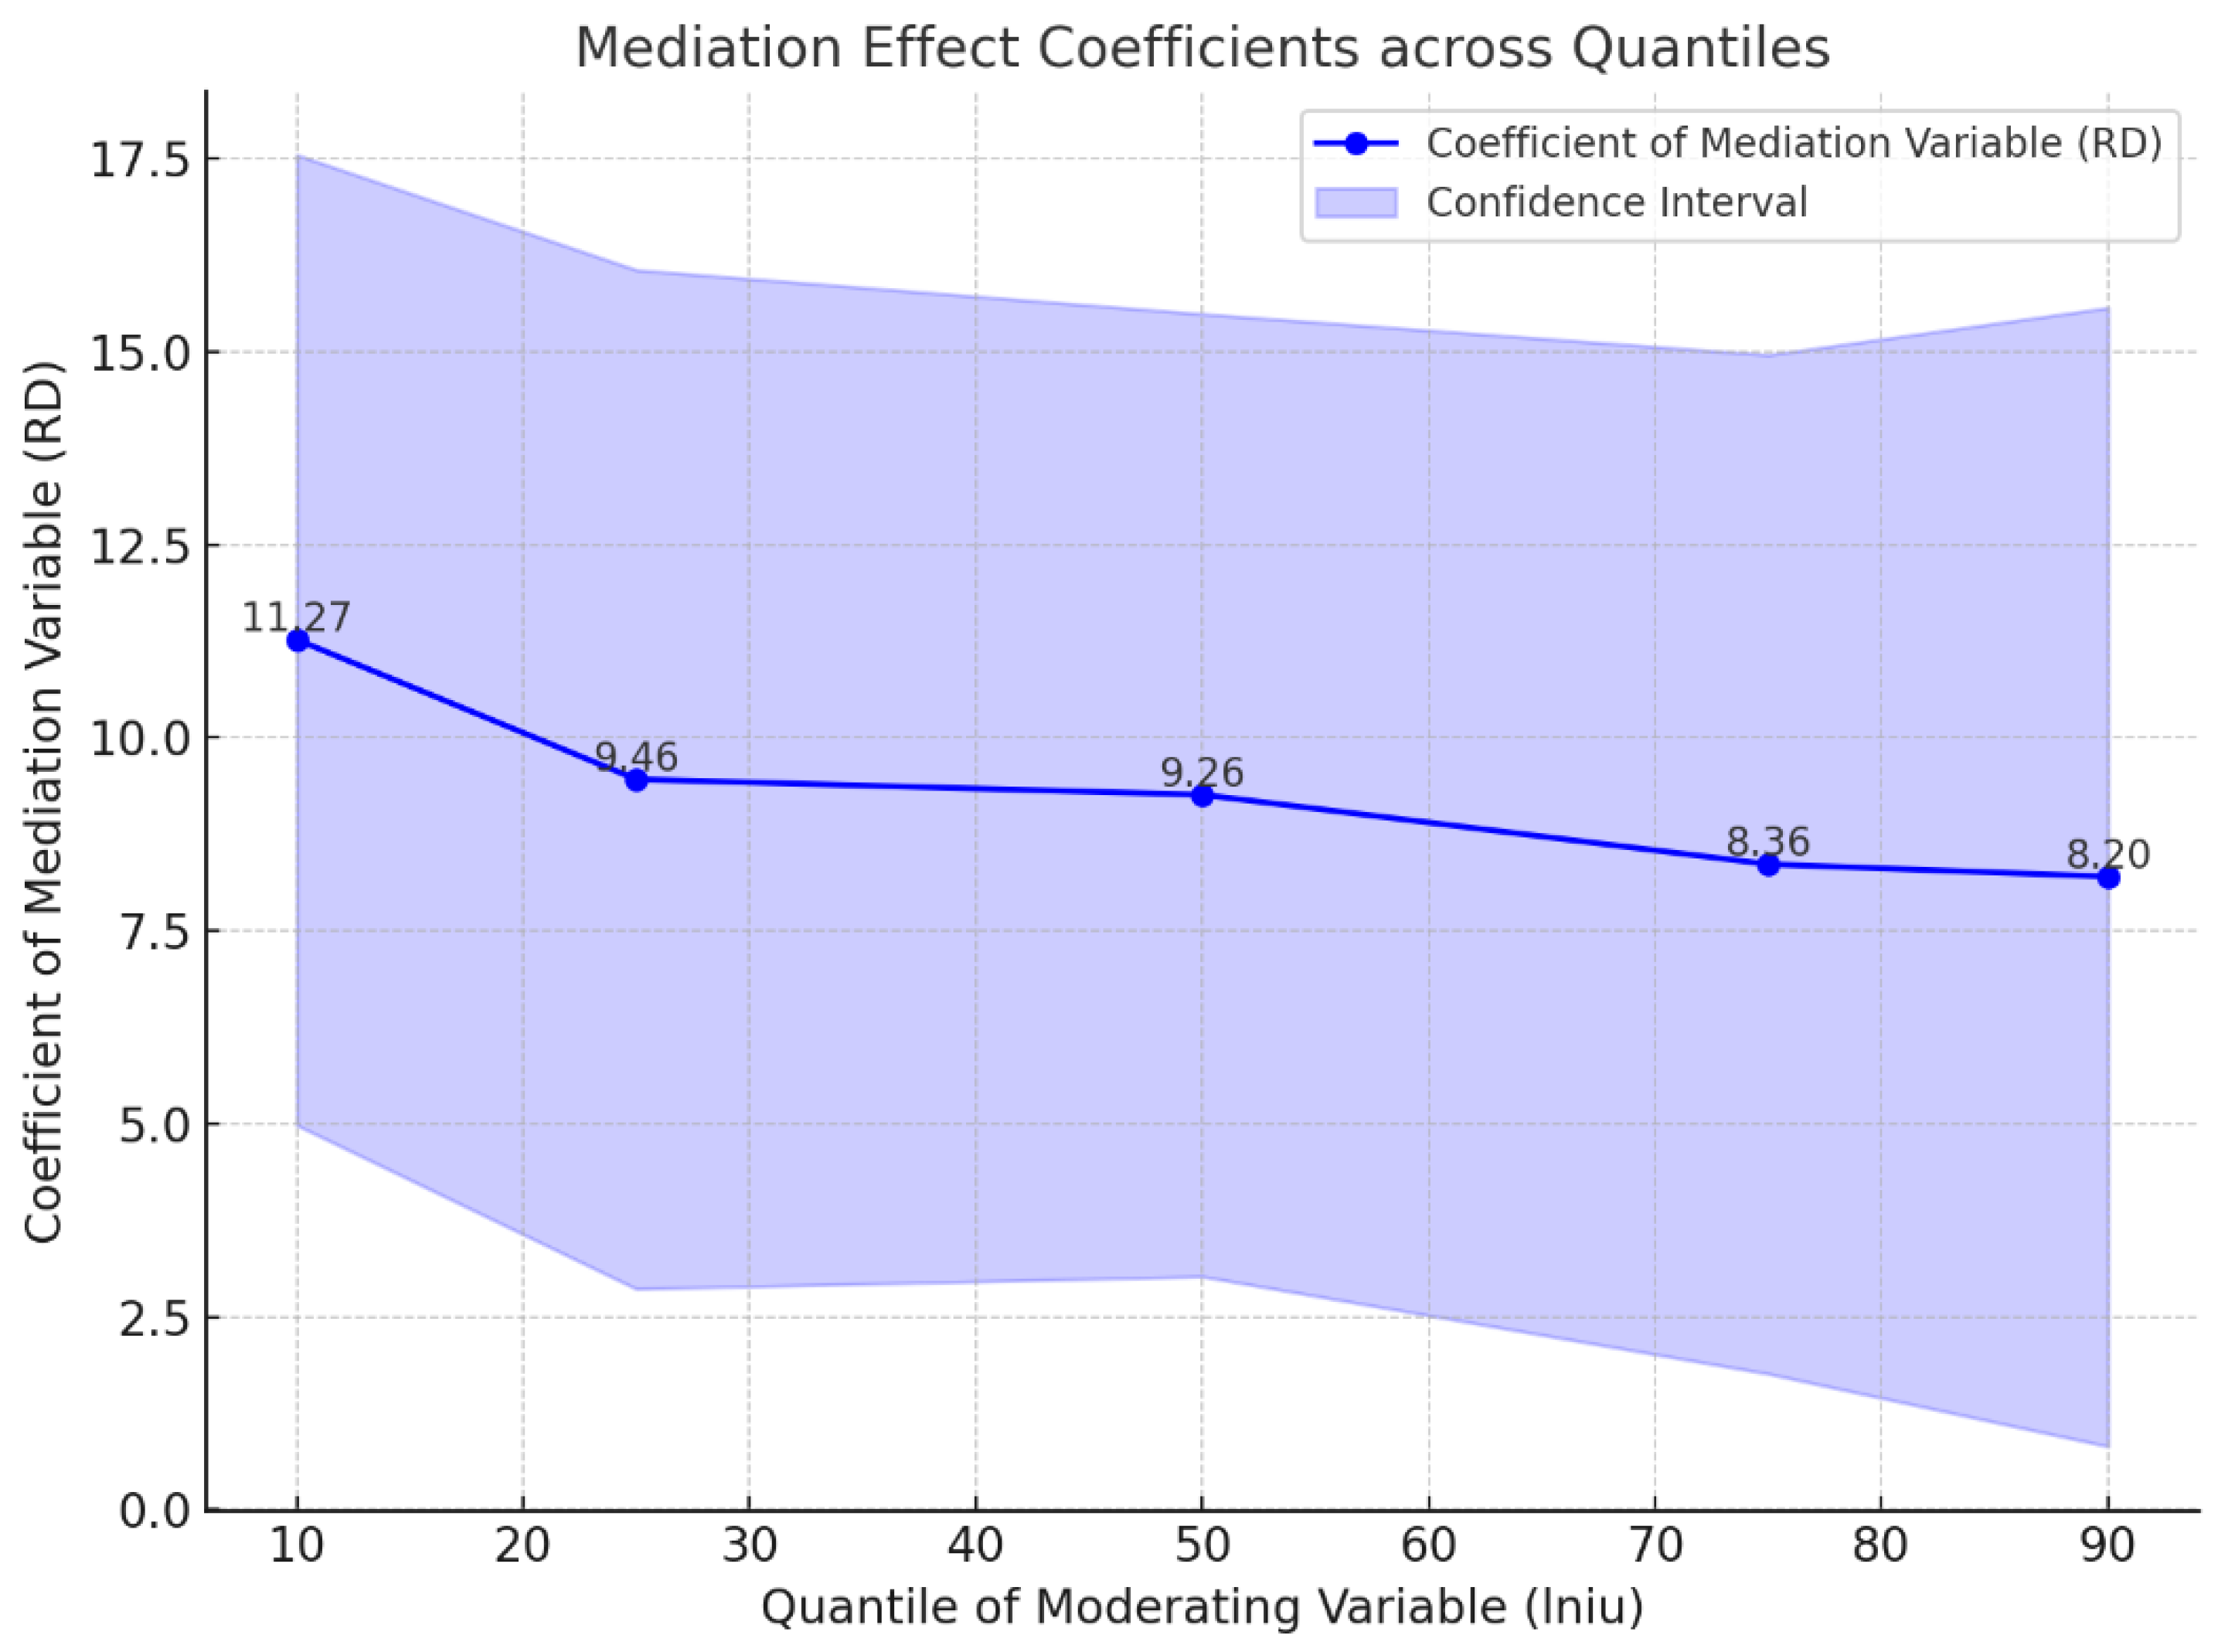
Figure 13.
Standardized percentage bias across covariates before and after matching.
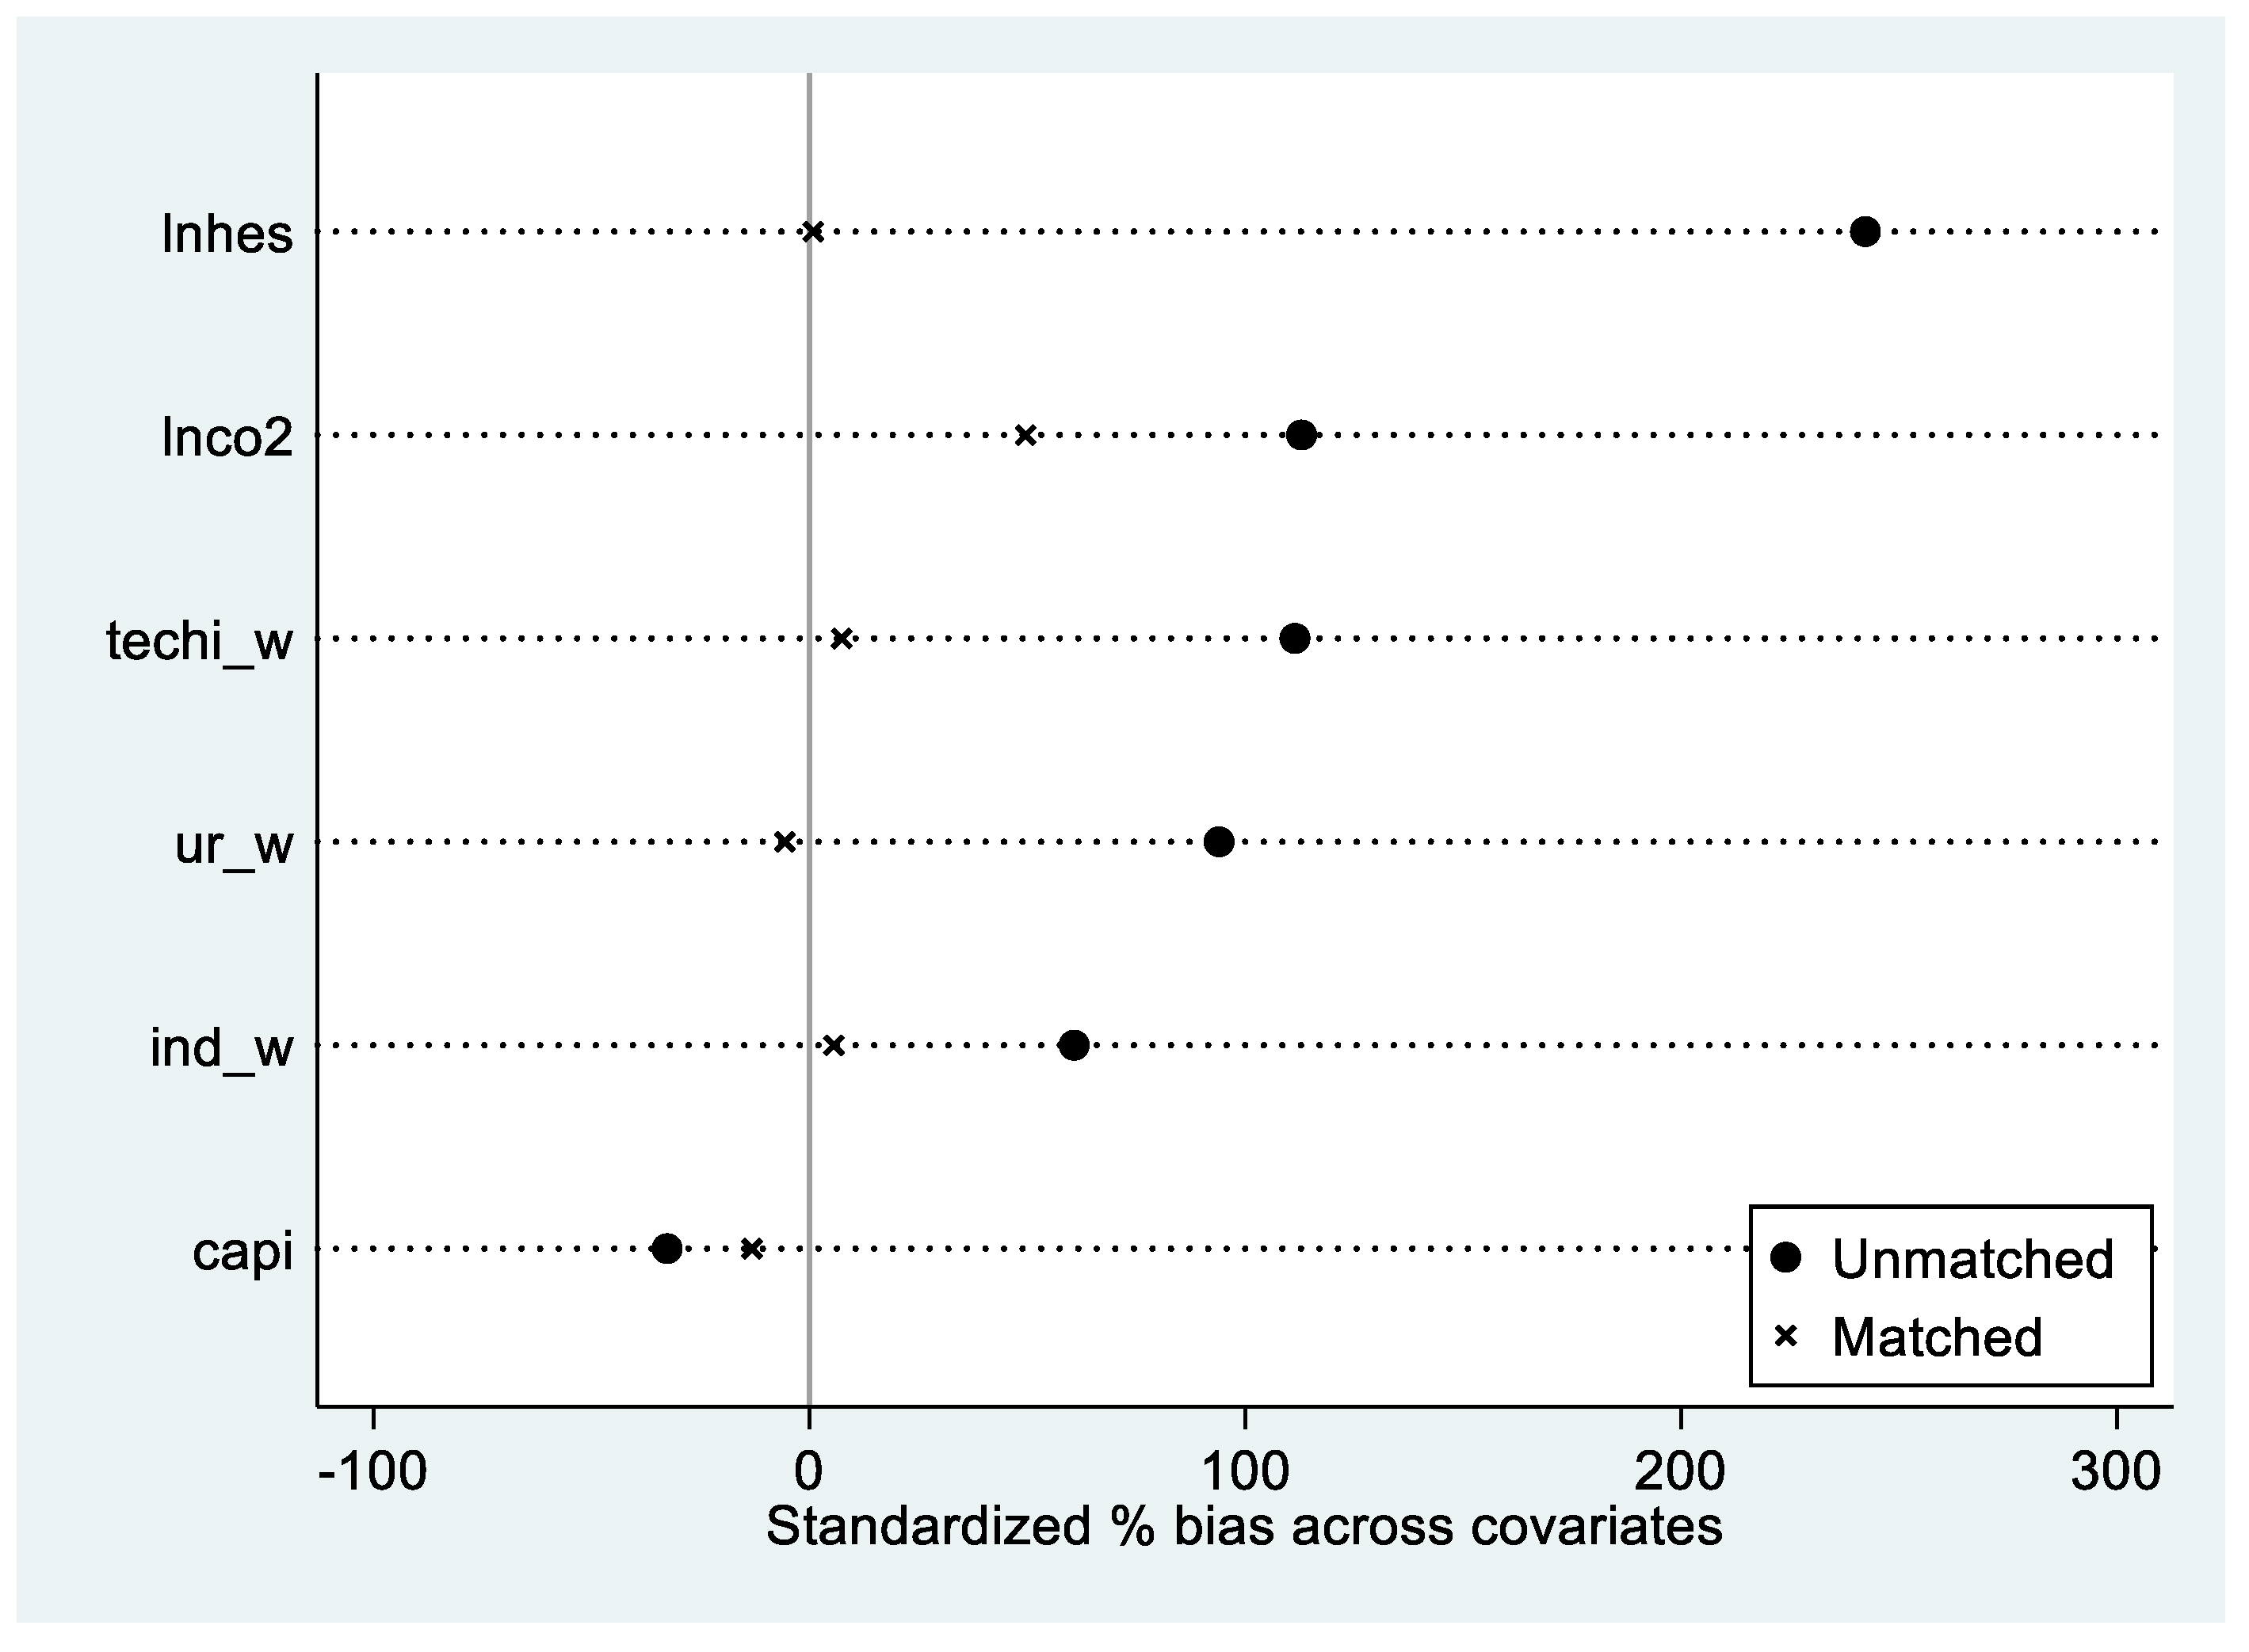

Table 1.
Regional innovation capacity indicator system.
| Level 1 indicators | Level 2 indicators | Description of indicators | Causality |
|---|---|---|---|
| Regional Innovation capacity (ric) | Knowledge creation 15% | Measuring a region's ability to generate new knowledge. | Positive |
| Knowledge acquisition 15% | Measurement of a region's ability to utilise external knowledge and cooperation between industry, academia and research. | Positive | |
| Enterprise innovation 25% | Measures the ability of firms within a region to apply new knowledge, develop new technologies, utilize innovative processes, and manufacture new products. | Positive | |
| Innovation environment 25% | Measure the ability of a region to provide the appropriate environment for the generation, flow and application of technology. | Positive | |
| Innovation performance 20% |
The ability to measure the benefits of innovation for the economic and social development of a region. | Positive | |
Table 2.
Green finance development index indicator system.
| Level 1 indicators | Level 2 indicators | Level 3 indicators | Description of indicators | Causality |
|---|---|---|---|---|
| Green Finance Development Index (gf) | Green credit 50% | Percentage of interest expenses in energy-intensive industries | Interest expenditure of the six major energy-consuming industrial Industries / Total interest expenditure of industrial industries | Negative |
| Percentage of new bank credit to A-share listed environmental enterprises | New bank credit by A-share listed environmental protection companies / Credit to banks by A-share listed companies | Positive | ||
| Green securities 25% |
Market capitalisation of A-share listed environmental enterprises | Market capitalisation of A-share listed environmental enterprises / Total market capitalisation of A-share listed enterprises | Positive | |
| Percentage of A-share value of A-share listed companies with high energy consumption | Market capitalisation of A-share listed energy-intensive enterprises/Total market capitalisation of A-share listed enterprises | Negative | ||
| Green insurance 15 % | Scale environmental pollution insurance | Agricultural insurance income/Property insurance income | Positive | |
| Percentage of compensation from environmental pollution insurance | Agricultural insurance expenditure/Income from agricultural insurance | Positive | ||
| Green investment 10% |
Percentage of investment in environmental pollution control | Investment in environmental pollution control/GDP | Positive | |
| Percentage of fiscal expenditure on environmental protection | Fiscal expenditure on environmental protection/Total fiscal expenditure | Positive |
Table 3.
Variable definitions and descriptions.
| Variable Name | Variable Symbol | Variable Definition |
|---|---|---|
| Regional innovation capacity | ric | Calculated by the weighted integrated evaluation method |
| Green finance development Index | gf | Entropy weighting |
| Industrial structure | ind | Value added of secondary sector/GDP |
| Human capital | lnhes | Logarithmic number of general higher education institutions |
| Urbanisation level | ur | Urban/Resident population |
| Science and technology focus | techi | Local finance science and technology expenditure/Local finance general budget expenditure |
| Carbon footprint | lnco2 | Logarithmic carbon dioxide emissions by province and region |
| Capital investment | capi | Investment in fixed assets/Gross regional product |
Table 4.
Descriptive statistics of variables.
| Variable | N | Mean | P50 | Sd | Min | Max |
|---|---|---|---|---|---|---|
| lnric | 420 | 3.359 | 3.315 | 0.309 | 2.820 | 4.197 |
| gf | 420 | 0.152 | 0.136 | 0.063 | 0.072 | 0.45 |
| ind | 420 | 0.418 | 0.427 | 0.083 | 0.16 | 0.62 |
| hes | 420 | 84.14 | 83.5 | 38.48 | 9 | 167 |
| ur | 420 | 0.575 | 0.557 | 0.131 | 0.291 | 0.896 |
| techi | 420 | 0.021 | 0.013 | 0.015 | 0.004 | 0.072 |
| co2 | 420 | 362.3 | 265.9 | 305 | 32.12 | 2100 |
| capi | 420 | 0.138 | 0.128 | 0.057 | 0.0450 | 0.457 |
Table 5.
Multiple covariance test.
| Variable | VIF | Tolerance |
|---|---|---|
| gf | 1.30 | 0.770 |
| ind | 1.79 | 0.559 |
| lnhes | 2.19 | 0.456 |
| ur | 2.58 | 0.387 |
| techi | 2.93 | 0.341 |
| lnco2 | 2.10 | 0.475 |
| capi | 1.18 | 0.849568 |
| Mean VIF | 2.01 | / |
Table 6.
Baseline regression results.
| Variable | Model 1 | Model 2 | Model 3 | Model 4 |
|---|---|---|---|---|
| lnric | lnric | lnric | lnric | |
| gf | 1.315*** (0.235) |
0.214*** (0.052) |
0.148 (0.133) |
0.207*** (0.052) |
| ind | 0.742*** (0.118) |
0.757*** (0.133) |
||
| lnhes | 0.174*** (0.017) |
0.142** (0.057) |
||
| ur | 0.337*** (0.089) |
0.252 (0.300) |
||
| techi | 13.187*** (0.850) |
2.097*** (0.477) |
||
| lnco2 | -0.070*** (0.013) |
-0.029* (0.015) |
||
| capi | 0.427*** (0.138) |
0.500*** (0.082) |
||
| Constant | 3.159*** (0.039) |
3.326*** (0.008) |
2.142*** (0.095) |
2.309*** (0.211) |
| N | 420 | 420 | 420 | 420 |
| R^2 | 0.069 | 0.950 | 0.775 | 0.960 |
| Prov FE | NO | YES | NO | YES |
| Year FE | NO | YES | NO | YES |
| r2_a | 0.067 | 0.944 | 0.771 | 0.954 |
Note: *, **, *** indicate significance at the 10 per cent, 5 per cent, and 1 per cent levels, respectively; Robust standard errors are in () in the table.
Table 7.
Mediated Effects Test.
| Variable | Model 7 | Model 8 | ||
|---|---|---|---|---|
| rd | lnric | rd | lnric | |
| gf | 0.004* (0.002) |
0.168** (0.068) |
0.063* (0.031) |
1.609* (0.891) |
| rd | 9.464*** (2.781) |
11.469*** (3.368) |
||
| lniu | -0.006*** (0.001) |
0.051 (0.046) |
||
| gf×lniu | 0.015* (0.007) |
0.412* (0.197) |
||
| control variable | YES | YES | YES | YES |
| Constant | 0.015*** (0.004) |
2.171*** (0.203) |
0.026*** (0.005) |
2.299*** (0.293) |
| N | 420 | 420 | 420 | 420 |
| Prov FE | YES | YES | YES | YES |
| Year FE | YES | YES | YES | YES |
| R² | 0.945 | 0.961 | 0.951 | 0.963 |
| R²_a | 0.938 | 0.956 | 0.944 | 0.957 |
| Within_ R² | 0.371 | 0.238 | 0.438 | 0.261 |
| F-statistic | 188.17 | 62.52 | 216.49 | 70.57 |
| Sobel Z | 2.347 | 2.103 | ||
| Sobel Z-p value | 0.019 | 0.035 | ||
| bootstrap Z | 2.13 | 1.98 | ||
| bootstrap Z-p value | 0.033 | 0.048 | ||
| Percentage of intermediary effects | 49% | 39.8% | ||
Note: Same as in Table 6.
Table 8.
Robustness tests.
| Variable | (1) | (2) | (3) | (4) | (5) |
|---|---|---|---|---|---|
| lnric | lnci | lnric | lnric | lnric | |
| gf | 0.207*** | 0.684*** | 0.614*** | 0.573*** | 0.773*** |
| (0.053) | (0.180) | (0.156) | (0.163) | (0.200) | |
| ind | 0.757*** | 1.562*** | 1.286** | 3.019*** | |
| (0.135) | (0.500) | (0.519) | (0.590) | ||
| is | -1.705*** | ||||
| (0.462) | |||||
| lnhes | 0.142** | -0.213 | -0.413 | -0.552 | |
| (0.059) | (0.255) | (0.263) | (0.330) | ||
| hep | -35.255 | ||||
| (26.260) | |||||
| ur | 0.252 | 0.636 | 0.294 | 2.822** | 2.742 |
| (0.301) | (0.760) | (0.842) | (1.094) | (1.694) | |
| techi | 2.097*** | 4.302** | 5.425*** | 2.040 | 4.526* |
| (0.475) | (1.762) | (1.483) | (1.358) | (2.284) | |
| lnco2 | -0.029* | -0.028 | -0.069 | -0.095 | |
| (0.015) | (0.049) | (0.048) | (0.058) | ||
| lnso2 | 0.086* | ||||
| (0.042) | |||||
| capi | 0.500*** | 0.997** | 1.135*** | 0.844** | 0.730* |
| (0.088) | (0.354) | (0.348) | (0.339) | (0.374) | |
| od | -0.521** | ||||
| (0.176) | |||||
| ep | -0.516 | ||||
| (1.455) | |||||
| fd | -0.323 | ||||
| (1.347) | |||||
| lnsize | 0.887* | ||||
| (0.449) | |||||
| Constant | 2.309*** | 3.076** | 3.524*** | -3.983 | 3.066*** |
| (0.213) | (1.060) | (0.454) | (3.251) | (0.887) | |
| N | 420 | 420 | 420 | 420 | 300 |
| Prov FE | YES | YES | YES | YES | YES |
| Year FE | YES | YES | YES | YES | YES |
| R² | 0.960 | 0.868 | 0.871 | 0.880 | 0.893 |
| R²_a | 0.960 | 0.851 | 0.853 | 0.863 | 0.874 |
| Within_ R² | 0.205 | 0.127 | 0.144 | 0.208 | 0.191 |
| F-statistic | 426.23 | 26.57 | 28.25 | 497.77 | 108.14 |
Note: Same as in Table 6.
Table 9.
2SLS Regression results for endogeneity test.
| Variable | GF & RIC | RD & RIC | GF & RD | |||
|---|---|---|---|---|---|---|
| (1) lnric |
(2) lnric |
(3) lnric |
(4) lnric |
(5) lnric |
(6) lnric |
|
| gfl1 | 0.129** (0.062) |
0.175** (0.103) |
||||
| gfl1, lngdp | 0.118** (0.056) |
|||||
| rdl1 | 2.598** (1.019) |
|||||
| rdl1, hep | 2.640** (1.018) |
|||||
| gfl1, fd | 0.170** (0.154) |
|||||
| control variable | YES | YES | YES | YES | YES | YES |
| Constant | -0.022 (0.041) |
-0.016 (0.045) |
0.096* (0.051) |
0.097* (0.051) |
0.143 (0.041) |
0.141 (0.045) |
| Prov FE | YES | YES | YES | YES | YES | YES |
| Year FE | YES | YES | YES | YES | YES | YES |
| First-stage F statistic | 939.513 | 469.257 | 743.148 | 829.754 | 939.513 | 474.851 |
| Kleibergen-Paap rk LM statistic | 11.934*** | 11.941*** | 12.463*** | 12.637*** | 11.934*** | 12.525*** |
| Kleibergen-Paap Wald rk F statistic | 1016.958 (16.38) | 735.997 (19.93) | 770.996 (16.38 | 1133.605 (19.93 | 1016.958 (16.38) | 551.437 (19.93) |
| Hansen J P value | / | (0.270) | / | (0.331) | / | (0.148) |
| N | 390 | 390 | 390 | 390 | 390 | 390 |
| 0.504 | 0.534 | 0.614 | 0.644 | 0.509 | 0.610 | |
Note: **, and *** indicate significance at the 10%, 5%, and 1% levels, respectively, with the values in parentheses representing cluster-robust standard errors at the time level. The values in brackets for the Kleibergen-Paap Wald rk F statistic represent the critical value at the 10% level according to the Stock-Yogo test.
Table 10.
Endogeneity test of sample selection bias.
| Variable | Heckman | PSM | WLS | |
| selected | lnric | lnric | lnric | |
| gf | 0.498** (5.166) |
0.320* (0.158) |
||
| gfdummy | 0.040** (0.017) |
0.057*** (0.015) |
||
| ind | 10.353* (5.593) |
0.844*** (0.158) |
0.751*** (0.138) |
0.584** (0.208) |
| lnhes | 2.164 (2.934) |
0.070 (0.060) |
0.126** (0.055) |
0.106 (0.068) |
| ur | 11.128 (11.064) |
0.373 (0.297) |
0.155 (0.312) |
0.369 (0.397) |
| techi | -85.195*** (31.270) |
1.028 (0.928) |
2.181*** (0.475) |
2.466*** (0.583) |
| lnco2 | 0.206 (1.135) |
-0.035 (0.020) |
-0.035** (0.015) |
-0.018 (0.019) |
| capi | -8.384* (4.345) |
0.575*** (0.137) |
0.514*** (0.079) |
0.508*** (0.092) |
| mills | -0.007 (0.010) |
|||
| ATT | 0.090*** (0.030) |
|||
| Constant | -11.934 (9.463) |
2.528*** (0.355) |
2.459*** (0.222) |
2.353*** (0.263) |
| Observations | 238 | 238 | 420 | 420 |
| R-squared | 0.534 | 0.934 | 0.960 | 0.960 |
Note: Same as in Table 6.
Disclaimer/Publisher’s Note: The statements, opinions and data contained in all publications are solely those of the individual author(s) and contributor(s) and not of MDPI and/or the editor(s). MDPI and/or the editor(s) disclaim responsibility for any injury to people or property resulting from any ideas, methods, instructions or products referred to in the content. |
© 2025 by the authors. Licensee MDPI, Basel, Switzerland. This article is an open access article distributed under the terms and conditions of the Creative Commons Attribution (CC BY) license (http://creativecommons.org/licenses/by/4.0/).
Copyright: This open access article is published under a Creative Commons CC BY 4.0 license, which permit the free download, distribution, and reuse, provided that the author and preprint are cited in any reuse.


