Submitted:
03 December 2025
Posted:
04 December 2025
You are already at the latest version
Abstract
As a malignant tumor with high heterogeneity, gastric cancer (GC) still suffers a poor prognosis despite therapeutic advances. For further investigation of its heterogeneity, the single-cell RNA (scRNA) sequencing of human GC samples has been analyzed, which stratifies malignant epithelial cells into seven tumor subtypes. Among these seven subtypes, the C3 tumor subtype characterized by OLFM4 expression shows distinct biological features with enhanced palmitoylation and energetic metabolism, which presents the significant activation of related specific modules, including a palmitoyltransferase of protein palmitoylation, ZDHHC2, and an important transporter of glycolysis named GLUT1. Besides, the functional assays also confirm that the upregulation of expressed OLFM4 could enhance the ATP production in GC cell lines, which indicates elevated energetic metabolism. Moreover, three prognosis-associated genes (MUC16, RALA, PCBD1) are used to establish a prognostic risk model, which could effectively predict the survival of STAD patients and is correlated with the tumor microenvironment (TME) including not only immune checkpoint expression and infiltration of immune cells. These findings not only highlight OLFM4 as a defining biomarker of a metabolically active gastric cancer subtype but also indicate the possibility that targeting palmitoylation and energy metabolism may offer new therapeutic strategies for patients with OLFM4-high gastric tumors.
Keywords:
gastric cancer
; tumor heterogeneity
; OLFM4
; palmitoylation
; energetic metabolism
1. Introduction
With the role of the fifth-ranked worldwide diagnosed malignancy, gastric cancer (GC) induces over 1 million new cases every year, which is a heavy global health burden [1]. As the predominant histological subtype of gastric cancer, stomach adenocarcinoma (STAD) is characterized as the second most prevalent cancer around the world and also ranks third in deadliest tumors [2]. Despite several therapies, which include surgical techniques, chemotherapy, and immunotherapy, having advanced, the overall prognosis of GC patients still can’t reach our satisfaction, which is largely due to the disease’s extensive heterogeneity [3,4,5,6].
For further researching the heterogeneity of the disease, many studies have focused on the molecular subtypes of STAD, such as: the Epstein–Barr virus (EBV) subtype, which is characterized by DNA hypermethylation, and the genomically stable (GS) subtype that has fewer specific genomic alterations [7,8,9]. Though these current molecular classifications, which have been wildly used in multiple projects including The Cancer Genome Atlas (TCGA) and the Asian Cancer Research Group (ACRG), have improved our understanding of GC subtypes at the transcriptomic level, the development of the RNA sequencing technology, such as the single-cell RNA sequencing (scRNA), provides more possibility for the advanced identification, which have revealed that GC patients could be classified into more molecular subtypes with different molecular mechanism characters [10,11,12,13]. Therefore, it’s necessary for us to have a more refined understanding of the heterogeneity based on the molecular subtypes of GC at the single-cell level.
As a technology of next-generation sequencing, scRNA sequencing enables the profiling of gene expression in individual cells, which includes not only rare tumor cells obscured by bulk RNA-seq but also multiple non-tumor cells of the tumor microenvironment (TME) [13,14,15,16]. In gastric cancer, multiple scRNA-Seq studies have uncovered substantial intratumoral heterogeneity and highlighted their functional diversity in TME. For example, the cellular communication between cancer-associated fibroblasts (CAFs) and GC cells was reported to have the function of maintaining GC stemness [8,17]. And it was revealed that the tumorigenesis and metastasis of MET-unamplified GC could be induced by the CAF-derived HGF [18]. Nevertheless, the heterogeneity of malignant epithelial cells in gastric cancer, which usually dominates the tumor progression and metastasis, still remains incompletely characterized and needs further research. Specifically, the molecular differences among different tumor subtypes and the corresponding underlying regulatory system have not been systematically investigated.
Olfactomedin 4 (OLFM4), which is also known as hGC-1 and hOlfD, originates from human hematopoietic myeloid cells, and is identified as GW112, which is a novel antiapoptotic molecule [19]. It is reported that OLFM4 is correlated not only with apoptosis but also with tumor growth [20]. Besides, overexpression of OLFM4 has been shown to modulate the cellular proliferation of prostate cancer and presents a promotion effect of apoptosis in human myeloid leukemia [20,21,22]. Meanwhile, as it’s said that OLFM4 has the potential as a biomarker for gastric cancer, we realize the importance of OLFM4 in GC and tend to focus on further investigation of the underlying mechanism in GC [23,24,25].
Metabolic reprogramming is a characteristic of malignant tumors, which plays an important role in the growth and survival of cancer [26]. Multiple biological mechanisms have been reported to participate in the process. For example, as the key factor of glycolysis, the Hexokinase 2 (HK2) could combine with voltage-dependent anion channels (VDACs), which are located on the outer membrane of mitochondria, to obtain ATP, whose activity is available for regulating the metabolic reprogramming in GC [27,28]. Besides, when GC cells lack glucose, nonessential amino acids could maintain the mitochondrial homeostasis to suppress the activity of the mitochondrial apoptosis pathway [29,30].
Among these diverse metabolic alterations, we find that the palmitoylation of protein, which is a reversible modification of lipid combining a palmitate group with cysteine residues, could play an important role in the post-translational mechanism that regulates not only metabolic enzymes but also signaling molecules, which is regarded as the modulator of anti-cancer treatment efficacy [31,32]. In gastric cancer, it’s said that the ZDHHC family, such as ZDHHC2 and ZDHHC14, affects the development of the tumor [33,34].
In this study, we integrated bulk and single-cell RNA sequencing data for the systematic investigation of the human GC heterogeneity at the transcriptional level. With the primary tumor and normal samples of the GSE163558 cohort, we identified seven malignant tumor subtypes in epithelial cells. Among these clusters, the C3 subtype, which was characterized by specifically high OLFM4 expression, presented enhancement of the palmitoylation and several energy metabolism pathways. For further confirmation, we upregulated the expression of OLFM4 in GC cell lines, and observed that the expression of ZDHHC2, which was identified as a palmitoyltransferase, as well as GLUT1, which was a key glycolytic transporter, was indeed increased, accompanied by increased ATP production. Furthermore, according to these C3-specific genes, we established a prognostic risk model with significant prognosis-related genes in TCGA-STAD (MUC16, RALA, and PCBD1), which predicted patient survival effectively and also demonstrated the correlation with the immune checkpoint expression.
2. Results
2.1. Classification of scRNA-Seq
For the data mining of STAD, we selected the scRNA-Seq data of three primary tumor samples and one normal tissue sample from the STAD cohort in the GEO database (GSE163558). After the quality control, which included filtering low-quality cells and low-expression features, we finally received a dataset with 14315 cells. With the dimensional reduction and classification of the data, we further annotated different clusters through multiple specific markers of different cells to receive a precise classification (Figure 1A). Therefore, we finally distinguished scRNA data into nine cell clusters, which included B cells, CD4+ T cells, CD8+ T cells, naïve T cells, endothelial, epithelial, fibroblast, monocytes, neutrophils, and plasma cells (Figure 1B). According to the distribution of cells in different tissues, we could also easily find that several cells, including epithelial, endothelial, fibroblast, monocytes, neutrophils, accounted for more ratio in the primary tumor tissue compared with the normal tissue, which corresponded with the phenomenon in the development of malignant tumors (Figure 1C).
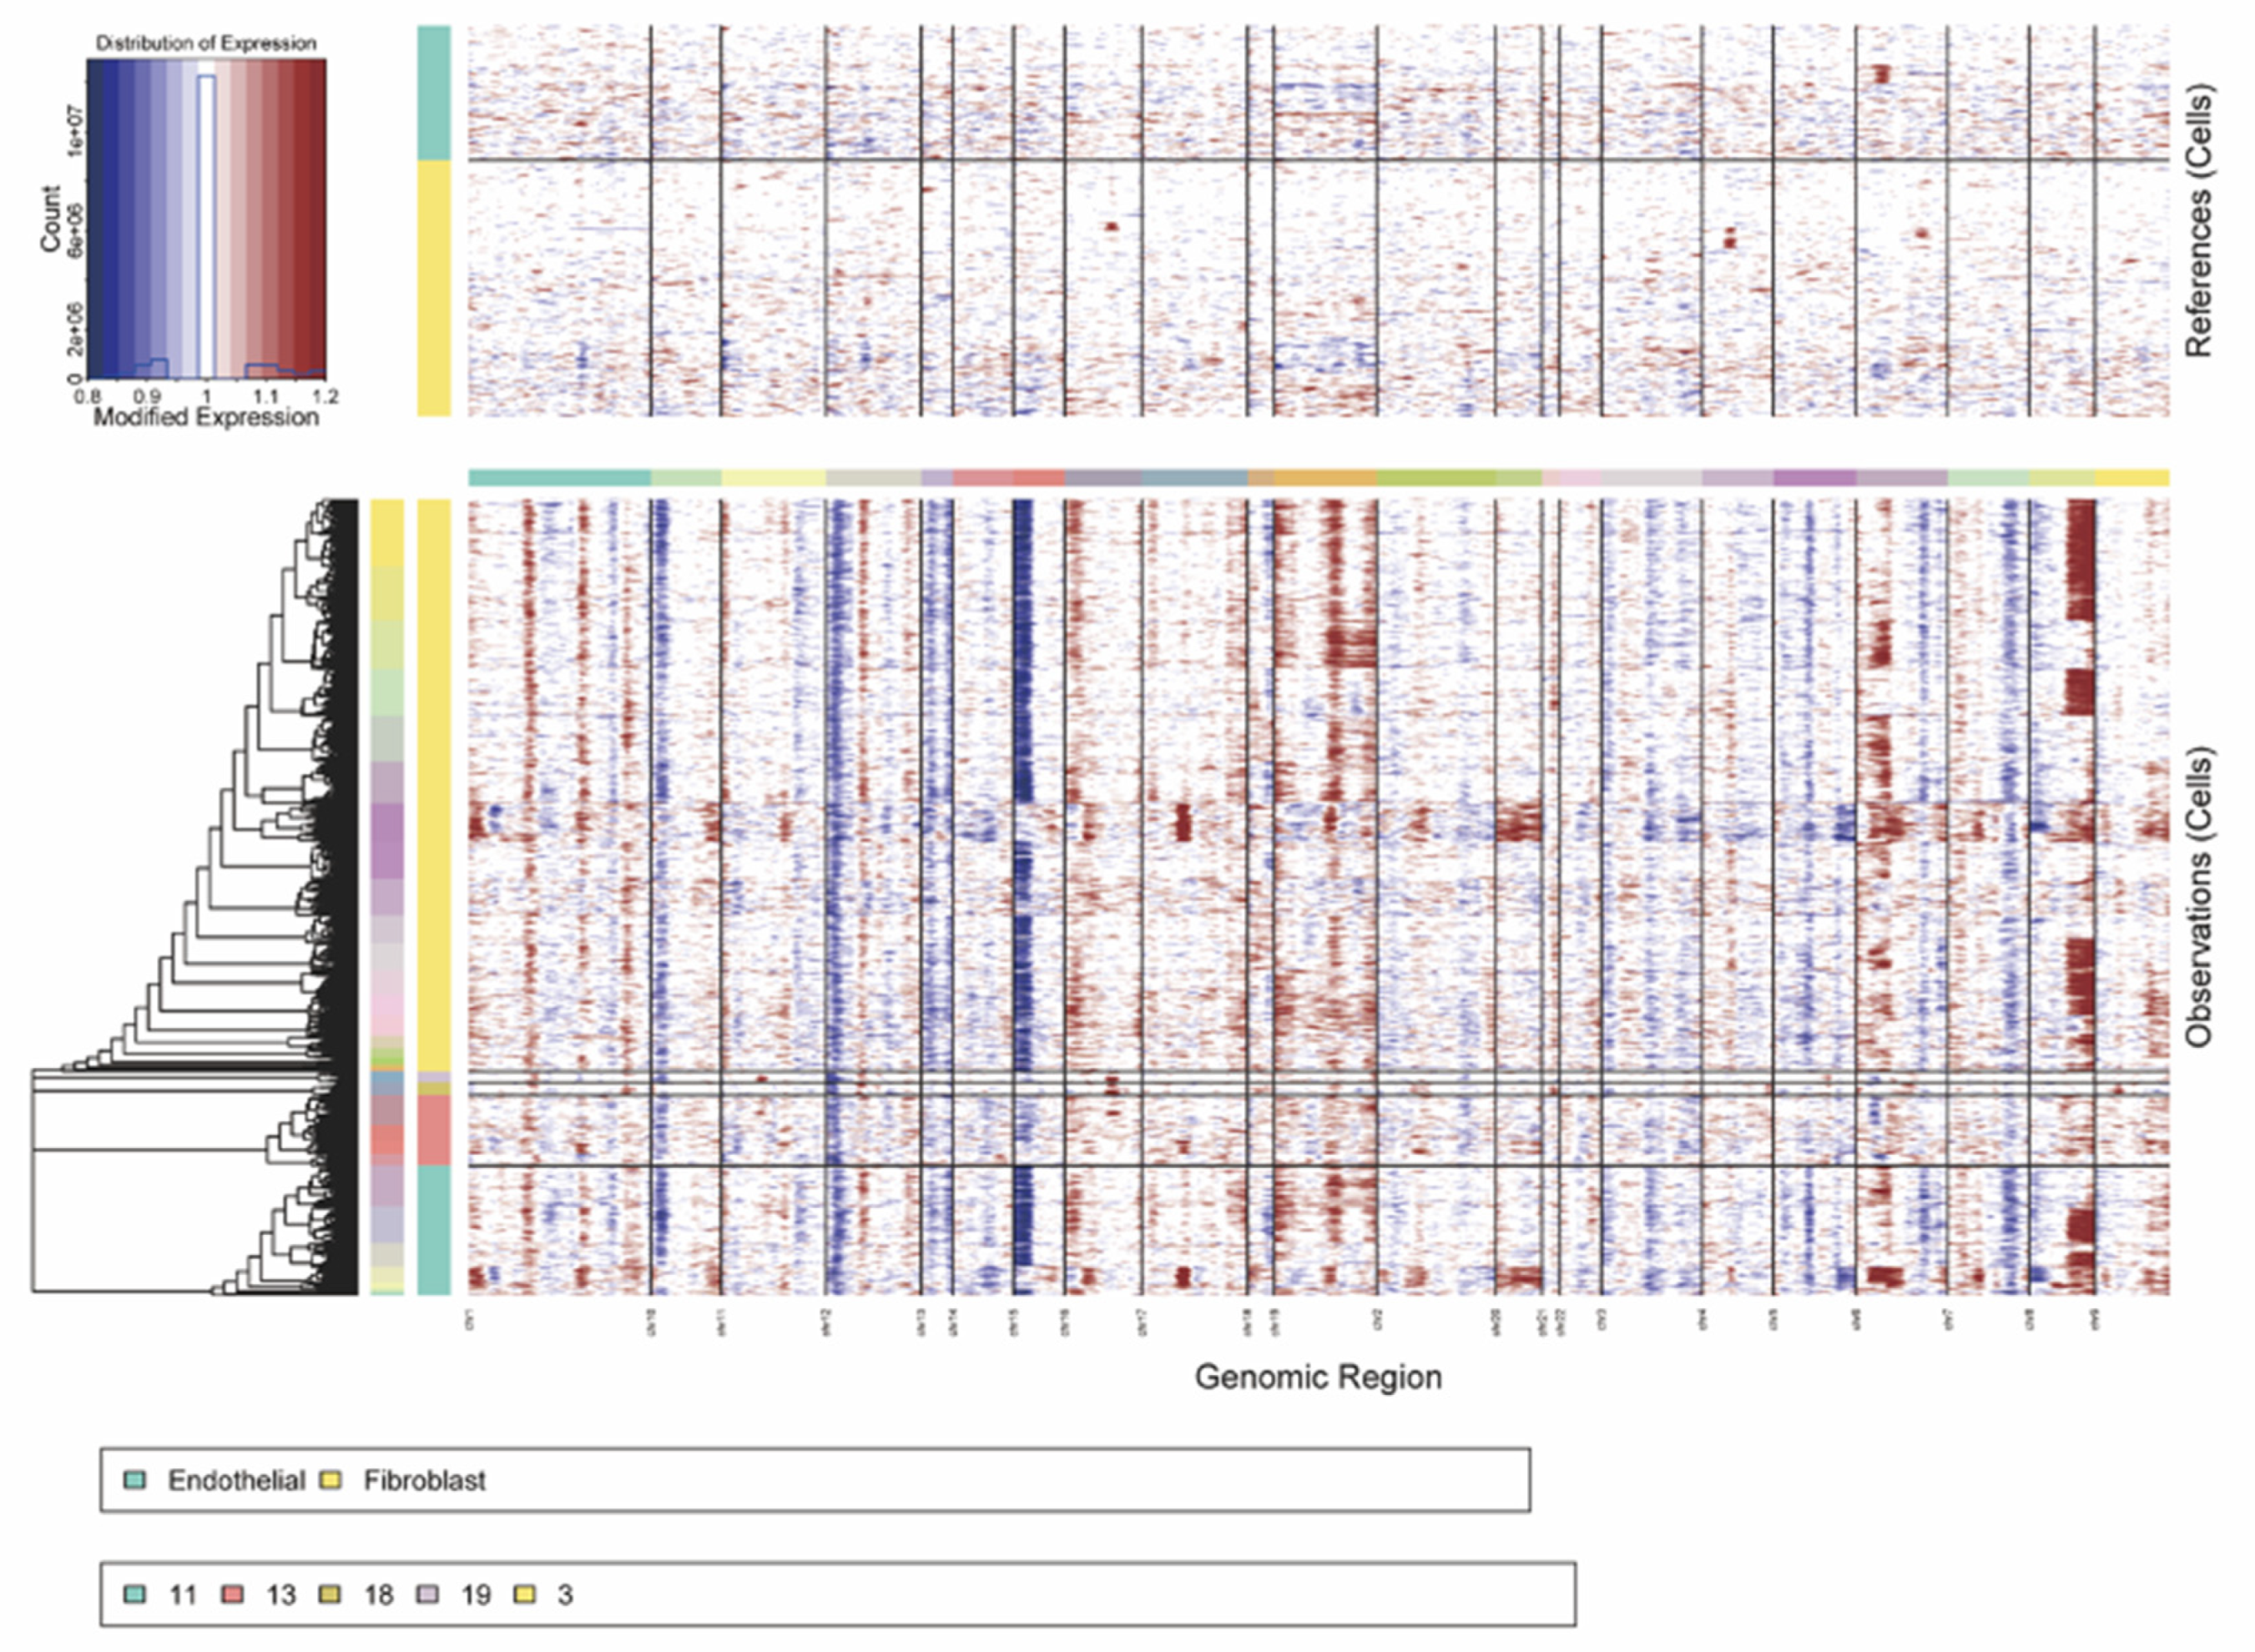
2.2. CNV Analysis of scRNA-Seq
With reference to the endothelial and the fibroblast, we performed the inferCNV analysis on all cells in the scRNA-Seq data and received the CNV score of each cell, which indicated that the CNV scores were varied significantly from epithelial cells.
Figure 2.
The heatmap of the CNV analysis presents the different malignancies among different cells.
Figure 2.
The heatmap of the CNV analysis presents the different malignancies among different cells.
2.3. The Heterogeneity of Tumor Cells in the scRNA-Seq of STAD
According to the expression of seven STAD-specific markers in malignant epithelial cells, we distinguished them into seven tumor subtypes, which were named from C0 to C7 with their specific identified markers (Figure 3A). Meanwhile, with the cell cycle score of each cell, we found that most C1 tumor cells stayed in both the G2M and S phase, as well as cells in the C1 phase mainly consisted of C0, C2 and C3 tumor cells (Figure 3B). Besides, based on the source of tissue, we also discovered that some tumor cells, which included C0, C1, C5, and C6, all originated from primary tumor tissues (PT) and most C4 tumor cells came from the normal tissue (NT) (Figure 3C). Then, we further performed the analysis of Representation Odds Ratio to Expected (Ro/e) towards seven tumor subtypes and distinguished them into 3 groups according to their distribution (Figure 3D). First, 4 tumor subtypes (C0, C1, C5, C6) were enriched in the PT group and C4 was located in the NT group, which corresponded to our previous analysis and ensured their different malignancy. Secondly, cells in C2 and C3 tumor subtypes didn’t present any bias, which indicated their intermediate state among these tumor cells. Furthermore, we compared the differences of CNV score, G2M score, S score and UMI counts among seven tumor subtypes, which demonstrated their heterogeneity in several aspects including tumoral malignancy, cellular mitosis and cellular transcriptional activity (Figure 3E-H).
Therefore, we held the view that the malignancy of epithelial cells varied from different tumor subtypes according to the comparison in different dimensions, which revealed their tumoral heterogeneity.
2.4. Cell-Cell Communications Analysis Revealed Specific Signaling Among Cells
For further comparing the heterogeneity of different tumor subtypes, we used CellChat for the analysis of cell-cell communication. Then we found that the combination of PPIA-BSG, which represented CypA signaling, had an extremely high interaction strength in the attraction from other cells towards tumor cells (Figure 4A-B). However, the outgoing interaction strength of tumor cells varied among different tumor subtypes. Compared with other tumor subtypes, subtypes of C0, C1, C2 and C5 had higher interaction strength of multiple signaling, which included the interaction of MDK-NCL and MIF-CD74_CD44, in communication with other cells (Figure 4C-D). Therefore, we could summarize that all these tumor subtypes had a similar incoming ability characterized by the CypA signaling, in communication with other cells, but only some subtypes (C0, C1, C2, C5) could have a similar outgoing ability in cell-cell communications, which demonstrated their tumoral heterogeneity (Figure 4E).
2.5. Cellular Differentiation Analysis
To further investigate the heterogeneity of these seven tumor subtypes, we used the CytoTRACE to quantify their potential for differentiation. Then we found that the C1 subtype demonstrated the highest stemness with the highest CytoTRACE score representing the highest cellular plasticity, and the C4 subtype had the lowest score (Figure 5A-B). Besides, we also performed the Pseudotime analysis on these seven subtypes and classified these cells into 5 states of 2 differentiation trajectories. Interestingly, we discovered that C4 had the lowest differentiation, which mostly stay in the State 1, however, C1 was highly differentiated, which mostly stay in the State 5 (Figure 5C-D), Therefore, we selected multiple differentiation-related genes (AGER, CAPS, CCL4, CRABP2, MT2A, SPARCL1) to compare their expression in these seven subtypes and revealed that expression of MT2A had an increasing tendency in the pseudo-time, which indicated its relationship with the cellular differentiation (Figure 5E). Furthermore, according to the pseudotime analysis in this cohort, we also revealed more differentiation-related genes (Figure 5F).
2.6. OLFM4-Characterized Cells Demonstrated Higher Palmitoylation and Energetic Metabolism
For further investigation of the molecular mechanism in various tumor subtypes of gastric cancer, we focused on the palmitoyl and calculated the score according to the geneset of palmitoylation. After comparing palmitoyl scores among seven tumor subtypes, we revealed that the C3 subtype, which was characterized by the OLFM4, had the highest activity of palmitoylation (Figure 6A). Therefore, we further performed the enrichment analysis of not only KEGG but also GO according to the differentially expressed genes (DEG) in C3 subtypes, and found that multiple pathways of energetic metabolism had been enriched (Figure 6B-C). For better estimating the regulation in the mechanism of energetic metabolism, we further applied the GSEA analysis towards all seven subtypes and focused on the significantly activated pathways in the C3 subtypes, which had upregulation of not only the GSVA score but also the t-value representing statistical significance, so that glycolysis attracted our attention (Figure 6D-E). Then, as both palmitoylation and glycolysis represented upregulation in the C3 subtype with specific OLFM4 expression, we further verified the relationship between OLFM4 and both palmitoylation and glycolysis. AGS and HGC-27 were selected according to their lower OLFM4 expression in comparison, which was similar to the GES-1 (Figure 6F). After upregulating the expression of OLFM4 in these 2 cell lines by treating them with the recombined protein, the specific markers of palmitoylation (ZDHHC2) and glycolysis (GLUT1) also presented higher expression (Figure 6G). Besides, we measured the expression of ATP in these 2 cell lines to estimate the change of energetic metabolism, and revealed the activation based on the higher ATP expression in the OLFM4 upregulated group of these 2 cell lines (Figure 6H). Therefore, we held the view that the OLFM4-characterized cells had higher palmitoylation and energetic metabolism.
2.7. Analysis of Transcription Factors in Multiple Tumor Subtypes
For investigating the regulation of transcription factors (TFs) in these seven different tumor subtypes, we used the pySCENIC to perform the Regulon analysis, which further classified TFs into 3 major modules (M1, M2, M3) according to the Connection Specificity Index (CSI) between different regulons (Figure 7A). In these 3 modules, we discovered the significantly related tumor subtypes according to their regulon activity scores (RAS) (Figure 7B). In Module 1 (M1), C2, C3 and C5 tumor subtypes were included. Besides, C4, C5 and C6 were identified as the significantly related tumor subtypes in Module 2 (M2). Meanwhile, Module 3 (M3) was linked with C1, C3 and C6 subtypes. Therefore, we selected the top-ranked tumor subtype in each module, which included C5 in M1, C4 in M2 and C1 in M3, for further researching their specific TFs. Then, we found that their top-ranked TFs, with the highest specificity scores, were specifically expressed in these 3 tumor subtypes (C1, C4, C5). Thus, we held the view that there was a correlation between CD74 and FOXM1, HELLS and ZNF41, as well as TOP2A and NFATC2 (Figure 7C-E).
2.8. Risk Score Associated with the C3 Tumor Subtype
For further investigating the effect of these different tumor subtypes, we focused on the C3 tumor subtype. With the top 100 specific markers in the C3 tumor subtype, we used the Cox regression to screen genes for establishing a system of risk profile prediction. First, we performed the univariate Cox analysis on these 100 genes and received 8 signatures significantly correlated with the prognosis of STAD patients in TCGA (p < 0.1), which included MUC16, ANXA2, RALA, MRPL33, CSTB, TMSB10, ACTG1, and PCBD1 (Figure 8A). Then, the multivariate Cox analysis was further applied to these 8 genes, so that we finally obtained 3 statistically significant genes, which consisted of MUC16, RALA, and PCBD1 (p<0.05) (Figure 8B). With the individual coefficients of these 3 genes, the pertinent risk coefficient of each patient was calculated, which further divided TCGA-STD patients into high/low risk groups. We could find that both MUC16 and RALA, with the adverse effect on survival, had relatively higher expression in the high-risk group, and PCBD1, which presented the protective effect on survival, demonstrated lower expression in the low-risk group (Figure 8C). Besides, in this cohort, as AUC values of the ROC curves for one, three, and five years were 0.664, 0.662, and 0.703, which indicated the predictive performance of our risk-score model (Figure 8D), we performed the KM survival analysis based on our high/low risk groups and revealed that high-risk group patients suffered a poor prognosis comparing with patients in the low-risk group (Figure 8E). Therefore, we further had the KM survival analysis towards these 3 risk-score related genes, which revealed that high expression of 2 genes (MUC16, RALA) induced worse survival outcomes, and the high expression of another gene, PCBD1, indicated better prognosis (Figure 8F).
2.9. Correlations Between Immune Infiltration and the Risk Score
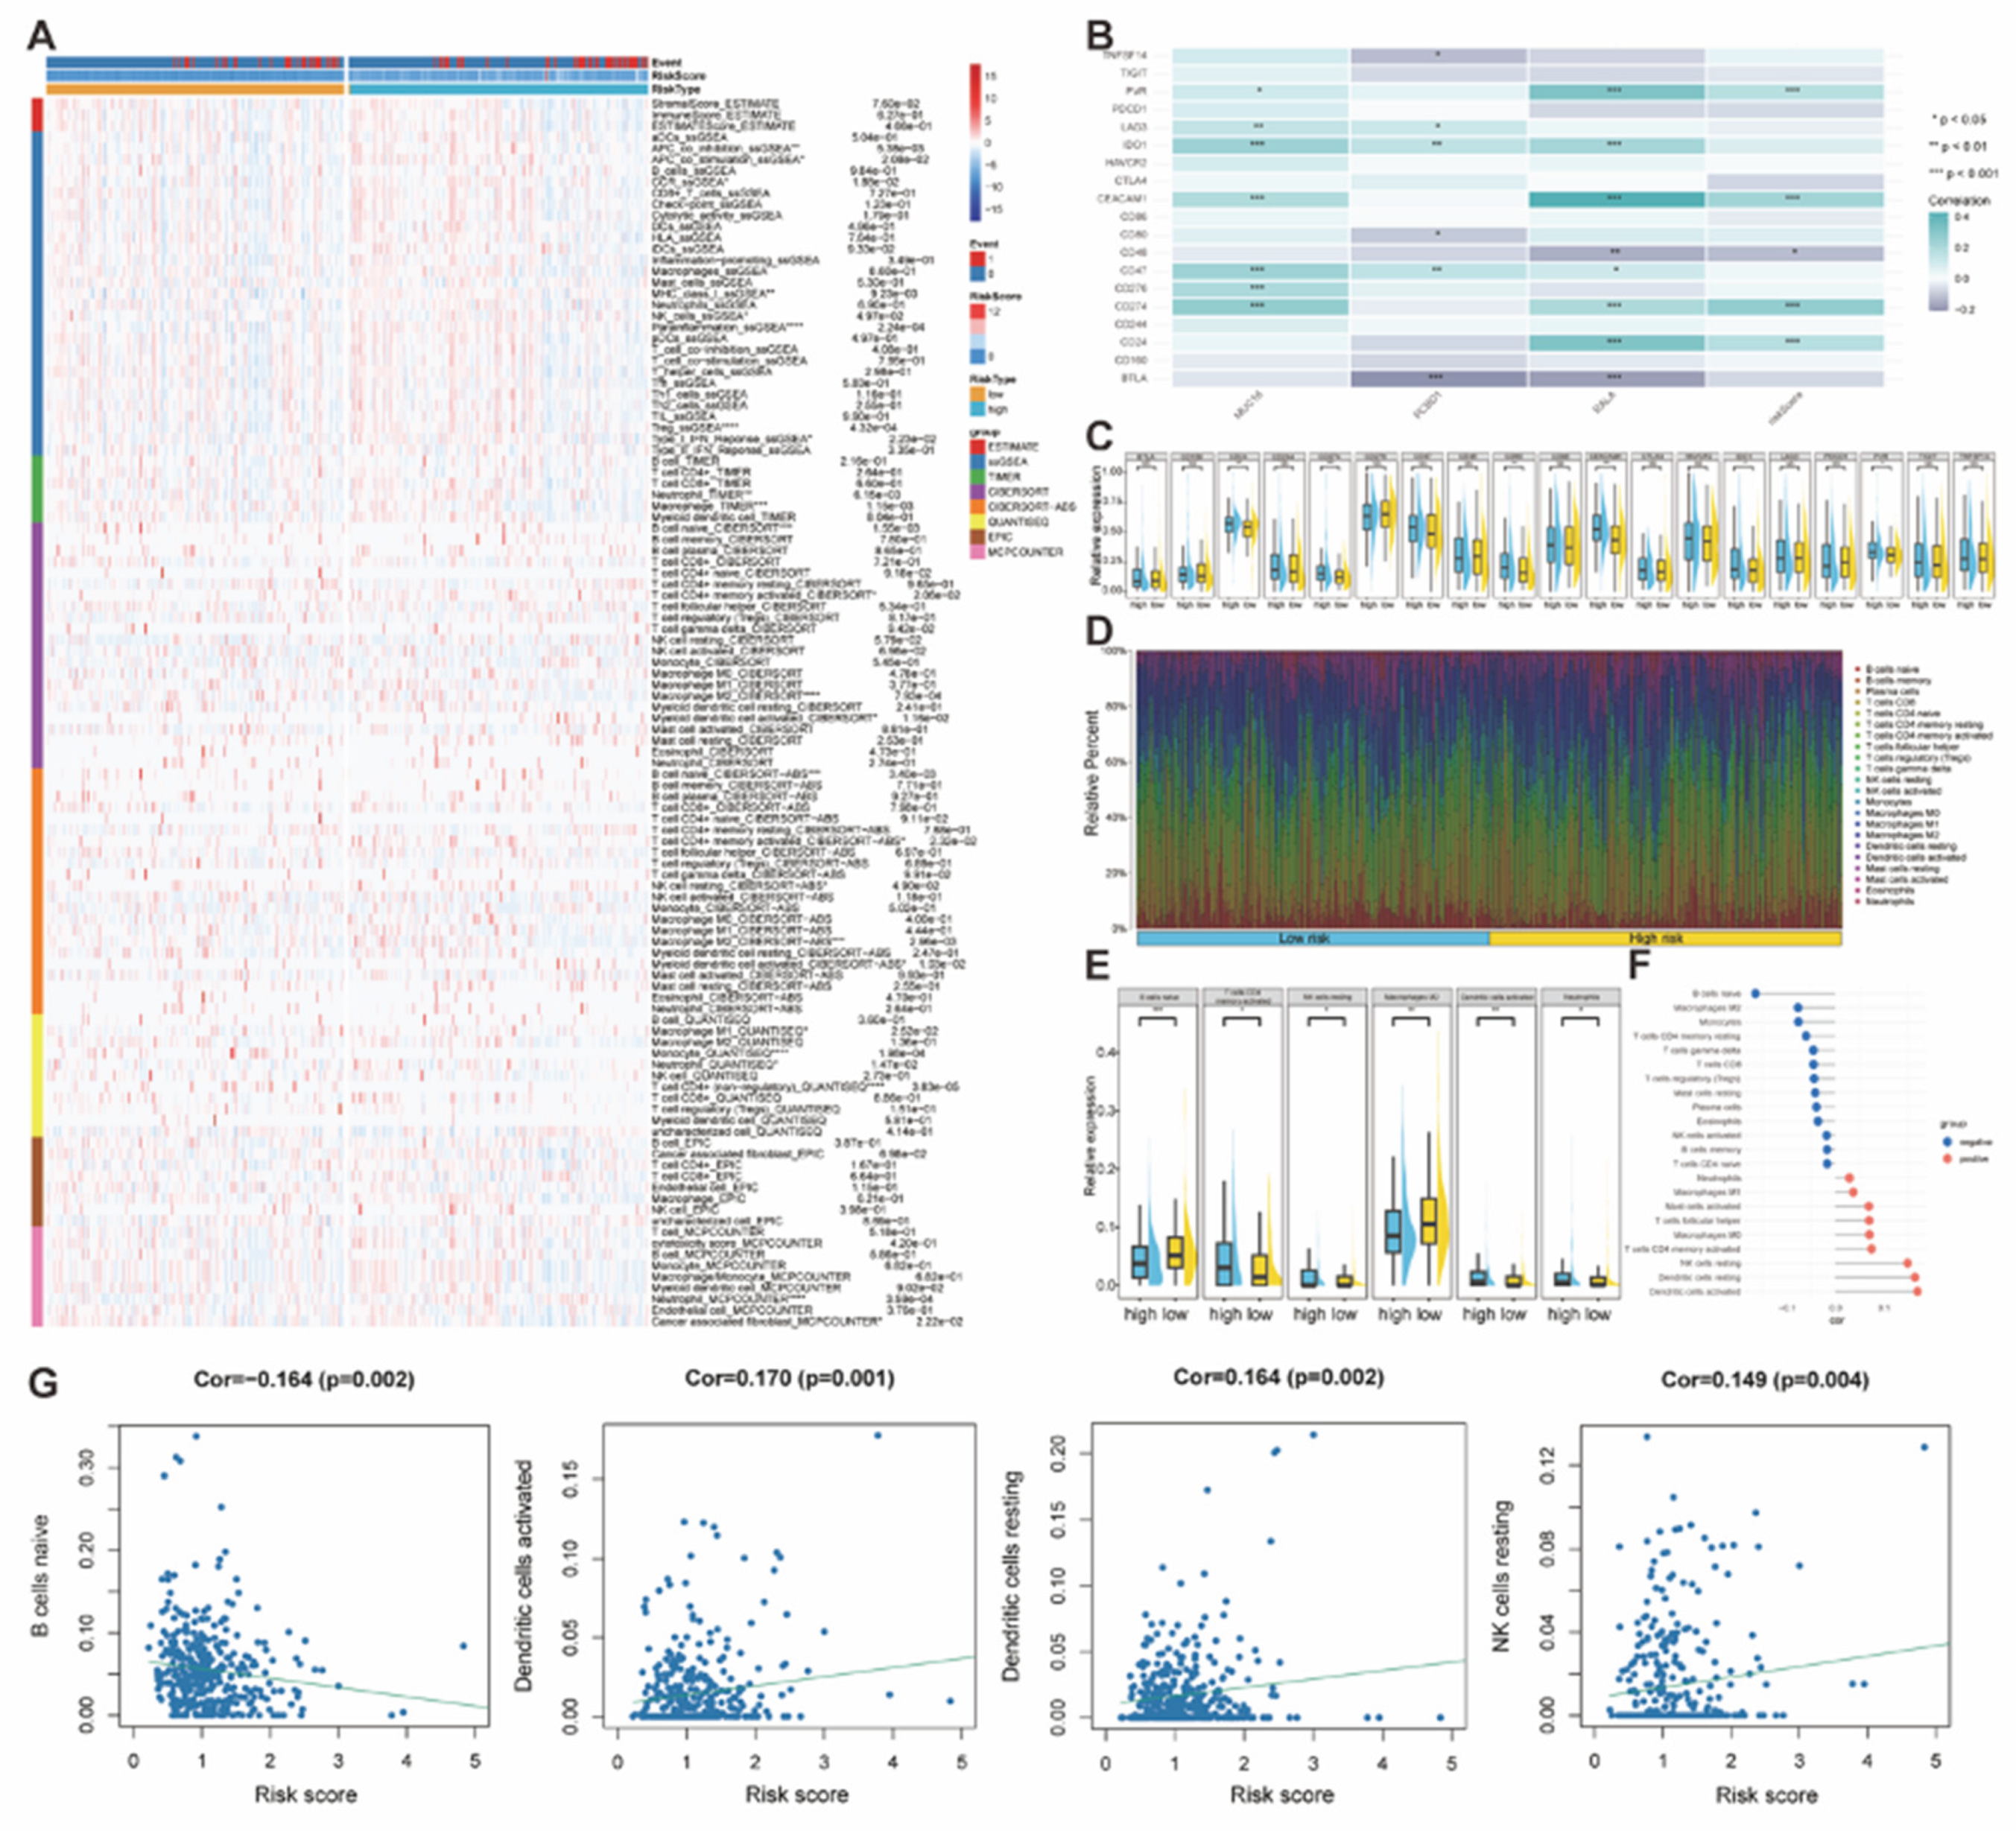
To further extend the research of our risk profile predicting model, we paid attention to immune infiltration. We used multiple methods, which included ESTIMATE, ssGSEA, CIBERSORT, quanTIseq, TIMER, EPIC, and MCPcounter, to quantify and estimate the infiltration level of different immune cells in the TCGA-STAD cohort, and compare the results between both high- and low-risk groups (Figure 9A). Besides, we also analyzed the correlation between the risk profile predicting model, which consisted of 3 risk-related genes (MUC16, RALA, PCBD1) and the risk score, and multiple immune checkpoints (Figure 9B). Meanwhile, for these immune checkpoints, the comparison between both high and low risk groups was employed (Figure 9C). Then, we revealed that some immune checkpoints (CD24, CD274, CEACAM1, IDO1, PVR) were positively related to our risk profile predicting model. For the infiltration of different immune cells in high/low risk groups, we further selected the result of CIBERSORT (Figure 9D), and found several immune cells with the statistically significant difference between the high/low risk group, which included B cells naïve, T cells CD4 memory activated, NK cells resting, Macrophages M2, Dendritic cells activated and Neutrophils (Figure 9E). Furthermore, we also did the correlation analysis of immune cells in CIBERSORT with risk scores, and found that only four immune cells (B cells naïve, Dendritic cells activated, Dendritic cells resting, NK cells resting) were significantly correlated (Figure 9F-G). Except for the Dendritic cells resting, all three other cells presented the same tendency as the comparison between the high/low risk groups.
3. Discussion
In this study, we comprehensively investigated the cellular heterogeneity of gastric cancer in not only bulk but also single-cell RNA sequencing data. Seven distinct tumor subtypes had been identified, which revealed their diversity of biological and transcriptional features. Among these seven clusters of scRNA data, the OLFM4-positive C3 subtype demonstrated significantly upregulated activity of both palmitoylation and glycolysis, which indicated a unique metabolic phenotype.
It was reported that OLFM4 was widely expressed among several types of tumors, which included gastric cancer, and many researchers held the view that OLFM4 acted as a secreted glycoprotein involved in the molecular mechanism regulation and played an important role in the development of gastric carcinogenesis [19,25,35,36,37]. For example, Tsubosaka et al. hold the view that OLFM4 may play a crucial role in the early stage of intestinal metaplasia (IM), which could be identified as a biomarker for cells in the intermediate stage between gastric and intestinal cell types [38]. And OLFM4 also presents the potential as a biomarker for the early detection of high-risk gastric lesions [23]. Besides, it’s also reported that high OLFM4 expression could be found in the intestinal stem cells of the IM region, which is correlated with the upregulation of the activity in not only oxidative phosphorylation but also myelocytomatosis (MYC) pathways [39]. However, very limited publications have defined the correlation between OLFM4 and not only palmitoylation but also energetic metabolism in gastric cancer. Therefore, we further verified their underlying relationship.
Functional experiments confirmed that upregulated expression of OLFM4 in GC cell lines with limited expression promoted the expression of specific biomarkers of palmitoylation and glycolysis, which included ZDHHC2 and GLUT1, accompanied by enhanced production of ATP. Furthermore, we established a risk-score-related model based on three C3-specific genes (MUC16, RALA, and PCBD1) for predicting outcomes of GC patients, which was also correlated with immune checkpoint expression. These findings novelly highlight the association between OLFM4 and not only palmitoylation but also energy metabolism in gastric cancer progression.
For the lipid modification of protein palmitoylation, the zinc finger DHHC-type (ZDHHC) enzyme family plays a key regulatory role in multiple cancer types, including gastric cancer (GC). By inducing the covalent attachment of palmitic acid to cysteine residues, the palmitoylation influences not only protein stability, but also membrane localization and signaling dynamics. Mechanistically, dysregulation of specific ZDHHC enzymes, which notably include ZDHHC2, ZDHHC3, and ZDHHC9, has been proven to have an association with aberrant activation of multiple oncogenic signaling cascades such as Ras, Wnt/β-catenin, and PI3K/Akt [32]. For example, in the research on the molecular mechanism, it’s said that antiproliferative signaling could be mediated by palmitoylation of CKAP4 induced by ZDHHC2 [40]. Besides, DHHC2-induced palmitoylation of Nrf2 could inhibit ubiquitin-dependent degradation to stabilize the transcription factor. It not only induces the enhancement of transcriptional activity of Nrf2 but also drives redox homeostasis, metabolic reprogramming, and chemoresistance in GC [34]. Both 2-bromopalmitate (2-BP) treatment and DHHC2 silencing could block this modification, which further reduces tumor growth and reverses immune suppression, positioning palmitoylation as a therapeutic target. Moreover, it’s also reported that the membrane localization and stability of PD-L1 could be enhanced in AGS after the palmitoylation by ZDHHC3, which further inhibits the sustenance of T-cells to promote immune evasion [41].
In the ZDHHC family, we realized that both ZDHHC2 and ZDHHC14 have been investigated in GC by several studies. For ZDHHC14, it has been reported that high ZDHHC14 expression could primarily promote tumor cell migration and invasion of GC by regulating integrin α5 and β1 subunit mRNA and protein, which indicates ZDHHC14 as an oncogene [33]. Interestingly, some articles announced that ZDHHC2 may serve as a tumor suppressor, as high ZDHHC2 expression is associated with worse clinical phenotypes, which include heavier lymph node metastasis, worse prognosis, and higher histological grade [42,43]. However, some other publications also indicate that the upregulation of ZDHHC2 could induce the promotion of GC growth and reduce the reactive oxygen species (ROS) levels via the palmitoylation of NRF2 [34].
Such differences of ZDHHC2 among different studies may be attributed to multiple factors, including the cellular context, the target substrates, and the oxidative stress microenvironment in different gastric cancer models. Since the process of palmitoylation is reversible for regulating protein localization and stability, the final biological effect of ZDHHC2 activation could largely be attributed to the regulation of its underlying molecular mechanism. In particular, the stabilization of NRF2 protein, which is induced by the ZDHHC2-mediated palmitoylation, thereby enhances the antioxidant defense system for reducing intracellular ROS levels, which indicates a feasible reason for tumor cells to survive under oxidative stress and suggests that ZDHHC2 can act as an oncogenic factor under certain conditions. Conversely, loss of ZDHHC2-mediated palmitoylation on other substrates may also lead to the opposite result. Therefore, we hold the view that ZDHHC2 may act as a suppressor or promoter in the process of tumor development, which depends on its specific interacting partners and the surrounding microenvironment.
Then, as for metabolic reprogramming, it is widely recognized as a hallmark of cancer, including the GC [44]. Several factors could lead to the occurrence of metabolic reprogramming, such as: interactions between gene and protein levels, and communications between tumor cells and host cells, which could further enhance the absorption of glucose in cancer [45]. For example, the p53 could regulate fructose-2,6-bisphosphatase to inhibit glycolysis, promote antioxidant activity, which further induces a reduction in intracellular reactive oxygen species (ROS) [46]. Besides, several biological processes induced by the abnormal activation of c-MYC, which include not only chromosomal translocation but also gene amplification and transcriptional enhancement, are significantly related to the occurrence and development of metabolic reprogramming [47]. Therefore, we tend to perform some novel molecular modulators of energetic metabolism, which induce us to have the scRNA analysis. According to our single-cell analysis data, we revealed that the diversity of metabolism occurred not only between tumor and normal epithelial cells but also among malignant subtypes themselves. The enrichment results of the C3 subtype exhibited multiple upregulated pathways of metabolism, including glycolysis, ATP synthesis coupled to electron transport, and oxidative phosphorylation, which indicated enhanced metabolic plasticity. This observation corresponds to previous studies reporting that OLFM4 promotes cell proliferation [34]. Thus, we tend to observe the relationship between OLFM4 and the underlying modulators of energetic metabolism. It’s widely known that tumor cells could reverse their metabolic mode in different conditions, including not only the concentration of external nutrients but also stress conditions, and prefer to produce adenosine triphosphate (ATP) via glycolysis even with enough oxygen, which makes us select glycolysis for further verification [48,49]. With the function of transporting glucose into cells, the glucose transporters 1 (GLUT1) play a crucial role in glucose metabolism as a key glycolytic enzyme [28,50]. Then, considering the definite biological impact on the energetic metabolism in GC, such as reversed metabolic reprogramming and induced apoptosis due to the downregulation of GLUT1, we finally select GLUT1 for verifying the association between the OLFM4 and glycolysis [51].
As a prognosis predicting tool, the risk model we established, which is composed of MUC16, RALA, and PCBD1, provides a good effect in predicting outcomes of STAD patients. MUC16, which is also called CA125, is a membrane-bound mucin. Besides, MUC16 also plays an effective role in risk stratification of patients for evaluating the therapeutic efficacy, as its combination with human epididymis 4 (HE4) can give patients with endometrioid adenocarcinoma before surgery an effective prediction of the high lymph node metastasis (LNM) risk [52]. And in GC, MUC16 has been reported for its association with the tumor mutation burden (TMB) [53]. Then, as a small GTPase, RALA encodes the RAS-like (RAL) GTPases with its family member RALB together, which is also associated with immune infiltration in the TME. There is a positive correlation between the RALA expression and the Macrophage M1 infiltration in STAD [54]. Furthermore, however, as the most abundant organs of PCBD1 are the kidney and liver, it’s difficult to discover enough significant results about its association with the development and progression of STAD [55]. Anyway, after combining these three genes together for stratification, TCGA-STAD patients are divided into high- and low-risk groups, whose efficacy and clinical value have been validated by not only ROC but also Kaplan–Meier analyses. Importantly, the risk score is positively correlated with multiple immune checkpoints, which include PD-L1 (CD274) and IDO1, indicating that metabolic reprogramming might be related to immunosuppressive TME, which implies that it may be possible for those patients with high OLFM4 expression or high-risk scores to benefit from some therapies targeting both energetic-metabolism-related pathways and immune checkpoints.
However, there are still many limitations to consider. First, although we got some valuable insights from our single-cell analysis, the number of selected gastric cancer samples was relatively limited, which may not capture the entire spectrum of tumor heterogeneity in GC. Second, though we had confirmed the regulations of OLFM4 towards ZDHHC2 as well as GLUT1 in vitro experiments, further investigation in vivo should also be required for validation and to explore the underlying signaling pathways with more details. Third, as the risk-score-related model was derived from the TCGA-STAD cohort, an external verification in at least another independent clinical dataset should be necessary for ensuring its general applicability. Despite these limitations, we still hold the view that we establish an integrative approach, which combines computational analysis with experimental validation, and provides a robust framework for exploring heterogeneity in gastric cancer.
4. Materials and Methods
4.1. Bulk-Seq Data Analyzation
The RNA-Seq expression matrix in log2-transformed TPM of human gastric cancer samples with the corresponding clinic data (n=403) was obtained from the TCGA-STAD cohort to establish the model for further analysis.
4.2. scRNA-Seq Data Processing
The scRNA Seq data of 4 human gastric cancer samples (3 primary gastric cancer and 1 adjacent non-tumoral sample) of the GSE163558 cohort in the GEO database were selected for further analysis. The whole process was achieved via the Seurat R package. For the quality control, cells were excluded with the mitochondrial percentage more than 20%, and the cutoffs of both UMI counts and gene counts were set as 200-1500 and 200-5000. Then the filtered data was normalized by R function NormalizedData(). Afterwards, FindVariableFeatures() function was performed to select 2000 highly variable genes for further PCA reduction. Furthermore, to reduce the impact of the cell cycle, we used the ScaleData() function by regressing out both “S.Score” and “G2M.Score”. Besides, the R package harmony was applied to reduce the batch effect of multiple samples. The dimensionality reduction included both UMAP and TSNE, and cell clusters were annotated via the method of Louvian with different specific signatures. As the FindAllMarkers() function was used to discover the differentially expressed genes (DEGs) among different cell clusters, we set the threshold for identifying significant DEGs as: p-value<0.05, log2FC>0.25 and the expression proportion more than 0.1.
4.3. Cell Clusters Identification
Multiple groups of genes were used to identify different human cell clusters in scRNA Seq. For the epithelial cells, AGR2, PIGR, KRT19, KRT8, KRT18 were regarded as specific markers, and SPARC, CALD1, COL1A2, COL3A1, COL1A1 were identified as the specific markers of fibroblast. Besides, markers for identifying endothelial cells included IGFBP5, PLVAP, STC1, COL4A1, IGFBP7, SPARCL1. T cells were divided into 3 types, which included CD4+ T cells (CXCL13, DUSP4, ICOS, TNFRSF18, MAF, CD2, CTLA4), CD8+ T cells (GZMB, GZMA, NKG7, CCL5, GNLY) and Naïve T cells (INTS6, TSPYL2, TCF7, BCL11B, HEXIM1, IL7R). Meanwhile, we selected several markers (G0S2, FCGR3B, S100A8, CXCL8) as the specific markers for identifying neutrophil cells. Furthermore, markers of monocytes consisted of MMP12, EREG, CTSB, SPP1, APOE. As for the plasma cells and B cells, we used two different groups of markers to distinguish them. The markers of plasma cells were IGLC3, JCHAIN, IGHA1, IGKC, and B cells specific markers were CD83, LY9, MEF2C, BANK1, MS4A1. For the classification of tumor cells, seven specific markers of gastric cancer (LGALS3, CD74, PLCG2, OLFM4, HELLS, TOP2A, GNLY) were selected for the distinguishment according to their expression in these cells. Then, seven clusters of malignant epithelial cells were identified.
4.4. CNV Analysis of scRNA-Seq
With the identification of different clusters, CNV analysis was further performed in the scRNA data to estimate the malignancy level of all cells through the inferCNV. As fibroblasts and endothelial cells were annotated into reference groups, CNV scores of each epithelial cell were acquired, and cells with a score higher than the median CNV score were identified as malignant tumor cells.
4.5. Pseudotime Analysis of scRNA-Seq
To analyze the pseudotime of the identified malignant tumor cells, the R package Monocle2 was used to investigate their differentiation simulation. First, the Seurat object of tumor cells was transferred into the CellDataSet (CDS) object. Then, after the gene ordering had been identified, the DDRTree method was applied for both the dimensionality reduction and the trajectory inference. All parameters in the analysis were set default.
4.6. Transcription Factor Analysis
The transcription factor (TF) analysis in malignant tumor cells was achieved through the Single-Cell Regulatory Network Inference and Clustering (SCENIC) to calculate the regulon activity score (RAS) in default characters. First, by using the GRNBoost software, we built the TF-genes co-expression network. Then, with the motif database, we could verify the combination between those genes and TFs via the RcisTarget. Furthermore, the AUCell R package was used to quantify the activity of each regulatory subset, which was regarded as the Regulon score.
4.7. Cell-Cell Communication Analysis
The analysis of cell-cell communication was achieved by CellChat R package. First, we set the normalized gene expression matrix as the input to create the CellChat object. After identifying both over-expressed signaling genes and over-expressed ligand-receptor interactions, communication probability between any cell groups with interaction had been calculated via the R function computeCommunProb(). Furthermore, we also computed the probability of communication at the signaling pathways level with filtered communications, which was achieved by R functions including filterCommunication() and computeCommunProbPathway(). Finally, the network of cell communications had been established through the R function aggregateNet(), which revealed exact communications between any different cell groups.
4.8. The Signature Score of Efferocytosis
We first select the geneset of efferocytosis, whose term was named as GOBP_PEPTIDYL_L_CYSTEINE_S_PALMITOYLATION (gsea-msigdb.org), from the Msigdb database. Then, we used the geneset for calculating the signature score, which represented the activity of the efferocytosis degree, in the scRNA data via the ssGSEA method in the GSVA R package.
4.9. Immune Infiltration Analysis
For estimating the infiltration of different immune cells in human bulk sequence, three methods including ESTIMATE, CIBERSORT, and xCell were applied by using the IOBR R package, which finally provided a numeric immune infiltration score to each patient sample from TCGA-STAD.
4.10. Enrichment Analysis
With the method of hypergeometric distribution, enrichment analysis based on the KEGG and GO databases was applied by using the clusterProfiler R package. Significant signaling pathways were identified as the p-value, which was adjusted by BH, was lower than 0.05. GSVA analysis was achieved by using fgsea R package, and the GSVA scores of each pathway in different tumor subtypes were compared to find a statistically significant result, whose significance was further quantified by the t-value.
4.11. The Prognosis-Based Model for Gene Screening
With the different expressed genes (DEGs) from the C3 tumor cell cluster, we chose several models based on the patients’ prognosis to perform further gene screening, which included both the univariate and multivariate Cox regression model (R function coxph() from the survival R package). As for the threshold of the filter, the p-value for univariate Cox regression was set as p<0.1 and for multivariate regression was set as p<0.05. Then, with the timeROC R package, the model’s prediction capabilities were quantified and estimated through the area under the curve (AUC) of the time-varying receiver operating characteristic (ROC) curve.
4.12. The Statistical Analysis
All data was processed, analyzed, and visualized through R 4.1.3. In these steps, Pearson’s analysis was applied to estimate the correlation between any two continuous variables, and the Chi-squared test was used to assess the correlation of categorical variables. The Wilcoxon rank-sum test or the T-test was performed in the comparison between two groups, and one-way ANOVA was applied to the comparison with groups of more than three. In the KM survival analysis, the best cut-off for separating the continuous variable was achieved through the survminer R package.
4.13. Cell Culture
All human gastric cancer cell lines were originated from the American Type Culture Collection (ATCC), which included GES-1, HGC-27, AGS, MKN45, SGC-7901, and were cultured with the 10% fetal bovine serum (FBS) medium (DMEM or RPMI-1640) at an atmosphere of 5% CO2 and 37 °C. Selected cell lines were further incubated with the recombinant protein of OLFM4 (10261-OL, R&D Systems) for 24h.
4.14. Western Blotting
Lysates of multiple cell lines seeded in 10cm wells were collected after cell lysis. The extracted proteins of different cell lines were separated by sodium dodecyl sulfate - polyacrylamide gel electrophoresis (SDS-PAGE) and transferred onto PVDF membranes, which were further blocked in 5% milk for 1h at room temperature. After incubating with primary antibodies at 4 °C overnight, secondary antibodies were used to incubate membranes for 1h at room temperature. Finally, we used the Odyssey CLx Imager for visualizing signals.
Antibodies are listed: OLFM4 (ab85046, Abcam), GLUT1(ab115730, Abcam), ZDHCC2 (sc-515204, Santa Cruz), β-actin (sc-69879, Santa Cruz).
4.15. ATP Measurement
The treated human gastric cancer cell lines in 6-well plates were lysed and centrifuged to obtain the lysates, which were further used for measuring the ATP level according to the instructions of the ATP assay kit (HY-K0314, MCE). The expression of ATP in different samples was quantified by the strength of luminescence in the microplate reader.
5. Conclusions
In summary, we comprehensively analyzed both single-cell and bulk RNA sequencing data of STAD, which revealed pronounced heterogeneity in different gastric cancer cells. Among seven malignant tumor subtypes, the C3 tumor subtype characterized by OLFM4 showed more activity not only on palmitoylation but also on energetic metabolism, particularly glycolysis. Furthermore, a prognostic risk model, which was based on three C3-specific genes (MUC16, RALA, and PCBD1), was established and could effectively predict the overall survival of gastric cancer patients. Besides, it was also found that the risk-profile predicted model was correlated with immune checkpoint expression, which indicated the possibility of immunotherapy. These findings highlight the palmitoylation and energy metabolism, which were associated with the OLFM4-specific expression, as key mechanisms for guiding the clinical treatment of gastric cancer.
Author Contributions
Weiping Wei, Gong Chen collected and analyzed data, drew in R language, and prepared the manuscript. Xiaoyan Huang performed the tests and final check. Xiaoyan Huang drafted the manuscript. All authors read and approved the final manuscript. Gong Chen and Weiping Wei contributed equally to this work.
Funding
This work was supported in part by the scholarships from the China Scholarship Council (CSC) (No. 202508080052, No. 202108350015, and No. 202308080048).
Institutional Review Board Statement
All data used in this study were obtained from public databases (TCGA and GEO). Therefore, ethical approval was not applicable.
Informed Consent Statement
All data used in this study were obtained from public databases (TCGA and GEO). Therefore, the informed consent was not applicable.
Data Availability Statement
All datasets analyzed in this study are publicly available. The bulk RNA sequencing data of stomach adenocarcinoma (STAD) were obtained from The Cancer Genome Atlas (TCGA-STAD) (https://portal.gdc.cancer.gov/), and the scRNA sequencing dataset was downloaded from the Gene Expression Omnibus (GEO) under accession number GSE163558 (https://www.ncbi.nlm.nih.gov/geo/query/acc.cgi?acc=GSE163558). Additional processed data supporting the findings of this study, including normalized expression matrices, differential expression results, and prognostic model coefficients, are available from the corresponding author upon reasonable request.
Acknowledgments
The authors gratefully acknowledge the financial support provided by the CSC and the institutional support from the Medical Faculty Heidelberg University.
Conflicts of Interest
The authors declare no conflicts of interest.
Abbreviations
The following abbreviations are used in this manuscript:
| OLFM4 | Olfactomedin 4 |
| GC | Gastric Cancer |
| scRNA | Single-Cell RNA Sequencing |
| STAD | Stomach Adenocarcinoma |
| TME | Tumor Microenvironment |
| TCGA | The Cancer Genome Atlas |
| CAFs | Cancer-Associated Fibroblasts |
| HK2 | Hexokinase 2 |
| VDACs | Voltage-Dependent Anion Channels |
| ZDHHC2 | Zinc Finger DHHC-Type Palmitoyltransferase 2 |
| GLUT1 | Glucose Transporter 1 |
| ATP | Adenosine Triphosphate |
| TF | Transcription Factor |
| RAS | Regulon Activity Scores |
| GSVA | Gene Set Variation Analysis |
| KEGG | Kyoto Encyclopedia of Genes and Genomes |
| GO | Gene Ontology |
| GSEA | Gene Set Enrichment Analysis |
| DEGs | Different Expressed Genes |
| AUC | Area Under the Curve |
| ATCC | American Type Culture Collection |
| FBS | Fetal Bovine Serum |
| PVDF | Polyvinylidene Fluoride |
| CNV | Copy Number Variation |
| PT | Primary Tumor tissue |
| NT | Normal Tissue |
| MUC16 | Mucin 16 |
| RALA | RAS-Like Proto-Oncogene A |
| PCBD1 | Pterin-4 Alpha-Carbinolamine Dehydratase 1 |
| MYC | Myelocytomatosis |
| ROC | Receiver Operating Characteristic |
| KM | Kaplan-Meier |
| OS | Overall Survival |
| CI | Confidence Interval |
| HR | Hazard Ratio |
| LNM | Lymph Node Metastasis |
References
- Smyth, E. C. , Nilsson, M., Grabsch, H. I., Van Grieken, N. C. & Lordick, F. Gastric cancer. The Lancet 396, 635–648 (2020). [CrossRef]
- Ni, B. , Song, X., Shi, B., Wang, J., Sun, Q., Wang, X., et al. Research progress of ginseng in the treatment of gastrointestinal cancers. Front. Pharmacol. 13, 1036498 (2022). [CrossRef]
- Luo, L. , Li, L., Liu, L., Feng, Z., Zeng, Q., Shu, X., et al. A Necroptosis-Related lncRNA-Based Signature to Predict Prognosis and Probe Molecular Characteristics of Stomach Adenocarcinoma. Front. Genet. 13, 833928 (2022). [CrossRef]
- He, Y. , Zhang, H., Zhang, Y., Wang, P., Zhu, K. & Ba, Y. Comprehensive Characterization of Transforming Growth Factor Beta Receptor 1 in Stomach Adenocarcinoma Identifies a Prognostic Signature for Predicting Clinical Outcomes and Immune Infiltrates. Int. J. Gen. Med. Volume 15, 3375–3391 (2022). [CrossRef]
- Xu, H. , Jiao, D., Liu, A. & Wu, K. Tumor organoids: applications in cancer modeling and potentials in precision medicine. J. Hematol. Oncol.J Hematol Oncol 15, 58 (2022). [CrossRef]
- Chen, H. , Zheng, Z., Yang, C., Tan, T., Jiang, Y. & Xue, W. Machine learning based intratumor heterogeneity signature for predicting prognosis and immunotherapy benefit in stomach adenocarcinoma. Sci. Rep. 14, 23328 (2024). [CrossRef]
- Sohn, B. H. , Hwang, J.-E., Jang, H.-J., Lee, H.-S., Oh, S. C., Shim, J.-J., et al. Clinical Significance of Four Molecular Subtypes of Gastric Cancer Identified by The Cancer Genome Atlas Project. Clin. Cancer Res. 23, 4441–4449 (2017). [CrossRef]
- Hasegawa, T. , Yashiro, M., Nishii, T., Matsuoka, J., Fuyuhiro, Y., Morisaki, T., et al. Cancer-associated fibroblasts might sustain the stemness of scirrhous gastric cancer cells via transforming growth factor-β signaling. Int. J. Cancer 134, 1785–1795 (2014).
- Wang, K. , Yuen, S. T., Xu, J., Lee, S. P., Yan, H. H. N., Shi, S. T., et al. Whole-genome sequencing and comprehensive molecular profiling identify new driver mutations in gastric cancer. Nat. Genet. 46, 573–582 (2014). [CrossRef]
- The Cancer Genome Atlas Research Network. Comprehensive molecular characterization of gastric adenocarcinoma. Nature 513, 202–209 (2014). [CrossRef]
- Cristescu, R. , Lee, J., Nebozhyn, M., Kim, K.-M., Ting, J. C., Wong, S. S., et al. Molecular analysis of gastric cancer identifies subtypes associated with distinct clinical outcomes. Nat. Med. 21, 449–456 (2015). [CrossRef]
- Dai, H. , Ren, J., Wang, C., Huang, J. & Wang, X. Prognostic molecular subtype reveals the heterogeneity of tumor immune microenvironment in gastric cancer. Sci. Rep. 15, 14453 (2025). [CrossRef]
- Deng, G. , Zhang, X., Chen, Y., Liang, S., Liu, S., Yu, Z., et al. Single-cell transcriptome sequencing reveals heterogeneity of gastric cancer: progress and prospects. Front. Oncol. 13, 1074268 (2023). [CrossRef]
- Yohe, S. & Thyagarajan, B. Review of Clinical Next-Generation Sequencing. Arch. Pathol. Lab. Med. 141, 1544–1557 (2017). [CrossRef]
- Baslan, T. & Hicks, J. Unravelling biology and shifting paradigms in cancer with single-cell sequencing. Nat. Rev. Cancer 17, 557–569 (2017). [CrossRef]
- Guruprasad, P. , Lee, Y. G., Kim, K. H. & Ruella, M. The current landscape of single-cell transcriptomics for cancer immunotherapy. J. Exp. Med. 218, e20201574 (2021). [CrossRef]
- Zhu, L. , Cheng, X., Shi, J., Lin, J., Chen, G., Jin, H., et al. Crosstalk between bone marrow-derived myofibroblasts and gastric cancer cells regulates cancer stemness and promotes tumorigenesis. Oncogene 35, 5388–5399 (2016). [CrossRef]
- Ding, X. , Ji, J., Jiang, J., Cai, Q., Wang, C., Shi, M., et al. HGF-mediated crosstalk between cancer-associated fibroblasts and MET-unamplified gastric cancer cells activates coordinated tumorigenesis and metastasis. Cell Death Dis. 9, 867 (2018). [CrossRef]
- Zhang, J. , Liu, W.-L., Tang, D. C., Chen, L., Wang, M., Pack, S. D., et al. Identification and characterization of a novel member of olfactomedin-related protein family, hGC-1, expressed during myeloid lineage development. Gene 283, 83–93 (2002). [CrossRef]
- Zhang, X. , Huang, Q., Yang, Z., Li, Y. & Li, C.-Y. GW112, A Novel Antiapoptotic Protein That Promotes Tumor Growth. Cancer Res. 64, 2474–2481 (2004). [CrossRef]
- Chen, L. , Li, H., Liu, W., Zhu, J., Zhao, X., Wright, E., et al. Olfactomedin 4 suppresses prostate cancer cell growth and metastasis via negative interaction with cathepsin D and SDF-1. Carcinogenesis 32, 986–994 (2011). [CrossRef]
- Liu, W. , Lee, H. W., Liu, Y., Wang, R. & Rodgers, G. P. Olfactomedin 4 is a novel target gene of retinoic acids and 5-aza-2′-deoxycytidine involved in human myeloid leukemia cell growth, differentiation, and apoptosis. Blood 116, 4938–4947 (2010). [CrossRef]
- Wei, H. , Li, W., Zeng, L., Ding, N., Li, K., Yu, H., et al. OLFM4 promotes the progression of intestinal metaplasia through activation of the MYH9/GSK3β/β-catenin pathway. Mol. Cancer 23, 124 (2024). [CrossRef]
- Liu, R. , Yang, M., Xiang, H., Bao, L., Yang, H., Yue, L., et al. Depletion of OLFM4 gene inhibits cell growth and increases sensitization to hydrogen peroxide and tumor necrosis factor-alpha induced-apoptosis in gastric cancer cells. J. Biomed. Sci. 19, 38 (2012). [CrossRef]
- Luo, Z. , Zhang, Q., Zhao, Z., Li, B., Chen, J. & Wang, Y. OLFM4 is associated with lymph node metastasis and poor prognosis in patients with gastric cancer. J. Cancer Res. Clin. Oncol. 137, 1713–1720 (2011). [CrossRef]
- Faubert, B. , Solmonson, A. & DeBerardinis, R. J. Metabolic reprogramming and cancer progression. Science 368, eaaw5473 (2020).
- Pedersen, P. L. Voltage dependent anion channels (VDACs): a brief introduction with a focus on the outer mitochondrial compartment’s roles together with hexokinase-2 in the “Warburg effect” in cancer. J. Bioenerg. Biomembr. 40, 123–126 (2008).
- Liu, Y. , Zhang, Z., Wang, J., Chen, C., Tang, X., Zhu, J., et al. Metabolic reprogramming results in abnormal glycolysis in gastric cancer: a review. OncoTargets Ther. Volume 12, 1195–1204 (2019). [CrossRef]
- Gomes, L. C. , Benedetto, G. D. & Scorrano, L. During autophagy mitochondria elongate, are spared from degradation and sustain cell viability. Nat. Cell Biol. 13, 589–598 (2011). [CrossRef]
- Wang, G. , Dai, L., Luo, L., Xu, W., Zhang, C., Zhu, Y., et al. Non-essential amino acids attenuate apoptosis of gastric cancer cells induced by glucose starvation. Oncol. Rep. 32, 332–340 (2014). [CrossRef]
- Li, W. , Shen, J., Zhuang, A., Wang, R., Li, Q., Rabata, A., et al. Palmitoylation: an emerging therapeutic target bridging physiology and disease. Cell. Mol. Biol. Lett. 30, 98 (2025). [CrossRef]
- Ko, P. & Dixon, S. J. Protein palmitoylation and cancer. EMBO Rep. 19, e46666 (2018). [CrossRef]
- Oo, H. Z. , Sentani, K., Sakamoto, N., Anami, K., Naito, Y., Uraoka, N., et al. Overexpression of ZDHHC14 promotes migration and invasion of scirrhous type gastric cancer. Oncol. Rep. 32, 403–410 (2014). [CrossRef]
- Liu, L. , Wang, L., Liu, L., Qu, X., Zhao, W., Ding, J., et al. Acyltransferase zinc finger DHHC-type containing 2 aggravates gastric carcinoma growth by targeting Nrf2 signaling: A mechanism-based multicombination bionic nano-drug therapy. Redox Biol. 70, 103051 (2024). [CrossRef]
- Aung, P. P. , Oue, N., Mitani, Y., Nakayama, H., Yoshida, K., Noguchi, T., et al. Systematic search for gastric cancer-specific genes based on SAGE data: melanoma inhibitory activity and matrix metalloproteinase-10 are novel prognostic factors in patients with gastric cancer. Oncogene 25, 2546–2557 (2006). [CrossRef]
- Yasui, W. , Oue, N., Aung, P. P., Matsumura, S., Shutoh, M. & Nakayama, H. Molecular-pathological prognostic factors of gastric cancer: a review. Gastric Cancer 8, 86–94 (2005). [CrossRef]
- Shinozaki, S. , Nakamura, T., Iimura, M., Kato, Y., Iizuka, B., Kobayashi, M., et al. Upregulation of Reg 1α and GW112 in the epithelium of inflamed colonic mucosa. Gut 48, 623–629 (2001).
- Tsubosaka, A. , Komura, D., Kakiuchi, M., Katoh, H., Onoyama, T., Yamamoto, A., et al. Stomach encyclopedia: Combined single-cell and spatial transcriptomics reveal cell diversity and homeostatic regulation of human stomach. Cell Rep. 42, 113236 (2023). [CrossRef]
- Huang, K. K. , Ma, H., Chong, R. H. H., Uchihara, T., Lian, B. S. X., Zhu, F., et al. Spatiotemporal genomic profiling of intestinal metaplasia reveals clonal dynamics of gastric cancer progression. Cancer Cell 41, 2019-2037.e8 (2023). [CrossRef]
- Planey, S. L. , Keay, S. K., Zhang, C.-O. & Zacharias, D. A. Palmitoylation of Cytoskeleton Associated Protein 4 by DHHC2 Regulates Antiproliferative Factor-mediated Signaling. Mol. Biol. Cell 20, 1454–1463 (2009). [CrossRef]
- Yao, H. , Lan, J., Li, C., Shi, H., Brosseau, J.-P., Wang, H., et al. Inhibiting PD-L1 palmitoylation enhances T-cell immune responses against tumours. Nat. Biomed. Eng. 3, 306–317 (2019). [CrossRef]
- Peng, C. , Zhang, Z., Wu, J., Lv, Z., Tang, J., Xie, H., et al. A Critical Role for ZDHHC2 in Metastasis and Recurrence in Human Hepatocellular Carcinoma. BioMed Res. Int. 2014, 1–9 (2014). [CrossRef]
- Yan, S.-M. , Tang, J.-J., Huang, C.-Y., Xi, S.-Y., Huang, M.-Y., Liang, J.-Z., et al. Reduced Expression of ZDHHC2 Is Associated with Lymph Node Metastasis and Poor Prognosis in Gastric Adenocarcinoma. PLoS ONE 8, e56366 (2013). [CrossRef]
- Hanahan, D. & Weinberg, R. A. Hallmarks of Cancer: The Next Generation. Cell 144, 646–674 (2011). [CrossRef]
- Nong, S. , Han, X., Xiang, Y., Qian, Y., Wei, Y., Zhang, T., et al. Metabolic reprogramming in cancer: Mechanisms and therapeutics. MedComm 4, e218 (2023). [CrossRef]
- Liu, Z. , Wu, Y., Zhang, Y., Yuan, M., Li, X., Gao, J., et al. TIGAR Promotes Tumorigenesis and Protects Tumor Cells From Oxidative and Metabolic Stresses in Gastric Cancer. Front. Oncol. 9, 1258 (2019). [CrossRef]
- Macek, P. , Cliff, M. J., Embrey, K. J., Holdgate, G. A., Nissink, J. W. M., Panova, S., et al. Myc phosphorylation in its basic helix–loop–helix region destabilizes transient α-helical structures, disrupting Max and DNA binding. J. Biol. Chem. 293, 9301–9310 (2018). [CrossRef]
- Lue, H. , Podolak, J., Kolahi, K., Cheng, L., Rao, S., Garg, D., et al. Metabolic reprogramming ensures cancer cell survival despite oncogenic signaling blockade. Genes Dev. 31, 2067–2084 (2017). [CrossRef]
- Sun, L. , Suo, C., Li, S., Zhang, H. & Gao, P. Metabolic reprogramming for cancer cells and their microenvironment: Beyond the Warburg Effect. Biochim. Biophys. Acta BBA - Rev. Cancer 1870, 51–66 (2018). [CrossRef]
- Zheng, S. , Li, H., Li, Y., Chen, X., Shen, J., Chen, M., et al. The emerging role of glycolysis and immune evasion in gastric cancer. Cancer Cell Int. 23, 317 (2023). [CrossRef]
- Zhang, T.-B. , Zhao, Y., Tong, Z.-X. & Guan, Y.-F. Inhibition of glucose-transporter 1 (GLUT-1) expression reversed Warburg effect in gastric cancer cell MKN45. Int. J. Clin. Exp. Med. 8, 2423 (2015).
- Zhang, X.-Y. , Hong, L.-L. & Ling, Z. MUC16: clinical targets with great potential. Clin. Exp. Med. 24, 101 (2024). [CrossRef]
- Hu, X. , Wang, Z., Wang, Q., Chen, K., Han, Q., Bai, S., et al. Molecular classification reveals the diverse genetic and prognostic features of gastric cancer: A multi-omics consensus ensemble clustering. Biomed. Pharmacother. 144, 112222 (2021). [CrossRef]
- Jin, H. , Qin, S., He, J., Xiao, J., Li, Q., Mao, Y., et al. Systematic pan-cancer analysis identifies RALA as a tumor targeting immune therapeutic and prognostic marker. Front. Immunol. 13, 1046044 (2022). [CrossRef]
- Tholen, L. E. , Bos, C., Jansen, P. W. T. C., Venselaar, H., Vermeulen, M., Hoenderop, J. G. J., et al. Bifunctional protein PCBD2 operates as a co-factor for hepatocyte nuclear factor 1β and modulates gene transcription. FASEB J. 35, e21366 (2021). [CrossRef]
Figure 1.
(A) The dot plot demonstrated specific markers for identifying different cell clusters. (B) The UMAP plot visualized the classification of different cell clusters. (C) The bar plot represented the ratios of different cells in both the primary tumor and the normal tissue.
Figure 1.
(A) The dot plot demonstrated specific markers for identifying different cell clusters. (B) The UMAP plot visualized the classification of different cell clusters. (C) The bar plot represented the ratios of different cells in both the primary tumor and the normal tissue.
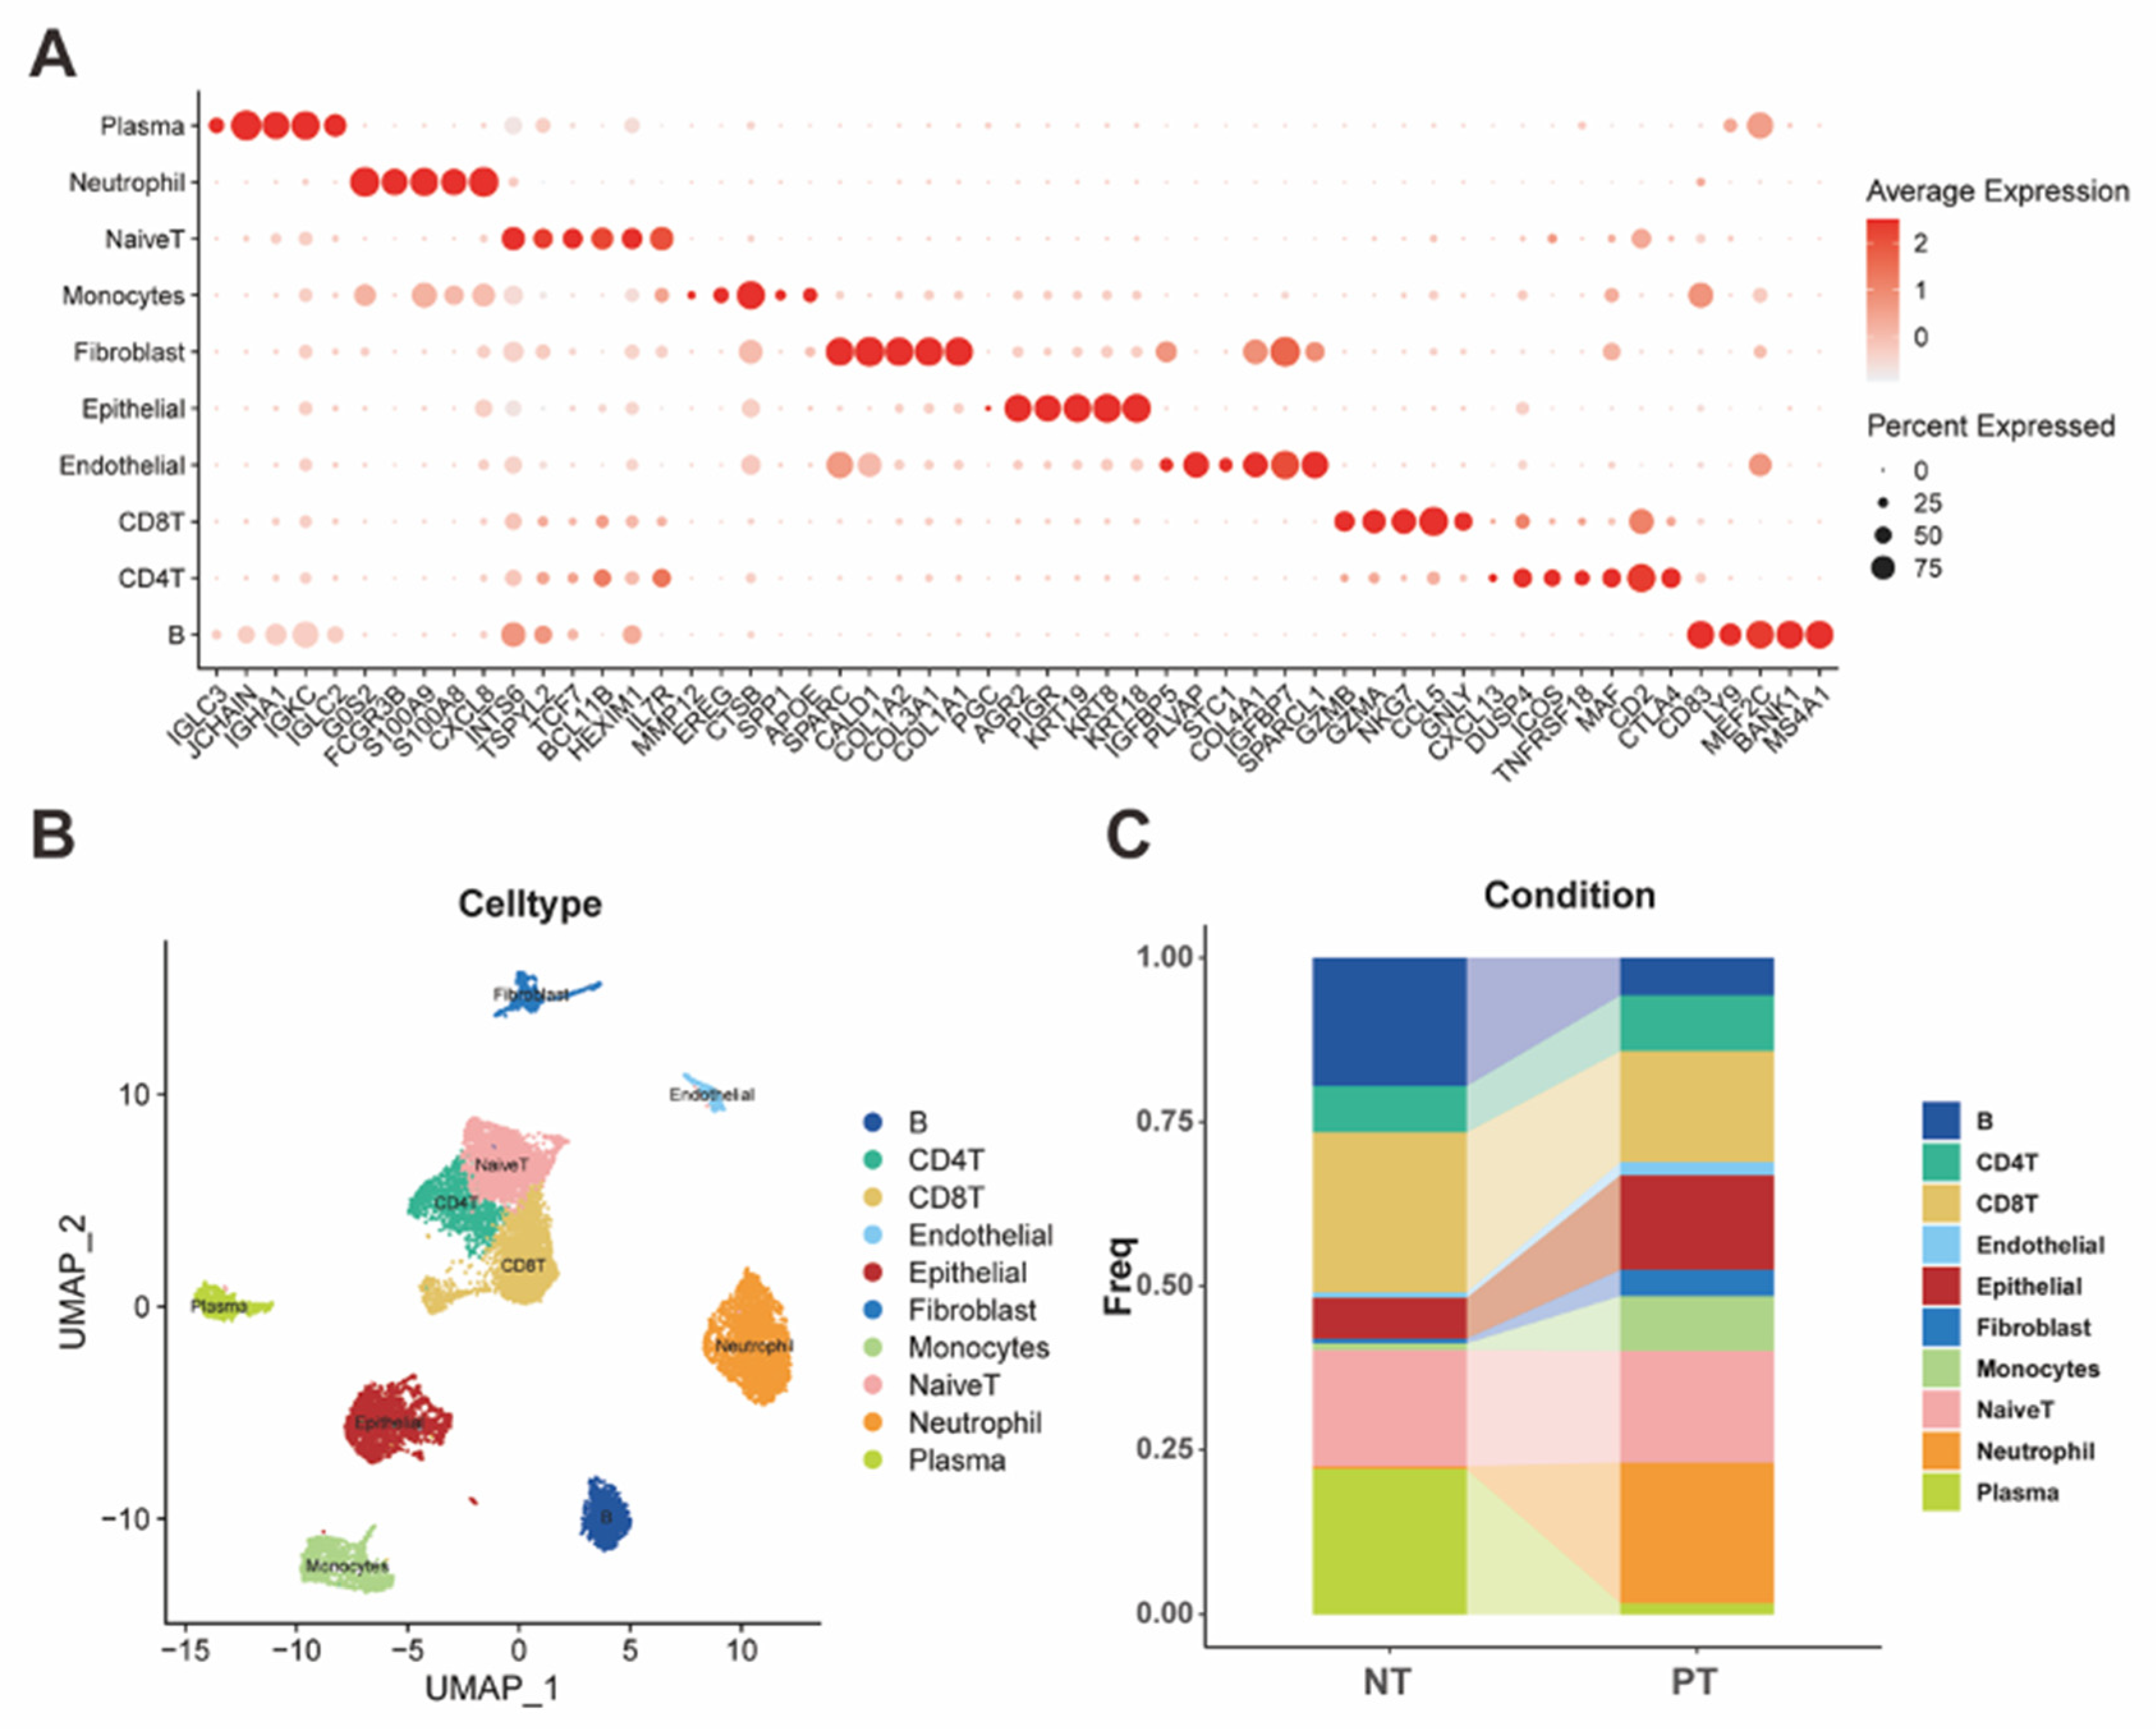
Figure 3.
(A) tSNE plot demonstrated seven subtypes of malignant epithelial cells. (B-C) Bar plots presented the ratio of each subtype in different cell cycle phases and tissue types. (D) Heatmap of Ro/e analysis showed the enrichment of different tumor subtypes in different tissue groups. (E-H) tSNE plots and violin plots revealed the diversity of multiple tumor subtypes in different dimensions.
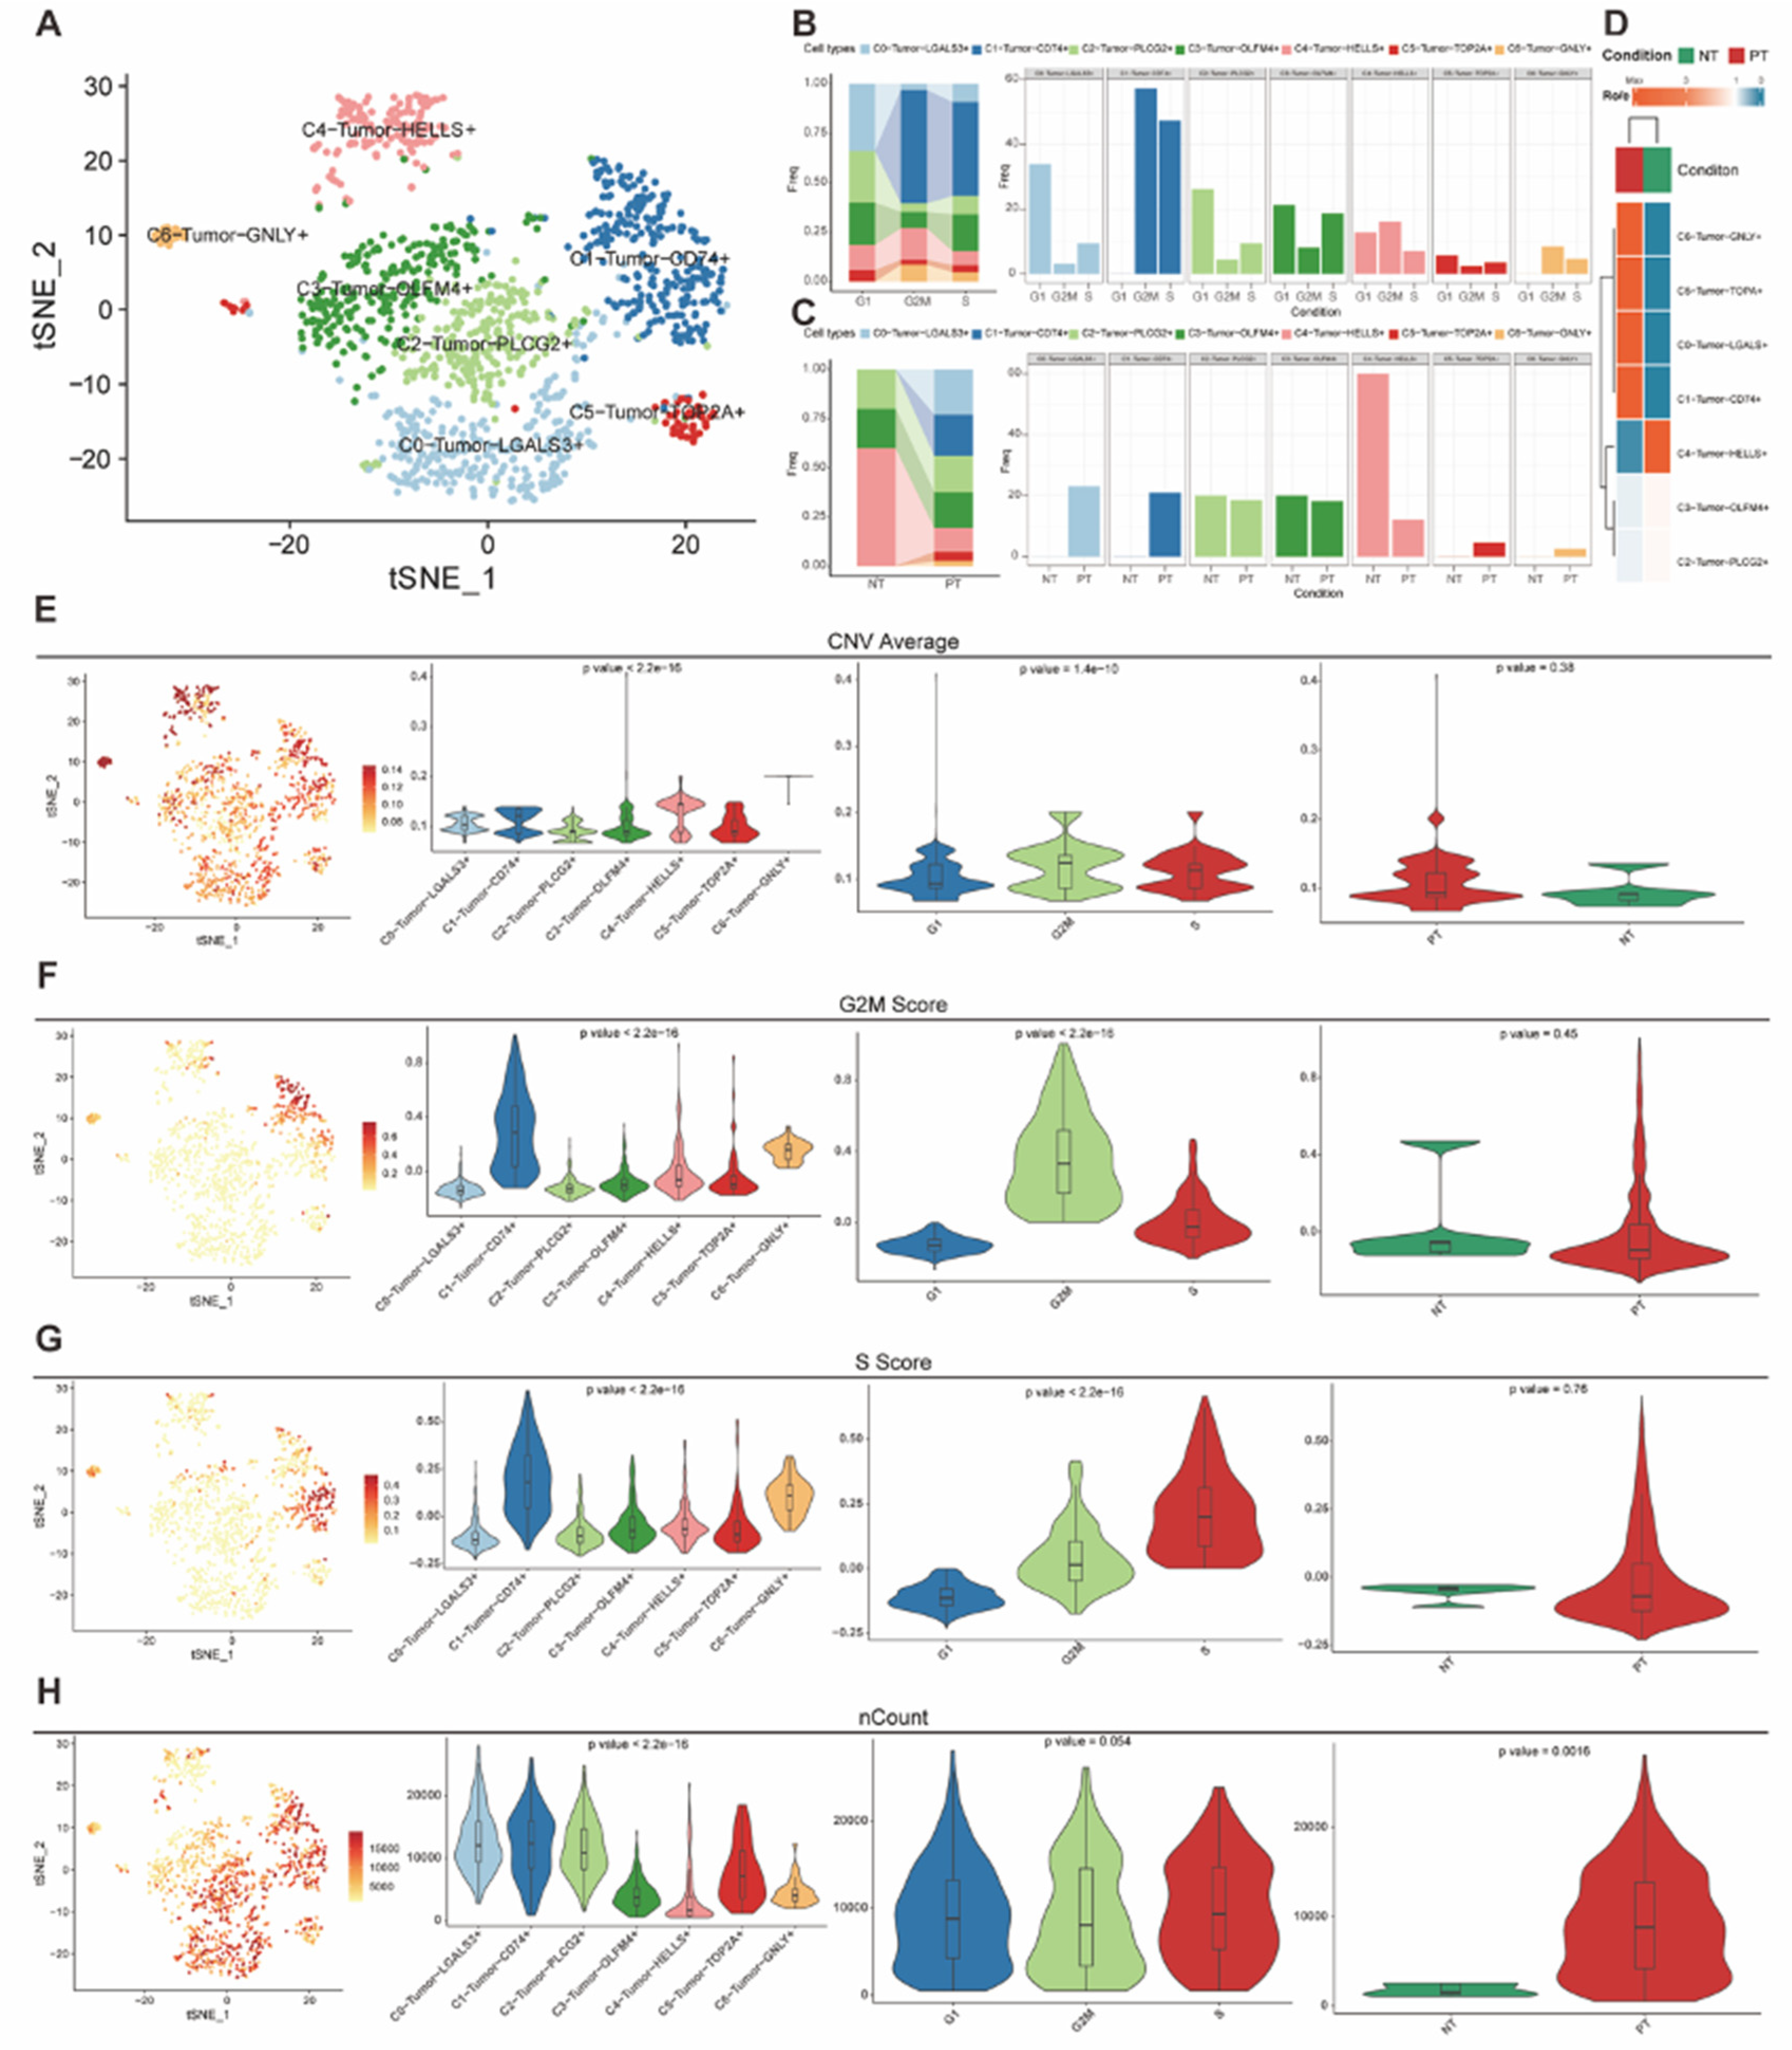
Figure 4.
(A-B) The chord graph and the dot plot demonstrated the incoming interaction of tumor cells with other cells and the corresponding ligand-receptor pairs. (C-D) The chord graph and the dot plot demonstrated the outgoing interaction of tumor cells with other cells and the corresponding ligand-receptor pairs. (E) The dot plot presented both the incoming and outgoing cell-cell interaction strength of all cell types.
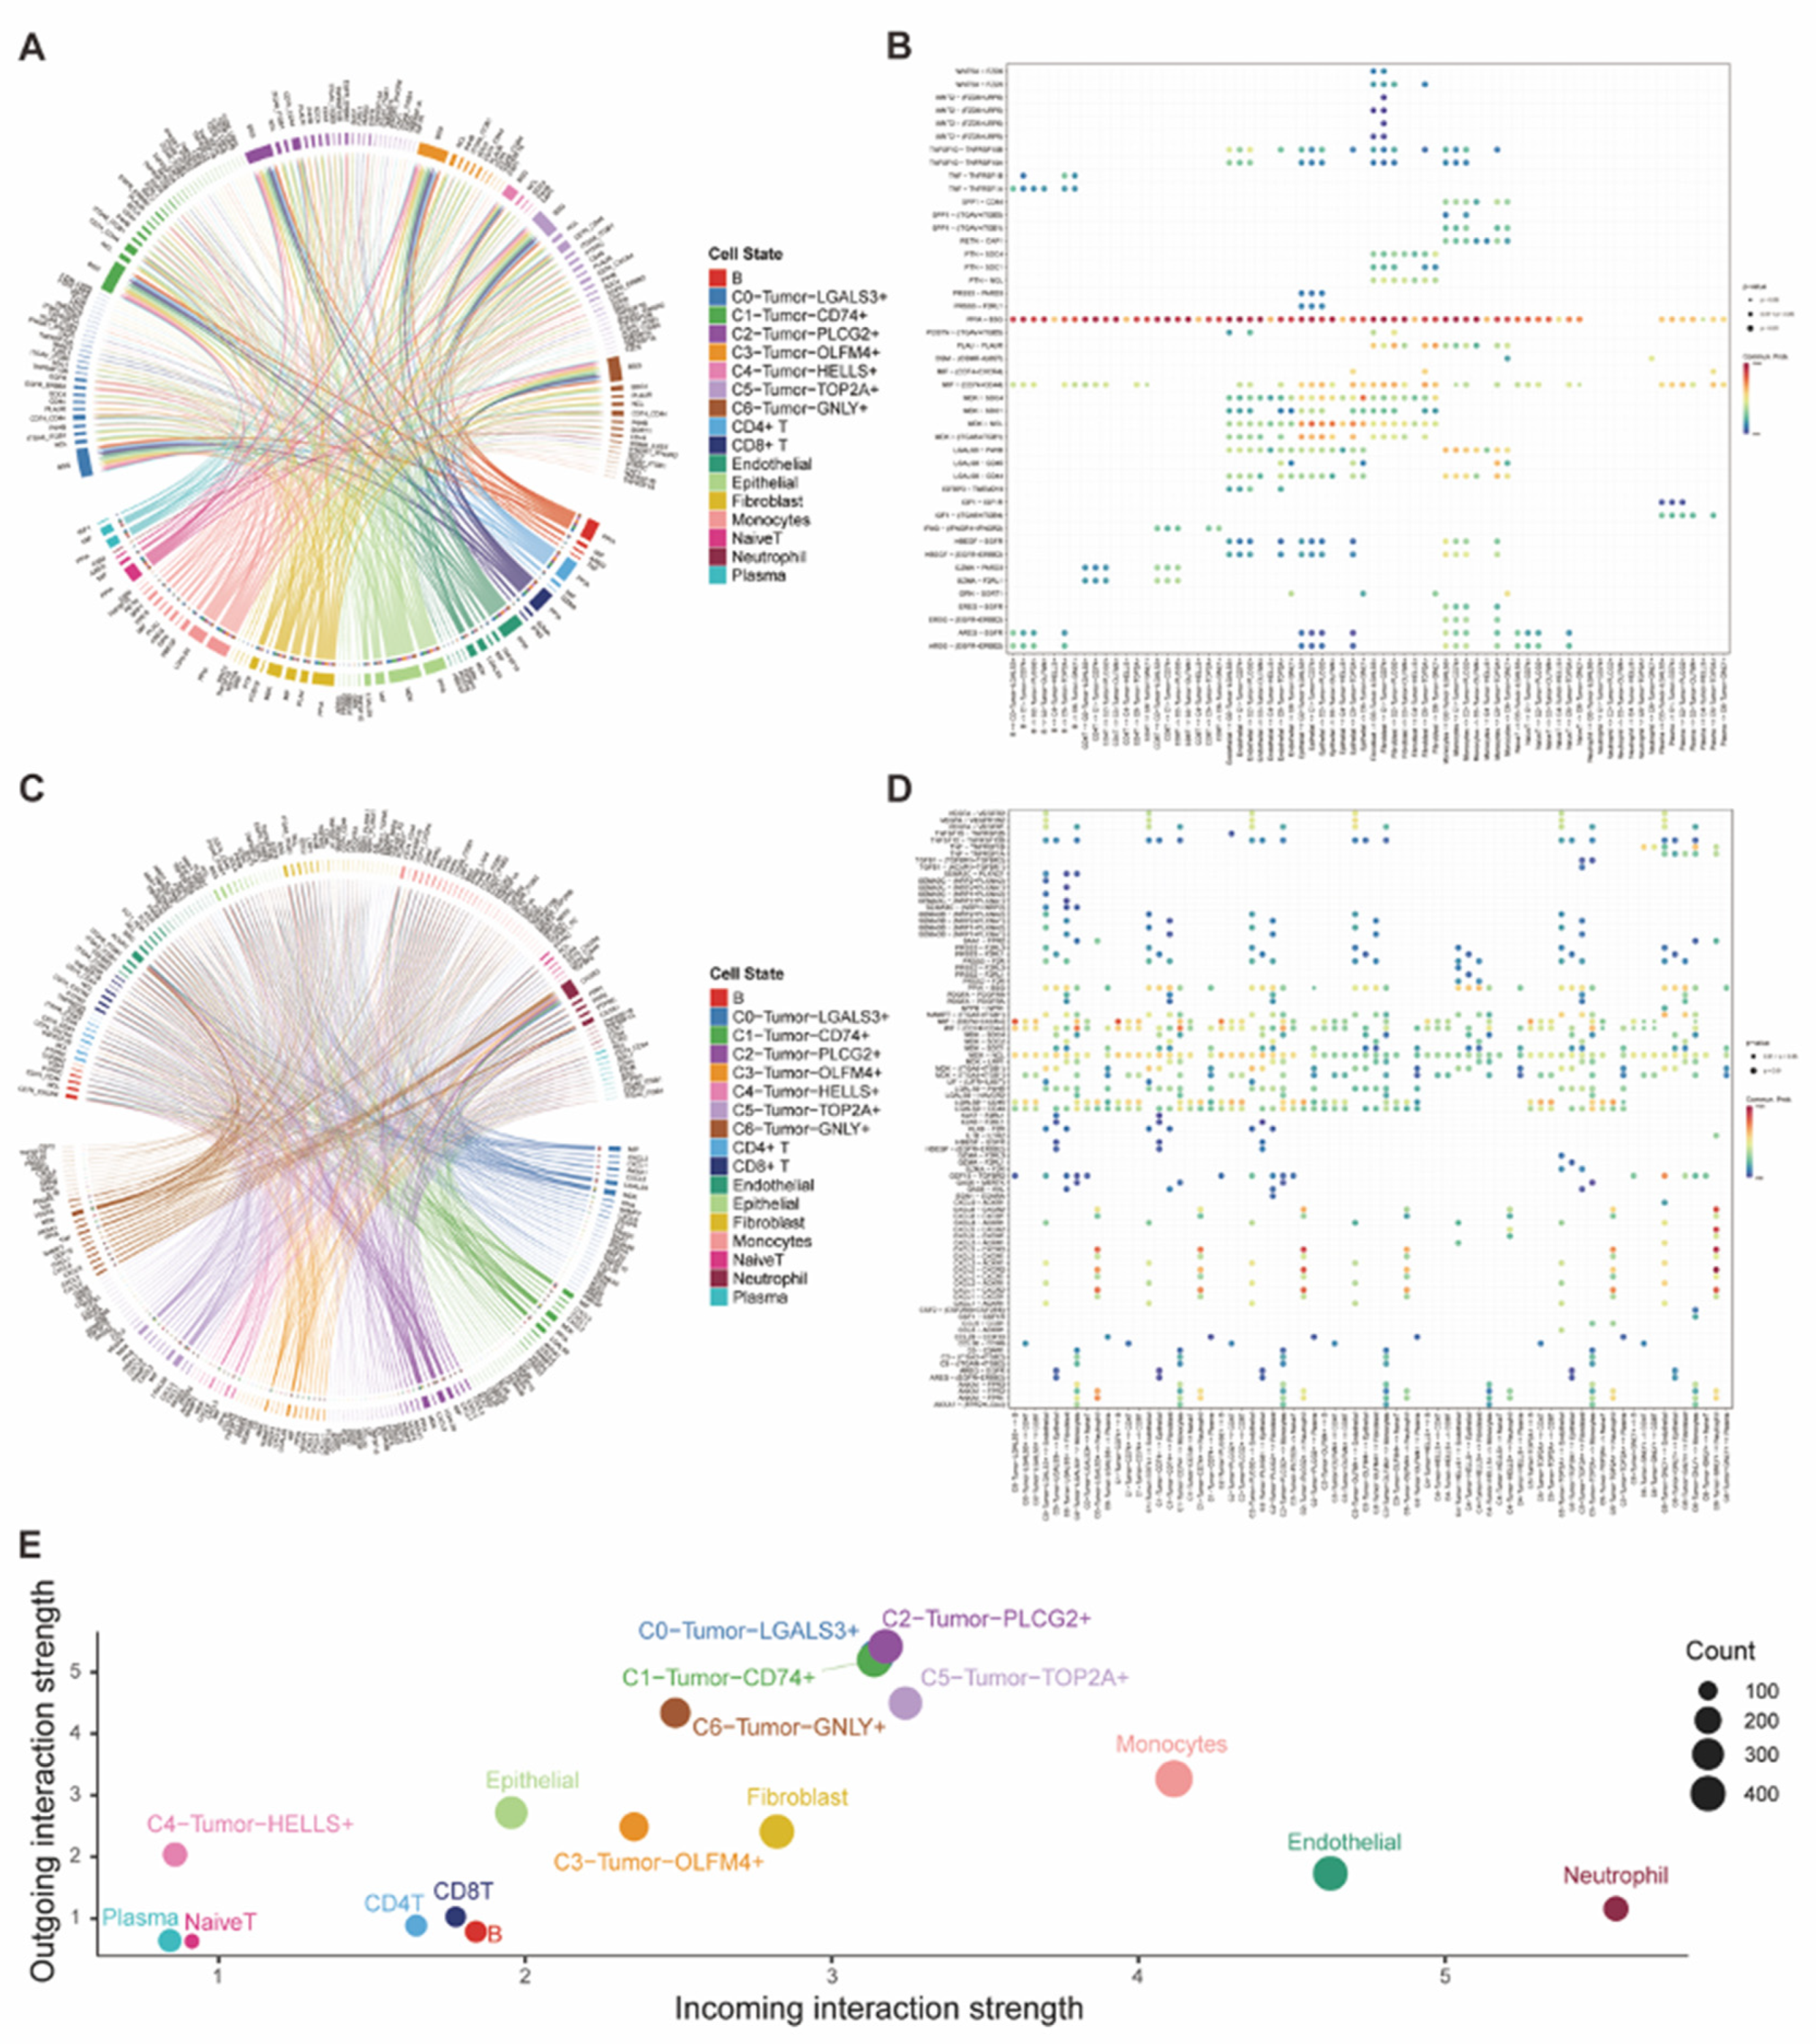
Figure 5.
(A-B) Box plot and tSNE plot visualized and compared the CytoTRACE score of each tumor subtype for presenting their cellular plasticity. (C) Plots of the trajectory analysis demonstrated different states and the differentiation trajectory according to the pseudotime analysis. (D) Bar plot showed the distribution of seven tumor subtype cells in 5 differentiation states. (E-F) Expression of differentiation-related genes had been visualized based on the pseudotime trajectory.
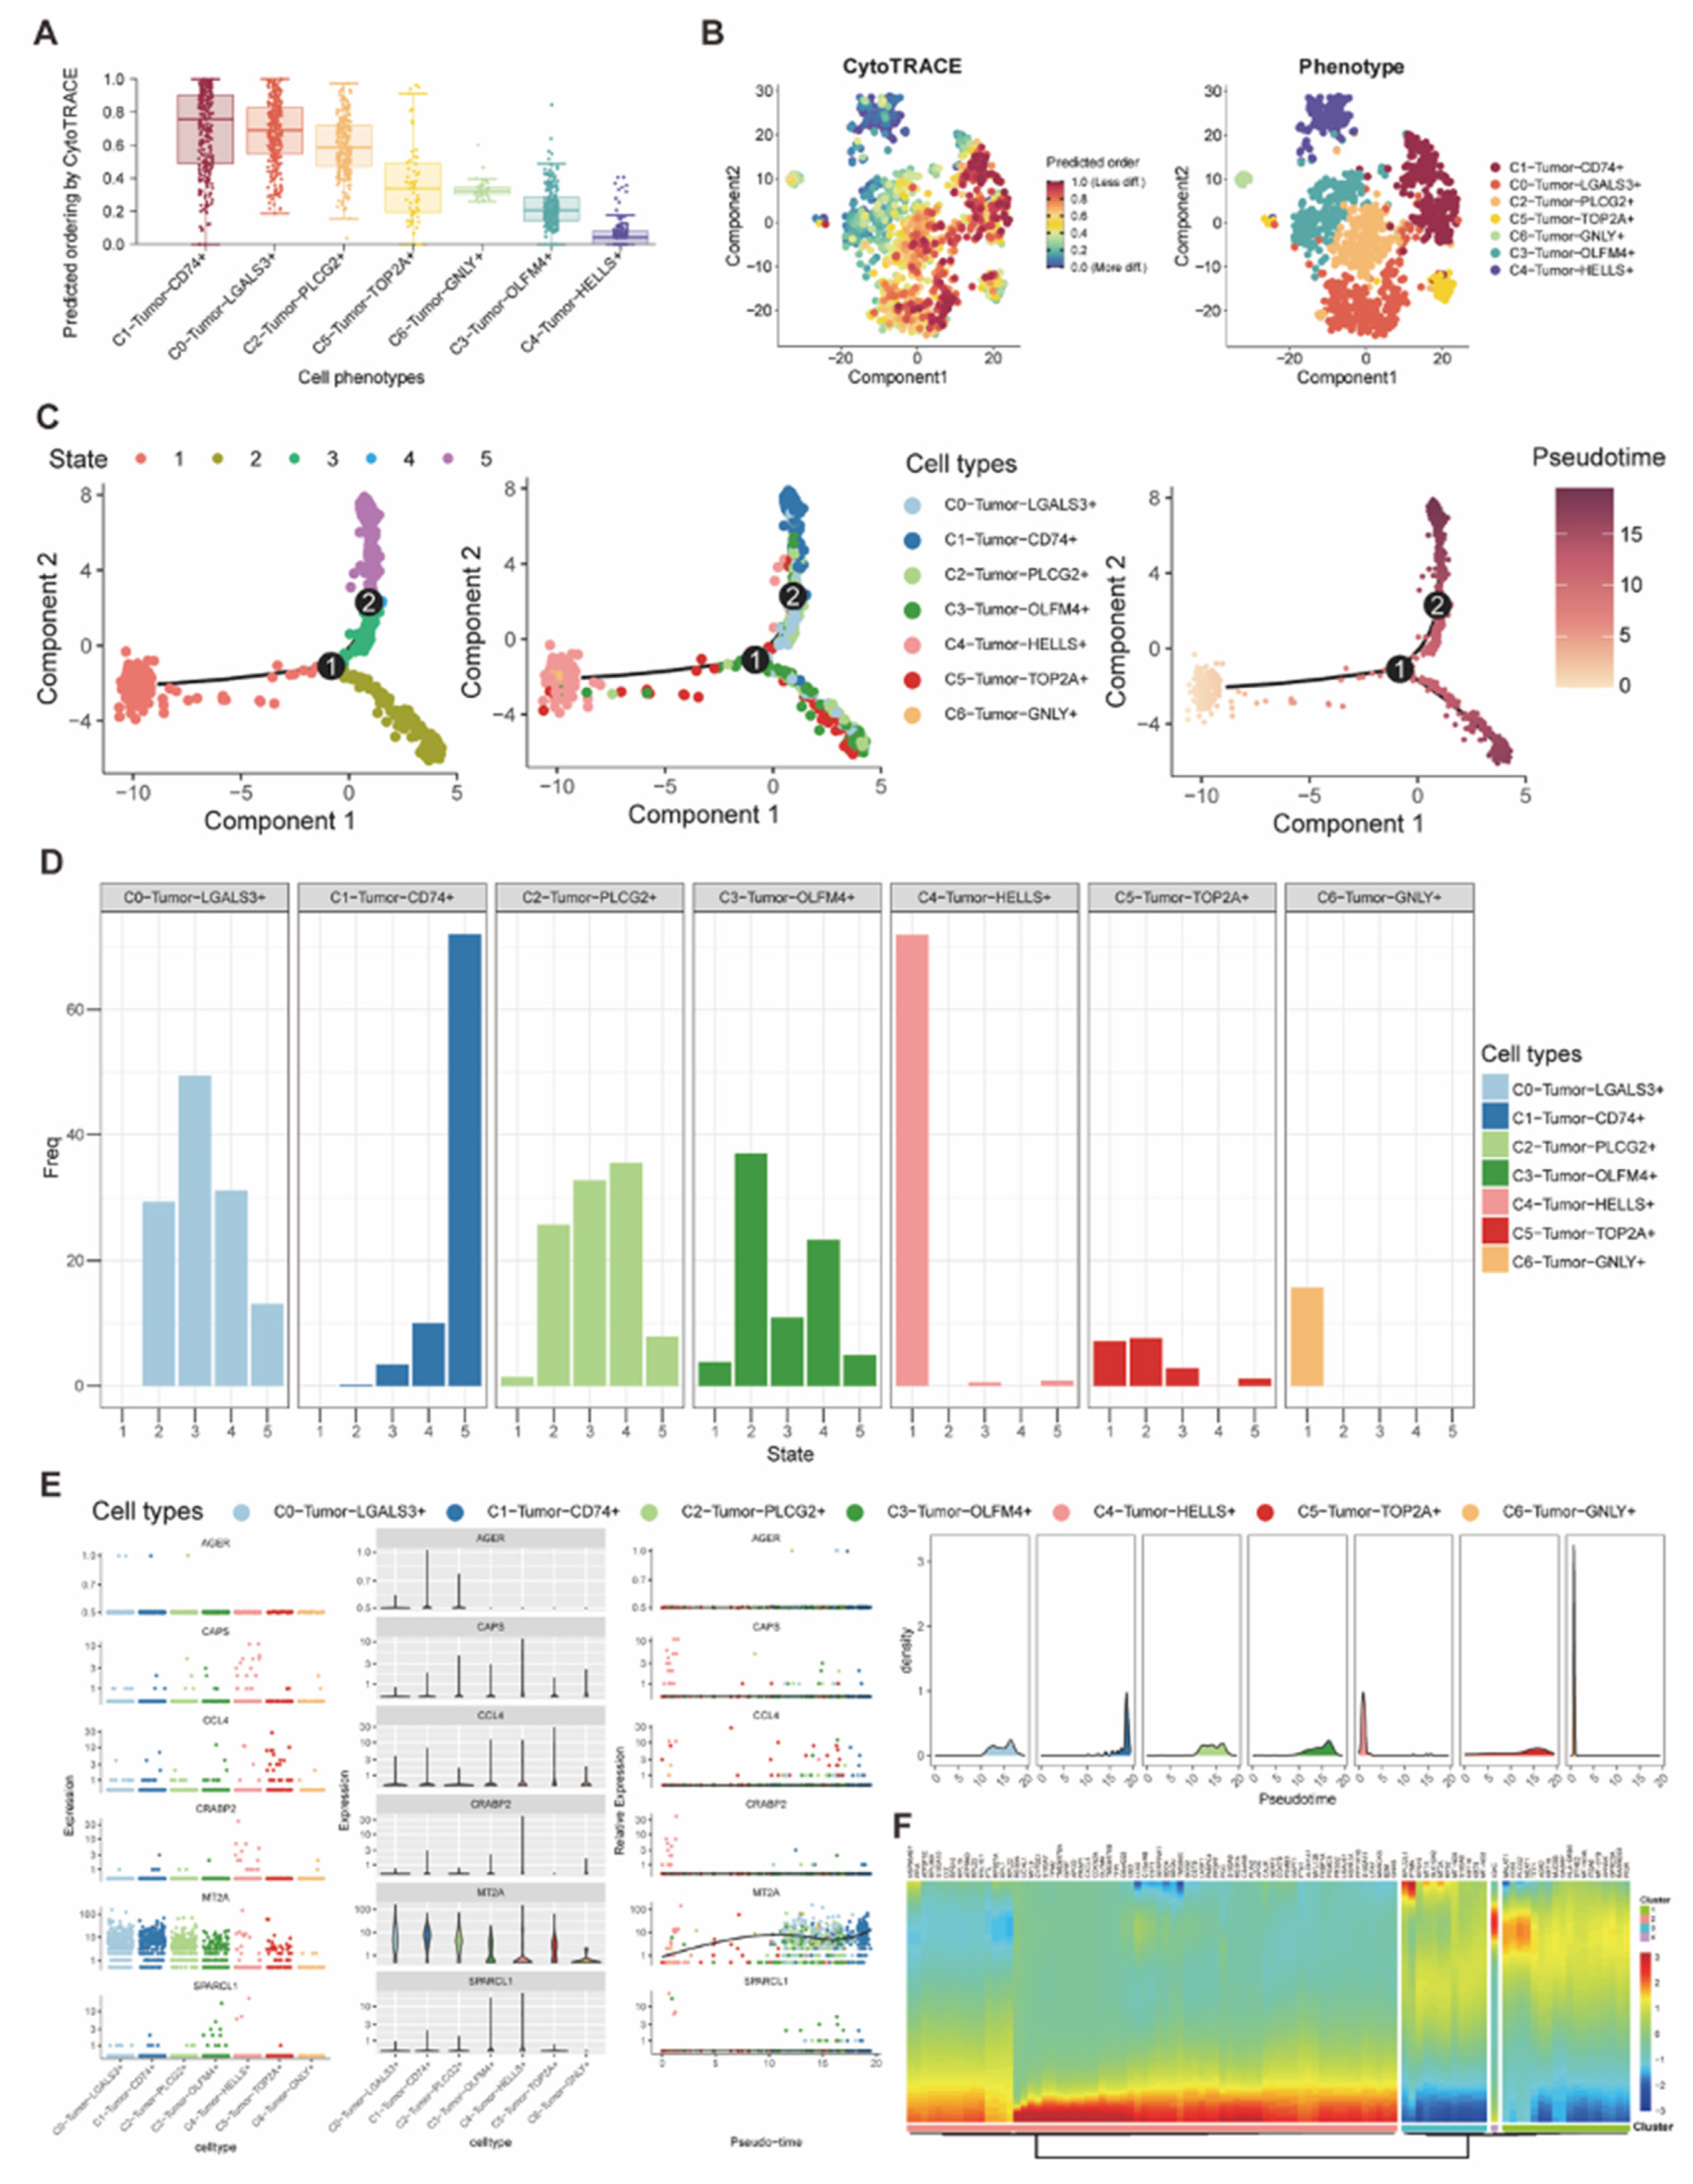
Figure 6.
(A) Feature plots and the violin plot indicated the different activity of the palmitoyl among the seven tumor subtypes. (B-C) Bar plots showed the enriched pathways of both KEGG (B) and GO (C), as pathways in KEGG were ranked by the -log10(pvalue) and pathways in GO were ranked by the gene counts. (D) The bar plot demonstrated the t-value of GSVA scores of multiple pathways in comparing C3 tumor subtypes with other tumor subtypes. (E) The heatmap visualized the GSVA scores of multiple pathways among different tumor subtypes. (F) Western blot showed the different expression of OLFM4 in 5 human gastric cancer cell lines (GES-1, AGS, HGC-27, MKN45, SGC-7901). (G) Western blot demonstrated higher OLFM4 expression induced upregulation of both the palmitoylation marker ZDHHC2 and the glycolysis marker GLUT1 in both AGS and HGC-27. (H) Bar plots showed that the OLFM4 upregulated group had significantly higher ATP expression in both AGS and HGC-27.
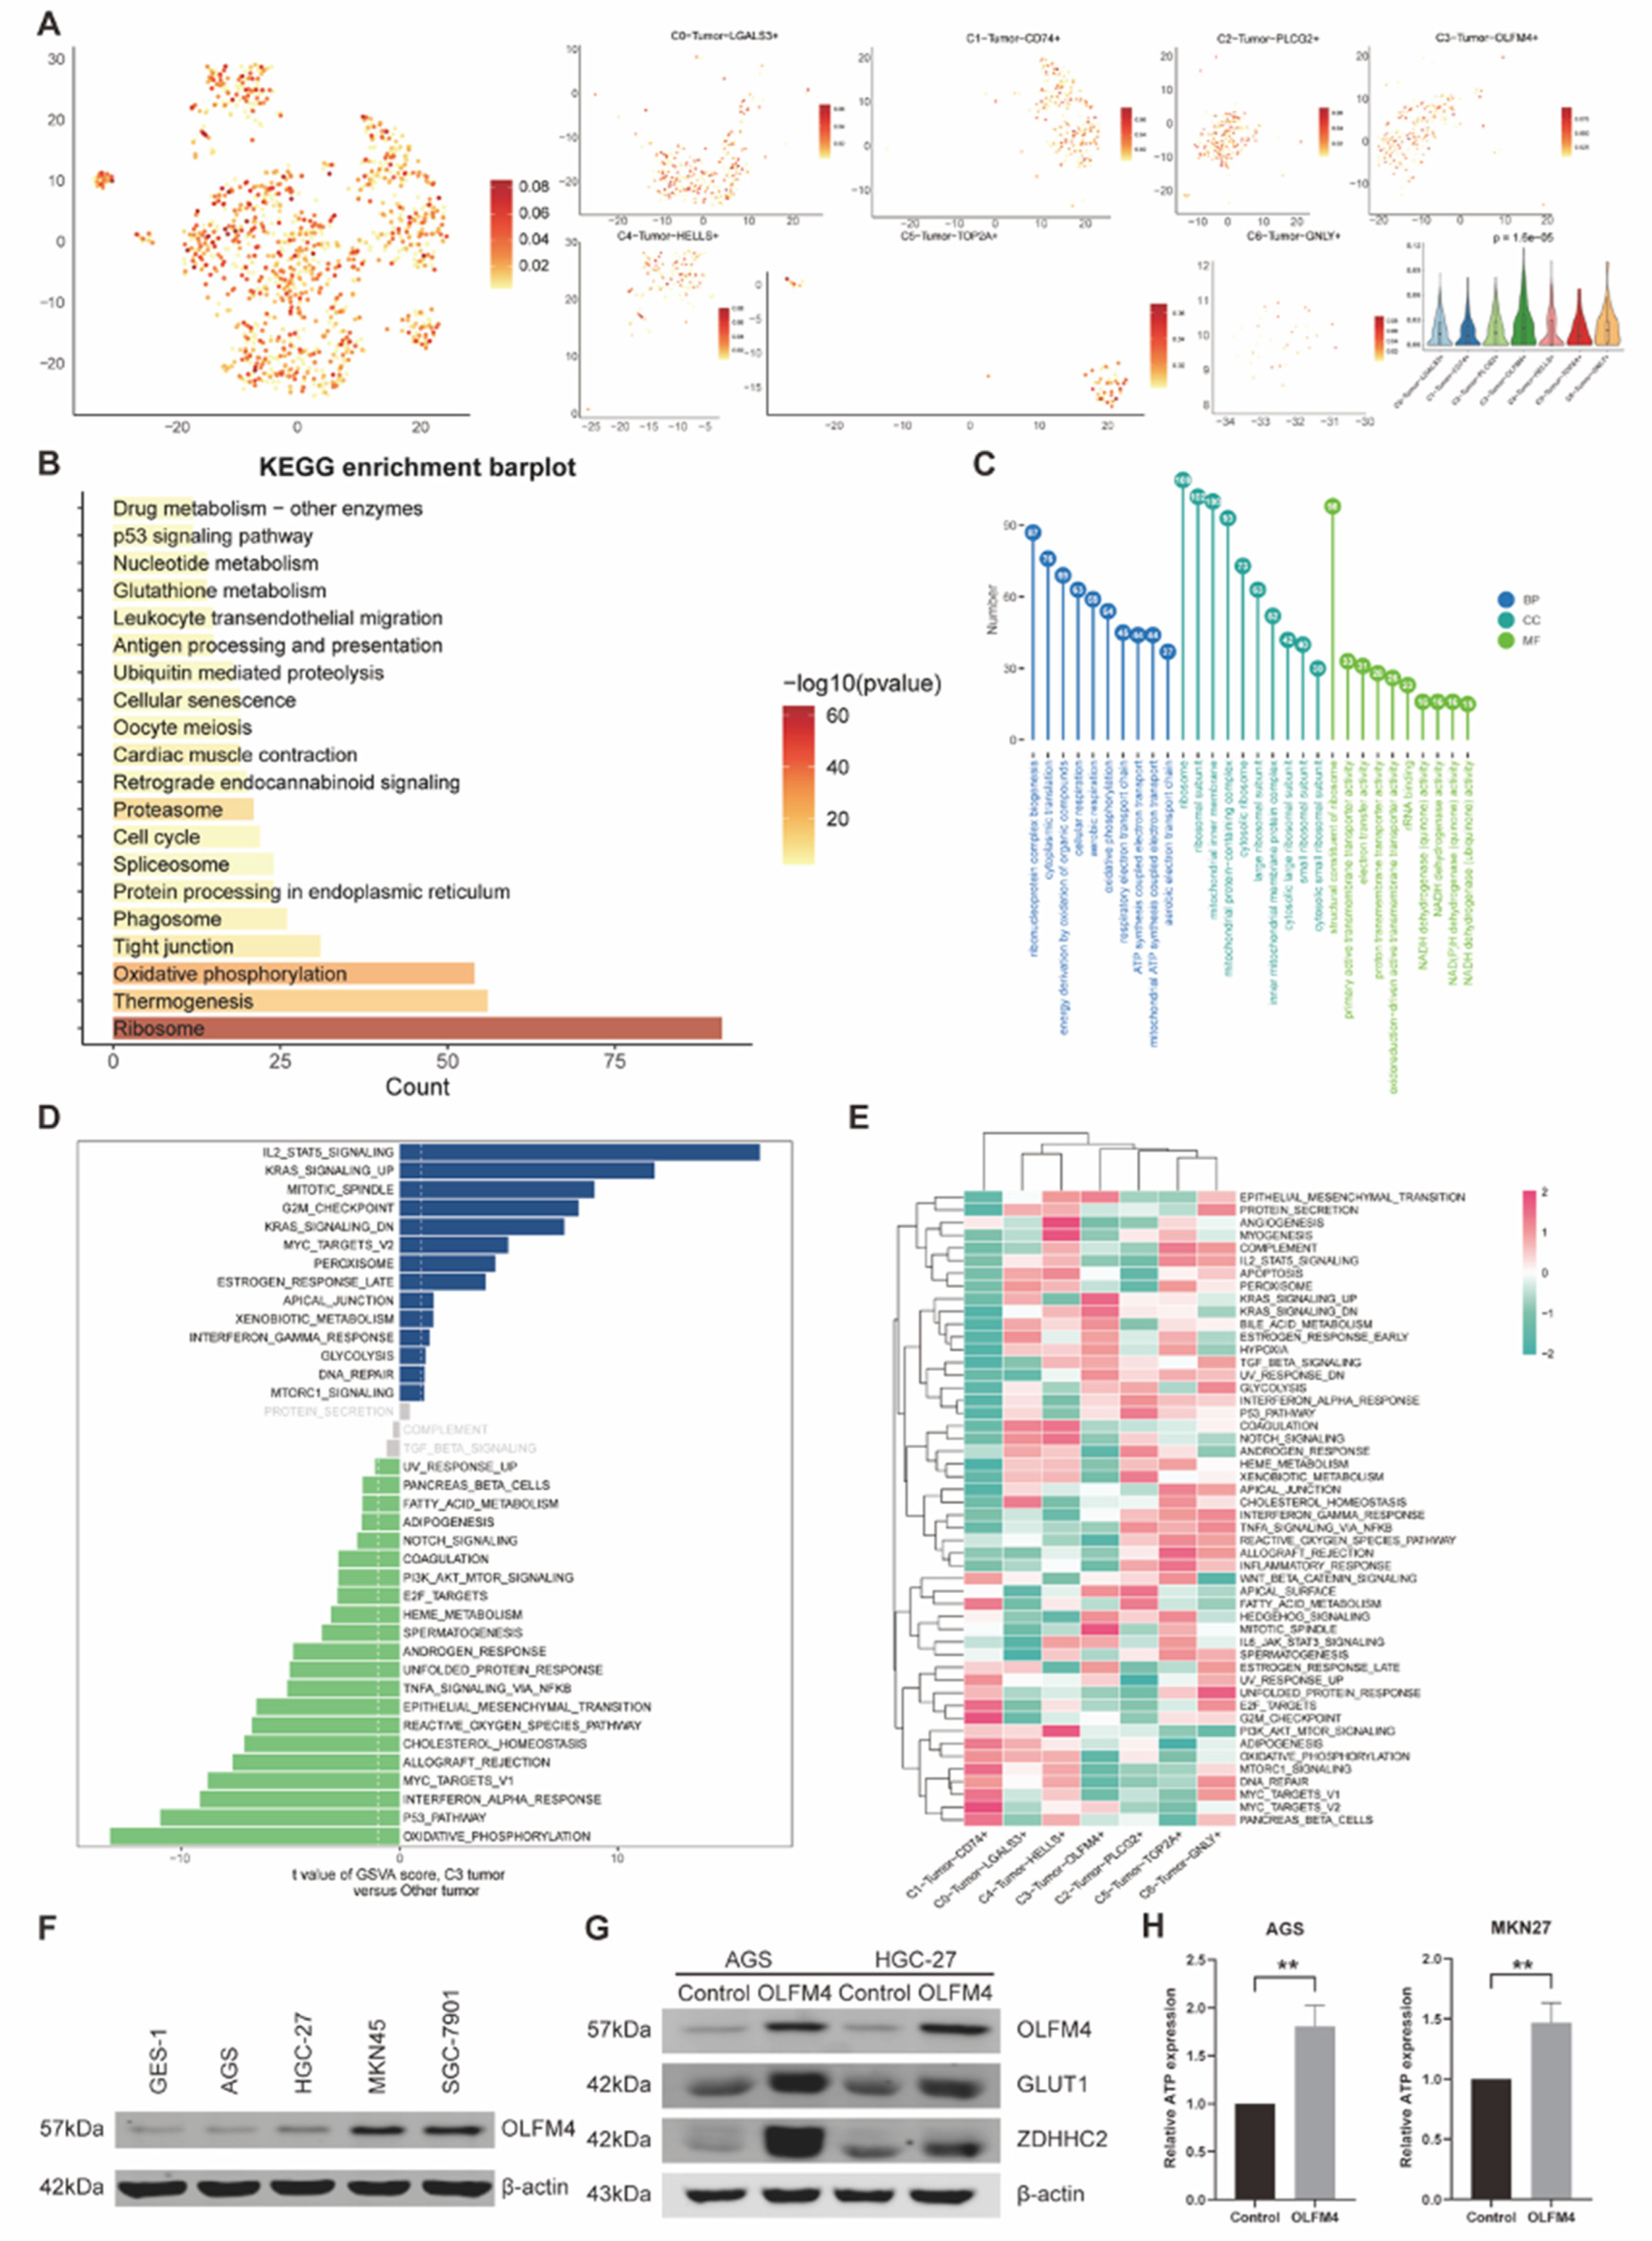
Figure 7.
(A) Heatmap of Regulon CSI matrix demonstrated the classification of TFs, which classified tumor cells into 3 groups (M1, M2, M3). (B) Dot plots showed average regulon activity scores of different tumor subtypes in each module and labeled the significantly related tumor subtypes. (C-E) Dot plots (left) presented the rank for regulons according to the regulon specificity score (RSS) in each tumor subtype, and the tSNE plots revealed the specific tumor subtype (middle, red dots) and the top-ranked regulon (right, blue dots) with the highest specificity scores in corresponding tumor subtypes.
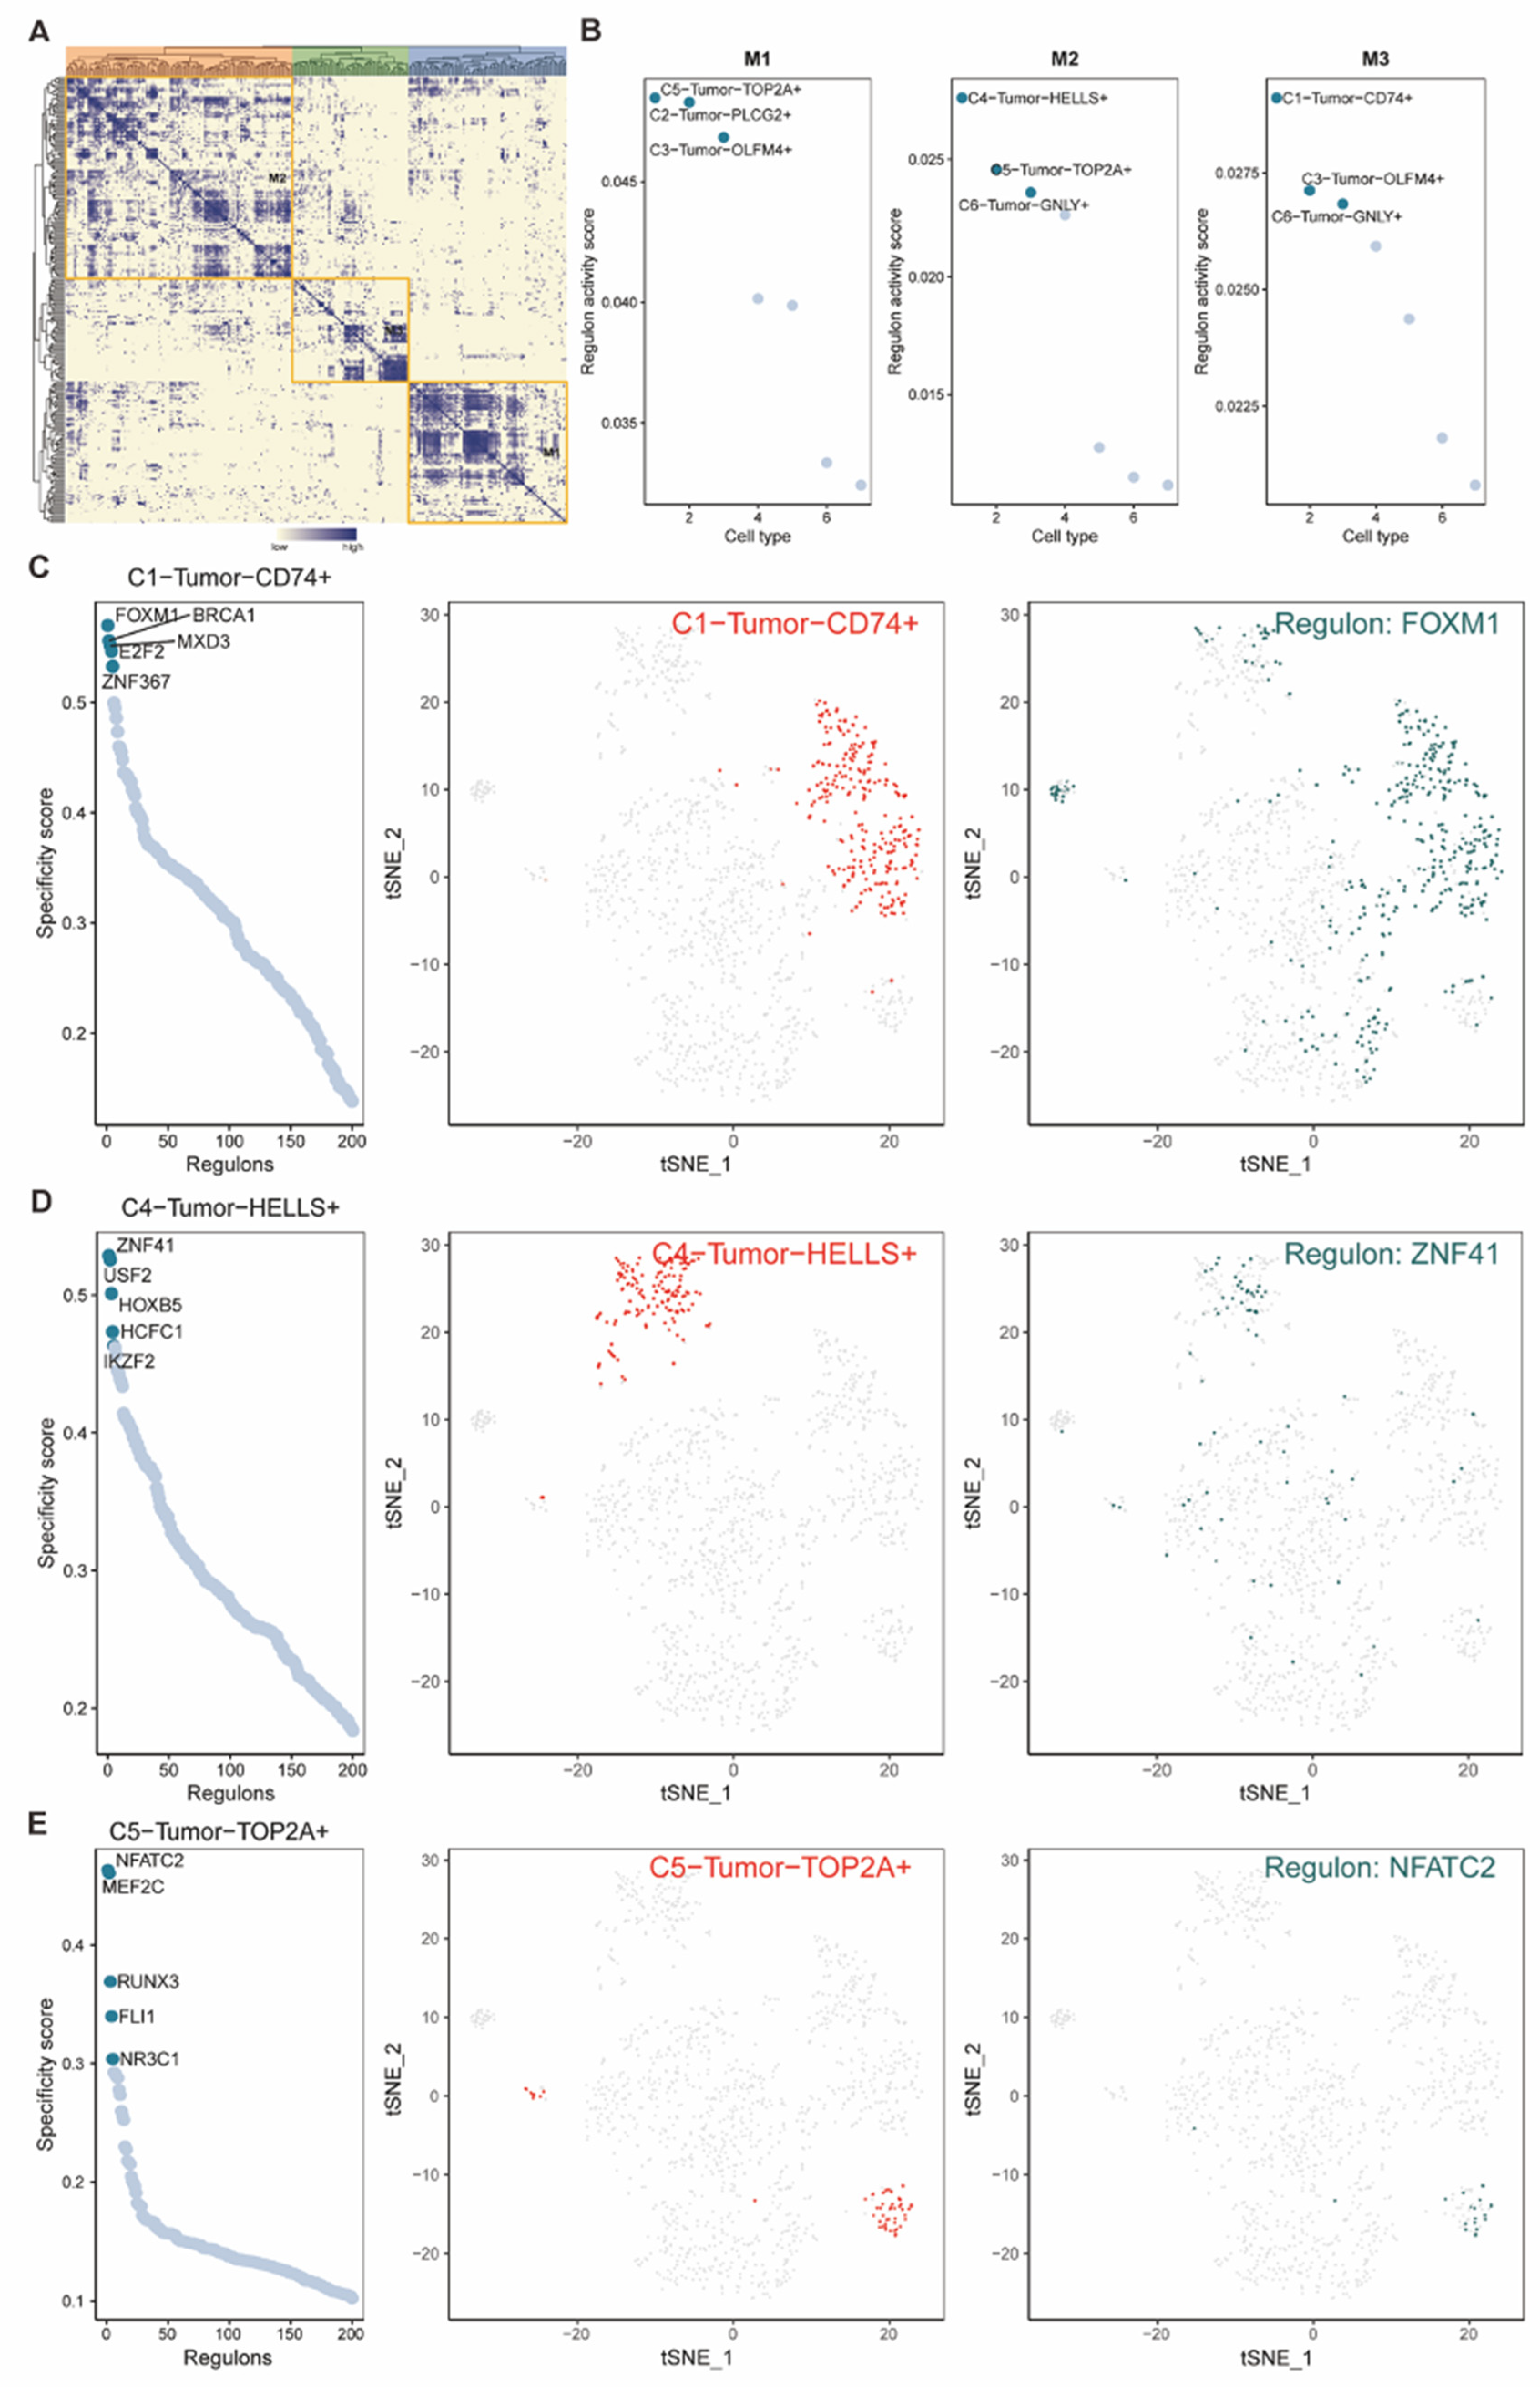
Figure 8.
(A-B) Forest plots presented the results of p-value, Hazard ratio, and 95% confidence interval (CI) about genes in univariate and multivariate Cox analysis in the TCGA-STAD cohort. The p-value cut-off was p < 0.1 and p < 0.05 in the univariate and multivariate Cox analysis, respectively. The hazard ratio (HR) >1 was identified as the reverse effect on survival and <1 was regarded as the protective effect on survival. (C) Heatmap demonstrated the expression of 3 genes in high/low risk groups of TCGA-STAD, with the median of the risk score set as the cut-off. (D) ROC curves of survival outcomes indicated the predictive performance of the risk-score model. (E-F) KM survival plots showed the significant relationship between the overall survival (OS) and not only risk groups (E) but also the risk-score related genes (MUC16, RALA, PCBD1) (F). p < 0.05 was identified as statistically significant.
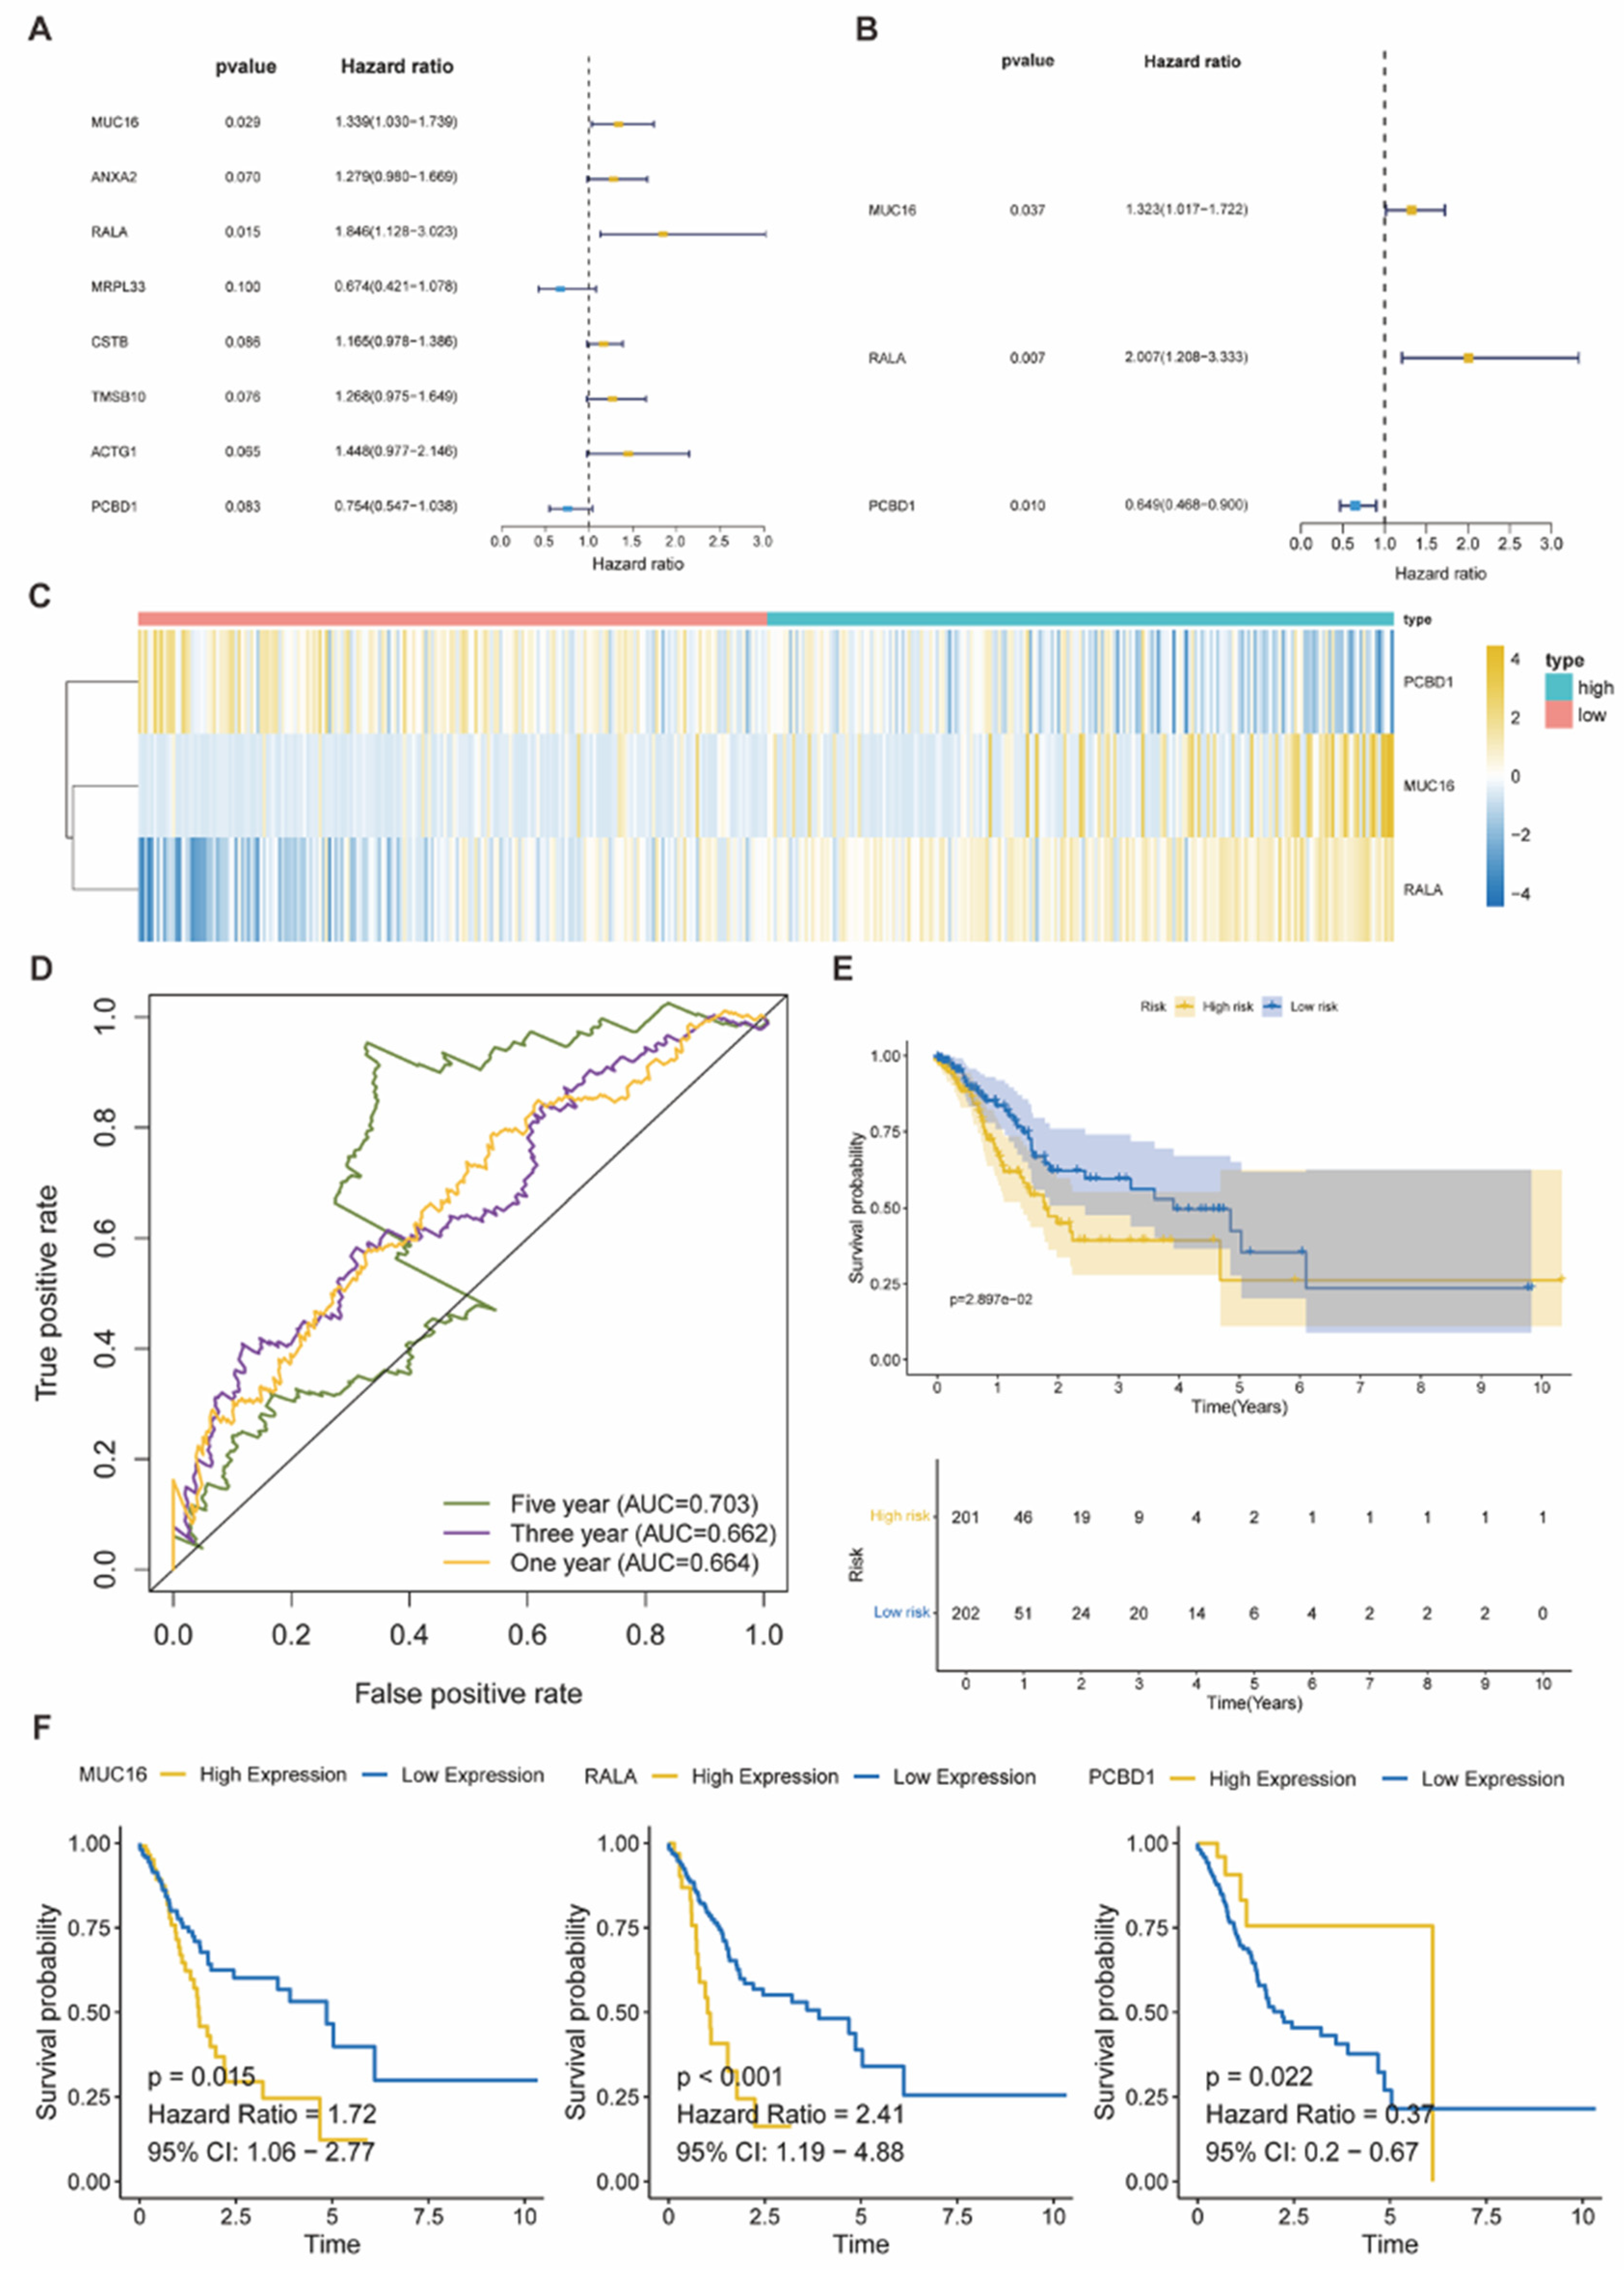
Figure 9.
(A) The Heatmap presented the quantified immune infiltration of the TCGA-STAD cohort based on multiple immune-related genesets. (B-C) Heatmap and boxplots visualized the risk-score associated immunocheckpoints. p < 0.05 was identified as statistically significant. (D) The bar plot demonstrated the relative percentage of different immune cells according to the CIBERSORT analysis. (E) Boxplots indicated immune cells with different infiltration between high and low risk groups. (F-G) The bar plot and dot plots showed immune cells that were significantly correlated with risk scores (p < 0.05).
Disclaimer/Publisher’s Note: The statements, opinions and data contained in all publications are solely those of the individual author(s) and contributor(s) and not of MDPI and/or the editor(s). MDPI and/or the editor(s) disclaim responsibility for any injury to people or property resulting from any ideas, methods, instructions or products referred to in the content. |
© 2025 by the authors. Licensee MDPI, Basel, Switzerland. This article is an open access article distributed under the terms and conditions of the Creative Commons Attribution (CC BY) license (http://creativecommons.org/licenses/by/4.0/).
Copyright: This open access article is published under a Creative Commons CC BY 4.0 license, which permit the free download, distribution, and reuse, provided that the author and preprint are cited in any reuse.


