
Submitted:
26 March 2025
Posted:
28 March 2025
You are already at the latest version
Abstract
Background: Long non-coding RNAs (lncRNAs) are crucial factors affecting the occurrence, progression and prognosis of gastric cancer. Disulfidptosis, a type of programmed cell death, results from abnormal accumulation of disulfide bonds in high-SLC7A11 cells. Research have demonstrated that upregulated SLC7A11 is common in human cancers, but the effect of disulfidptosis on gastric cancer remains unclear. It is of great significance to recognize disulfidptosis -related lncRNAs (drlncRNAs) and develop a risk signature with prognostic value in gastric cancer. Methods: The transcriptome data and clinical information of gastric cancer patients were obtained from TCGA (the Cancer Genome Atlas) database. A 3 drlncRNAs risk model was built by three common regression analysis methods. Then we used ROC curves, independent prognostic analysis and other methods to assess the accuracy of the model. Furthermore, GO and KEGG enrichment analysis, immune infiltration analysis and drug sensitivity prediction were also performed in this study. Finally, TMB, MSI, and TIDE analyses were conducted to further explore the difference of high- and low- risk score group in immunotherapy response. Results: We constructed a prognostic model composed of 3 drlncRNAs (AC107021.2, AC016394.2 and AC129507.1). Univariate and multivariate Cox regression proved that the model was able to predict the prognosis of GC patients independently. GO and KEGG analyses suggested that the high-risk group mainly enriched in sulfur compound binding, canonical WNT signaling pathway, cell-substrate adherens junction, cAMP signaling pathway and so on. TME analysis indicated that ImmuneScores, StromalScores, and ESTIMATEScores were higher in the high-risk group. Meanwhile, the high-risk group showed higher levels of immune cell infiltration, while the low-risk group exhibited higher expression levels of immune checkpoints. Our research further revealed that, compared to patients in the high-risk group, patients in the low-risk group had higher tumor mutation burden, a higher proportion of MSI-H, and lower TIDE scores. Finally, gemcitabine, ABT.888 (veliparib) and other sensitive drugs were confirmed to be more effective in low-risk groups. Conclusion: The risk model we constructed can independently predict prognosis and provide precise and individual clinical treatment guidance for patients with GC.
Keywords:
gastric cancer
; disulfidptosis
; lncRNA
; TCGA
; prognostic model
; immune status
1. Introduction
Gastric cancer is one of the most commonly diagnosed cancers in the world with nearly 1 million new cases and more than 720,000 deaths worldwide each year[1]. Worldwide gastric cancer statistics from 2020 showed 770,000 deaths and 1.1 million newly diagnosed cases. These numbers are projected to climb significantly, with forecasts indicating 1.8 million new cases and 1.3 million deaths by 2040[2]. Early gastric cancer typically presents with subtle and nonspecific symptoms, resulting in more than 60% of patients being diagnosed after metastasis[3]. This late diagnosis contributes to poor prognosis, with only 5% of patients with metastatic GC surviving beyond five years[4,5].
Luckily, the development of immunotherapy such as immunocheckpoint inhibitors (ICIs) shed light on the treatment of advanced and recurrent gastric cancer[6]. However, a substantial proportion (40-60%) of patients treated with immune checkpoint inhibitors demonstrated resistance to therapy[7]. Thus, it is of great significance to find reliable biomarkers to predict the survival of stomach adenocarcinoma (STAD) patients, identify high-response individuals and drugs, and ultimately improving the survival of GC patients.
Disulfidptosis is a kind of original regulated cell death that is different from ferroptosis and cuproptosis. Liu et al. first defined it as a unique form of cell death induced by abnormal accumulation of disulfide bonds in high-SLC7A11 cells. Here we focus on drlncRNAs related to 24 DRGs (disulfidptosis-related genes) mentioned in the literature including GYS1, NDUFS1, OXSM, LRPPRC, NDUFA11, NUBPL, NCKAP1, RPN1, SLC3A2, SLC7A11,INF2, CD2AP, ACTN4, PDLIM1, IQGAP1, DSTN, CAPZB, ACTB, MYL6, MYH9, MYH10, TLN1, FLNA, FLNB. Among these 24 DRGs, the last 14 are genes that encode actin-related proteins and upregulate following the glucose starvation[8]. Given that upregulated SLC7A11 is common in human cancers, the discovery of disulfidptosis expands the framework of programmed cell death and may lead to new treatment and therapeutic targets for multiple cancers [9,10,11].
Accumulating research have reported that lncRNAs serving as an "oncogene" could promote the proliferation, invasion and metastasis of gastric cancer cells, and can be used to predict survival, guide precise clinical therapy of STAD patients as potential biomarkers[12,13,14,15]. However, disulfidptosis-related lncRNA in STAD have barely been reported so far.
The present study aims to develop a novel disulfidptosis-related lncRNA signature to predict the prognosis and immune landscape of STAD. We believe that this research will provide valuable reference in identifying effective drugs and individuals with high response to immunotherapy.
2. Materials and methods
2.1. Date source
The flowchart of the present study was showed in Figure 1. We downloaded the transcriptome data of 448 STAD patients (412 tumor samples and 36 normal samples) and clinical data of 443 STAD patients from the Cancer Genome Atlas (TCGA) database (https://tcga-data.nci.nih.gov/tcga/). To separate mRNAs and lncRNAs, Strawberry Perl software (version 5.30.0-64bit) was downloaded from https://strawberryperl.com/. 24 DRGs were collected from the literature by Liu et al. mentioned before and Pearson correlation analysis was then performed to filter out drlncRNAs. In order to minimize errors, patients with missing survival information were excluded and 407 STAD patients remained eventually. The simple nucleotide variation (SNV) data of 434 STAD patients were also obtained from TCGA database and then used to calculate tumor mutational burden (TMB). The data of STAD microsatellite status were obtained from TCIA website (https://www.tcia.at/ ). Finally, we acquired the tumor immune dysfunction and exclusion (TIDE) score from http://tide.dfci.harvard.edu.
2.2. The development and verification of the arlncRNAs signature
The entire set containing 407 STAD patients were randomly divided into train set and test set at 1:1 ratio. Then, statistical analysis was performed to confirm the reliability of the grouping. We first developed the drlncRNA prognostic model in the train set. By conducting univariate cox regression analysis, we obtained 29 drlncRNAs that were significantly associated with overall survival (OS) (p<0.05). To avoid overfitting, we next executed LASSO (least absolute shrinkage and selection operator)-penalized Cox analysis with 10-fold cross-validation in the condition of p<0.05 and screened out 7 drlncRNAs. Finally, a prognostic model composed of 3 drlncRNAs was constructed after performing multivariate Cox regression analysis. The test set and the whole set were then used to validate the performance of the model. The risk score was calculated according to following formula:
Risk score= lncRNA1exp × coef1 + lncRNA2exp × coef2 +… + lncRNAnexp × coefn.
lncRNAnexp: expression of lncRNAn; coefn: risk coefficient of lncRNAn based on the model
All STAD patients were then segmented into high and low risk groups (high and low disulfidptosis score groups) based on the median calculated risk score as the cutoff value. To assess the accuracy of our prognostic model, we performed independent prognostic analysis to validate whether our drlncRNA signature can predict the prognosis of GC patients independent of age, gender, grade and stage. Subsequently, we used R packages "survival", "survminer" and "timeROC" to plot ROC curves of the train set, test set, entire set and different clinicopathological characteristics respectively, and corresponding AUC (area under curve) value were also calculated. In addition, to further verify the performance of our prognostic model, Kaplan–Meier curves of different clinicopathological variables such as age, grade, stage, size of the primary tumor (T stage), metastasis of regional lymph node (N stage) and distant metastasis of tumor (M stage) were obtained
2.3. Independent prognostic analysis and ROC curve plotting
Independent prognostic analysis was utilized to verify whether our model can predict the outcomes of patients independent of age, gender, stage and grade. The accuracy of the prognostic signature was assessed through ROC curves and AUC (area under curve) values. (R packages "limma", "scatterplot3d", "survival", "survminer" and "timeROC" were used in this progress)
2.4. Nomagram and Calibration
Considering clinicopathological factors and risk score, a predictive nomogram which was designed to predict 1-, 3-, and 5-year OS was created utilizing R packages "survival", "regplot" and "rms". In the meantime, 1-, 3-, and 5-year calibration curves were also plotted to evaluate the predictive precision of the nomogram.
2.5. Gene set enrichment analysis
The Gene Ontology (GO) database classified the functions of genes into three categories, including biological process (BP), cellular component (CC) and molecular function (MF). Using R package "clusterProfiler", we conducted GO and Kyoto Encyclopedia of Genes and Genomes (KEGG) analysis to identify potential enriched functions and signaling pathways, and visualized with R packages "GOplot" and "ggplot2".
2.6. Investigation of TME, immune infiltration and immune checkpoints
Based on the result of GO and KEGG, we conducted immune-related analyses. ESTIMATE algorithm is usually used to calculate immune, stromal, and comprehensive scores of TME[16]. Here we executed ESTIMATE algorithm with R packages "limma" and "ggpubr" to explore the potential correlation between risk score and TME score. The infiltration difference of distinct immune cell subpopulations between high and low disulfidptosis score groups was investigated via 7 platforms including XCELL, TIMER, QUANTISEQ, MCPCOUNTER, EPIC, CIBERSORT and CIBERSORT-ABS, and visualized in a bubble chart. R packages "limma", "scales", "ggplot2", "ggtext", "reshape2", "tidyverse" and "ggpubr" were utilized in this progress. Subsequently, we calculated the scores of 29 immune cells and functions in 448 STAD patients via single-sample gene set enrichment analysis (ssGSEA) using R packages "GSVA", "limma" and "GSEABase", and visualized in two boxplots with R packages "limma", "ggpubr" and "reshape2". Finally, we conducted immune checkpoint analysis to explore differentially expressed immune checkpoints between high and low disulfidptosis score group.
2.7. TMB, MSI and TIDE
We first downloaded the SNV data of 434 STAD patients from TCGA database and calculated the TMB of all patients utilizing Strawberry Perl software. Then we plotted the waterfall diagrams of 15 genes with the highest mutation rates in high and low risk groups through "maftools" package. Kaplan–Meier curves of “H-TMB + high risk”, “H-TMB + low risk”, “L-TMB + high risk” and “L-TMB + low risk” were obtained by R packages "survival" and "survminer". In addition, according to the extracted STAD microsatellite status data, we drew a barplot and a boxplot to illustrate the relationship between MSI and risk score. Finally, we compared the difference of TIDE score between high and low disulfidptosis score groups.
2.8. Drug sensitivity analysis
The half maximal inhibitory concentration (IC50) values of multiple drugs were calculated and compared between high and low disulfidptosis score groups utilizing R package "pRRpphetic", and the results were presented as boxplots.
3. Results
3.1. Data source and processing
Using Strawberry Perl software, we processed the TCGA transcriptome data and gained the expression data of 19938 mRNAs and 16876 lncRNAs. By combining the mRNAs expression profile with 24 disulfidptosis-related genes, we obtained the expression data of 24 DRGs. Then, based on the criteria of |Pearson R|>0.4 and p < 0.001, Pearson correlation analysis between 16876 lncRNAs and 24 DRGs was conducted and 367 drlncRNAs were finally identified (Figure 2A).
3.2. Construction and validation of the drlncRNA prognostic model
By combining 367 drlncRNAs expression data with 407 GC patients’ clinical information, we acquired the drlncRNAs expression data profile and survival data for 407 samples, which was used for prognostic model building. We first performed univariate cox regression analysis and preliminary screening out 29 drlncRNAs (Figure 2B, p<0.05). Subsequently, LASSO-penalized Cox analysis was executed to avoid overfitting and 7 drlncRNAs significantly related to overall survival (OS) were obtained (Figure 2C,D, p<0.05). Eventually, the drlncRNA risk signature comprising 3 lncRNAs (AC107021.2, AC016394.2 and AC129507.1) and corresponding risk coefficient was acquired (Figure 2E, p<0.05). In the meantime, the relationship between 24 DRGs and 3 drlncRNAs is presented in Figure 2F. According to the previous calculation formula, risk score = AC107021.2exp × 0.66000986856416 + AC016394.2exp × -0.435804339506525 + AC129507.1exp × 0.636605050383588.
A total of 407 STAD samples were then allocated into two groups randomly at a 1:1 ratio with 204 samples in the train set and 203 samples in the test set. Based on the median risk score as cutoff value, patients were divided into high and low risk group. According to the risk score and survival status of train set patients manifested in Figure 3A,B, we can conclude that the mortality of patients was positively correlated with risk score. Obviously, the risk heatmap of 3 drlncRNAs constructed the model (Figure 3C) showed that the upregulated AC107021.2 and AC129507.1 were significantly correlated with higher disulfidptosis score, while AC016394.2 was highly expressed in low disulfidptosis score group. The Kaplan–Meier curve of train set (Figure 3D, p<0.001) indicated that the survival time of patients in the high risk group were notably lower than that in the low risk group, which was consistent with our expectations. To demonstrate the predictability of the arlncRNA model, we conducted the same analysis in the test set and whole set. The results of the test group (Figure 3E-H) and whole group (Figure 3I-L) were consistent with the TCGA training group.
Independent prognostic analysis showed that the 3 drlncRNAs model was a reliable prognosis predictor, independent of clinical features such as age, stage (Figure 3M, N). Subsequently, the area under the ROC curves (AUC values) was calculated in train group (1-year AUC = 0.741, 3-year AUC = 0.654, and 5-year AUC = 0.781; Figure 3O), test group (1-year AUC = 0.638, 3-year AUC =0.640, and 5-year AUC = 0.707; Figure 3P) and entire group (1-year AUC = 0.692, 3-year AUC = 0.646, and 5-year AUC = 0.723; Figure 3Q). The AUC values of ROC curves for different clinical features were also calculated, and the ROC curve based on our risk model showed the greatest AUC value (Figure 3R), which illustrated that our risk model as a prognosis predictor was considerably accurate.
In order to further verify the accuracy of the model, we plotted K-M curves of patients in high and low risk groups based on different clinical features including age , grade, stage, T stage, N stage and M stage.We can recognize that our prognostic model can accurately predict the prognosis of patients independent of clinical variables (Figure 4). For patients in M1 stage, there was no significant difference in survival between our high and low risk groups, which may be due to the lack of sufficient samples.
3.3. Nomogram and calibration curves
3.4. Functional analysis of the model
The circle chart and corresponding notes (Figure 6A,B), column chart (Figure 6C) and bubble chart (Figure 6D) of GO and KEGG enrichment analysis showed that these three drlncRNAs were closely related to sulfur compound binding, canonical WNT signaling pathway, cell-substrate adherens junction and cAMP signaling pathway.
3.5. Immune infiltration status
In order to explore the difference of tumor microenvironment between high and low disulfidptosis score groups, we utilized ESTIMATE (Estimation of STromal and Immune cells in MAlignant Tumour tissues using Expression data) algorithm to score the purity of tumors. According to the boxplots, we recognized that the score of the high risk group was higher than those of the low risk group in StromalScore(p=2.5e-10), ImmuneScore(p=0.039) and ESTIMATEScore(p=6.1e-06) (Figure 7A). Subsequently, we analyzed the differences in immune cell subpopulations in TME between high and low risk groups. The bubble chart showed that the high risk group corresponded to a higher degree of immune cells infiltration, such as CAF(Cancer associated fibroblast) in XCELL, MCPCOUNTER and EPIC, Macrophage 2 in QUANTISEQ, CIBERSORT and CIBERSORT-ABS (Figure 7B). In addition, the boxplot of 29 immune cells and functions between high and low risk groups showed that high risk group had higher levels of MAST cells infiltration and lower levels of MHC class 1 expression (Figure 7C,D). ICP analysis revealed that the expression levels of ICPs such as PDCD-1, CD274 (PD-L1) and CTLA-4 were upregulated in the low risk group (Figure 7E).
3.6. Immunotherapy response analysis
In this part, TMB, MSI, TIDE analyses were conducted. First of all, we compared the TMB of the high and low risk groups and found that the patients in the low risk group had higher TMB (Figure 8A). In order to further explore the difference of mutant genes between high and low risk groups, we plotted the corresponding waterfall diagram. Among the 15 genes with the highest mutation rate, only TP53 gene had a higher mutation rate in the high risk group than in the low risk group, and we noticed that the mutation rate of ARID1A gene in the high risk group was significantly lower than that in the low risk group (Figure 8B). Next, we explored the relationship between TMB, patient survival, and risk score (Figure 8C). We found that the survival of GC patients with “H-TMB” was better than that of patients with “L-TMB”(p=0.009), and the level of TMB could predict the prognosis of patients independent of risk score. In addition, when we explored the relationship between MSI and risk score, we found that the proportion of patients with “MSI-H” in the low risk group (32%) was much higher than that in the high risk group (9%)(Figure 8D). The risk score of patients with “MSI-H” was much lower than patients with “MSS”(p=4.7e-10) and “MSI-L” (p=1.7e-05) (Figure 8E). Finally, TIDE (Tumor Immune Dysfunction and Exclusion) analysis revealed that patients in the high risk group had higher TIDE scores (Figure 8F).
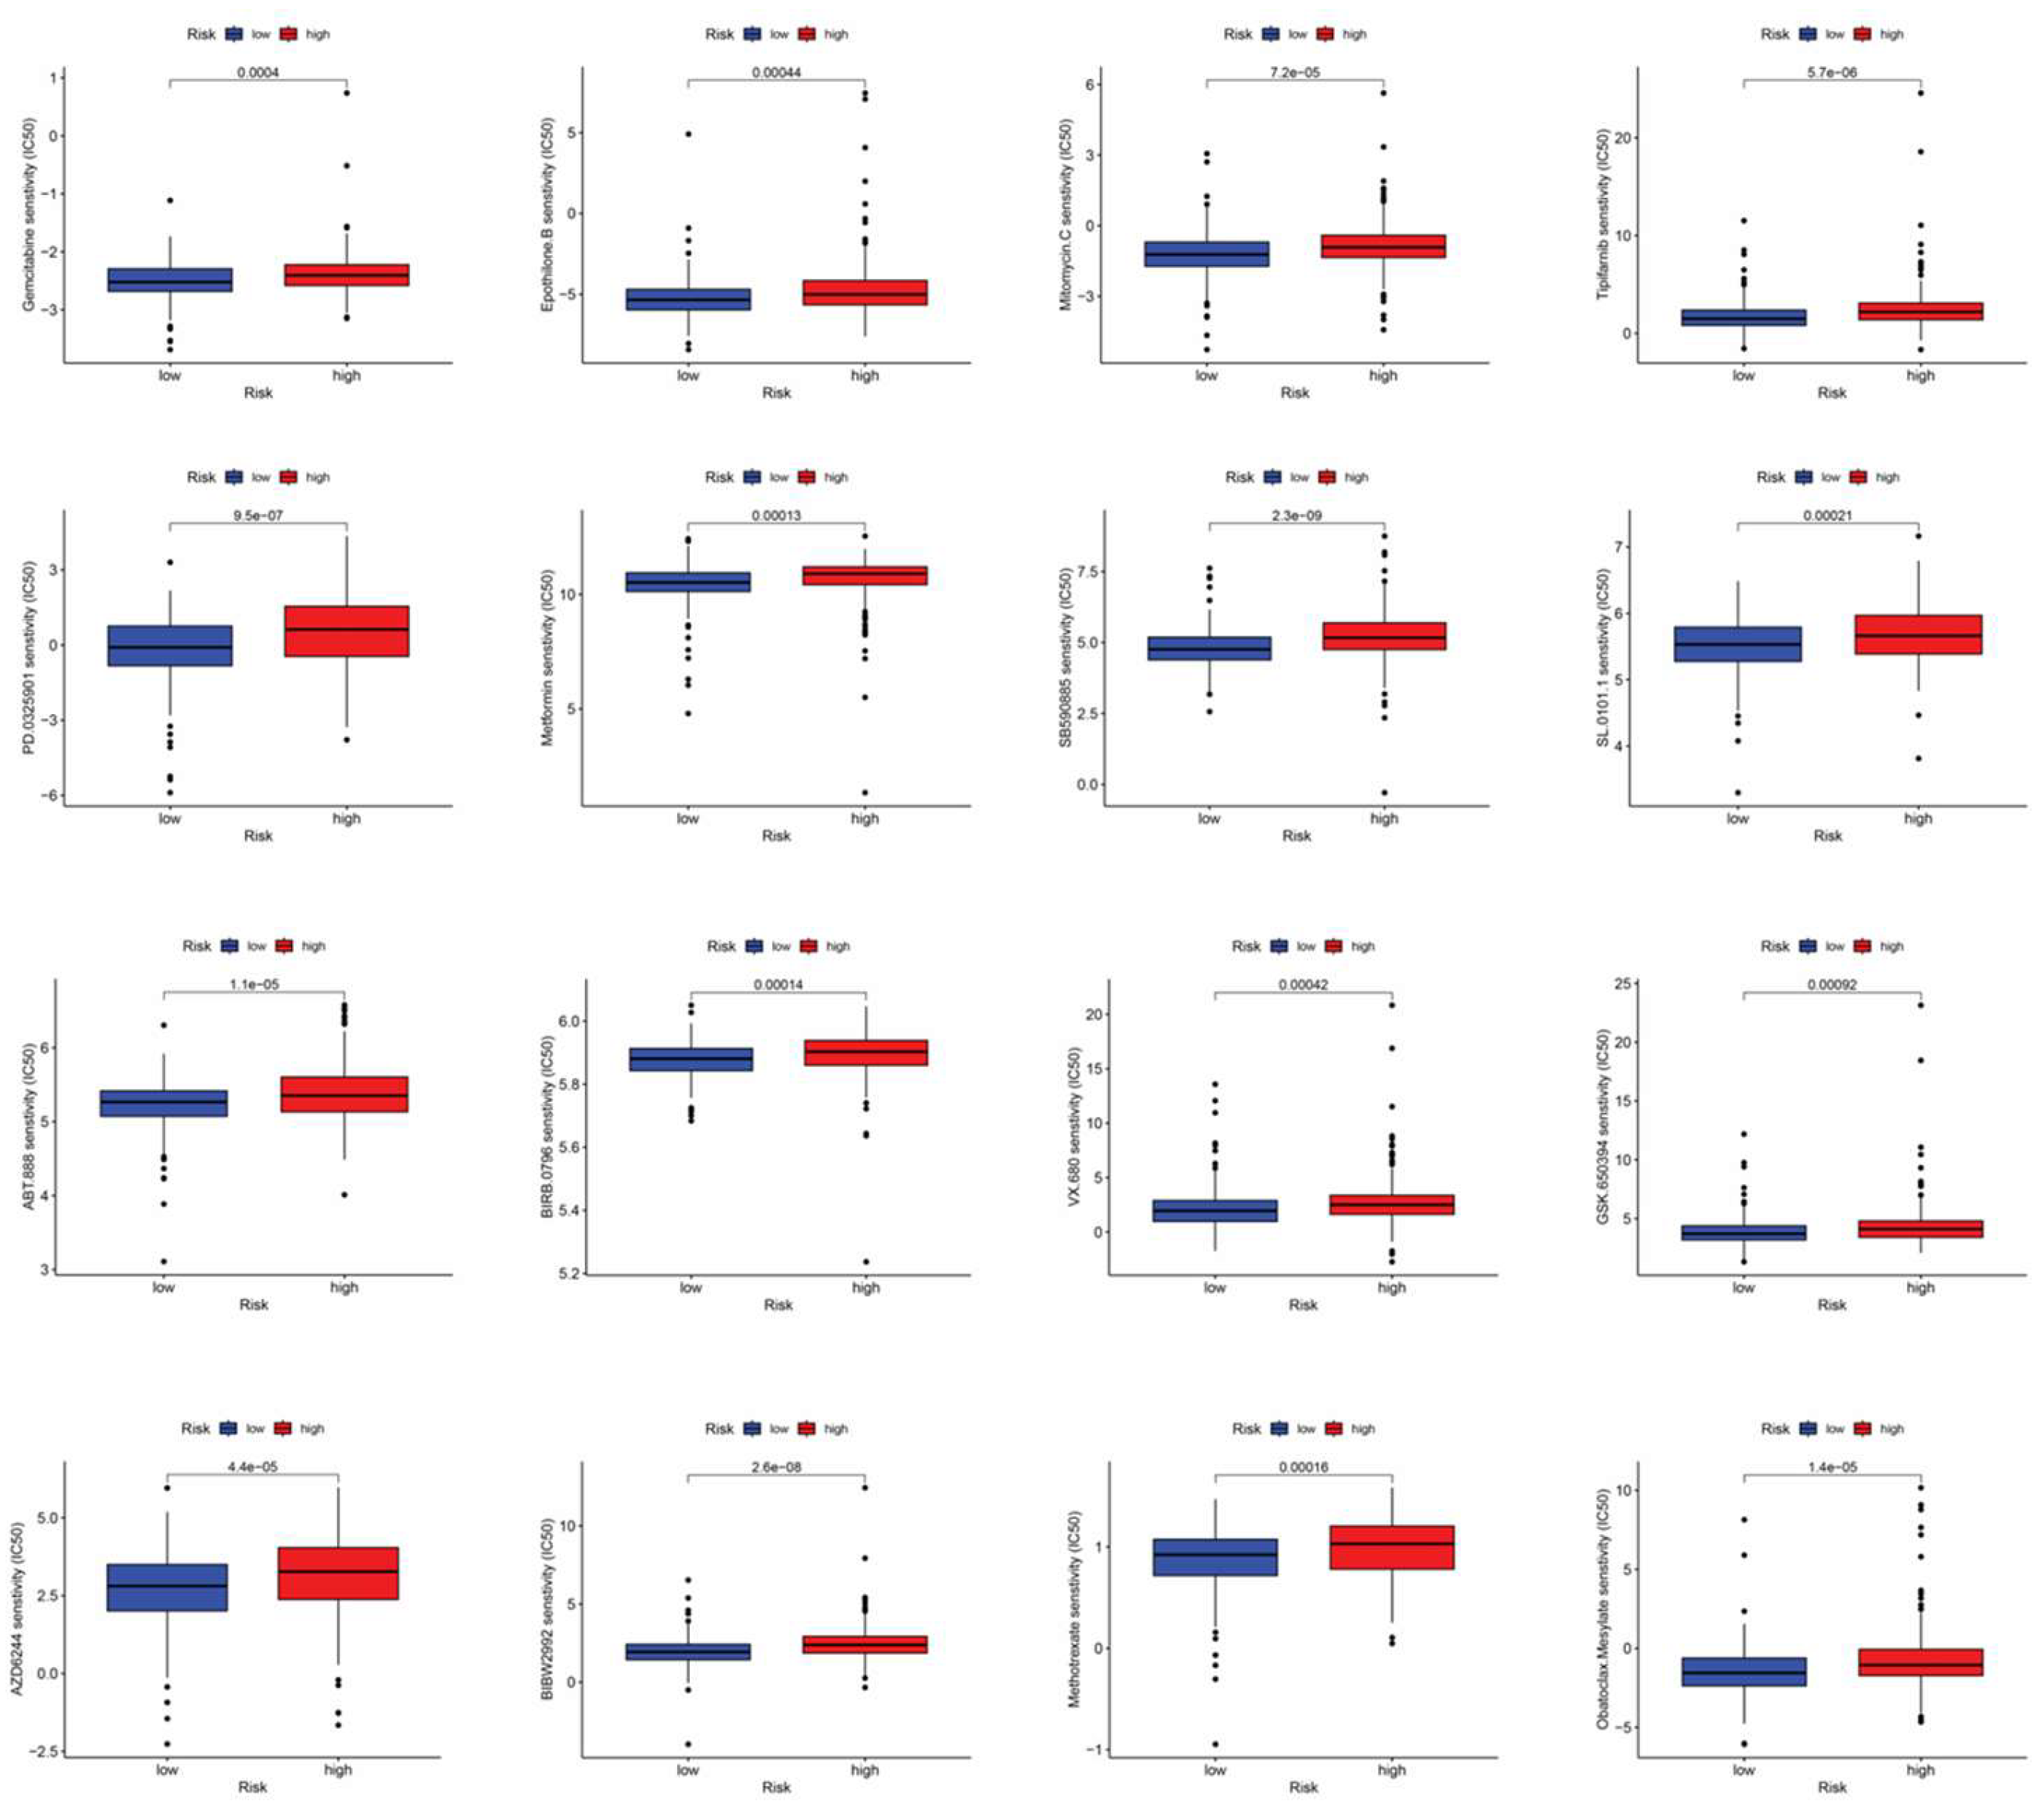
3.7. Drug sensitive analysis
By performing drug sensitivity analysis, we identified a series of drugs (e.g., gemcitabine, ABT.888) that exhibited lower IC50 values in GC patients with low disulfidptosis scores (Figure 9).
4. Discussion
A literature search revealed 24 genes involved in the disulfidptosis pathway. Co-expression analysis enabled us to identify lncRNAs associated with disulfidptosis. Subsequently, using Cox regression analysis combined with LASSO penalty analysis, we constructed a prognostic model comprising three disulfidptosis-related lncRNAs. AC107021.2 has emerged as a diagnostic marker for gastric and lung adenocarcinomas[17,18], while AC016394.2 and AC129507.1 show diagnostic potential in both gastric adenocarcinoma and prostate carcinoma[19,20]. However, the relationship between disulfidptosis-associated lncRNAs and immune landscape in STAD, along with their prognostic significance, remains to be elucidated. Our study investigated drlncRNAs in gastric cancer and established a three-drlncRNA prognostic signature to predict the prognosis and provide precise and individual clinical treatment guidance for patients with GC.
Through independent prognostic analysis, we demonstrated that our risk model's ability to predict patient outcomes remains significant when accounting for other clinical parameters. By drawing the ROC curve, we calculated AUC (Area Under the Curve) values, which validate our risk model's accuracy in predicting patient survival outcomes across 1-, 3-, and 5-year timeframes. Kaplan-Meier curves of different clinical features, including age, grade, stage, T stage, N stage, and M stage, illustrated that our risk model can predict patient outcomes regardless of clinical variables. Through nomogram and calibration curves, our model enables individualized prediction of patient survival at 1-, 3-, and 5-year timepoints.
As anticipated, enrichment analysis revealed a strong association between disulfidptosis-related lncRNAs and sulfur compound binding. The identification of disulfidptosis revealed a promising therapeutic strategy for cancer treatment, wherein sulfur compound binding orchestrates this cell death process through the activation of specific signaling cascades[10]. GO and KEGG analysis also revealed other functions and pathways that are closely related to drlncRNA, such as GPCR(G protein coupled receptor) binding, cAMP signaling pathway. A recent study revealed that activation of the Gαs-PKA signaling pathway drives CD8+ T cell dysfunction and confers resistance to immunotherapy[21]. cAMP exhibits dual regulatory effects on tumor cell survival and proliferation through its interactions with multiple immune components of the TME, particularly T cells and tumor-associated macrophages (TAMs)[22,23,24,25,26,27].
Given that GO and KEGG enrichment analyses revealed associations between drlncRNAs and immune function, we proceeded to investigate the immune landscape by comparing immune cell infiltration patterns between high- and low-risk groups. The elevated TME scores observed in high-risk patients indicate enhanced immune cell infiltration and enriched stromal cell content in their tumor microenvironment. Macrophages exhibit two distinct polarization states: M1 and M2[28]. In our analysis of immune cell infiltration patterns within the TME, we observed contrasting infiltration levels between M1 and M2 across the high- and low-risk groups: high levels of M1 infiltration were observed in the low-risk group, while high levels of M2 infiltration were observed in the high-risk group. While M1 play a crucial role in anti-tumor immunity, M2 facilitate tumor progression by promoting immune escape, angiogenesis, and extracellular matrix remodeling in tumor cells[29,30]. This may explain the poor survival of patients in the high disulfidptosis score group. Besides, the distinctions in 16 immune cells and 13 immune-related pathways across two subgroups were investigated using single-sample Gene Set Enrichment Analysis (ssGSEA). In the high-risk group, we observed elevated levels of mast cells accompanied by downregulation of MHC class I (Major Histocompatibility Complex I) molecules. A recent study shows that mast cells contribute to resistance against anti-PD-1 immunotherapy, and targeted depletion of mast cells enhances the therapeutic efficacy of immune checkpoint blockade[31]. Additional research shows that cancer cells can escape immune detection by reducing the expression of MHC-I. This decrease in MHC-I expression represents a key pathway for both inherent and adaptive resistance to immunotherapeutic interventions in cancer patients[32]. Unlike traditional therapy, this approach doesn't directly target tumor cells. Instead, it works by alleviating immunosuppression and stimulating the body's natural anti-tumor immune response, demonstrating remarkable efficacy across various treatment-resistant tumors. When combined with chemotherapy, targeted therapy, radiotherapy, and other treatment modalities, it enhances overall therapeutic outcomes[33,34,35,36]. Elevated expression of immune checkpoints, including PDCD1, PD-L1, and CTLA-4, in the low-risk group suggests a potentially enhanced response to immunotherapy.
TMB refers to the total number of nonsynonymous somatic mutations found in the cancer genome. As a biomarker for ICI therapy response, MSI-H demonstrates predictive value across diverse tumor types, potentially due to its role as a mechanistic mediator of immunotherapy outcomes[37]. Accumulating evidence suggests that TMB levels serve as a potential predictor of patient responsiveness to immune checkpoint inhibitor therapy, particularly when combined with PD-1 expression and MSI status for enhanced prognostic accuracy[38,39,40,41]. Our analysis demonstrated that patients with low disulfidptosis scores exhibited significantly higher tumor mutational burden (TMB) (p=1.2e-09) and a greater proportion of MSI-H cases (32%) compared to the high-score group. These findings suggest that patients with low disulfidptosis scores may achieve enhanced therapeutic responses to immunotherapy. Moreover, we found patients with elevated TMB showed improved survival outcomes regardless of disulfidptosis scores. To comprehensively analyze the mutational landscape differences between high- and low-risk groups, we generated waterfall plots depicting the 15 most frequently mutated genes. Notably, among the 15 most frequently mutated genes, only the tumor suppressor gene TP53 showed a higher mutation frequency in the high-risk group compared to the low-risk group. In contrast, we observed that ARID1A mutations were significantly less prevalent in the high-risk group, establishing a distinct mutational pattern between the two risk groups. TP53 represents the most frequently mutated gene across human cancers[42]. Its mutations not only compromise its tumor-suppressive functions but also confer oncogenic properties to the mutant p53 protein[43]. Studies have demonstrated that TP53 mutations correlate with poor clinical outcomes in cancer patients[44]. This observation, on the other hand, provides a mechanistic explanation for the poor survival outcomes observed in patients with high disulfidptosis scores. Multiple clinical trials have demonstrated that ARID1A-mutated solid tumors exhibit enhanced responsiveness to immune checkpoint blockade (ICB) therapy across various cancer types, independent of MSI status or TMB[45,46,47]. These findings suggest that patients with high disulfidptosis scores may exhibit resistance to immune checkpoint inhibitor therapy.
TIDE (Tumor Immune Dysfunction and Exclusion) analysis further revealed that patients in the high-risk group exhibited a higher likelihood of developing resistance to immunotherapy, suggesting limited therapeutic benefit from immune checkpoint blockade in this subgroup. Moreover, comprehensive drug sensitivity analysis identified multiple potential therapeutic agents that showed enhanced efficacy in the low-risk group, while also revealing drugs prone to resistance in the high-risk group, thereby providing valuable insights for personalized treatment strategies. Recent clinical trials have demonstrated that the combination of gemcitabine plus cisplatin with PD-L1 inhibitors exhibits promising therapeutic efficacy in patients with advanced biliary tract cancer[48]. In another phase I dose-escalation study, the combination of ABT.888(veliparib) with PD-1 inhibitor plus platinum-based doublet chemotherapy demonstrated promising therapeutic efficacy in patients with metastatic or advanced non-small cell lung cancer[49]. Based on these findings, the combination of immune checkpoint inhibitors with conventional chemotherapeutic agents represents a promising therapeutic strategy for gastric cancer.
Additionally, we realized that this study still had limitations. Firstly, the 3 drlncRNAs prognostic model was developed and verified on the basis of the results of these retrospective analyses of TCGA. It is necessary to conduct prospective cohort studies to further validate this risk model. Secondly, more independent immunotherapy cohorts were needed to validate the predictive value of the risk model for immunotherapy response. Lastly, we should not only verify the accuracy and practicality of the above lncRNA signature by collecting a large number of clinical data, but also further explore the mechanism of these lncRNAs in GC.
5. Conclusions
In conclusion, our established disulfidptosis-related lncRNA prognostic model enables accurate prediction of patient survival and facilitates the identification of potentially effective drugs and treatment-sensitive individuals, ultimately contributing to improved survival outcomes in STAD patients.
Author Contributions
J.Z., W.S., X.Z. and T.S. conceived and designed all bioinformatics analysis. J.Z., X.Z. and S.W. analyzed the data and drafted the manuscript. J.Z., W.S., Z.X., S.W., H.Z. and T.S. revised our manuscript. All authors contributed to the paper and approved the submitted version.
Funding
This research received no external funding.
Institutional Review Board Statement
Not applicable.
Informed Consent Statement
Not applicable.
Data Availability Statement
The original contributions presented in the study are included in the article/Supplementary Materials. Further inquiries can be directed to the corresponding authors.
Conflicts of Interest
The authors declare that the research was conducted in the absence of any commercial or financial relationships that could be construed as a potential conflict of interest.
References
- Van Cutsem, E.; Sagaert, X.; Topal, B.; Haustermans, K.; Prenen, H. Gastric cancer. Lancet (London, England) 2016, 388, 2654–2664. [Google Scholar] [CrossRef]
- Morgan, E.; Arnold, M.; Camargo, M.C.; Gini, A.; Kunzmann, A.T.; Matsuda, T.; Meheus, F.; Verhoeven, R.H.A.; Vignat, J.; Laversanne, M.; et al. The current and future incidence and mortality of gastric cancer in 185 countries, 2020-40: A population-based modelling study. EClinicalMedicine 2022, 47, 101404. [Google Scholar] [CrossRef] [PubMed]
- Thrift, A.P.; El-Serag, H.B. Burden of Gastric Cancer. Clinical gastroenterology and hepatology : the official clinical practice journal of the American Gastroenterological Association 2020, 18, 534–542. [Google Scholar] [CrossRef] [PubMed]
- Karimi, P.; Islami, F.; Anandasabapathy, S.; Freedman, N.D.; Kamangar, F. Gastric cancer: descriptive epidemiology, risk factors, screening, and prevention. Cancer epidemiology, biomarkers & prevention : a publication of the American Association for Cancer Research, cosponsored by the American Society of Preventive Oncology 2014, 23, 700–713. [Google Scholar] [CrossRef]
- Liu, X.; Meltzer, S.J. Gastric Cancer in the Era of Precision Medicine. Cellular and molecular gastroenterology and hepatology 2017, 3, 348–358. [Google Scholar] [CrossRef] [PubMed]
- Jin, X.; Liu, Z.; Yang, D.; Yin, K.; Chang, X. Recent Progress and Future Perspectives of Immunotherapy in Advanced Gastric Cancer. Frontiers in immunology 2022, 13, 948647. [Google Scholar] [CrossRef]
- Maleki Vareki, S.; Garrigós, C.; Duran, I. Biomarkers of response to PD-1/PD-L1 inhibition. Critical reviews in oncology/hematology 2017, 116, 116–124. [Google Scholar] [CrossRef]
- Liu, X.; Nie, L.; Zhang, Y.; Yan, Y.; Wang, C.; Colic, M.; Olszewski, K.; Horbath, A.; Chen, X.; Lei, G.; et al. Actin cytoskeleton vulnerability to disulfide stress mediates disulfidptosis. Nature cell biology 2023, 25, 404–414. [Google Scholar] [CrossRef]
- Koppula, P.; Zhuang, L.; Gan, B. Cystine transporter SLC7A11/xCT in cancer: ferroptosis, nutrient dependency, and cancer therapy. Protein & cell 2021, 12, 599–620. [Google Scholar] [CrossRef]
- Zheng, T.; Liu, Q.; Xing, F.; Zeng, C.; Wang, W. Disulfidptosis: a new form of programmed cell death. Journal of experimental & clinical cancer research : CR 2023, 42, 137. [Google Scholar] [CrossRef]
- Zheng, P.; Zhou, C.; Ding, Y.; Duan, S. Disulfidptosis: a new target for metabolic cancer therapy. Journal of experimental & clinical cancer research : CR 2023, 42, 103. [Google Scholar] [CrossRef]
- Shuai, Y.; Ma, Z.; Liu, W.; Yu, T.; Yan, C.; Jiang, H.; Tian, S.; Xu, T.; Shu, Y. TEAD4 modulated LncRNA MNX1-AS1 contributes to gastric cancer progression partly through suppressing BTG2 and activating BCL2. Molecular cancer 2020, 19, 6. [Google Scholar] [CrossRef] [PubMed]
- Sun, D.; Gou, H.; Wang, D.; Li, C.; Li, Y.; Su, H.; Wang, X.; Zhang, X.; Yu, J. LncRNA TNFRSF10A-AS1 promotes gastric cancer by directly binding to oncogenic MPZL1 and is associated with patient outcome. International journal of biological sciences 2022, 18, 3156–3166. [Google Scholar] [CrossRef]
- Qi, F.; Liu, X.; Wu, H.; Yu, X.; Wei, C.; Huang, X.; Ji, G.; Nie, F.; Wang, K. Long noncoding AGAP2-AS1 is activated by SP1 and promotes cell proliferation and invasion in gastric cancer. Journal of hematology & oncology 2017, 10, 48. [Google Scholar] [CrossRef]
- Liu, Y.W.; Xia, R.; Lu, K.; Xie, M.; Yang, F.; Sun, M.; De, W.; Wang, C.; Ji, G. LincRNAFEZF1-AS1 represses p21 expression to promote gastric cancer proliferation through LSD1-Mediated H3K4me2 demethylation. Molecular cancer 2017, 16, 39. [Google Scholar] [CrossRef]
- Mao, M.; Yu, Q.; Huang, R.; Lu, Y.; Wang, Z.; Liao, L. Stromal score as a prognostic factor in primary gastric cancer and close association with tumor immune microenvironment. Cancer medicine 2020, 9, 4980–4990. [Google Scholar] [CrossRef]
- Fan, Z.; Wang, Y.; Niu, R. Identification of the three subtypes and the prognostic characteristics of stomach adenocarcinoma: analysis of the hypoxia-related long non-coding RNAs. Functional & integrative genomics 2022, 22, 919–936. [Google Scholar] [CrossRef]
- Mao, F.; Li, Z.; Li, Y.; Huang, H.; Shi, Z.; Li, X.; Wu, D.; Liu, H.; Chen, J. Necroptosis-related lncRNA in lung adenocarcinoma: A comprehensive analysis based on a prognosis model and a competing endogenous RNA network. Frontiers in genetics 2022, 13, 940167. [Google Scholar] [CrossRef]
- Lu, Y.; Wu, J.; Li, X.; Leng, Q.; Tan, J.; Huang, H.; Zhong, R.; Chen, Z.; Zhang, Y. Cuproptosis-related lncRNAs emerge as a novel signature for predicting prognosis in prostate carcinoma and functional experimental validation. Frontiers in immunology 2024, 15, 1471198. [Google Scholar] [CrossRef]
- Kang, K.; Li, X.; Peng, Y.; Zhou, Y. Comprehensive Analysis of Disulfidptosis-Related LncRNAs in Molecular Classification, Immune Microenvironment Characterization and Prognosis of Gastric Cancer. Biomedicines 2023, 11. [Google Scholar] [CrossRef]
- Wu, V.H.; Yung, B.S.; Faraji, F.; Saddawi-Konefka, R.; Wang, Z.; Wenzel, A.T.; Song, M.J.; Pagadala, M.S.; Clubb, L.M.; Chiou, J.; et al. The GPCR-Gα(s)-PKA signaling axis promotes T cell dysfunction and cancer immunotherapy failure. Nature immunology 2023, 24, 1318–1330. [Google Scholar] [CrossRef] [PubMed]
- Wu, J.J.; Yang, Y.; Peng, W.T.; Sun, J.C.; Sun, W.Y.; Wei, W. G protein-coupled receptor kinase 2 regulating β2-adrenergic receptor signaling in M2-polarized macrophages contributes to hepatocellular carcinoma progression. OncoTargets and therapy 2019, 12, 5499–5513. [Google Scholar] [CrossRef]
- Yano, S.; Ghosh, P.; Kusaba, H.; Buchholz, M.; Longo, D.L. Effect of promoter methylation on the regulation of IFN-gamma gene during in vitro differentiation of human peripheral blood T cells into a Th2 population. Journal of immunology (Baltimore, Md. : 1950) 2003, 171, 2510–2516. [Google Scholar] [CrossRef] [PubMed]
- Qian, X.; Gu, L.; Ning, H.; Zhang, Y.; Hsueh, E.C.; Fu, M.; Hu, X.; Wei, L.; Hoft, D.F.; Liu, J. Increased Th17 cells in the tumor microenvironment is mediated by IL-23 via tumor-secreted prostaglandin E2. Journal of immunology (Baltimore, Md. : 1950) 2013, 190, 5894–5902. [Google Scholar] [CrossRef]
- Ji, Y.; Zhang, W. Th17 cells: positive or negative role in tumor? Cancer immunology, immunotherapy : CII 2010, 59, 979–987. [Google Scholar] [CrossRef]
- Asadzadeh, Z.; Mohammadi, H.; Safarzadeh, E.; Hemmatzadeh, M.; Mahdian-Shakib, A.; Jadidi-Niaragh, F.; Azizi, G.; Baradaran, B. The paradox of Th17 cell functions in tumor immunity. Cellular immunology 2017, 322, 15–25. [Google Scholar] [CrossRef]
- Zhang, H.; Liu, Y.; Liu, J.; Chen, J.; Wang, J.; Hua, H.; Jiang, Y. cAMP-PKA/EPAC signaling and cancer: the interplay in tumor microenvironment. Journal of hematology & oncology 2024, 17, 5. [Google Scholar] [CrossRef]
- Huang, Y.C.; Feng, Z.P. The good and bad of microglia/macrophages: new hope in stroke therapeutics. Acta pharmacologica Sinica 2013, 34, 6–7. [Google Scholar] [CrossRef] [PubMed]
- Aras, S.; Zaidi, M.R. TAMeless traitors: macrophages in cancer progression and metastasis. British journal of cancer 2017, 117, 1583–1591. [Google Scholar] [CrossRef]
- Toledo, B.; Zhu Chen, L.; Paniagua-Sancho, M.; Marchal, J.A.; Perán, M.; Giovannetti, E. Deciphering the performance of macrophages in tumour microenvironment: a call for precision immunotherapy. Journal of hematology & oncology 2024, 17, 44. [Google Scholar] [CrossRef]
- Somasundaram, R.; Connelly, T.; Choi, R.; Choi, H.; Samarkina, A.; Li, L.; Gregorio, E.; Chen, Y.; Thakur, R.; Abdel-Mohsen, M.; et al. Tumor-infiltrating mast cells are associated with resistance to anti-PD-1 therapy. Nature communications 2021, 12, 346. [Google Scholar] [CrossRef] [PubMed]
- Taylor, B.C.; Balko, J.M. Mechanisms of MHC-I Downregulation and Role in Immunotherapy Response. Frontiers in immunology 2022, 13, 844866. [Google Scholar] [CrossRef] [PubMed]
- Janjigian, Y.Y.; Shitara, K.; Moehler, M.; Garrido, M.; Salman, P.; Shen, L.; Wyrwicz, L.; Yamaguchi, K.; Skoczylas, T.; Campos Bragagnoli, A.; et al. First-line nivolumab plus chemotherapy versus chemotherapy alone for advanced gastric, gastro-oesophageal junction, and oesophageal adenocarcinoma (CheckMate 649): a randomised, open-label, phase 3 trial. Lancet (London, England) 2021, 398, 27–40. [Google Scholar] [CrossRef]
- Pennock, G.K.; Chow, L.Q. The Evolving Role of Immune Checkpoint Inhibitors in Cancer Treatment. The oncologist 2015, 20, 812–822. [Google Scholar] [CrossRef]
- Ribas, A.; Wolchok, J.D. Cancer immunotherapy using checkpoint blockade. Science (New York, N.Y.) 2018, 359, 1350–1355. [Google Scholar] [CrossRef]
- Gaikwad, S.; Agrawal, M.Y.; Kaushik, I.; Ramachandran, S.; Srivastava, S.K. Immune checkpoint proteins: Signaling mechanisms and molecular interactions in cancer immunotherapy. Seminars in cancer biology 2022, 86, 137–150. [Google Scholar] [CrossRef]
- Ionov, Y.; Peinado, M.A.; Malkhosyan, S.; Shibata, D.; Perucho, M. Ubiquitous somatic mutations in simple repeated sequences reveal a new mechanism for colonic carcinogenesis. Nature 1993, 363, 558–561. [Google Scholar] [CrossRef]
- Wang, X.; Lamberti, G.; Di Federico, A.; Alessi, J.; Ferrara, R.; Sholl, M.L.; Awad, M.M.; Vokes, N.; Ricciuti, B. Tumor mutational burden for the prediction of PD-(L)1 blockade efficacy in cancer: challenges and opportunities. Annals of oncology : official journal of the European Society for Medical Oncology 2024, 35, 508–522. [Google Scholar] [CrossRef]
- Wang, F.; Wei, X.L.; Wang, F.H.; Xu, N.; Shen, L.; Dai, G.H.; Yuan, X.L.; Chen, Y.; Yang, S.J.; Shi, J.H.; et al. Safety, efficacy and tumor mutational burden as a biomarker of overall survival benefit in chemo-refractory gastric cancer treated with toripalimab, a PD-1 antibody in phase Ib/II clinical trial NCT02915432. Annals of oncology : official journal of the European Society for Medical Oncology 2019, 30, 1479–1486. [Google Scholar] [CrossRef]
- Robert, C.; Lewis, K.D.; Gutzmer, R.; Stroyakovskiy, D.; Gogas, H.; Protsenko, S.; Pereira, R.P.; Eigentler, T.; Rutkowski, P.; Demidov, L.; et al. Biomarkers of treatment benefit with atezolizumab plus vemurafenib plus cobimetinib in BRAF(V600) mutation-positive melanoma. Annals of oncology : official journal of the European Society for Medical Oncology 2022, 33, 544–555. [Google Scholar] [CrossRef]
- Budczies, J.; Kazdal, D.; Menzel, M.; Beck, S.; Kluck, K.; Altbürger, C.; Schwab, C.; Allgäuer, M.; Ahadova, A.; Kloor, M.; et al. Tumour mutational burden: clinical utility, challenges and emerging improvements. Nature reviews. Clinical oncology 2024, 21, 725–742. [Google Scholar] [CrossRef] [PubMed]
- Kastenhuber, E.R.; Lowe, S.W. Putting p53 in Context. Cell 2017, 170, 1062–1078. [Google Scholar] [CrossRef]
- Hu, J.; Cao, J.; Topatana, W.; Juengpanich, S.; Li, S.; Zhang, B.; Shen, J.; Cai, L.; Cai, X.; Chen, M. Targeting mutant p53 for cancer therapy: direct and indirect strategies. Journal of hematology & oncology 2021, 14, 157. [Google Scholar] [CrossRef]
- Olivier, M.; Hollstein, M.; Hainaut, P. TP53 mutations in human cancers: origins, consequences, and clinical use. Cold Spring Harbor perspectives in biology 2010, 2, a001008. [Google Scholar] [CrossRef]
- Okamura, R.; Kato, S.; Lee, S.; Jimenez, R.E.; Sicklick, J.K.; Kurzrock, R. ARID1A alterations function as a biomarker for longer progression-free survival after anti-PD-1/PD-L1 immunotherapy. Journal for immunotherapy of cancer 2020, 8. [Google Scholar] [CrossRef] [PubMed]
- Goswami, S.; Chen, Y.; Anandhan, S.; Szabo, P.M.; Basu, S.; Blando, J.M.; Liu, W.; Zhang, J.; Natarajan, S.M.; Xiong, L.; et al. ARID1A mutation plus CXCL13 expression act as combinatorial biomarkers to predict responses to immune checkpoint therapy in mUCC. Science translational medicine 2020, 12. [Google Scholar] [CrossRef]
- Li, L.; Li, M.; Jiang, Z.; Wang, X. ARID1A Mutations Are Associated with Increased Immune Activity in Gastrointestinal Cancer. Cells 2019, 8. [Google Scholar] [CrossRef]
- Hindson, J. Gemcitabine and cisplatin plus immunotherapy in advanced biliary tract cancer: a phase II study. Nature reviews. Gastroenterology & hepatology 2022, 19, 280. [Google Scholar] [CrossRef]
- Clarke, J.M.; Patel, J.D.; Robert, F.; Kio, E.A.; Thara, E.; Ross Camidge, D.; Dunbar, M.; Nuthalapati, S.; Dinh, M.H.; Bach, B.A. Veliparib and nivolumab in combination with platinum doublet chemotherapy in patients with metastatic or advanced non-small cell lung cancer: A phase 1 dose escalation study. Lung cancer (Amsterdam, Netherlands) 2021, 161, 180–188. [Google Scholar] [CrossRef]
Figure 1.
The flow chart of the present study.
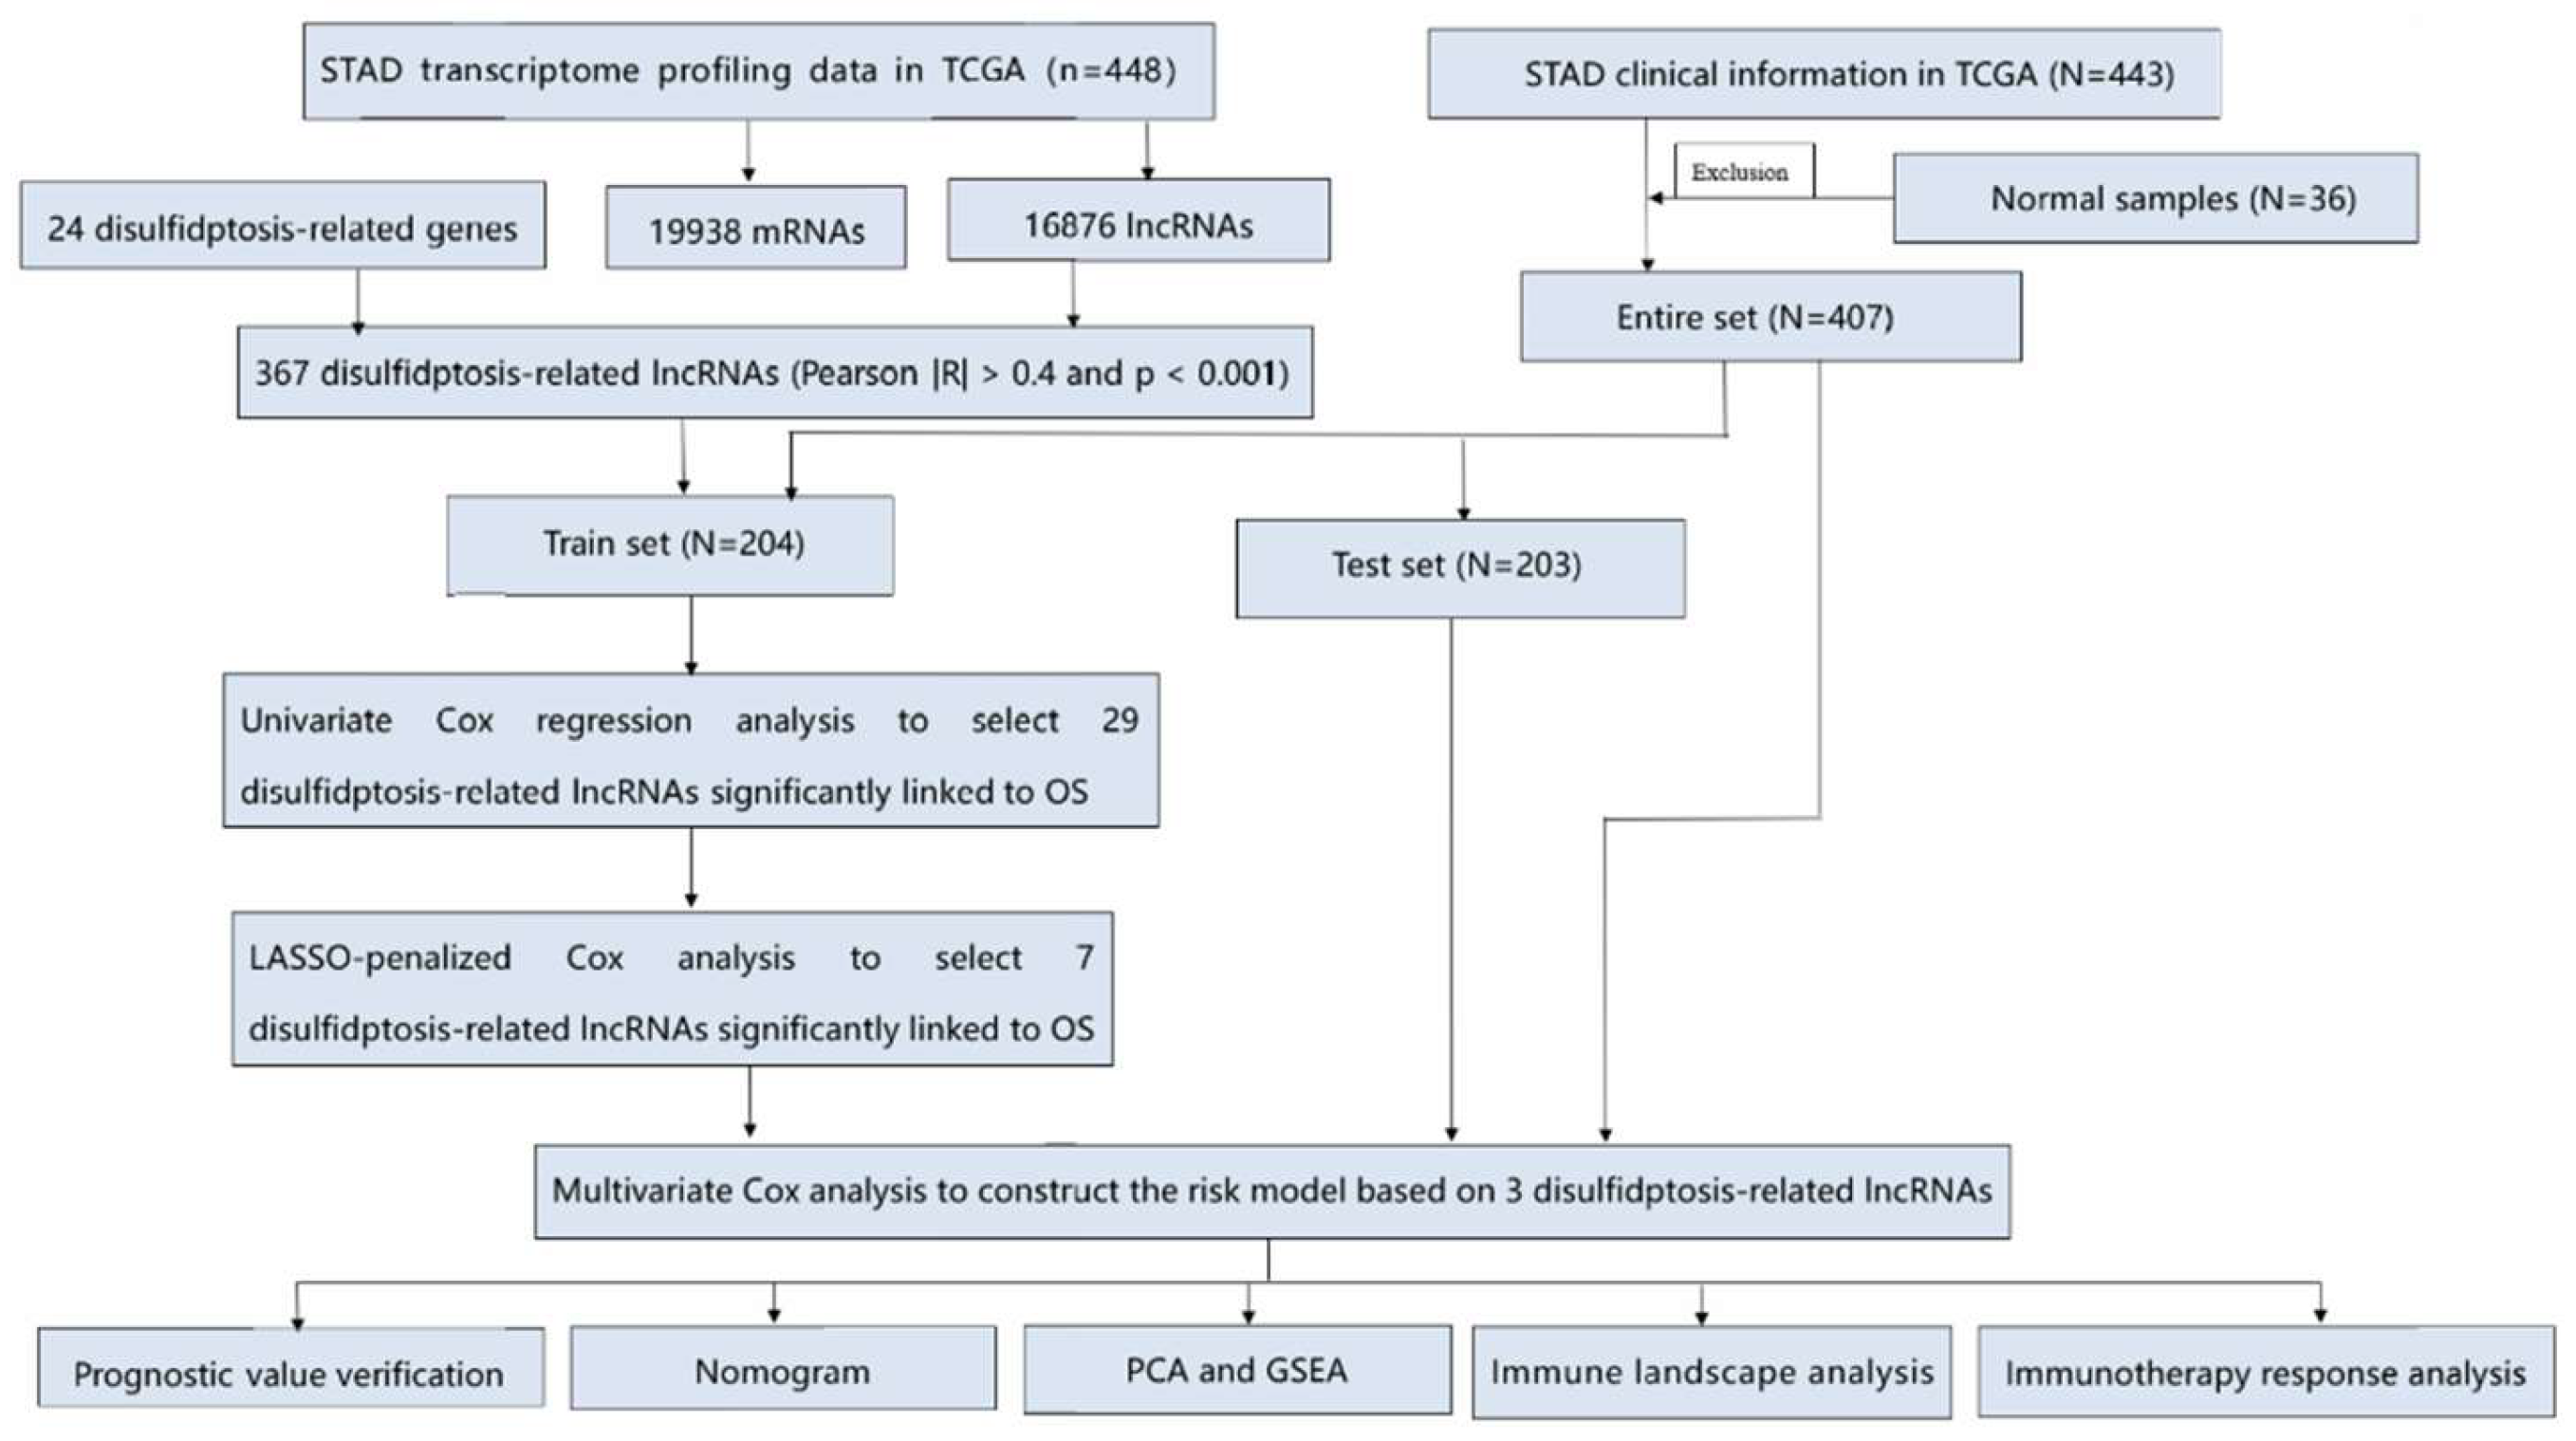
Figure 2.
Identification of drlncRNAs in GC and construction of a risk model. (A) A total of 367 disulfidptosis-related lncRNAs were identified in STAD. (B) The forest plot of the result of univariate Cox regression analysis. (C,D) LASSO regression of the 30 OS-related genes identified via univariate Cox regression analysis. (E) disulfidptosis -related prognostic signature was identified via the multivariate Cox regression analysis. (F) The correlation between prognostic signature and disulfidptosis-related genes.
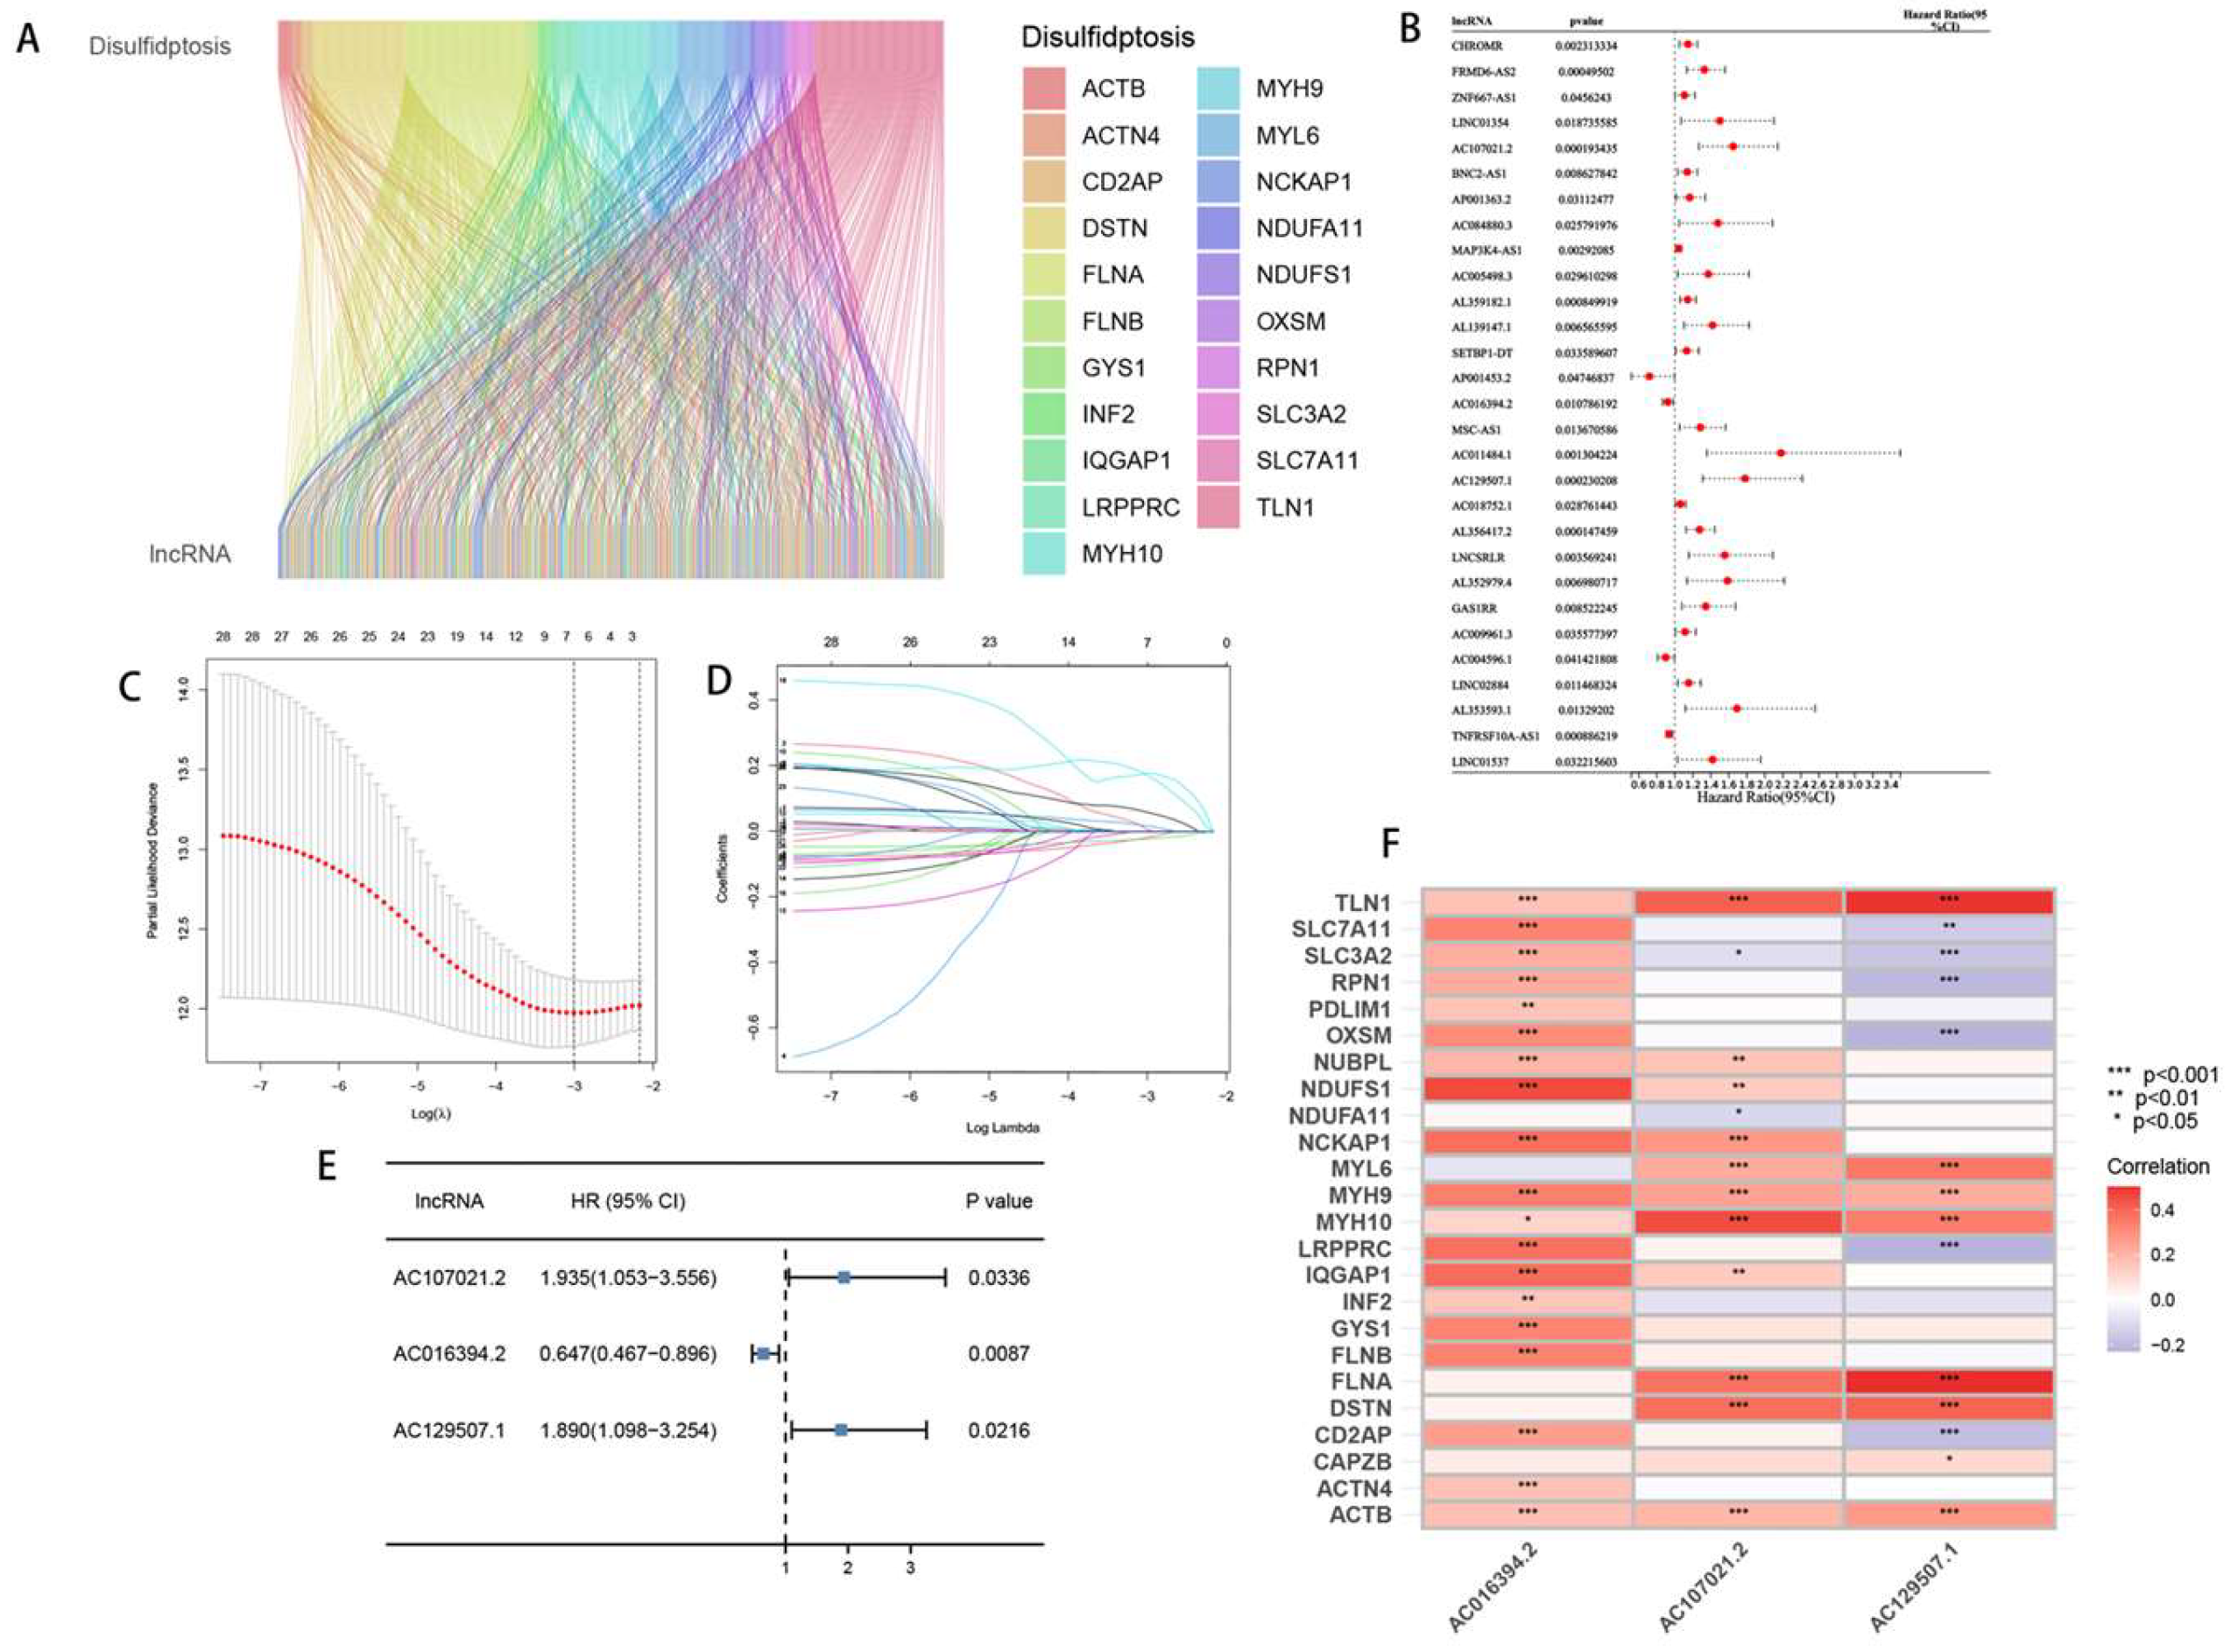
Figure 3.
Risk model prognosis in the train, test and entire sets. (A-D) The difference of risk scores, survival status, heatmap and prognosis between high and low disulfidptosis score groups in the train set. (E-H, I-L) A similar analysis was carried out in the test set and entire set. (M) The forest plots for univariate COX regression analysis of different clinicopathological characteristics. (N) Multivariate COX regression analysis. (O-Q) The 1-, 3- and 5- year ROC curves for the train set, test set and entire set. (R) ROC curves comparing drlncRNA models with different clinical features.
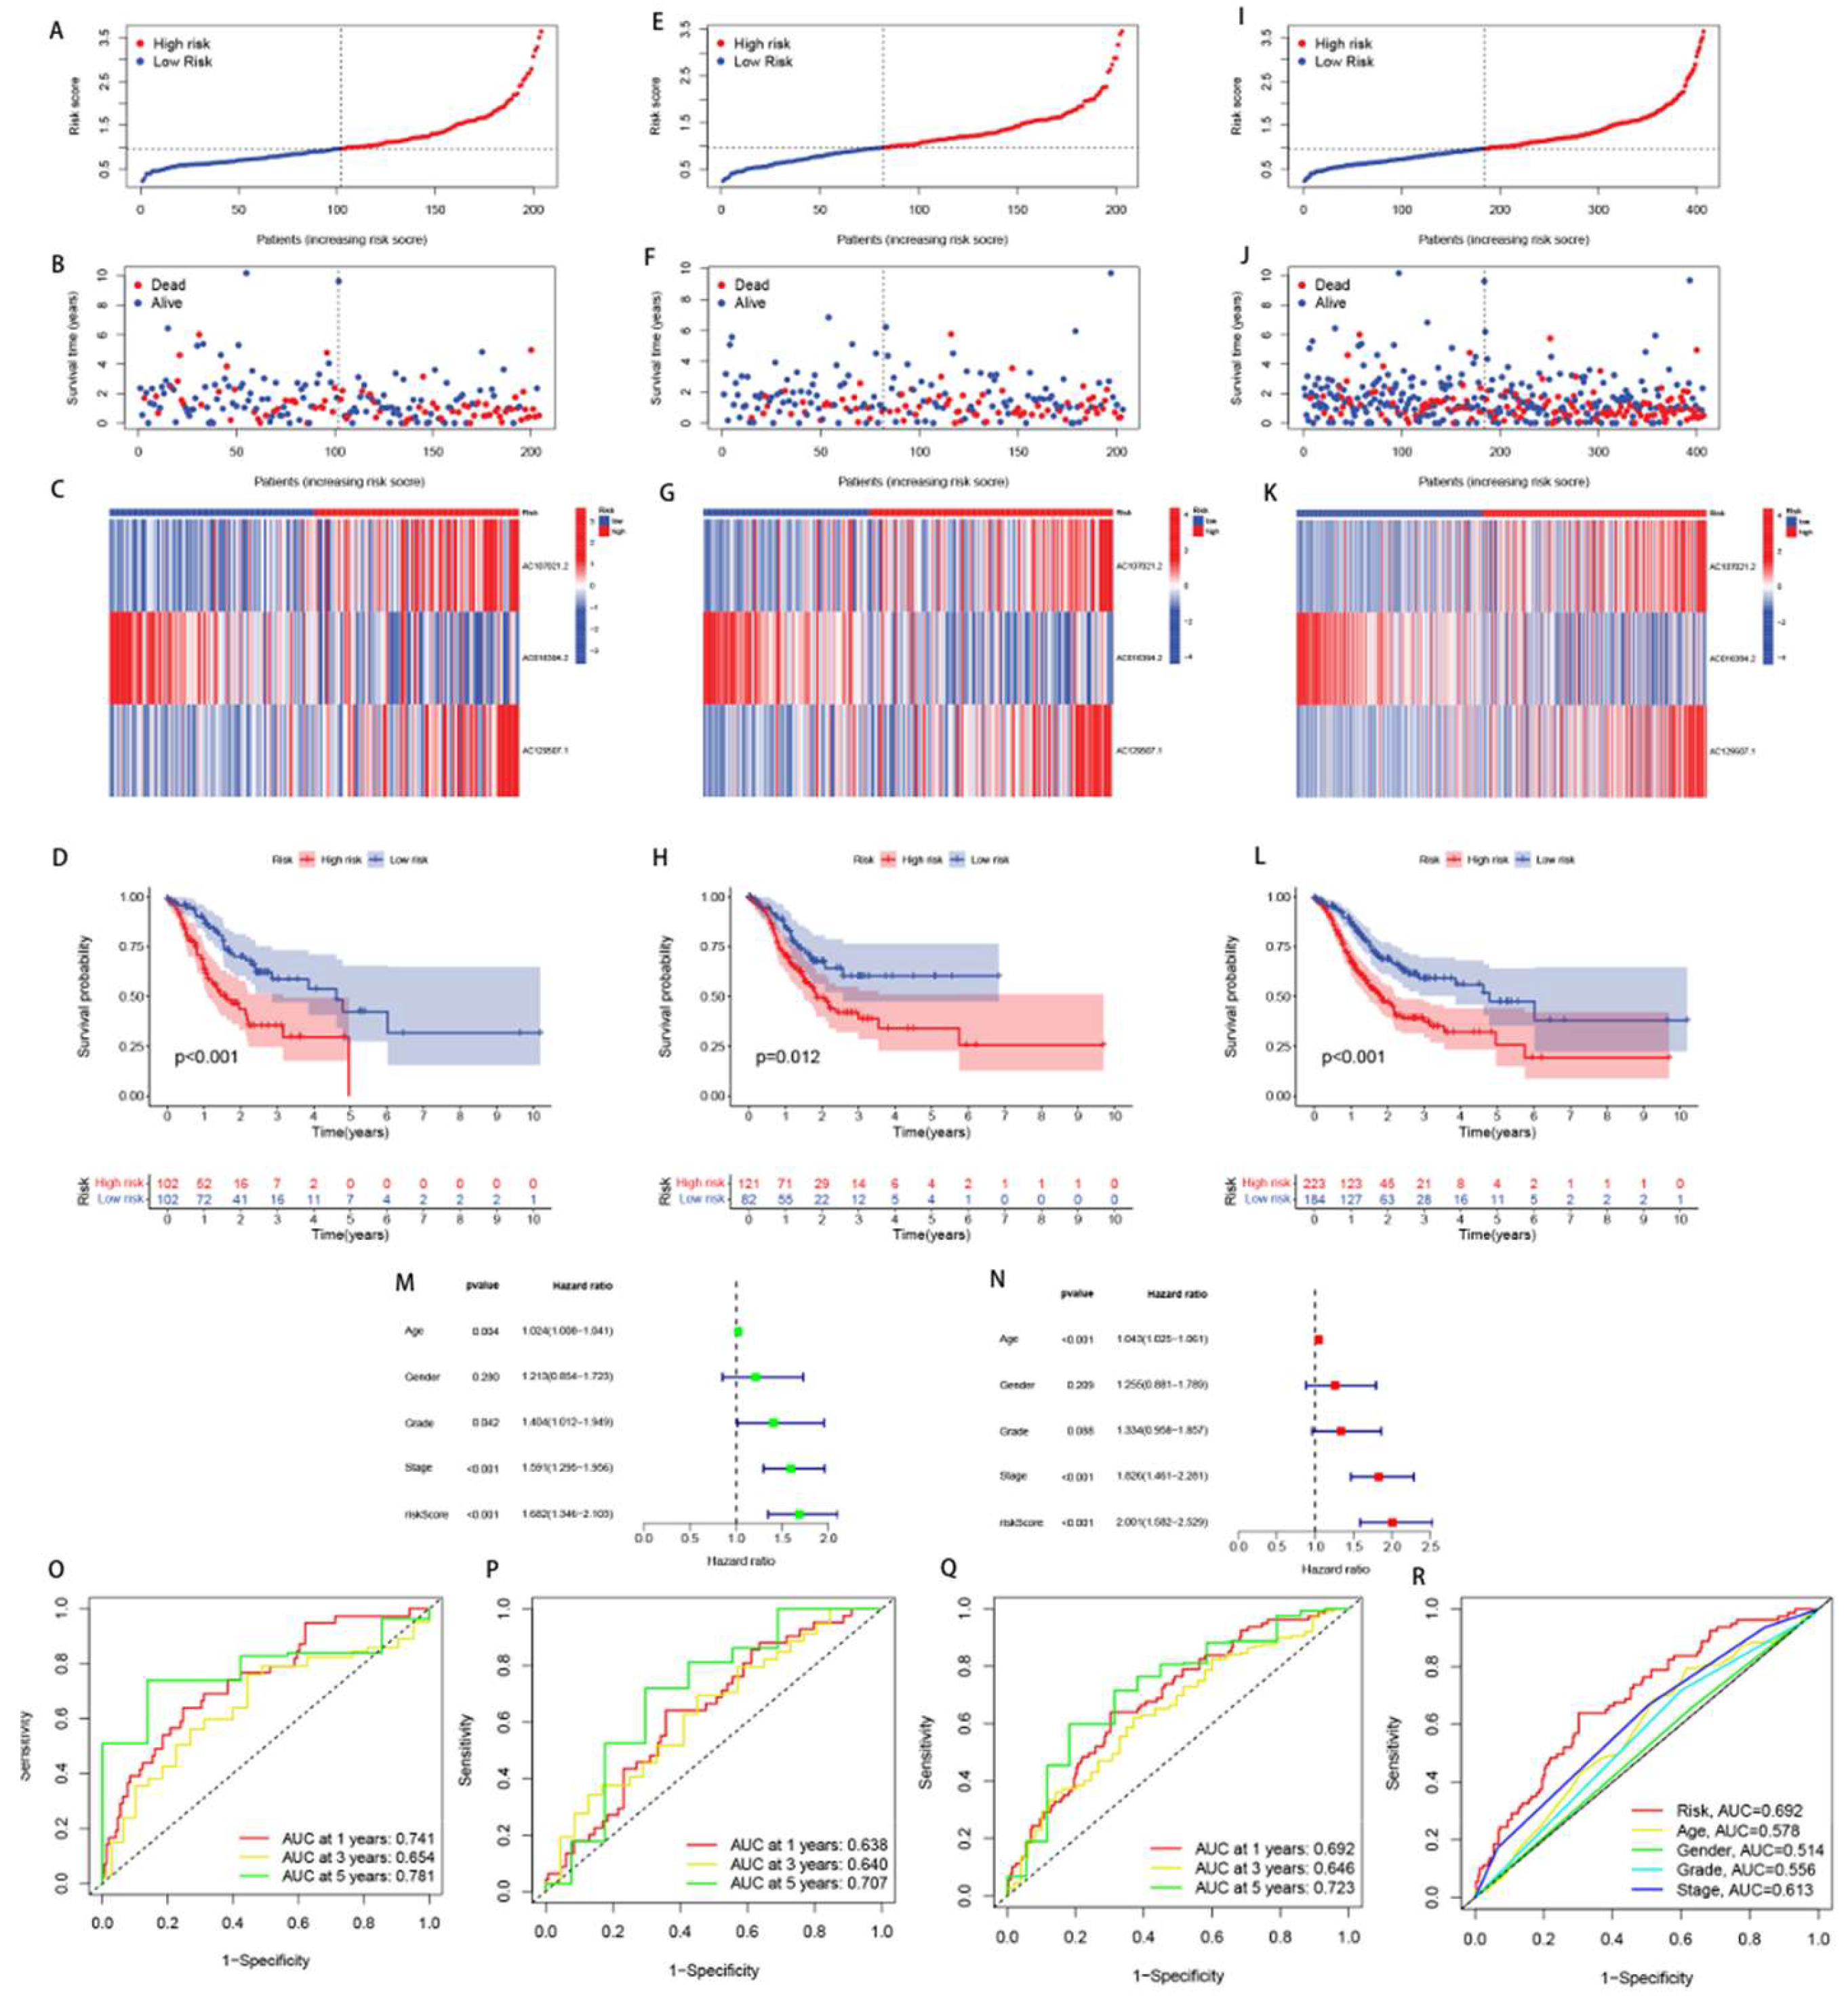
Figure 4.
Kaplan-Meier survial analysis for different clinicopathological characteristics.
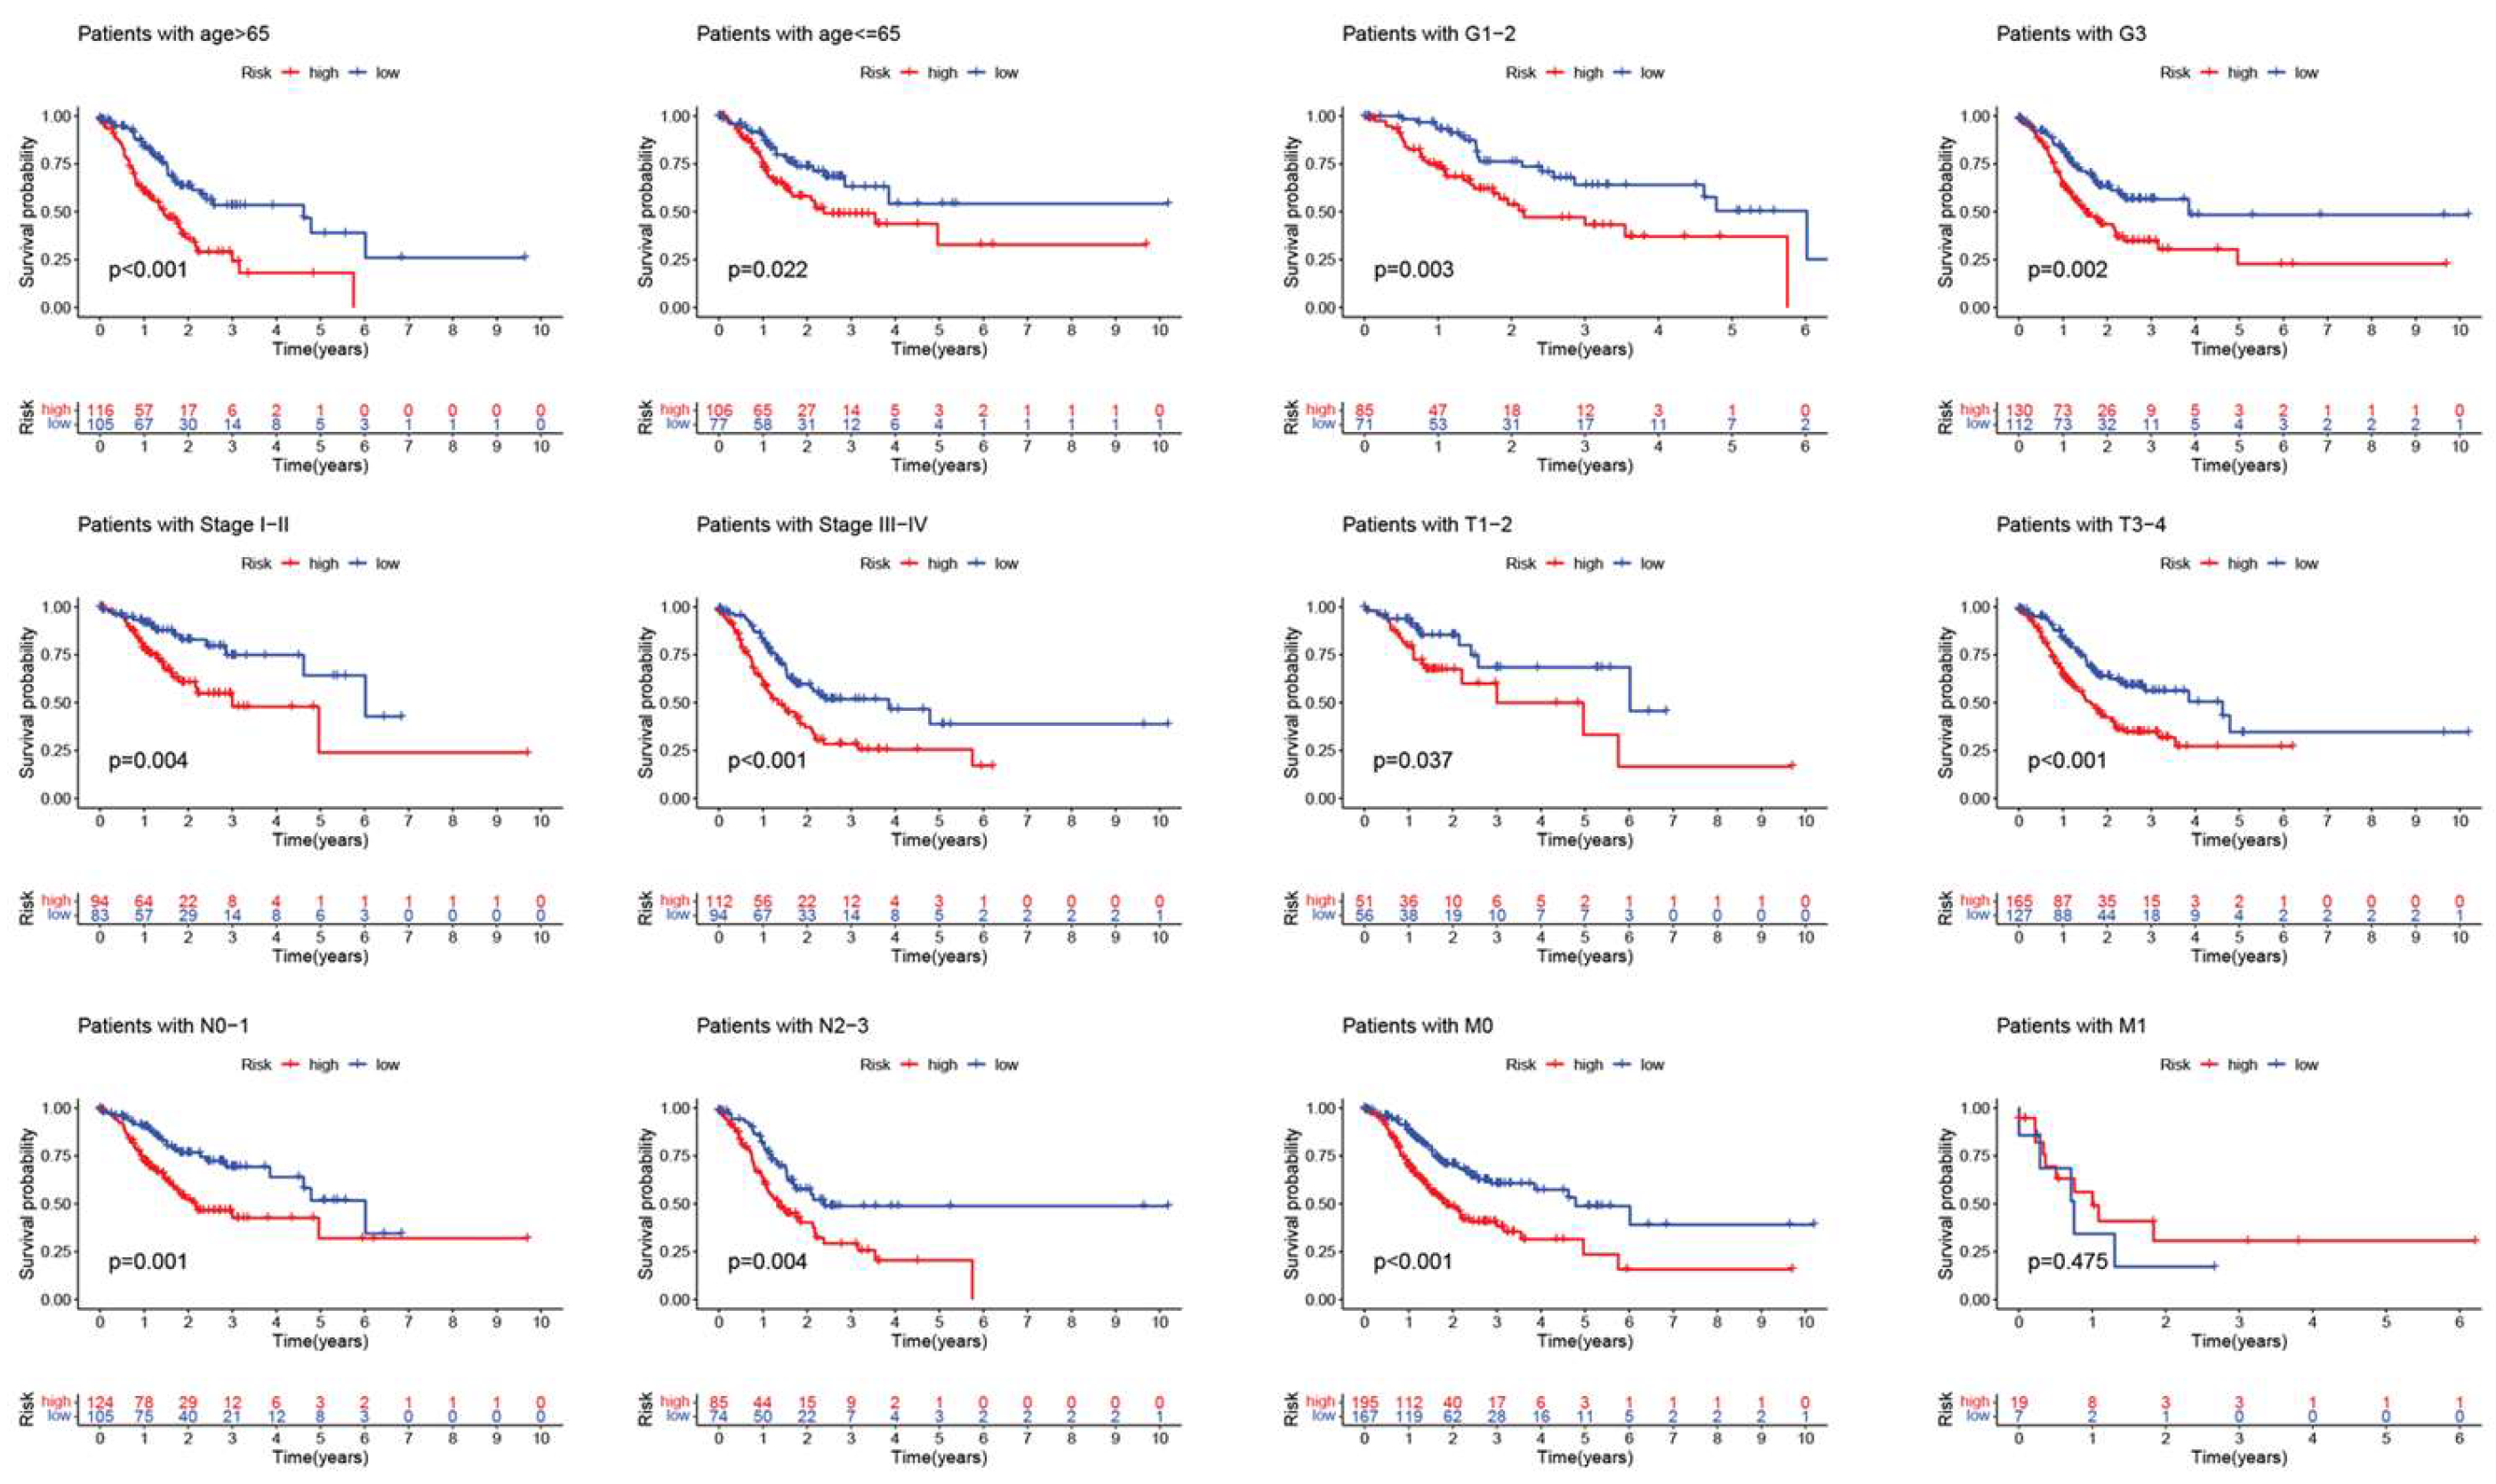
Figure 5.
Risk model nomogram establishment and verification. (A) A nomogram considering clinicopathological variables and risk scores predicts overall survival in STAD.(** p < 0.01; *** p < 0.001). (B) Calibration curves of the nomogram.
Figure 5.
Risk model nomogram establishment and verification. (A) A nomogram considering clinicopathological variables and risk scores predicts overall survival in STAD.(** p < 0.01; *** p < 0.001). (B) Calibration curves of the nomogram.
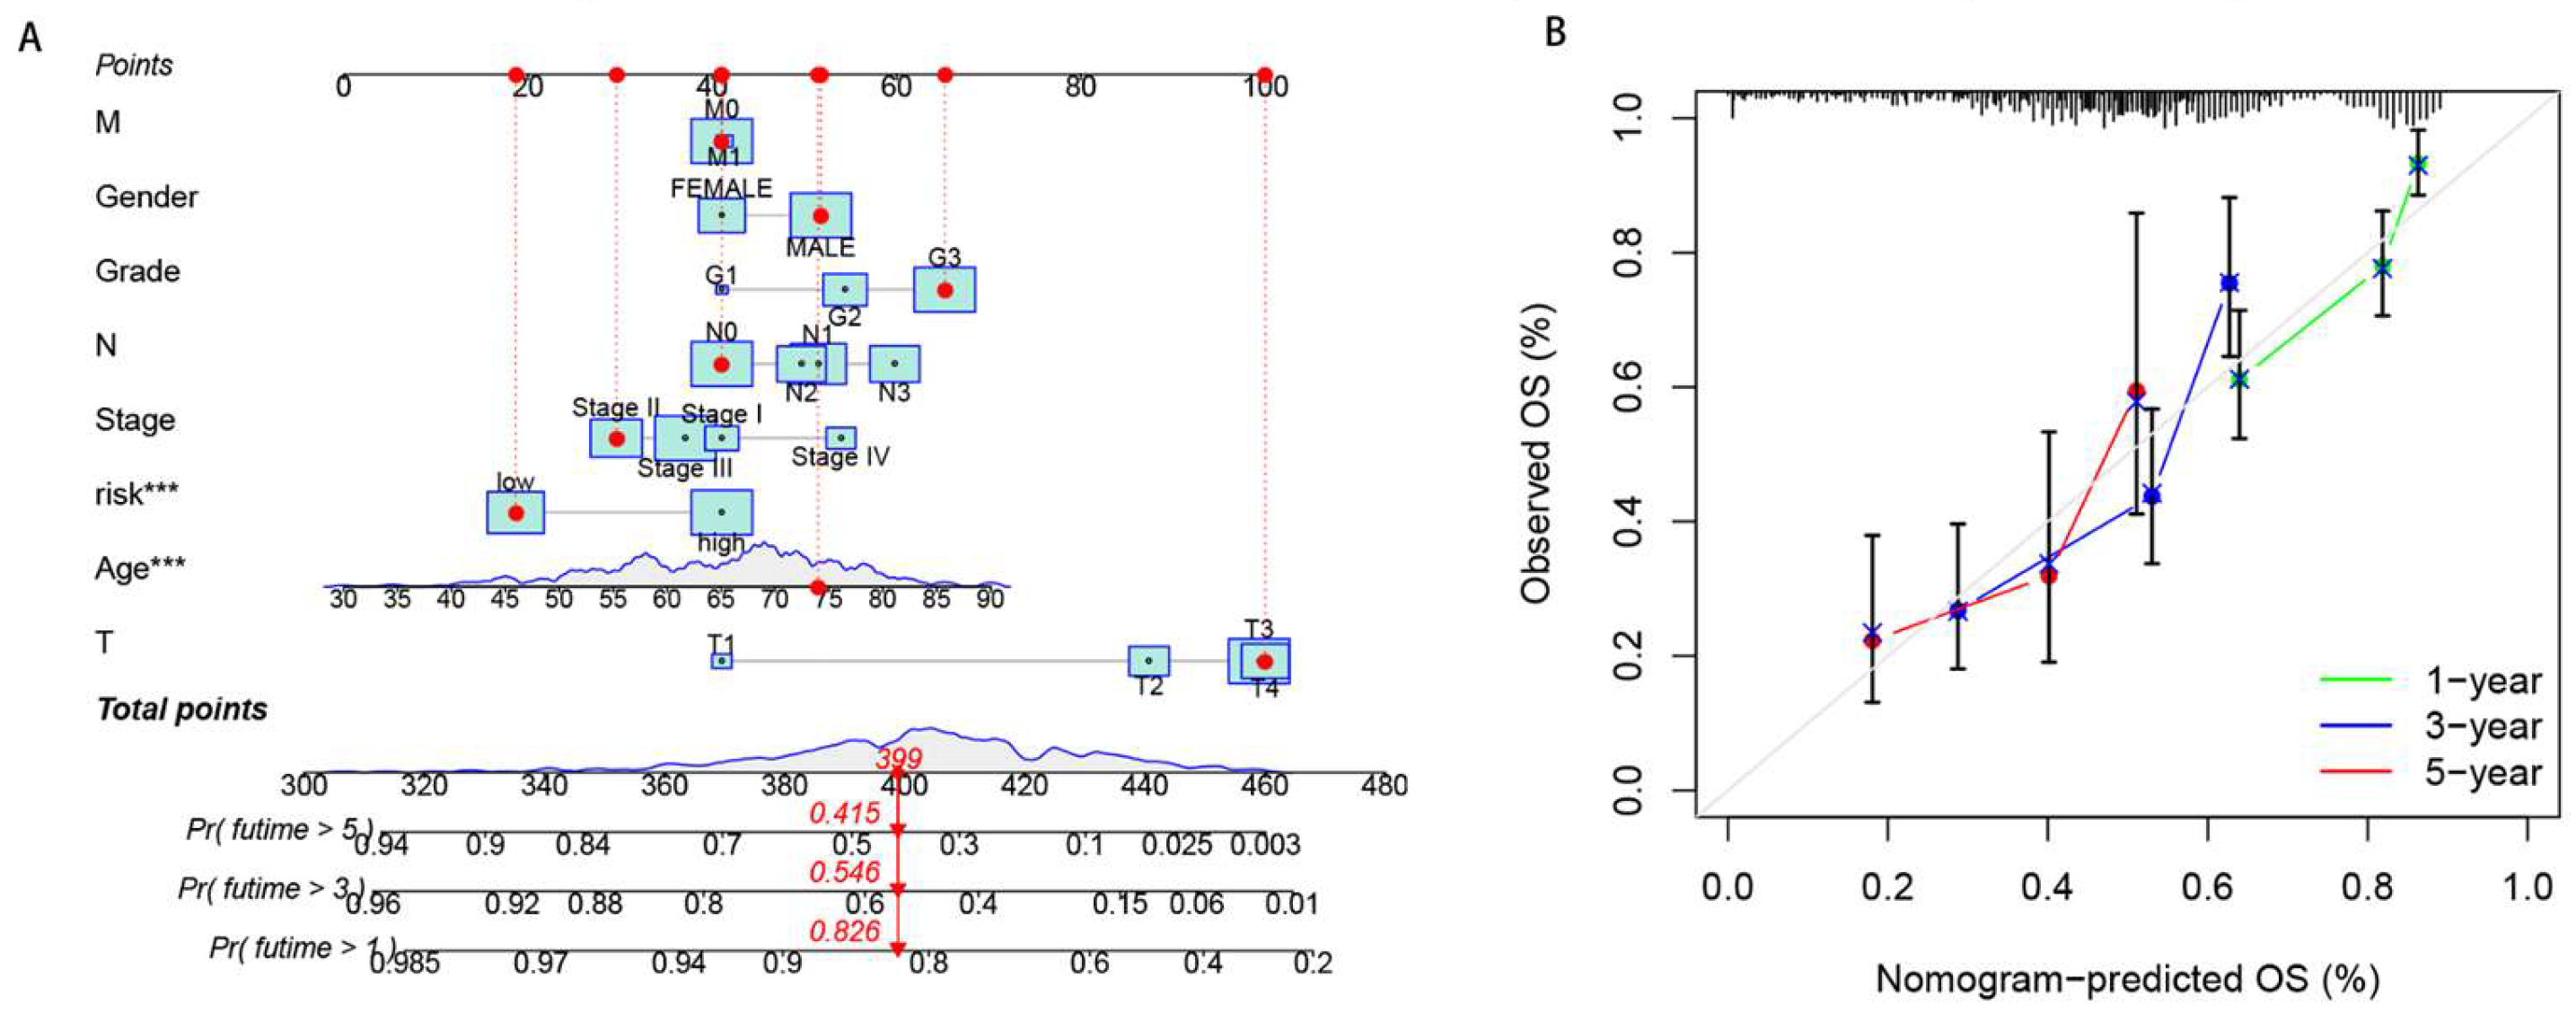
Figure 6.
Functional analysis in the different risk groups. (A,B) GO enrichment analysis. (C,D) GO and KEGG enrichment analysis.
Figure 6.
Functional analysis in the different risk groups. (A,B) GO enrichment analysis. (C,D) GO and KEGG enrichment analysis.
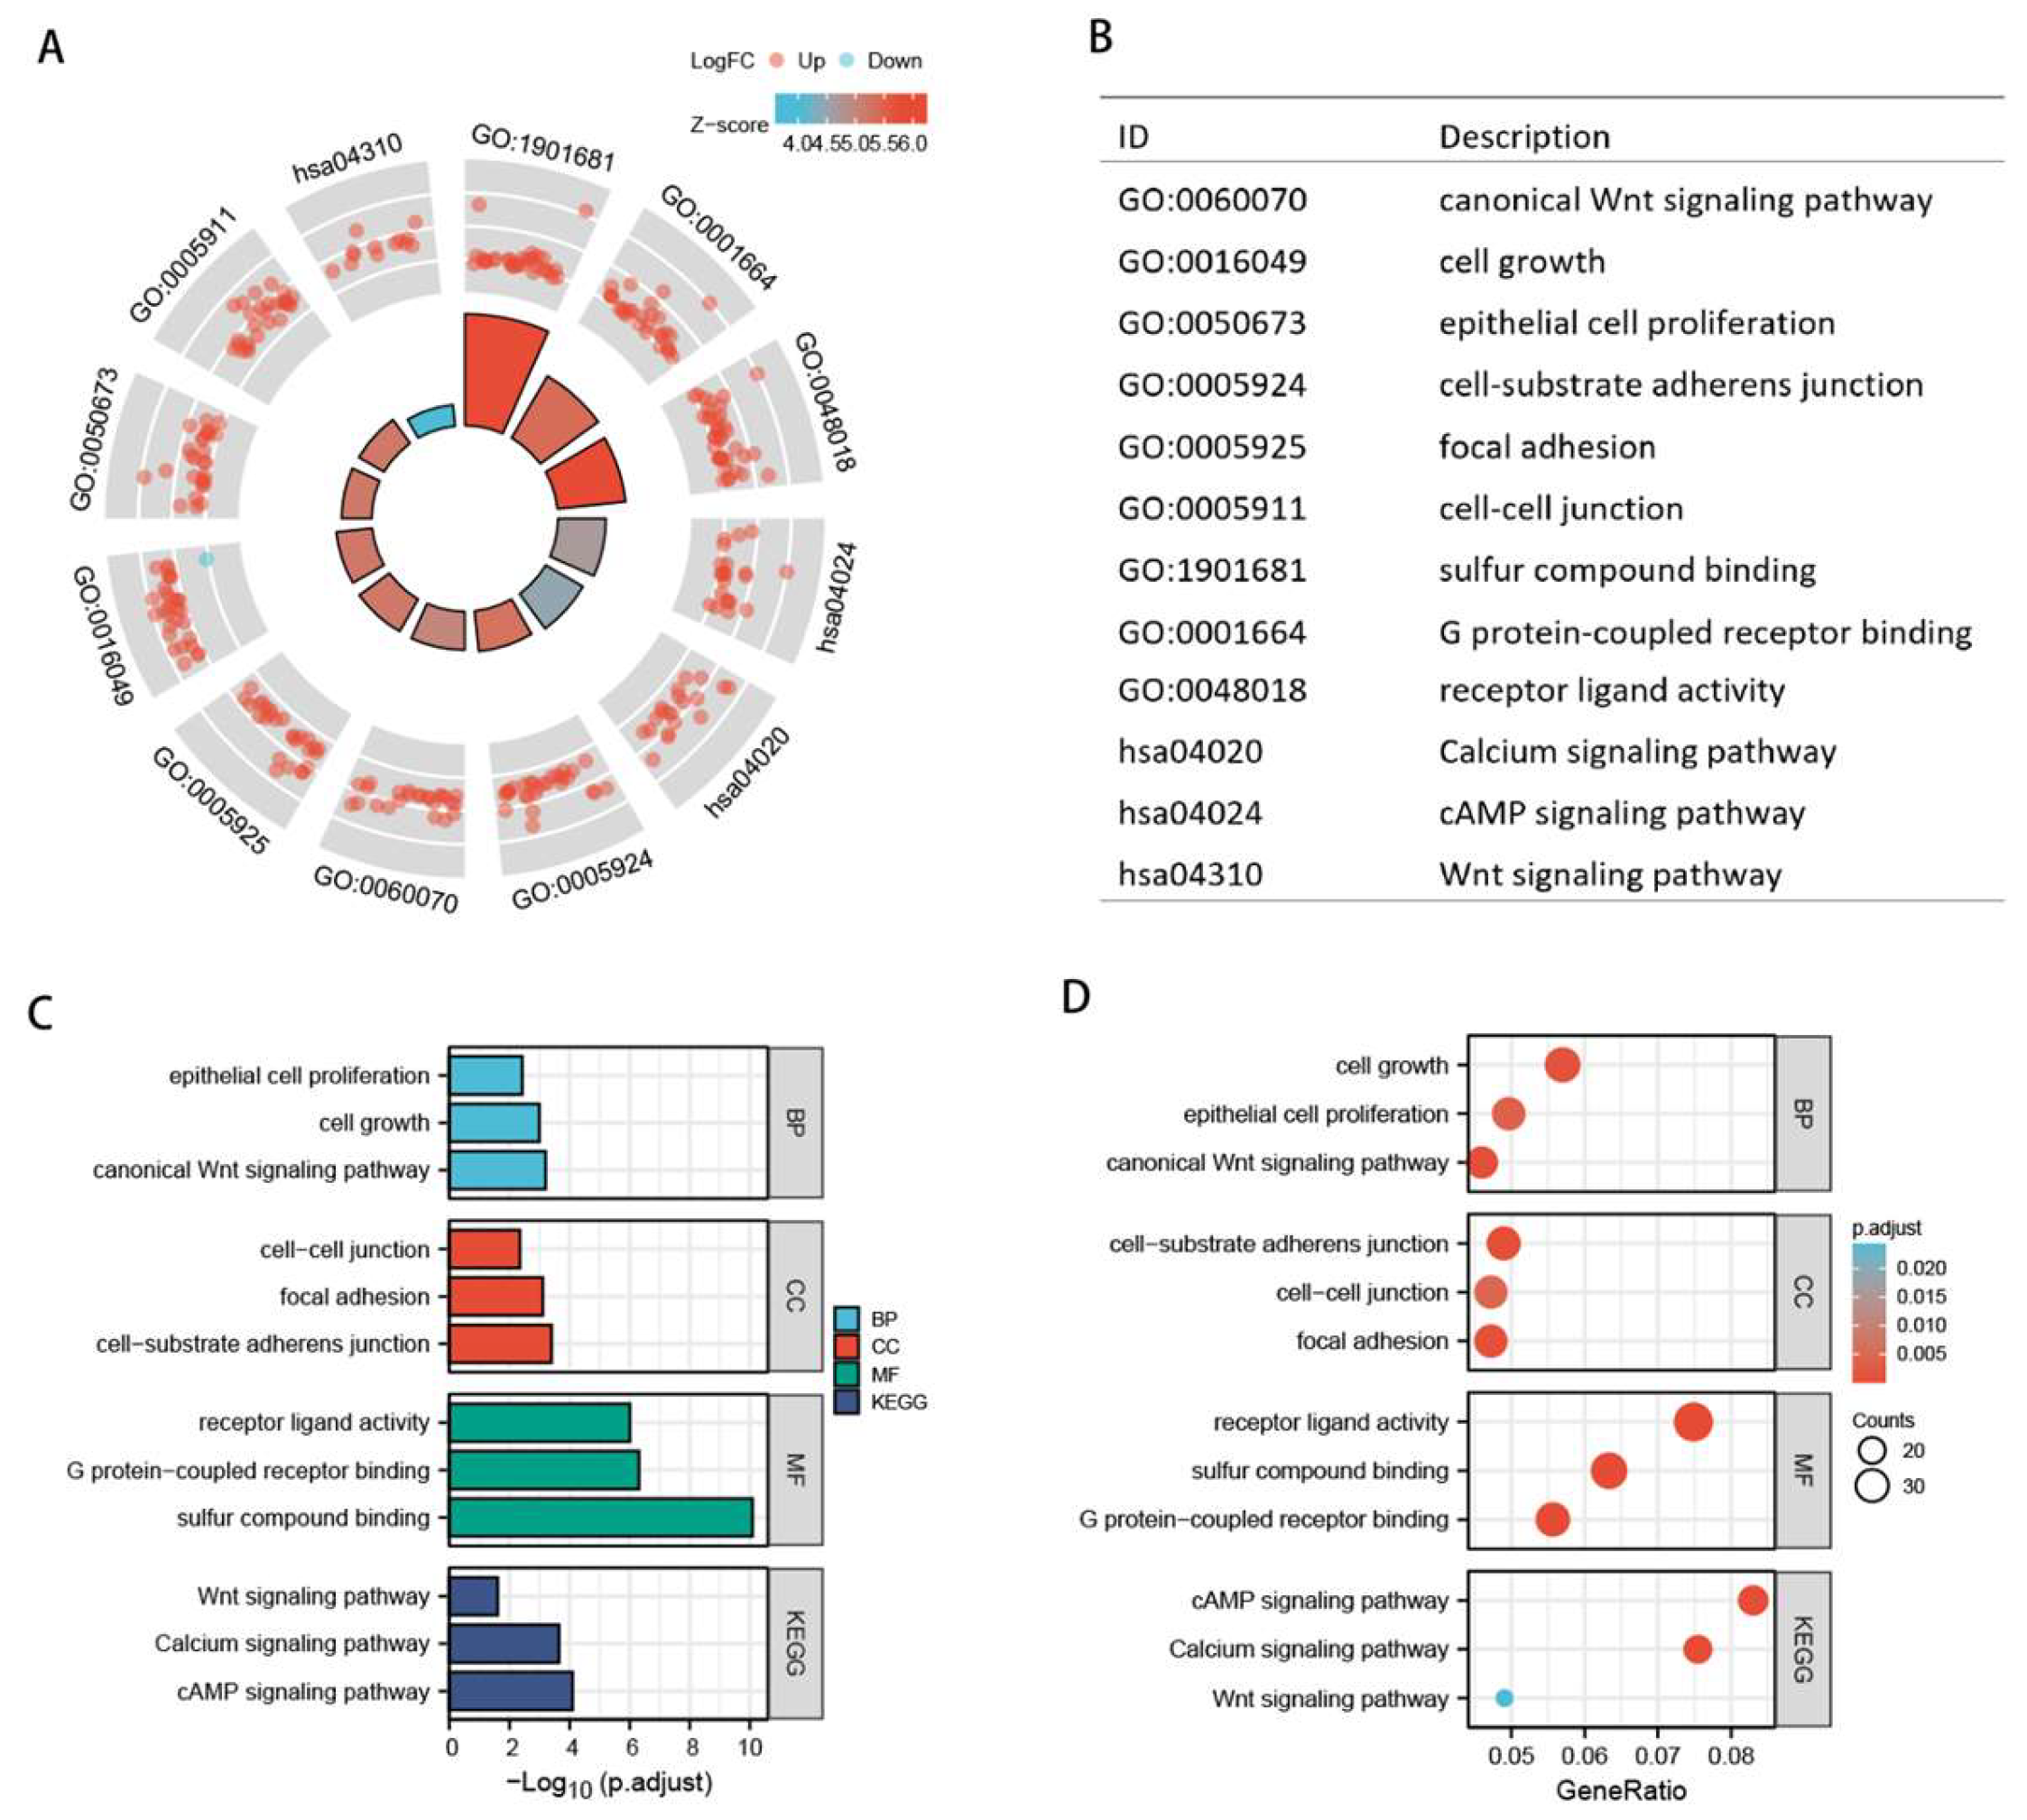
Figure 7.
Analysis of immune infiltration status for patients with STAD. (A) Differences in immune scores, stromal scores and estimate scores between high and low risk groups. (B) Bubble chart of immune components in high and low risk groups based on seven different algorithms. (C,D) Boxplots of differences in immune cells and immune-related functions between high and low risk groups. (E) Boxplot of differences in expression levels of immune checkpoints between high and low risk groups.
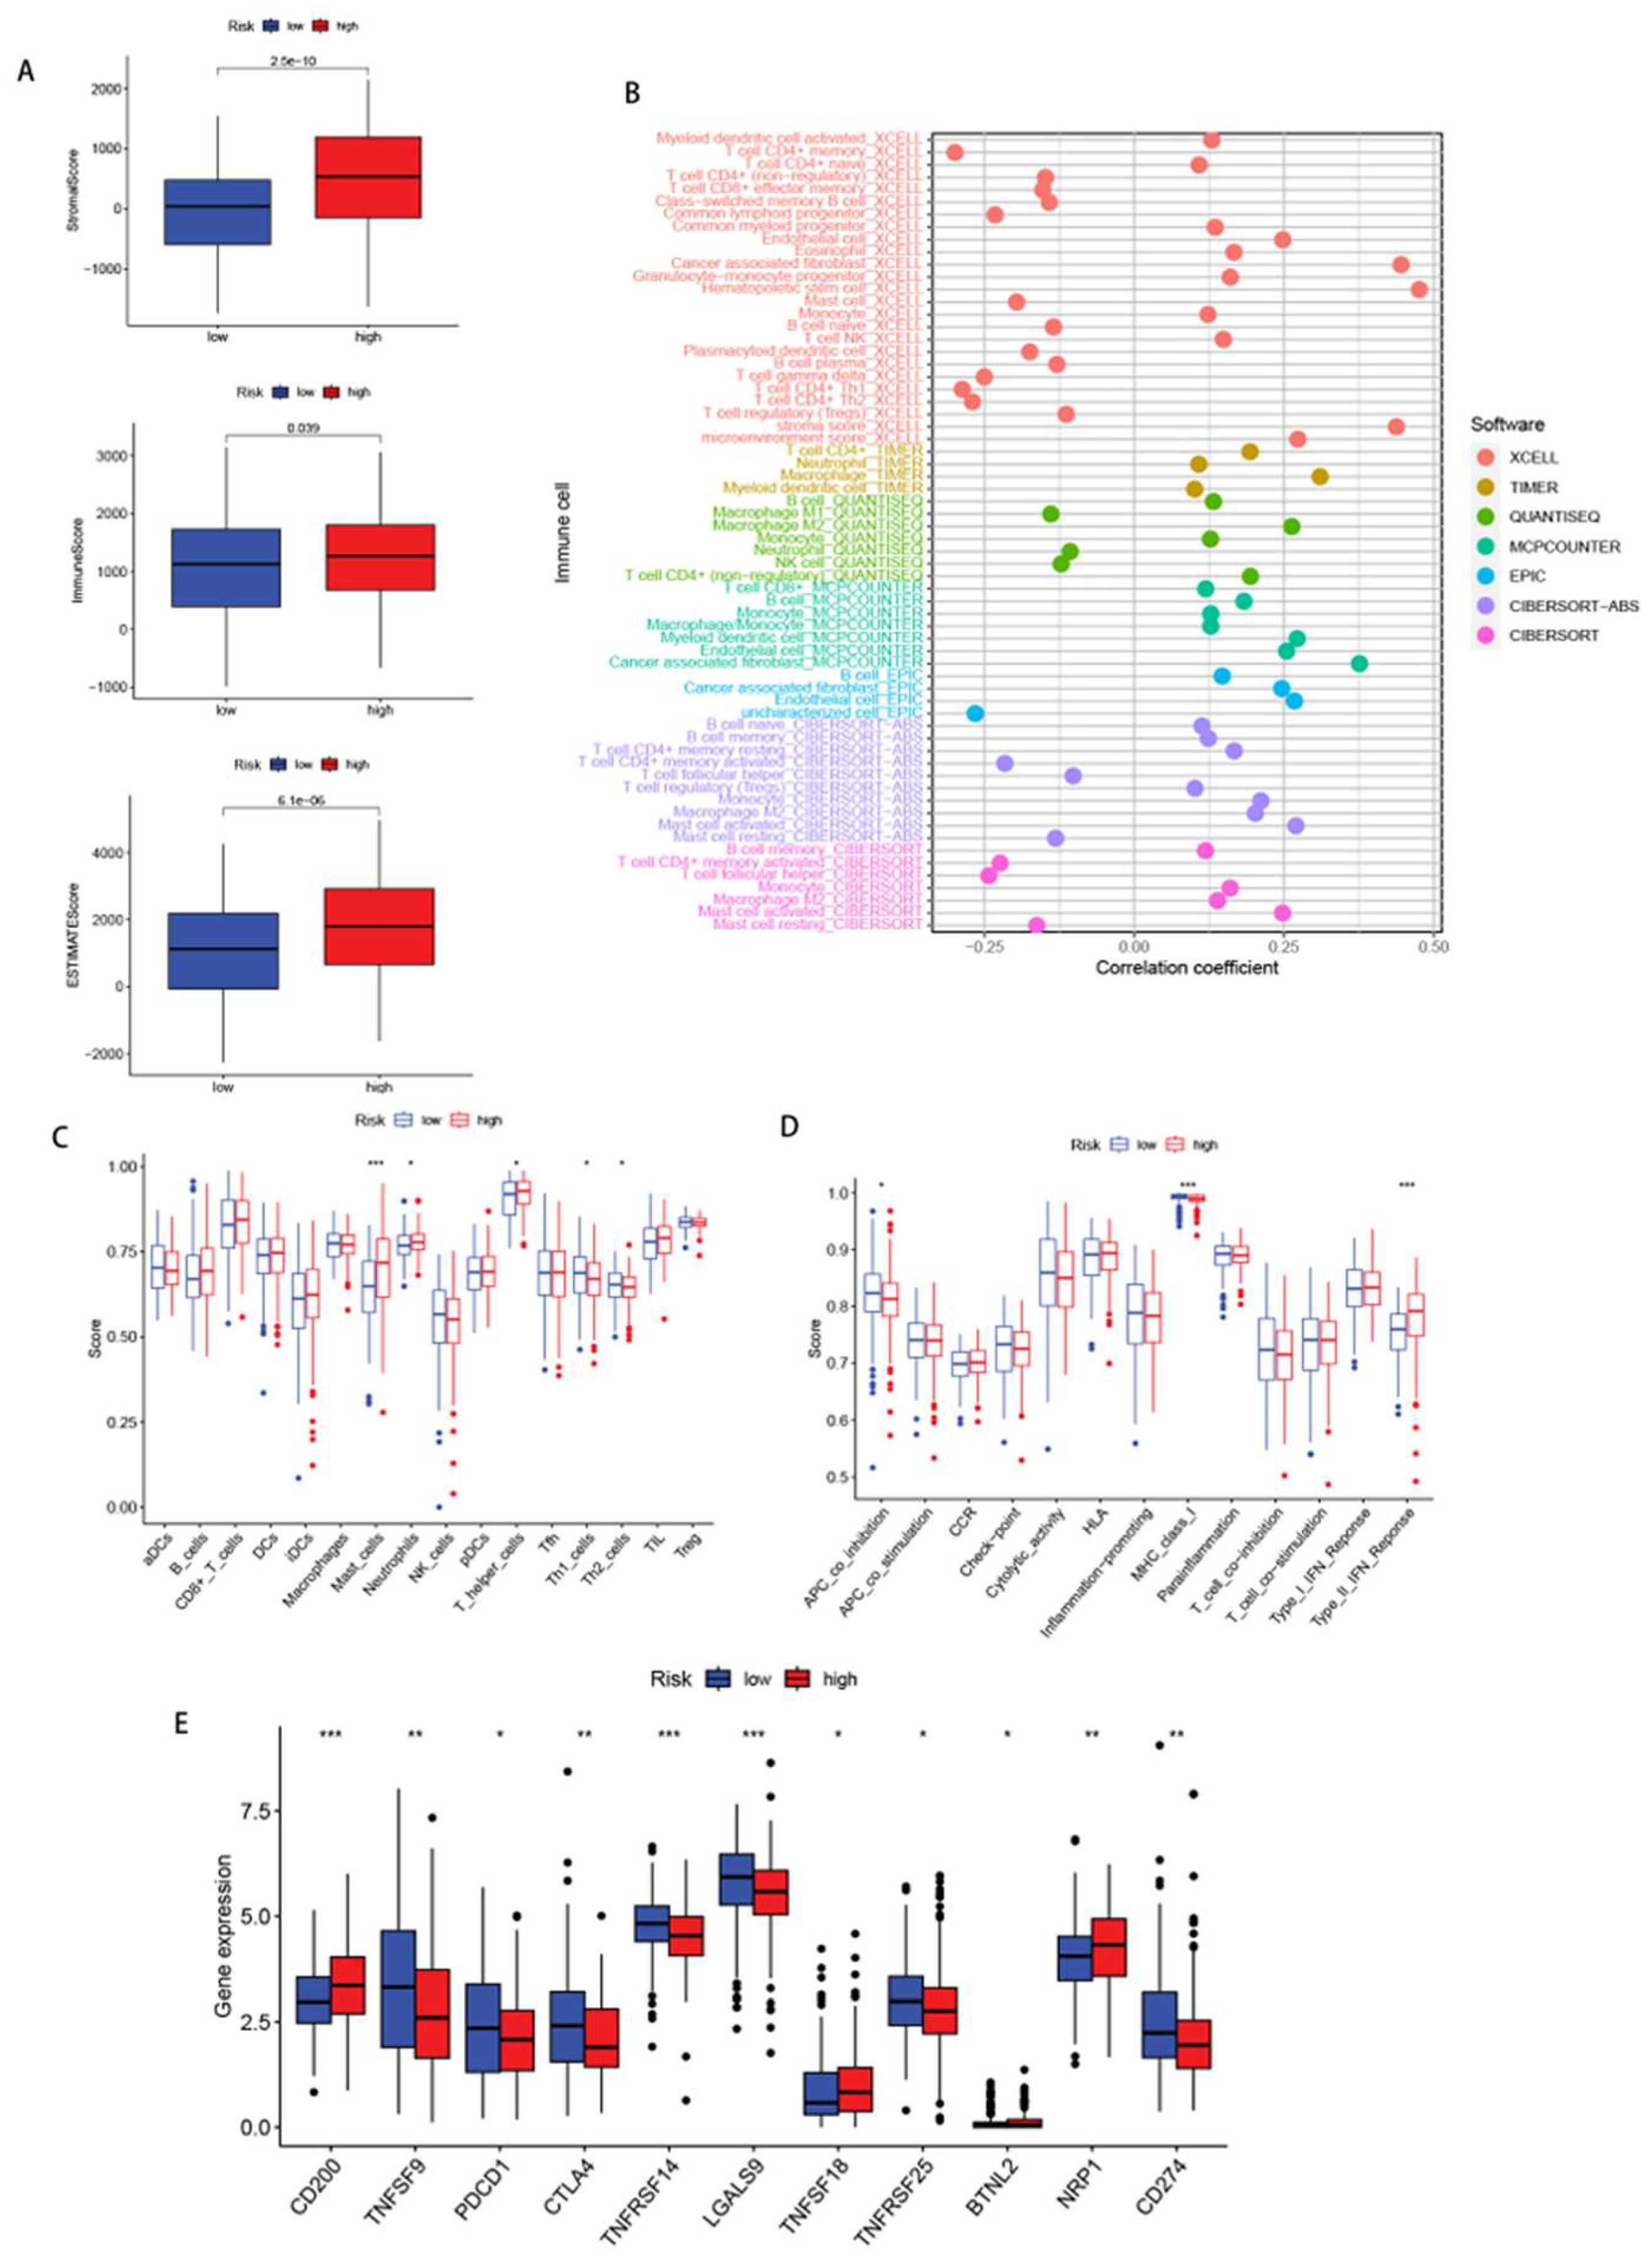
Figure 8.
Analysis of TMB, MSI, TIDE. (A,B)The difference in somatic mutation characteristics between the high- and low- risk groups. (C) Survival curve in the different groups of STAD patients. (D,E) Relationships between risk score and MSI. (F) The difference in TIDE scores between high- and low-risk groups.
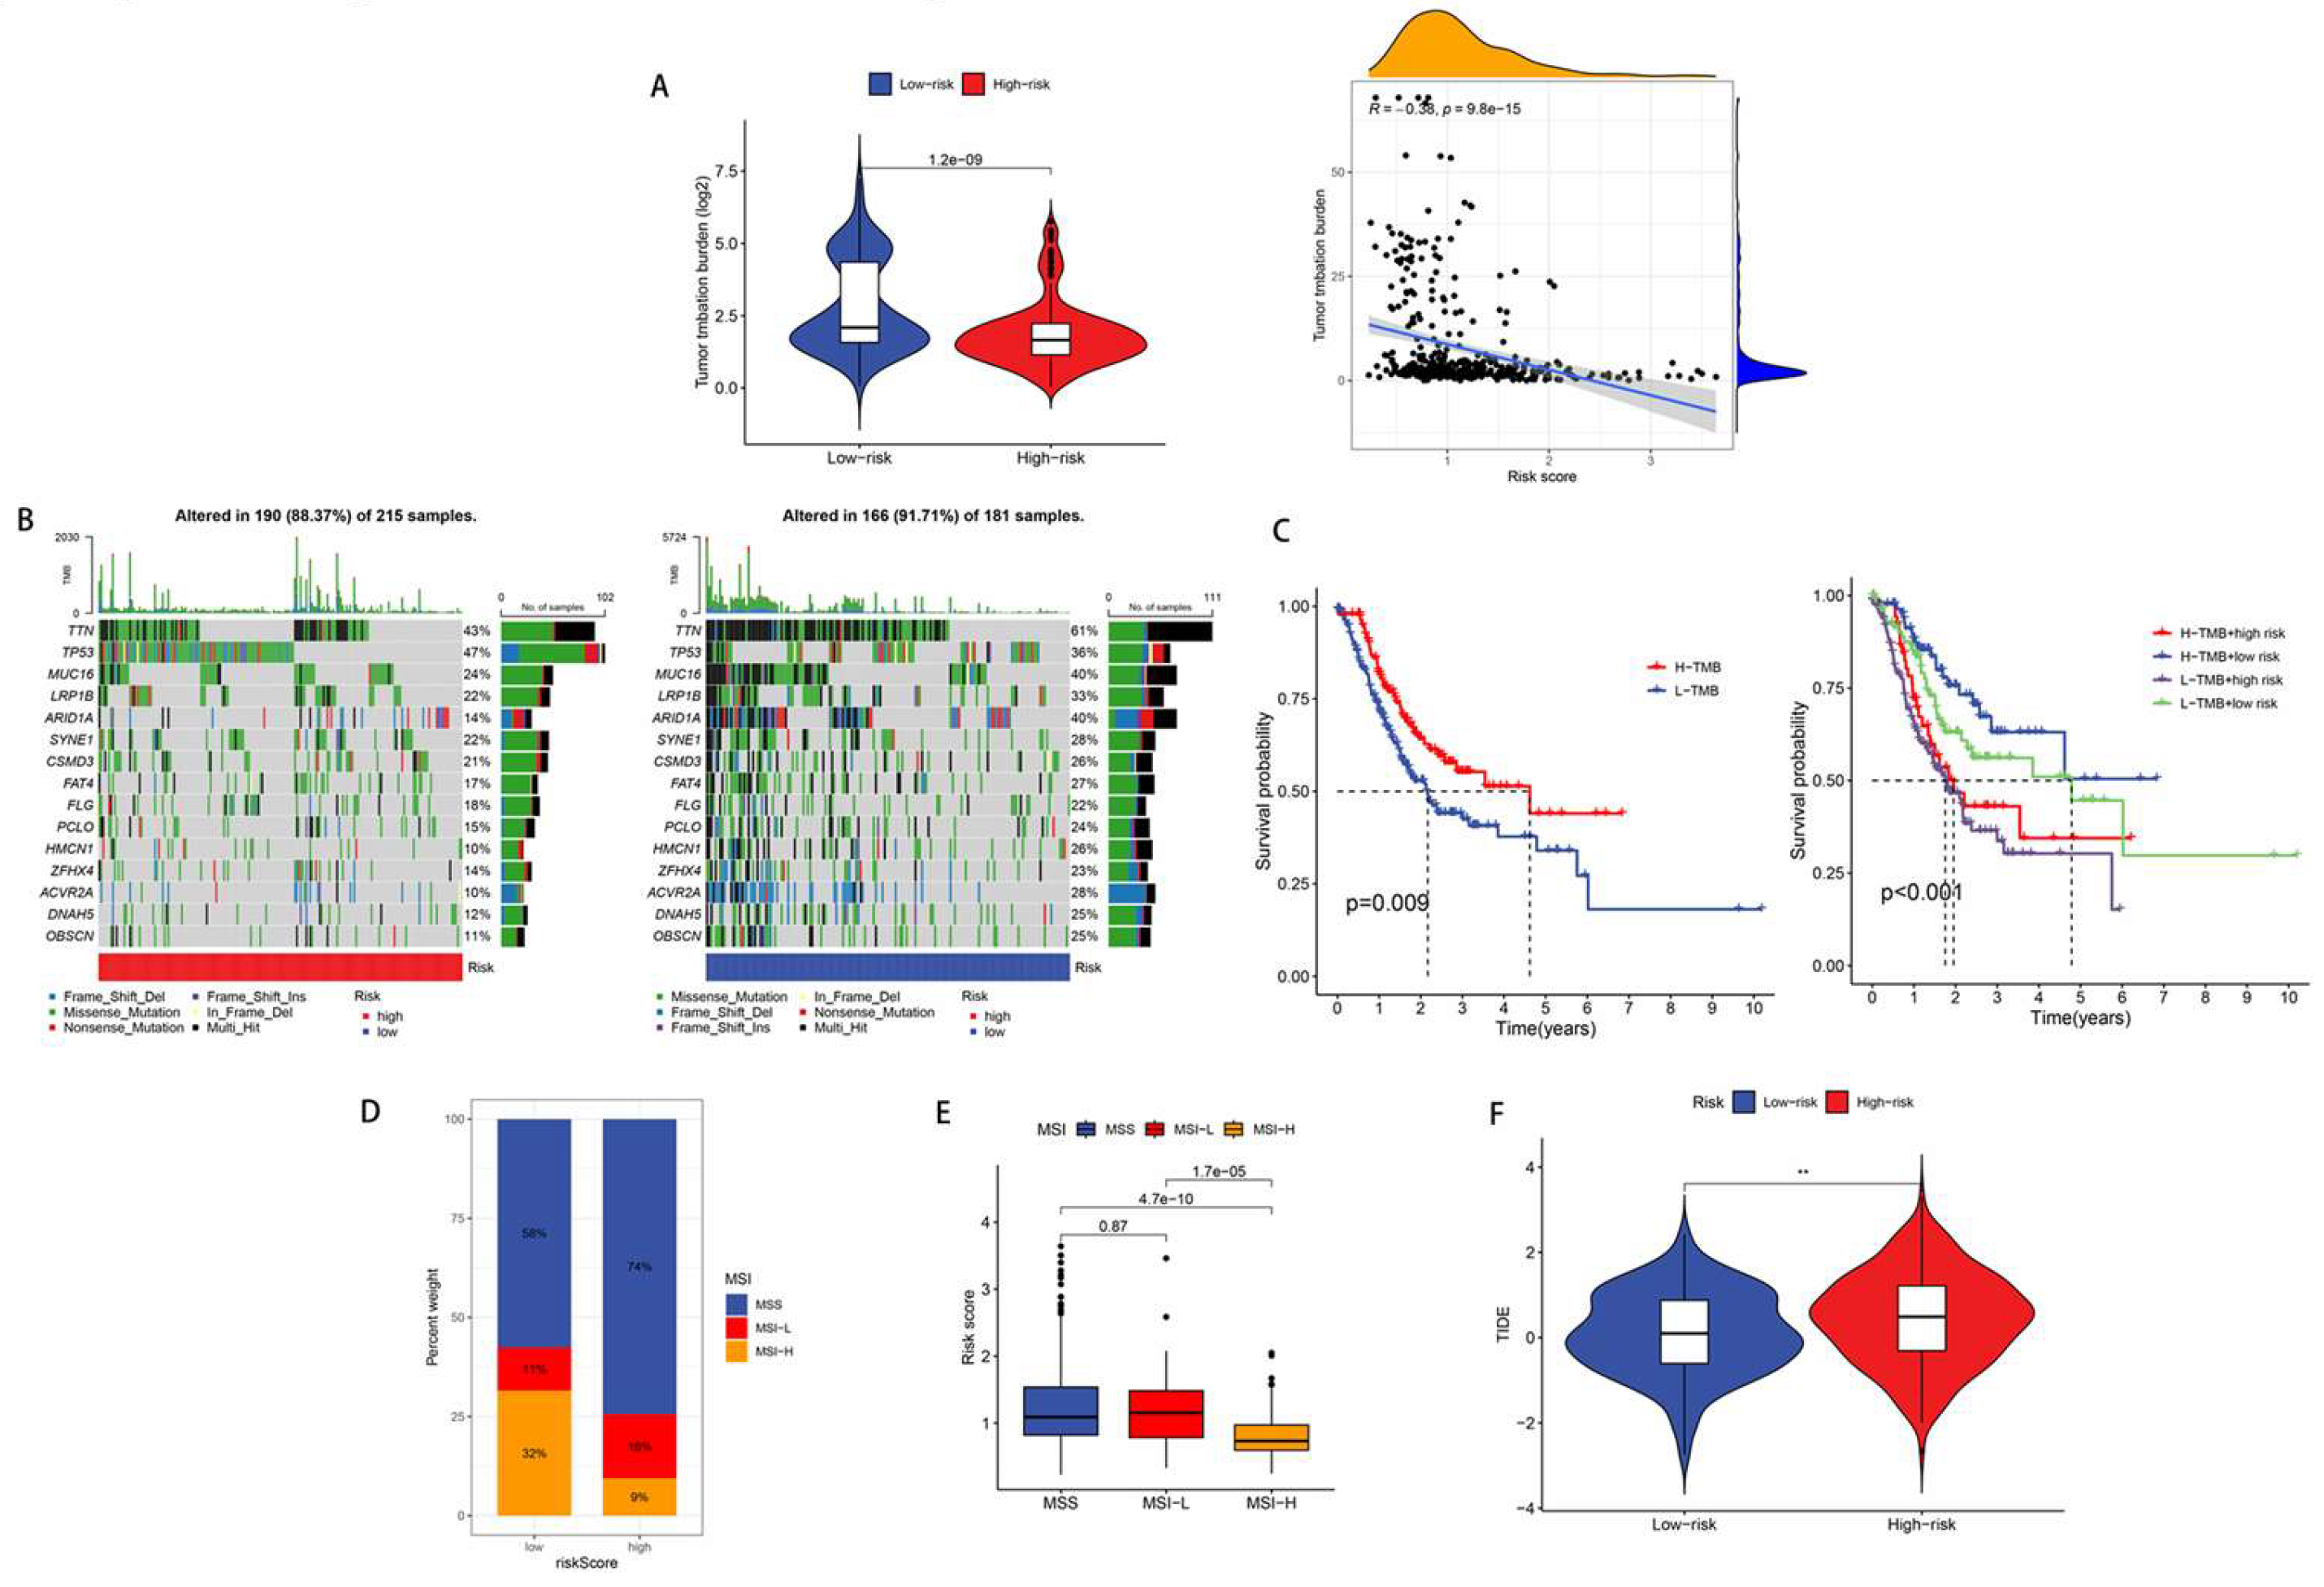
Figure 9.
Drugs with lower IC50 value in the low-risk group.
Disclaimer/Publisher’s Note: The statements, opinions and data contained in all publications are solely those of the individual author(s) and contributor(s) and not of MDPI and/or the editor(s). MDPI and/or the editor(s) disclaim responsibility for any injury to people or property resulting from any ideas, methods, instructions or products referred to in the content. |
© 2025 by the authors. Licensee MDPI, Basel, Switzerland. This article is an open access article distributed under the terms and conditions of the Creative Commons Attribution (CC BY) license (http://creativecommons.org/licenses/by/4.0/).
Copyright: This open access article is published under a Creative Commons CC BY 4.0 license, which permit the free download, distribution, and reuse, provided that the author and preprint are cited in any reuse.


