Submitted:
03 December 2025
Posted:
05 December 2025
You are already at the latest version
Abstract
A spiral spin arrangement with a magnetic unit cell 28 times the size of nuclear one has been reported for the Fe spins below TN = 80 K in bilayered van der Waals gapped FeOCl. In this work, we used neutron magnetic diffraction and ac magnetic susceptibility to reveal a much-reduced magnetic unit cell of 4 times the size of nuclear one for the Fe spins below TN = 119 K, when 27% of non-magnetic Na were intercalated into the van der Waals gaps of FeOCl. X-ray emission spectra and X-ray absorption edge spectra reveal charge transfers from the intercalated Na into the Fe sites that reduce the Fe3+ into Fe2+ ions, giving a significantly larger Fe-O-Fe bond angle that largely strengthens the strength of antiferromagnetic superexchange (AFMSE) coupling over the competing ferromagnetic direct exchange (FMDE) coupling between the two neighboring Fe ions, driving to a higher degree of magnetic symmetry and a significantly higher Neel temperature for the Fe spins in Na0.27FeOCl.
Keywords:
quasi-two-dimensional
; Na-intercalation
; neutron magnetic diffraction
; charge transfer
1. Introduction
Crystallographically layered compounds have recently received considerable attention, because of their distinguished physical properties arising from the quasi-two-dimensional (Q2D) nature. The Q2D nature, resulting from the presence of van der Waals crystallographic gaps, has made this class of materials a good host for accommodating guest molecules. Intercalation of organic or inorganic compounds into layered metal oxychlorides MOCl (where M represents Fe, Ti, V, Cr or In) have been reported by a number of authors [1,2,3,4,5,6,7,8,9,10,11,12]. It is known that the interaction between the intercalated guest molecules and the inorganic host matrix lies on charge transfer between them, which results in partial reduction of the matrix [13,14]. A strongly oxidizing host is the key to a stable intercalation, which provides the driving force for an optimum uptake of guest molecules. Among them, iron oxychloride FeOCl is one of the most promising materials for intercalations of a great variety of molecules owing to its high oxidizing power [15,16,17]. Lithium ion intercalated FeOCl has been used as a cathode for rechargeable lithium batteries [18,19,20,21].
Until recently, studies made on intercalated FeOCl are mostly focused on the electrochemical properties, but less on the magnetic characters. FeOCl crystallizes into an orthorhombic Pmmn symmetry at room temperature [22,23]. Two types of magnetic interactions that appear in FeOCl: ferromagnetic (FM) Fe-Fe direct exchange (DE) coupling between the two neighboring Fe ions, and antiferromagnetic (AFM) Fe-O-Fe superexchange (SE) coupling mediated through the O ions located between the two neighboring Fe ions. In addition, the anisotropic Cl-Fe-O network will give rise to distinct magnetic interaction along each of the three crystallographic directions. Competition between the FMDE and AFMSE couplings in anisotropic Cl-Fe-O network will render a complicated arrangement for the Fe spins. A three-dimensional long-range ordering of the Fe spins in FeOCl develops below 80 K, with a spiral magnetic structure that may be characterized by a propagation vector of (2/7, 1/2, 1/2) marked using the nuclear unit cell [22,23]. A 16% intercalation of polyaniline (C6H4NH) into FeOCl reduces the magnetic structure into a two-dimensional one, demonstrating that the appearance of 16% polyaniline in the van der Waals gaps is sufficient to disrupt the interlayer magnetic interactions in FeOCl [23]. In this article, we report on the observations of a charge transfer that triggers an Fe spin rearrangement together with a large increase in the Neel temperature initiated by intercalation of 27% non-magnetic Na into FeOCl, namely Na0.27FeOCl, studied using neutron diffraction, x-ray emission, and ac magnetic susceptibility measurements. Antiferromagnetic and ferromagnetic couplings were both clearly revealed in Na0.27FeOCl, with the Fe spins coupled into a higher degree of magnetic symmetry than the Fe spins in FeOCl. It is the transfer of electronic charges from the Na ions into the Fe ions that largely strengthens the AFMSE coupling in Fe-O-Fe chains for a simple AFM Fe spin arrangement along the crystallographic a-axis direction and a FM one along the crystallographic b-axis direction in Na0.27FeOCl.
2. Materials and Methods
2.1. Sample Fabrication
The polycrystalline iron-oxychloride FeOCl was prepared by the chemical vapor transport technique [22]. High-purity Fe2O3 and FeCl3 powders with a mole ratio of 1:1.3 were mixed thoroughly before sealed in an evacuated glass tube, followed by heating at 380 °C for 48 hours, then naturally cooling to room temperature that took 24 hours. The resultant product was then washed thoroughly using water-free acetone to remove the excess FeCl3 before the wet-muddy powder was dried at 60 oC in vacuum for 24 hours. The grains in the resultant polycrystalline sample had a lamellar shape, reflecting the anisotropic crystallographic structure of FeOCl. The compound thus obtained was isolated from atmospheric environment at all times to avoid hydration of the compound. Intercalation of Na into FeOCl was achieved by mixing 5.0 g (46.6 mmol) of FeOCl into 100 ml of 3% NaOH solution (75 mmol) in acetonitrile, followed by slowly stirred at 120 rpm for 7 days. The black shiny microcrystalline product was then isolated by filtration, washed with acetone and dried naturally in vacuum.
2.2. Neutron Diffraction
Neutron powder diffraction measurements were conducted at ANSTO, using the cold neutron triple-axis spectrometer SIKA, employing pyrolytic graphite PG(002) crystals at both the monochromator and analyzer positions to select neutrons of wavelength λ = 2.359 Å, with PG filters placed before and after the sample positions to suppress higher-order wavelength contamination. For these measurements, ~10 g of the sample was loaded into a cylindrical vanadium-can, which produces no detectable neutron diffraction peak. The sample temperature was controlled using a He-gas closed-cycle refrigerator.
2.3. X-Ray Emission Spectroscopy (XES) and X-Ray Absorption Edge Spectrum (XAS)
The x-ray emission spectrum were conducted at SPring-8, Japan, using the Taiwan beamline BL12XU, employing a pair of Si(111) mirrors to define the energy of incident photons, a toroidal mirror to focus the beam into a spot size of 120 (horizontal) × 80 (vertical) μm2 at the sample position, and a 1-m bent Si(531) crystal with a solid-state detector to analyze the Fe Kβ(3p→1s) emission lines. The high-resolution X-ray absorption edge spectrum (XAS) were performed in the partial fluorescence yield (PFY) mode, by collecting the intensity at the maximum of the main peak of the Fe-Kβ emission line, when scanning the incident energy across the Fe-K edge.
2.4. AC Magnetic Susceptibility
The alternating current (ac) magnetic susceptibility was measured using a Physical Property Measurement System, manufactured by Quantum Design, employing the standard set up, with and without the presence of an applied magnetic field Ha. The magnetic response of the compound to the driving ac magnetic field was detected using two identical sensing coils connected in opposition. For these measurements, ~1 g of the sample was loaded into a non-magnetic cylindrical container. A pumped 4He cryostat was used to cool the sample and the lowest temperature achieved was 1.8 K.
3. Results
3.1. Crystalline Structure
It is known that FeOCl crystallizes into an orthorhombic Pmmn symmetry at room temperature [23]. The main focus in the structural study for the present Na-intercalated FeOCl is to determine the amount of Na ions that is intercalated into the crystallographic gaps and the changes in the gap separation. The neutron diffraction pattern taken at 130 K was analyzed using the General Structure Analysis System (GSAS) program [24], following the Rietveld profile refining method [25]. The refinements were carried out assuming an orthorhombic symmetry with a space group Pmmn and coherent scattering amplitudes of 0.954, 0.581, 0.958, and 0.363 ×10⁻¹² cm for Fe, O, Cl, and Na, respectively. All atom locations, occupation numbers, and lattice parameters were allowed to vary simultaneously. Figure 1 displays the observed (crosses) and fitted (solid lines) neutron diffraction patterns, taken at 130 K, with their differences plotted at the bottom. Clearly, the observed pattern may be described very well by the proposed orthorhombic Pmmn symmetry. All but Na sites are essentially fully occupied, with a Na composition of 0.27 to locate in the gap at (3/4 1/4 -0.5870), giving chemical compositions of Na0.27FeOCl for the compound (Table 1). An axial lattice constant of c = 11.351 Å was obtained for the Na0.27FeOCl at 130 K, which is 44% longer than the c = 7.9085 Å obtained for FeOCl at room temperature [23]. The crystalline structure of FeOCl may be viewed as a stacking of charge-neutral Q2D (Fe2O2Cl2)n lamellas, where the adjacent lamellas are weakly bonded via van der Waals interactions, as shown in Figure 2. The basic (Fe2O2Cl2)n lamellas consist of edge-sharing distorted FeCl2O4 octahedrons, with the Cl layers outermost on either side of a central (FeO)2 bilayer, forming a bilayered Q2D Fe-O-Fe network (designated as the basial a-b plane), while the network along the axial c-axis direction is interconnected by two weakly bonded Cl layers. The Na ions connected to the Cl ions to appear in the gap.
3.2. Charge Transfer
Two distinct peaks at 7045 and 7060 eV are clearly revealed in the X-ray emission spectra that link to the Fe-Kβ line of FeOCl (solid line in Figure 3a) and Na0.27FeOCl (dashed line in Figure 3a). These spectra were normalized in intensity to their maxima. The Fe-Kβ spectral lines of FeOCl and Na0.27FeOCl are nearly identical show that the high-spin state of Fe in FeOCl is retained upon intercalation of Na. The Fe-Kβ line is known to be associated with the radiative 3p to 1s decays, following the creations of 1s core holes. Its spectral line shape is a direct result of the superimposition of two multiplet groups originating from the exchange interaction between the 3p core-hole and the moment of the open 3d shell [26,27]. The two spectral lines observed correspond to the main Kβ1,3(3p to 1s) line at 7060 eV and the satellite line Kβ on the lower photon-energy side at 7045 eV. The energy splitting between these two peaks is given by J×(2S+1) and their intensity ratio by S/(S+1), where J is the 3p-3d exchange integral and S the total spin of the 3d orbital [28]. The relative intensity and energy of the Fe-Kβ structure reflect therefore directly the local magnetic moment. A slightly higher intensity of the satellite Kβ line for the Na0.27FeOCl than for the FeOCl (inset to Figure 3a) reveals that the intercalation of Na into FeOCl transfers charges to the Fe ions from apparently the Na ions. An alternation to the magnetic state of the Fe ions through reduction of the Fe3+ ions into Fe2+ ions can then be anticipated. A substantial shift in the spectral lines and intensities of the PFY-XAS spectra towards lower photon energies is clearly revealed for the Na-intercalated FeOCl, where both spectral lines of the Fe-K edge of Na0.27FeOCl appear at slightly but noticeably lower photon energies than those of FeOCl (Figure 3b). The K edge of transition metals is known to contain both structural and electronic information [29]. No structural modification of the FeOCl bilayer was found upon Na intercalation, suggesting that the observed spectral modifications are mainly of electronic origin. The shift of the Fe-K edge spectrum towards lower-photon energies upon Na-intercalation agrees with the reduction of the Fe3+ sites expected from shift of charge from Na sites to Fe sites.
3.3. Magnetic Transition
Direct comparisons between the temperature profiles of the in-phase component χ‘ of the ac magnetic susceptibility of Na0.27FeOCl (open circles) and FeOCl (open triangles) are shown in Figure 4a, where the solid lines indicate the results of fits of the data at high temperatures (> 150 K) to Curie-Weiss law χ‘ = C/(T-Cλ) where C is the Curies constant that proportional to the conduction electron density, and λ is the Weiss molecular field constant. The main features seen are: (1) A Curie constant of C = 0.144(2) emu-K/g-Oe was obtained from the fits for Na0.27FeOCl, which is 12 times larger than the C = 0.012(1) emu-K/g-Oe for FeOCl, revealing that the intercalation of 27% Na into FeOCl giving rise to a 12 times increase for the conduction electron density; (2) Negative values of λ = -965 g-Oe/emu was obtained for Na0.27FeOCl and λ = -4500 g-Oe/emu for FeOCl, showing AFM couplings dominating over FM couplings in both compounds; (3) χ‘(T) of both Na0.27FeOCl and FeOCl depart from the Curie-Weiss behavior at low temperatures, indicating the appearance of magnetic correlations that link to the ordering of Fe spins; (4) χ‘(T) of Na0.27FeOCl departs from the Curie-Weiss behavior at TN = 120 K, which is significantly higher than the TN = 80 K for FeOCl; (5) The values of χ‘ of Na0.27FeOCl in the paramagnetic state are substantially higher than those of FeOCl at all temperatures studied, showing intercalation of Na gives rise to a higher conduction electron density for Na0.27FeOCl [30]; (6) A peak appears in the χ‘(T) of Na0.27FeOCl, which shifts to a lower temperature at the appearance of an applied magnetic field (Figure 4b), revealing an antiferromagnetic character for the Fe ions in Na0.27FeOCl; (7) χ‘ of Na0.27FeOCl and FeOCl increasing on further cooling to lower temperatures in the magnetic state, showing the existence of a ferromagnetic component for both compounds. Remarkably, intercalation of 27% non-magnetic Na into FeOCl strongly enhances metallic character and largely strengthens the antiferromagnetic correlations between the Fe ions to increase TN by as much as 50%.
3.4. Spin Arrangement
At a temperature well above any magnetic ordering temperature, the spins of the unpaired electrons scatter neutrons incoherently, so that the magnetic scattering appears as paramagnetic background in a powder diffraction pattern. When the magnetic correlations develop, as the temperature is reduced, the magnetic scattering develops into magnetic Bragg peaks. Figure 5 shows the magnetic diffraction pattern at 10 K, where the diffraction pattern taken at 130 K, serving as the non-magnetic background, has been subtracted to isolate the magnetic signals. This difference pattern reveals several resolution-limited peaks that developed as the temperature is reduced from 130 to 10 K, originated from long range ordering of the Fe spins. These magnetic peaks can be indexed, based on the nuclear unit cell, with half-integer Miller’s indices for the basal a-axis and axial c-axis crystallographic directions but integer for the basal b-axis crystallographic direction, revealing that the magnetic unit cell doubles the nuclear one along the a-axis and c-axis directions, but is the same along the b-axis direction. The spin configuration that fits best to the observed pattern is illustrated in Figure 6. This proposed magnetic structure may be viewed as consists of ferromagnetic chains along the b-axis direction that are coupled antiferromagnetically along the a-axis direction, with the moments between the neighboring layers are mutually perpendicular. The solid curves in Figure 5 indicate the calculated diffraction pattern based on the proposed magnetic structure shown in Figure 6 with a magnetic moment of <μZ> = 3.62(3) μB at 10 K for the Fe spins. The calculated pattern agrees reasonably well with the observed one.
Intensities of the (1/2 0 1) (Figure 7a) and (1/2 0 3/2) (Figure 7b) magnetic peaks decrease progressively upon warming. They reveal typical order-parameter curves obtained on powdered samples to see thermal reductions of the magnetic order parameter (grey shaded regions in Figure 7) and intensity fluctuations near transition temperature (yellow shaded regions in Figure 7). It is known that magnetic intensity Im proportional to the square of magnetization M. The Im(T) curve hence measures the thermal variations of the square of the magnetic order parameter M. The solid curves in Figure 7 indicate the results of the fits of the Im in the grey shaded region to Im=IB+I0{1-(T/TN)}2β, where IB is the background intensity, I0 is the saturated magnetic intensity, TN is the Neel temperature, and β is the critical exponent of the magnetic transition. The TN and β obtained from the (1/2 0 1) and (1/2 0 3/2) magnetic intensities agree very well, giving TN = 119(1) K and β = 0.25(4) for Na0.27FeOCl. The TN = 119(1) K obtained from magnetic intensities matches very well to the temperature at which χ‘(T) departs from the Curie-Weiss behavior (Figure 4a). The TN = 119(1) K obtained for Na0.27FeOCl is 50% higher than the TN = 80 K of FeOCl [23]. Remarkably, an intercalation of 27% non-magnetic Na into the van der Waals gaps of FeOCl largely strengthen the strength of magnetic interaction by as much as 50%. The β = 0.25 obtained for Na0.27FeOCl is considerably smaller than the β = 0.34 of ferromagnetic Fe, revealing the appearance of a non-ferromagnetic magnetic component in Na0.27FeOCl and the thermal reduction rate to the magnetic order parameter of AFM Na0.27FeOCl is even smaller than the pure FM Fe.
4. Discussion
Intercalation reaction of 27% Na into the van der Waals gaps of FeOCl results in a 44% increase of the axial c-axis lattice constant, while no significant change is observed in the a- and b- axis lattice constants. Two types of magnetic couplings between the Fe spins in Na0.27FeOCl may be anticipated, a ferromagnetic direct exchange coupling between two neighboring Fe eg orbitals, and an antiferromagnetic superexchange coupling between two Fe half-filled t2g orbitals mediated through the O p orbitals located between them [31]. The moment directions of the neighboring spins along the a-axis direction in FeOCl have been found to be 2×360º/7≈102.85º apart [23]. Interaction of 27% Na into FeOCl results in a 27% enlarged Fe-O-Fe bond angle (from 103.5º to 131.5º) together with an 8% longer Fe-Fe separation (from 3.2992 Å to 3.5526 Å) along the a-axis direction, which give rise to a stronger antiferromagnetic coupling so that the neighboring spins along the a-axis direction in Na0.27FeOCl becoming antiparallel. On the other hand, the Fe-O-Fe bond angle and the Fe-Fe bond length along the b-axis direction are smaller in Na0.27FeOCl than in FeOCl, which results in a ferromagnetic arrangement of the Fe spins along the b-axis direction. The coupling along the c-axis direction is crystallographically separated into intrabilayer and interbilayer interactions. The intrabilayer interaction is similar to that along the a-axis direction, while the interbilayer coupling is dominated by the dipolar interaction, since neighboring bilayers are bonded via van der Waals interactions, rendering superexchange interaction insignificant. Apparently, the spiral magnetic structure of the Fe spins along the crystallographic a-axis direction in FeOCl reduces to a simple antiferromagnetic arrangement in Na0.27FeOCl. On the other hand, spiral three-dimensional magnetic structure for the Fe spins in FeOCl reduces into a two-dimensional one as 16% polyaniline (C6H4NH) are intercalated into FeOCl [23].
5. Conclusions
It is known that the magnetic structure of the Fe spins in layered iron oxychloride FeOCl is characterized by a propagation vector of (7/2 1/2 1/2) to reveal a spiral spin arrangement along the crystallographic a-axis direction from the appearance of strong competition between the AFMSE and FMDE couplings in the zig-zag Fe-O-Fe-O-Fe-O chains. Intercalation of Na into the van der Waals gaps provides addition electrons shifted into the Fe-sites, reducing partially the Fe3+ into Fe2+ that enlarge the Fe-O-Fe bond angle to a stronger AFMSE coupling but a weaker FMDE coupling. Apparently, a 27% Na-intercalation is enough to rearrange the spiral spin arrangement into a simple antiferromagnetic one in the crystallographic a-axis direction, and enhance the Neel temperature from 80 K for FeOCl into 119 K for Na0.27FeOCl.
Author Contributions
W.H.L. and T.Y.Y. designed the study; T.Y.Y., Y.C.H. and K.Y.L. synthesized the samples; T.Y.Y., C.M.W., Y.C.H., K.Y.L. and W.H.L. performed the measurements; T.Y.Y., Y.C.H., K.Y.L. and C.M.W. analyzed all of the data; all of the authors discussed the results; W.H.L. and T.Y.Y. wrote the manuscript with discussion and input from all of the authors. All authors have read and agreed to the published version of the manuscript.
Funding
This work was funded by National Atomic Research Institute, Taiwan under grant No. NARI NL-114-0444 and by National Science and Technology Council of Taiwan under grant No. NSTC-114-2112-M-213-006.
Data Availability Statement
All relevant data that support the findings of this study are available from the corresponding authors upon request.
Conflicts of Interest
The authors declare no conflict of interest.
References
- Kauzlarich, S.M.; Stanton, Jr J.L.; Farber, J.; Averill, B.A. Neutron profile refinement of the structure of FeOCl and FeOCl(TTF)1/8.5. J. Am. Chem. Soc. 1986, 108, 7946-7951.
- Sagua, A.; Morán, E.; Alario-Franco, M.A.; Rivera, A.; León, C.; Santamarìa, J.; Sanz, J. Lithium intercalation in FeOCl revisited. Int. J. Inorg. Mat. 2001, 3, 293-301.
- Zhang, J.; Liu, G.; Liu, S. 2D/2D FeOCl/graphite oxide heterojunction with enhanced catalytic performance as a photo-Fenton catalyst. New J. Chem. 2018, 42, 6896-6902.
- Zhang, T.; Wang, Y.; Li, H.; Zhong, F.; Shi, J.; Wu, M.; Sun, Z.; Shen, W.; Wei, B.; Hu, W.; Liu, X.; Huang, L.; Hu, C.; Wang, Z.; Jiang, C.; Yang, S.; Zhang, Q.-M.; Qu, Z. Magnetism and Optical Anisotropy in van der Waals Antiferromagnetic Insulator CrOCl. ACS Nano 2019, 13, 11353-11362.
- Bian, Y.; Nie, L.; Wang, A.; Zhang, L.; Yue, R.; Han, N.; Chen, Y. Facile synthesis of stoichiometric InOCl mesoporous material for high performance formaldehyde gas sensors. Sensors and Actuators B: Chemical 2020, 319, 128078.
- Ekholm, M.; Schönleber, A.; van Smaalen, S. The role of magnetic order in VOCl. J. Phys.: Condens. Matter 2019, 31, 325502.
- Zhang, J.; Liu, G.; Liu, S. 2D/2D FeOCl/graphite oxide heterojunction with enhanced catalytic performance as a photo-Fenton catalyst. New J. Chem. 2018, 42, 6896-6902.
- Ferrenti, A.M.; Klemenz, S.; Lei, S.; Song, X.; Ganter, P.; Lotsch, B.V.; Schoop, L.M. Change in Magnetic Properties upon Chemical Exfoliation of FeOCl. Inorg. Chem. 2020, 59(2), 1176-1182.
- Zheng, X.; Wei, Y.; Wei, Z.; Luo, W.; Guo, X.; Zhang, X.; Liu, J.; Chen, Y.; Peng, G.; Cai, W.; Qin, S.; Huang, H.; Deng, C.; Zhang, X. Highly anisotropic thermal conductivity of few-layer CrOCl for efficient heat dissipation in graphene device. Nano Res. 2022, 15, 9377-9385.
- Maguire, J.A.; Banewicz, J.J. Direct intercalation of alkali metal ions in FeOCl. Mat. Res. Bull. 1984, 19, 1573-1580.
- Ferrenti, A.M.; Klemenz, S.; Lei, S.; Song, X.; Ganter, P.; Lotsch, B.V.; Schoop, L.M. Change in Magnetic Properties upon Chemical Exfoliation of FeOCl. Inorg. Chem. 2020, 59(2), 1176-1182.
- Zeng, Y.; Gu, P.; Zhao, Z.; Zhang, B.; Lin, Z.; Peng, Y.; Li, W.; Zhao, W.; Leng, Y.; Tan, P.; Yang, T.; Zhang, Z.; Song, Y.; Yang, J.; Ye, Y.; Tian, K.; Hou, Y. 2D FeOCl: A Highly In-Plane Anisotropic Antiferromagnetic Semiconductor Synthesized via Temperature-Oscillation Chemical Vapor Transport. Adv Mater. 2022, 34(14), e2108847.
- Schollhorn, R. Intercalation Reactions of Solids by Electron/Ion Transfer. Angew. Chem. 1980, 19, 983.
- Jarrige, I.; Cai, Y.Q.; Shieh, S.R.; Ishii, H.; Hiraoka, N.; Karna, S.; Li, W.-H. Charge transfer in FeOCl intercalation compounds and its pressure dependencies: An X-ray spectroscopic study, Phys. Rev. B 2010, 82, 165121.
- Palvadeau, P.; Coic, L.; Rouxel, J.; Portier, J. The lithium and molecular intercalates of FeOCl. Mat. Res. Bull. 1978, 13, 221-227.
- O’Hare, D. Inorganic Materials, edited by D. W. Bruce and D. O’Hare; John Wiley & Sons Ltd., Chichester; 1997, pp. 202-208.
- Wu, C.-G.; DeGroot, D.C.; Marcy, H.O.; Schindler, J.L.; Kannewurf, C.R.; Bakas, T.; Papaefthymiou, V.; Hirpo, W.; Yesinowski, J.P.; Liu, Y.-J.; Kanatzidis, M.G. Reaction of Aniline with FeOC1. Formation and Ordering of Conducting Polyaniline in a Crystalline Layered Host. J. Am. Chem. Soc. 1995, 117, 9229-9242.
- Takehara, Z.; Kanamura, K.; Imanishi, N.; Zhen, C. Synthetic Photochemistry. XLIX. Synthesis and Photoisomerization of 2-Acetyl-2-azatricyclo[6.2.2.01,5]dodeca-4,6,9,11-tetraen-3-one. An MO Explanation of the Cycloaddition of Cyclohepta[b]pyrrol-2(1H)-ones. Bull. Chem. Soc. Jpn. 1989, 62, 1567-1571.
- Halbert, T.R.; Scanlon, J. Organometallic intercalation compounds of FeOCl. Mater. Res. Bull. 1979, 14, 415-421.
- Takehara, Z.; Sakaebe, H.; Kanamura, K. Application of FeOOH derivatives for a secondary lithium battery. J. Power Sources 1993, 44, 627-634.
- Kanamura, K.; Takehara, Z.I.; Sakaebe, H.; Fujimoto, H. Application of FeOCl derivatives for a secondary lithium battery. III: Electrochemical reaction and physical state of reaction product of FeOCl with aniline in water. J. Electrochemical Society 1995, 142(7), 2126-2131.
- Adam, A.; Buisson, G. Structure magnétique cycloïdale de FeOCl. Phys. Status Solidi A 1975, 30, 323-329.
- Hwang, S.R.; Li, W.-H.; Lee, K.C.; Lynn, J.W.; Wu, C.-G. Spiral magnetic structure of Fe in Van der Waals gaped FeOCl and polyaniline-intercalated FeOCl, Phys. Rev. B. 2000, 62, 14157-14163.
- Larson, A.C.; Von Dreele, R.B. General Structure Analysis System, Report LA-UR-86-748; Los Alamos National Laboratory: Los Alamos, NM. 1990.
- Rietveld, H.M. A profile refinement method for nuclear and magnetic structures. J. Appl. Crystallogr. 1969, 2, 65.
- Wang, X.; de Groot, F.M.F.; Cramer, S.P. Spin-polarized x-ray emission of 3d transition-metal ions: A comparison via Ka and Kb detection. Phys. Rev. B 1997, 56, 4553-4564.
- Tsutsumi, K.; Nakamori H.; Ichikawa, K. X-ray Mn Kβ emission spectra of manganese oxides and manganates. Phys. Rev. B 1976, 13, 929-933.
- Rueff, J.-P.; Kao, C.-C.; Struzhkin, V.V.; Badro, J.; Shu, J.; Hemley, R.J.; Mao, H.K. Pressure-Induced High-Spin to Low-Spin Transition in FeS Evidenced by X-Ray Emission Spectroscopy. Phys. Rev. Lett. 1999, 82, 3284-3287.
- Monesi, C.; Meneghini, C.; Bardelli, F.; Benfatto, M.; Mobilio, S.; Manju, U.; Sarma, D.D. Quantitative structural refinement of Mn K edge XANES in LaMnO3 and CaMnO3 perovskites. Nucl. Instrum. Methods in Phys. Res. B 2006, 246, 158-164.
- Charles, K. Introduction to Solid State Physics, 8th ed.; Wiley, New York; 2005, pp. 323-325.
- Anderson, P.W. Antiferromagnetism. Theory of Superexchange Interaction. Phys. Rev. 1950, 79, 350-356.
Figure 1.
Observed (crosses) and fitted (solid lines) neutron powder-diffraction pattern of Na0.27FeOCl at 130 K, assuming an orthorhombic symmetry of space group Pmmn. The differences between the calculated and observed patterns are plotted at the bottom. The solid vertical lines mark the calculated positions of the Bragg reflections of the proposed crystalline structure.
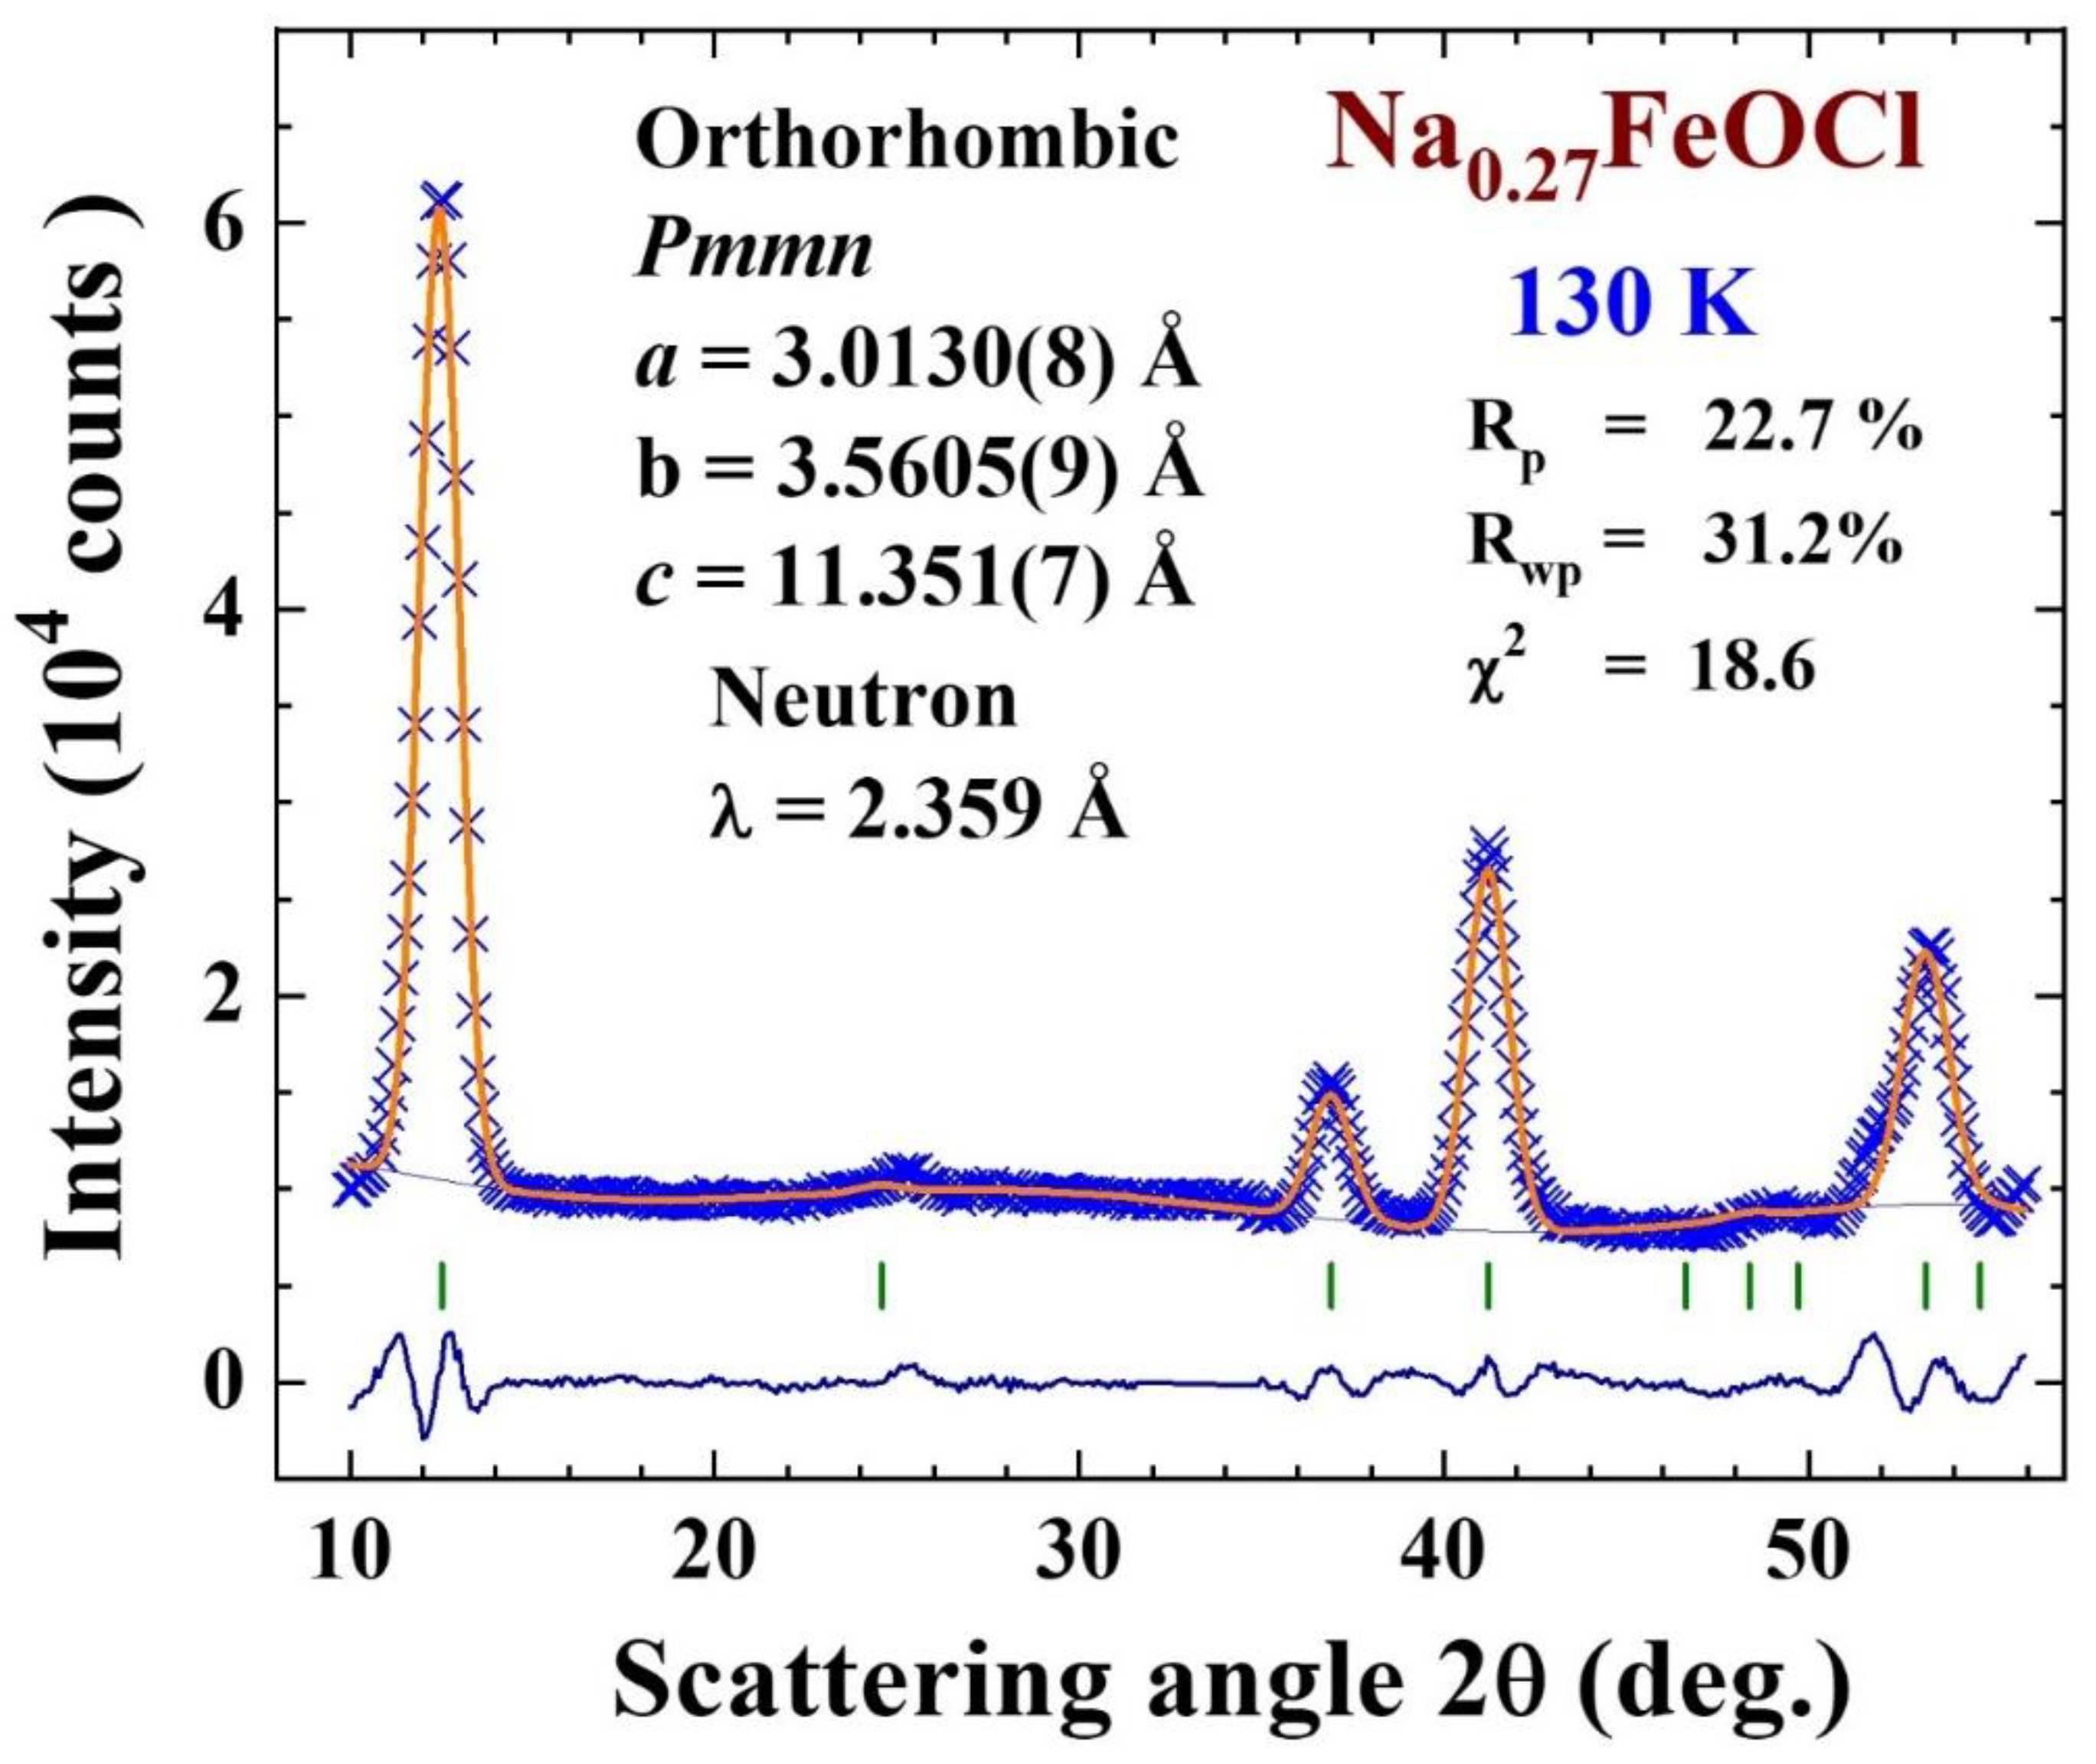
Figure 2.
Proposed crystalline structure of NaFeOCl, where a unit cell contains two sets of distorted Cl-Fe-O chains and the intercalated Na connected to Cl to appear in the gap.
Figure 2.
Proposed crystalline structure of NaFeOCl, where a unit cell contains two sets of distorted Cl-Fe-O chains and the intercalated Na connected to Cl to appear in the gap.
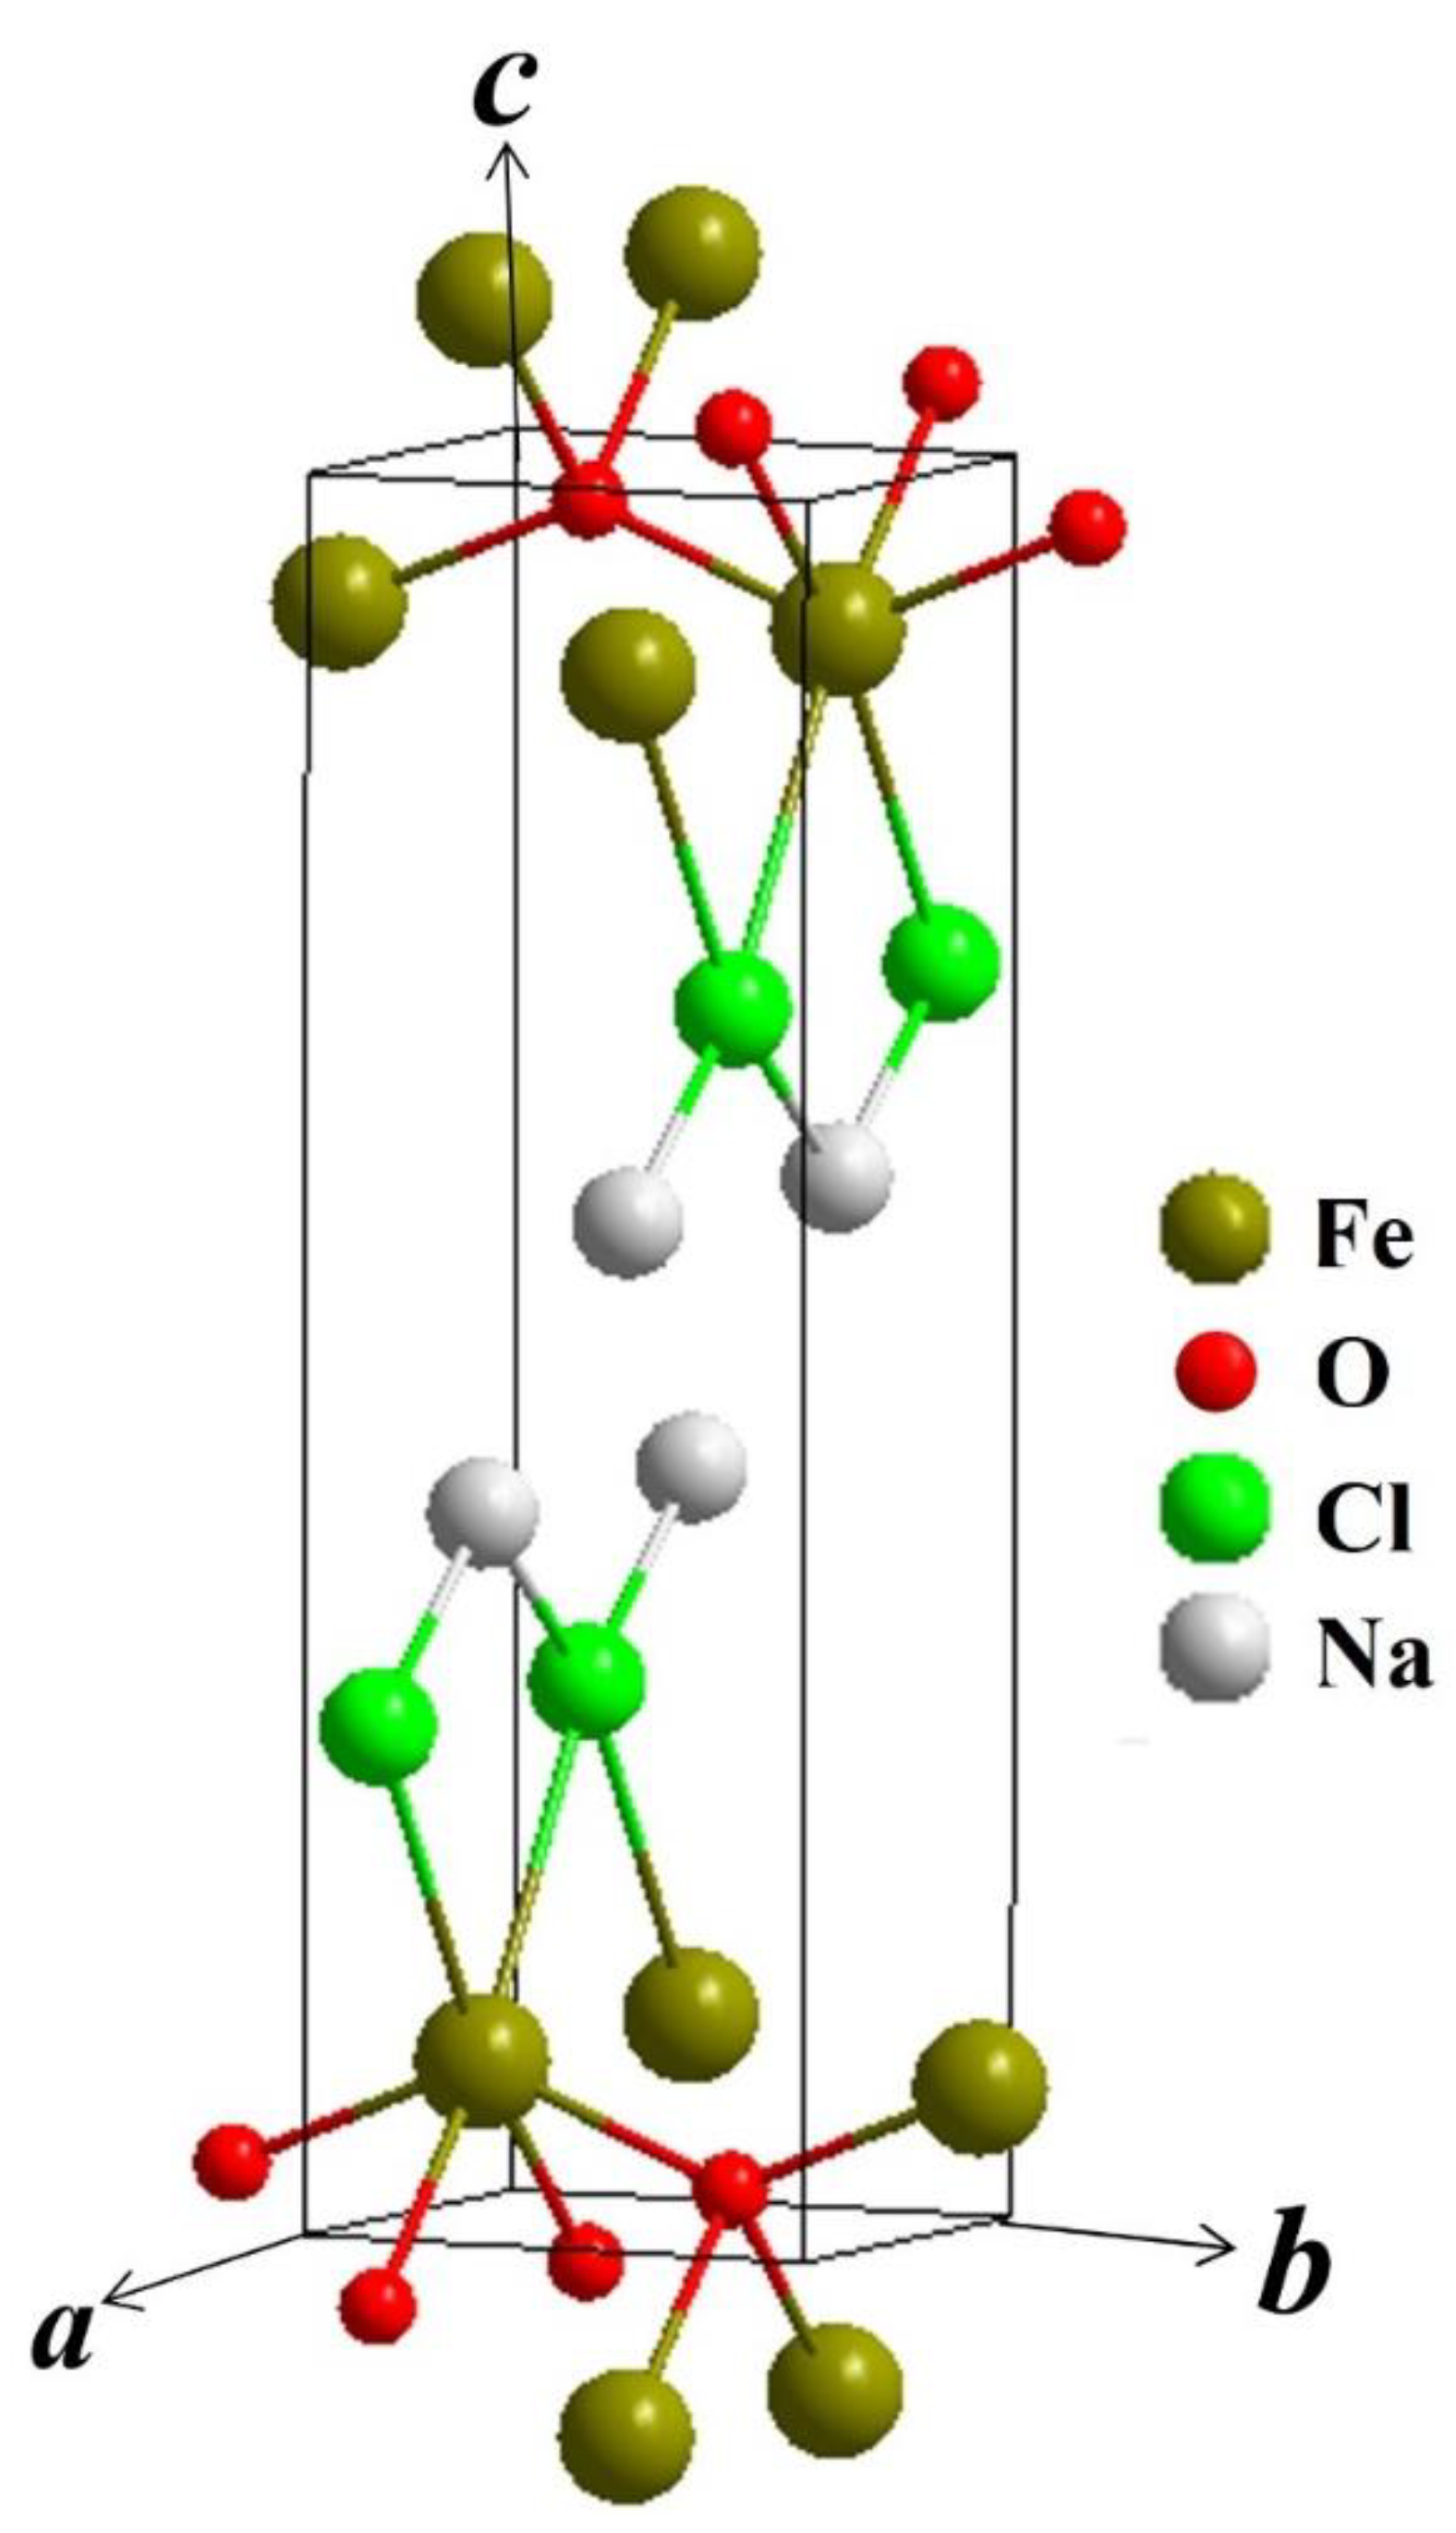
Figure 3.
(a) XES spectra of the Fe-Kβ emission lines of FeOCl (solid line) and Na0.27FeOCl (dished line), normalized in intensity to their maximum. The inset shows an enlarged view of the Kβ structure. (b) PFY-XAS spectra of FeOCl (solid line) and Na0.27FeOCl (dashed line) at the Fe-K edge. The spectra were normalized in intensity to their area. The vertical dashed lines indicate the energies of the main peaks of the spectrum of FeOCl, and the arrows indicate those of Na0.27FeOCl.
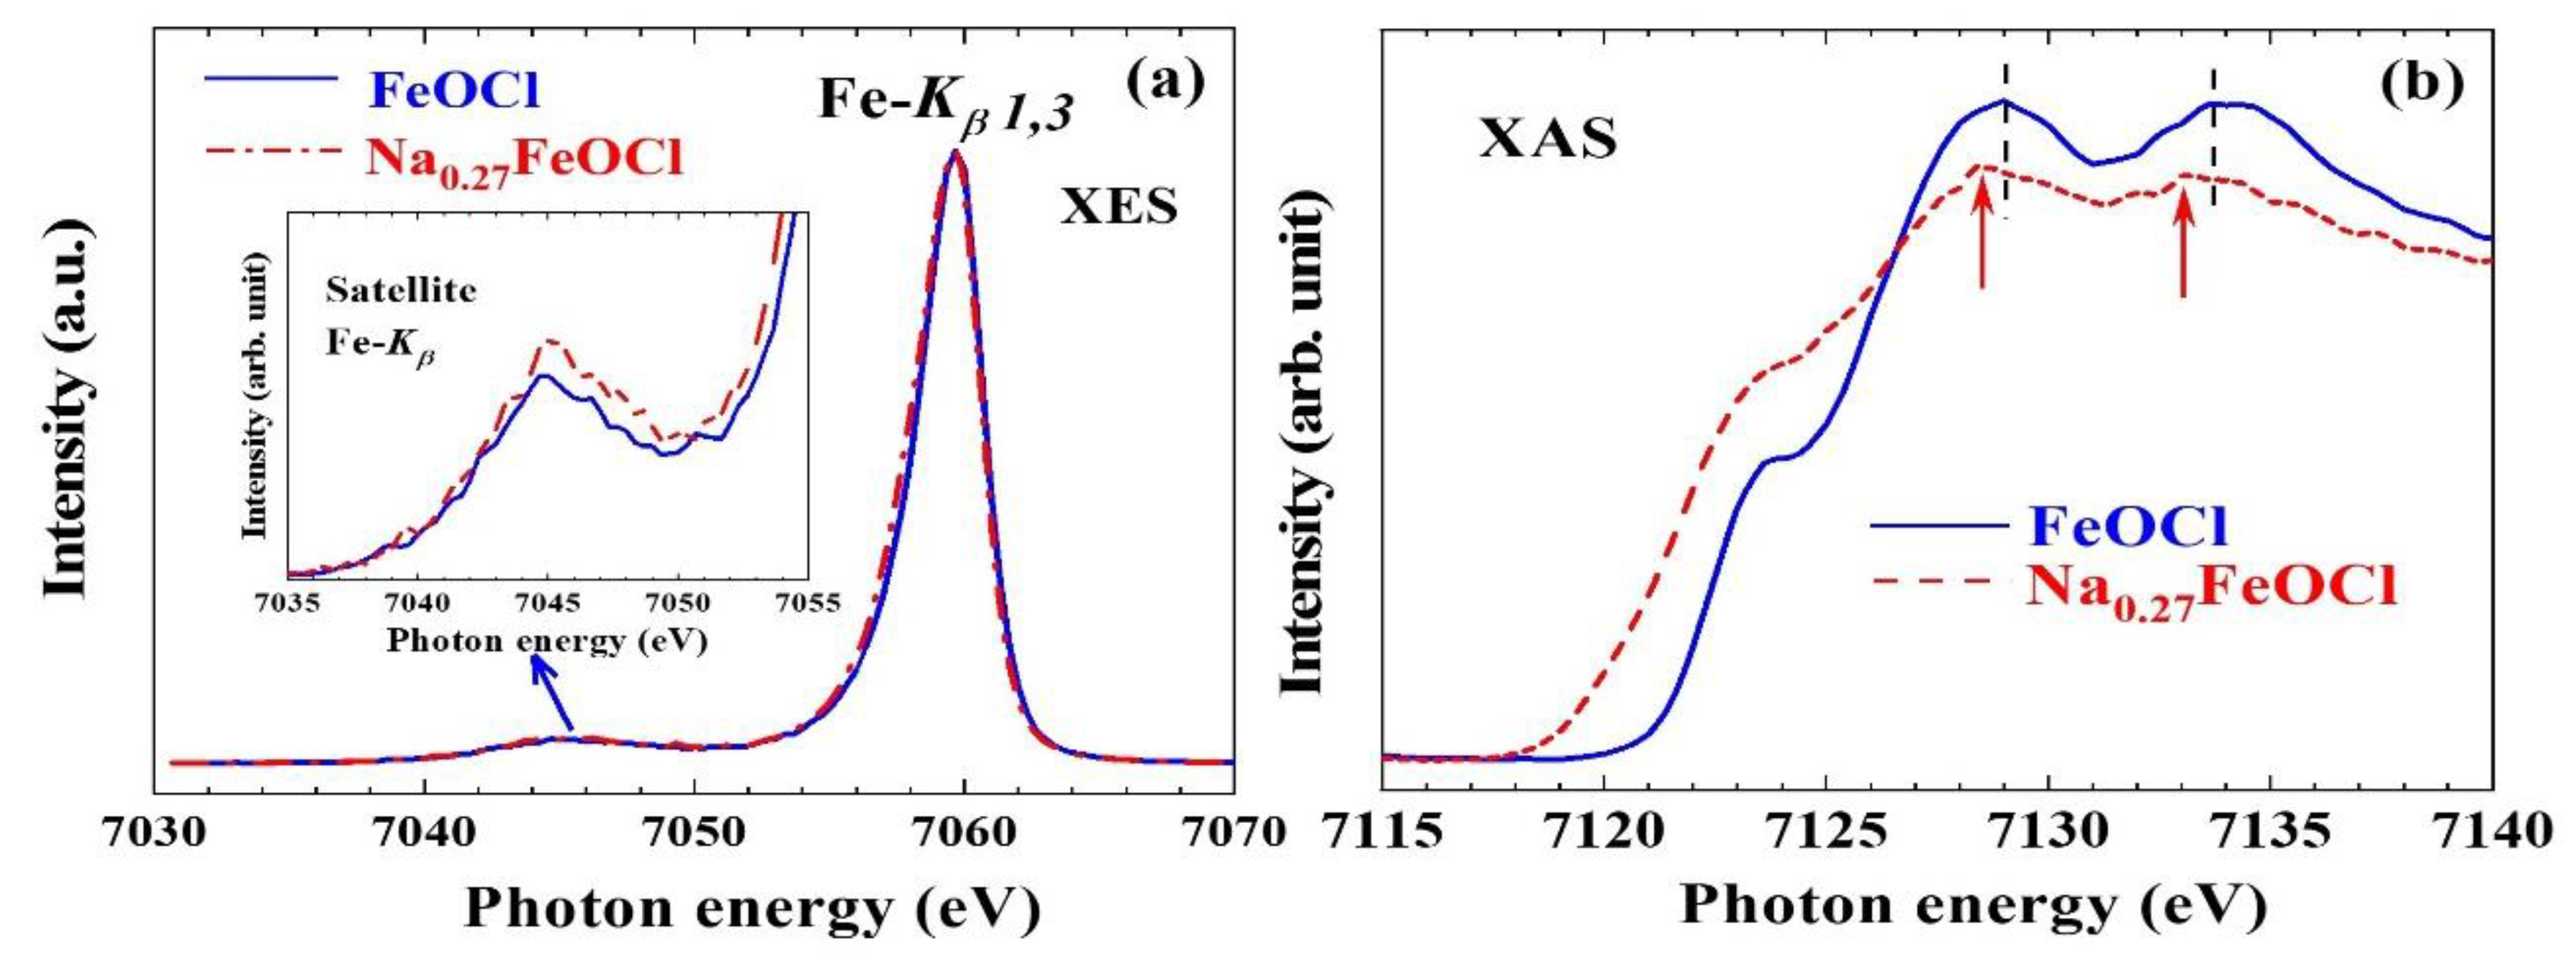
Figure 4.
(a) Temperature dependences of the in-phase component χ’ of the ac magnetic susceptibility χ’(T), measured using a probing magnetic field with a rms strength of Hac = 10 Oe and a frequency of f = 103 Hz, of FeOCl (open triangle) and Na0.27FeOCl (open circles). The solid curves indicate the results of fits of the data above 150 K to Curie-Weiss law. (b) Direct comparisons of χ’(T) of Na0.27FeOCl measured under an applied magnetic field of Hdc = 0 (open inverse triangles), Hdc = 2 T (open circles), and Hdc = 6 T (open triangles). An anomaly at 22 K is clearly revealed in the Hdc = 0 curve. The anomaly shifts to 21 K at Hdc = 2 T, and further to 18 K at Hdc = 6 T.
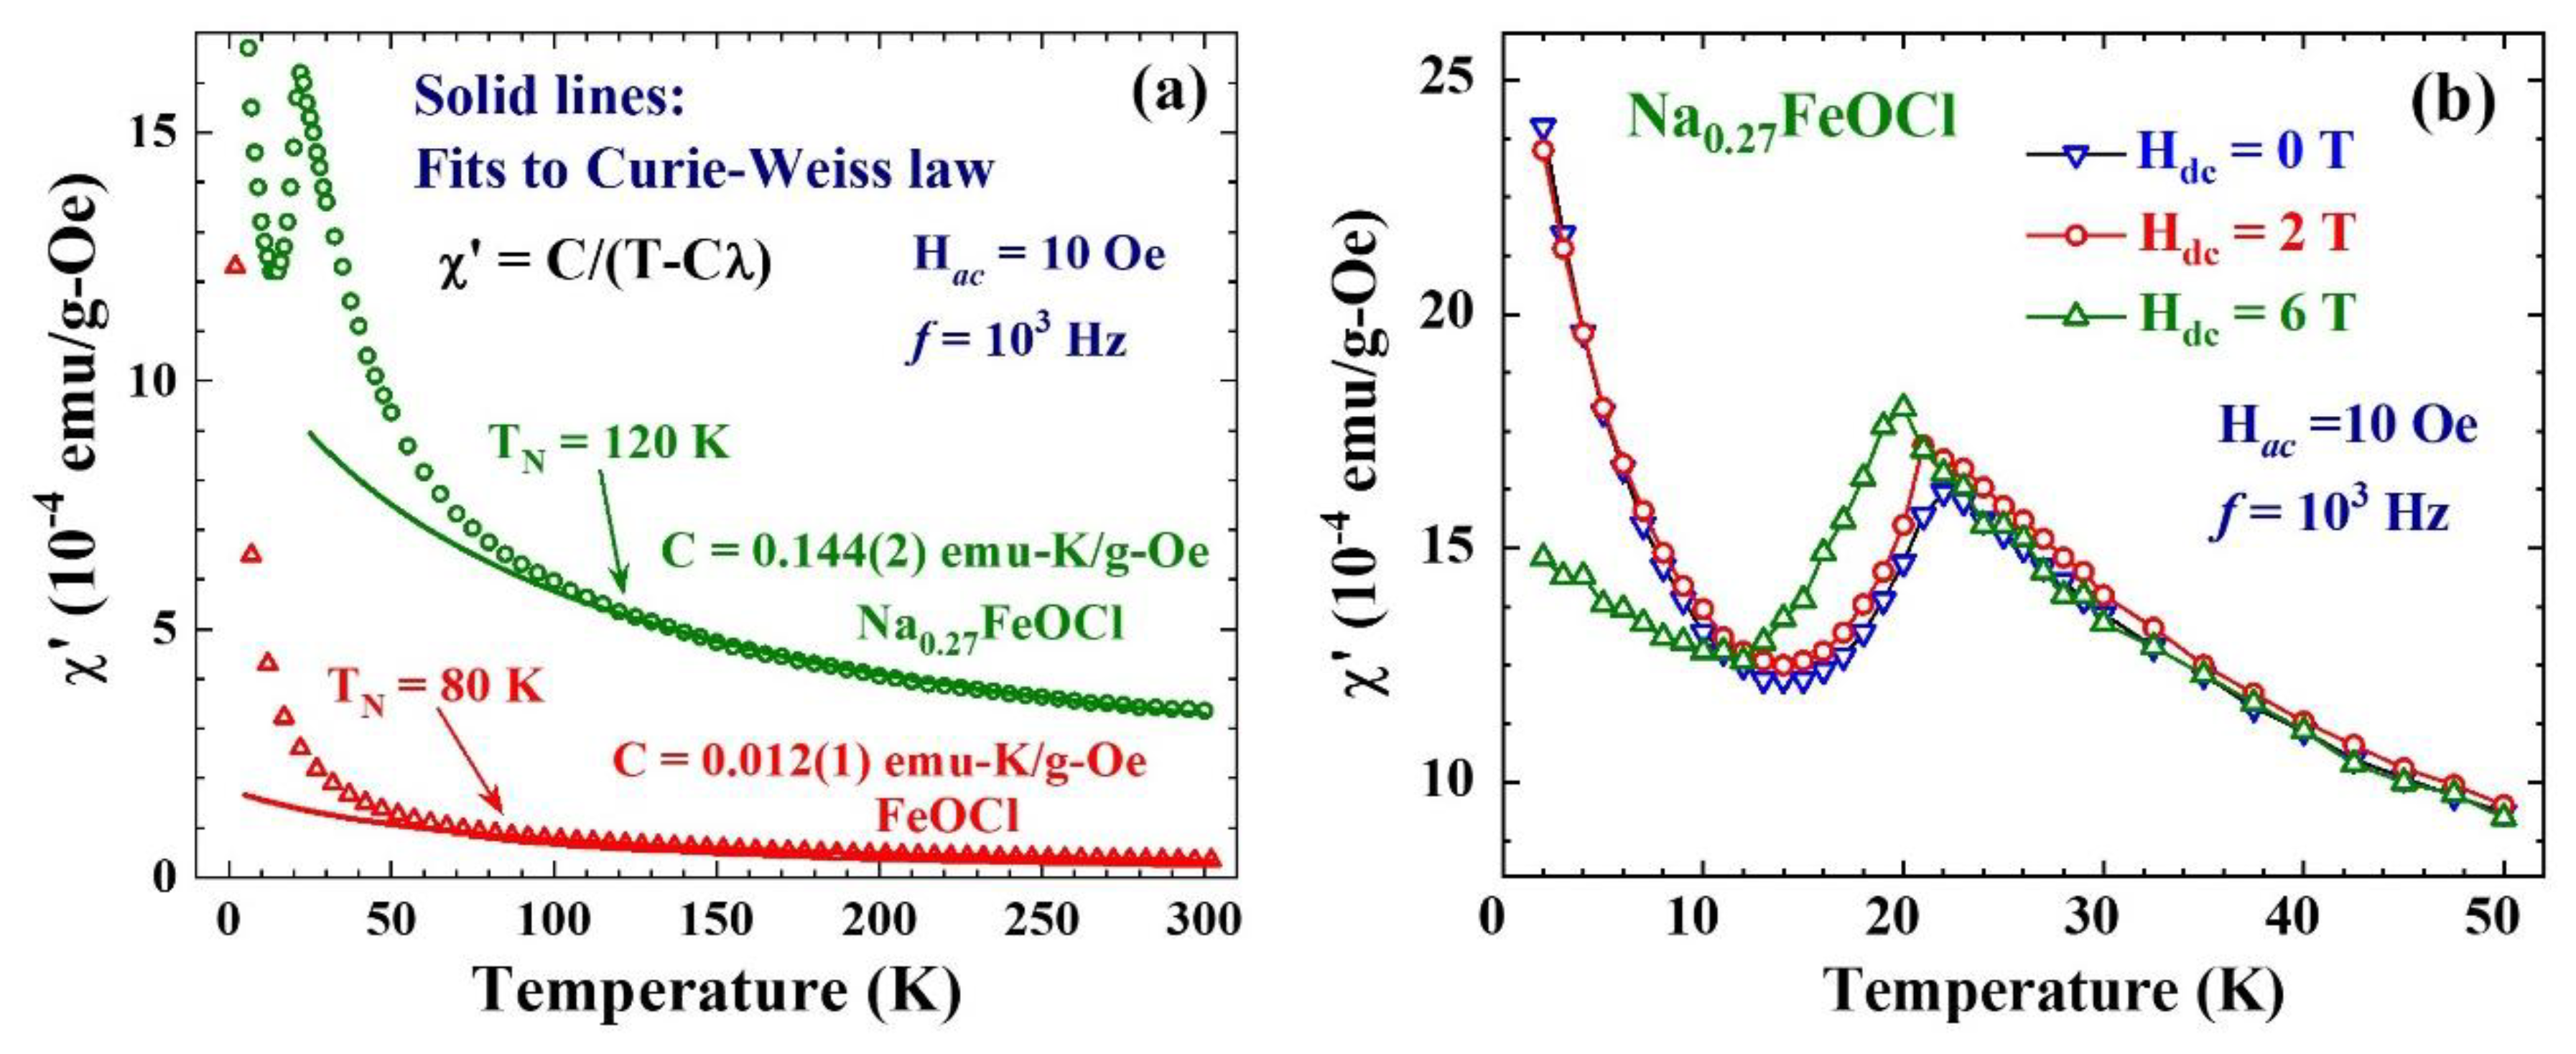
Figure 5.
Magnetic diffraction pattern obtained at 10 K, where the indices shown are based on the nuclear unit cell. The solid curves are results of the fits of the data to the proposed structure, using Gaussian resolution function for the peak profiles.
Figure 5.
Magnetic diffraction pattern obtained at 10 K, where the indices shown are based on the nuclear unit cell. The solid curves are results of the fits of the data to the proposed structure, using Gaussian resolution function for the peak profiles.
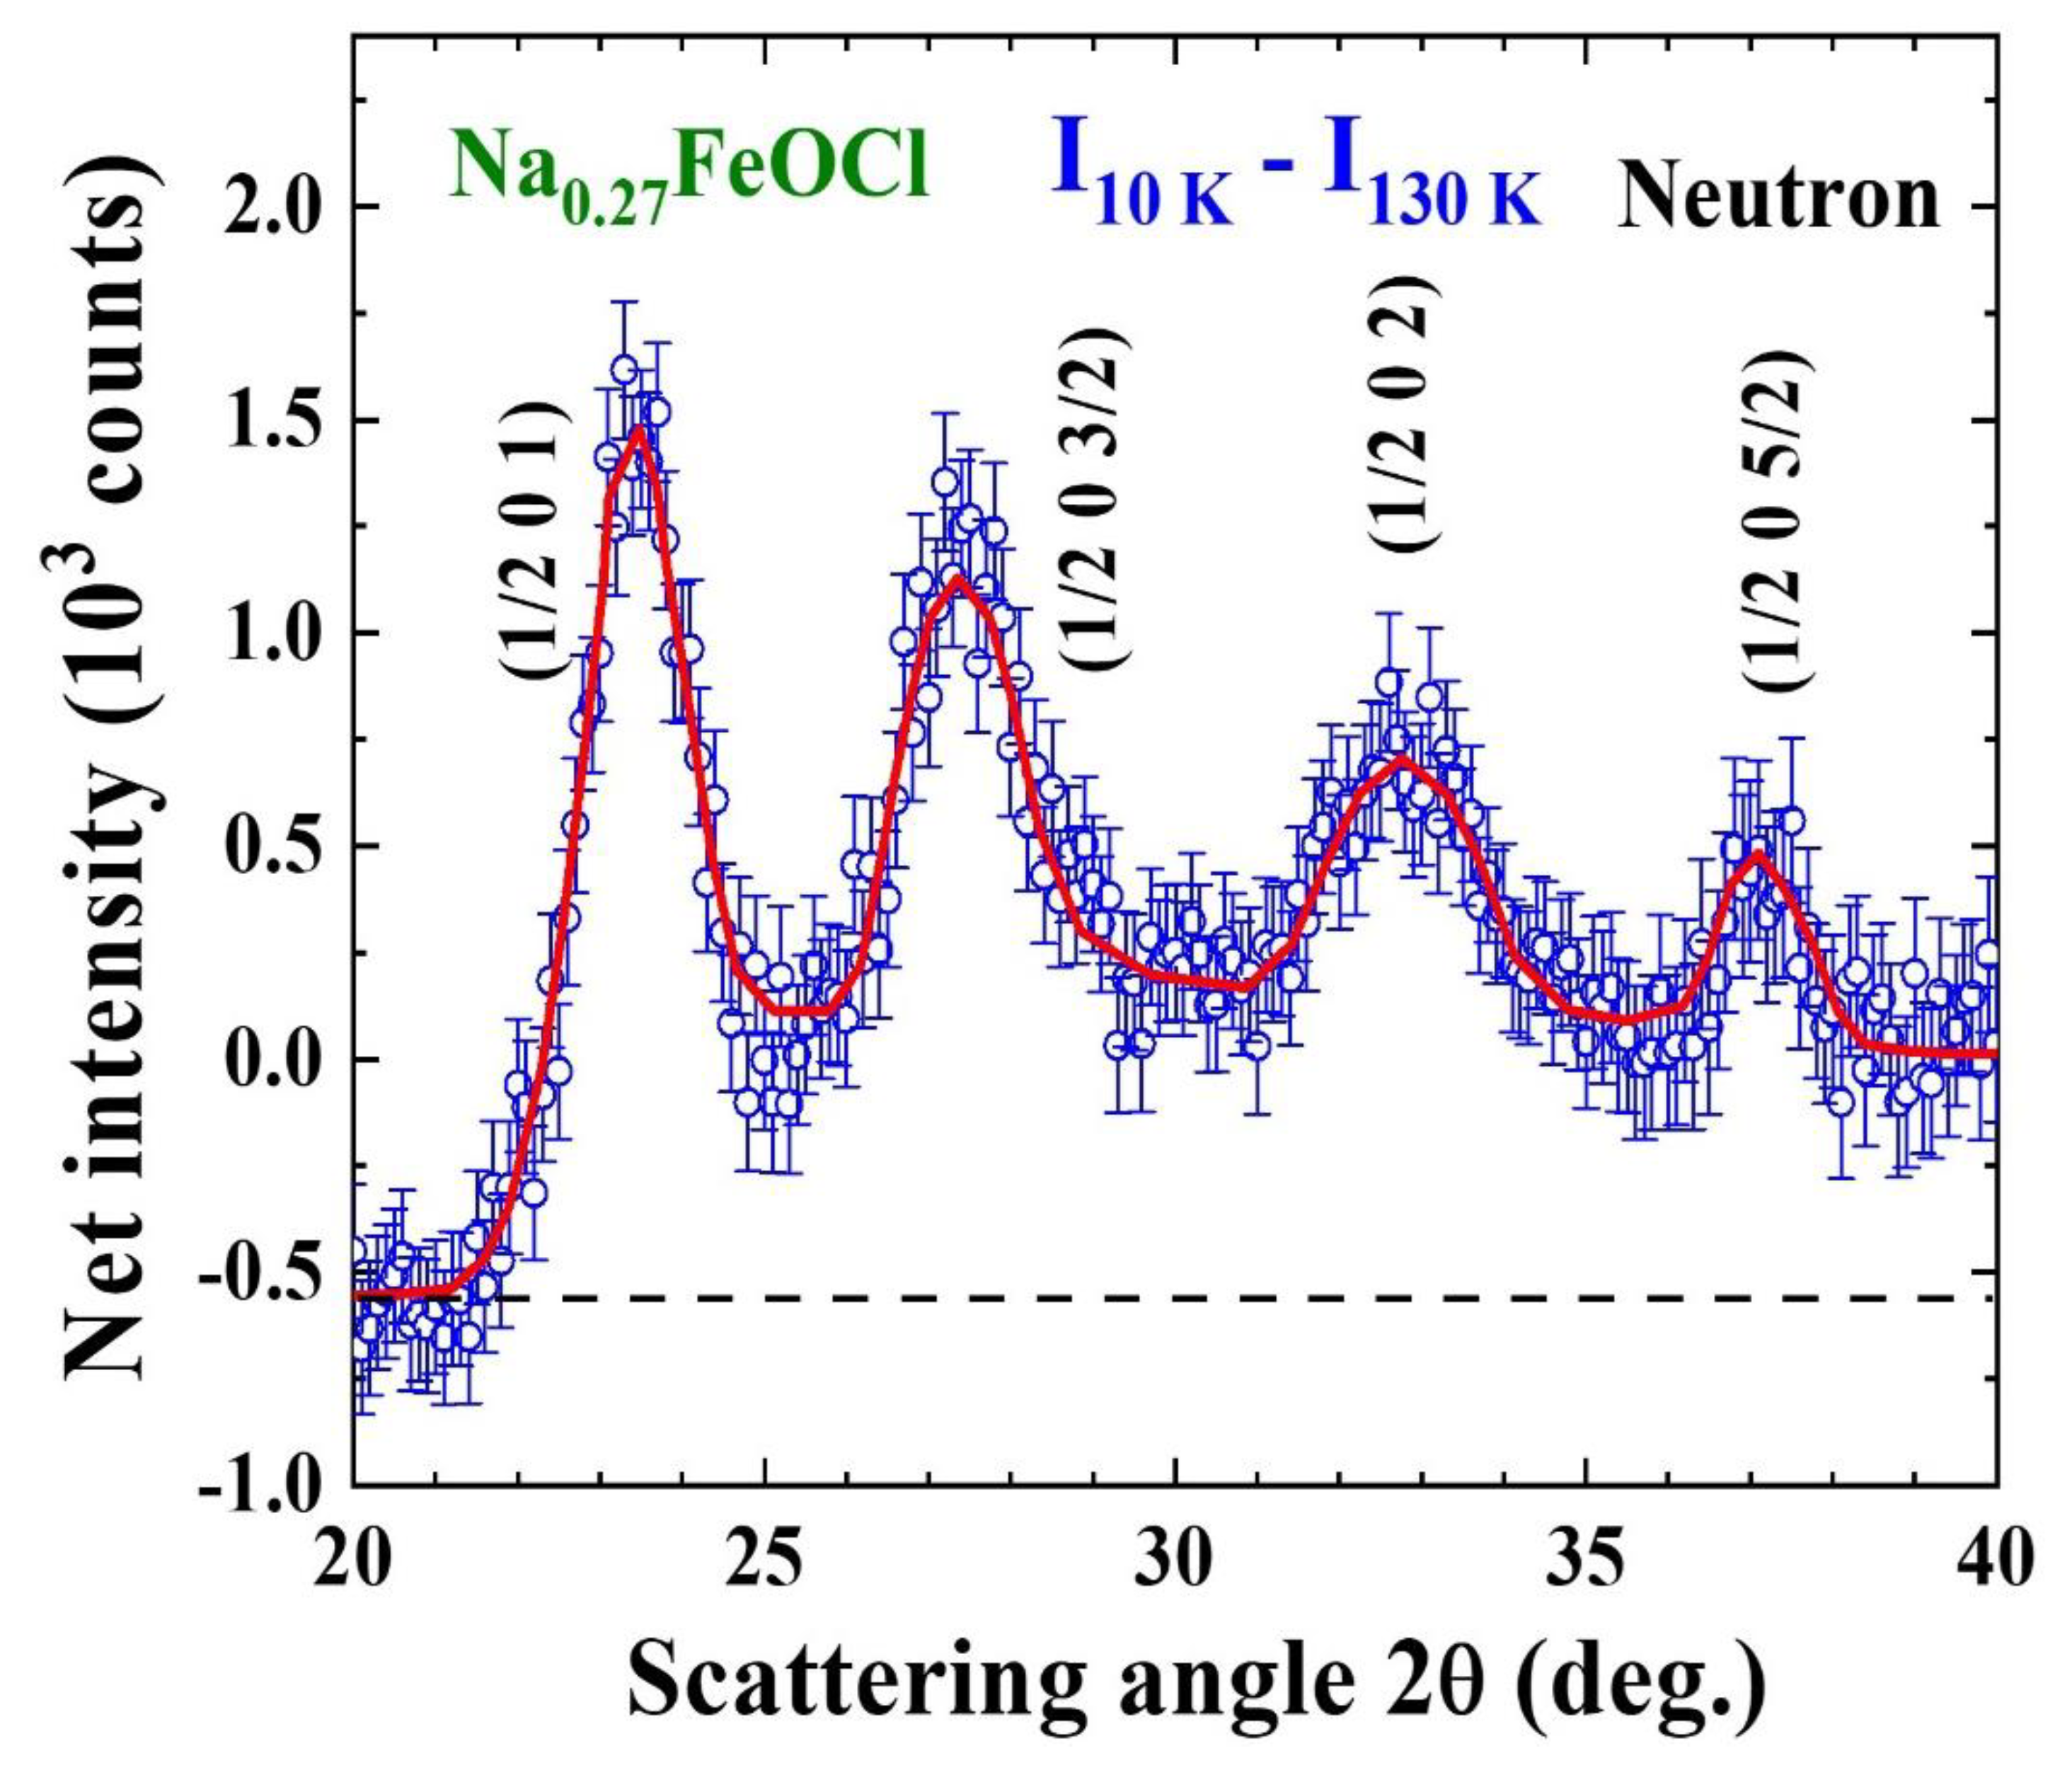
Figure 6.
The proposed magnetic structure for the Fe spins in Na0.27FeOCl, where nearest-neighbor Fe spins in the basal a-b plane are aligned anti-parallel along a-axis direction and parallel along b-axis direction.
Figure 6.
The proposed magnetic structure for the Fe spins in Na0.27FeOCl, where nearest-neighbor Fe spins in the basal a-b plane are aligned anti-parallel along a-axis direction and parallel along b-axis direction.
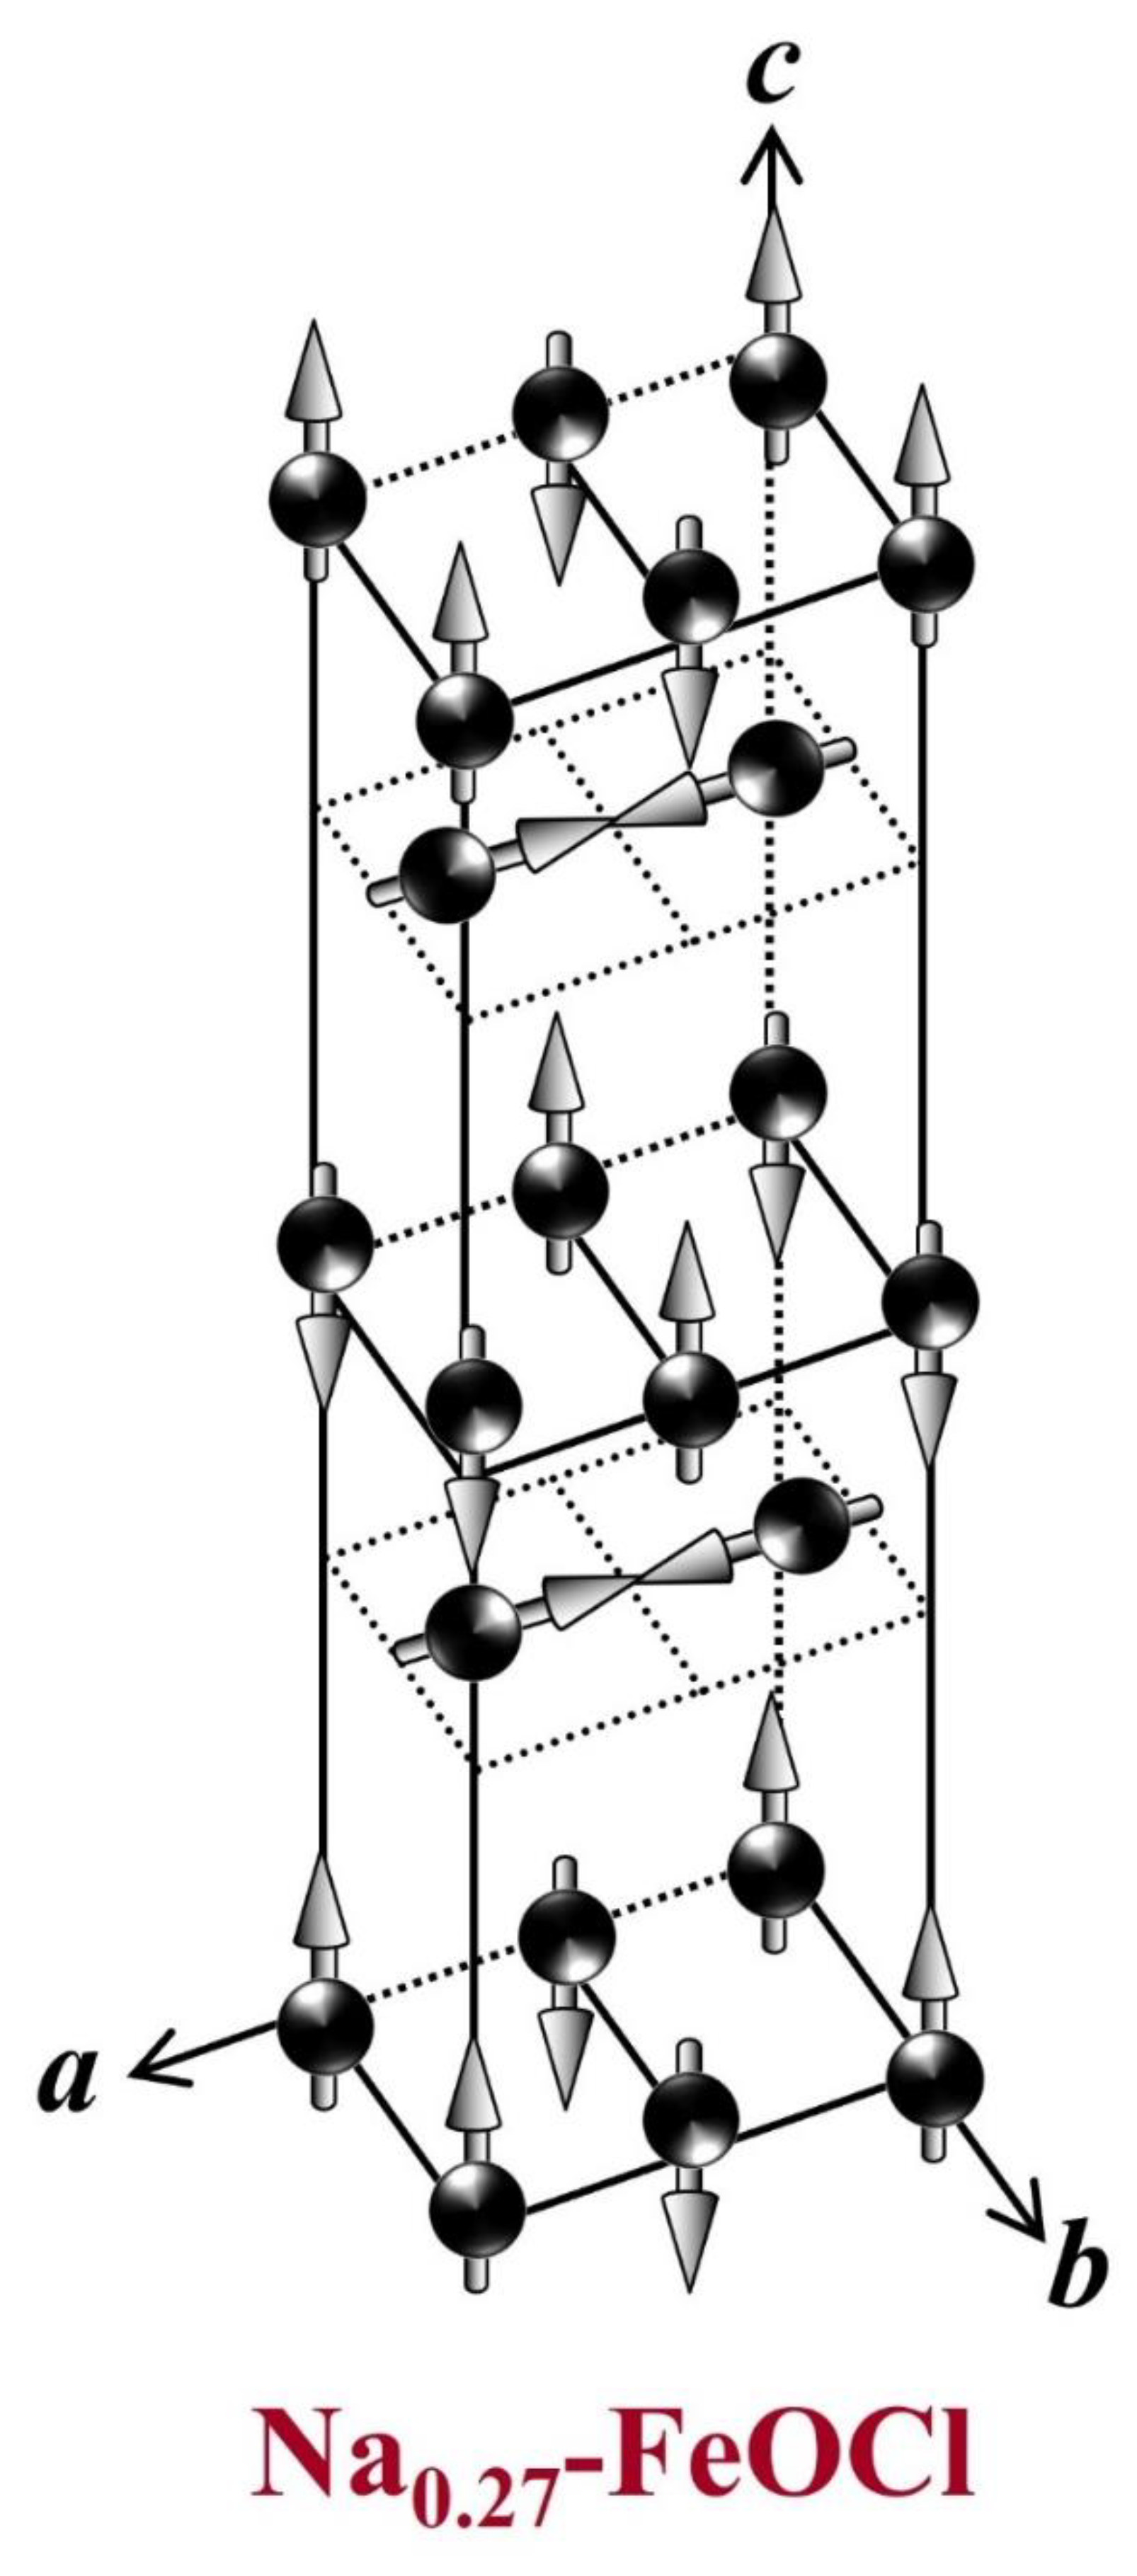
Figure 7.
Temperature dependences of the peak intensity of the (a) (1/2 0 1) and (b) (1/2 0 3/2) magnetic reflections. The grey shaded regions indicate the temperature regimes where reductions of the magnetic intensities appeared. The yellow shaded regions indicate the temperature regimes where intensity fluctuation from powdered samples appeared. The solid lines are results of fits of the data in the grey shaded regions to the expression shown in plots.
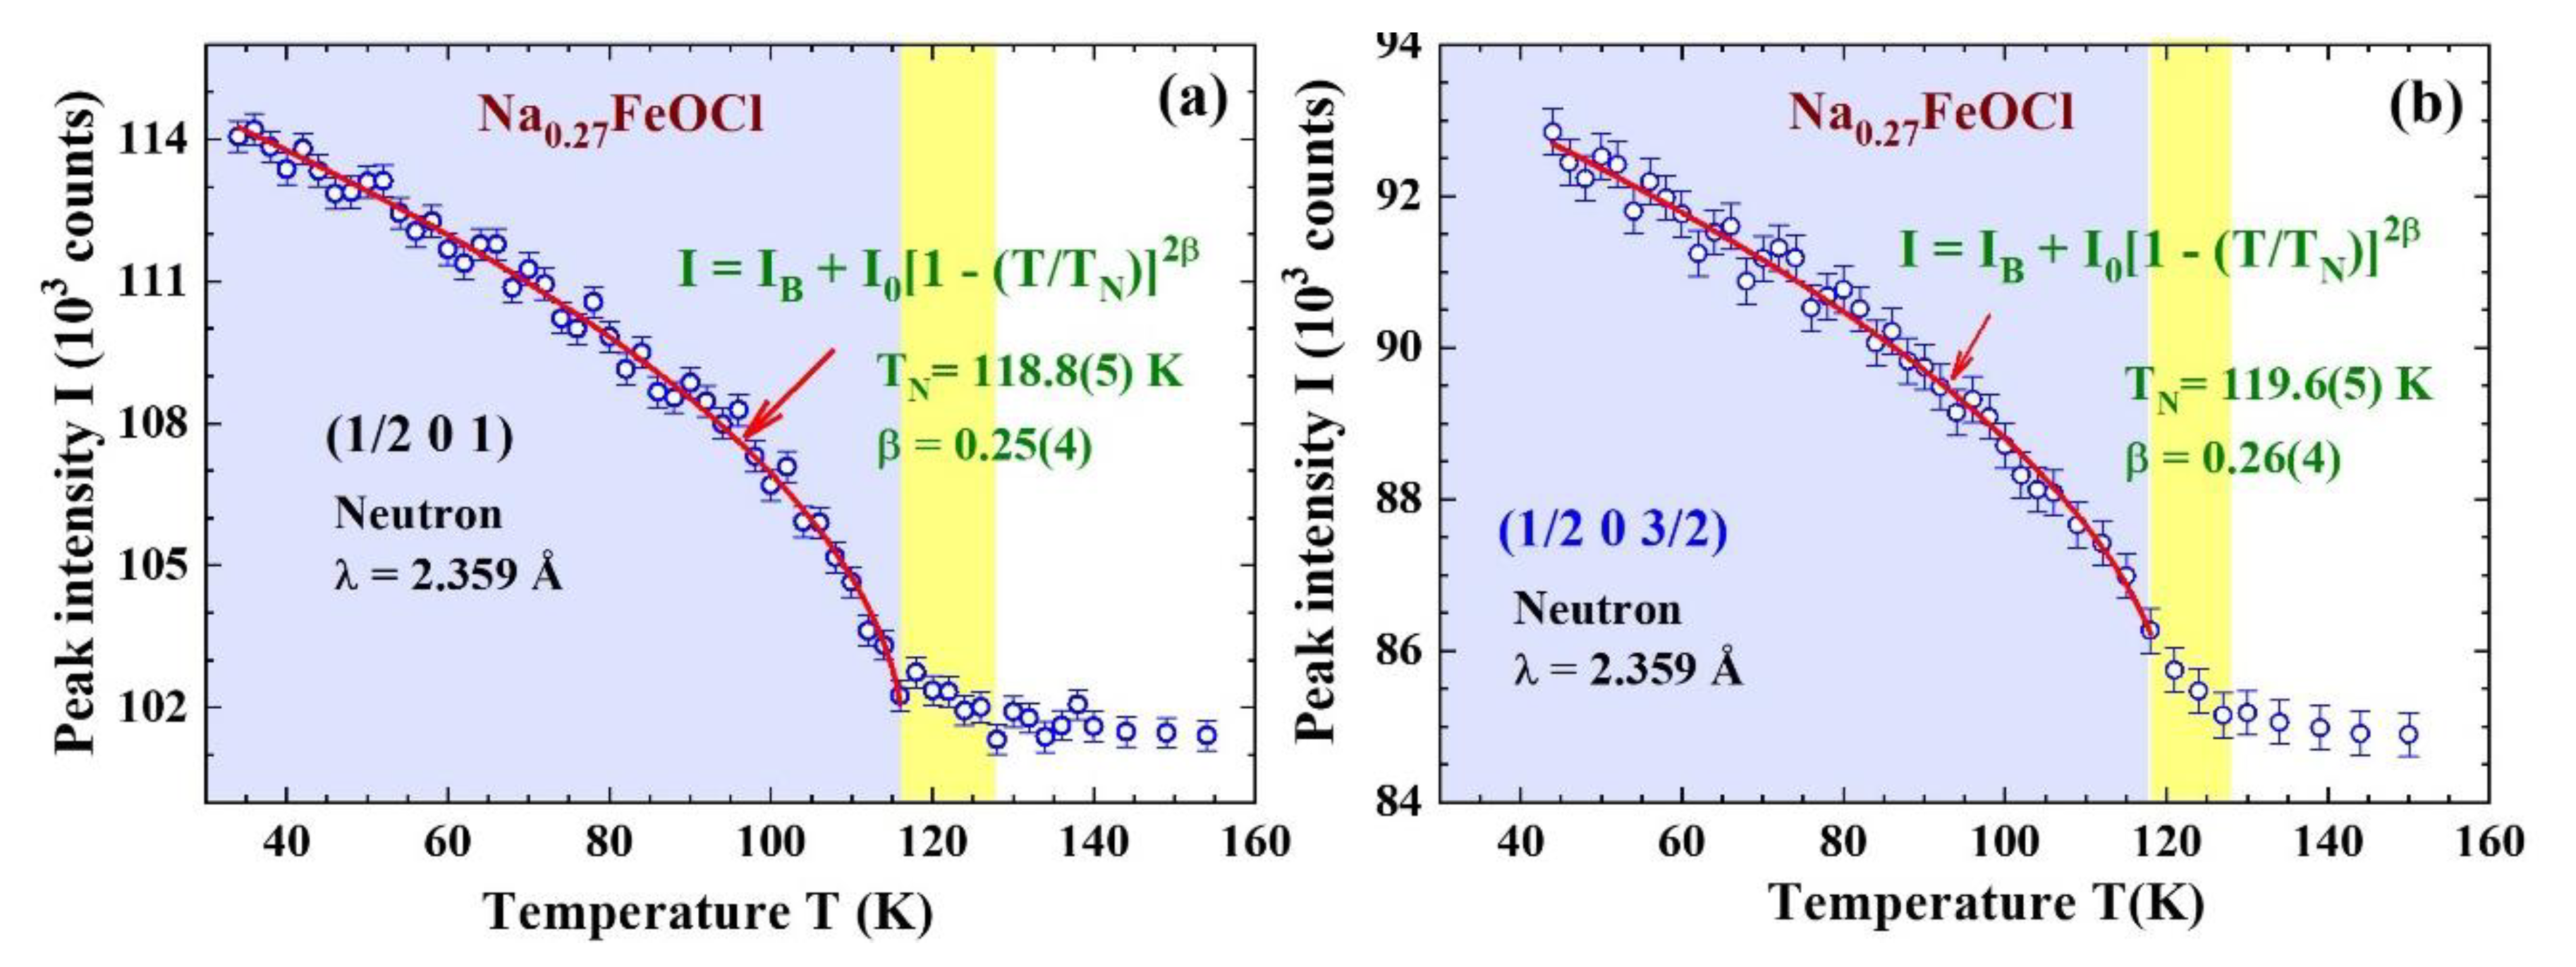

Table 1.
Refined structural parameters of Na0.27FeOCl at 130 K. Biso represents the isotropic temperature parameter with Biso = π2<μ2>, where <μ2> is the mean square displacement.
Table 1.
Refined structural parameters of Na0.27FeOCl at 130 K. Biso represents the isotropic temperature parameter with Biso = π2<μ2>, where <μ2> is the mean square displacement.
|
Na0.27FeOCl at 130 K Orthorhombic Pmmn space group (No. 59, Z=2) a= 3.0130(8) Å, b = 3.5605(9) Å, c = 11.351(7) Å | ||||||
| Atom | x | y | z | Multi | Biso(Å2) | Occupancy |
| Fe | 0.75 | 0.25 | 0.0940(9) | 2b | 0.75(5) | 1 |
| O | 0.25 | 0.25 | -0.0337(7) | 2a | 0.88(7) | 1.00(1) |
| Cl | 0.25 | 0.25 | 0.2979(6) | 2b | 1.33(9) | 0.99(2) |
| Na | 0.75 | 0.25 | -0.5870(4) | 2b | 0.03(1) | 0.27(2) |
| Rp (%) = 22.7, Rwp (%) = 31.2, χ2 = 18.6 Fe-O-Fe bond angle Fe-Fe separation Along a 131.5(5)o 3.5526(9) Å Along b 120.3(5)o 3.1621(8) Å | ||||||
Disclaimer/Publisher’s Note: The statements, opinions and data contained in all publications are solely those of the individual author(s) and contributor(s) and not of MDPI and/or the editor(s). MDPI and/or the editor(s) disclaim responsibility for any injury to people or property resulting from any ideas, methods, instructions or products referred to in the content. |
© 2025 by the authors. Licensee MDPI, Basel, Switzerland. This article is an open access article distributed under the terms and conditions of the Creative Commons Attribution (CC BY) license (http://creativecommons.org/licenses/by/4.0/).
Copyright: This open access article is published under a Creative Commons CC BY 4.0 license, which permit the free download, distribution, and reuse, provided that the author and preprint are cited in any reuse.


