1. Introduction
According to the European Green Deal initiative, the European Union aims to achieve climate neutrality by 2050 [
1,
2]. Currently, energy production and consumption in the EU account for more than 75% of the EU's greenhouse gas emissions. In this context, decarbonization is a top-priority task that requires a profound transformation of the energy system. The European Wind Power Action Plan sets ambitious targets to increase installed wind power capacity from 204 GW in 2022 to over 500 GW by 2030 [
3]. The document outlines measures to promote sustainable growth and enhance the sector’s competitiveness, including addressing supply chain sustainability. It highlights six key areas: accelerating the deployment of new capacity, improving the auction mechanism, expanding access to financing, strengthening international competitiveness, developing skills, and enhancing industry engagement.
Wind generation in Latvia reached 276 gigawatt-hours (GWh) in 2024, a 1.8% increase from 2023, accounting for approximately 5.9% of the country's renewable electricity production. Over the 2020–2024 period, output rose from 177 GWh to 276 GWh (+56%), yet wind remains a minor contributor compared to hydropower (3,210 GWh) and the rapidly expanding solar sector (536 GWh in 2024) [
4,
5].
Modern studies emphasise the increasing importance of electrification and the integration of renewable energy sources in rural and natural areas, where the landscape and underlying surface characteristics significantly impact generation efficiency [
6]. At the same time, the development of local energy communities and distributed generation models underscores the need to optimise energy production and management in line with local conditions [
7].
Several studies have demonstrated that the wind field above forests exhibits distinct aerodynamic characteristics that differ significantly from those in open-terrain conditions. The airflow is typically characterised by high turbulence intensity, a strong vertical wind shear, and a pronounced wind veer with height, all of which influence the stability of the boundary-layer flow and the available wind energy potential [
8]. The power function of a wind turbine depends not only on wind speed and air density but also on vertical wind shear, vertical wind veer, turbulence intensity, directional variation, and inflow angle. Over forested terrain, surface roughness enhances wind shear, veer, and turbulence, altering the effective inflow conditions and increasing aerodynamic loading on the turbine. Therefore, accurate assessment of these parameters is crucial for determining the optimal hub height and for predicting the annual energy yield and structural performance [
9,
10]. According to IEC 61400-1:2019, the optimum hub height of a wind turbine is determined not only by economic and structural constraints but also by compliance with the standard turbulence classes (A, B, or C). Since turbulence intensity generally decreases with height, even above forests, increasing the hub height is considered a practical engineering approach to reduce dynamic loading and enhance energy yield [
11].
In forested environments, measurements indicate a wind-speed deficit of approximately 15% up to 5 forest heights downstream, which gradually diminishes beyond 15 heights, while elevated turbulence remains detectable up to 20 heights [
12].
The levelized cost of energy (LCOE) represents the average total cost per megawatt-hour of generating electricity over its lifetime, including capital, operational, and maintenance expenses relative to the total energy produced.
Table 1 displays recent LCOE figures for onshore wind energy in various countries. Costs generally range from 35 to 90 €/MWh, depending on wind resource quality, terrain difficulty, and financing conditions. Onshore sites with forests tend to have higher LCOE due to lower wind speeds and higher construction and maintenance costs.
The study aims to assess the impact of forest parameters and seasonal wind variations on the annual electricity output and economic efficiency of wind turbines installed in forested areas. Specifically, the research examines how canopy height, forest density, and roughness length impact wind flow, turbulence intensity, and vertical wind shear, as well as how these factors influence turbine performance and lifetime. Using WindPRO software, the study simulates wind flow and wake effects for a selected site in Latvia, providing quantitative estimates of energy yield, capacity factor, and Levelized Cost of Energy (LCOE). The results contribute to a better understanding of wind turbine operation in complex forested terrains and support evidence-based decisions in wind farm planning.
2. Materials and Methods
The presence of forest canopies significantly alters the structure of the atmospheric boundary layer, generating stronger wind shear and increased turbulence near the surface [
17]. These factors directly affect the aerodynamic behaviour of the blades and the efficiency of wind energy conversion. Numerical and experimental studies both indicate that the high surface roughness of forested terrain reduces wind speed and leads to an uneven velocity distribution at hub height, resulting in decreased energy production and increased fatigue loads on turbine components [
18]. Moreover, the recovery of the wind profile and turbine wake above forests occurs only at higher elevations and requires a longer downstream distance. Therefore, the selection of hub height and inter-turbine spacing becomes a critical design factor for wind farms located in forested areas [
19].
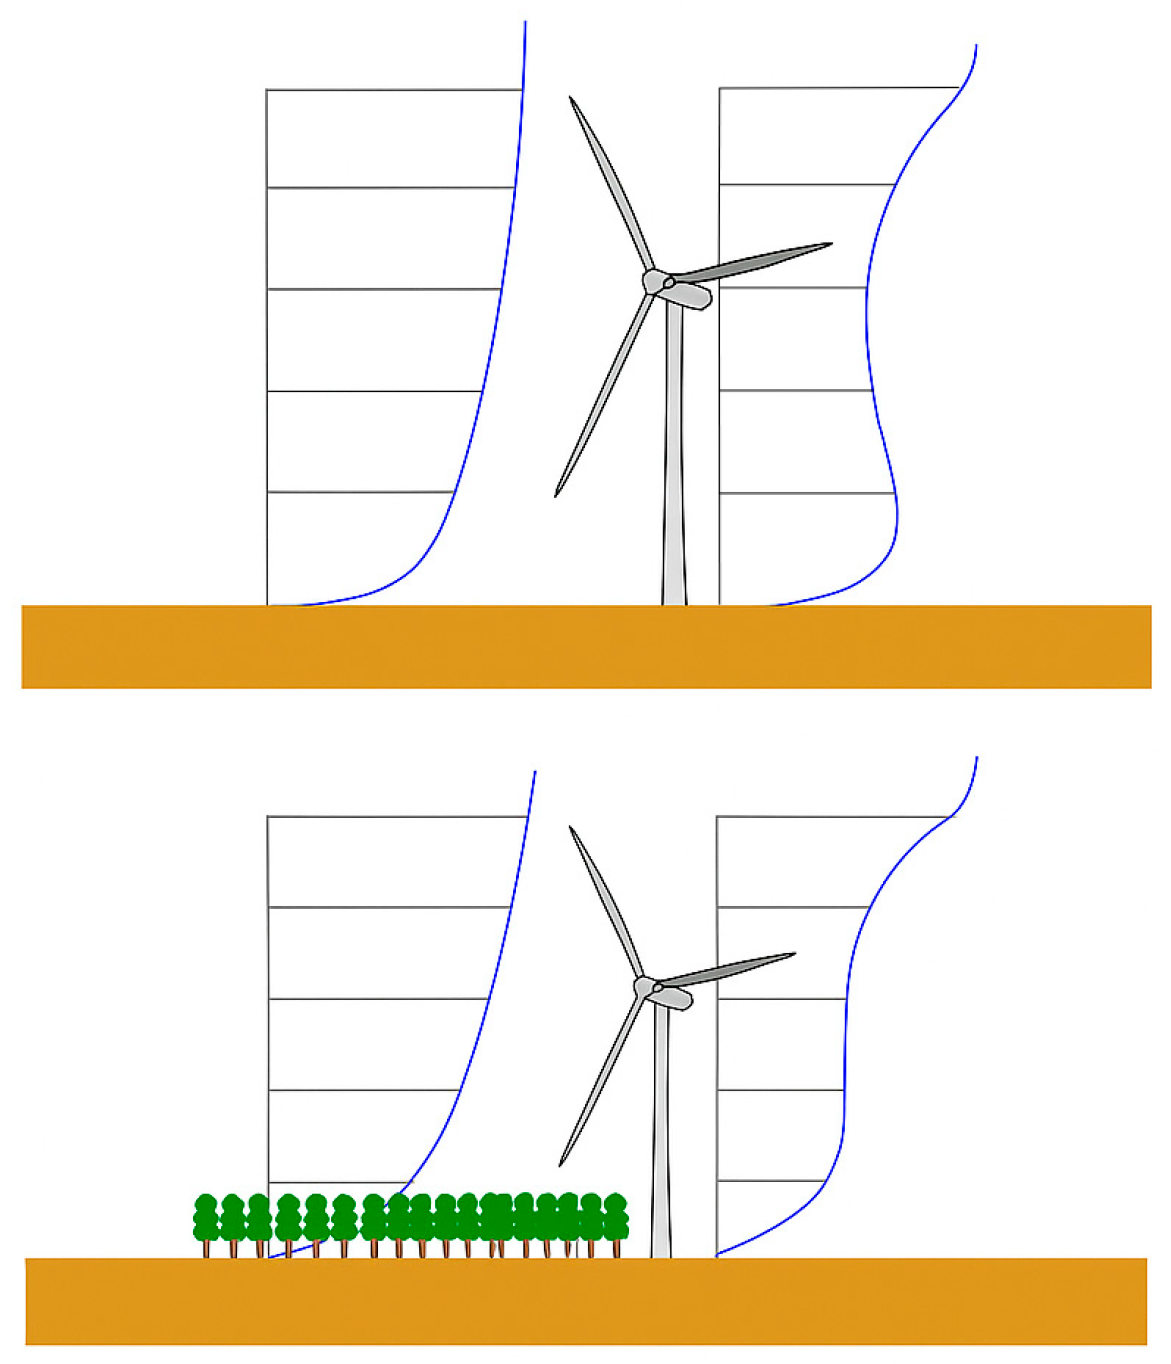
Figure 1 illustrates the influence of forested terrain on wind flow behaviour compared with flat terrain. In the upper diagram, the wind profile over flat land shows a nearly logarithmic increase in velocity with height, allowing the turbine to operate in a relatively uniform, undisturbed flow field. In contrast, the lower diagram demonstrates the effects of a forest canopy on wind flow distribution. The presence of trees increases surface roughness and the displacement height, resulting in a pronounced wind-speed deficit within and immediately above the canopy layer. This results in a lower effective wind speed at the turbine hub and increased turbulence intensity in the near-canopy region.
The vertical profile of wind speed is governed by the interaction between the airflow and the underlying surface and can be described by the logarithmic wind law. As height increases, the influence of surface friction decreases, leading to higher wind speeds; however, the rate of this increase depends strongly on the surface roughness length (z
0). Larger z
0 values correspond to greater turbulence and energy dissipation, resulting in a slower rise in wind speed near the ground. This effect is clearly illustrated in the report [
20], which demonstrates that for z
0 = 0.0001 m (smooth surfaces, such as open water), the wind speed increases rapidly with height, whereas for z
0 = 3 m (urban or forested terrain), the profile is much more gradual.
Accurate terrain modelling involves the precise parameterisation of surface roughness, which is impacted by the size, geometry, and distribution of roughness elements such as vegetation, built structures, and topographical features. The roughness length z₀ commonly defines the roughness. A simplified relationship between physical obstacles and z₀, as determined by Lettau, is a function of element height and wind-facing cross-sectional area, as shown in Equation 1.
Where h is the mean height of the roughness elements, S is their frontal area facing the wind, and A
H is the mean horizontal area per element. This relation provides reasonable estimates when A
H ≫ S, but may overestimate z₀ when elements are densely packed, as the airflow is lifted above them. In such cases, a displacement height must be considered, representing the level where the adequate wind flow begins. For forests or tall vegetation, z₀ should also be adjusted for canopy density, since lower canopy density reduces aerodynamic drag compared to solid surfaces [
21].
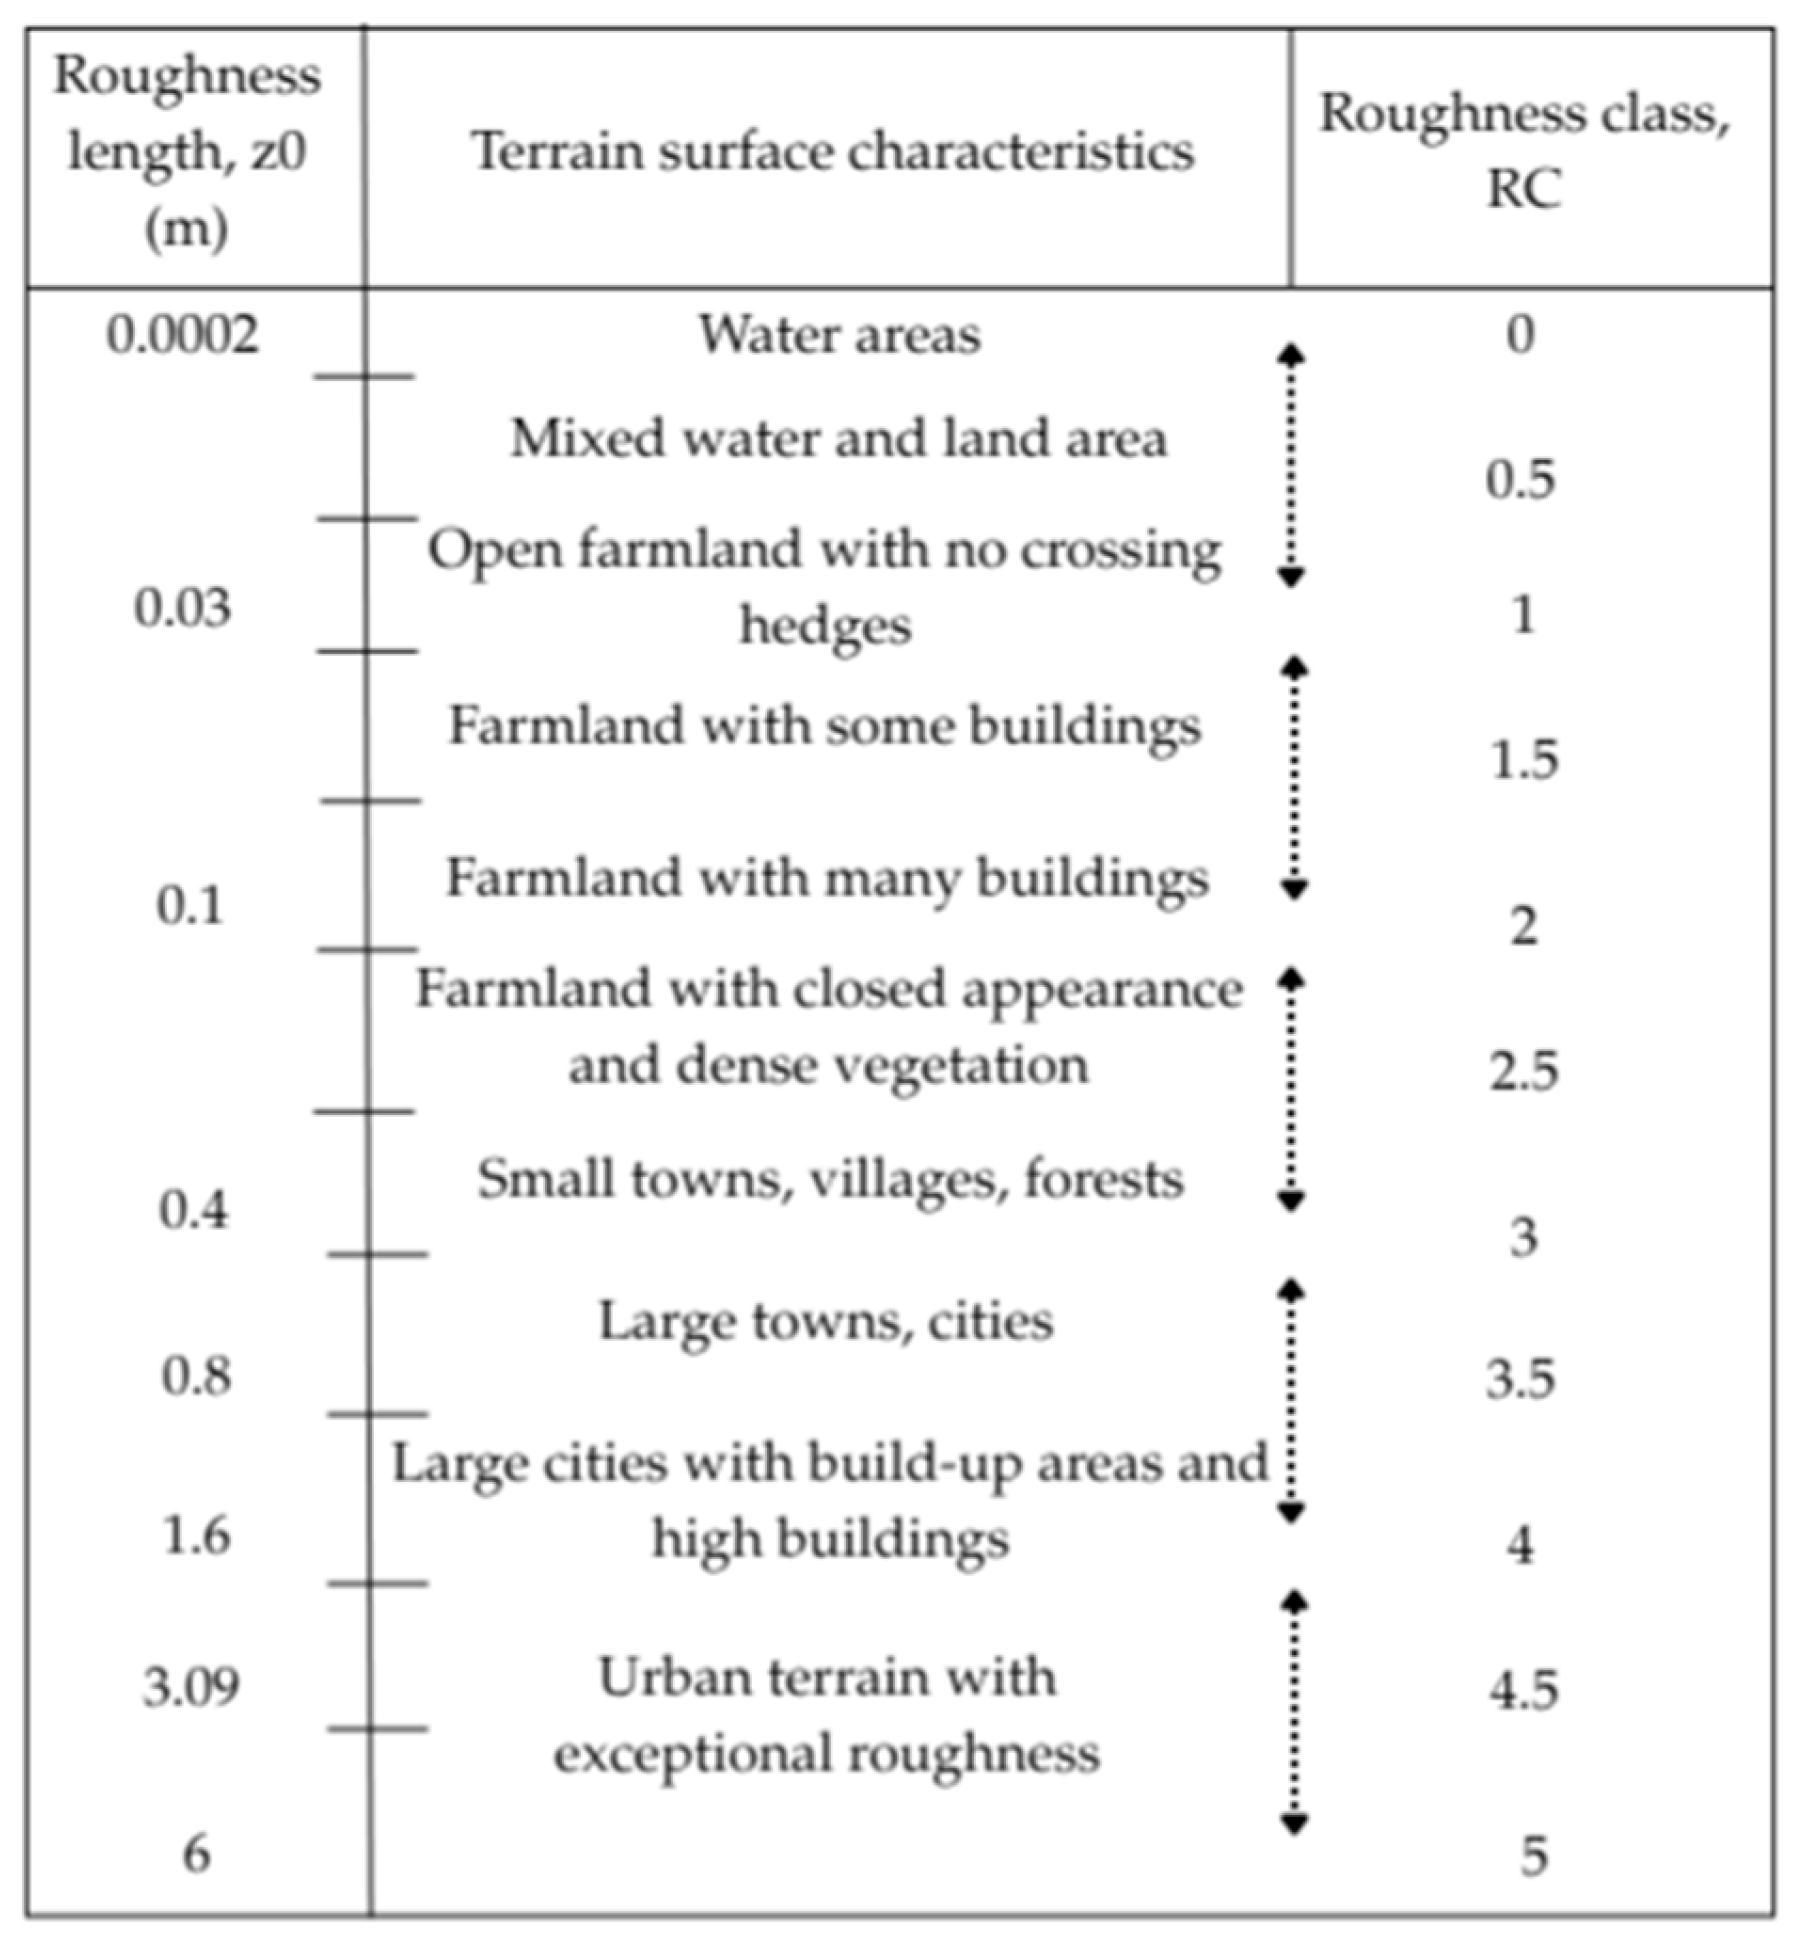
For practical application, roughness is often categorised into discrete classes. In this study, a six-class system from 0 to 5 is utilised. This scale ranges from Class 0, representing open water surfaces, to Class 5, representing very dense urban or industrial areas. Forested terrain typically falls within Classes 3 to 4, with the specific class dependent on canopy type and the corresponding roughness length (
Figure 2). The terrain roughness classification used in this study follows the WasP/WindPRO method, in which the roughness length z0 ranges from 0.0002 m (open water) to 6.0 m (urban terrain with exceptionally rough surfaces). Forested areas typically correspond to
z0≈0.4 m, which equals roughness class (
RC) 3 [
22].
3. Results
3.1. Study Area
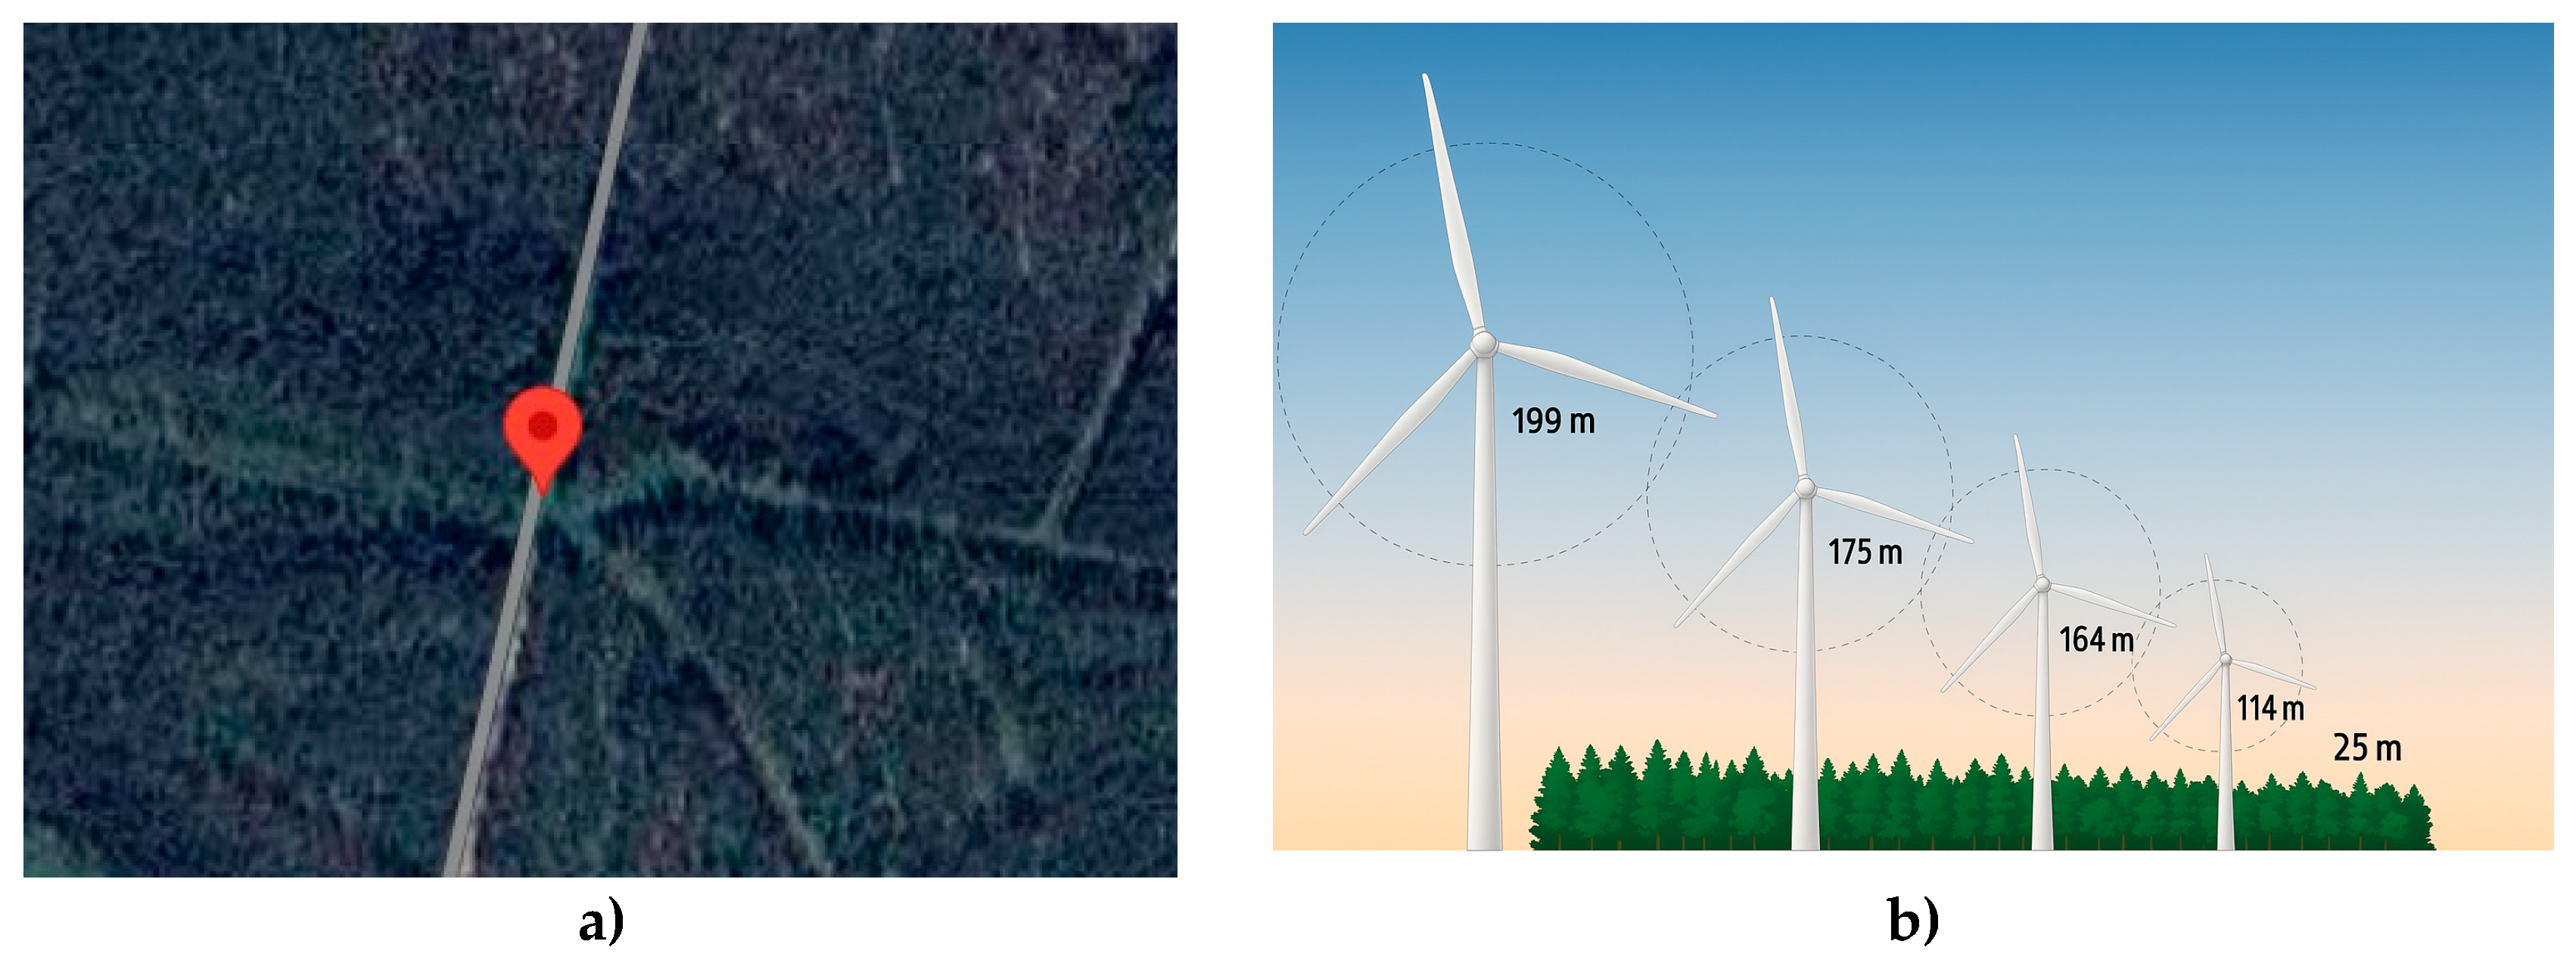
The object of the study is a wind turbine installed in a forested area in the northeast of Latvia (
Figure 4), a region characterised by a temperate cold climate, predominance of forested areas, and complex terrain of the underlying surface. The selected territory is characterised by a significant proportion of forest land and a heterogeneous vegetation structure, making it particularly relevant for studying the influence of the forest canopy on wind profiles, turbulence intensity, wake dynamics, and, consequently, on wind turbine energy production. The average height of the forest in this area is approximately 25 metres.
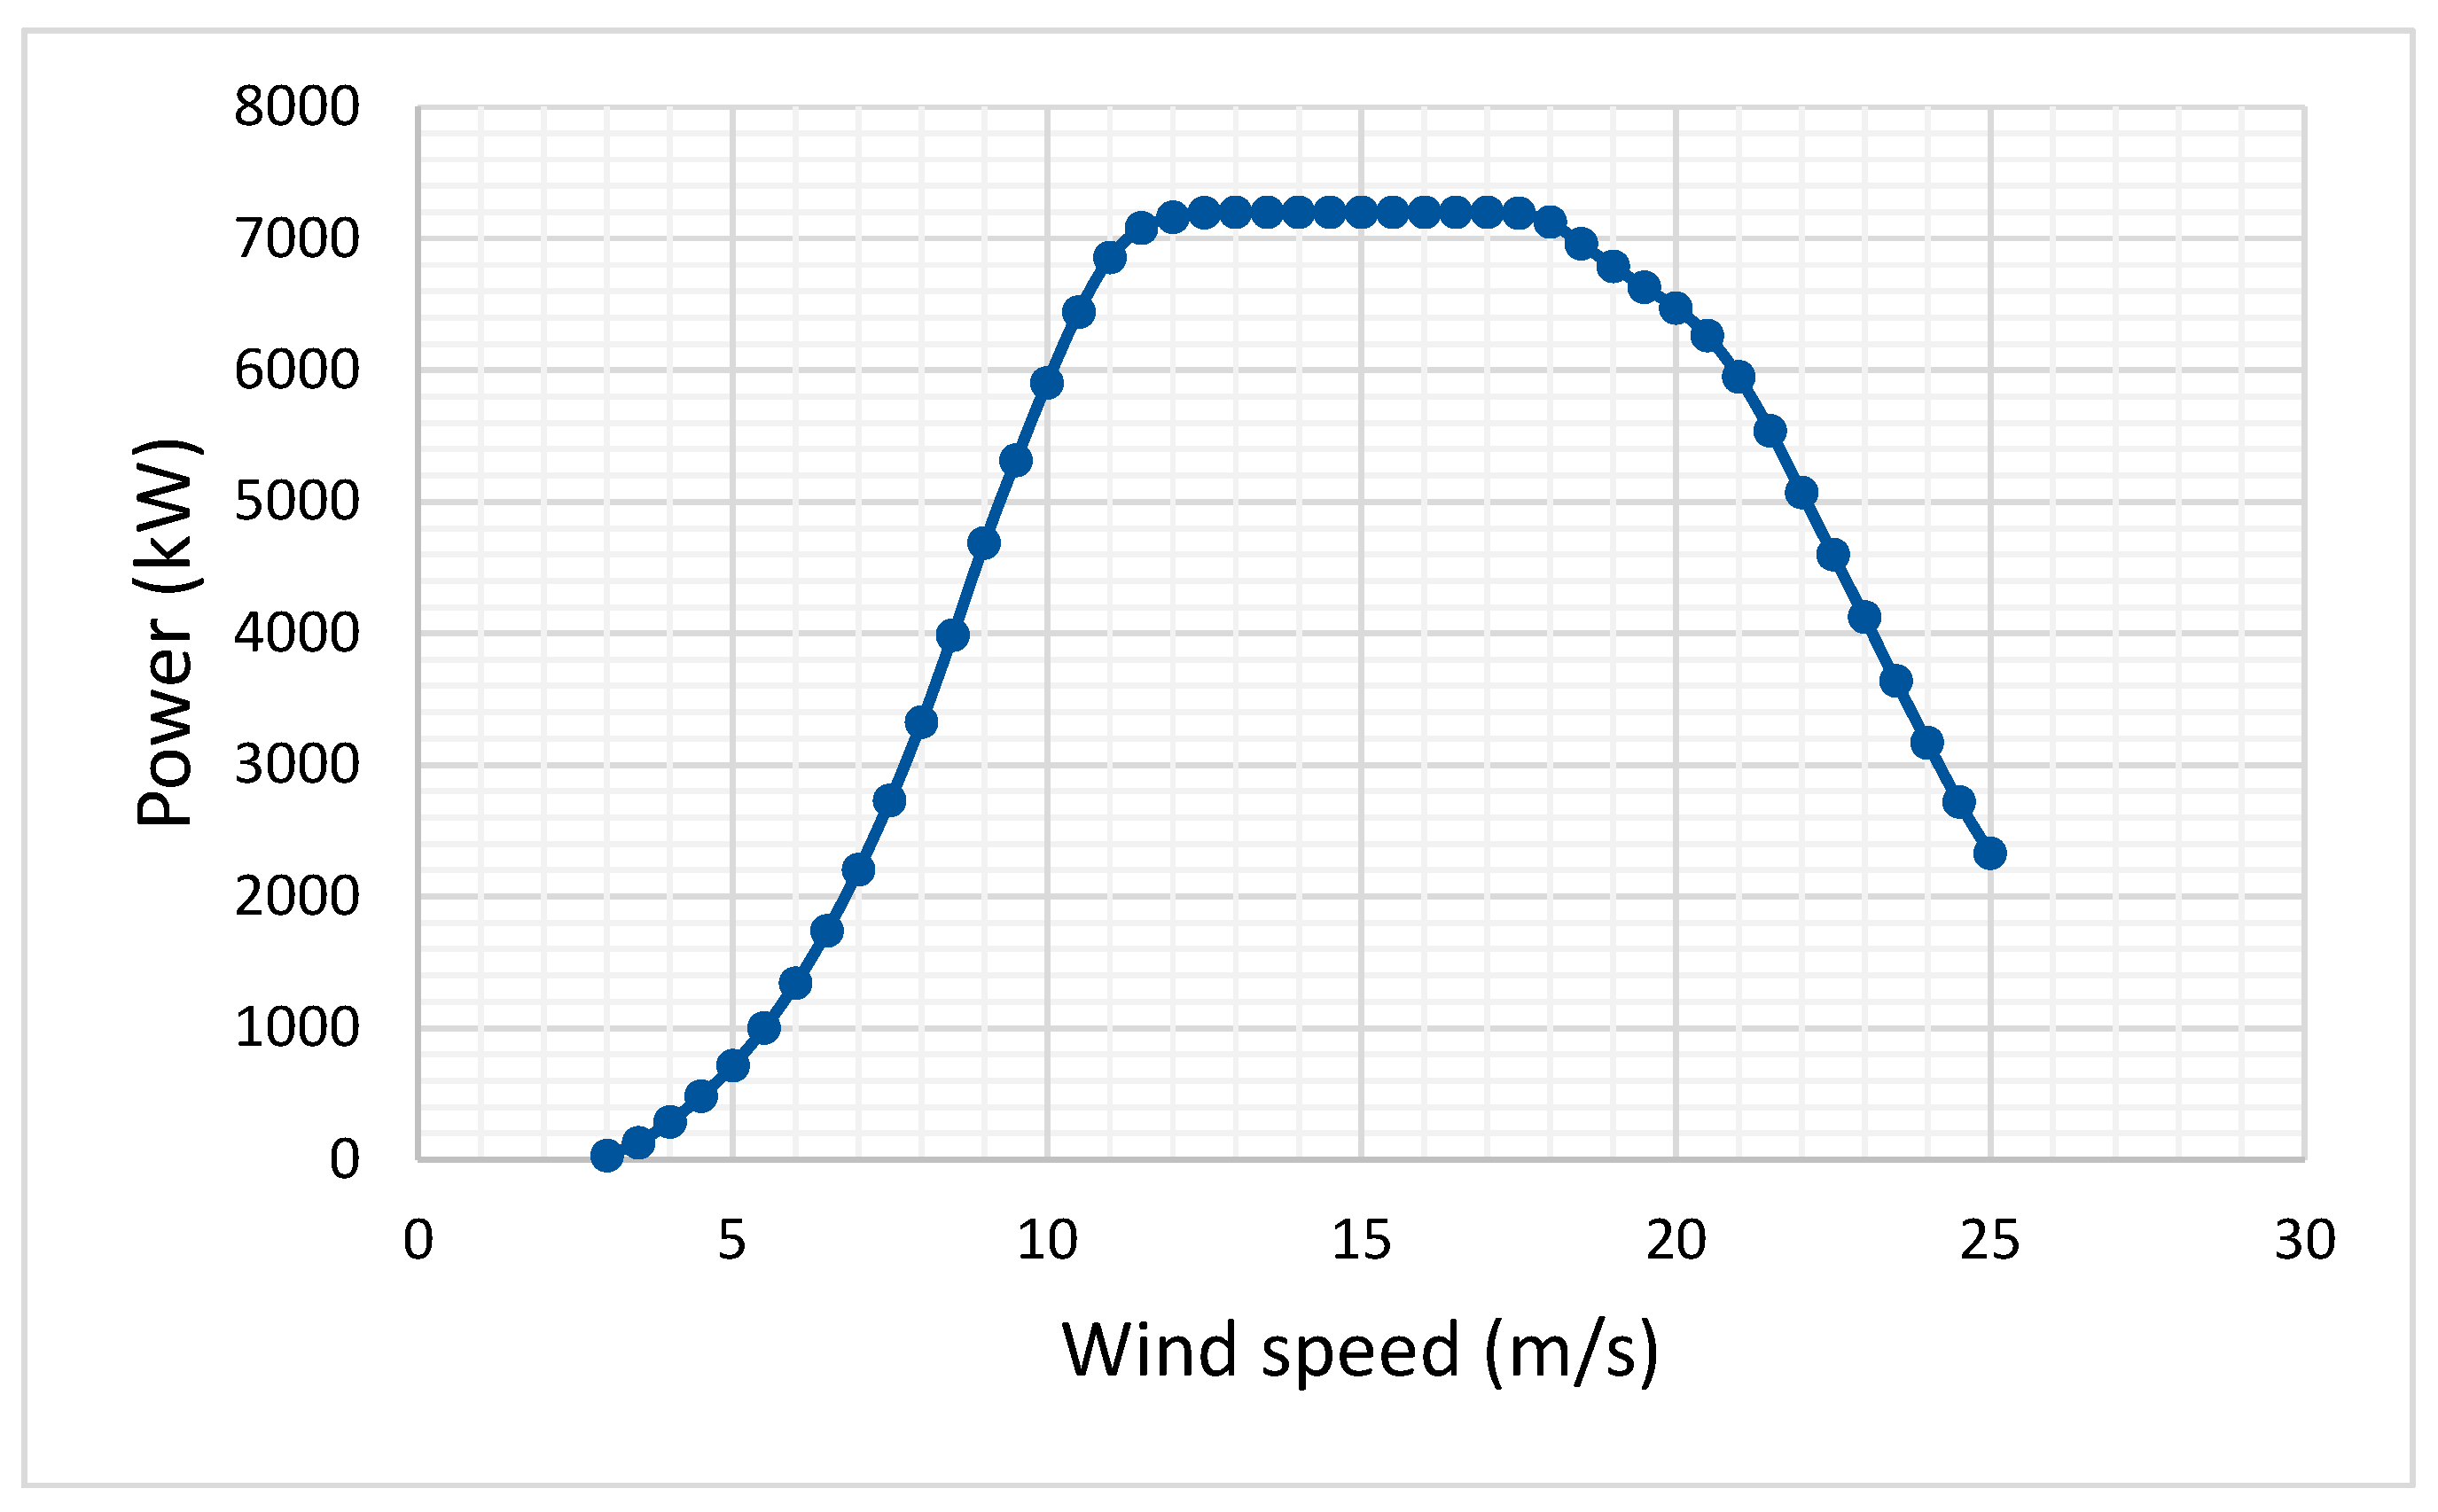
In this study, the Vestas V172-7.2 MW wind turbine is used as the reference model. This modern, large-scale turbine is designed for moderate and low wind speeds (IEC 61400-1:2019 Class IIA/B and IIIA/B).
Table 2 presents the main technical specifications of the Vestas V172 7.2 MW turbine. The power curve at an air density of 1.225 kg/m
3 is presented in
Figure 3. As illustrated in
Figure 4, the study site is located in a densely forested region of northern Latvia, and the comparative height schematic shows the geometry of the modelled Vestas 7.2 MW turbines. All simulations of wind flow and energy yield were performed for multiple hub heights.
Figure 4.
Location and comparative height illustration of modelled wind turbines. a) satellite image showing the analysed forested site in northern Latvia; b) scaled schematic of Vestas 7.2 MW wind turbines.
Figure 4.
Location and comparative height illustration of modelled wind turbines. a) satellite image showing the analysed forested site in northern Latvia; b) scaled schematic of Vestas 7.2 MW wind turbines.
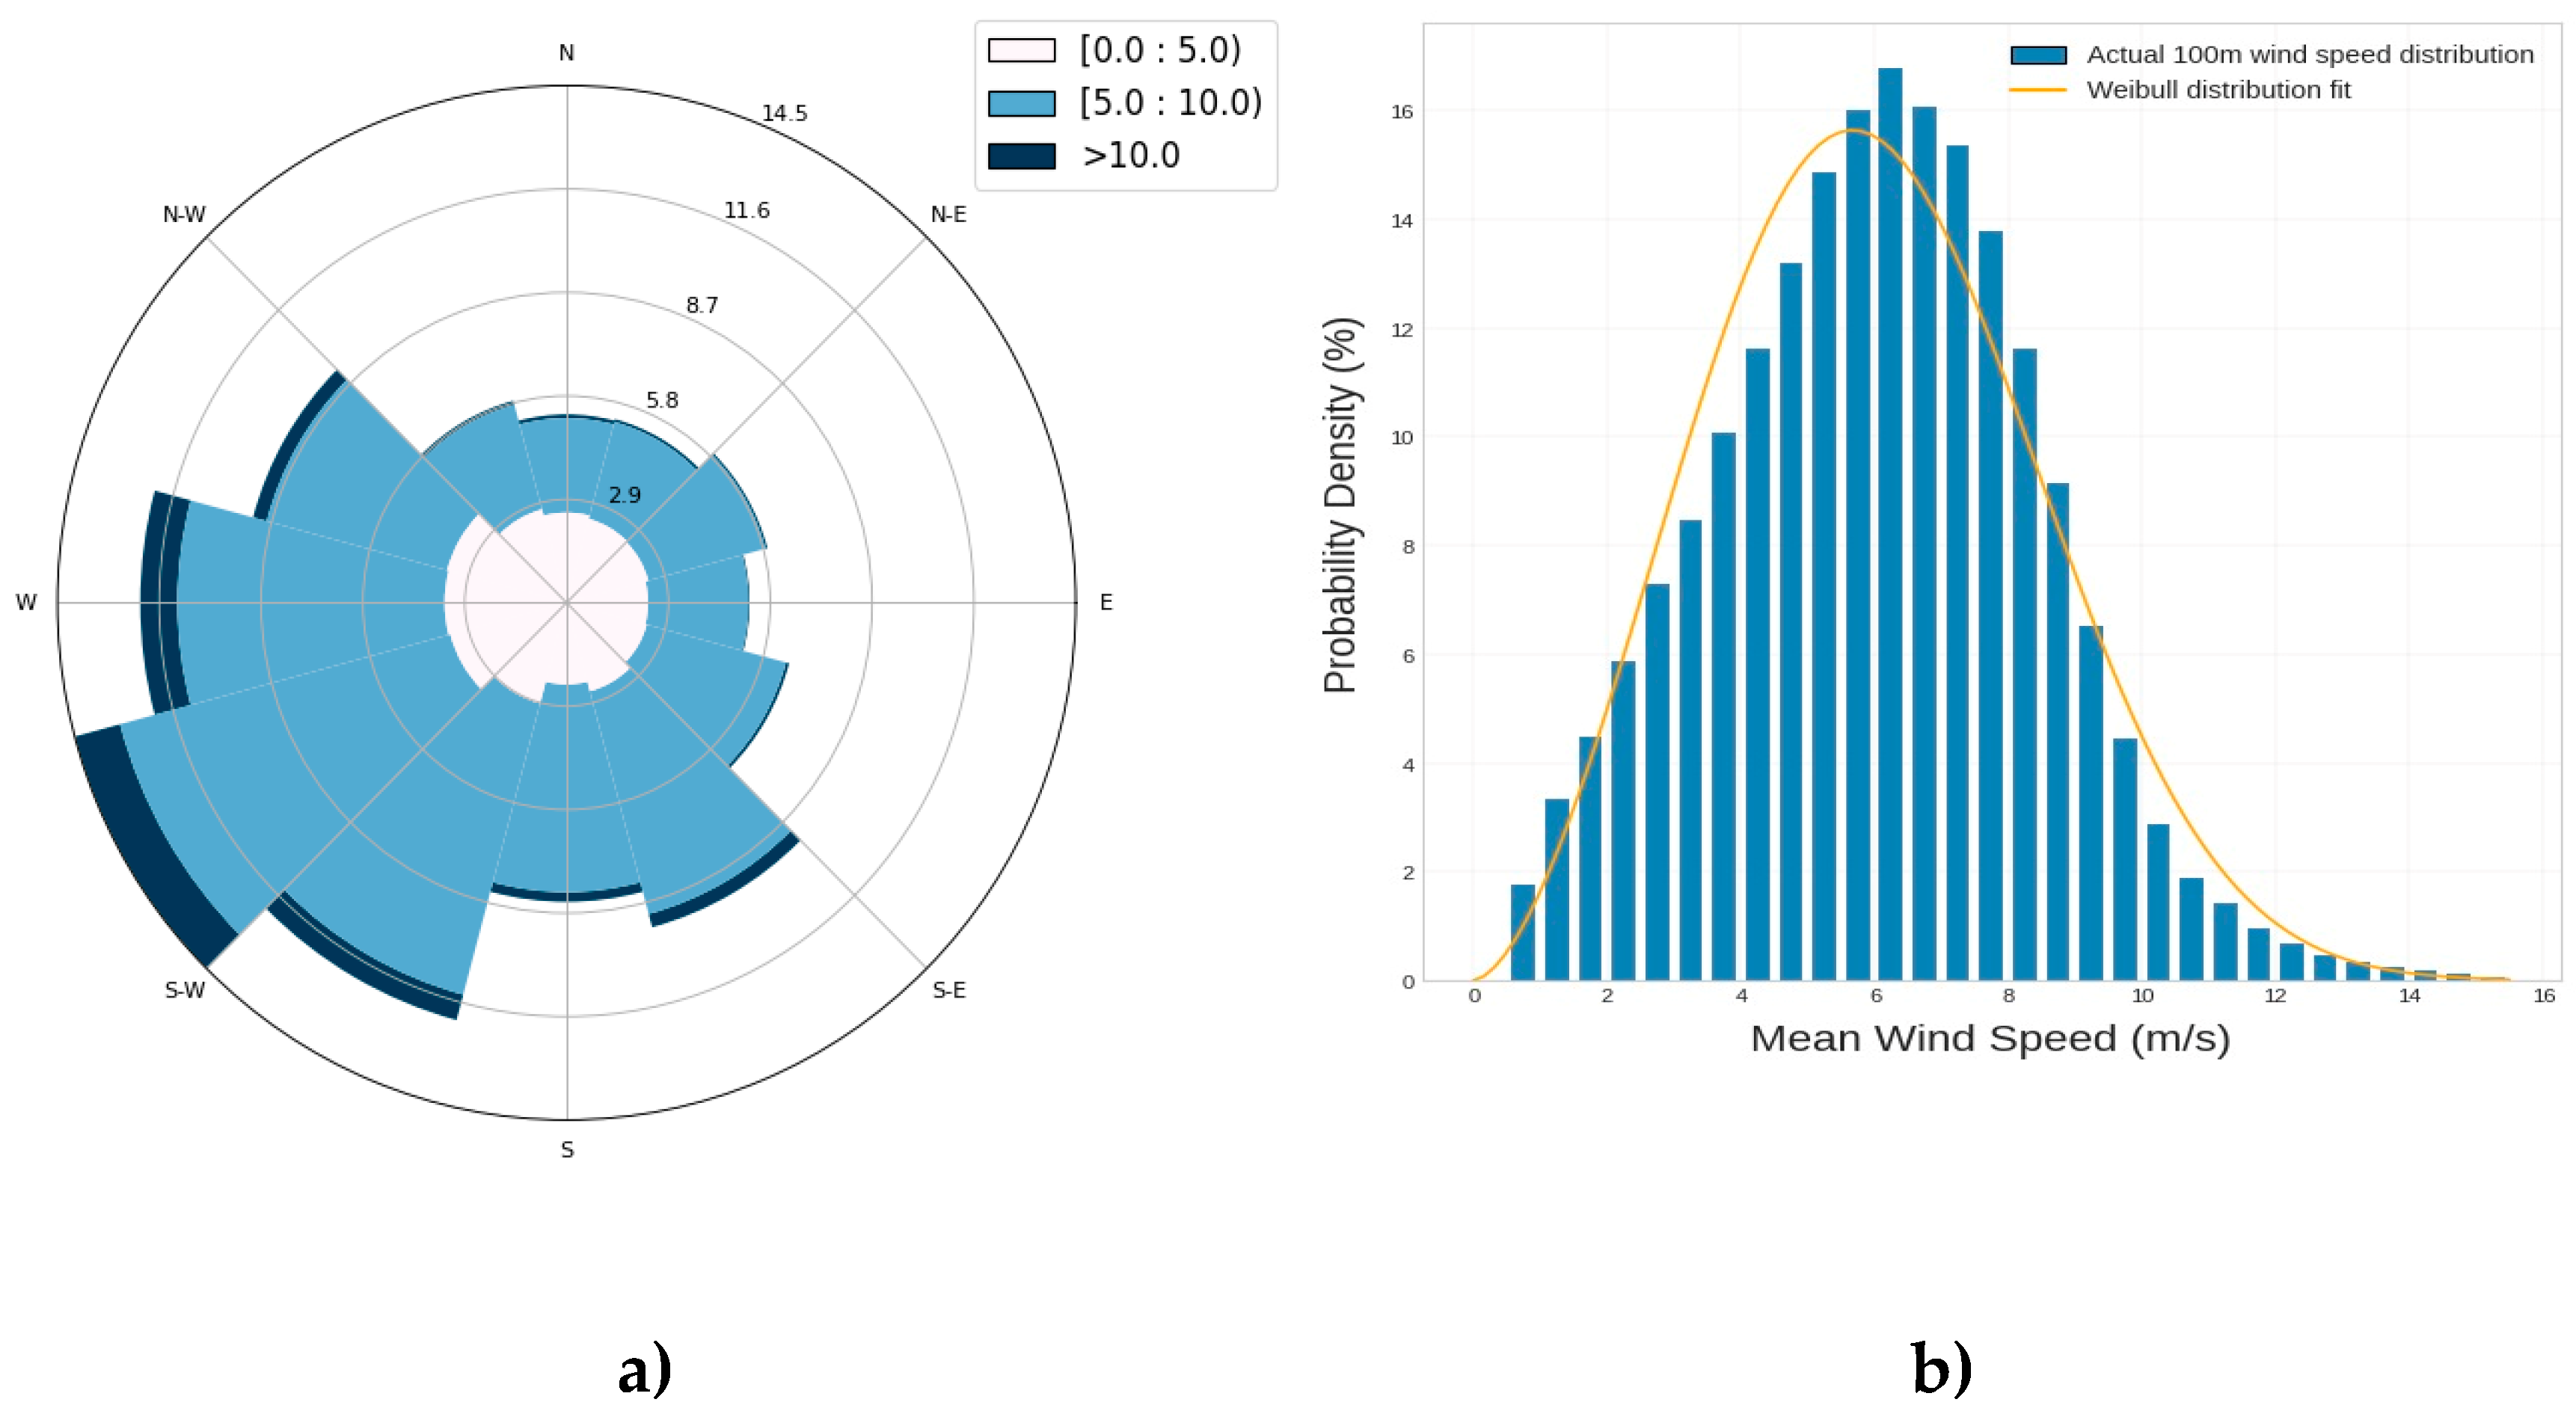
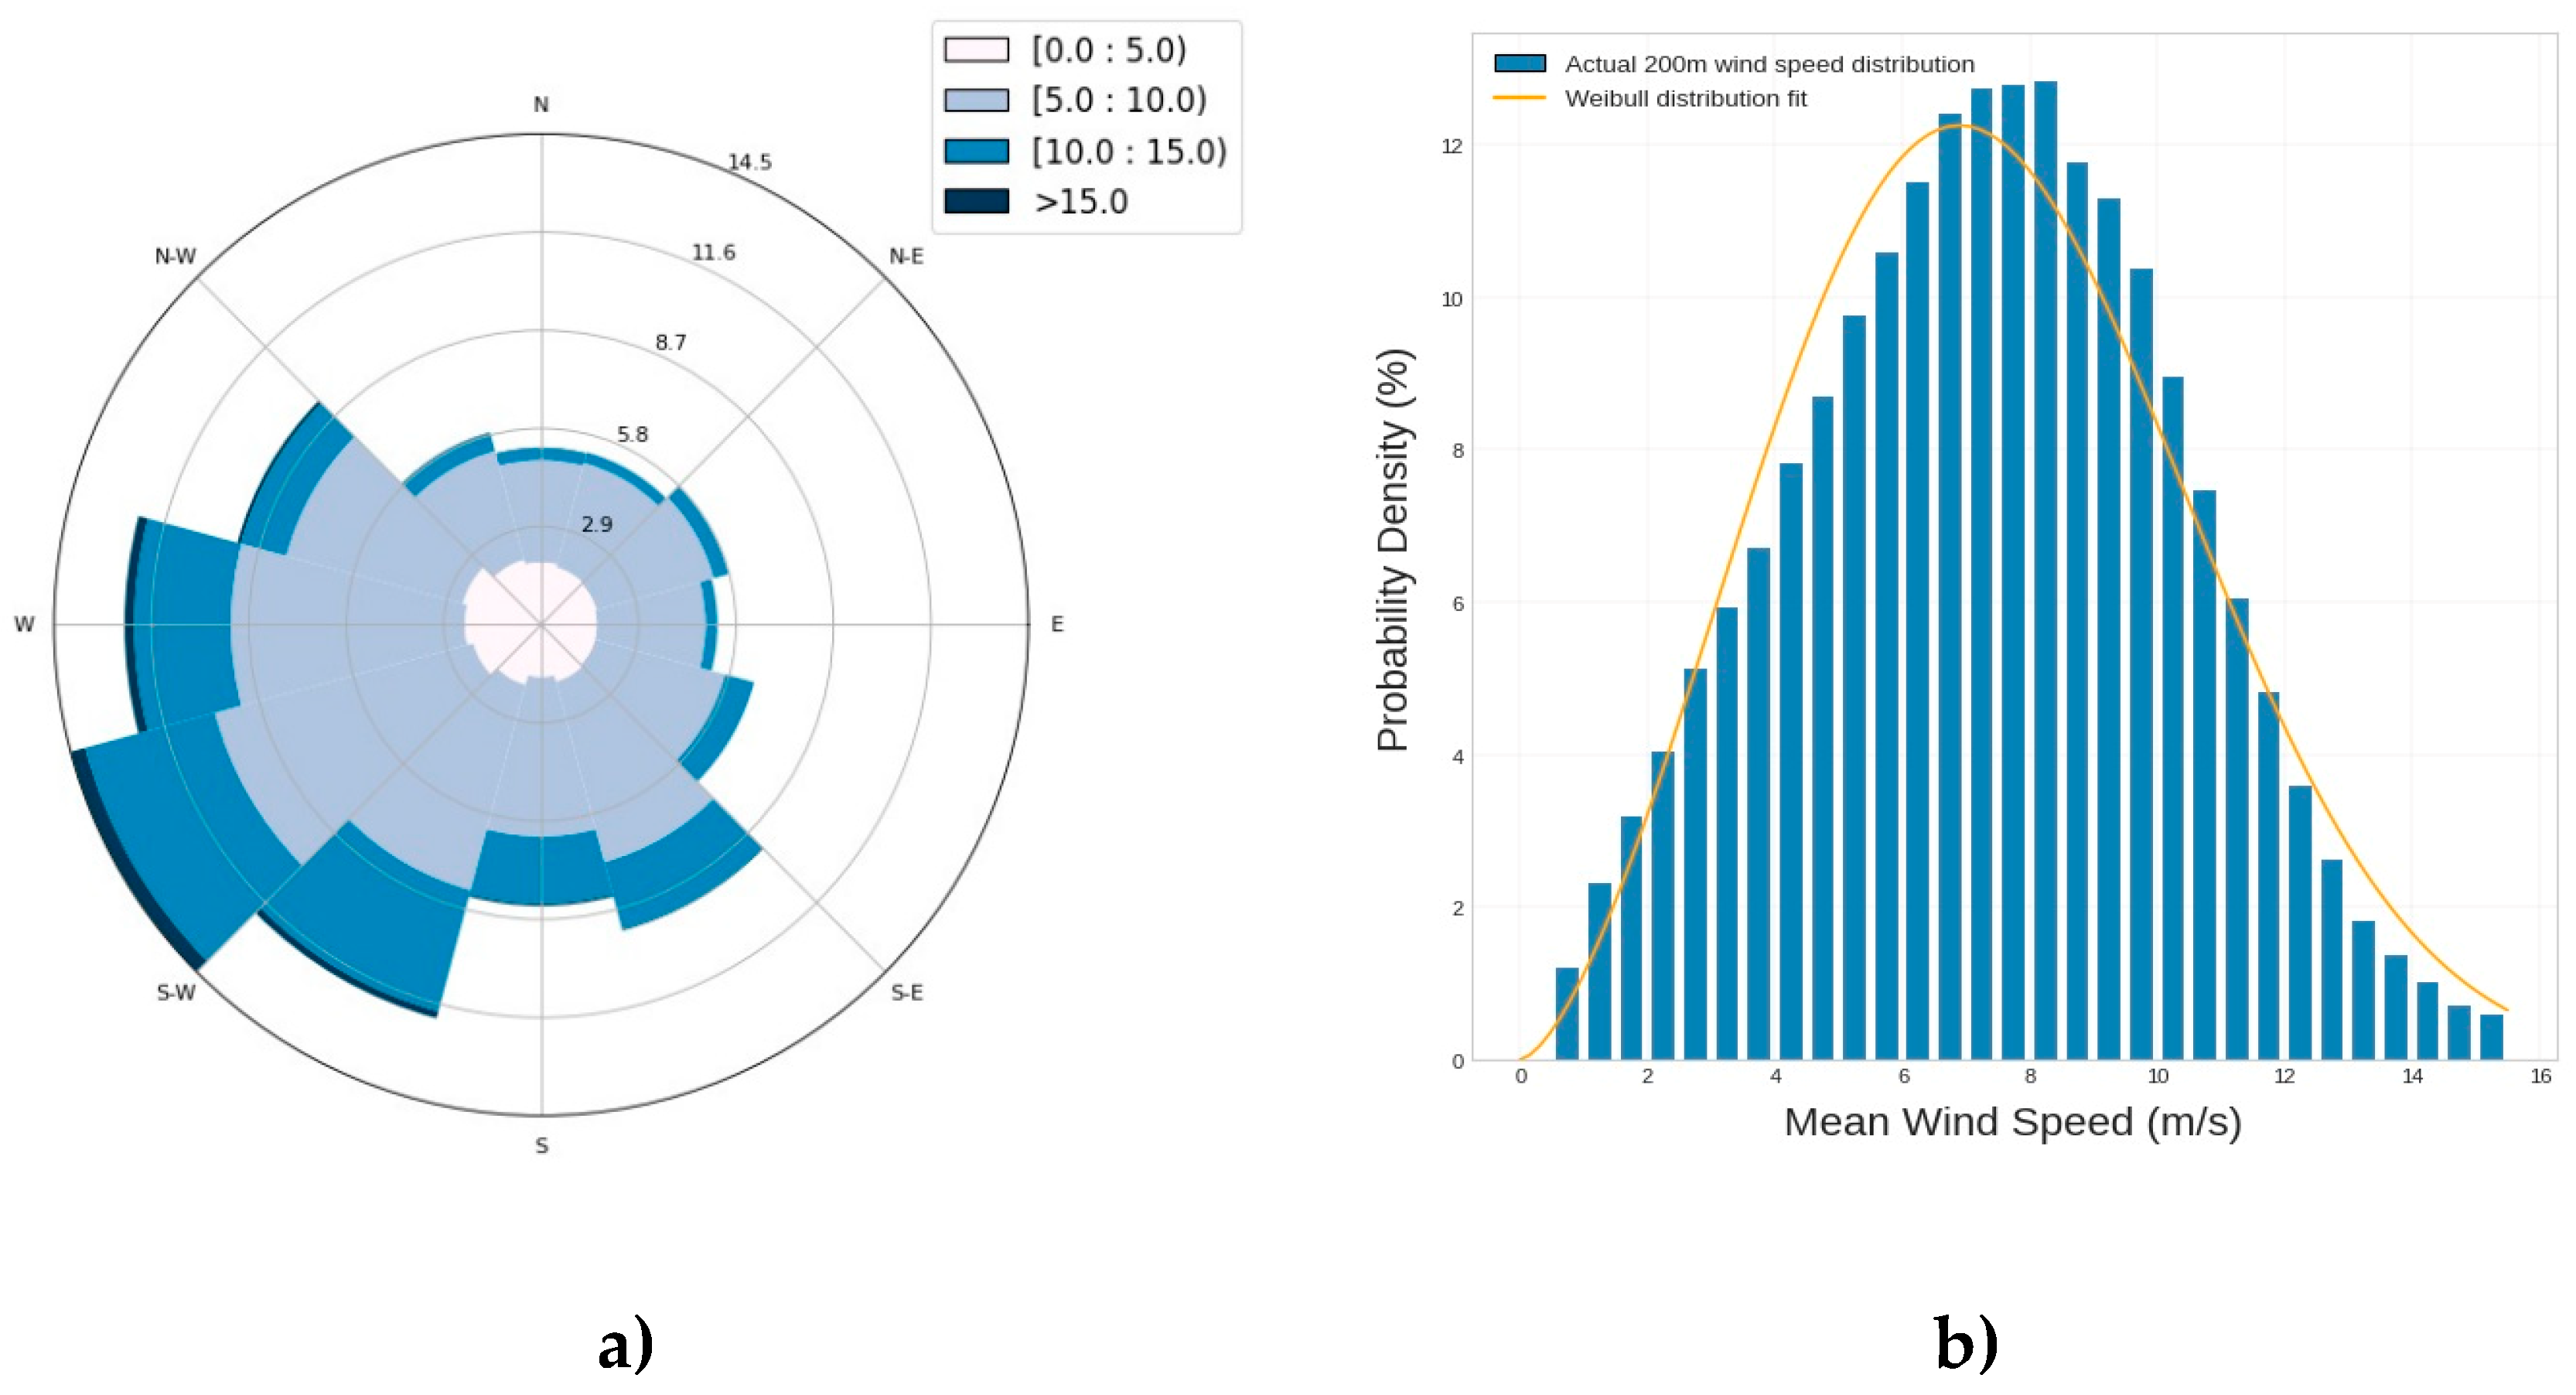
The study used historical data from the NORA3 source.
Figure 5 and
Figure 6 present the wind roses and Weibull distributions for measurement heights of 100 m and 200 m, respectively, calculated from NORA3 data collected from January 1999 to July 2025. NORA3 dataset, a high-resolution (3 km) regional atmospheric reanalysis developed by the Norwegian Meteorological Institute [
24].
The wind rose indicates a dominant flow direction from the west and south-west at both altitudes, with greater uniformity and wind intensity observed at 200 m. This suggests a stable vertical structure of the wind flow.
3.2. Effect of Seasonal Wind Variation on Energy Yield
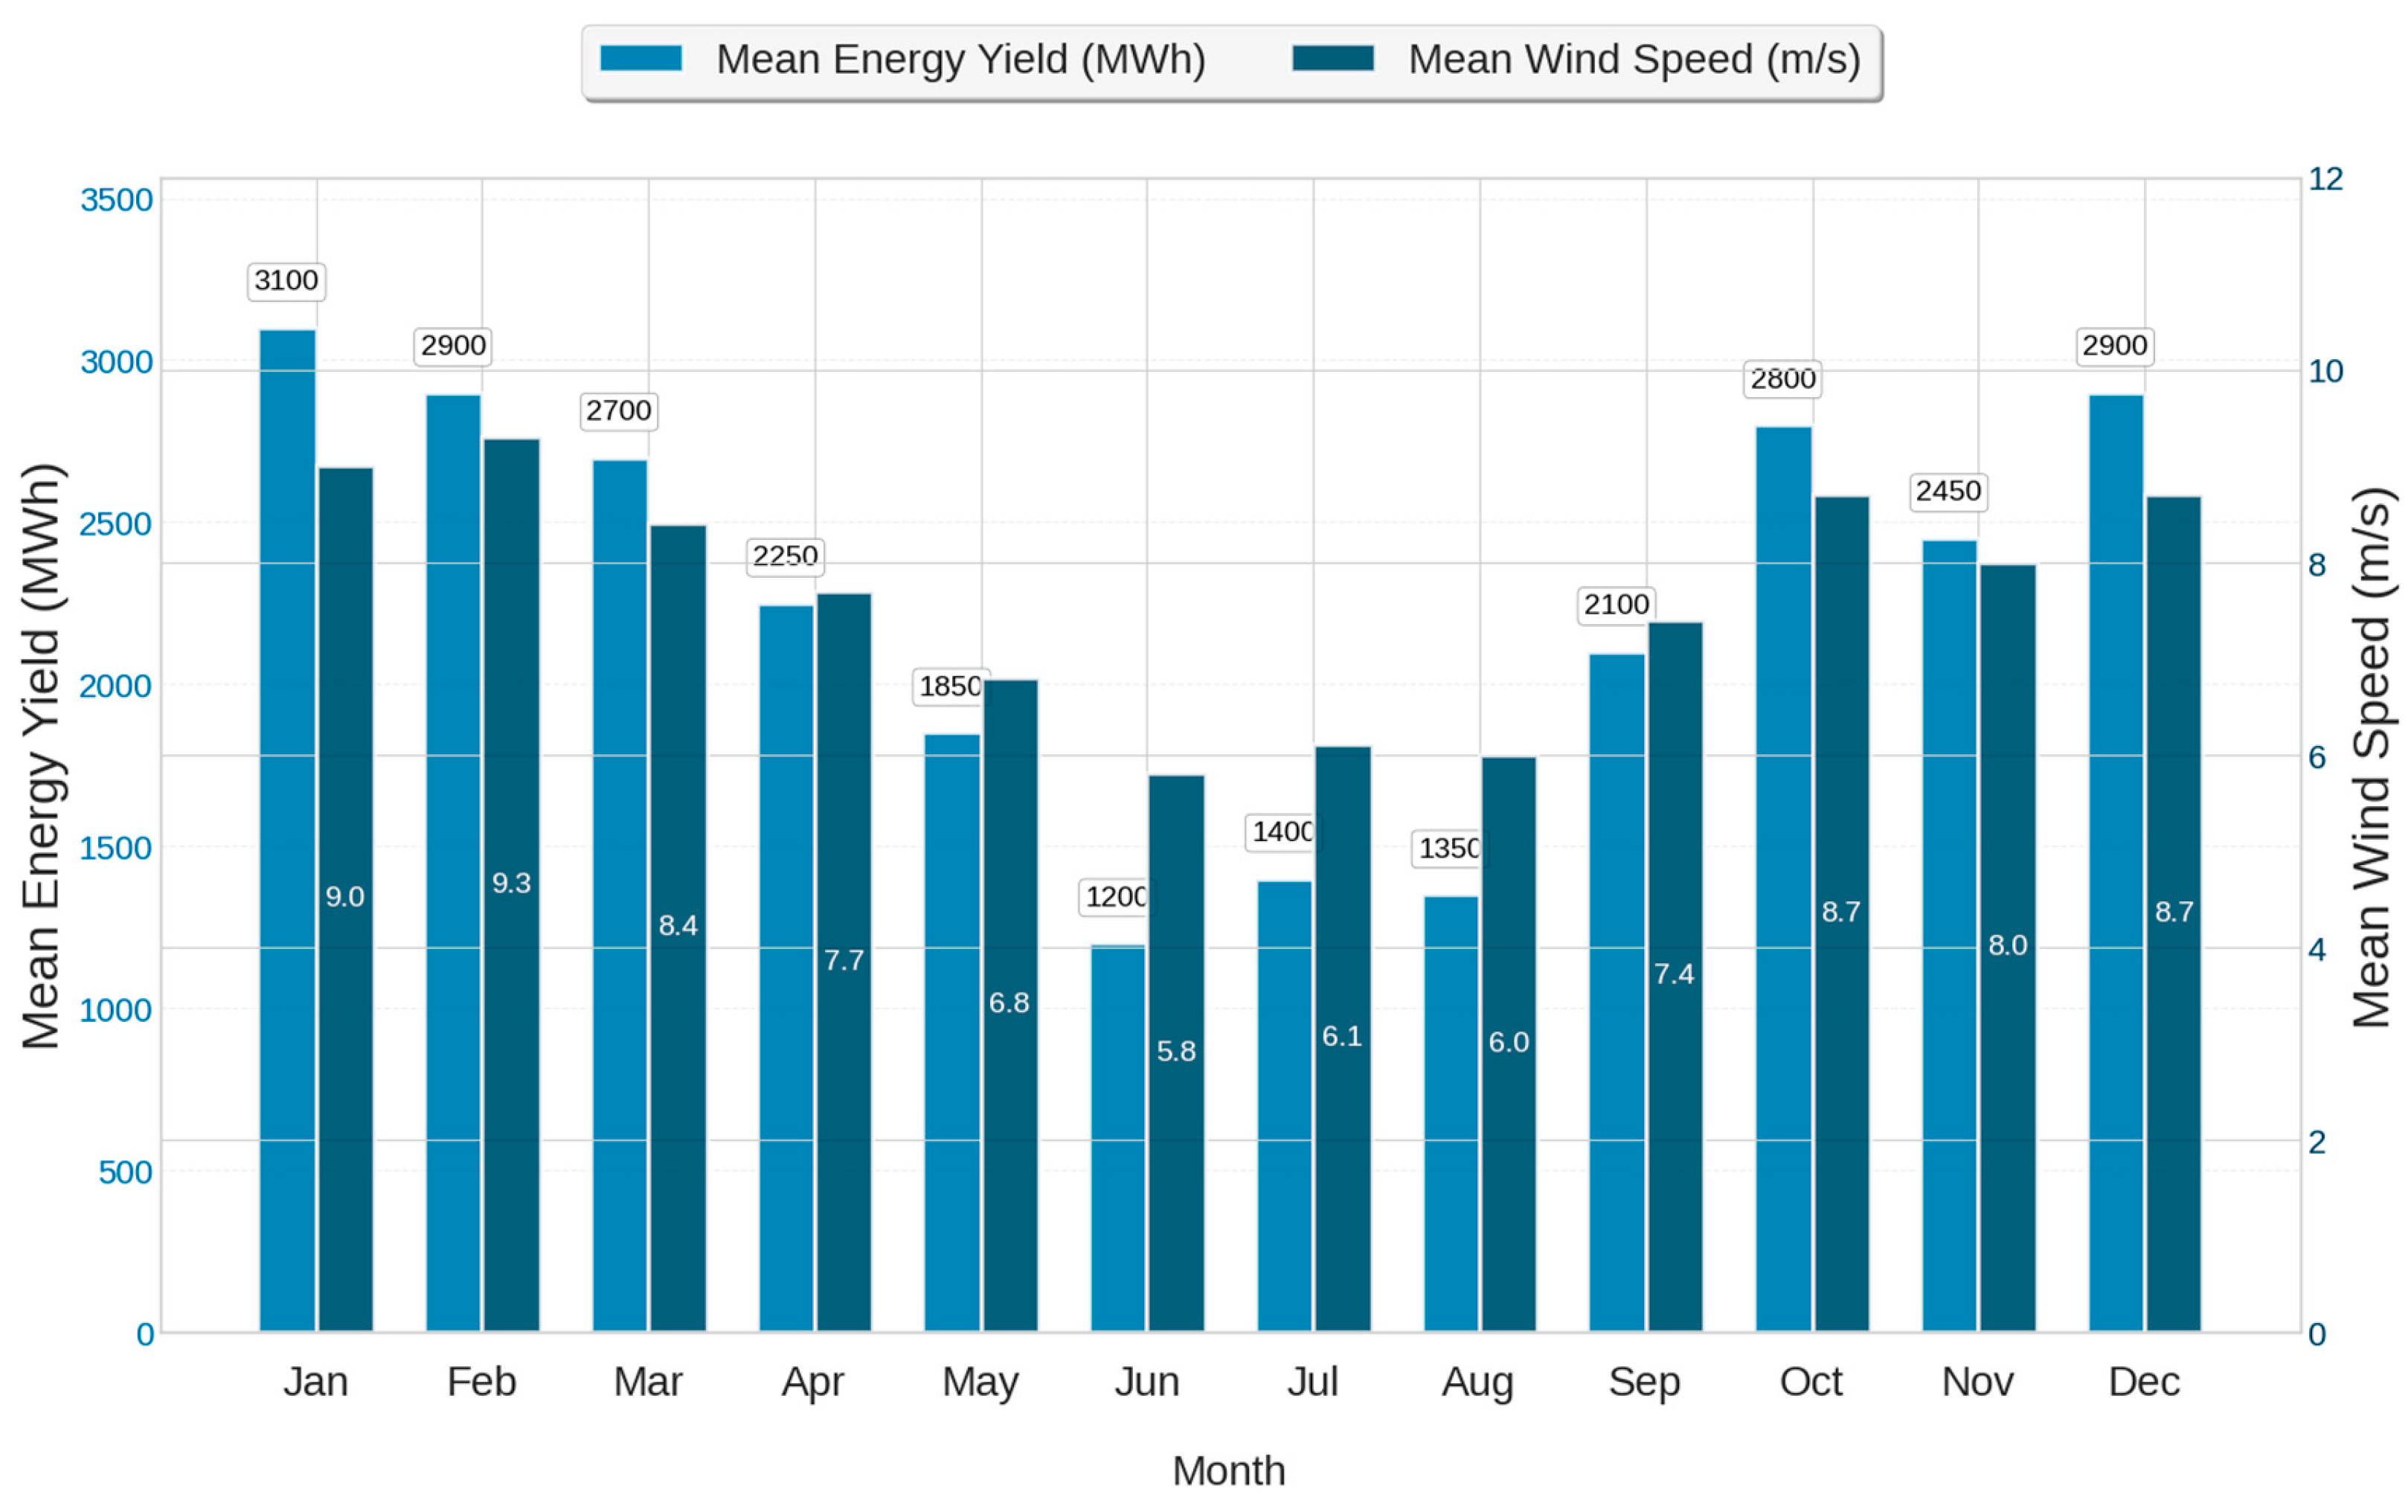
Figure 7 shows the monthly variation of average energy yield (MWh) and average wind speed (m/s) throughout the year at a hub height of 199 m. The graph is based on a 5-year meteorological dataset obtained from NORA3. The results reveal a clear seasonal pattern, with both parameters being higher during the winter months and lower during the summer period.
The highest energy production occurs in January (3100 MWh), followed by February (2900 MWh) and December (2900 MWh), corresponding to mean wind speeds of approximately 9.0–9.3 m/s. Conversely, the lowest energy yield is observed in June (1200 MWh), coinciding with the minimum mean wind speed of 5.8 m/s. From July onwards, wind conditions gradually improve, leading to a steady increase in energy output that peaks again during autumn and winter. This pattern reflects the typical seasonal wind regime in temperate climates, where stronger and more consistent winds dominate the colder months. The strong correlation between mean wind speed and energy yield highlights the sensitivity of wind turbine performance to seasonal wind variability.
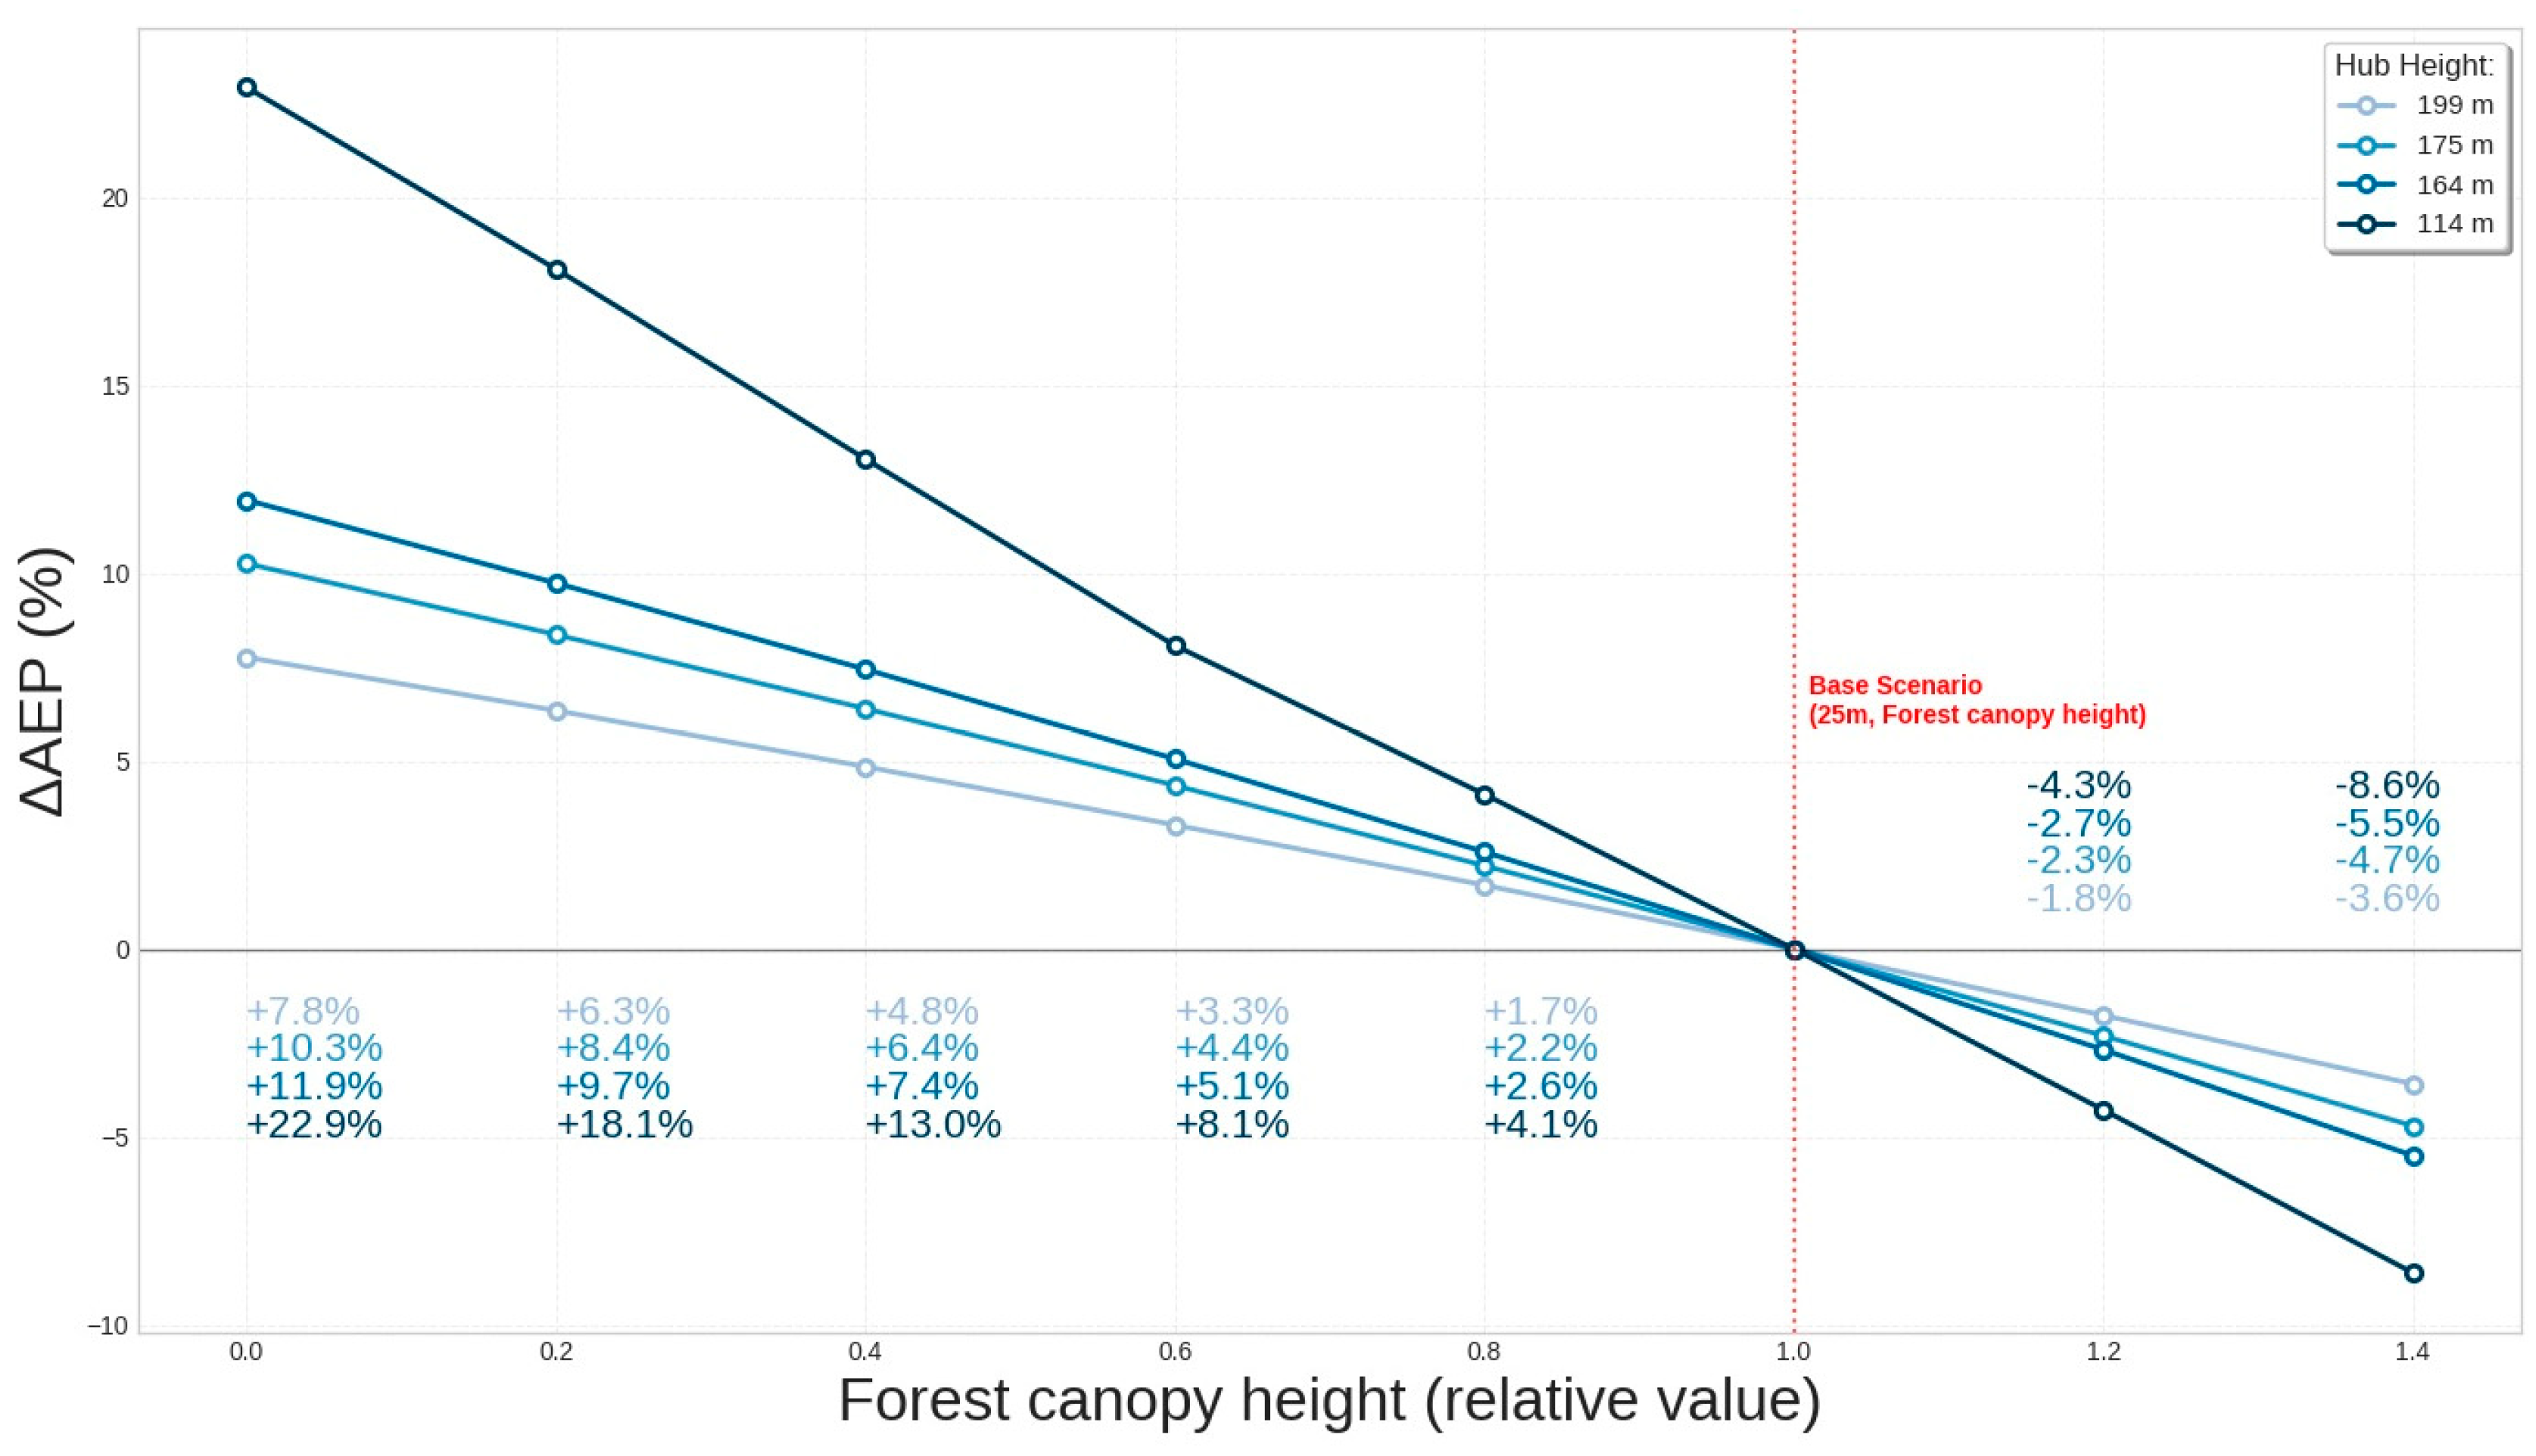
3.3. Effect of Canopy Height on Annual Energy Production
To evaluate the impact of forest canopy on wind turbine performance, a parametric sensitivity analysis was conducted to assess annual energy production (AEP) as a function of the canopy coefficient. This coefficient is defined as a multiplier based on a tree height of 25 metres (the baseline coefficient is set at 1.0). The canopy height varied from 0 to 35 m, corresponding to a canopy coefficient between 0.0 and 1.4, where the reference tree height was 25 m. Positive ΔAEP values indicate an increase in output relative to the baseline. The calculations focused on the Vestas V172-7.2 turbine, utilising four different hub heights: 114 metres, 164 metres, 175 metres, and 199 metres (see
Figure 8).
The curve shows that decreasing the coefficient increases Annual Energy Production (AEP), while increasing it reduces AEP. The lowest hub height of 114 meters shows the most incredible sensitivity, with AEP varying from +22.9% to -8.6%. Increasing the hub height from 114 meters to 164-175 meters significantly reduces the impact of canopy changes on AEP, as it elevates the rotor above the high-turbulence layer above the treetops. The slight difference in AEP between heights of 164 and 175 meters is negligible compared to other uncertainties. At a hub height of 199 meters, the range of AEP variation narrows to +7.8% to -3.6%.
At a hub height of 114 metres, the V172-7.2 rotor, with an 86-metre radius, has its lower tip approximately 28 metres above ground. With a representative canopy height of 25 metres, this results in a clearance of only about 3 metres above the treetops. Consequently, part of the rotor operates within the zone of intense turbulence just above the canopy. This zone, known as the roughness (canopy) sublayer, typically extends to roughly twice the canopy height above the treetops. Therefore, at a hub height of 114 metres, a significant part of the rotor disc is situated within an unfavourable height range.
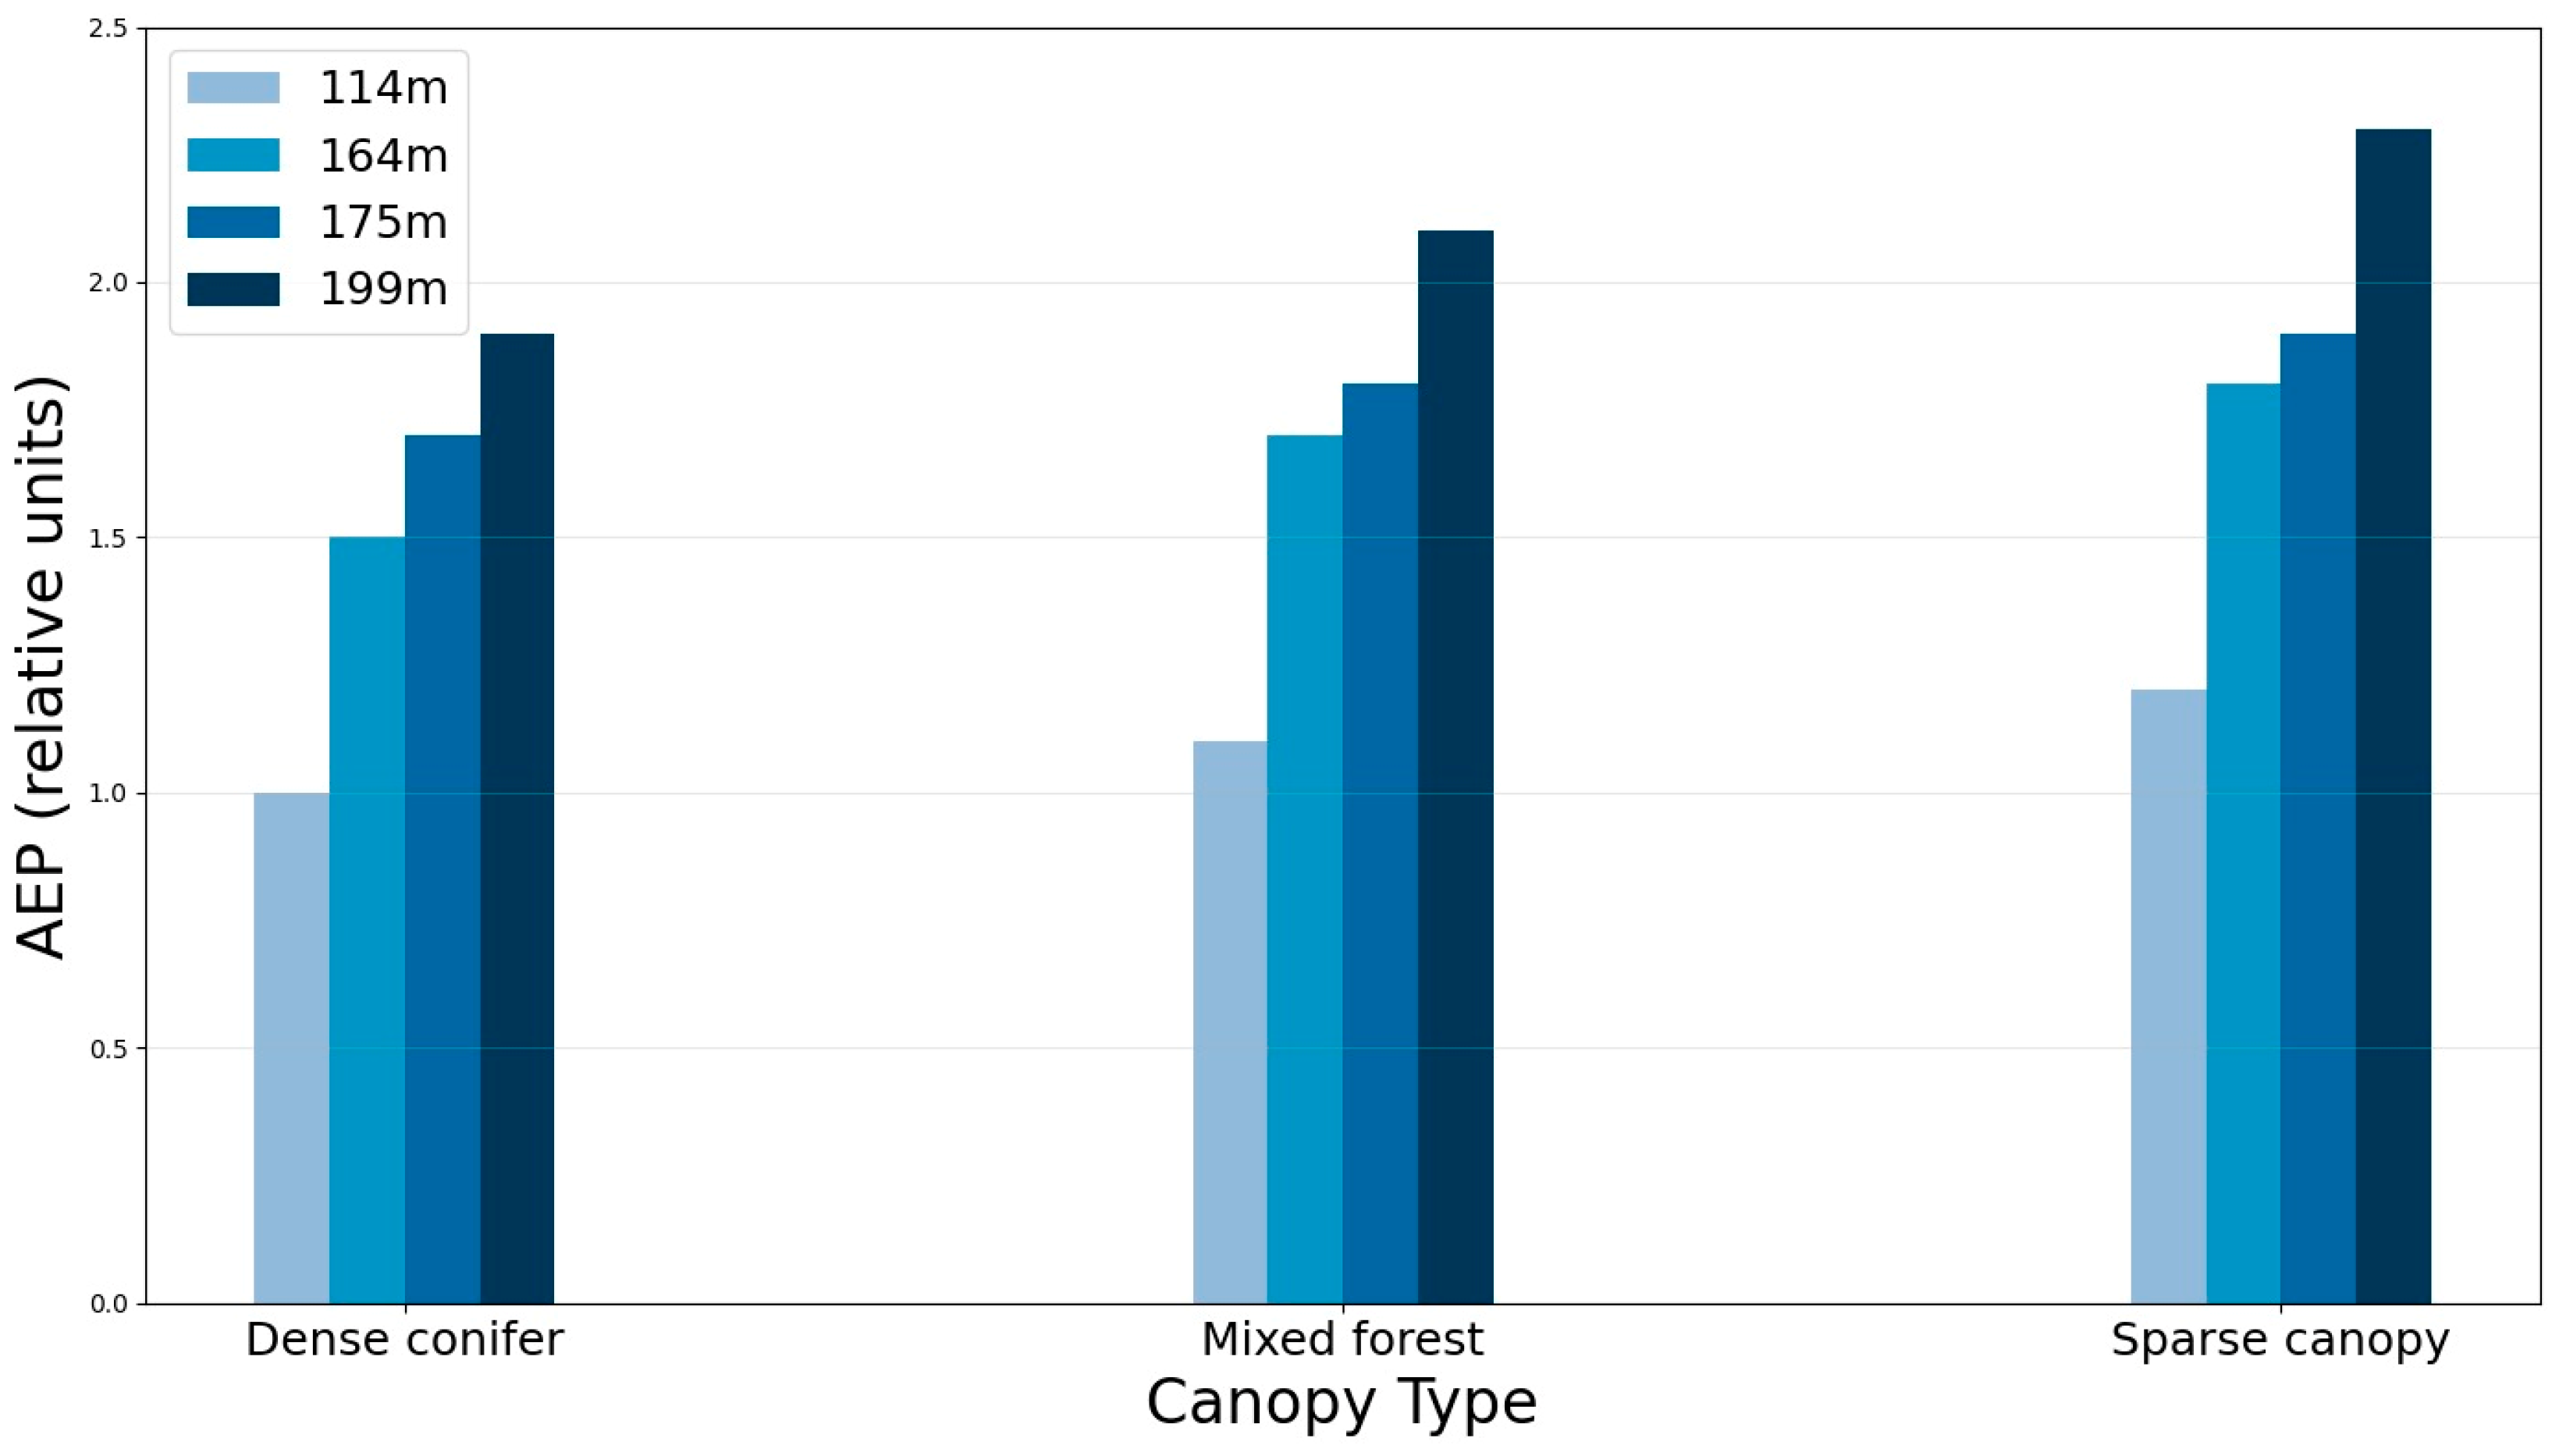
3.4. Effect of Forest Canopy Type on Annual Energy Production
To analyse the influence of surface conditions and hub height on wind turbine performance, the results are presented as relative annual energy production (AEP). The baseline reference is defined as the AEP at a hub height of 114 metres over dense coniferous forest, which is set to unity (Relative AEP = 1).
Figure 9 illustrates how relative AEP values change as hub height increases up to 199 metres across different types of forest canopies—dense coniferous forest, mixed forest, and sparse canopy forest. The observed relationships highlight the impact of surface roughness and turbulence, influenced by varying forest density and structure, on energy production efficiency.
The analysis results show that both hub height and the type of underlying forest canopy greatly affect the relative annual energy production (AEP). Raising the hub height from 114 to 199 m consistently increases AEP across all scenarios, mainly due to reduced surface roughness and turbulence. The highest energy yields are found over sparse canopy conditions, while the lowest occur in dense coniferous forests. Additionally, differences between canopy types become more pronounced at higher hub heights, underscoring the importance of forest features in wind resource assessment and turbine siting.
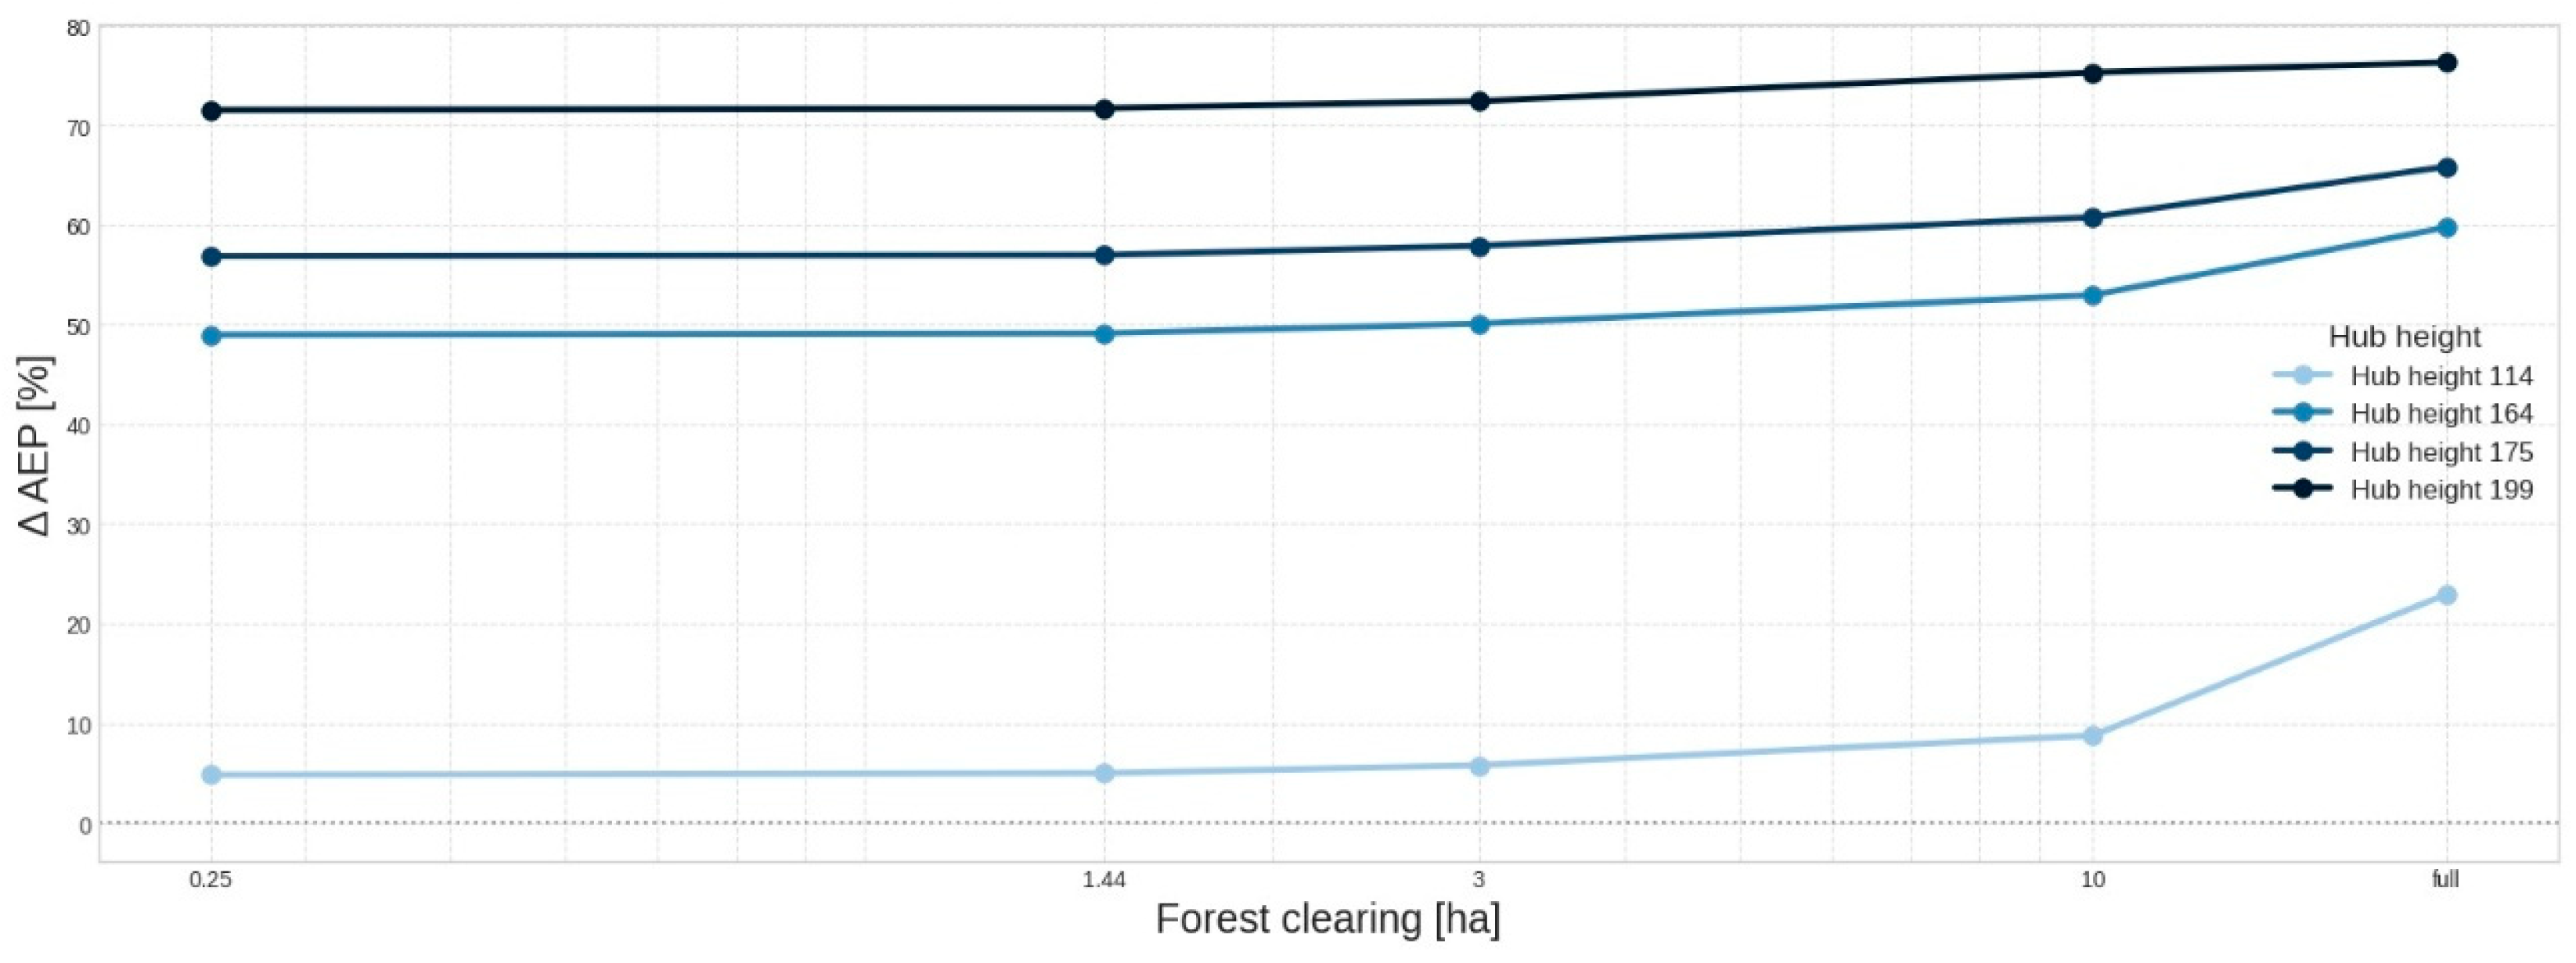
3.5. Effect of Forest Clearing Area on Annual Energy Production
Planning and siting of wind turbines require effective management of fire risk, as this is a crucial factor influencing the safety and resilience of wind energy infrastructure. A comprehensive assessment of each turbine or wind farm should consider site-specific ecological, climatic, and geographical conditions, addressing not only energy efficiency but also noise propagation and broader environmental implications. Preventive measures aim to lower both the likelihood of wildfires being caused by turbine-related incidents and the risk of wildfires damaging turbine infrastructure. Currently, there are no universally recognised standards for the minimum separation distances between wind turbines and woodland. For example, in the United States, a minimum clearance distance of 152 m (≈ 7.3 ha) from trees is specified, assuming a circular buffer area. For turbines near shrub or brush vegetation, a base clearance zone of 60 m (≈ 1.1 ha) is recommended [
25]. Likewise, the Confederation of Fire Protection Associations Europe (CFPA-E) recommends creating a 25 m (≈ 0.2 ha) buffer zone cleared of scrub and low vegetation to reduce the risk of fire spread [
26]. Such area-based safety zones serve as valuable references for spatial planning in forested or fire-prone areas. They can be incorporated into wind farm layout optimisation to improve fire resilience.
Figure 10 illustrates the variation in annual energy production (AEP, %) as a function of forest clearing area for turbines with hub heights of 114 m, 164 m, 175 m, and 199 m. A consistent increase in AEP is observed with the expansion of forest clearing across all configurations. This trend indicates that removing surrounding vegetation reduces surface roughness and turbulence intensity, thereby increasing the effective wind speed at hub height.
The results are based on simulations of rectangular forested areas with mixed canopies that were progressively cleared to create open zones around a centrally positioned turbine. The scenarios range from of 0.25 ha to complete forest removal.
The results indicate that turbines with lower hub heights exhibit a stronger dependence of annual energy production (AEP) on the extent of forest clearing, reflecting the influence of forest structure on wind flow dynamics. In contrast, turbines with higher hub heights demonstrate reduced sensitivity to forest clearing, resulting in more consistent AEP across varying levels of forest removal.
3.6. Evaluation of Economic Efficiency Using the Levelized Cost of Electricity (LCOE)
To evaluate the economic efficiency of the project, the Levelized Cost of Electricity (LCOE) indicator was employed, the average cost of electricity generation over the entire lifecycle of the installation [
27]. This indicator enables an objective comparison of different configurations and parameters of wind energy systems, considering both capital costs and operational expenses.
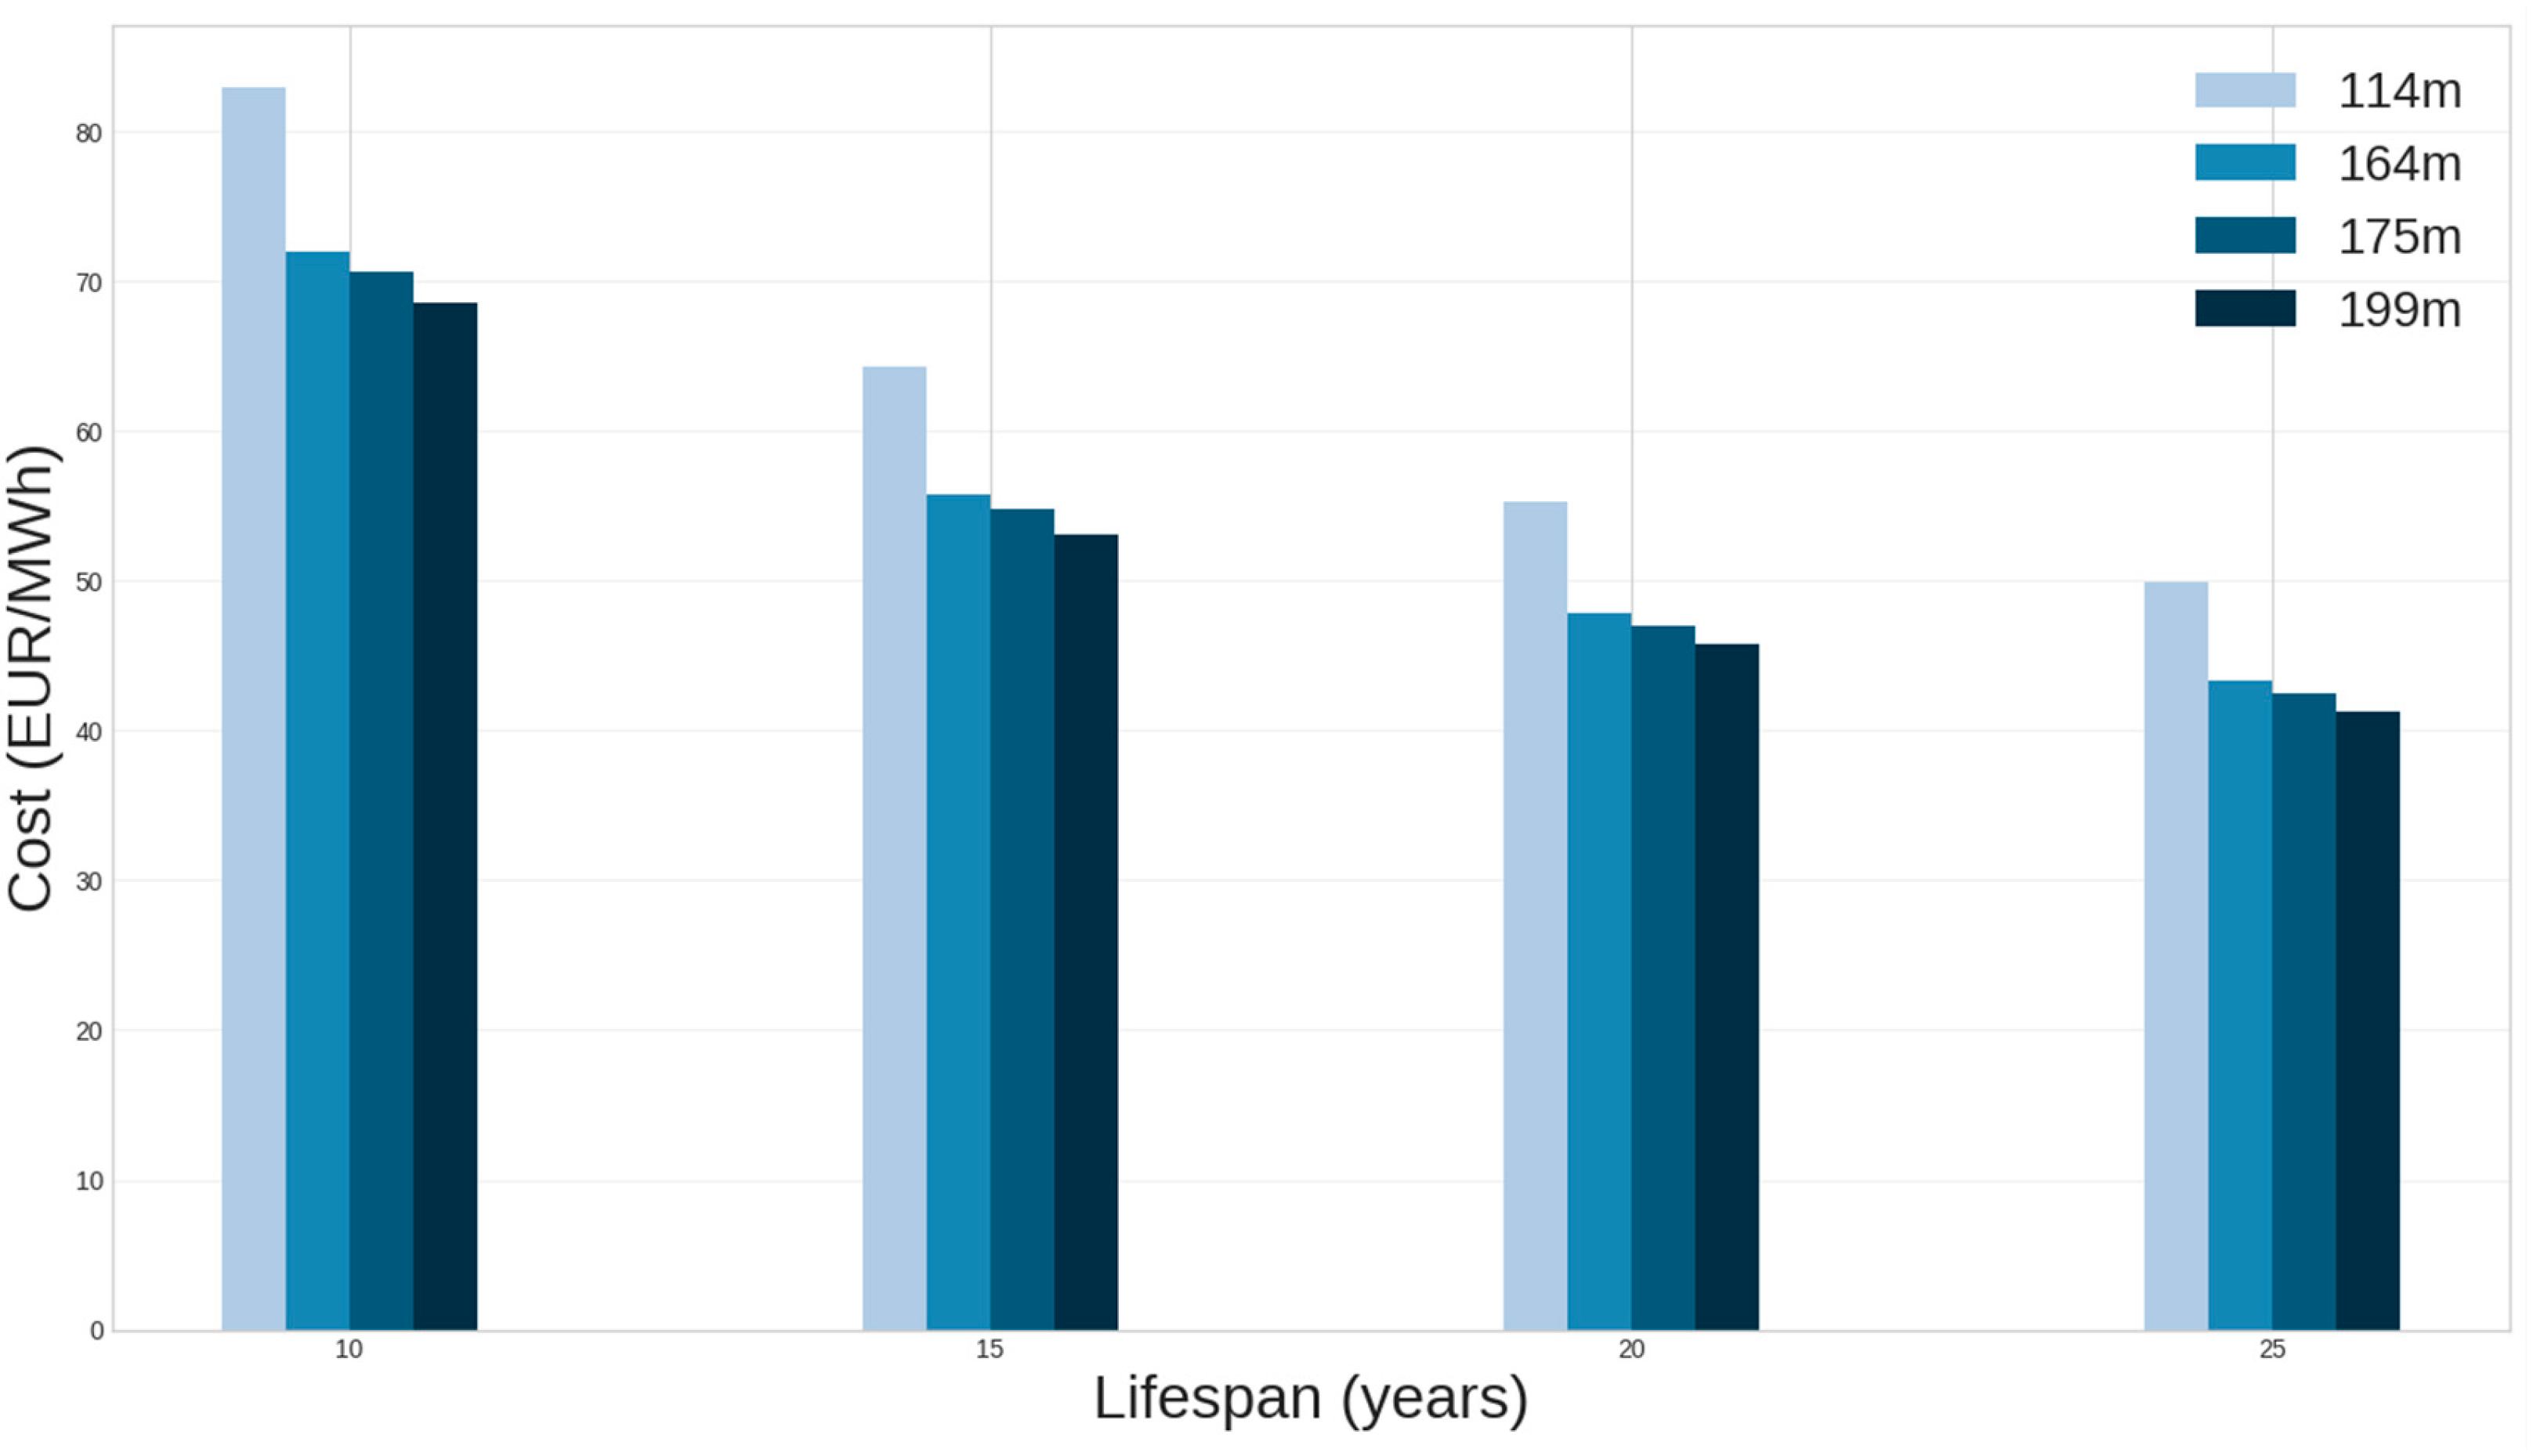
Figure 11 illustrates the variation in the Levelized Cost of Electricity (LCOE) as a function of turbine hub height across different assumed operational lifespans.
The assessment was conducted for an onshore wind farm consisting of 25 Vestas V172-7.2 MW turbines, located in the northern part of Latvia within a forested area characterised by mixed vegetation and an average tree height of approximately 25 m.
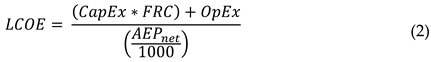
The LCOE is calculated using equation 2 with a 5% discount rate, which accounts for the time value of money. For comparison, the Cost of Energy (COE) was also calculated as the ratio of total costs over the wind farm's lifespan to total electricity output, without discounting.
The variables in the above equation are defined as follows: LCOE is the levelized cost of energy (EUR/MWh); FRC is the fixed charge rate (%); CapEx is the capital expenditures (EUR/kW); AEPnet is the net average annual energy production (MWh/MW/year); OpEx is operational expenditures (EUR/kW/year).
The results demonstrate a consistent pattern: increasing hub height reduces LCOE, with the lowest values achieved at an installation lifespan of 25 years.
The downward trend in LCOE with longer operational lifespans reflects the effect of spreading capital costs over a larger cumulative energy output. As the lifespan extends from 10 to 25 years, LCOE decreases from approximately 80–85 EUR/MWh to 40–45 EUR/MWh, depending on hub height. This suggests that project longevity has a significant impact on economic performance, enhancing the overall cost-effectiveness of wind power generation.
Additionally, turbines with higher hub heights consistently achieve lower LCOE values within each lifespan category. This improvement is attributed to higher average wind speeds and reduced turbulence intensity at higher elevations, resulting in increased annual energy production (AEP). For example, at a 25-year lifespan, turbines with a hub height of 199 m have an LCOE around 10–15% lower than those with a hub height of 114 m.
Overall, the analysis indicates that increasing hub height, extending project lifespans, and reducing wake losses all help to lower the levelised cost of wind energy. These findings suggest that cost-effective wind energy development relies not on a single measure but on the combined effect of technological advancements and strategic long-term operational planning.
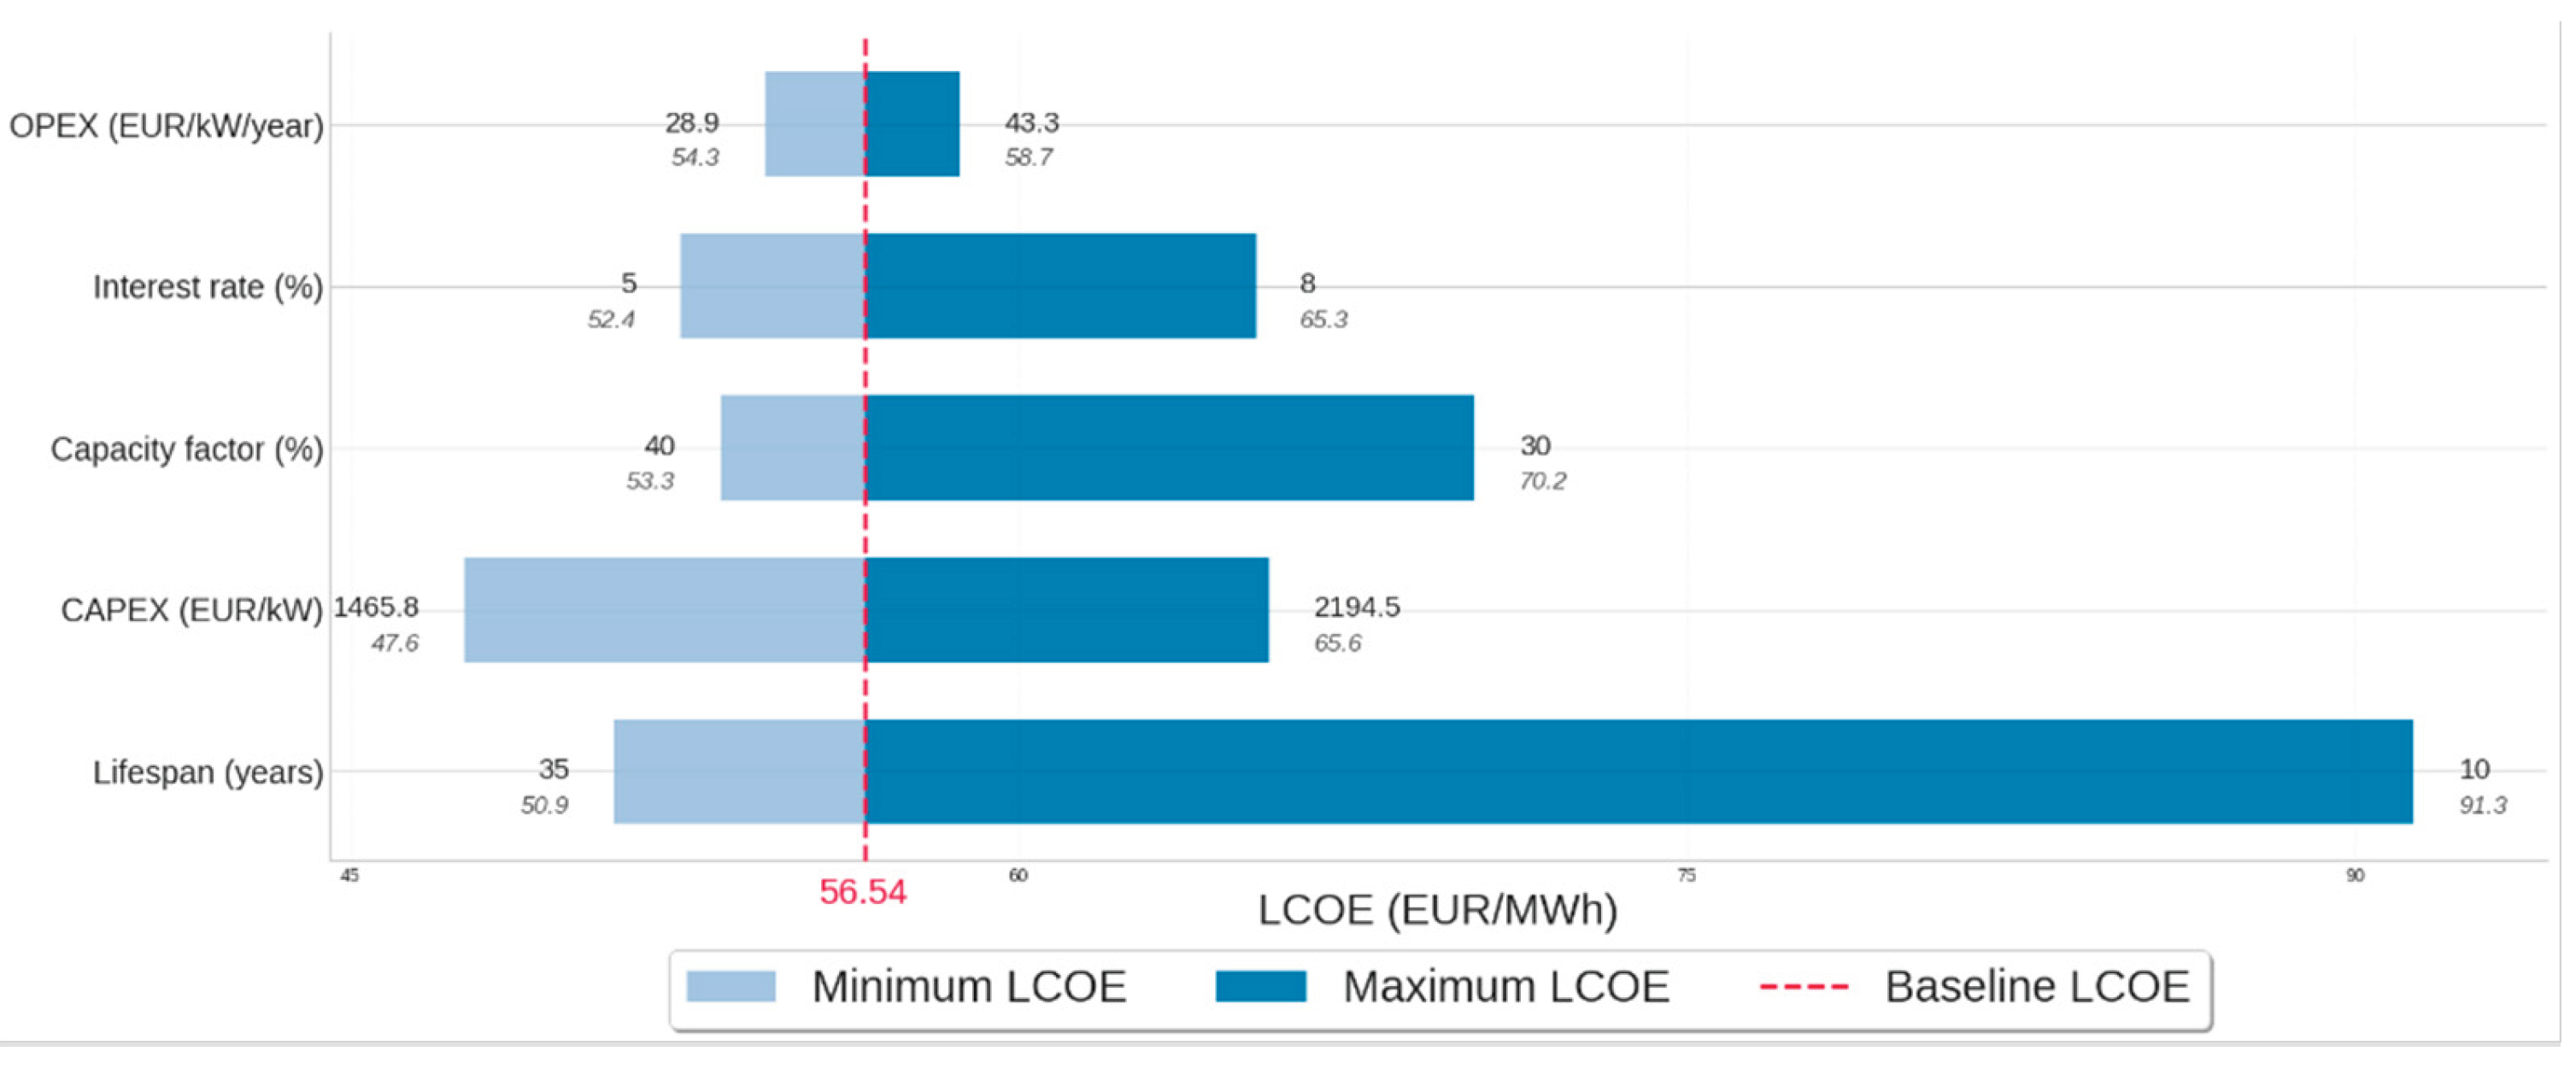
Figure 12 illustrates the results of the sensitivity analysis of the Levelized Cost of Energy (LCOE) to changes in key parameters.
Data for the analysis were obtained by developing multiple scenarios in the Cost Model Setup. The baseline scenario assumed a project lifetime of 25 years, an interest rate of 6%, a capacity factor of 37.6%, a capital expenditure (CapEx) of 1,829 EUR/kW, an operational expenditure (OpEx) of 36.2 EUR/kW/year. It resulted in an LCOE of 56.54 EUR/MWh. During the sensitivity analysis, one parameter was varied at a time, while the others were kept at their baseline values.
The results demonstrate that the project’s operational lifetime and capital expenditure (CapEx) have the most significant influence on the Levelized Cost of Energy (LCOE). Extending the project lifespan significantly reduces LCOE by spreading the initial investment over a longer period of energy production. Similarly, reductions in CapEx lead to a direct, proportional decrease in energy costs, underscoring the critical role of investment optimisation and cost-effective infrastructure design.
In contrast, variations in interest rate and capacity factor have a moderate effect on LCOE. Lower financing rates and improved turbine performance contribute to cost reductions but to a lesser extent. Changes in OpEx have a negligible influence on LCOE, indicating that maintenance and operating costs play a relatively minor role in determining the final price of electricity generation.
Conclusions
The results of this study provide a comprehensive overview of the influence of forested terrain on both the energy production and financial performance of wind farms. The findings clearly indicate that incorporating forest assessments into conventional wind and environmental analyses can significantly enhance the optimisation of energy output. By accounting for forest characteristics such as canopy density and tree height, more suitable turbine hub heights, placements, and even forest clearing areas can be determined.
Multiple simulations were conducted based on Latvian geographical and meteorological conditions, encompassing seasonal wind assessments, variations in tree height, clearing zones, and overall terrain roughness. The wind assessment using the NORA3 dataset clearly demonstrates a strong seasonal dependence of annual energy production. Furthermore, forest height and canopy density significantly influence the complex dynamics of wind flow. The simulations revealed that lower and sparser forests surrounding wind turbines lead to more efficient energy production, primarily due to increased wind speeds and improved wake recovery effects.
From an economic perspective, comprehensive forest assessment represents a critical component of wind park analysis. The determination of the Levelized Cost of Energy (LCOE) serves as a fundamental metric for evaluating project competitiveness and investment viability before development. A reduction in the Levelized Cost of Energy (LCOE) directly corresponds to enhanced economic efficiency, improved competitiveness relative to alternative generation technologies, and greater long-term profitability. Sensitivity analyses demonstrate that the final LCOE is highly elastic with respect to Annual Energy Production (AEP). The Annual Energy Production (AEP), in turn, is influenced by a range of design and environmental parameters, including turbine hub height, between-turbine spacing, surface roughness characteristics, and the extent of the forest clearing zone. Consequently, an assessment integrating these parameters is essential to derive an optimised configuration that minimises energy costs while maximising resource utilisation efficiency.
The findings suggest that optimising turbine placement in forested areas is a complex and multifaceted task. The main limitation remains the availability of suitable land, as strict regulatory requirements impose buffer zones around settlements, infrastructure, and environmentally sensitive areas. These constraints are particularly significant in forested landscapes, where habitat structure, high biodiversity, and the presence of protected species further restrict potential turbine locations.
Despite these spatial and environmental limitations, the study emphasises the importance of thoroughly considering forest-related factors that influence wind flow dynamics, including turbulence intensity, vertical wind shear, and energy losses due to increased surface roughness. Incorporating these parameters into wind farm optimisation is essential for accurately predicting energy output and ensuring the long-term performance of turbines situated within or near forested regions.
Author Contributions
Conceptualization, N.D., E.K. and S.O.; methodology, E.K. S.O.; software, N.D.; validation, N.D., M.M.; formal analysis, E.K.; investigation, N.D., M.M.; resources, V.K..; data curation, V.K.; writing—original draft preparation, S.O., M.M. and N.D.; writing—review and editing M.M., E.K., V.K.; visualisation, N.D., M.M.; supervision, S.O. All authors have read and agreed to the published version of the manuscript.
Funding
This work was supported by the NextGeneration EU (Latvia’s Recovery and Resilience Plan’s investment “Research, Development and Consolidation Grants”) under Grant “MESVA: “Methods, Tools and Techniques for Smart Development of Energy system” (Nr.5.2.1.1.i.0/2/24/I/CFLA/006).
Conflicts of Interest
The authors declare that they have no conflicts of interest.
References
- A European Green Deal - https://ec.europa.eu/info/strategy/priorities-2019-2024/european-green-deal, 2023-05-12.
- Fit for 55: delivering the EU's 2030 Climate Target on the way to climate neutrality - https://eur-lex.europa.eu/legal-content/EN/TXT/?uri=CELEX:52021DC0550.
- European Commission. European Wind Power Action Plan. Available online: https://eur-lex.europa.eu/legal-content/EN/TXT/?uri=celex:52023DC0669 (accessed on 19 September 2025).
- Central Statistical Bureau of Latvia. Renewable Resource Consumption up by 11.2% in the Past Five Years. Press Release; 10 September 2025. Available online: https://stat.gov.lv/en/statistics-themes/business-sectors/energy/press-releases/23598-consumption-renewable-energy (accessed on 17 September 2025).
- Artelys. Integration of Renewable Energy in the Latvian Grid: Executive Summary; Augstsprieguma Tīkls AS (AST). Available online: https://www.ast.lv/sites/default/files/editor/Executive_summary_Artelys.pdf (accessed on 18 September 2025).
- Stakens, J.; Mutule, A.; Lazdins, R. Agriculture Electrification, Emerging Technologies, Trends and Barriers: A Comprehensive Literature Review. Available online: https://www.scopus.com/pages/publications/85161545841 (accessed on 30 October 2025).
- Korõtko, T.; Plaum, F.; Häring, T.; Mutule, A.; Lazdins, R.; Borščevskis, O.; Rosin, A.; Carroll, P. Assessment of Power System Asset Dispatch under Different Local Energy Community Business Models. Energies 2023, 16, 3476. Available online: https://www.scopus.com/pages/publications/85156138329 (accessed on 30 October 2025).
- Baylis, S., M. Colls, P. Marek and A. Head, 2014: Parameterised turbine performance. Proceedings 9th meeting of the Power Curve Working Group, 16 December 2014, Glasgow, Scotland. [Available at http://www.pcwg.org/].
- Stuart, P., 2013: Introduction to the Power Curve Working Group. Proceedings from EWEA workshop Resource Assessment, 25-26 June 2013, Dublin, Ireland. [Available at http://www.ewea.org/events/workshops/wp-content/uploads/2013/06/EWEA-RA2013Dublin-3-1-Peter-Stuart-RES.pdf ].
- Baylis, S., M. Colls, P. Marek and A. Head, 2014: Parameterised turbine performance. Proceedings 9th meeting of the Power Curve Working Group, 16 December 2014, Glasgow, Scotland. [Available at http://www.pcwg.org/].
- EC 61400-1:2019 (Edition 4). Wind Energy Generation Systems—Part 1: Design Requirements. International Electrotechnical Commission, Geneva, Switzerland. Available online: https://webstore.iec.ch/en/publication/26423\ (accessed on 3 November 2025).
- Kazda, J.; Zendehbad, M.; Chokani, N.; Abhari, R.S. (2017). Impact of Forest-Elevated Turbulence Levels on Wind Farm Performance. J. Phys.: Conf. Ser., 854, 012041. [CrossRef]
- Levelized Cost of Electricity—Renewable Energy Technologies; Fraunhofer Institute for Solar Energy Systems ISE: Freiburg, Germany, 2024. Available online: https://www.ise.fraunhofer.de/content/dam/ise/en/documents/publications/studies/EN2024_ISE_Study_Levelized_Cost_of_Electricity_Renewable_Energy_Technologies.pdf (accessed on 31 October 2025).
- International Renewable Energy Agency (IRENA). Renewable Power Generation Costs in 2024; International Renewable Energy Agency: Abu Dhabi, 2025. Available online: https://www.rinnovabili.it/wp-content/uploads/2025/07/IRENA-RENEWABLE-POWER-GENERATION-COSTS-IN-2024.pdf.
- NREL. Cost of Wind Energy Review: 2024 Edition; National Renewable Energy Laboratory: Golden, CO, USA, 2025. Available online: https://www.nrel.gov/docs/fy25osti/91775.pdf (accessed on 31 October 2025).
- BalticWind.eu. “IRENA Report: Onshore and Offshore Wind — the Most Cost-Competitive Power Generation Globally.” BalticWind.eu, 28 Jul 2025. Available online: https://balticwind.eu/irena-report-onshore-and-offshore-wind-the-most-cost-competitive-power-generation-globally/ (accessed on 31 October 2025).
- Agafonova, O. A Numerical Study of Forest Influences on the Atmospheric Boundary Layer and Wind Turbines. Ph.D. Thesis, Lappeenranta University of Technology, Lappeenranta, Finland, 2017.
- Cheng, S.; Elgendi, M.; Lu, F.; Chamorro, L.P. On the Wind Turbine Wake and Forest Terrain Interaction. Energies 2021, 14, 7204. [CrossRef]
- Nebenführ, B.; Davidson, L. Prediction of Wind-Turbine Fatigue Loads in Forest Regions Based on Turbulent LES Inflow Fields. Wind Energy 2014, 17 (3), 337–350. Available online: https://onlinelibrary.wiley.com/doi/abs/10.1002/we.2076 (accessed on 30 October 2025).
- Anderson, E.; Antkowiak, M.; Butt, R.; Davis, J.; Dean, J.; Hillesheim, M.; Hotchkiss, E.; Hunsberger, R.; Kandt, A.; Lund, J.; Massey, K.; Robichaud, R. Broad Overview of Energy Efficiency and Renewable Energy Opportunities for Department of Defense Installations; U.S. Department of Energy: Washington, DC, USA, 2011. [CrossRef]
- Troen, I.; Lundtang Petersen, E. European Wind Atlas; Risø National Laboratory: Roskilde, Denmark, 1989.
- EMD International A/S. WAsP—The Wind Atlas Analysis and Application Program: User Guide and Technical Reference. EMD International A/S, Aalborg, Denmark, 2019. Available online: https://www.emd.dk/wasp (accessed on 3 November 2025).
- Vestas. Energy Solutions. Onshore Wind Turbines. Available online: https://www.vestas.com/en/energy-solutions/onshore-wind-turbines/enventus-platform/V172-7-2-MW (accessed on 17 October 2025).
- Norwegian Meteorological Institute. THREDDS Data Server Open Access to Meteorological and Oceanographic Data. Available online: https://thredds.met.no/thredds/catalog.html (accessed on 19 October 2025).
- FM Global. FM Property Loss Prevention Data Sheets 13-10: Wildland Fire; FM Global: Johnston, RI, USA, 2021; p. 15. Available online: https://www.fm.com/-/media/project/publicwebsites/fmglobal/documentum-new/data-sheet-individual/13-mechanical/fmds1310.pdf (accessed on 17 October 2025).
- The Confederation of Fire Protection Associations Europe (CFPA-E). Wind Turbines Fire Protection, Guideline No. 22:2022 F. CFPA-E: Stockholm, Sweden, 2022. Available online: https://cfpa-e.eu/app/uploads/2022/05/CFPA_E_Guideline_No_22_2022_F.pdf (accessed on 17 October 2025).
- Aldersey-Williams, J.; Rubert, T. Levelised Cost of Energy—A Theoretical Justification and Critical Assessment. Energy Policy 2019, 124, 169–179. [CrossRef]
|
Disclaimer/Publisher’s Note: The statements, opinions and data contained in all publications are solely those of the individual author(s) and contributor(s) and not of MDPI and/or the editor(s). MDPI and/or the editor(s) disclaim responsibility for any injury to people or property resulting from any ideas, methods, instructions or products referred to in the content. |
© 2025 by the authors. Licensee MDPI, Basel, Switzerland. This article is an open access article distributed under the terms and conditions of the Creative Commons Attribution (CC BY) license (http://creativecommons.org/licenses/by/4.0/).