
Submitted:
05 April 2025
Posted:
08 April 2025
You are already at the latest version
Abstract
This research presents a detailed evaluation of global wind power generation, employing cutting-edge machine learning methods to forecast future trends and capacities through 2050. Reviewing the past data of various countries, we construct predictive models for analyzing the potential increase in wind power generation, capacity factors, and regional differences. Using polynomial regression and random forest methods, we project high growth in wind energy production, pointing to the key importance of installed capacity, technology, and geographical diversity in deciding the fate of renewable energy. Our research establishes the feasibility of high growth in wind power generation, and trends indicating significant improvement in most parts of the world.
Keywords:
wind energy
; renewable energy
; capacity forecasting
; machine learning
; energy forecasting
; climate change mitigation
1. Introduction
The global transition to non-traditional energy sources has grown increasingly essential in addressing climate change and reducing carbon emissions. Wind power has turned out to be a turning-point technology in this revolution, with a sustainable and increasingly affordable means of producing electricity compared to fossil fuels (Dincer & Acar, 2015; Lacy et al., 2013; Mascarenhas et al., 2019; Phillips, 2013; Zhao et al., 2013). With countries around the world committing to minimize their carbon signatures, it becomes ever more essential for policymakers, investors, and environmental planners to know the future of wind energy as shown in Figure 1 (Falcone et al., 2021; Jiménez-González et al., 2010; Mittal & Kushwaha, 2024a; Praveenkumar et al., 2024).
Wind power generation is characterized by a combination of interlinked factors such as technological innovation, geographical limitations, financial investment, and national energy policy (Blanco, 2009; Mittal & Kushwaha, 2024c; Salman & Teo, 2003; Zhang & Wan, 2014). In the past, these factors have been analyzed independently, but exhaustive, prospective examinations that combine a variety of prediction methods are in short supply. This study attempts to fill this important gap through the creation of a multi-method approach to the prediction of wind power generation (Blaabjerg et al., 2012; Demirbas, 2008; Hansen, 2012; Liu et al., 2023; Milani et al., 2020; Salman & Teo, 2003).
Our study attempts to offer a more realistic image of global wind power potential through the use of a novel machine-learning technique. Using extrapolation of historical trends and advanced forecasting models, we examine the likely growth, geographic reach, and technology impact of wind electricity generation from the near term through 2050(Fei et al., 2011; Fingersh, 2003; He et al., 2005; Zhou et al., 2012). Our research goes beyond previous scholarly efforts, providing pragmatic recommendations for energy planning and environmentally friendly growth policy (Bairamzadeh et al., 2018; Chen et al., 2022; Demirbas, 2017; Xiang et al., 2020).
2. Methodology
Our research methodology utilized a high-level, holistic approach to wind energy production analysis, integrating high-end data pre-processing methods, machine learning models, and predictive modeling methodologies.The study design comprised intensive data acquisition from worldwide wind power databases, rigorous pre-processing for data quality and comparability, and the application of multiple predictive modeling techniques like random forest regression and polynomial regression (Pekel, 2020; Rahimi-Gorji et al., 2017; Smith et al., 2013; Smola & Schölkopf, 2004). We sought to develop a multi-dimensional analytical framework with the ability to introspect upon the complex interactions between the variety of factors responsible for wind power generation, i.e., installed capacity, growth rates, geographical variations, and technological developments (Amendola et al., 2000; Buhre et al., 2005; Mittal & Kushwaha, 2024b; Sreelekshmy et al., 2020).
2.1. Data Preprocessing and Collection
Data collection process involved gathering wind energy data from global sources, and gathering information carefully to provide comprehensive and representative global wind energy trends coverage. We performed strict data cleansing processes to rectify mistakes, handle missing values, and normalize data across different countries to provide the best possible data quality for our forecasting models.
2.2. Predictive Modeling Approaches
Our predictive modeling strategy integrated some of the most advanced machine learning techniques to capture the complex dynamics of wind energy generation. Random forest regression was employed to investigate feature importance and develop robust predictive models, and polynomial regression allowed us to investigate the non-linear interaction between installed capacity and energy output, providing more nuanced results compared to traditional linear techniques (Candanedo et al., 2018; Kruppa et al., 2012; Mazhnik & Oganov, 2020; Rodriguez-Galiano et al., 2015; H. Yang et al., 2023).
2.3. Feature Engineering
Feature engineering was also a significant component of our approach, including advanced analysis of critical predictors such as capacity growth percentages, generation rates, and capacity factors. Through developing an enriched and heavily hand-curated feature set, we were able to optimize the accuracy and robustness of our forecast models. We employed cutting-edge techniques such as polynomial feature transformation to detect the non-linear interaction between the variables so that our models could detect more subtle associations in the data. Our recursive feature elimination with mutual information scoring was performed for the best predictor of effect selection, pruning dimensionality increasingly while preserving key information. Besides, we employed strong normalization and scaling techniques to compare features of different magnitudes and correctly weight them in our machine learning models. By specifying interaction features that encapsulated complex interdependencies across different energy production parameters, we were in a position to develop a more sophisticated and contextually aware predictive model.
2.4. Prediction Techniques
Our prediction techniques entailed the application of state-of-the-art computational modeling methods designed to detect the subtle dynamics of wind energy production globally. Using historical data and sophisticated machine learning algorithms, we developed a multi-layered predictive model that could withstand the inherent randomness and uncertainty in long-term energy forecasting.The approach included time series analysis, regression modeling, and ensemble modeling to yield consistent predictions taking into consideration technological progress, economic factors, and spatial variations in wind energy growth (Avery et al., 2019; Bajari et al., 2015; Degerman et al., 2009; Joselin Herbert et al., 2007; Ostblom, 1982; W.-J. Yang & Aydin, 2001).
The forecasting framework pushed forward forecasting horizons to 2050, employing advanced computational approaches that married statistical sophistication with machine learning expertise. We developed ensemble models that combined random forest regression and polynomial regression techniques to generate more advanced and sensitive predictions compared to linear prediction models. The models used varying input parameters, including historical growth rates of capacity, trends in technology improvement, geographical constraints, and economic variables, to give detailed projections of wind power generation potential across various regions of the world. The research approach enabled us to make scenario-based forecasts scalable for prospective technology revolutions and dynamic changes in energy landscape dynamics (Blaabjerg & Ke Ma, 2013; Mittal et al., 2024; Rodrigues et al., 2015; Sherif et al., 2005; Snyder & Kaiser, 2009).
3. Results
Our analysis gave profound insights into the future world wind energy capacity. Projection models suggested that world wind energy capacity will grow exponentially, with installed capacity rising from current capacities to nearly three times current capacity by 2050, a revolutionary shift of renewable energy infrastructure. It was particularly regional differences that were at issue, with North American, European, and Asian growth trends being most promising through drives from technological advances, accommodating policies, and increasing economic viability of wind technologies.
The study of capacity factor introduced more advanced observations, where an average capacity factor of around 0.35 was mentioned, with considerable variations based on various geographic areas. The conclusion emphasizes the role of site-specific considerations in planning wind power facilities, which requires the scope of available optimization prospects and technological advances guaranteeing optimal efficiency of energy output and general renewable energy performance.
Figure 3.
World contribution of wind power to electricity production (2023).
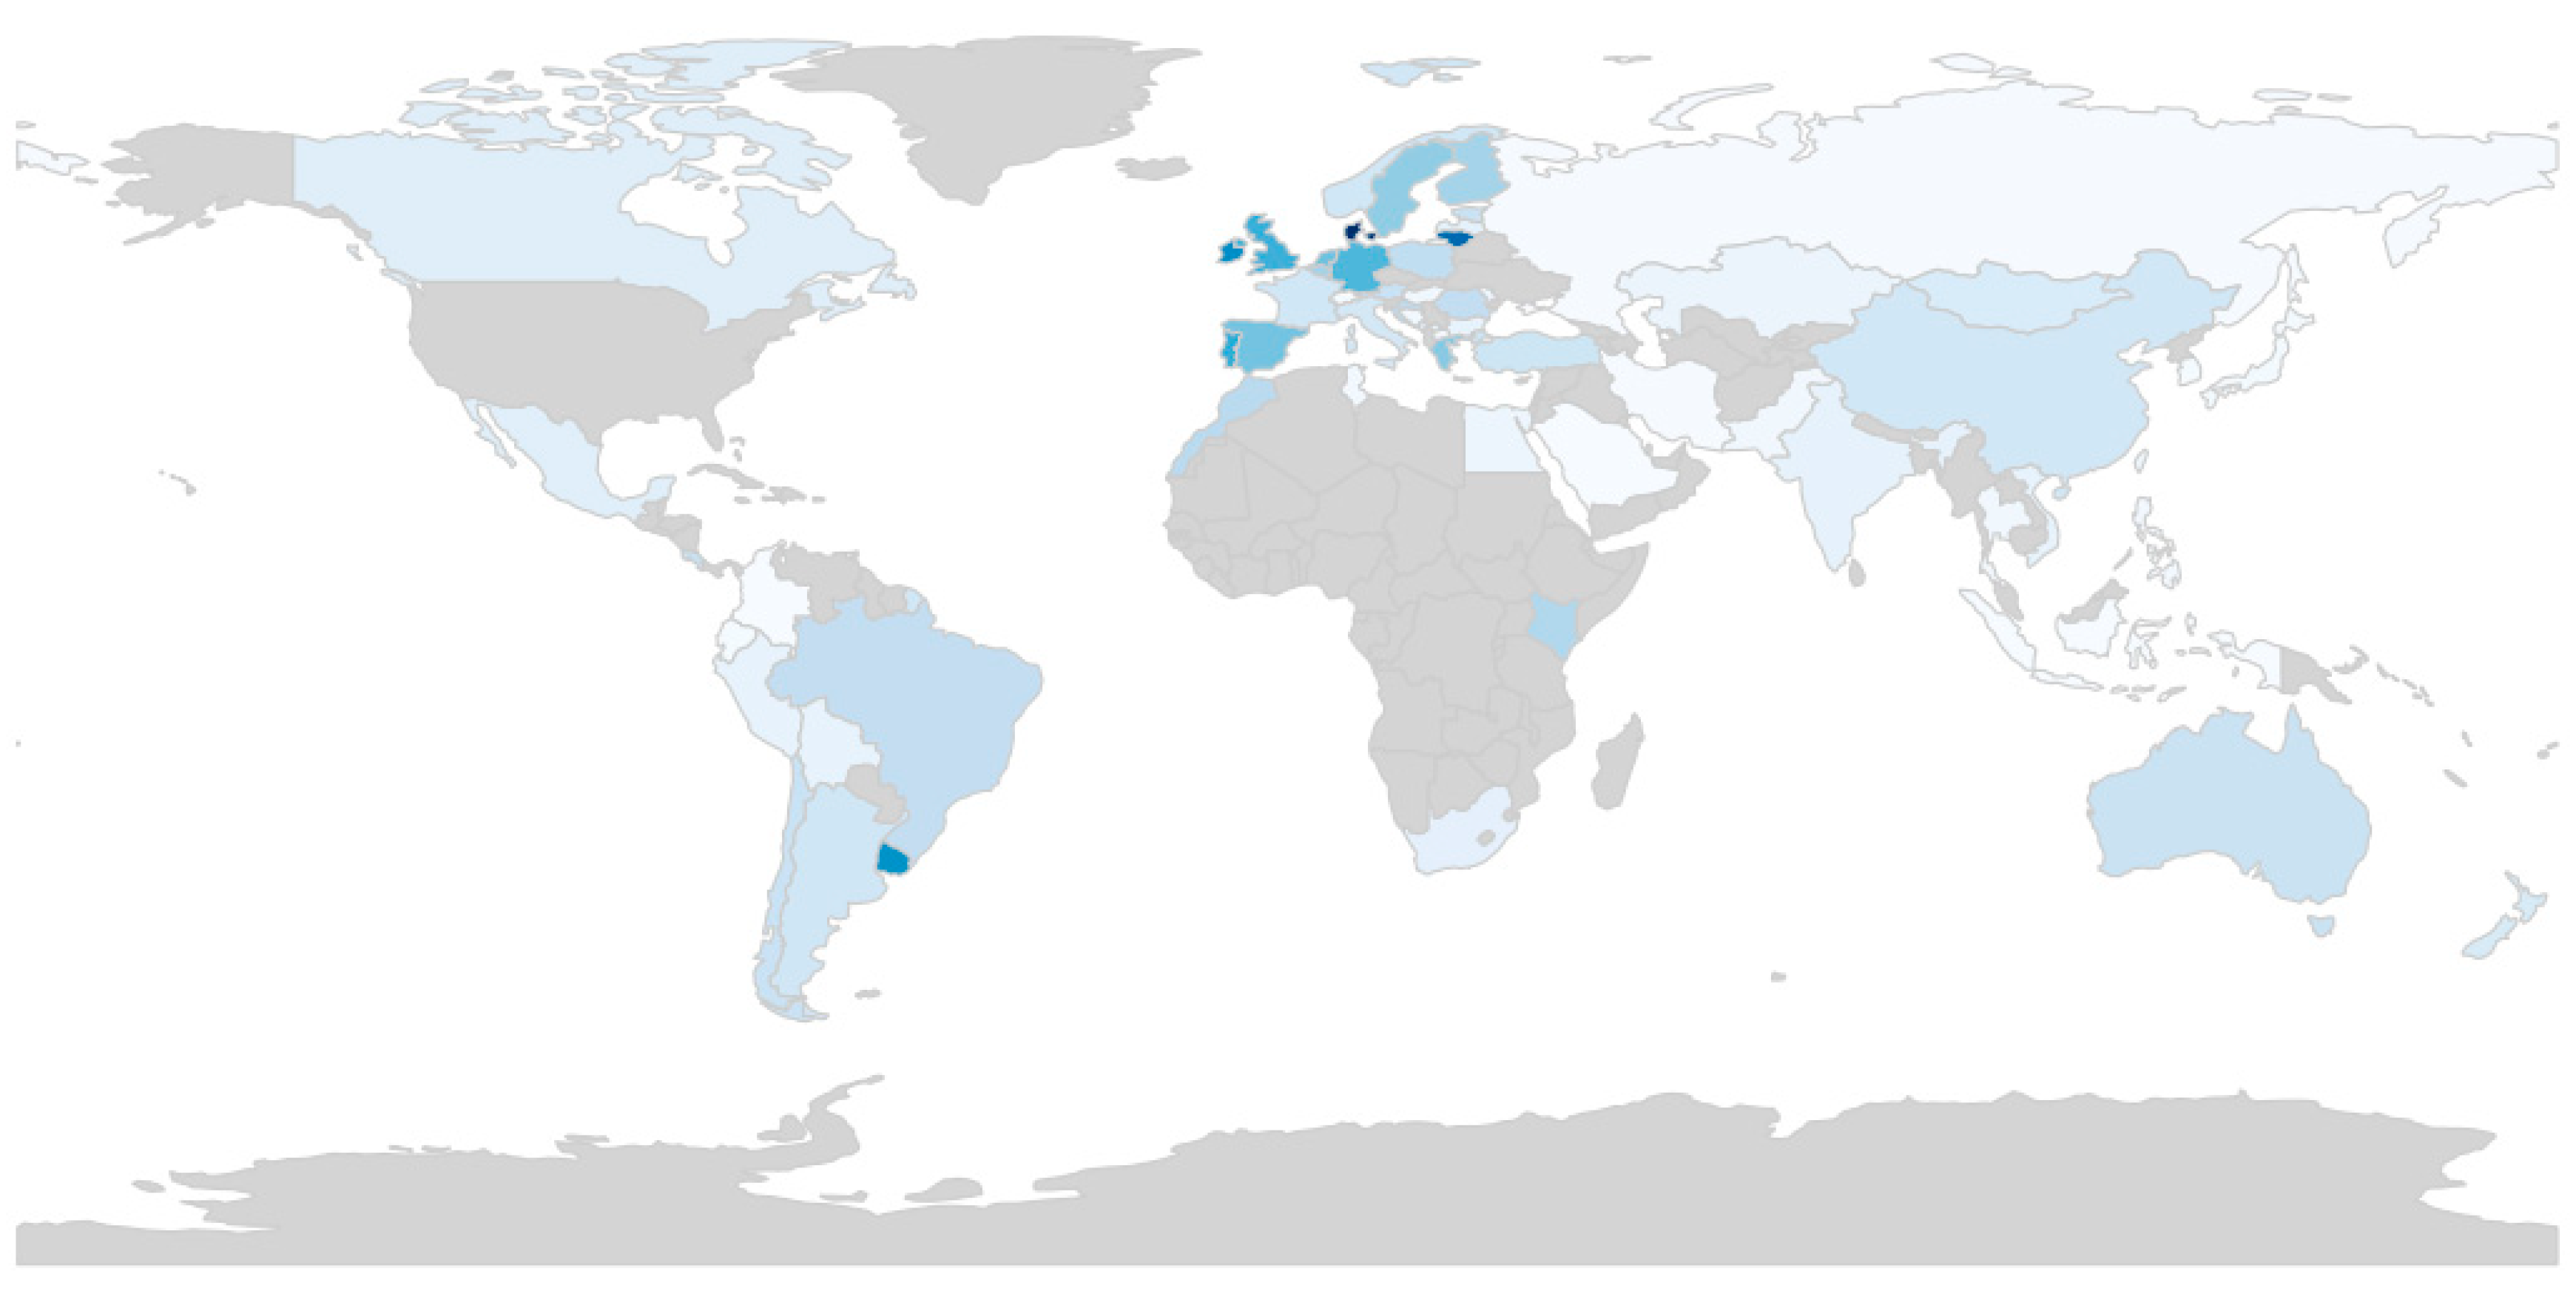
The choropleth map "Share of Electricity Production from Wind (2023)" shows the global distribution of percentage of wind generated by the nation. The map uses a gradient of light blue to dark blue, which depicts the share of electricity supplied by wind power, with the more intense the blue, the larger the share. The areas with no data points are shown in light gray color. Particular emphasis is laid on Northern Europe, which is greatly reliant on wind energy. A couple of nations have gone beyond 40–50% of electricity production by wind. The map shows the disparity of consumption of wind energy across the globe, highlighting its prevalence in certain regions and low consumption in others.
Figure 4.
World wind power generation by nation in 2050.
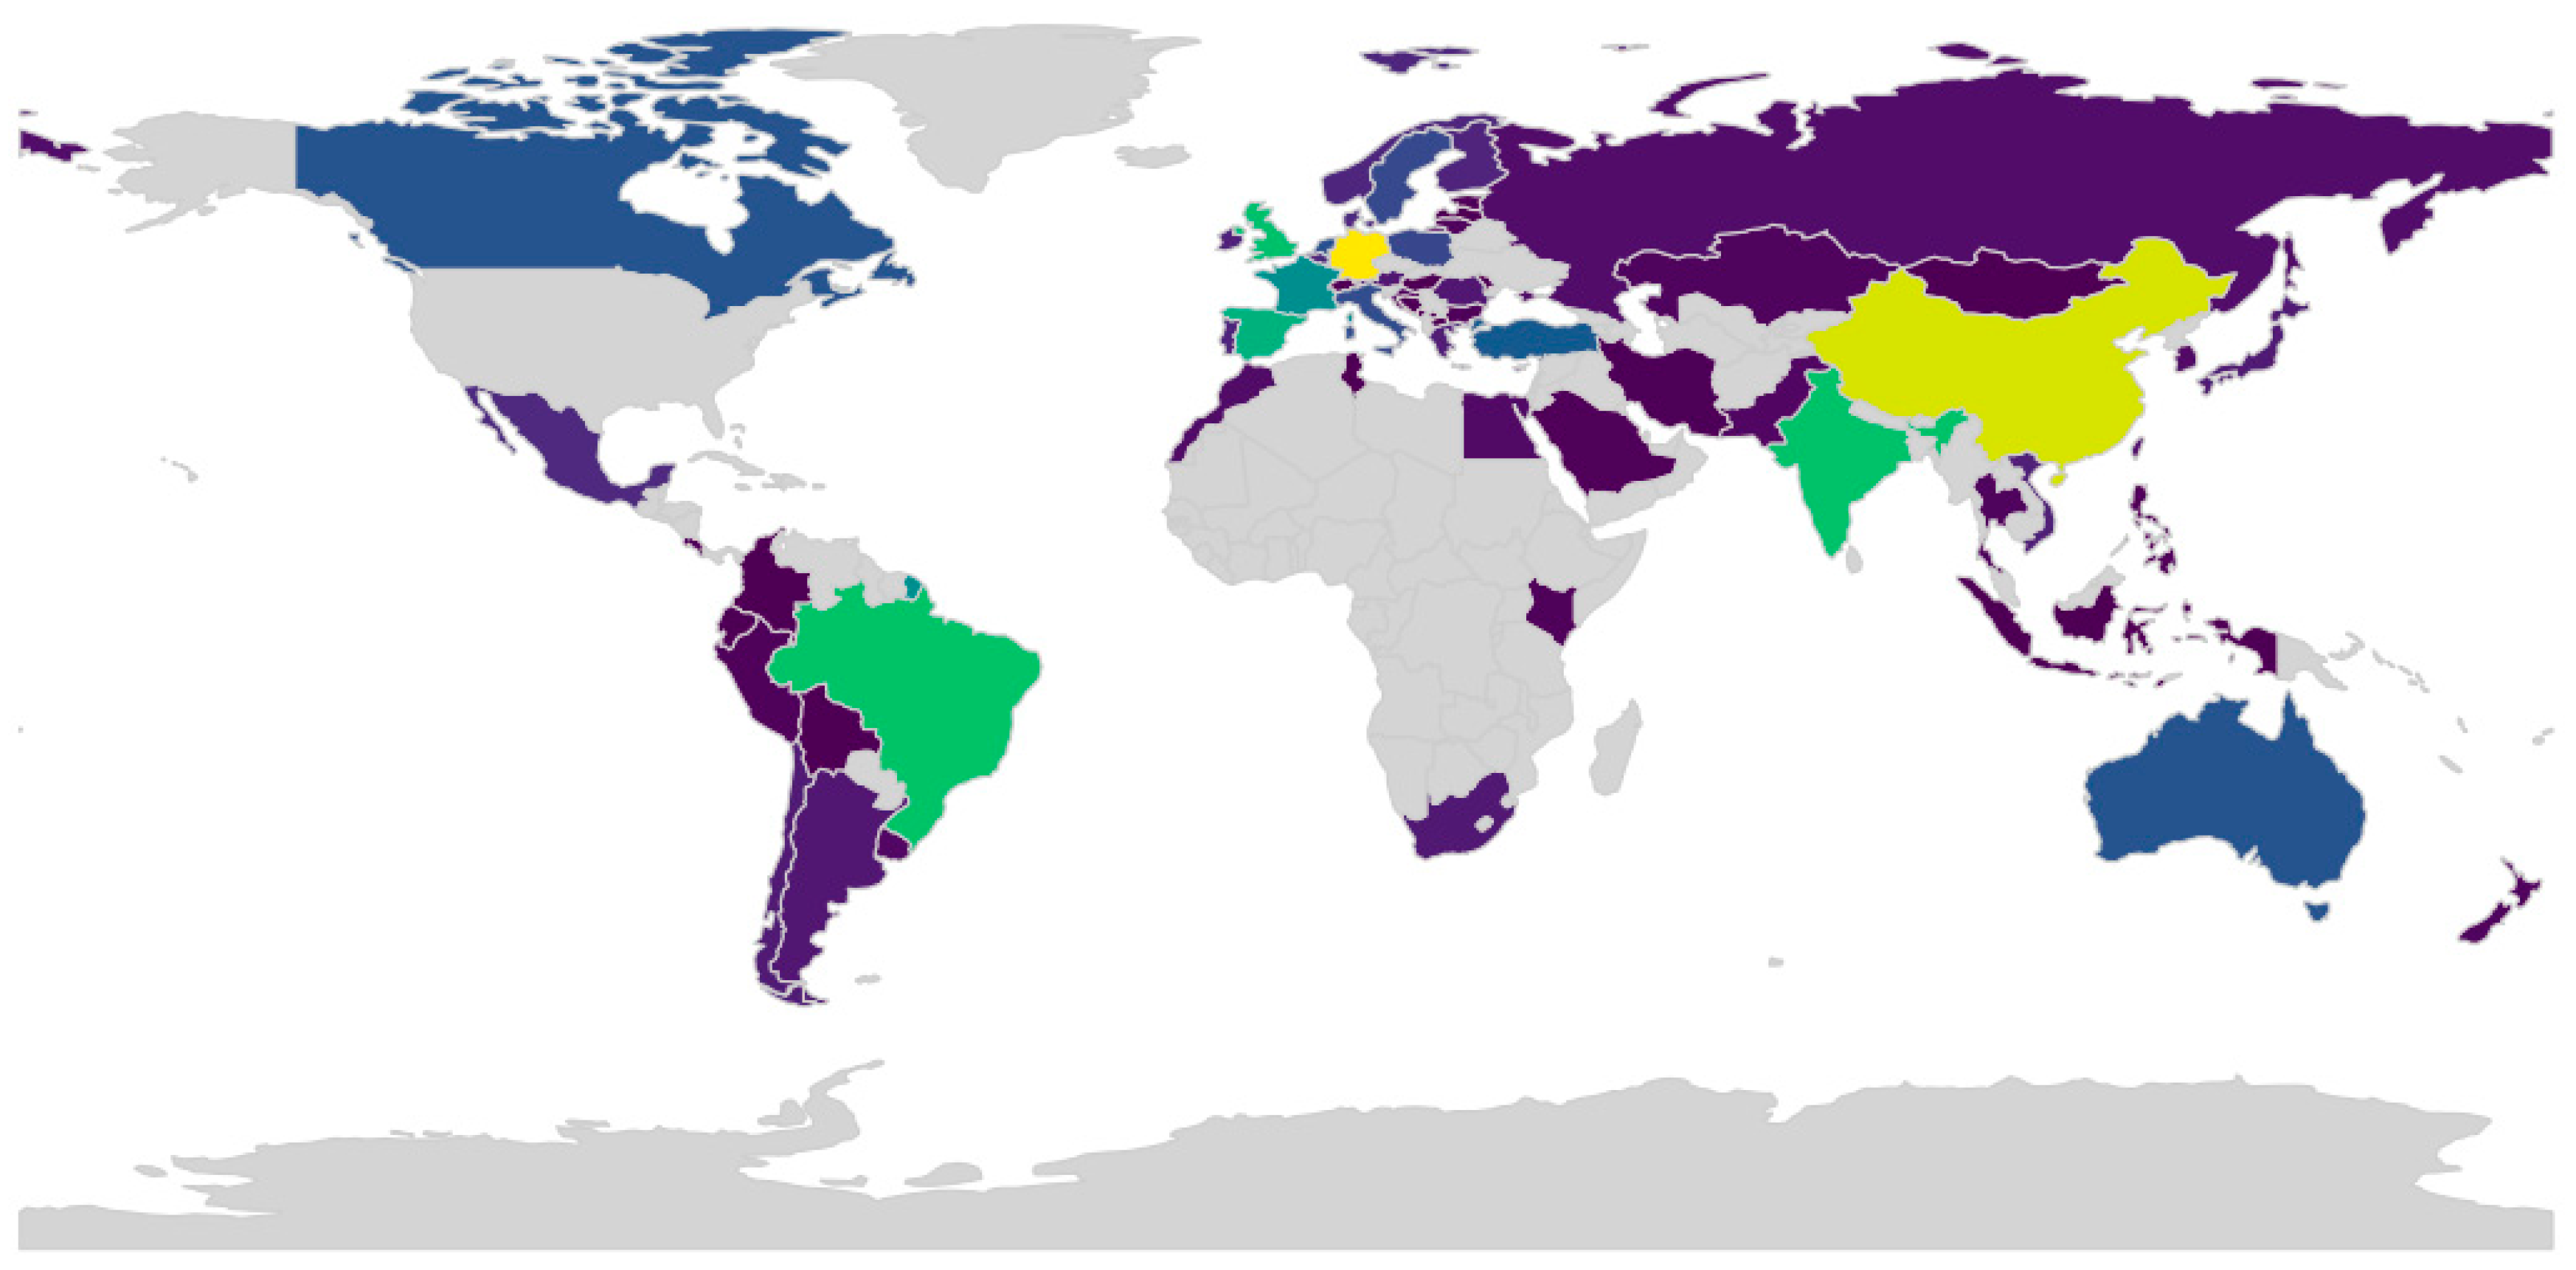
The estimated wind power production by countries in 2050, in terawatt-hours (TWh), is indicated on the map. The gradient color map from purple (low production) to yellow (high production) highlights significant variations in the capacity to produce wind power across the globe. India and China will be expected to produce the most wind power, as they have made massive investments in renewable energy-based facilities. Simultaneously, regions in Europe and South America also reflect strong contributions, characteristic of extensive uses of wind energy technologies. The grey regions are the ones with little data or where it is not probable that wind energy is a dominant contributor. The picture indicates how the world shifted towards renewable power and the varied ability of countries to harness the power of the wind effectively at the mid-century point.
Figure 5.
Wind energy capacity factor vs. percentage of electricity generation.
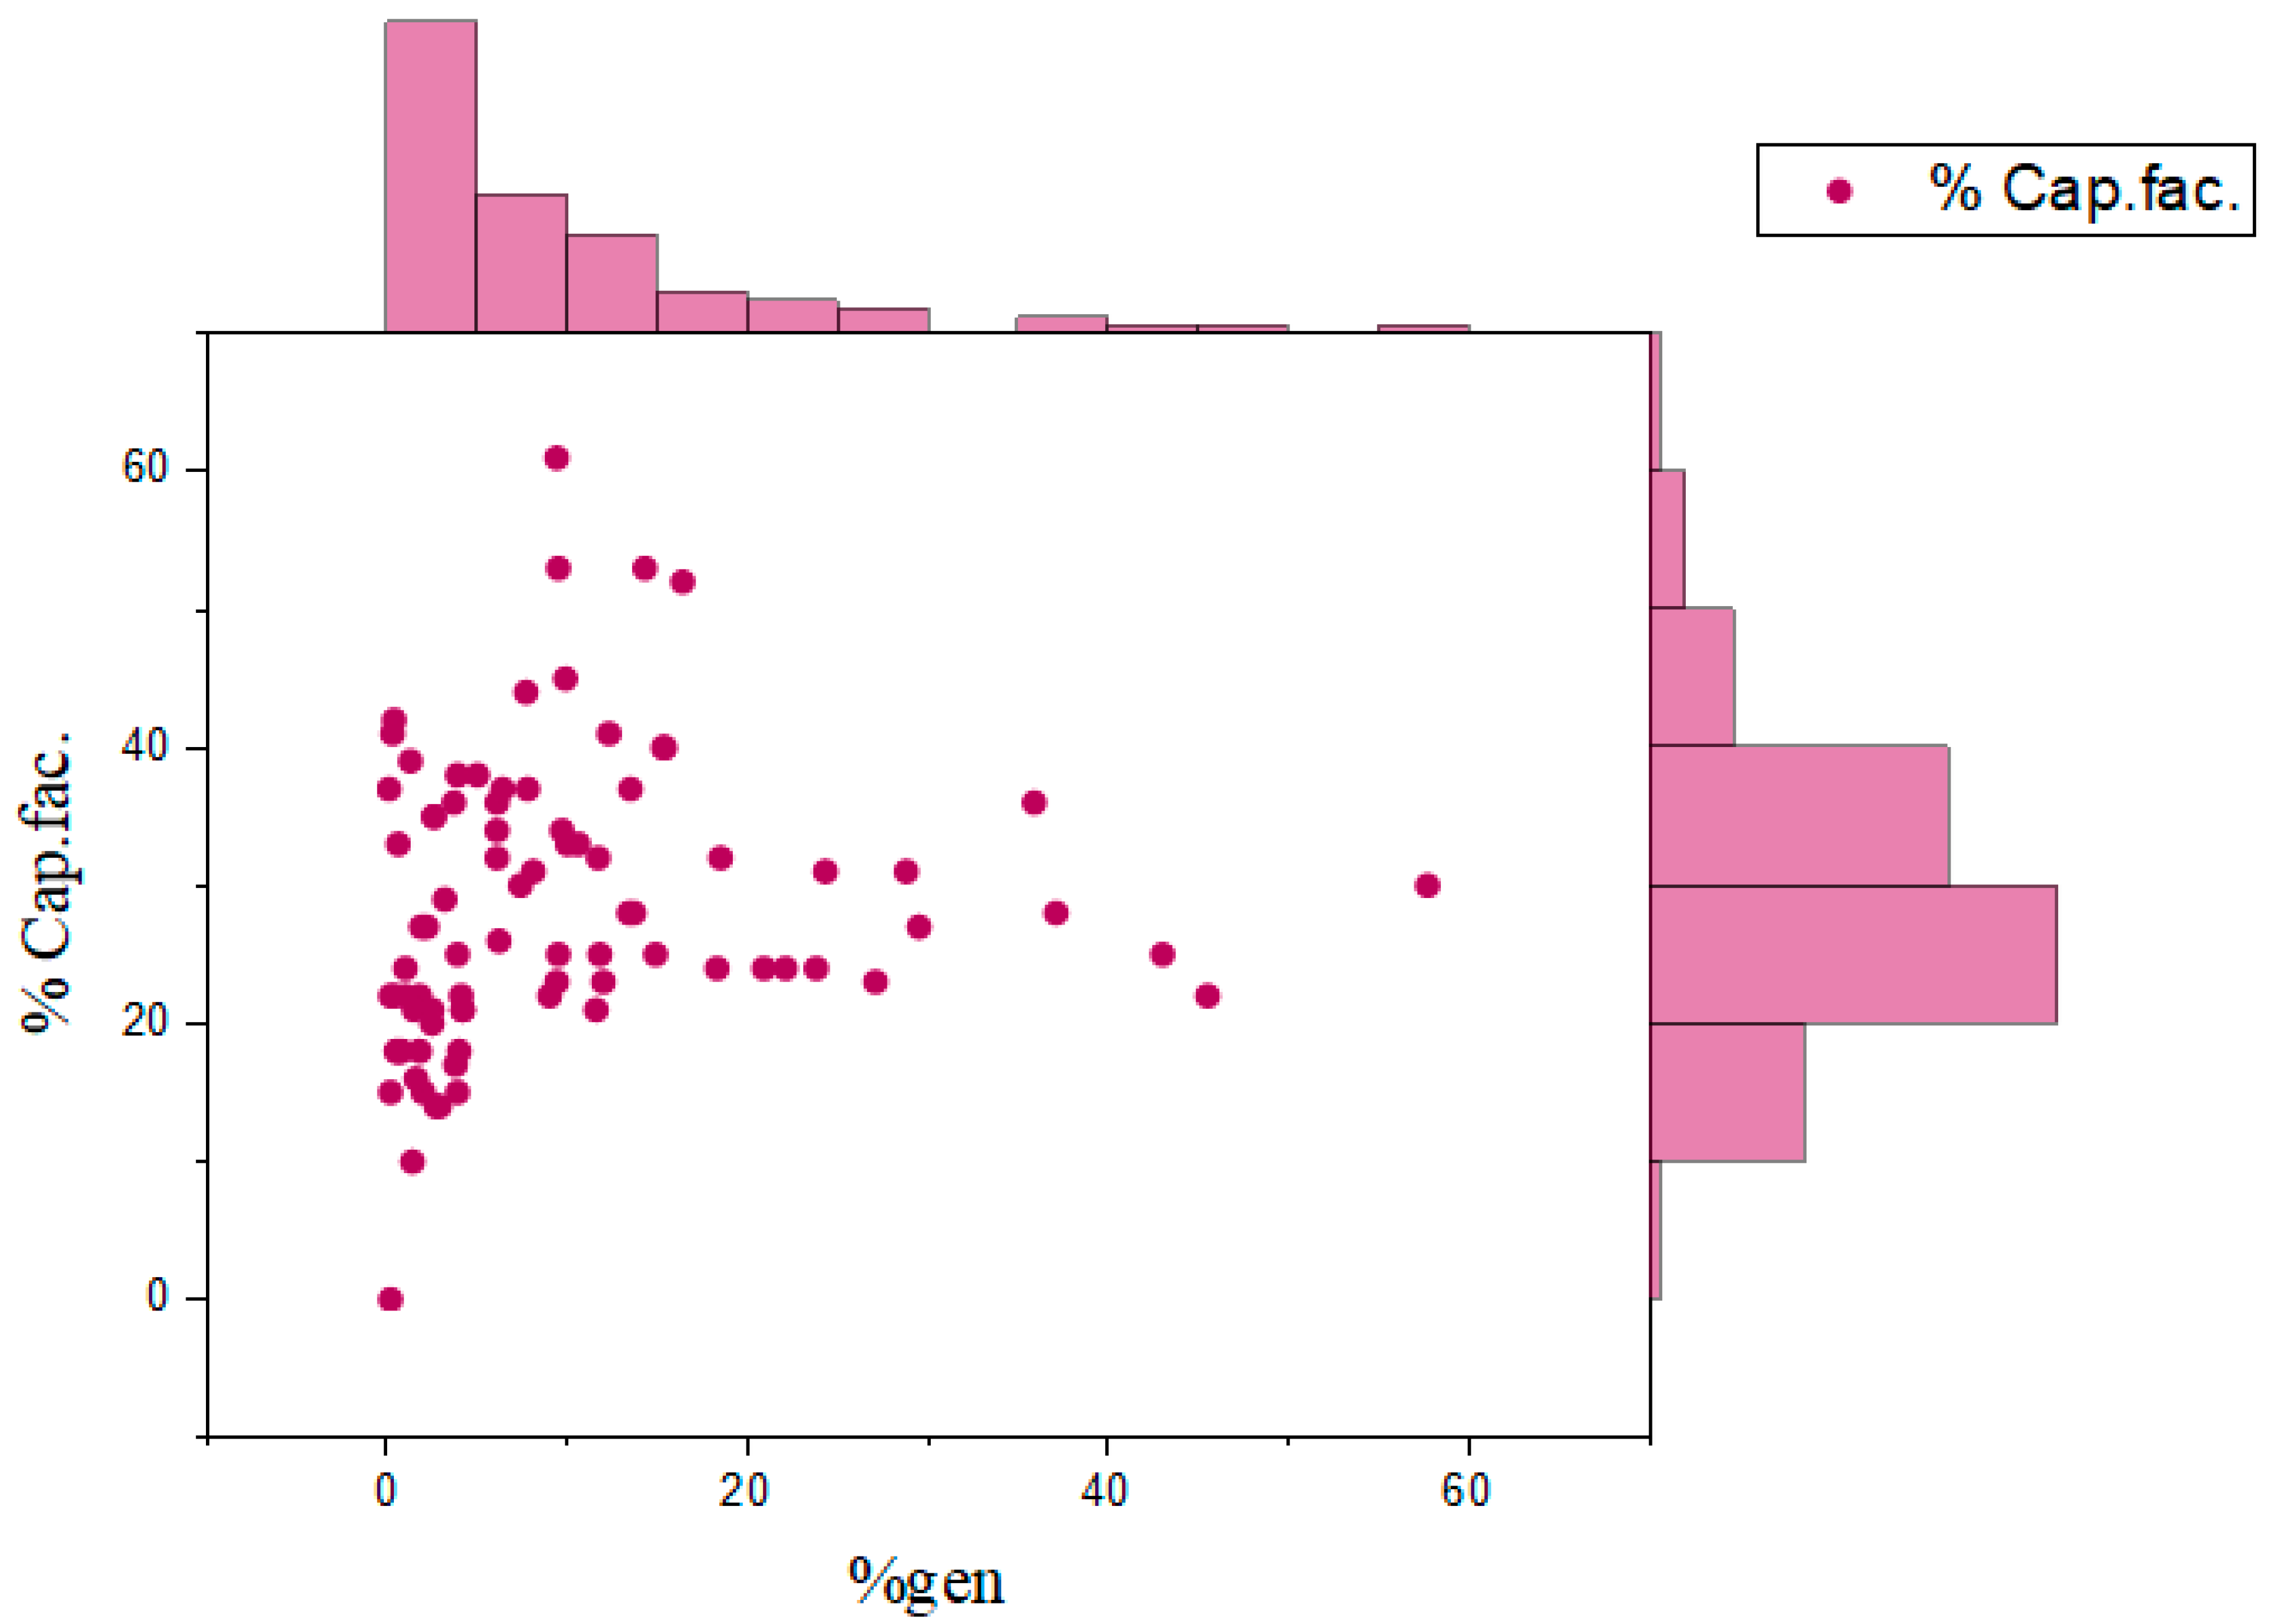
This scatter plot examines the relationship between the capacity factor of the wind plant (% Cap.fac.) and the % of total generation from wind (%gen). The pattern is a cluster of points around lower levels of %gen, indicating that most locations have a proportionally small percentage of their electricity coming from wind despite fluctuating capacity factors.There is a positive, though weak, trend indicated by the data, that with an increase in the proportion of electricity generation through wind, the capacity factor will also tend to increase. The histograms on the axes reveal the individual distributions of generation share and capacity factor and indicate that the capacity factors tend to be most commonly in the range of 20-30%, whereas most of the regions tend to have less than 10% wind generation share.
Figure 6.
Wind energy characteristics correlation matrix.
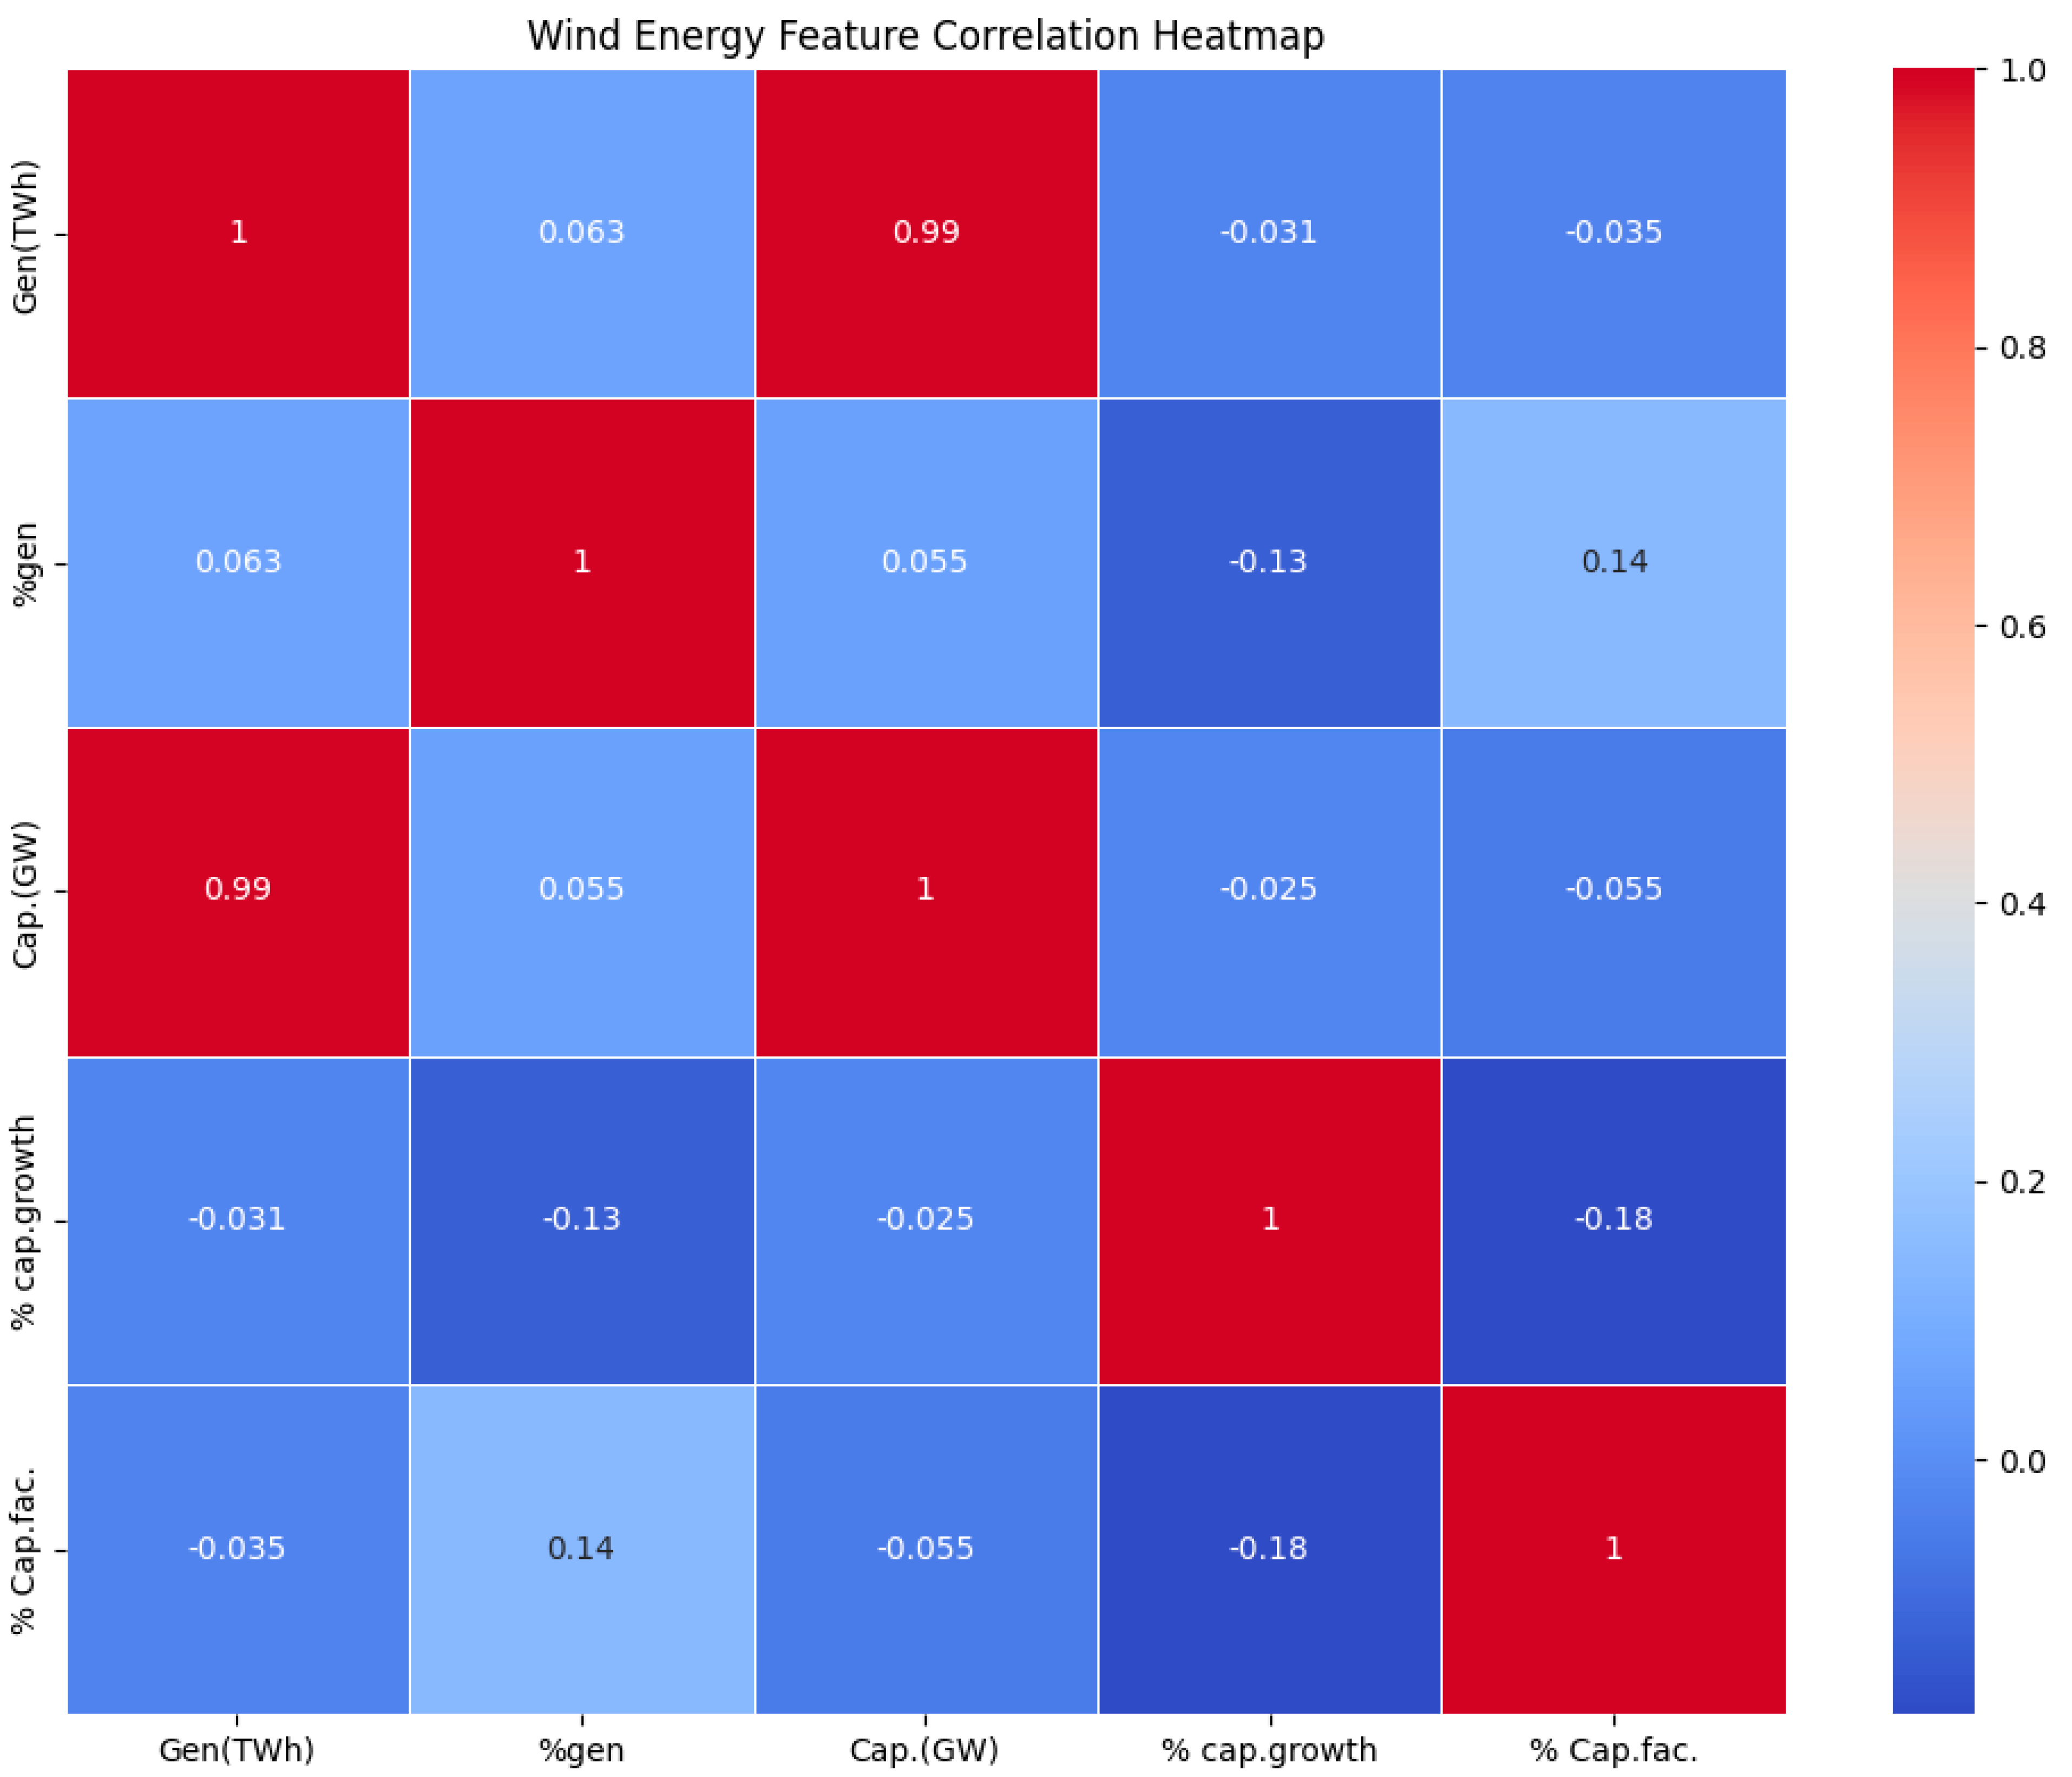
The matrix of correlations is better depicted graphically by the heatmap for principal traits of wind energy, with insight into their interrelationships. Both Gen(TWh) (generated wind energy) and Cap.(GW) (installed capacity) are very positively correlated (0.99), suggesting a linear relationship in which capacity rise leads to the corresponding generation of energy. Conversely, fairly low correlations exist between capacity growth (% cap.growth) and other variables, meaning that capacity growth is, to an extent, independent of capacity factors and generation levels. The rest of the correlations are quite insignificant. This analysis highlights the significance of installed capacity as a key driver of wind energy production and illustrates the multifaceted nature of factors that drive wind energy production.
4. Conclusions
The study emphatically proves the transformative power of wind energy in the global landscape of renewable energy. Wind power will be an increasingly key driver of the world's electricity demand by 2050, with growth in all but a few regions likely to be very strong, capable of reducing carbon emissions by up to 30% in the production of electricity. The crossroads of advanced machine learning has yielded unprecedented views into what is likely to be around the corner, providing an eagle's-eye perspective on the large-scale dynamics informing the progress of renewable energy.
Although opportunities look promising, there are challenges that still confront policy support, technology innovation, and infrastructure development. Increased research expenditures, more efficient turbine technologies that have raised efficiency, and policy regimes favorable to them will realize the potential of wind power as a clean power generation technology, with an emphasis on regional balances and strategy development for adaptability in emerging markets.
Acknowledgements
TM acknowledges Pro H2Vision Solutions for the continued support in her research career. SM and HM acknowledges Pro H2Vis and the windmill which gave the motivation behind this work. D and OSK acknowledges the supporting institutes for this work.
References
- Amendola, S. C., Sharp-Goldman, S. L., Janjua, M. S., Kelly, M. T., Petillo, P. J., & Binder, M. (2000). An ultrasafe hydrogen generator: aqueous, alkaline borohydride solutions and Ru catalyst. Journal of Power Sources. [CrossRef]
- Avery, P., Wang X, Oses C, Gosset E, & Proserpio DM. (2019). Predicting superhard materials via a machine learning informed evolutionary structure search.
- Bairamzadeh, S., Saidi-Mehrabad, M., & Pishvaee, M. S. (2018). Modelling different types of uncertainty in biofuel supply network design and planning: A robust optimization approach. Renewable Energy, 116, 500–517. [CrossRef]
- Bajari, P., Nekipelov, D., Ryan, S. P., & Yang, M. (2015). Machine Learning Methods for Demand Estimation. American Economic Review, 105(5), 481–485. [CrossRef]
- Blaabjerg, F., & Ke Ma. (2013). Future on Power Electronics for Wind Turbine Systems. IEEE Journal of Emerging and Selected Topics in Power Electronics, 1(3), 139–152. [CrossRef]
- Blaabjerg, F., Liserre, M., & Ma, K. (2012). Power Electronics Converters for Wind Turbine Systems. IEEE Transactions on Industry Applications, 48(2), 708–719. [CrossRef]
- Blanco, M. I. (2009). The economics of wind energy. Renewable and Sustainable Energy Reviews, 13(6–7), 1372–1382. [CrossRef]
- Buhre, B. J. P., Elliott, L., Sheng, C., Gupta, R., & Wall, T. (2005). Oxy-fuel combustion technology for coal-fired power generation. Progress in Energy and Combustion Science. [CrossRef]
- Candanedo, I. S., Nieves, E. H., González, S. R., Martín, M. T. S., & Briones, A. G. (2018). Machine Learning Predictive Model for Industry 4.0 (pp. 501–510). [CrossRef]
- Chen, S., Liu, J., Zhang, Q., Teng, F., & McLellan, B. C. (2022). A critical review on deployment planning and risk analysis of carbon capture, utilization, and storage (CCUS) toward carbon neutrality. Renewable and Sustainable Energy Reviews, 167, 112537. [CrossRef]
- Degerman, M., Degerman, M., Westerberg, K., Westerberg, K., Nilsson, B., & Nilsson, B. (2009). Determining Critical Process Parameters and Process Robustness in Preparative Chromatography - A Model-Based Approach. Chemical Engineering & Technology. [CrossRef]
- Demirbas, A. (2008). Biofuels sources, biofuel policy, biofuel economy and global biofuel projections. Energy Conversion and Management, 49(8), 2106–2116. [CrossRef]
- Demirbas, A. (2017). Future hydrogen economy and policy. Energy Sources, Part B: Economics, Planning, and Policy, 12(2), 172–181. [CrossRef]
- Dincer, I., & Acar, C. (2015). Review and evaluation of hydrogen production methods for better sustainability. International Journal of Hydrogen Energy. [CrossRef]
- Falcone, P. M., Hiete, M., & Sapio, A. (2021). Hydrogen economy and sustainable development goals: Review and policy insights. Current Opinion in Green and Sustainable Chemistry, 31, 100506. [CrossRef]
- Fei, L., Dong, S., Xue, L., Liang, Q., & Yang, W. (2011). Energy consumption-economic growth relationship and carbon dioxide emissions in China. Energy Policy, 39(2), 568–574. [CrossRef]
- Fingersh, L. J. (2003). Optimized Hydrogen and Electricity Generation from Wind. [CrossRef]
- Hansen, A. D. (2012). Generators and Power Electronics for Wind Turbines. In Wind Power in Power Systems (pp. 73–103). Wiley. [CrossRef]
- He, Z., He, Z., Minteer, S. D., Minteer, S. D., Angenent, L. T., & Angenent, L. T. (2005). Electricity Generation from Artificial Wastewater Using an Upflow Microbial Fuel Cell. Environmental Science & Technology. [CrossRef]
- Jiménez-González, C., Jiménez-González, C., Woodley, J. M., & Woodley, J. M. (2010). Bioprocesses: Modeling needs for process evaluation and sustainability assessment. Computers & Chemical Engineering. [CrossRef]
- Joselin Herbert, G. M., Iniyan, S., Sreevalsan, E., & Rajapandian, S. (2007). A review of wind energy technologies. Renewable and Sustainable Energy Reviews, 11(6), 1117–1145. [CrossRef]
- Kruppa, J., Ziegler, A., & König, I. R. (2012). Risk estimation and risk prediction using machine-learning methods. Human Genetics, 131(10), 1639–1654. [CrossRef]
- Lacy, R., Serralde, C., Climent, M., & Vaca, M. (2013). Initial assessment of the potential for future CCUS with EOR projects in Mexico using CO2 captured from fossil fuel industrial plants. International Journal of Greenhouse Gas Control. [CrossRef]
- Liu, J., Chen, T., & Hu, B. (2023). Consumer acceptance under hydrogen energy promotion policy: Evidence from Yangtze River Delta. International Journal of Hydrogen Energy, 48(30), 11104–11112. [CrossRef]
- Mascarenhas, J. dos S., Chowdhury, H., Thirugnanasambandam, M., Chowdhury, T., & Saidur, R. (2019). Energy, exergy, sustainability, and emission analysis of industrial air compressors. Journal of Cleaner Production, 231, 183–195. [CrossRef]
- Mazhnik, E., & Oganov, A. R. (2020). Application of machine learning methods for predicting new superhard materials. Journal of Applied Physics, 128(7), 075102. [CrossRef]
- Milani, D., Kiani, A., & McNaughton, R. (2020). Renewable-powered hydrogen economy from Australia’s perspective. International Journal of Hydrogen Energy. [CrossRef]
- Mittal, H., & Kushwaha, O. S. (2024a). Biogas and Biofuel Production from Biowaste: Modelling and Simulation Study. In From Waste to Wealth (pp. 379–400). Springer Nature Singapore. [CrossRef]
- Mittal, H., & Kushwaha, O. S. (2024b). Machine Learning in Commercialized Coatings. In Functional Coatings (pp. 450–474). Wiley. [CrossRef]
- Mittal, H., & Kushwaha, O. S. (2024c). Policy Implementation Roadmap, Diverse Perspectives, Challenges, Solutions Towards Low-Carbon Hydrogen Economy. Green and Low-Carbon Economy. [CrossRef]
- Mittal, H., Verma, S., Bansal, A., & Singh Kushwaha, O. (2024). Low-Carbon Hydrogen Economy Perspective and Net Zero-Energy Transition through Proton Exchange Membrane Electrolysis Cells (PEMECs), Anion Exchange Membranes (AEMs) and Wind for Green Hydrogen Generation. Qeios. [CrossRef]
- Ostblom, G. (1982). Energy use and structural changes: Factors behind the fall in Sweden’s energy output ratio☆. Energy Economics. [CrossRef]
- Pekel, E. (2020). Estimation of soil moisture using decision tree regression. Theoretical and Applied Climatology, 139(3–4), 1111–1119. [CrossRef]
- Phillips, J. (2013). Determining the sustainability of large-scale photovoltaic solar power plants. Renewable and Sustainable Energy Reviews, 27, 435–444. [CrossRef]
- Praveenkumar, V., Mittal, H. N., & Kushwaha, O. S. (2024). Analysing Industrial Scale-Up of Carbon Dioxide Capture in Aqueous Amino Acids for Sustainable Technologies (pp. 39–55). [CrossRef]
- Rahimi-Gorji, M., Ghajar, M., Kakaee, A.-H., & Ganji, D. D. (2017). Modeling of the air conditions effects on the power and fuel consumption of the SI engine using neural networks and regression. Journal of The Brazilian Society of Mechanical Sciences and Engineering. [CrossRef]
- Rodrigues, S., Restrepo, C., Kontos, E., Teixeira Pinto, R., & Bauer, P. (2015). Trends of offshore wind projects. In Renewable and Sustainable Energy Reviews (Vol. 49, pp. 1114–1135). Elsevier Ltd. [CrossRef]
- Rodriguez-Galiano, V., Sanchez-Castillo, M., Chica-Olmo, M., & Chica-Rivas, M. (2015). Machine learning predictive models for mineral prospectivity: An evaluation of neural networks, random forest, regression trees and support vector machines. Ore Geology Reviews, 71, 804–818. [CrossRef]
- Salman, S. K., & Teo, A. L. J. (2003). Windmill modeling consideration and factors influencing the stability of a grid-connected wind power-based embedded generator. IEEE Transactions on Power Systems, 18(2), 793–802. [CrossRef]
- Sherif, S. A., Barbir, F., & Veziroglu, T. N. (2005). Wind energy and the hydrogen economy—review of the technology. Solar Energy, 78(5), 647–660. [CrossRef]
- Smith, P. F., Ganesh, S., & Liu, P. (2013). A comparison of random forest regression and multiple linear regression for prediction in neuroscience. Journal of Neuroscience Methods, 220(1), 85–91. [CrossRef]
- Smola, A. J., & Schölkopf, B. (2004). A tutorial on support vector regression. Statistics and Computing, 14(3), 199–222. [CrossRef]
- Snyder, B., & Kaiser, M. J. (2009). Ecological and economic cost-benefit analysis of offshore wind energy. Renewable Energy, 34(6), 1567–1578. [CrossRef]
- Sreelekshmy, B. R., Basheer, R., Sivaraman, S., Vasudevan, V., Elias, L., & Shibli, S. M. A. (2020). Sustainable electric power generation from live anaerobic digestion of sugar industry effluents using microbial fuel cells. Journal of Materials Chemistry A, 8(12), 6041–6056. [CrossRef]
- Xiang, Y., Cai, H., Gu, C., & Shen, X. (2020). Cost-benefit analysis of integrated energy system planning considering demand response. Energy, 192. [CrossRef]
- Yang, H., Zou, C., Huang, M., Zang, M., & Chen, S. (2023). High-fidelity computational modeling of scratch damage in automotive coatings with machine learning-driven identification of fracture parameters. Composite Structures, 316, 117027. [CrossRef]
- Yang, W.-J., & Aydin, O. (2001). Wind energy-hydrogen storage hybrid power generation. International Journal of Energy Research, 25(5), 449–463. [CrossRef]
- Zhang, G., & Wan, X. (2014). A wind-hydrogen energy storage system model for massive wind energy curtailment. International Journal of Hydrogen Energy, 39(3), 1243–1252. [CrossRef]
- Zhao, C., Chen, X., Anthony, E. J., Jiang, X., Duan, L., Wu, Y., Wu, Y., Dong, W., & Zhao, C. (2013). Capturing CO2 in flue gas from fossil fuel-fired power plants using dry regenerable alkali metal-based sorbent. Progress in Energy and Combustion Science. Progress in Energy and Combustion Science. [CrossRef]
- Zhou, P., Ang, B. W., Wang, H., Wang, H., Wang, H., & Wang, H. (2012). Energy and CO2 emission performance in electricity generation: A non-radial directional distance function approach. European Journal of Operational Research. [CrossRef]
Figure 1.
Diagram of a wind turbine system demonstrating energy conversion, storage, and transmission to AC devices through charge controller, batteries, and inverter.
Figure 1.
Diagram of a wind turbine system demonstrating energy conversion, storage, and transmission to AC devices through charge controller, batteries, and inverter.
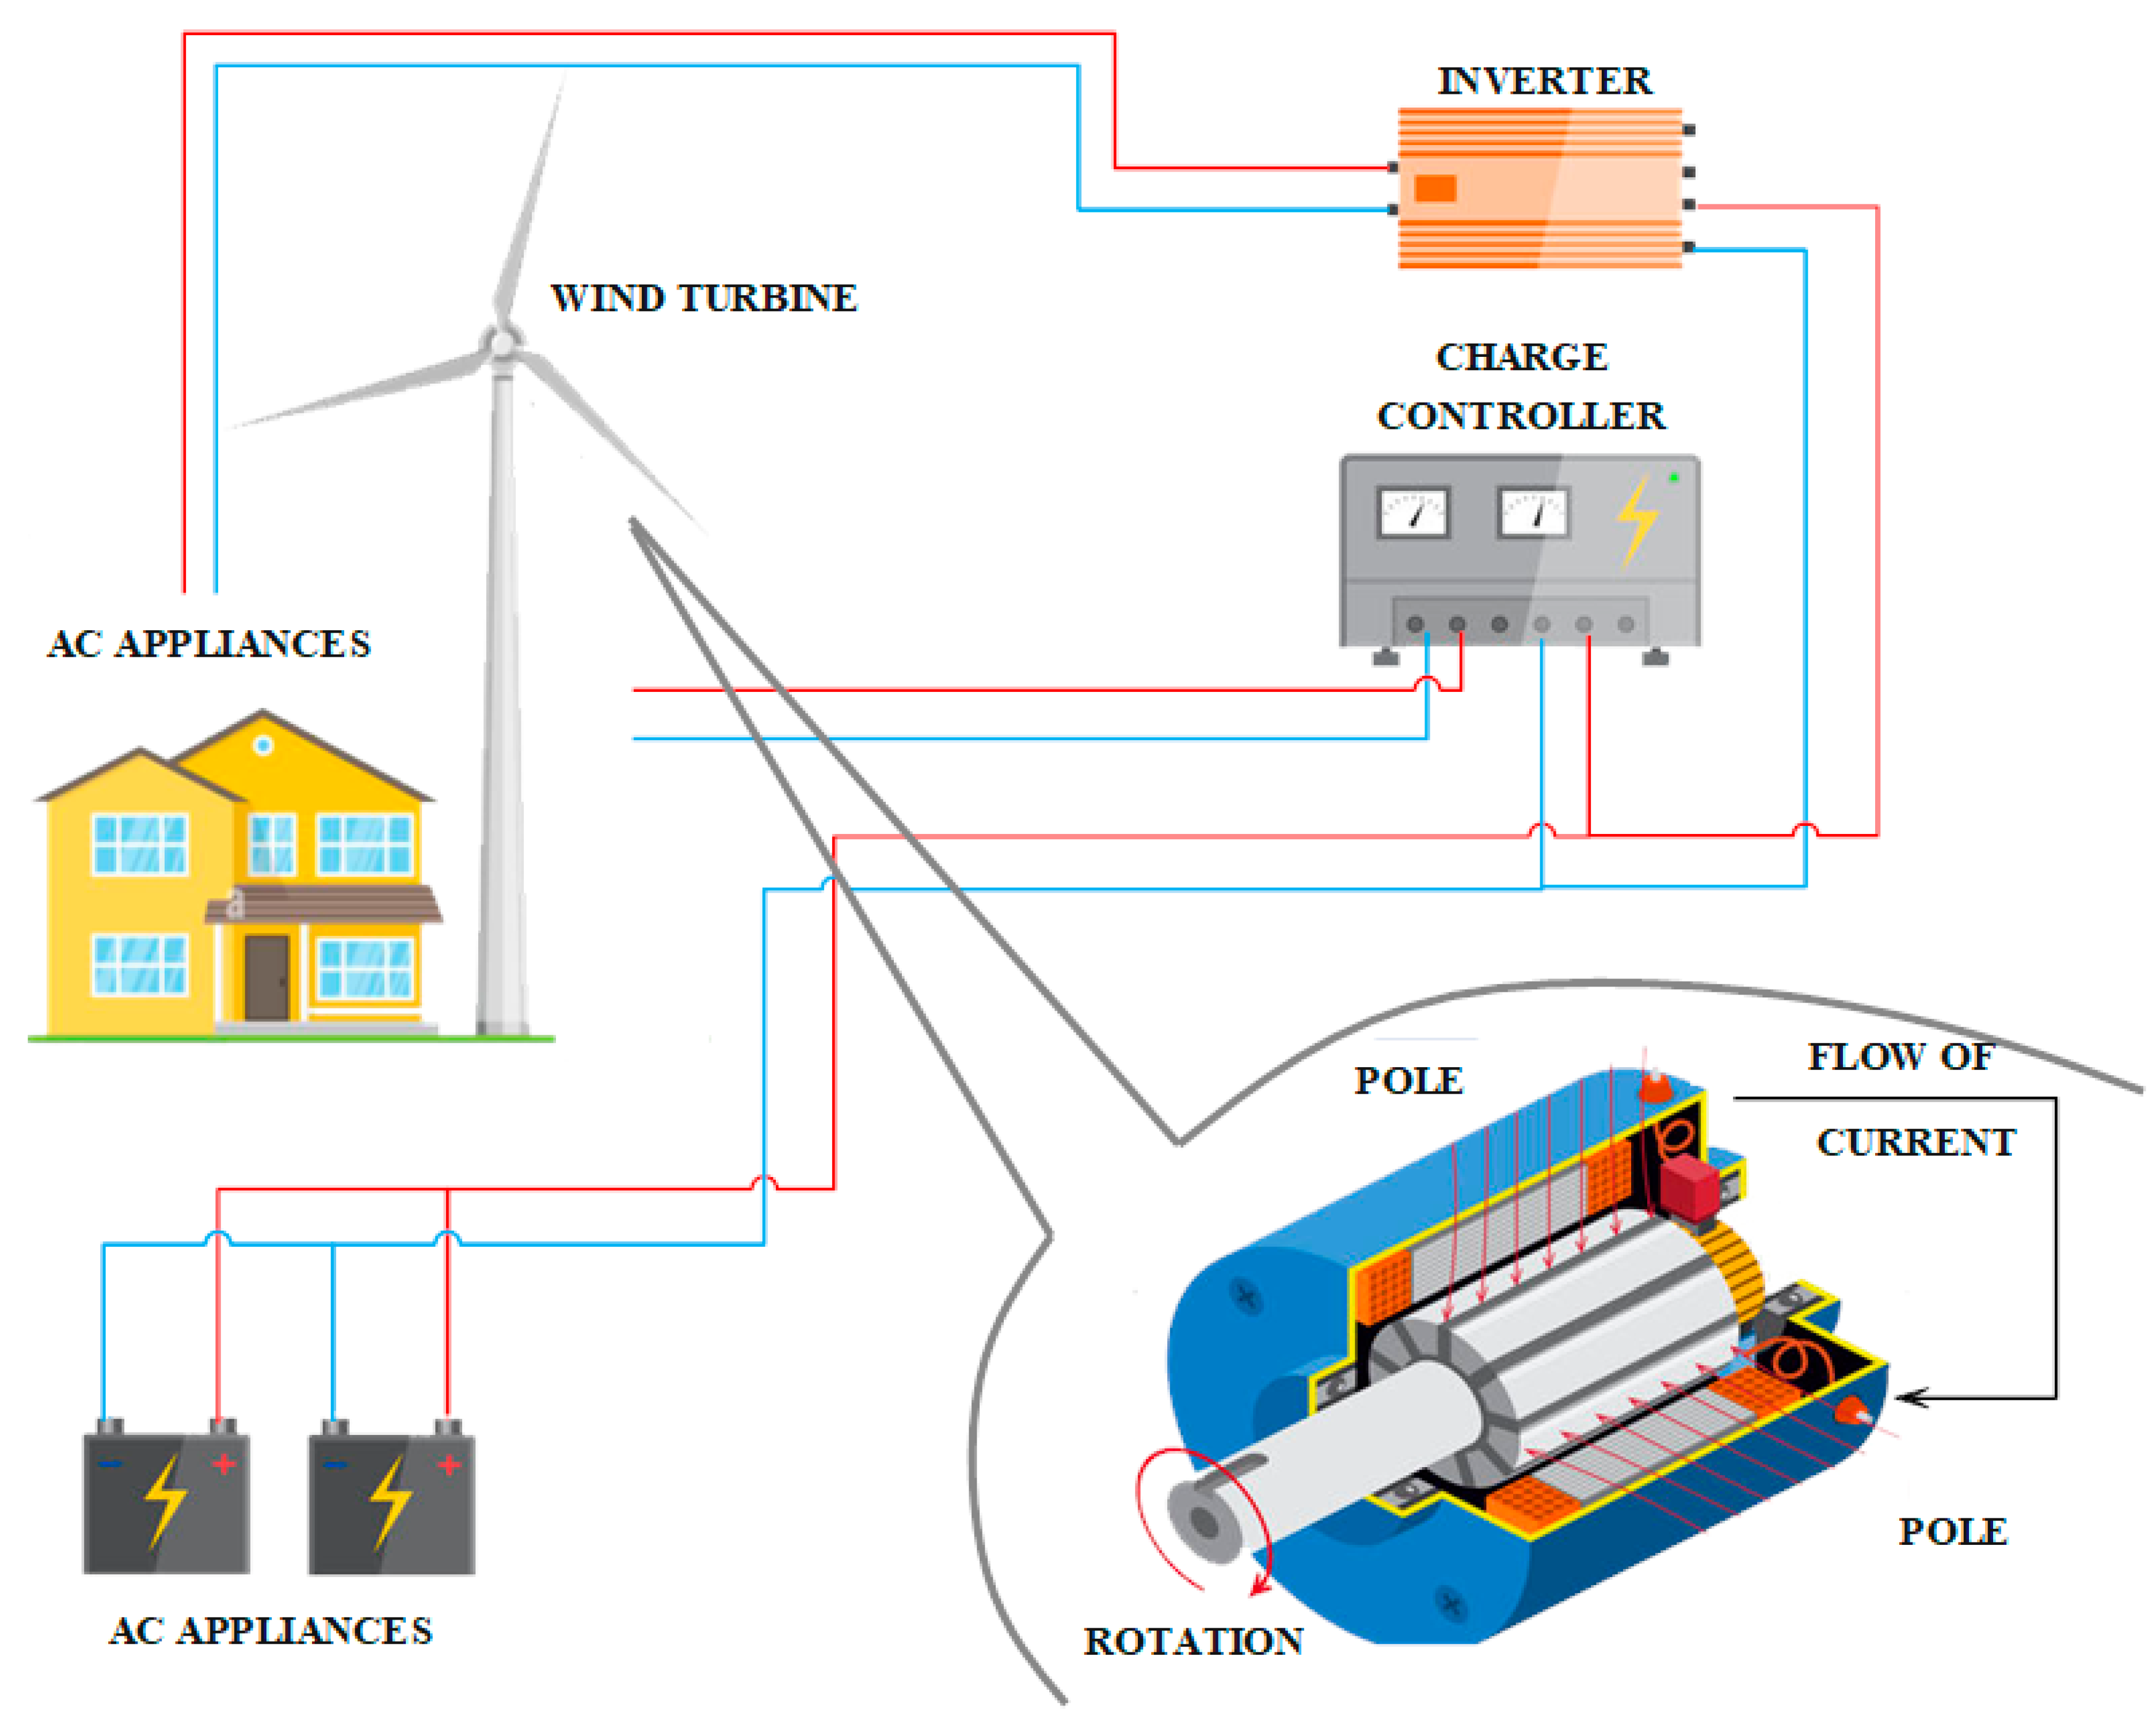
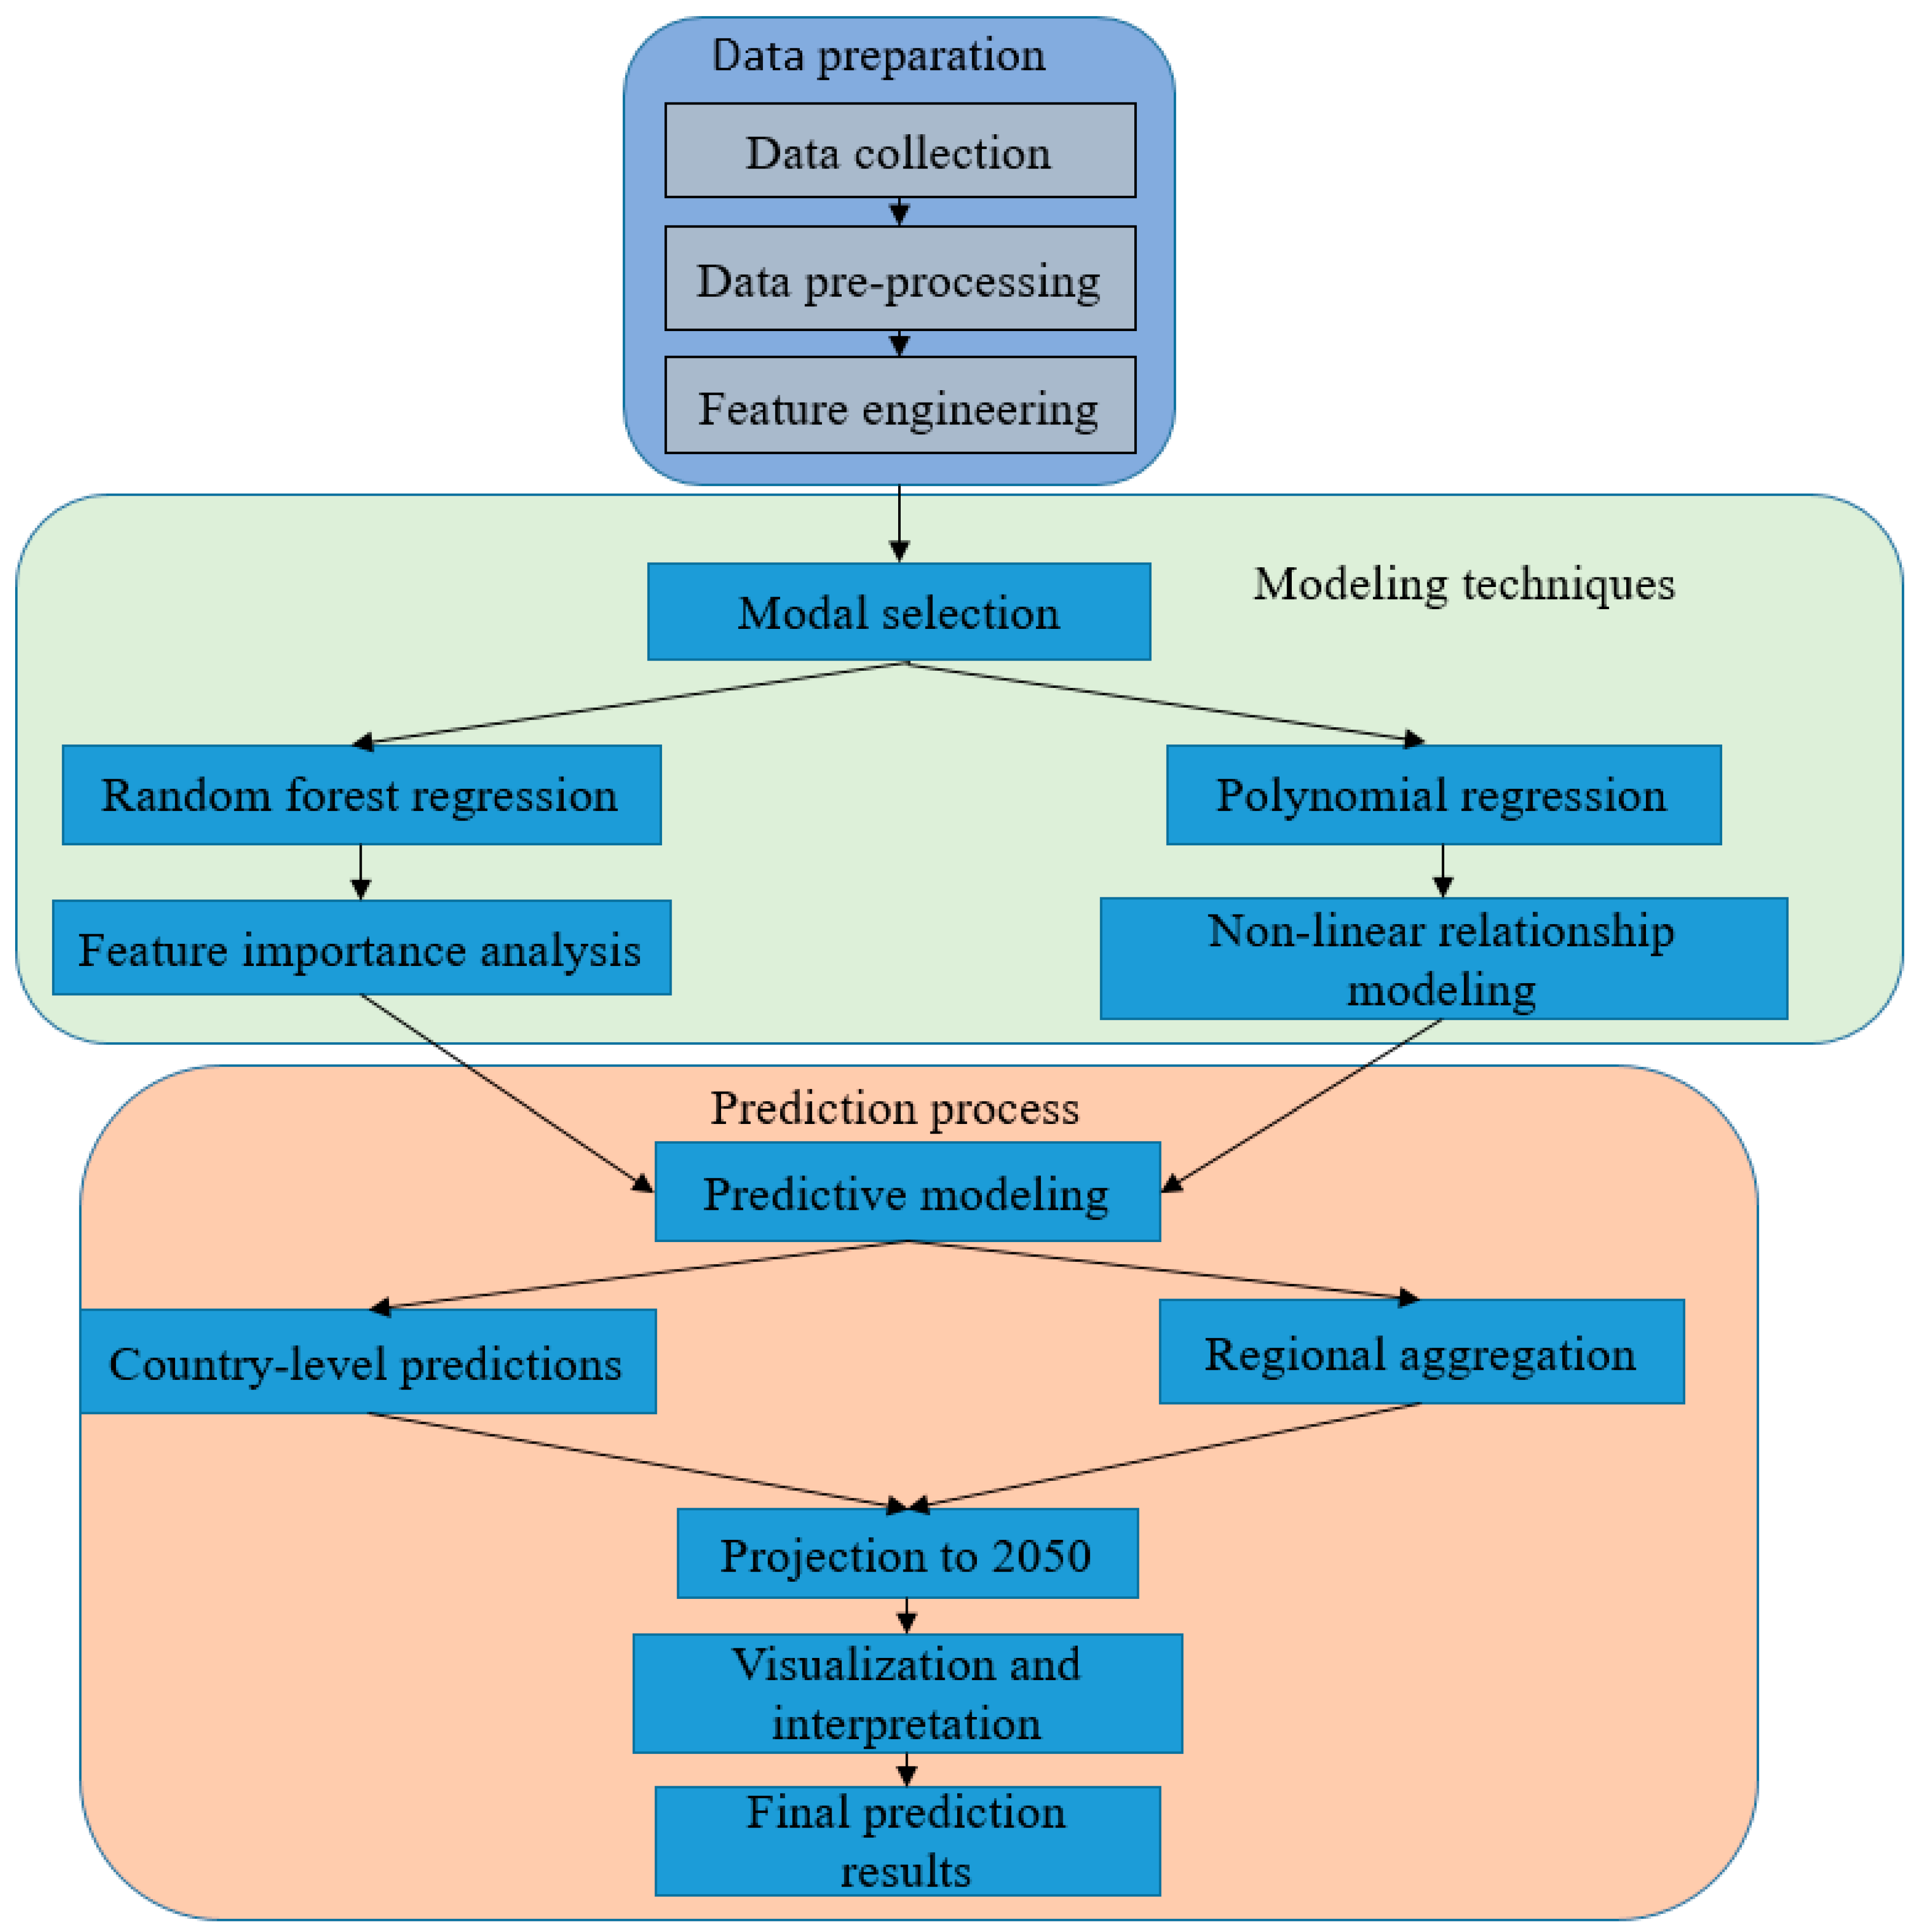
Figure 2.
A flowchart illustrating the methodology for predicting wind energy generation to 2050.
Disclaimer/Publisher’s Note: The statements, opinions and data contained in all publications are solely those of the individual author(s) and contributor(s) and not of MDPI and/or the editor(s). MDPI and/or the editor(s) disclaim responsibility for any injury to people or property resulting from any ideas, methods, instructions or products referred to in the content. |
© 2025 by the authors. Licensee MDPI, Basel, Switzerland. This article is an open access article distributed under the terms and conditions of the Creative Commons Attribution (CC BY) license (http://creativecommons.org/licenses/by/4.0/).
Copyright: This open access article is published under a Creative Commons CC BY 4.0 license, which permit the free download, distribution, and reuse, provided that the author and preprint are cited in any reuse.


