1. Introduction
Allergic rhinitis (AR) is a chronic inflammatory disorder of the upper airway affecting over 500 million individuals worldwide [
1,
2]. While AR is primarily driven by type 2 immune responses, characterized by elevated interleukin (IL)-4, IL-5, and IL-13, accumulating evidence suggests that structural alterations in the nasal epithelium, such as epithelial thickening, barrier dysfunction, and goblet cell metaplasia, play a pivotal role in disease persistence, symptom severity, and susceptibility to environmental triggers [
3,
4,
5]. However, the cellular and molecular mechanisms underlying epithelial remodeling in AR remain incompletely defined.
The small GTPase Ras homolog family member A (RhoA) is a key intracellular signal transducer belonging to the Rho family of small GTPases [
6]. It functions as a nucleotide-dependent molecular switch, cycling between an inactive GDP-bound state and an active GTP-bound state [
7]. Upon activation, RhoA interacts with various downstream effectors, such as Rho-associated coiled-coil containing protein kinase (ROCK), to regulate actomyosin contractility, junctional integrity, and epithelial barrier function [
8,
9,
10]. Notably, activation of the RhoA/ROCK pathway has been implicated in airway inflammation by modulating the recruitment, differentiation, and activation of multiple inflammatory cell types, including eosinophils, macrophages, mast cells, and T cells [
11,
12,
13]. Recent studies further indicate that dysregulated RhoA/ROCK signaling contributes to epithelial barrier disruption, airway inflammation, and tissue remodeling in diverse inflammatory airway diseases [
8,
9,
14]. However, the specific role of epithelial RhoA signaling in AR, particularly its contribution to epithelial remodeling through non-immune mechanisms, remains largely unexplored.
Beyond its immunomodulatory functions, emerging evidence indicates that RhoA signaling is a key regulator of oxidative stress and mitochondrial homeostasis—processes intimately linked to epithelial cellular senescence [
8,
15]. Epithelial senescence has recently been recognized as a hallmark of chronic airway inflammation [
16,
17,
18]. Senescent epithelial cells exhibit impaired proliferative capacity and secrete a broad array of pro-inflammatory cytokines, chemokines, and matrix-degrading enzymes, collectively termed the senescence-associated secretory phenotype (SASP) [
18,
19,
20]. Excessive accumulation of reactive oxygen species (ROS) is a well-established trigger of cellular senescence and epithelial dysfunction [
21,
22]. While these mechanisms have been implicated in diseases such as asthma, pulmonary fibrosis, and chronic obstructive pulmonary disease (COPD) [
22,
23,
24], the presence and functional significance of nasal epithelial senescence in AR remain largely undefined. Moreover, the contribution of epithelial RhoA/ROCK signaling to the induction of senescence and epithelial remodeling in AR has not yet been elucidated.
In this study, we sought to define how RhoA/ROCK signaling contributes to epithelial oxidative stress, senescence, and remodeling in AR, and to identify the molecular pathways underlying these processes. Nasal mucosa from AR patients were examined histologically and by bulk RNA sequencing to identify RhoA-associated transcriptomic changes. Epithelial-specific
RhoA-deficient mice and the ROCK inhibitor fasudil were used to evaluate the effects of RhoA/ROCK inhibition on oxidative stress, cellular senescence, and epithelial remodeling. The contribution of senescent cells to allergic inflammation, oxidative stress, and epithelial remodeling was also investigated. Pathway and network analyses identified
PRKN, a key regulator of mitochondrial homeostasis [
25], as a major downstream mediator of RhoA signaling. Functional assays in human nasal epithelial cells (HNEpCs) further validated the role of
PRKN in modulating mitochondrial dysfunction, oxidative stress, and epithelial senescence.
2. Methods
2.1. Human Study Subjects
This study enrolled 40 participants, including 20 patients with AR and 20 healthy controls (HCs). The diagnosis of AR was established according to the 2023 International Consensus Statement on Allergy and Rhinology: Allergic Rhinitis (ICAR-Allergic Rhinitis 2023) criteria [
26]. HCs were non-atopic individuals who underwent nasal surgery for non-inflammatory, non-allergic conditions. Exclusion criteria included prior allergen immunotherapy, concurrent infection, pregnancy, or use of systemic corticosteroids, antihistamines, or immunosuppressive agents within four weeks before sample collection. Inferior turbinate mucosal biopsies were obtained intraoperatively. Symptom severity in AR patients was evaluated using the Total Nasal Symptom Score (TNSS) and the Rhinoconjunctivitis Quality of Life Questionnaire (RQLQ) [
27,
28,
29]. Clinical and demographic characteristics of all participants are summarized in Table S1 in the Online Repository. The study protocol was approved by the Human Research Ethics Committee of Xiangya Hospital, Central South University, and written informed consent was obtained from all participants prior to enrollment.
2.2. Mice
Wild-type (WT) C57BL/6J mice, CC10-CreERTM transgenic mice, and p16-3MR homozygous mice were obtained from The Jackson Laboratory (Bar Harbor, USA). RhoAf/f mice were generously provided by Dr. Yi Zheng (University of Cincinnati). To generate conditional RhoA knockout mice, CC10-CreERTM mice were crossed with RhoAf/f mice to obtain CC10-CreERTM; RhoA f/f (RhoAcKO) mice. All mice were maintained under specific pathogen-free conditions at the animal facility of the Johns Hopkins University School of Medicine. All experimental procedures were conducted in accordance with the guidelines of the National Institutes of Health and were approved by the Institutional Animal Care and Use Committee of Johns Hopkins University.
2.3. Generation of the AR Murine Model
The murine model of AR was established following a modified protocol from previous studies [
30,
31]. Both
RhoAcKO and
RhoA flf mice received tamoxifen (75 mg/kg; Sigma-Aldrich, St. Louis, USA) once daily for five consecutive days, followed by a 7-day washout period to induce Cre-mediated gene recombination in airway club cells. Mice were then sensitized by intraperitoneal injection of 100 μg house dust mite (HDM; Greer Laboratories, Lenoir, USA) emulsified in 2 mg Imject Alum (Thermo Fisher Scientific, Waltham, USA) in 200 μL PBS on days 0, 7, and 14. From days 21 to 26, mice were challenged intranasally with 50 μg HDM in 20 μL PBS once daily for six consecutive days, while controls received PBS alone.
p16-3MR mice underwent the same protocol and were treated with ganciclovir (GCV; 25 mg/kg; MedChemExpress, Monmouth Junction, USA) or vehicle (DMSO) once daily during the challenge phase to selectively eliminate senescent cells. In a separate experiment, AR mice received the ROCK inhibitor fasudil (30 mg/kg; MedChemExpress) 30 minutes before each HDM challenge [
9,
10]. Mice were euthanized on day 27, and nasal tissues were collected for histological and molecular analyses. Serum and nasal lavage fluid (NALF) were used to quantify total and HDM-specific IgE and cytokine levels. Allergic symptoms were behaviorally assessed by counting sneezing and nasal scratching events within 10 minutes after the final intranasal challenge.
2.3. Hematoxylin and Eosin and Periodic Acid-Schiff Staining
Fresh human inferior turbinate tissues and mouse nasal specimens were fixed in 4% paraformaldehyde, dehydrated, paraffin-embedded, and sectioned at 4 μm thickness. Tissue sections were dewaxed, rehydrated, and subjected to Hematoxylin and Eosin (H&E) and Periodic Acid–Schiff (PAS) staining using commercially available kits (Abcam, Cambridge, UK), according to the manufacturer’s instructions [
9].
2.4. Human NEC Culture and Intervention
Primary human NECs were isolated from inferior turbinate tissues obtained from HCs during surgery and cultured in PneumaCul
TM-Ex Plus Medium (STEMCELL Technologies, Vancouver, Canada) at 37 °C in a humidified 5% CO
2 incubator, as previously described [
32,
33]. When cells reached approximately 80% confluence, they were dissociated and seeded into 6-well plates at a density of 1 × 10
5 cells/well.
2.5. Mouse NECs Air-Liquid Interface Culture
Primary mouse NECs were isolated and cultured based on established protocols[
32,
34]. NECs were initially seeded in Collagen I–coated flasks (Corning, USA) and expanded in PneumaCult
TM-Ex Plus Medium with daily medium replacement. Upon reaching 80% confluence, NECs were dissociated and seeded at a density of ~1 × 10
5 cells/well onto 12-well Transwell inserts (0.4 µm pore size; Corning). Once confluent, an air–liquid interface (ALI) was established by replacing the apical medium with air and culturing with PneumaCult™-ALI Medium (STEMCELL Technologies). Cells were maintained for 21 days to allow full differentiation. Transepithelial electrical resistance (TEER) was measured using an epithelial voltohmmeter (Millipore, Billerica, USA) [
32,
34].
2.6. Establishment of PRKN-Overexpressing HNEpCs
HNEpCs were transduced with a lentiviral vector carrying the full-length human PRKN coding sequence (LV-plex-MCS backbone, NM_004562, 1442 bp; OBiO Technology, Shanghai, China) according to the manufacturer’s instructions. Following transduction, cells were cultured in fresh growth medium containing selection antibiotics for 10–14 days, with medium replaced every 2–3 days, until resistant colonies were established. Surviving clones were expanded and screened for stable PRKN overexpression using quantitative reverse transcription PCR (qRT-PCR) and Western blotting. The verified stable cell lines were used for subsequent experiments.
2.7. qRT-PCR
Total RNA was extracted from nasal tissues using TRIzol reagent (Invitrogen, Waltham, MA, USA), and RNA purity and concentration were assessed spectrophotometrically. Complementary DNA was synthesized via reverse transcription, followed by amplification using the TaqMan® Gene Expression Kit (Thermo Fisher Scientific). GAPDH served as internal control. Relative gene expression was quantified using the 2-ΔΔCT method. Primer sequences are listed in Table S2 in the Online Repository.
2.8. Western Blot Assay
Total protein was extracted from nasal mucosal tissues or cultured cells, separated by SDS–PAGE (Servicebio, Wuhan, China), and transferred to PVDF membranes. Membranes were blocked and incubated overnight at 4℃ with primary antibodies against RhoA-GTPase (New East Biosciences, Malvern, PA, USA), PRKN (Cell Signaling Technology, Danvers, USA), and β-Tubulin (Affinity, Changzhou, China). After incubation with HRP-conjugated secondary antibodies, bands were visualized using enhanced chemiluminescence and quantified using ImageJ.
2.9. ELISA
Concentrations of IL-4, IL-5, IL-13, IL-1β, IL-6, and total IgE were measured using commercial ELISA kits (BD Biosciences, San Diego, CA, USA) following the manufacturer’s instructions. HDM-specific IgE was quantified by coating 96-well plates with HDM extract (10 µg/mL), followed by blocking, incubation with diluted samples, and detection using biotinylated anti-mouse IgE, streptavidin-HRP, and TMB substrate [
9,
35,
36]. Absorbance was measured using a microplate reader (Bio-Rad, Hercules, CA, USA)
2.10. Immunohistochemistry and Immunofluorescence Staining
Immunostaining was performed on paraffin-embedded tissue sections and cultured NECs. After deparaffinization and antigen retrieval, samples were blocked and incubated overnight at 4℃ with primary antibodies against human IL-4, IL-5, and IL-13 (1:200, Affinity). For immunohistochemistry, sections were treated with HRP-conjugated secondary antibodies and developed using DAB substrate, followed by hematoxylin counterstaining. For immunofluorescence staining, primary antibodies (summarized in Table S3, Online Repository) were detected using species-specific fluorophore-conjugated secondary antibodies. Nuclei were counterstained with DAPI. Senescent cells were detected using a SA-β-Gal staining kit (Cell Signaling Technology) according to the manufacturer’s instructions. ROS levels in cultured cells were measured using CM-H₂DCFDA (total intracellular ROS; Thermo Fisher Scientific) and MitoSOX Red (mitochondrial superoxide; Thermo Fisher Scientific). All images were captured using a fluorescence microscope, and quantification of fluorescence intensity and positive cell percentage was conducted using ImageJ software.
2.11. Bulk RNA-Seq Analysis
Total RNA was extracted from nasal mucosal tissues using TRIzol reagent (Invitrogen, Waltham, USA), and RNA integrity was assessed with an Agilent 2200 TapeStation (Agilent Technologies, Santa Clara, USA). Library construction and high-throughput sequencing were performed on an Illumina HiSeq 3000 platform (Illumina, San Diego, CA, USA) by RiboBio (Guangzhou, China). Raw reads were processed and aligned to the reference genome, and differentially expressed genes (DEGs) were identified using the DESeq2 package (v1.40.2) in R (v4.3.0). Genes with an adjusted p-value < 0.05 and log2(fold change) > log2(1.5) were considered statistically significant. Visualization of transcriptomic data, including heatmaps and volcano plots, was performed in R. Sequencing data have been deposited in the GSA-Human database at CNCB (BioProject ID: PRJCA038464).
2.12. Transmission Electron Microscope Examination
For ultrastructural analysis, treated HNEpCs were fixed in 2.5% glutaraldehyde overnight at 4 °C, posted in 1% osmium tetroxide for 2 hours, and dehydrated through a graded ethanol series. Specimens were embedded in Spurr’s epoxy resin, sectioned, and stained with uranyl acetate and lead citrate. Samples were imaged using a transmission electron microscope (TEM; Hitachi, Tokyo, Japan).
2.13. JC-1 Staining
Treated HNEpCs were incubated with 1 µM JC-1 (Thermo Fisher Scientific) working solution for 20 min at 37 °C in the dark and then observed under a fluorescence microscope. Red JC-1 aggregates represent polarized mitochondria, while green monomers indicate depolarized mitochondria. The red/green fluorescence ratio was used to assess mitochondrial integrity.
2.14. Statistical Analysis
All data are expressed as mean ± standard error of the mean (SEM). For comparisons between two groups, either an unpaired two-tailed Student’s t-test or the Mann–Whitney U test was used, depending on data distribution. For comparisons involving more than two groups, one-way ANOVA followed by Bonferroni’s multiple comparisons test, or the Kruskal–Wallis test for non-parametric data, was applied as appropriate. Correlations between variables were assessed using Spearman’s rank correlation coefficient. Statistical analyses and graph generation were performed using GraphPad Prism 10.0 (GraphPad Software, La Jolla, CA, USA). A p value < 0.05 was considered statistically significant.
4. Discussion
While the role of Th2 immune responses and IgE in AR is well established [
3,
43,
44,
45,
46,
47], increasing evidence suggests that the nasal epithelium itself plays an active role in disease pathogenesis [
45,
48]. Disruption of epithelial barrier integrity, through tight-junction breakdown, impaired mucociliary clearance, and increased allergen penetration, has been implicated in AR [
49,
50,
51]. Epithelial oxidative stress and mitochondrial dysfunction also contribute to chronic inflammation and remodeling [
48,
49,
52,
53]. However, how oxidative injury and epithelial stress responses translate into persistent mucosal remodeling remains poorly defined. These gaps hinder understanding of why some patients develop severe or refractory disease despite conventional therapy. Thus, elucidating the upstream epithelial mechanisms that drive remodeling, oxidative stress, and chronic inflammation is critical for identifying novel therapeutic targets. In this study, we identify RhoA/ROCK signaling as a pivotal upstream regulator of epithelial remodeling in AR, acting through oxidative stress and PRKN-dependent cellular senescence. By integrating human clinical samples, genetically modified mouse models, pharmacological inhibition strategies, and primary NEC cultures, we delineate a previously unrecognized molecular pathway linking Th2-type allergic inflammation with epithelial dysfunction. Specifically, we propose a RhoA/ROCK/PRKN-regulated ROS–senescence cascade as a central driver of pathological epithelial remodeling in AR.
Similar to previous findings, we found that the nasal epithelium in AR undergoes marked remodeling characterized by epithelial thickening, goblet cell hyperplasia, and EMT-like changes, accompanied by elevated ROS accumulation and Th2 cytokine expression [
3,
45,
46,
47,
48,
49,
52,
53]. Particularly, these findings reveal that oxidative stress and epithelial structural reprogramming are central, interlinked features of AR pathogenesis, highlighting epithelial dysfunction, not just immune activation, as a critical and previously underappreciated driver of chronic allergic inflammation. Importantly, transcriptomic and protein-level analyses identified RhoA/ROCK signaling as one of the most significantly upregulated genes in AR nasal mucosa, with activation localized primarily to the epithelium and correlating with clinical severity. This observation aligned with prior studies in asthma, where RhoA/ROCK activation has been shown to impair epithelial integrity through cytoskeletal rearrangement, eosinophil accumulation and tight junction destabilization [
8,
9,
10,
54,
55], and provided the first evidence that epithelial RhoA activation is directly linked to allergic inflammation in human AR. The positive correlation between RhoA expression and clinical indices (TNSS, RQLQ) underscored its potential as a biomarker of disease activity.
Genetic and pharmacologic inhibition of RhoA/ROCK signaling revealed its central role in orchestrating epithelial remodeling, oxidative stress, and Th2 inflammation in AR. Epithelial-specific deletion of RhoA or treatment with the ROCK inhibitor Fasudil markedly attenuated nasal inflammation, epithelial thickening, goblet cell hyperplasia, and type 2 cytokine production, underscoring that epithelial RhoA activation is not merely a downstream consequence but an upstream driver of allergic pathology. These results expanded prior and demonstrated its functional involvement in allergic inflammation
in vivo [
8,
15,
54]. Of interest, the reduction in ROS accumulation and restoration of epithelial integrity following RhoA/ROCK inhibition highlight the pathway’s link to epithelial oxidative injury and barrier dysfunction. Importantly, the
in vitro ALI model confirmed that these effects are epithelial-intrinsic, as Fasudil restored TEER values and reversed IL-13–induced ROS and EMT-like changes. Collectively, these findings establish epithelial RhoA/ROCK activation as a key mechanistic node coupling epithelial remodeling and oxidative stress to Th2-driven inflammation, suggesting that targeted inhibition of this pathway could be a viable therapeutic strategy for allergic airway diseases.
One of the striking findings is the increased cellular senescence in AR and closely regulated by RhoA/ROCK signaling. Cellular senescence is increasingly recognized as a pathogenic mechanism in chronic airway diseases, including asthma, pulmonary fibrosis and COPD, but has been largely overlooked in AR [
17,
24,
56,
57]. Senescent epithelial cells exhibit irreversible growth arrest while remaining metabolically active, and secrete SASPs, a broad array of pro-inflammatory and tissue-modifying factors [
58,
59,
60]. Transcriptomic and histological analyses revealed strong enrichment of senescence-associated pathways and accumulation of p16⁺, p21⁺, and γH2AX⁺ epithelial cells in AR nasal mucosa, particularly in patients with high RhoA expression. The positive correlation between RhoA activation and senescence markers, together with elevated SASP cytokines (IL-1β and IL-6), suggests that RhoA-driven epithelial stress contributes to a self-perpetuating inflammatory milieu. Functionally, both
in vivo (
RhoAcKO mice) and
in vitro (ALI-NECs) experiments confirmed that RhoA/ROCK signaling acts as an upstream regulator of allergen- or IL-13–induced epithelial senescence, as genetic deletion or pharmacologic inhibition markedly reduced senescence and SASP induction. These findings identify epithelial RhoA activation as a mechanistic bridge linking oxidative stress to mitochondrial dysfunction and cellular senescence, thereby promoting chronic inflammation and epithelial remodeling in AR. Importantly, they introduce epithelial senescence as a novel pathogenic process, beyond immune activation, that contributes to persistent Th2 inflammation and epithelial remodeling.
We also provided direct evidence that senescent epithelial cells actively contribute to allergic inflammation, oxidative stress, and epithelial remodeling in AR. Especially, we used the transgenic senescence reporter mouse line
p16-3MR and evaluated the role of senescence in AR by removing senescent cells using GCV [
61]. We found that selective ablation of senescent cells markedly reduced epithelial thickening, goblet cell hyperplasia, oxidative injury, and Th2 cytokine production following allergen challenge. These results confirm that senescent cells are not passive bystanders but active mediators of chronic inflammation through persistent secretion of SASP factors such as IL-1β and IL-6, which amplify local immune responses and epithelial remodeling [
23,
42,
62,
63]. The observed restoration of epithelial integrity and barrier function after senescent cell clearance underscores the pathogenic role of senescent epithelial populations in sustaining allergic pathology. Together, these findings identify epithelial senescence as a mechanistic driver of epithelial remodeling and Th2 inflammation.
Mechanistically, our transcriptomic and mechanistic analyses identify PRKN as a previously unrecognized node connecting RhoA signaling to epithelial senescence. PRKN is a mitochondrial E3 ubiquitin ligase that facilitates mitophagy and maintains mitochondrial quality control [
56,
64]. Although extensively studied in neurodegenerative and age-related contexts [
65,
66,
67,
68], the role of PRKN in airway epithelial biology has yet to be fully elucidated. We found that PRKN was markedly downregulated in AR nasal mucosa and inversely correlated with RhoA expression. Overexpression of PRKN preserved mitochondrial structure and membrane potential while reducing both total and mitochondrial ROS accumulation, highlighting its role in maintaining mitochondrial quality control through mitophagy. Functionally, PRKN restoration markedly reduced SA-β-Gal activity and expression of p16, p21, and γH2AX, confirming its ability to suppress cytokine-induced senescence. These findings provide direct mechanistic evidence that loss of PRKN contributes to RhoA-driven epithelial senescence in AR and that restoring PRKN activity can reverse mitochondrial and oxidative damage. Collectively, this identifies mitochondrial dysfunction as a pivotal link between epithelial stress and cellular senescence, suggesting that targeting the RhoA-PRKN axis or enhancing mitophagy may offer new therapeutic avenues for allergic airway disease. In addition to PRKN, our transcriptomic analyses identified several ROS–related genes differentially regulated in high-RhoA AR mucosa. Notably, ACE2, a modulator of epithelial oxidative injury and inflammation [
69]; FYN, a redox-sensitive tyrosine kinase involved in ROS signaling [
70]; and ITGB2, an integrin linked to immune activation and oxidative stress responses [
71], may represent additional candidates linking RhoA signaling to epithelial dysfunction. Future studies should explore the functional relevance of those novel targets of RhoA in allergic airway disease.
Several limitations should be acknowledged. Although epithelial-specific RhoA deletion demonstrates causality, the contribution of RhoA signaling in other structural and immune cells remains to be investigated. The modest sample size in human transcriptomic analyses may limit statistical power, and the correlation between RhoA and senescence markers warrants confirmation in larger and more diverse cohorts. Moreover, pharmacologic inhibition with fasudil, while supportive, may exert off-target effects. Finally, this study focused primarily on Th2-mediated inflammation; future work should examine whether RhoA-driven senescence also influences non–Th2 inflammatory pathways and steroid responsiveness. Looking forward, future studies should explore how RhoA/ROCK signaling transcriptionally represses PRKN and whether epigenetic or post-translational mechanisms are involved. Integration of single-cell and spatial transcriptomic approaches will help delineate epithelial subpopulations prone to senescence and their spatial relationship to immune infiltrates. Translationally, preclinical evaluation of ROCK inhibitors or mitophagy-enhancing agents may offer new therapeutic strategies for patients with refractory or steroid-insensitive AR.
In summary, this work establishes a mechanistic framework in which RhoA/ROCK-driven epithelial senescence links oxidative stress to Th2 inflammation and tissue remodeling in AR and identifies PRKN as a novel mitochondrial checkpoint with therapeutic potential to restore epithelial homeostasis and attenuate chronic allergic inflammation.
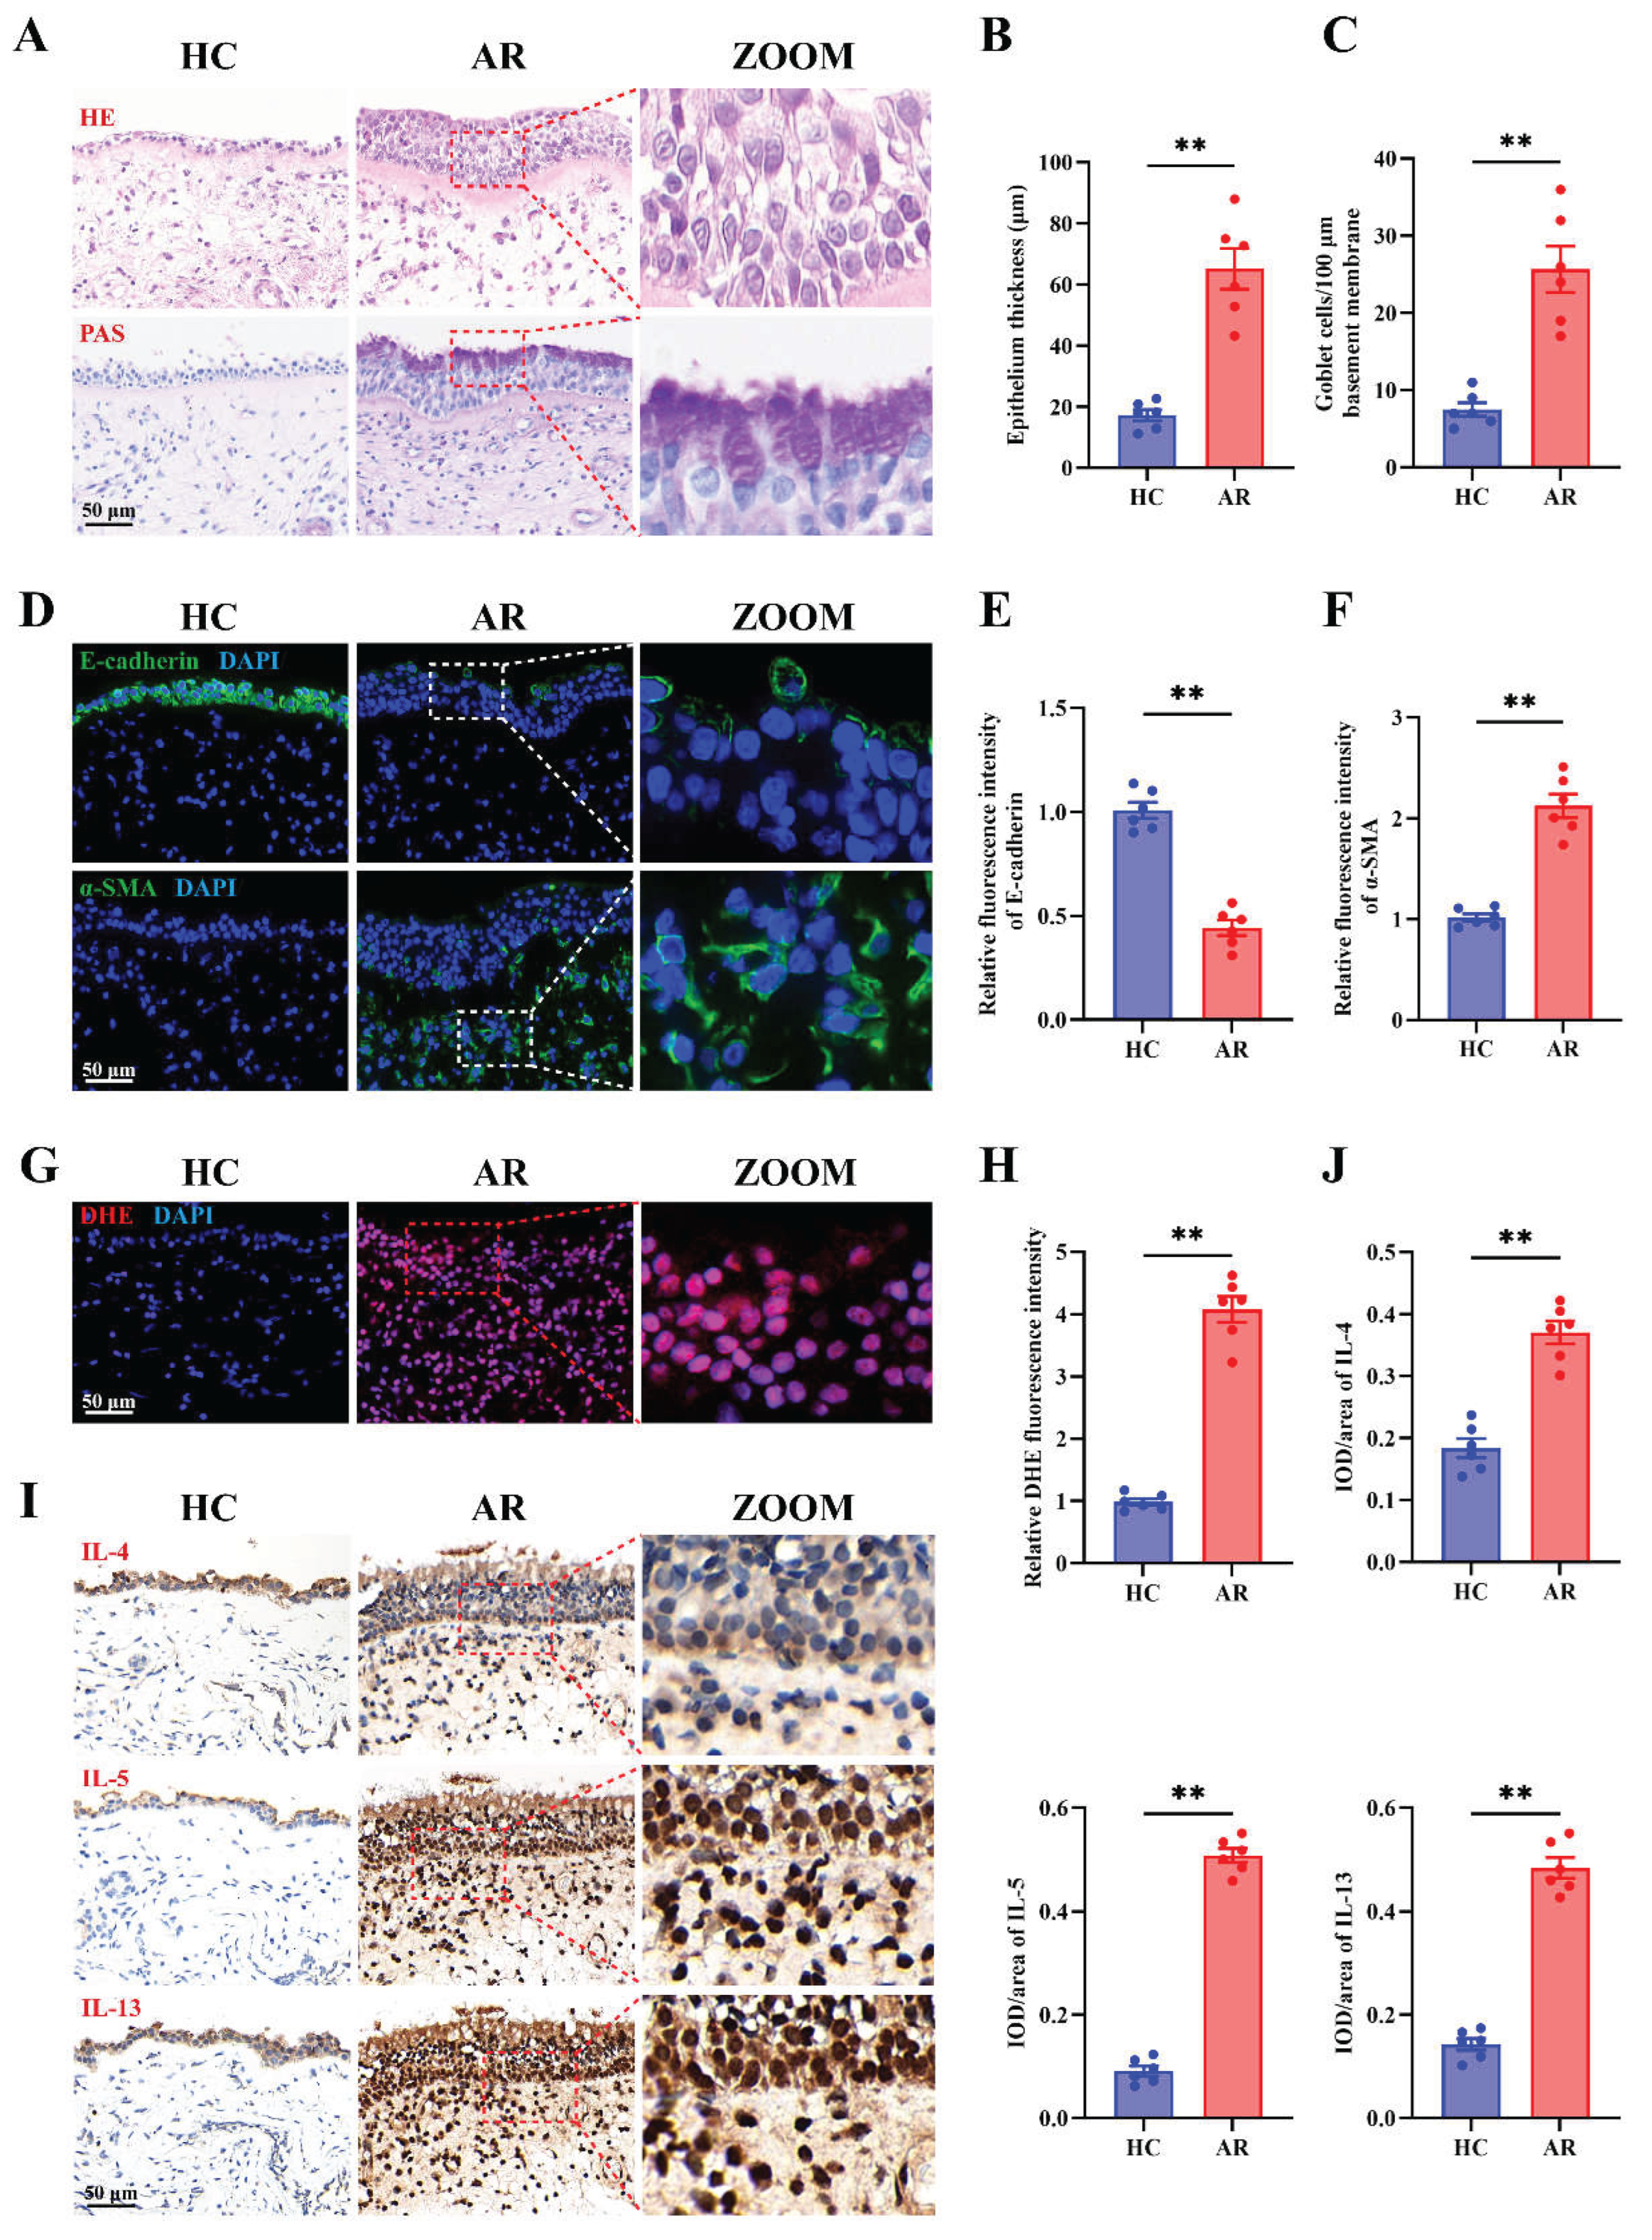
Figure 1.
Epithelial remodeling, oxidative stress, and Th2 inflammation are prominent features in AR nasal mucosa. (A) Representative images of H&E and PAS staining in HC and AR nasal mucosa. (B-C) Quantification of epithelial thickness (B) and goblet cell density (C). (D-F) Representative images (D) and quantification (E-F) of immunofluorescence staining of E-cadherin and α-SMA expression in HC and AR nasal mucosa. (G-H) Representative images (G) and quantification (H) of DHE staining in HC and AR nasal mucosa. (I-J) Representative images (I) and quantification (J) of immunohistochemistry staining of IL-4, IL-5, and IL-13 in HC and AR nasal mucosa. n=6. Data are presented as mean ± SEM. **P < 0.01.
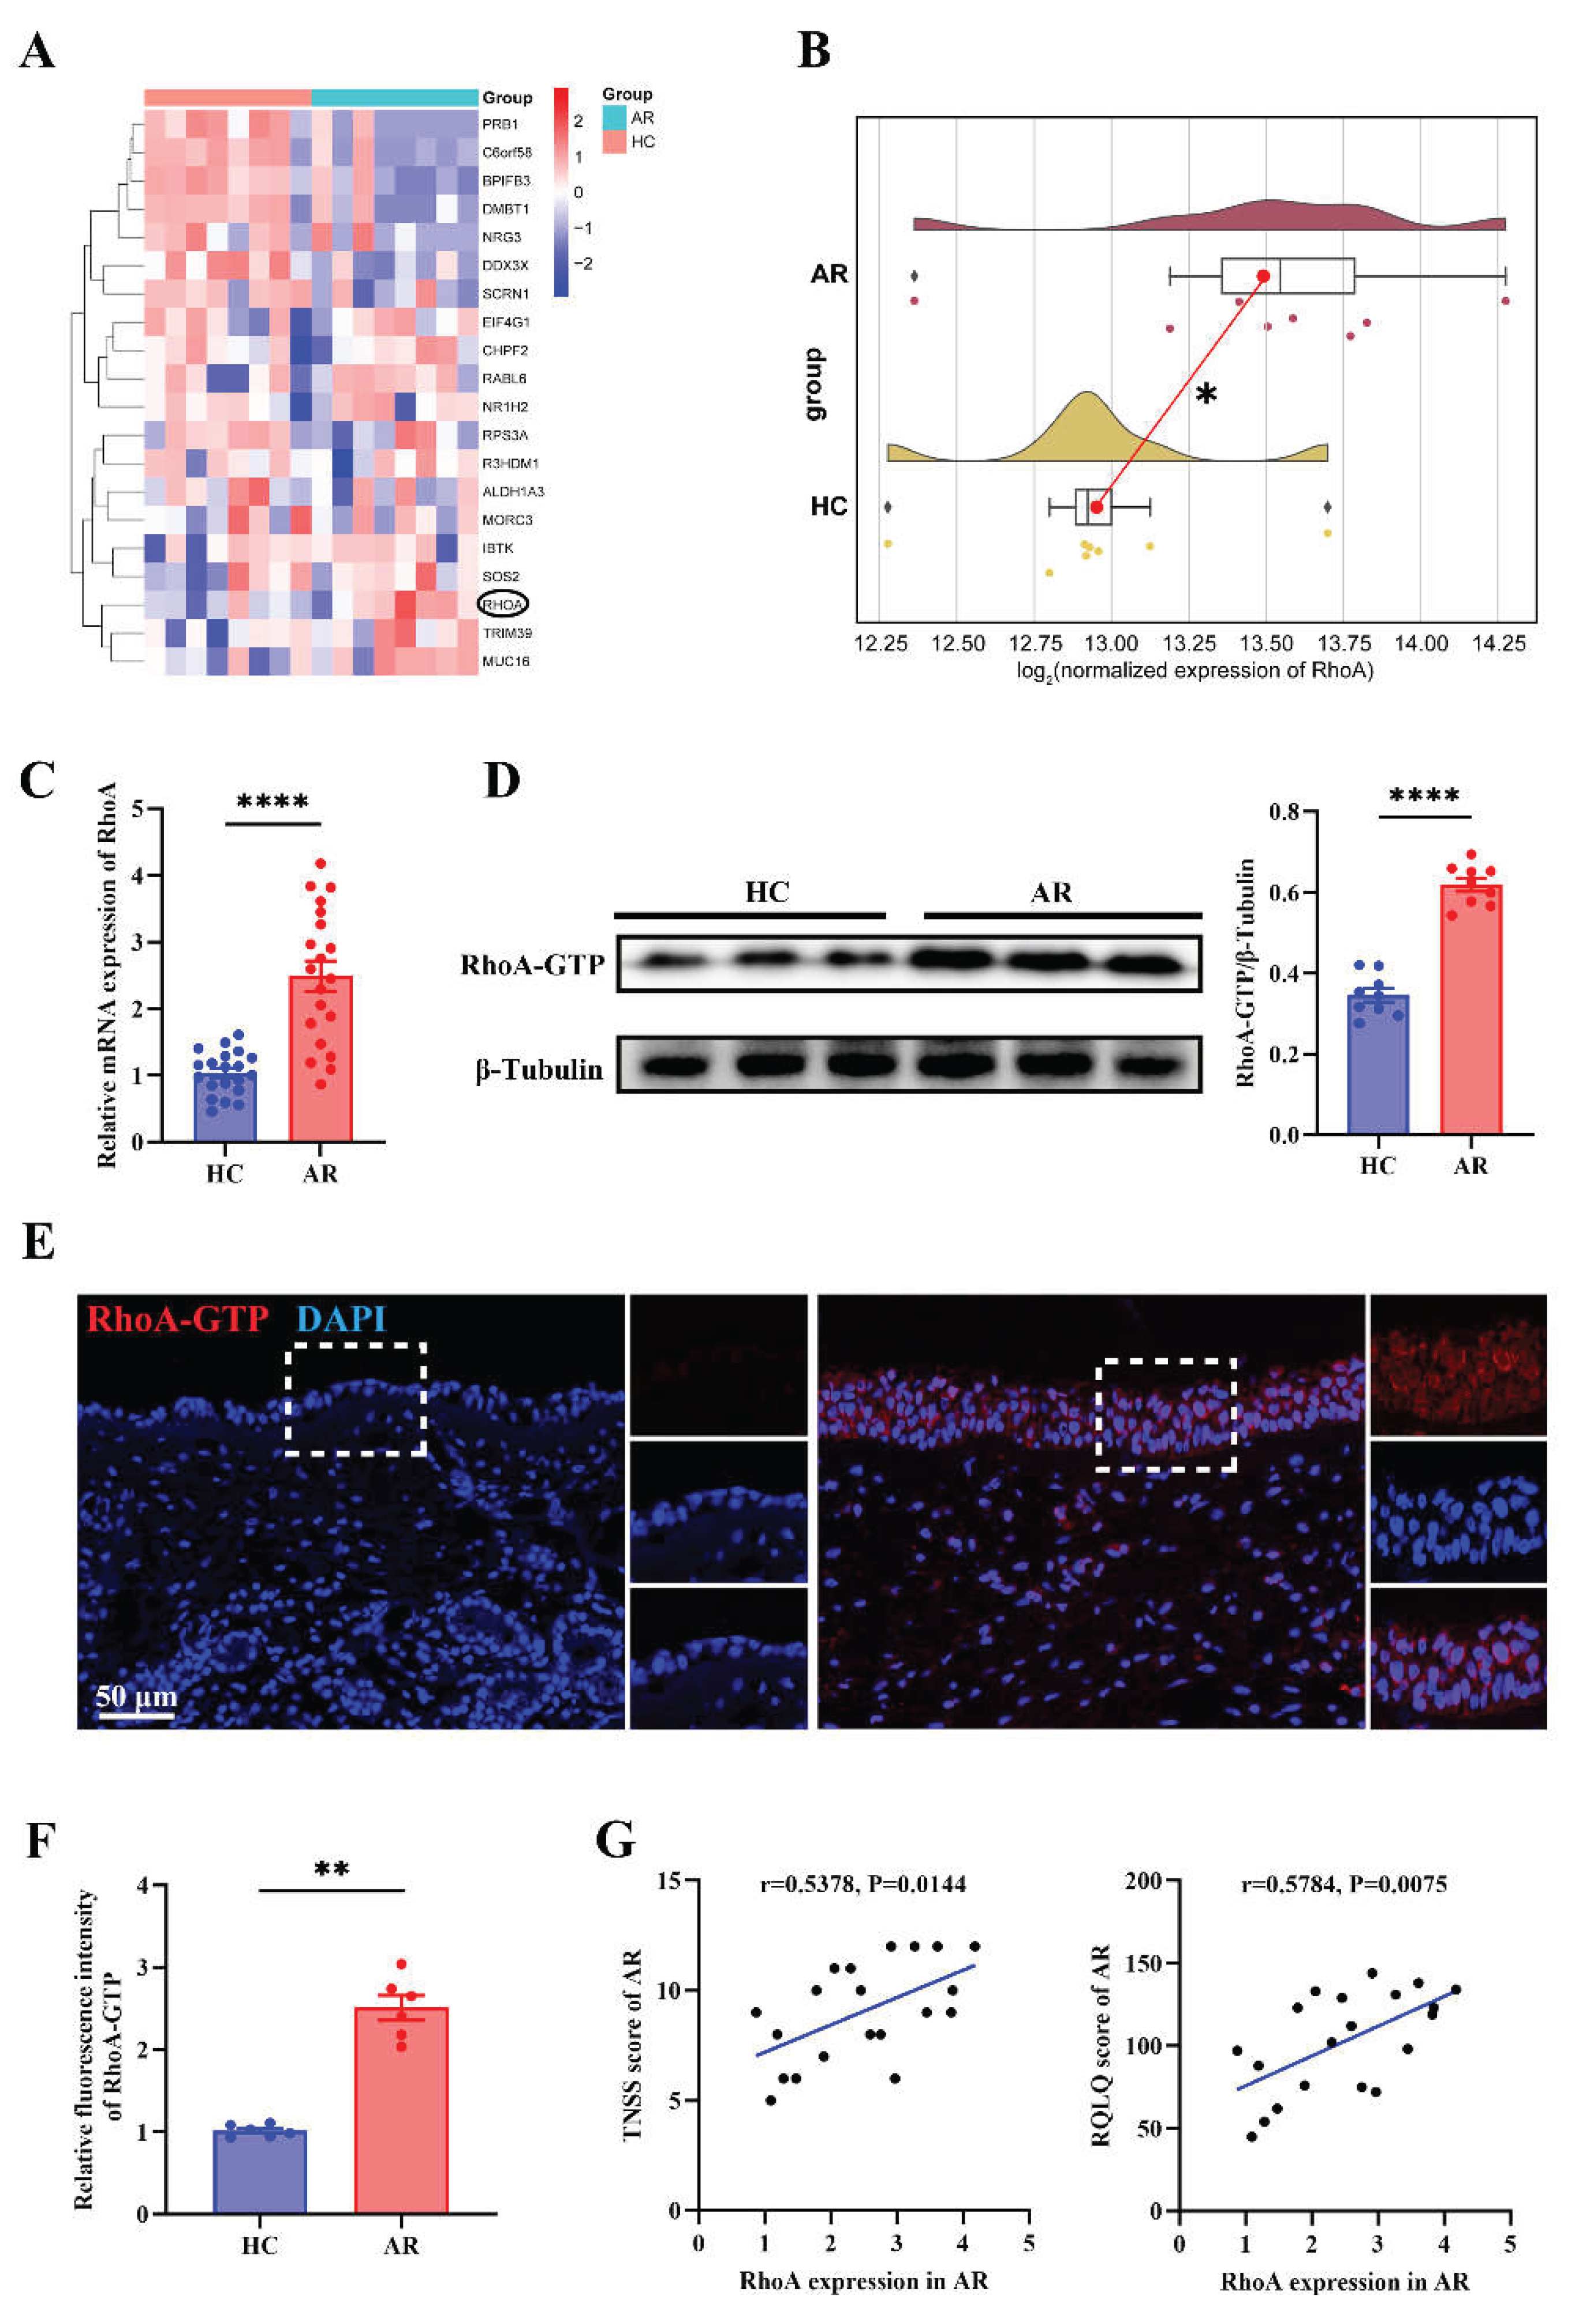
Figure 2.
Up-regulated RhoA in AR nasal mucosa and correlates with disease severity. (A) Heatmap of differentially expressed genes from nasal mucosa RNA-sequencing of matched AR patients and HCs (n=8). (B) Raincloud plots with density overlay of RhoA expression. (C) qRT-PCR analysis of RhoA mRNA expression in HC and AR nasal mucosa (n=20). (D) Representative Western blot and quantification of RhoA-GTP protein levels in HC and AR groups (n=9). (E-F) Representative images (E) and quantification (F) of immunofluorescence staining of RhoA-GTP expression in nasal mucosa (n=6). (G) Correlation analysis between RhoA mRNA levels and TNSS and RQLQ in AR patients (n=20). Data are presented as mean ± SEM. **P < 0.01; ****P < 0.0001.
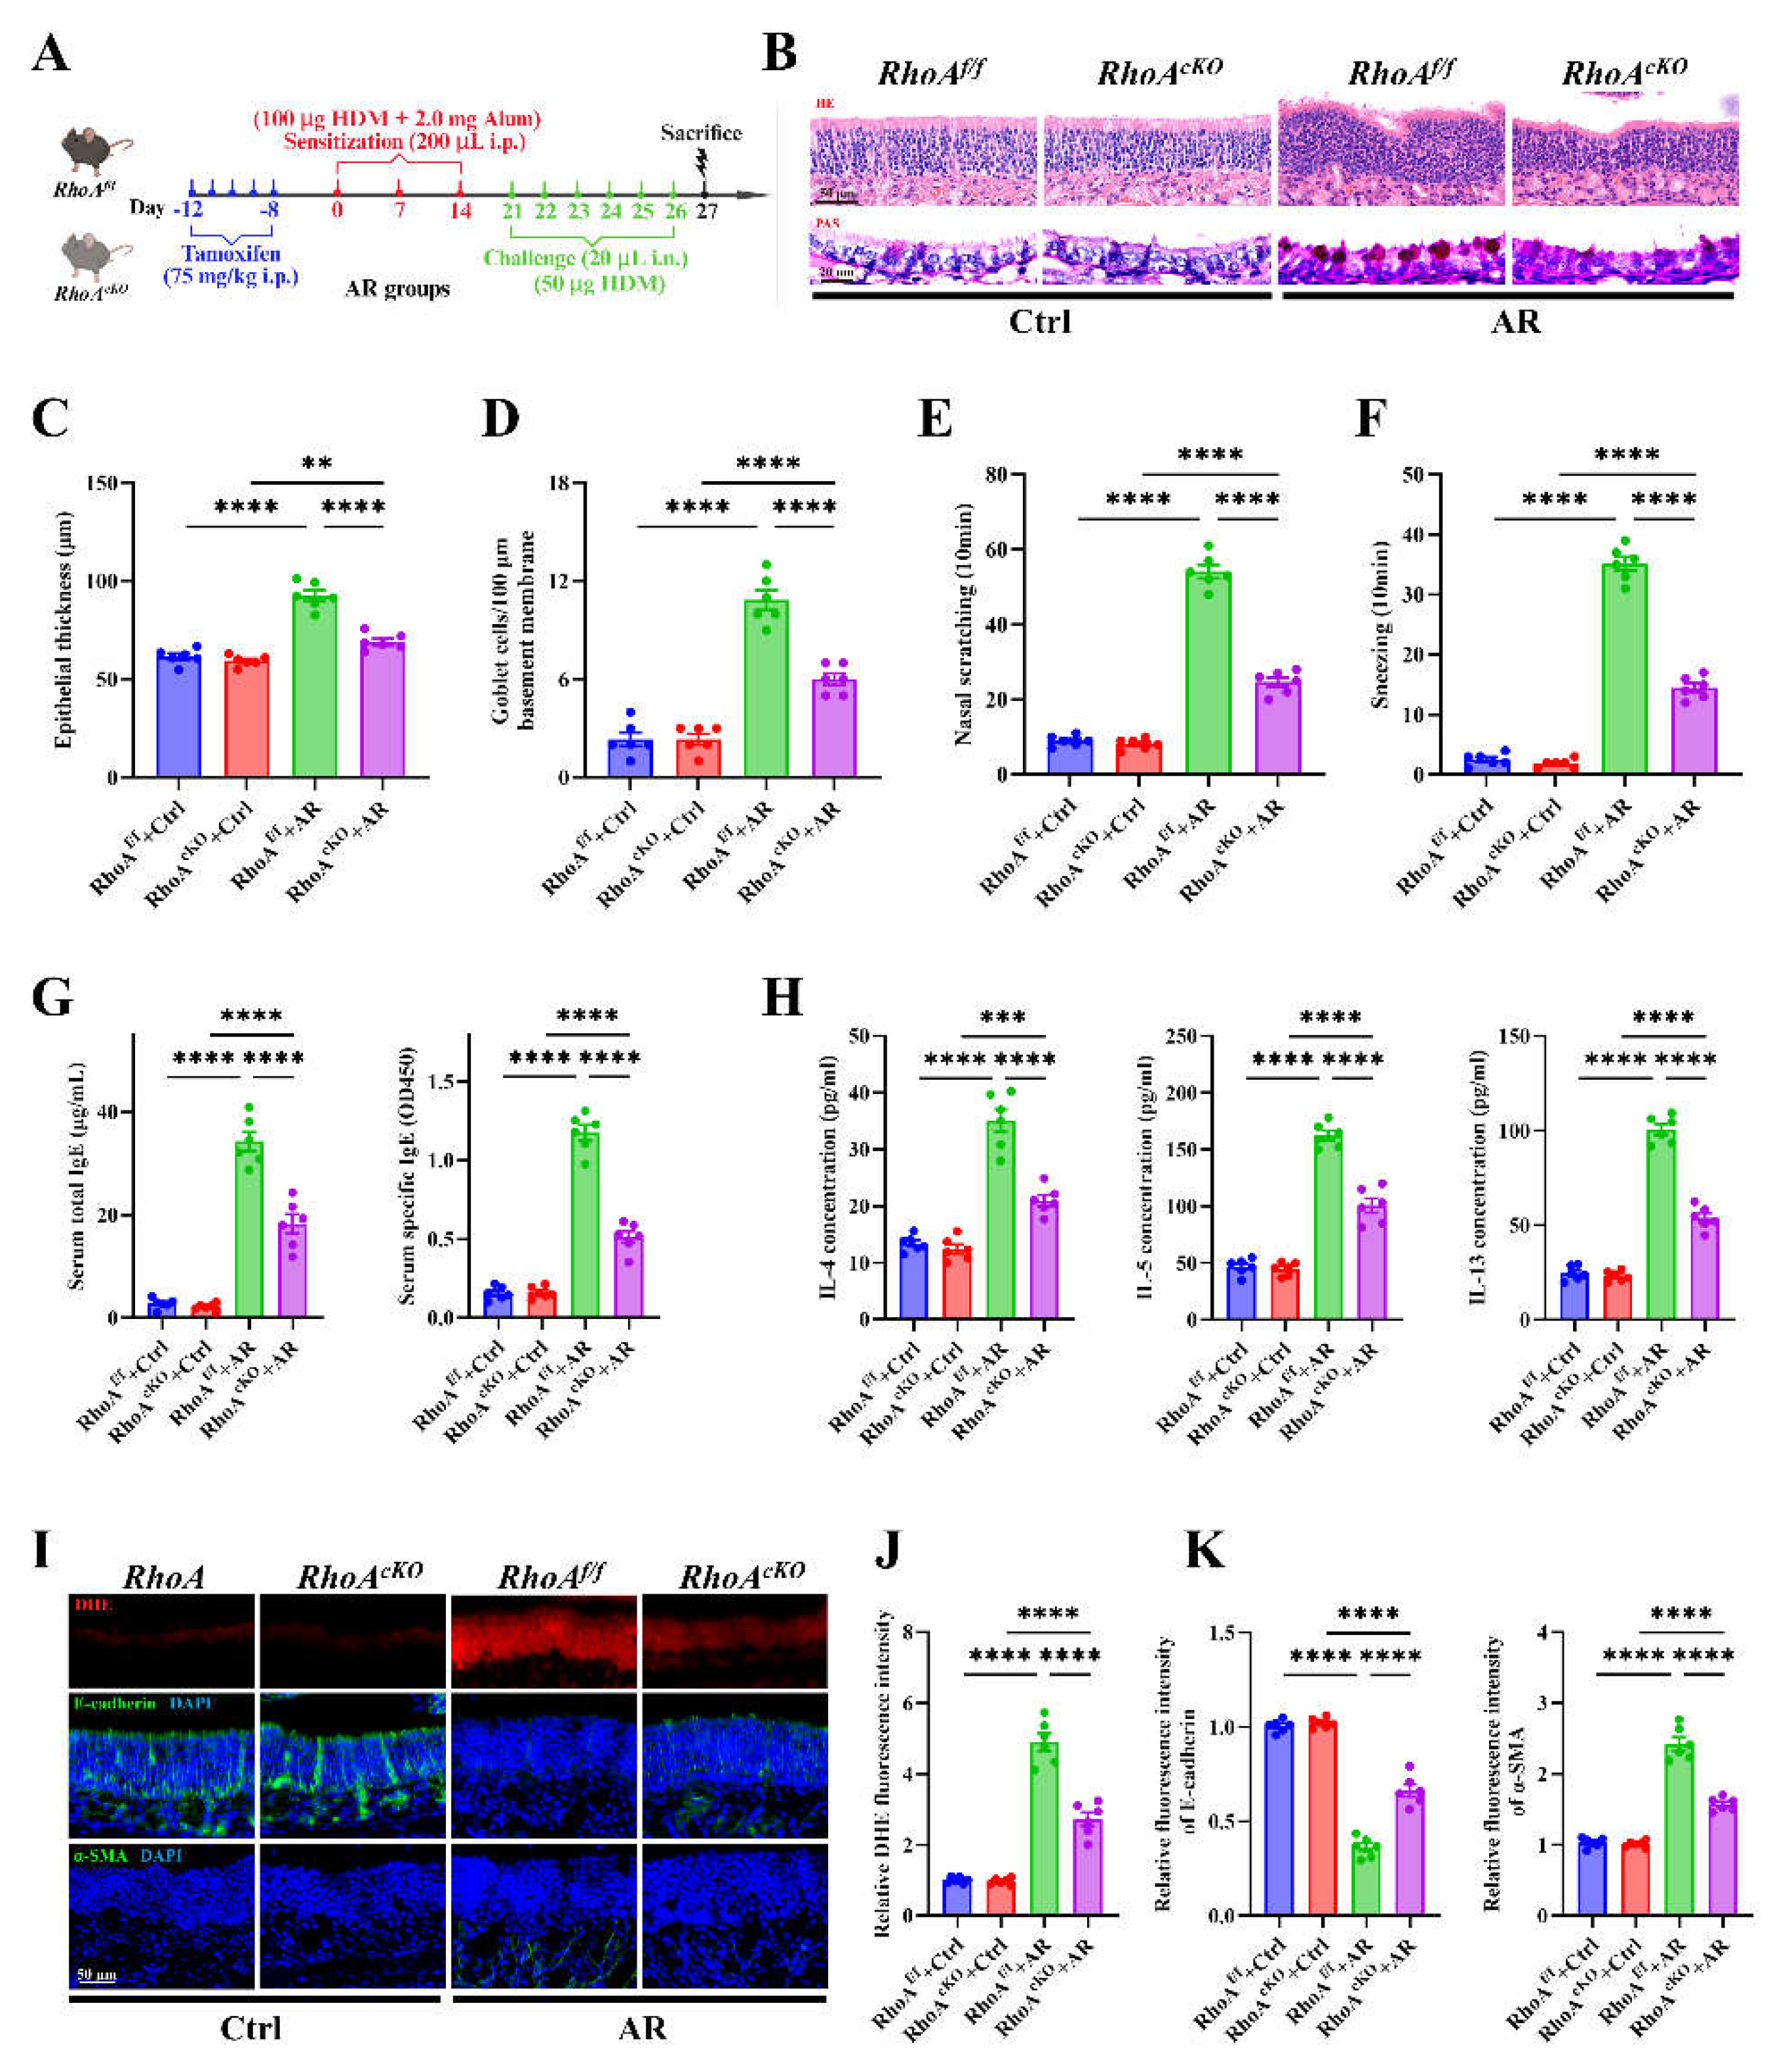
Figure 3.
RhoA/ROCK signaling deficiency attenuates nasal Th2 inflammation, oxidative stress, and epithelial remodeling in AR. (A) Schematic of HDM-induced AR protocol using tamoxifen-inducible RhoA conditional knockout (RhoAcKO) and RhoA flf control mice. (B) Representative images of H&E and PAS staining in nasal mucosa. (C-D) Quantification of epithelial thickness (C) and goblet cell density (D). (E-F) Quantification of nasal scratching (E) and sneezing frequencies (F). (G) ELISA quantification of serum total and HDM-specific IgE concentrations. (H) ELISA quantification of IL-4, IL-5, and IL-13 levels in nasal lavage fluid. (I) Representative images of DHE staining and immunofluorescence staining of E-cadherin and α-SMA expression in nasal mucosa. (J-K) Quantification of DHE (J), E-cadherin and α-SMA (K) fluorescence intensity. n=6. Data are presented as mean ± SEM. ****P < 0.0001.
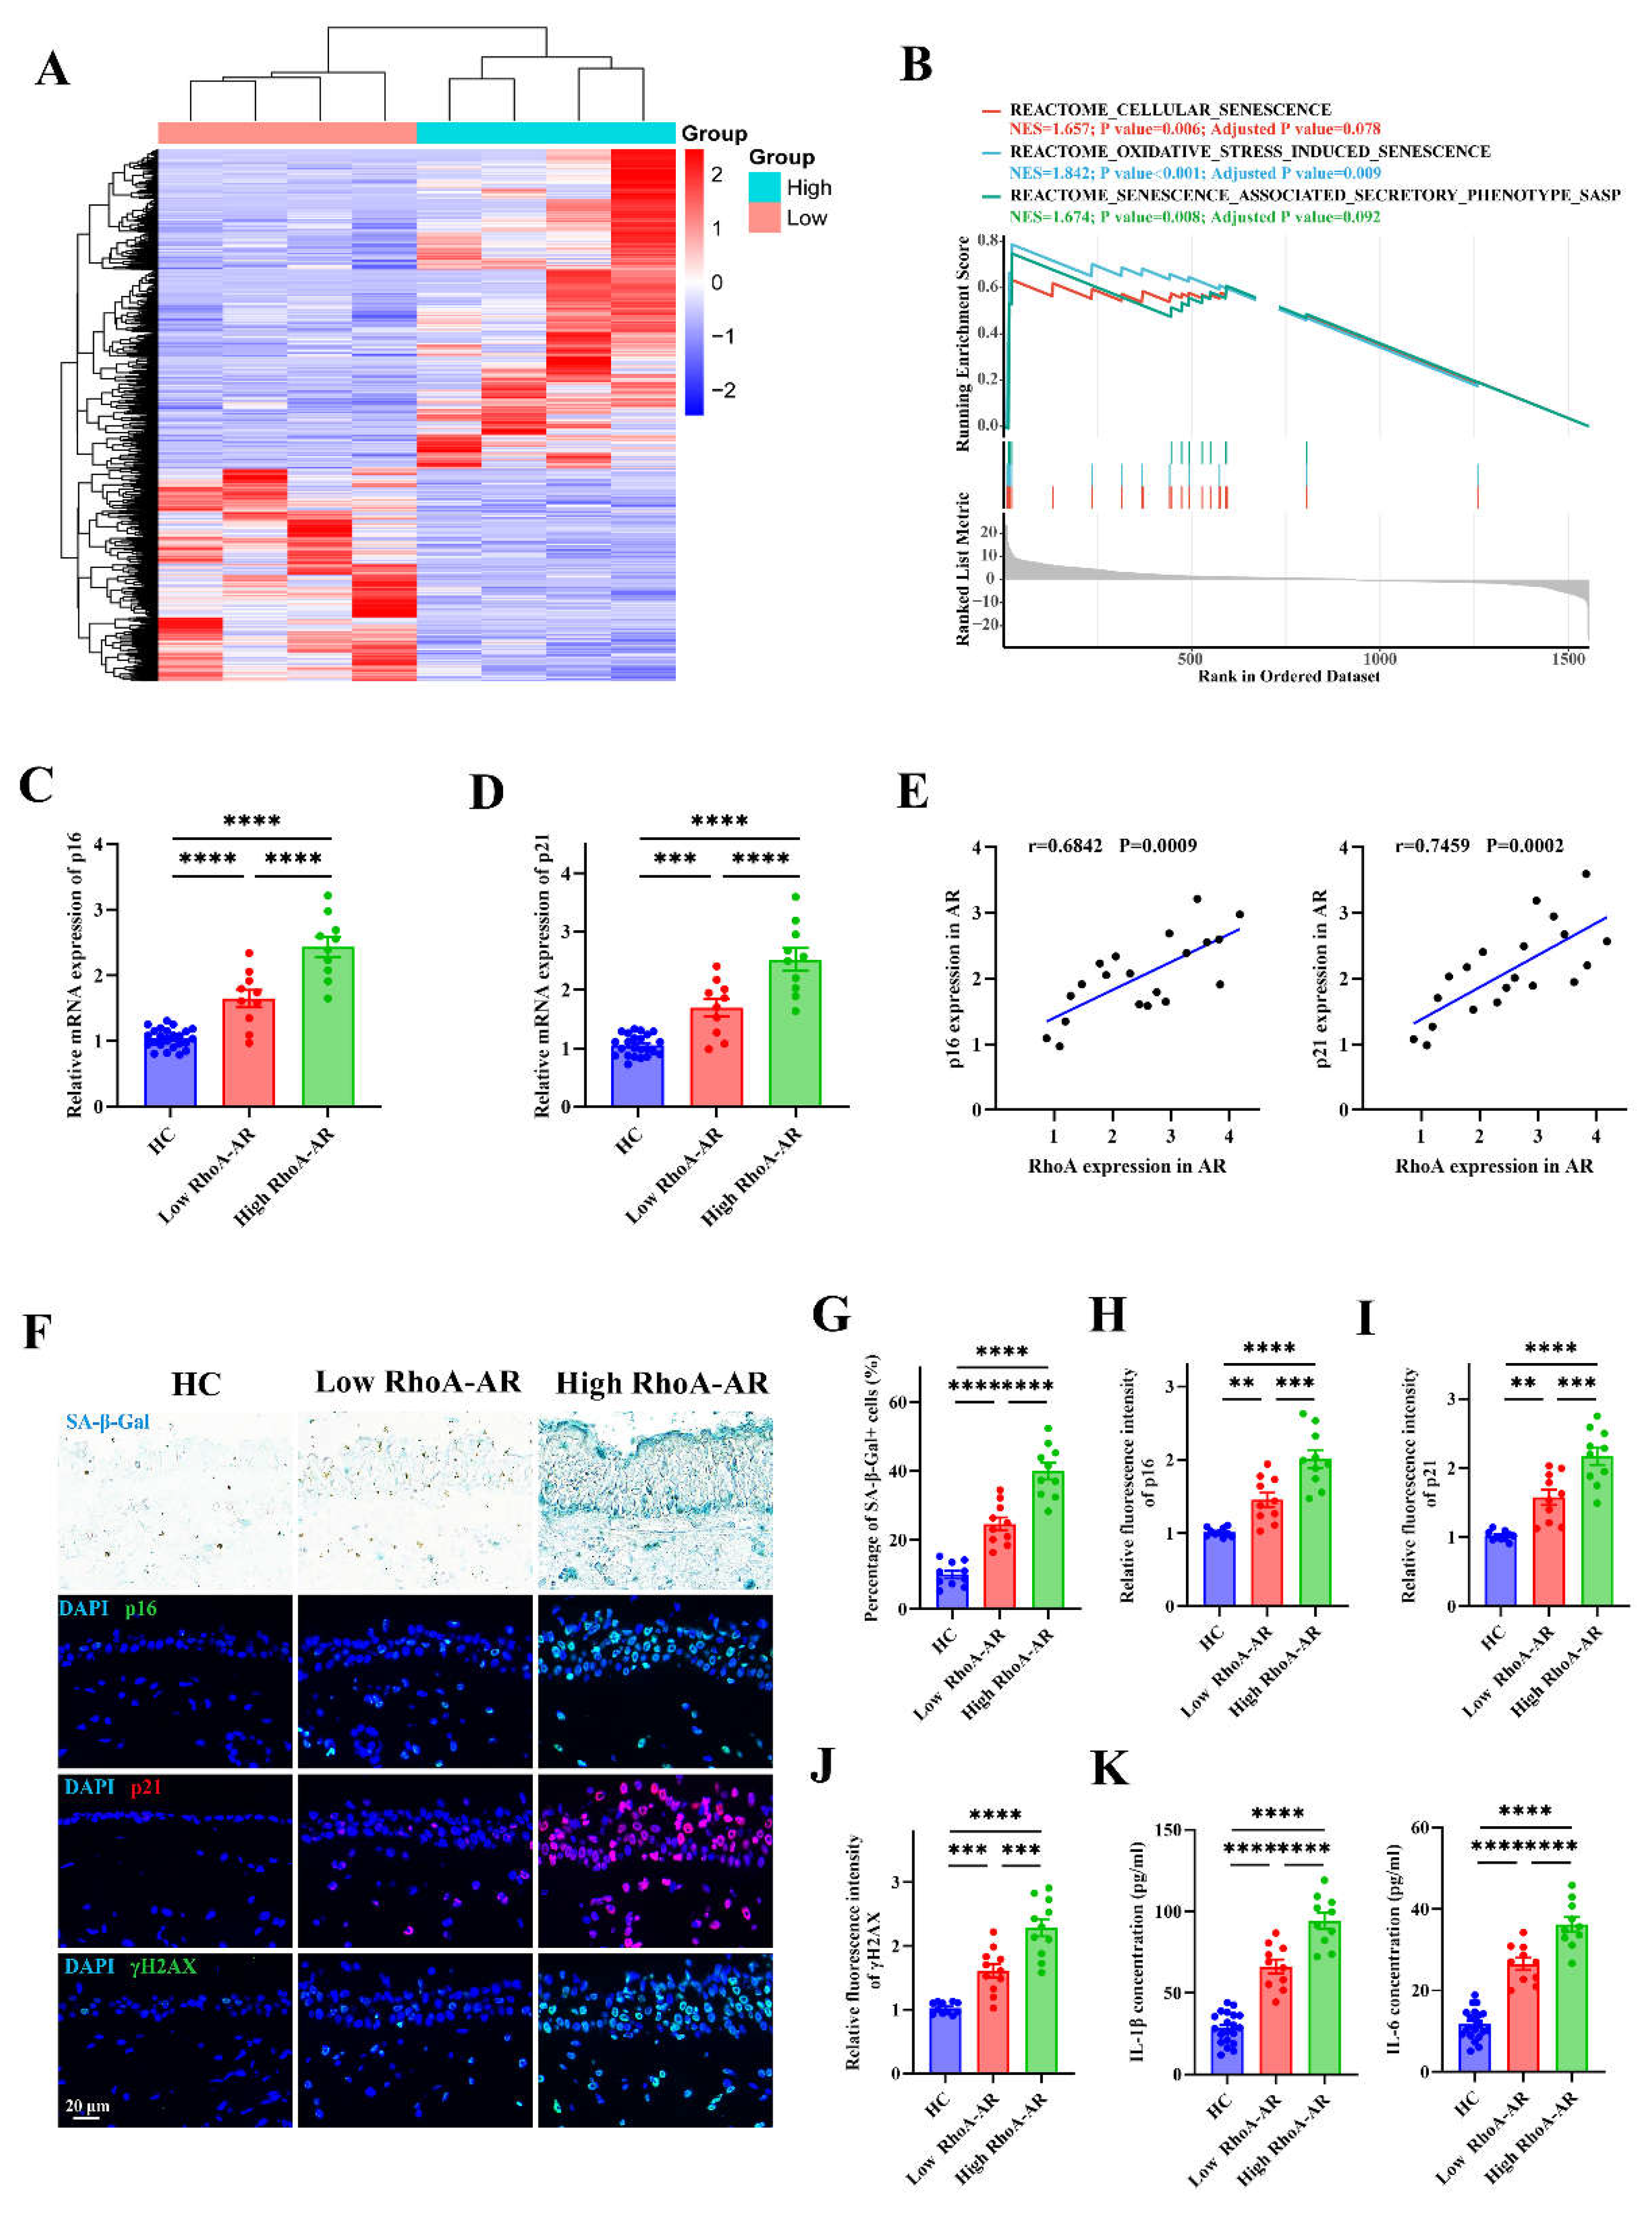
Figure 4.
Elevated RhoA activation contributes to epithelial senescence in AR patients. (A) Heatmap of differentially expressed genes from RNA-sequencing of AR nasal mucosa grouped by high and low RhoA expression (n=4). (B) GSEA enrichment plots of senescence-related pathways in high-RhoA AR samples. (C-D) qRT-PCR analysis of p16 (C) and p21 (D) mRNA levels in HC (n=20), low-RhoA AR (n=10), and high-RhoA AR (n=10) nasal mucosa. (E) Correlation analysis between RhoA mRNA expression and p16 or p21 levels in AR patients (n=20). (F) Representative images of SA-β-Gal staining and immunofluorescence staining of p16, p21, and γH2AX in nasal mucosa from HC, low-RhoA AR, and high-RhoA AR. (G–J) Quantification of SA-β-Gal–positive cell percentage (G) and fluorescence intensity of p16 (H), p21 (I), and γH2AX (J). (K) ELISA quantification of IL-1β and IL-6 levels in nasal lavage fluid of AR patients and HCs. Data are presented as mean ± SEM. **P < 0.01; ***P < 0.001; ****P < 0.0001.
Figure 5.
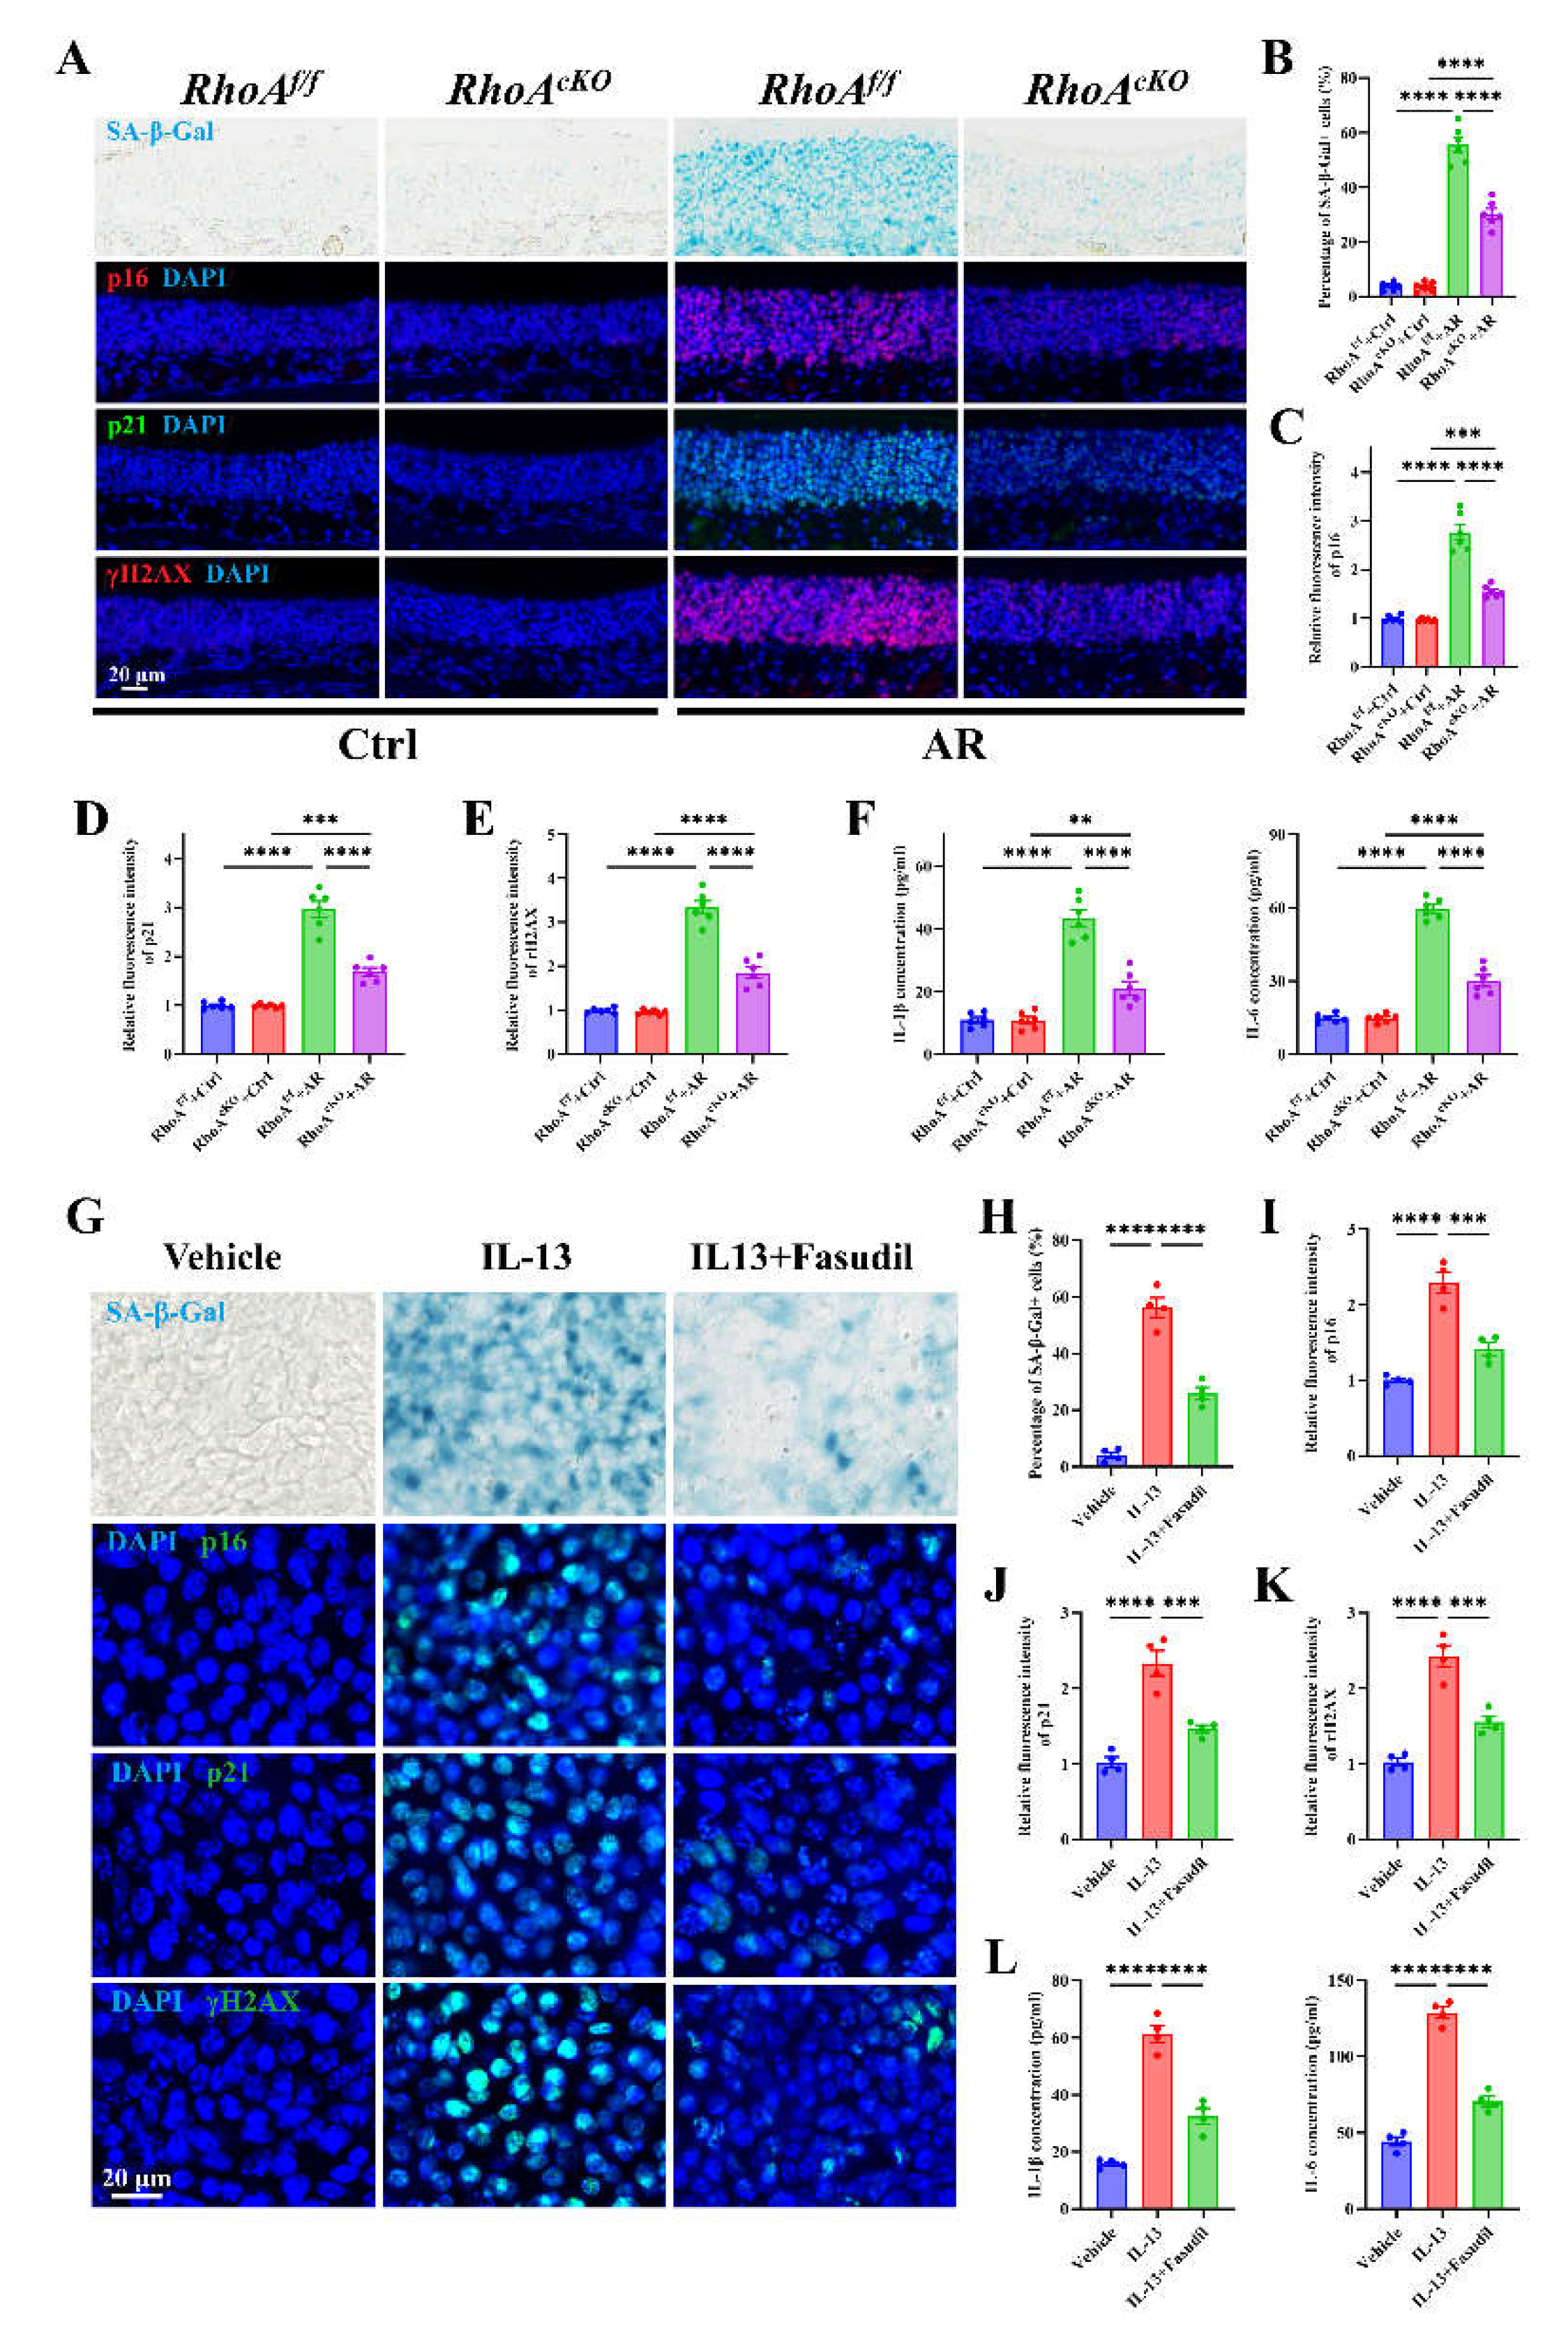
Epithelial RhoA activation regulates allergen or Th2 cytokine-induced cellular senescence in both in vitro and in vivo analyses. (A) Representative images of SA-β-Gal staining and immunofluorescence staining of p16, p21, and γH2AX in nasal mucosa. (B) Quantification of SA-β-Gal–positive cells in nasal mucosa. (C-E) Quantification of fluorescence intensity of p16 (C), p21 (D), and γH2AX (E). (F) ELISA quantification of IL-1β and IL-6 levels in nasal lavage fluid. n=6. (G) Representative images of SA-β-Gal staining and immunofluorescence staining of p16, p21, and γH2AX in ALI-NECs. (H) Quantification of SA-β-Gal–positive cells. (I-K) Quantification of fluorescence intensity of p16 (I), p21 (J), and γH2AX (K). (L) ELISA quantification of IL-1β and IL-6 levels in culture supernatants. n=4. Data are presented as mean ± SEM. **P < 0.01; ***P < 0.001; ****P < 0.0001.
Figure 5.
Epithelial RhoA activation regulates allergen or Th2 cytokine-induced cellular senescence in both in vitro and in vivo analyses. (A) Representative images of SA-β-Gal staining and immunofluorescence staining of p16, p21, and γH2AX in nasal mucosa. (B) Quantification of SA-β-Gal–positive cells in nasal mucosa. (C-E) Quantification of fluorescence intensity of p16 (C), p21 (D), and γH2AX (E). (F) ELISA quantification of IL-1β and IL-6 levels in nasal lavage fluid. n=6. (G) Representative images of SA-β-Gal staining and immunofluorescence staining of p16, p21, and γH2AX in ALI-NECs. (H) Quantification of SA-β-Gal–positive cells. (I-K) Quantification of fluorescence intensity of p16 (I), p21 (J), and γH2AX (K). (L) ELISA quantification of IL-1β and IL-6 levels in culture supernatants. n=4. Data are presented as mean ± SEM. **P < 0.01; ***P < 0.001; ****P < 0.0001.
Figure 6.
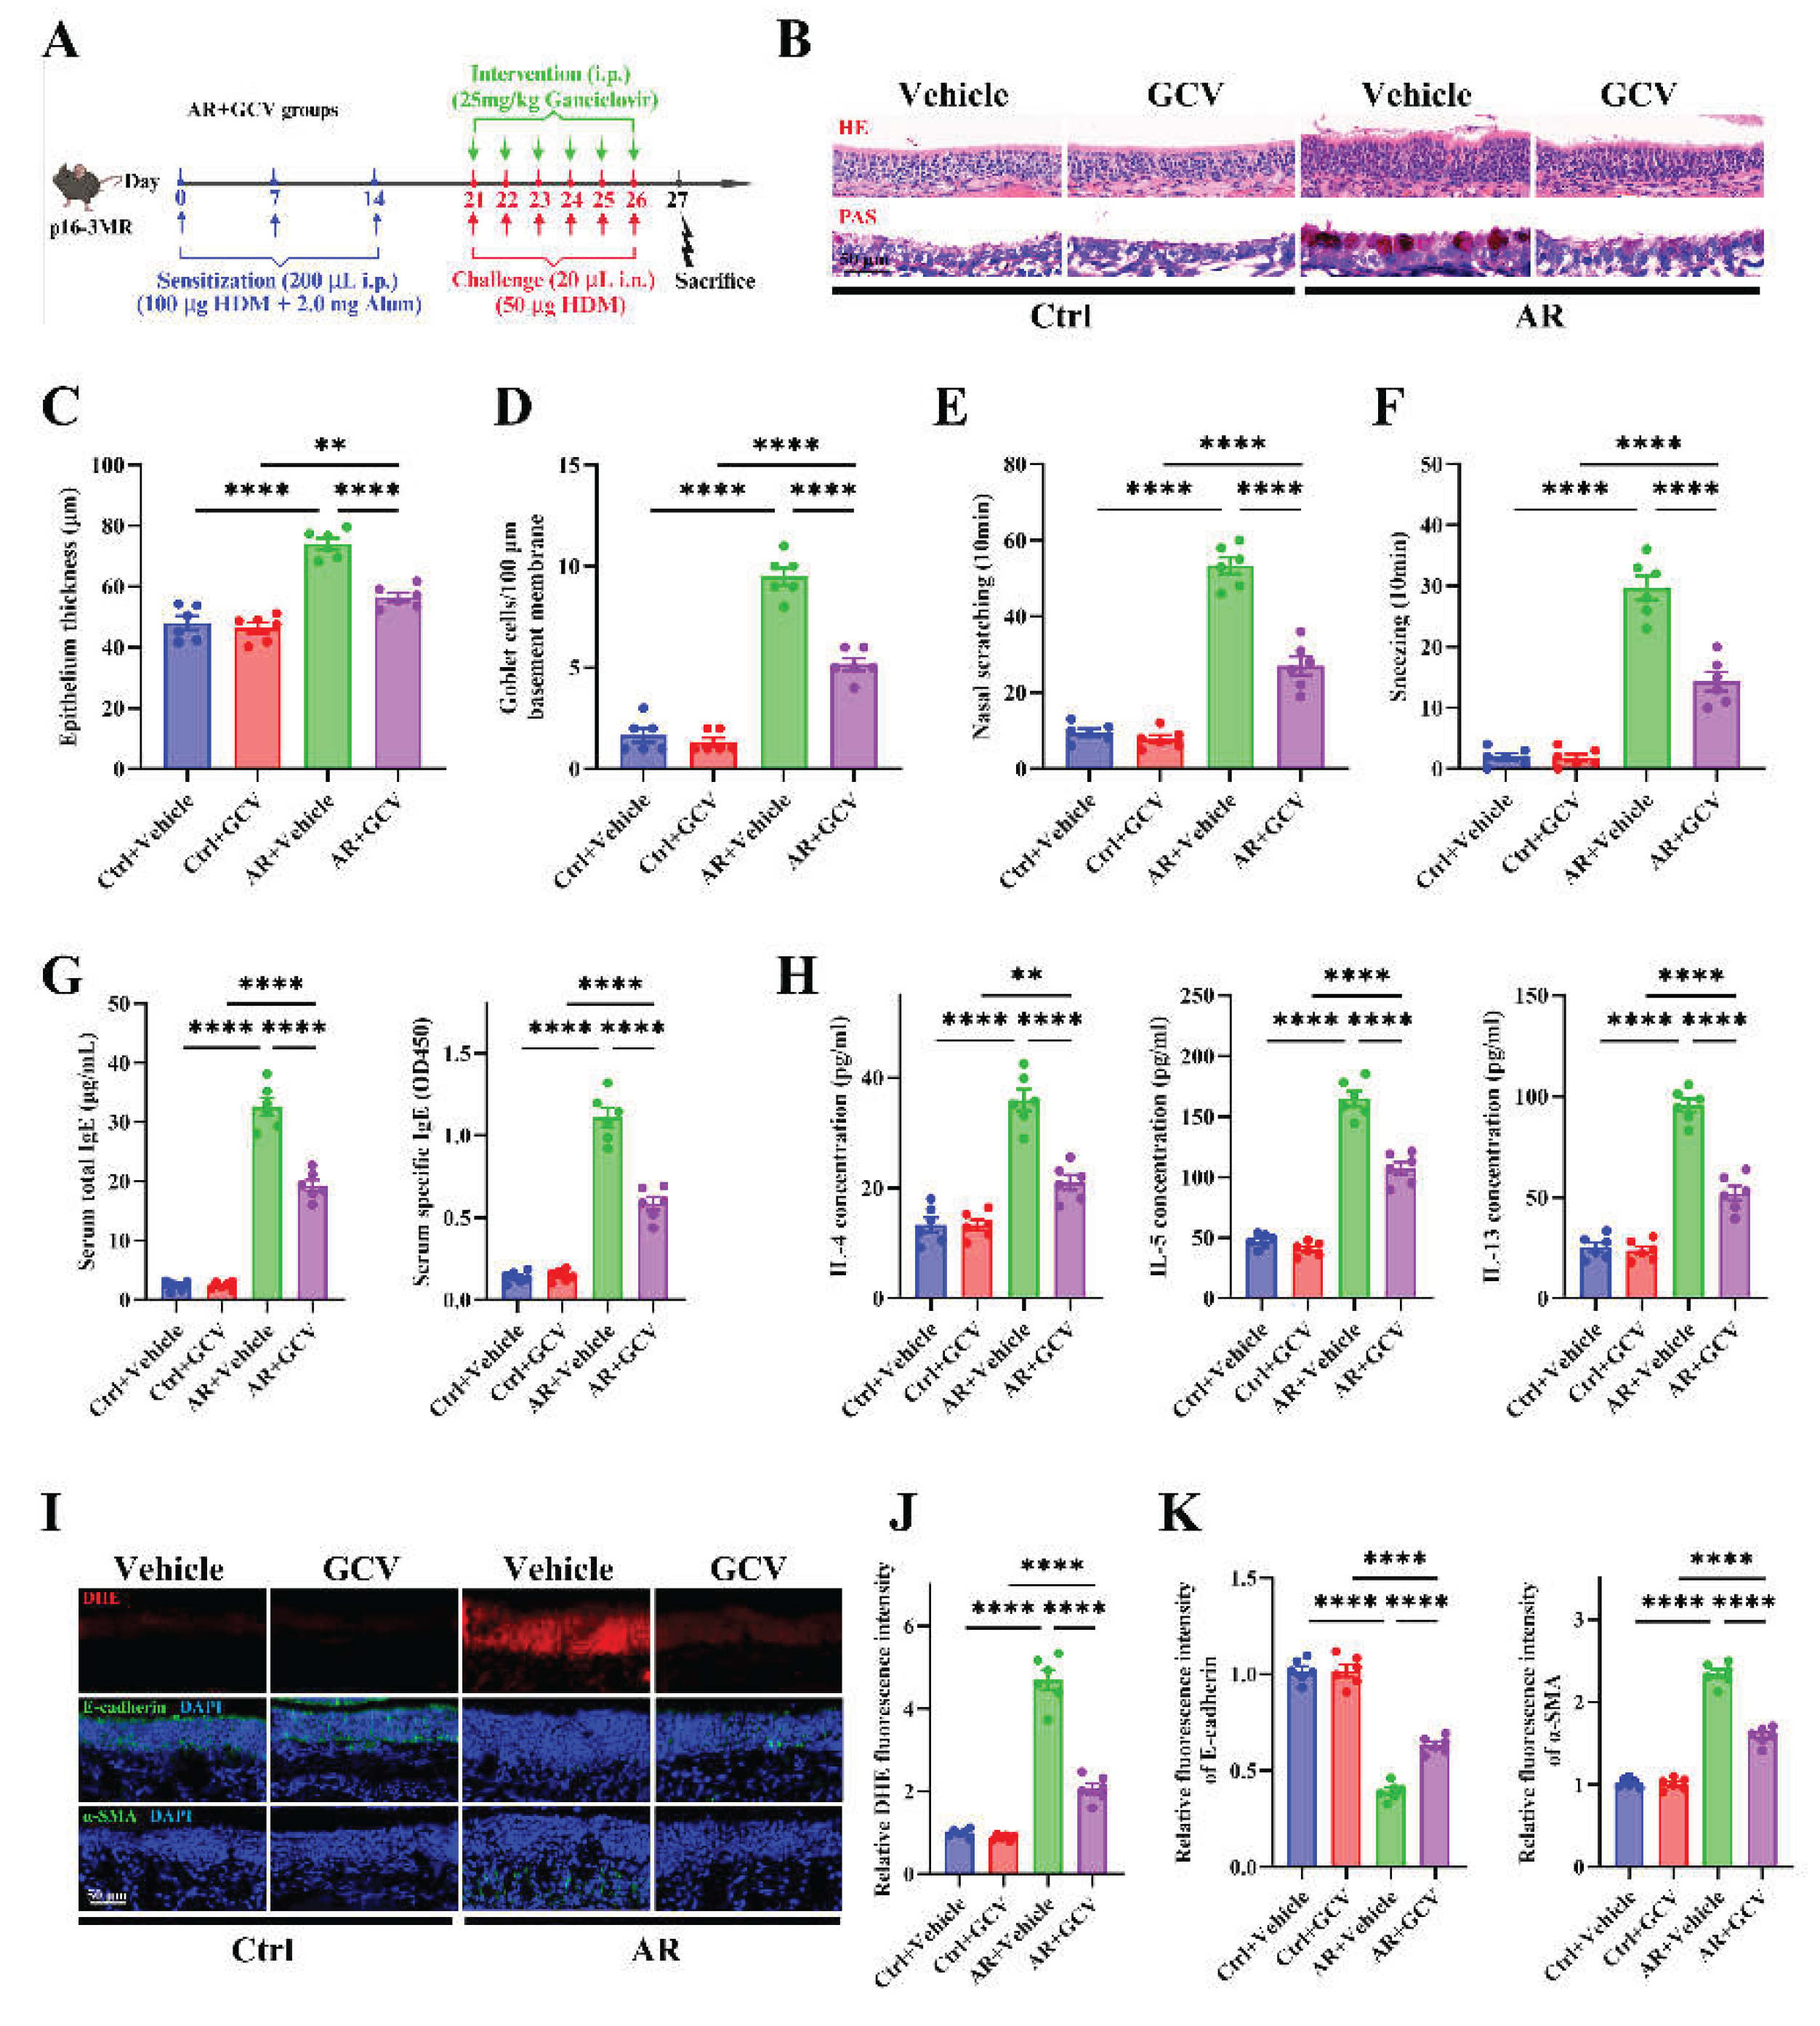
Genetic elimination of senescent cells alleviates allergic inflammation, oxidative stress, and epithelial remodeling. (A) Schematic of AR induction and GCV intervention protocol in p16-3MR transgenic mice. (B) Representative images of H&E and PAS staining in nasal mucosa. (C-D) Quantification of epithelial thickness (C) and goblet cell density (D). (E-F) Quantification of nasal scratching (E) and sneezing frequencies (F). (G) ELISA quantification of serum total and HDM-specific IgE concentrations. (H) ELISA quantification of IL-4, IL-5, and IL-13 levels in nasal lavage fluid. (I) Representative images of DHE staining and immunofluorescence staining of E-cadherin and α-SMA expression in nasal mucosa. (J-K) Quantification of DHE (J), E-cadherin and α-SMA (K) fluorescence intensity. n=6. Data are presented as mean ± SEM. **P < 0.01; ***P < 0.001; ****P < 0.0001.
Figure 6.
Genetic elimination of senescent cells alleviates allergic inflammation, oxidative stress, and epithelial remodeling. (A) Schematic of AR induction and GCV intervention protocol in p16-3MR transgenic mice. (B) Representative images of H&E and PAS staining in nasal mucosa. (C-D) Quantification of epithelial thickness (C) and goblet cell density (D). (E-F) Quantification of nasal scratching (E) and sneezing frequencies (F). (G) ELISA quantification of serum total and HDM-specific IgE concentrations. (H) ELISA quantification of IL-4, IL-5, and IL-13 levels in nasal lavage fluid. (I) Representative images of DHE staining and immunofluorescence staining of E-cadherin and α-SMA expression in nasal mucosa. (J-K) Quantification of DHE (J), E-cadherin and α-SMA (K) fluorescence intensity. n=6. Data are presented as mean ± SEM. **P < 0.01; ***P < 0.001; ****P < 0.0001.
Figure 7.
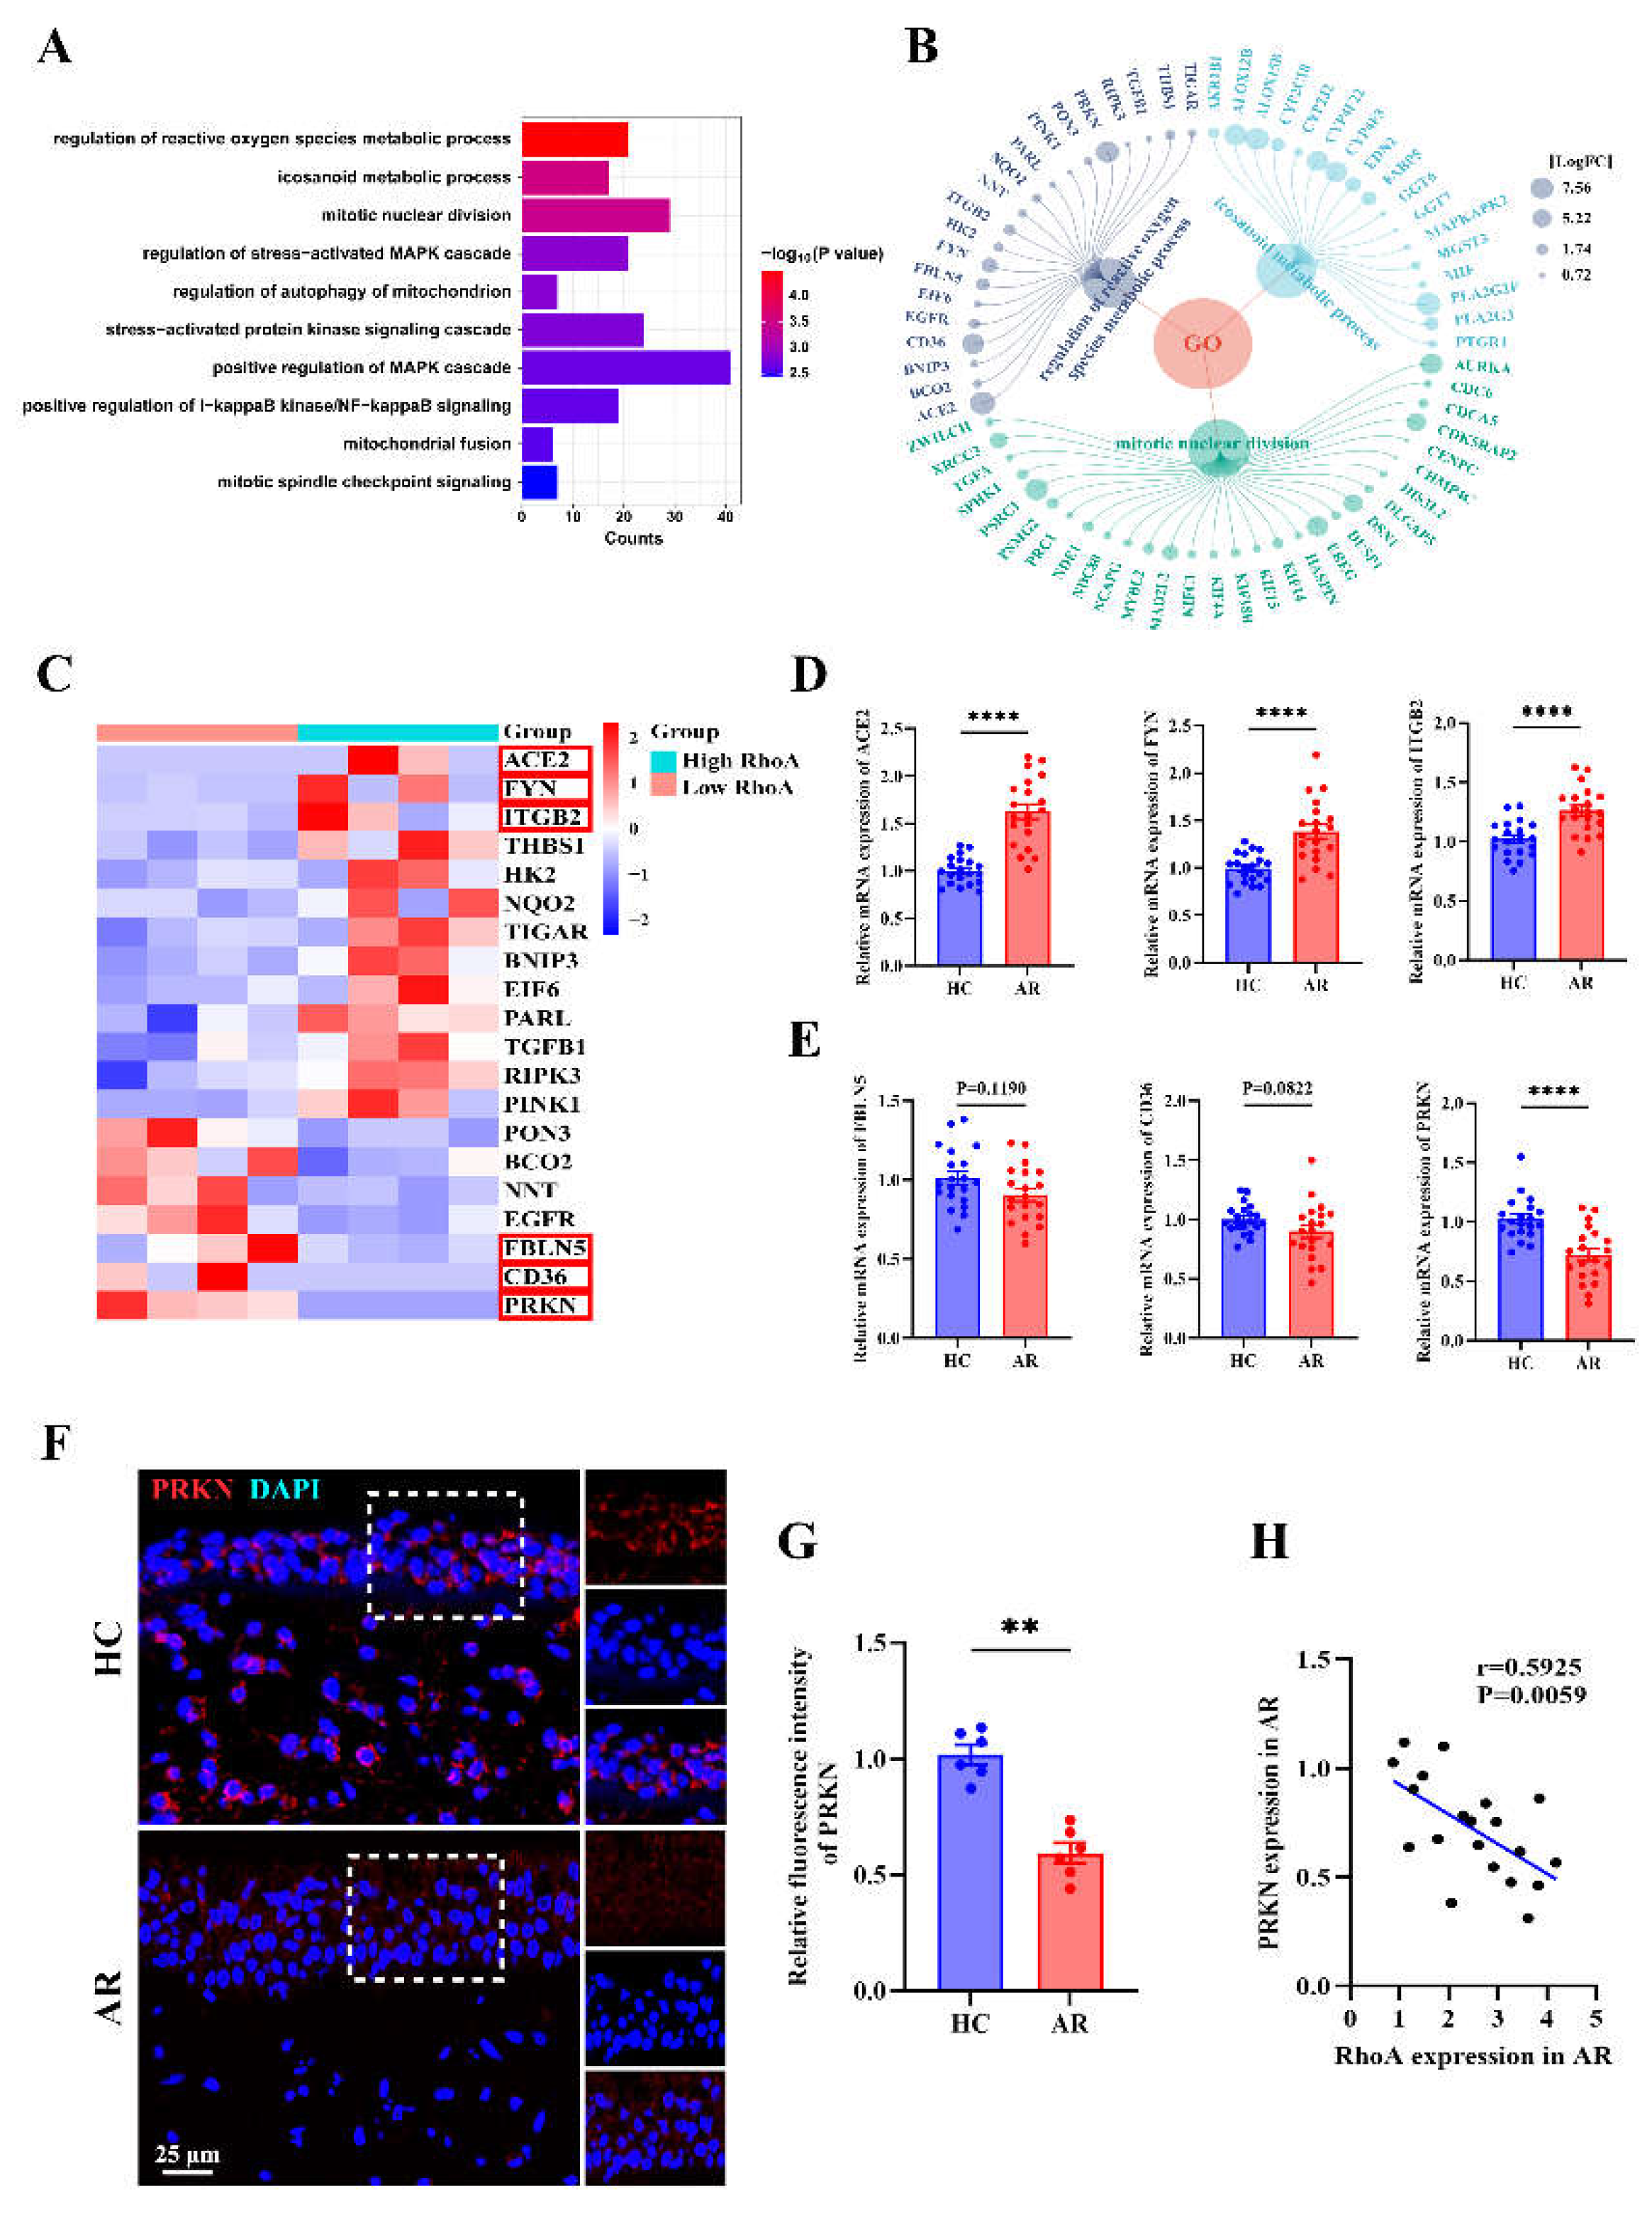
PRKN emerges as a key node in RhoA-regulated senescence pathways in AR. (A) Gene Ontology enrichment analysis showing top enriched biological processes associated with cellular senescence in the high-RhoA AR group. (B) Visualization of differentially expressed genes enriched in Top3 senescence-associated pathways. (C) Heatmap showing the expression of selected oxidative stress-related genes. (D-E) qRT-PCR analysis of ACE2, FYN, ITGB2 (D), FBLN5, CD36, and PRKN (E) expression in HC and AR nasal mucosa (n=20). (F-G) Representative immunofluorescence images (F) and quantification (G) of PRKN expression in HC and AR nasal mucosa (n=6). (H) Correlation analysis between RhoA and PRKN mRNA expression in AR patients (n=20). Data are presented as mean ± SEM. **P < 0.01; ****P < 0.0001.
Figure 7.
PRKN emerges as a key node in RhoA-regulated senescence pathways in AR. (A) Gene Ontology enrichment analysis showing top enriched biological processes associated with cellular senescence in the high-RhoA AR group. (B) Visualization of differentially expressed genes enriched in Top3 senescence-associated pathways. (C) Heatmap showing the expression of selected oxidative stress-related genes. (D-E) qRT-PCR analysis of ACE2, FYN, ITGB2 (D), FBLN5, CD36, and PRKN (E) expression in HC and AR nasal mucosa (n=20). (F-G) Representative immunofluorescence images (F) and quantification (G) of PRKN expression in HC and AR nasal mucosa (n=6). (H) Correlation analysis between RhoA and PRKN mRNA expression in AR patients (n=20). Data are presented as mean ± SEM. **P < 0.01; ****P < 0.0001.
Figure 8.
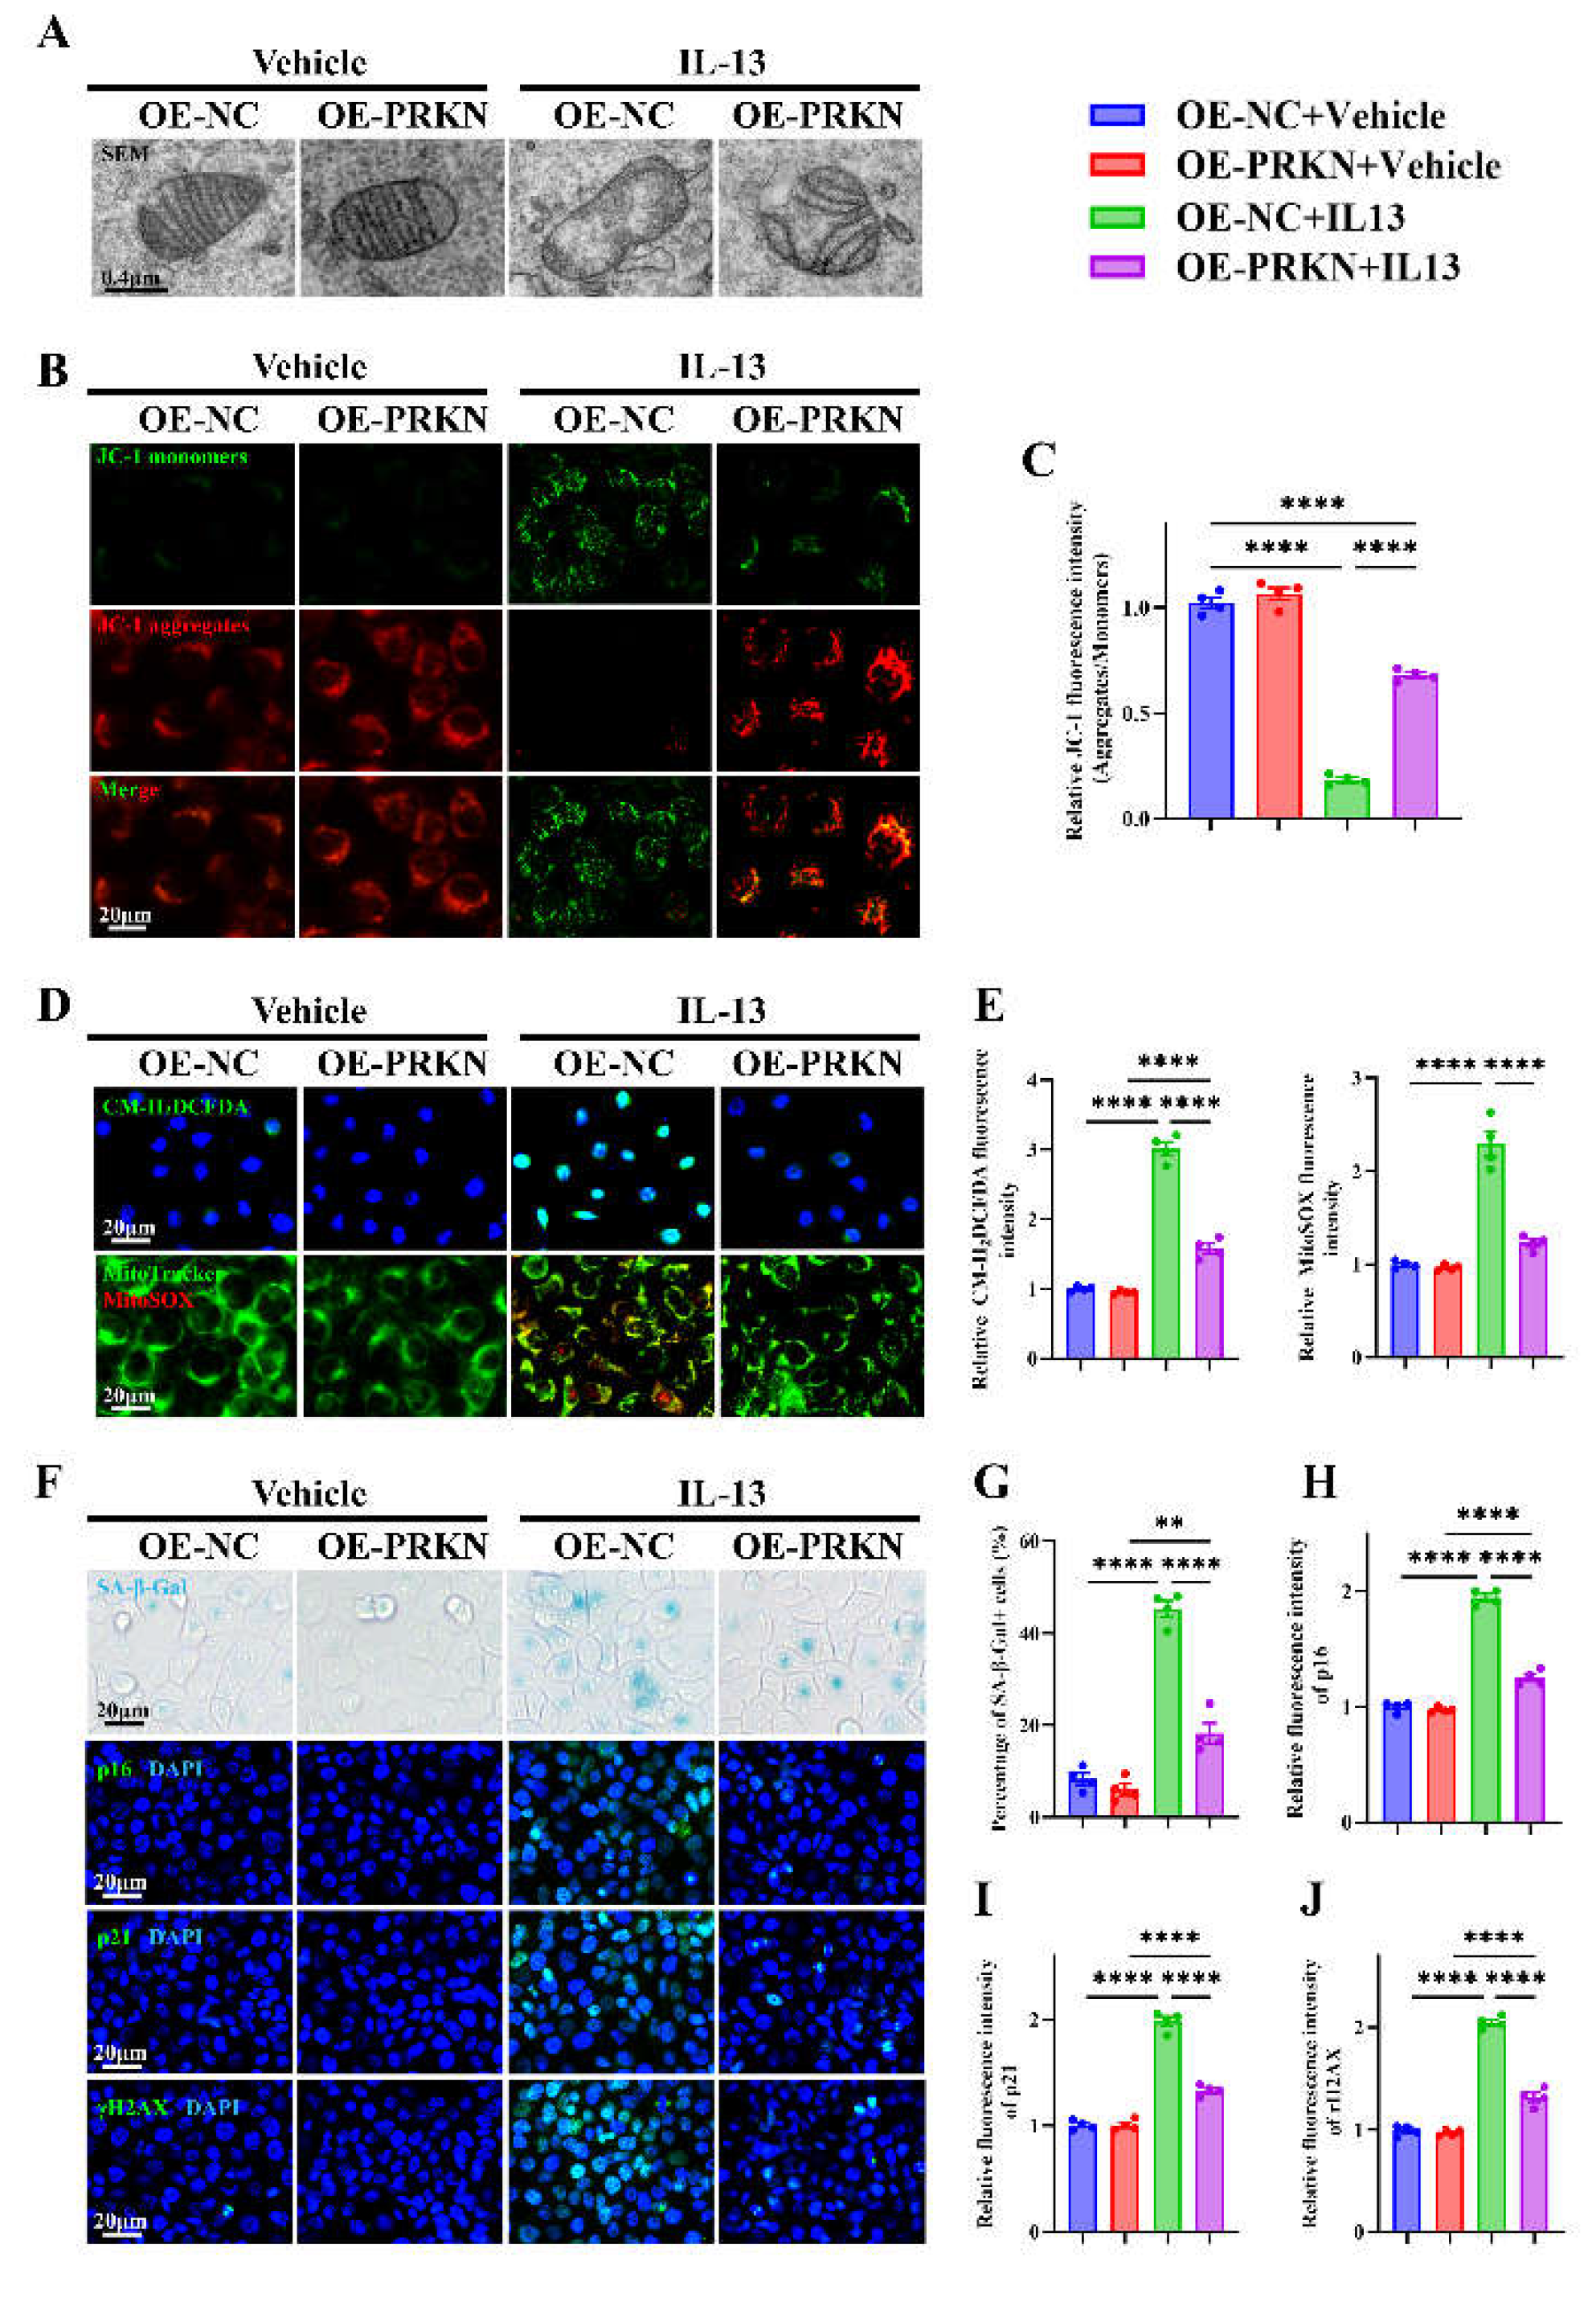
PRKN overexpression alleviates IL-13–induced mitochondrial dysfunction, oxidative stress, and epithelial senescence in HNEpCs. (A) Representative images of transmission electron microscopy in PRKN-overexpressing and control HNEpC. (B-C) Representative images (B) and quantification (C) of JC-1 staining. (D-E) Representative images (D) and quantification (E) of H₂DCFDA and MitoTracker/MitoSOX staining. (F) Representative images of SA-β-Gal staining and immunofluorescence staining for p16, p21, and γH2AX. (G–J) Quantification of SA-β-Gal+ cells (G) and fluorescence intensity of p16 (H), p21 (I), and γH2AX (J). n=4. Data are presented as mean ± SEM. **P < 0.01; ****P < 0.0001.
Figure 8.
PRKN overexpression alleviates IL-13–induced mitochondrial dysfunction, oxidative stress, and epithelial senescence in HNEpCs. (A) Representative images of transmission electron microscopy in PRKN-overexpressing and control HNEpC. (B-C) Representative images (B) and quantification (C) of JC-1 staining. (D-E) Representative images (D) and quantification (E) of H₂DCFDA and MitoTracker/MitoSOX staining. (F) Representative images of SA-β-Gal staining and immunofluorescence staining for p16, p21, and γH2AX. (G–J) Quantification of SA-β-Gal+ cells (G) and fluorescence intensity of p16 (H), p21 (I), and γH2AX (J). n=4. Data are presented as mean ± SEM. **P < 0.01; ****P < 0.0001.