Submitted:
28 November 2025
Posted:
02 December 2025
You are already at the latest version
Abstract
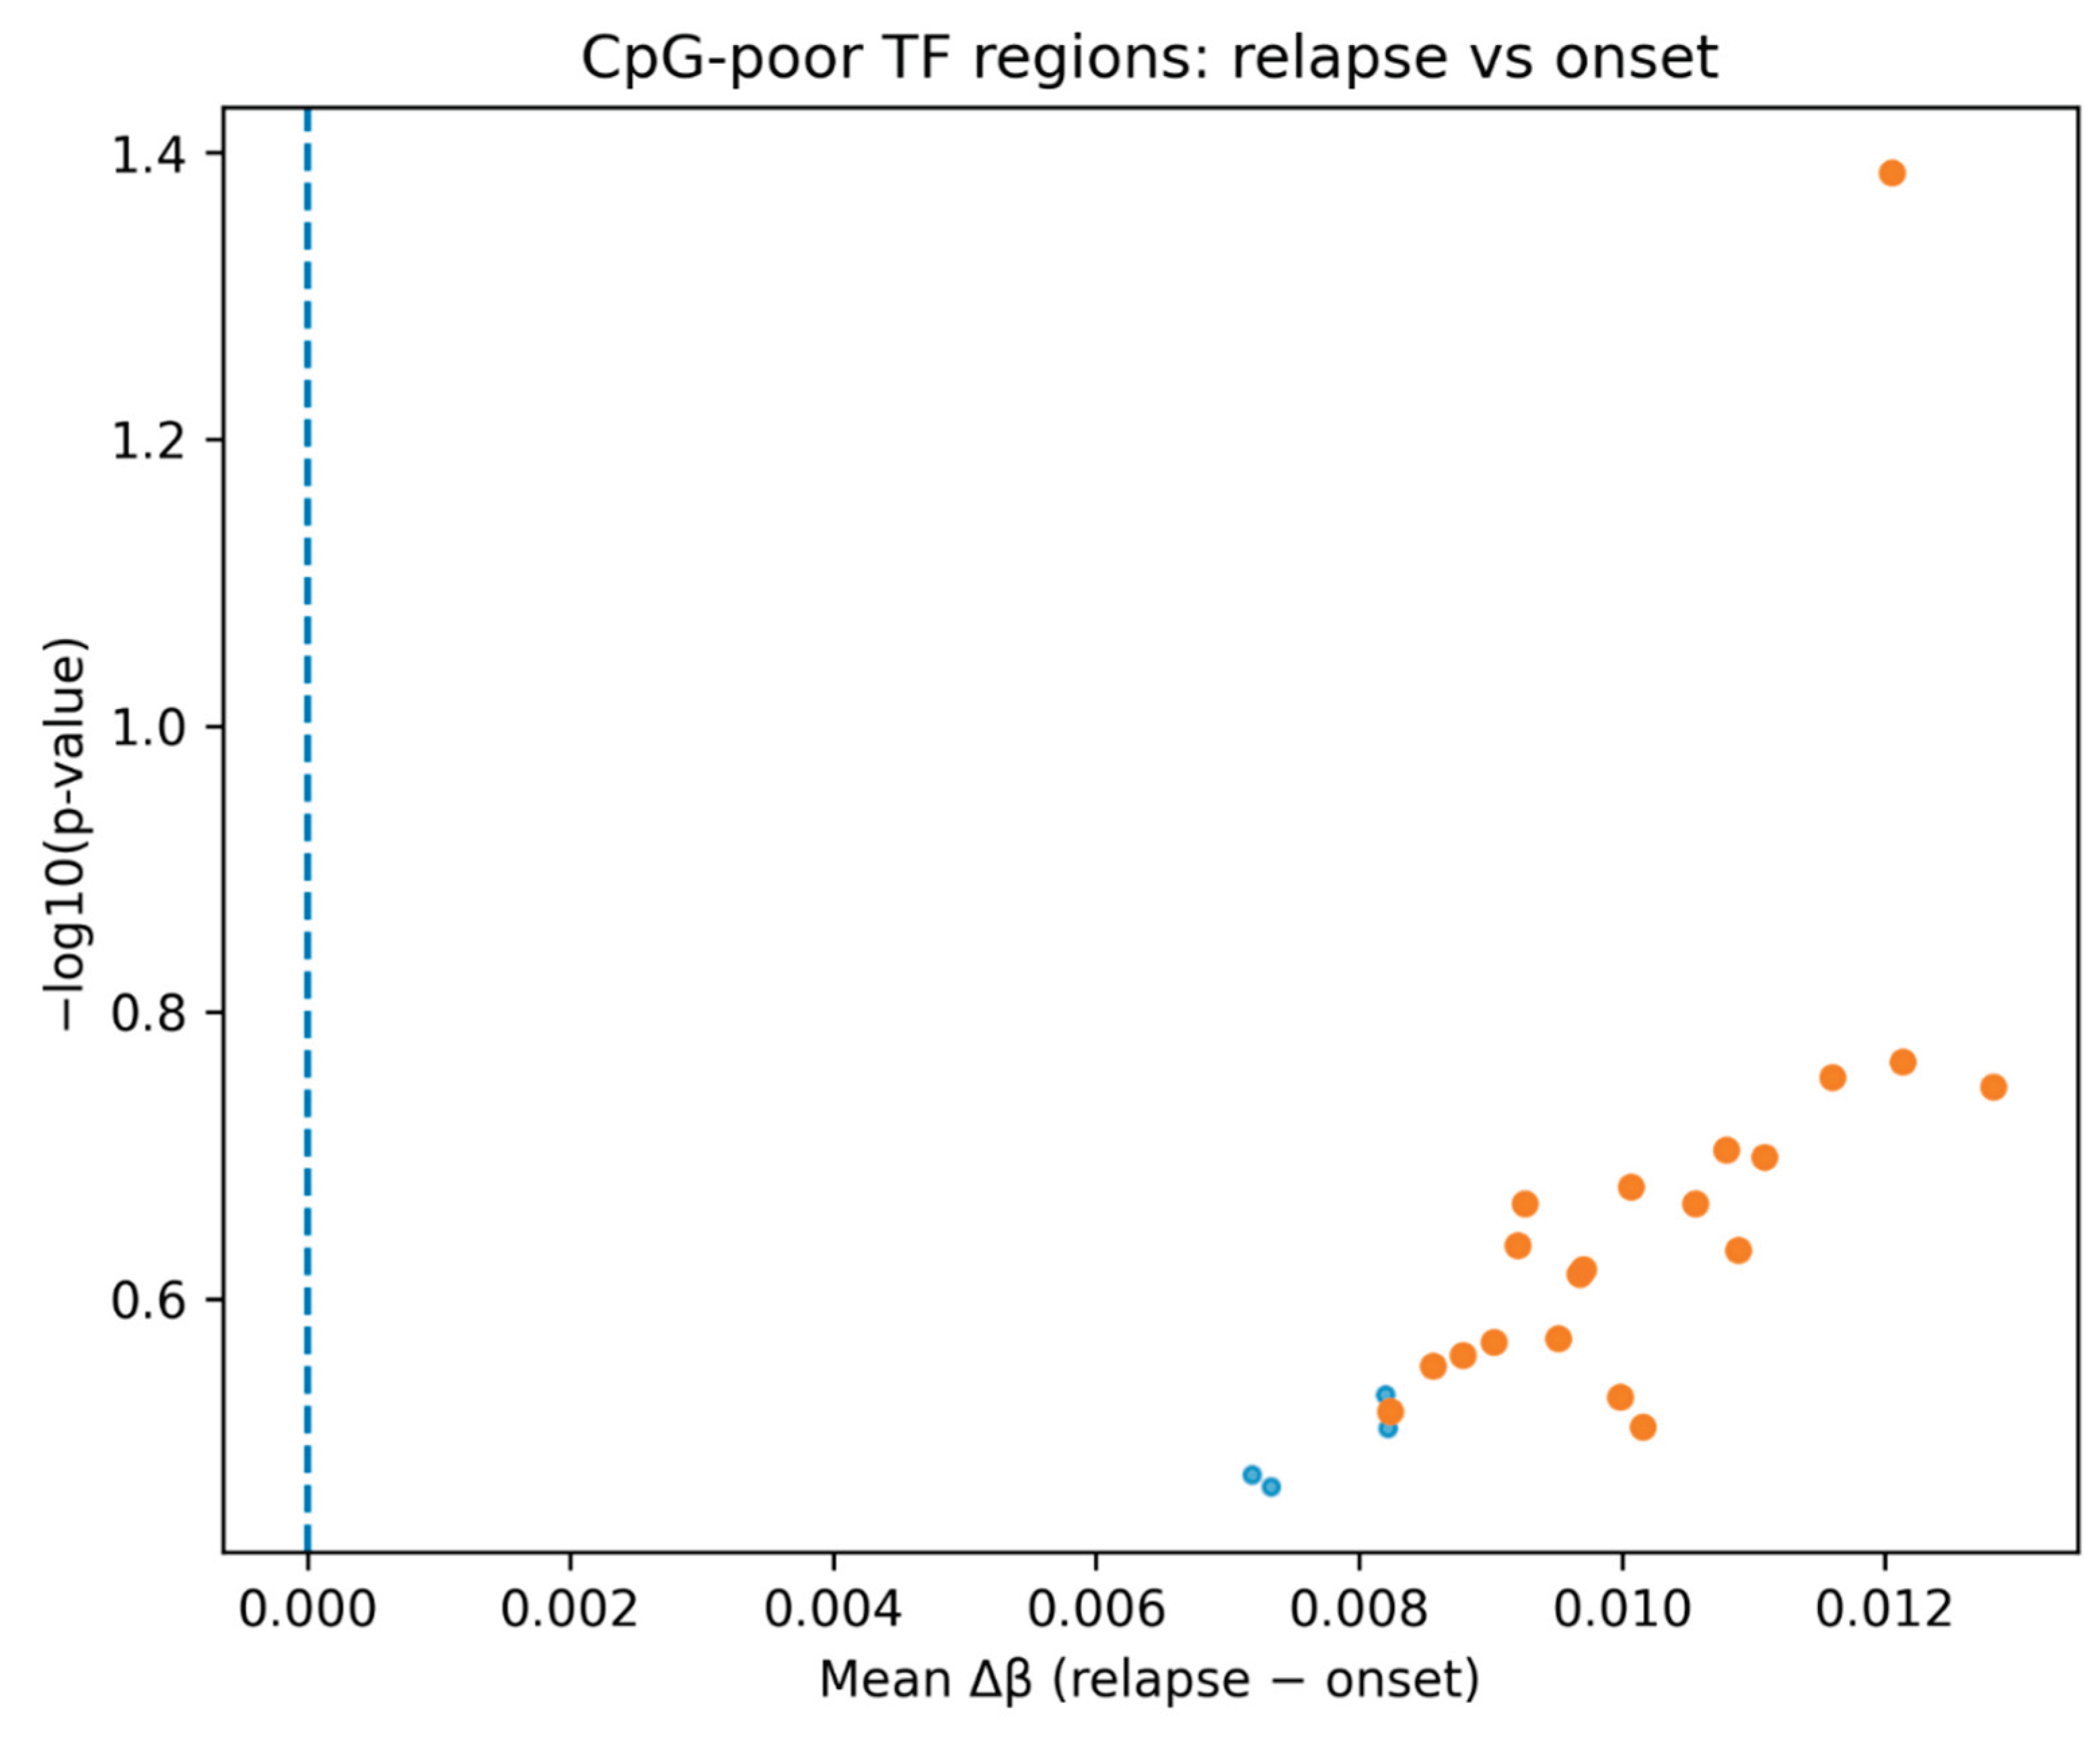
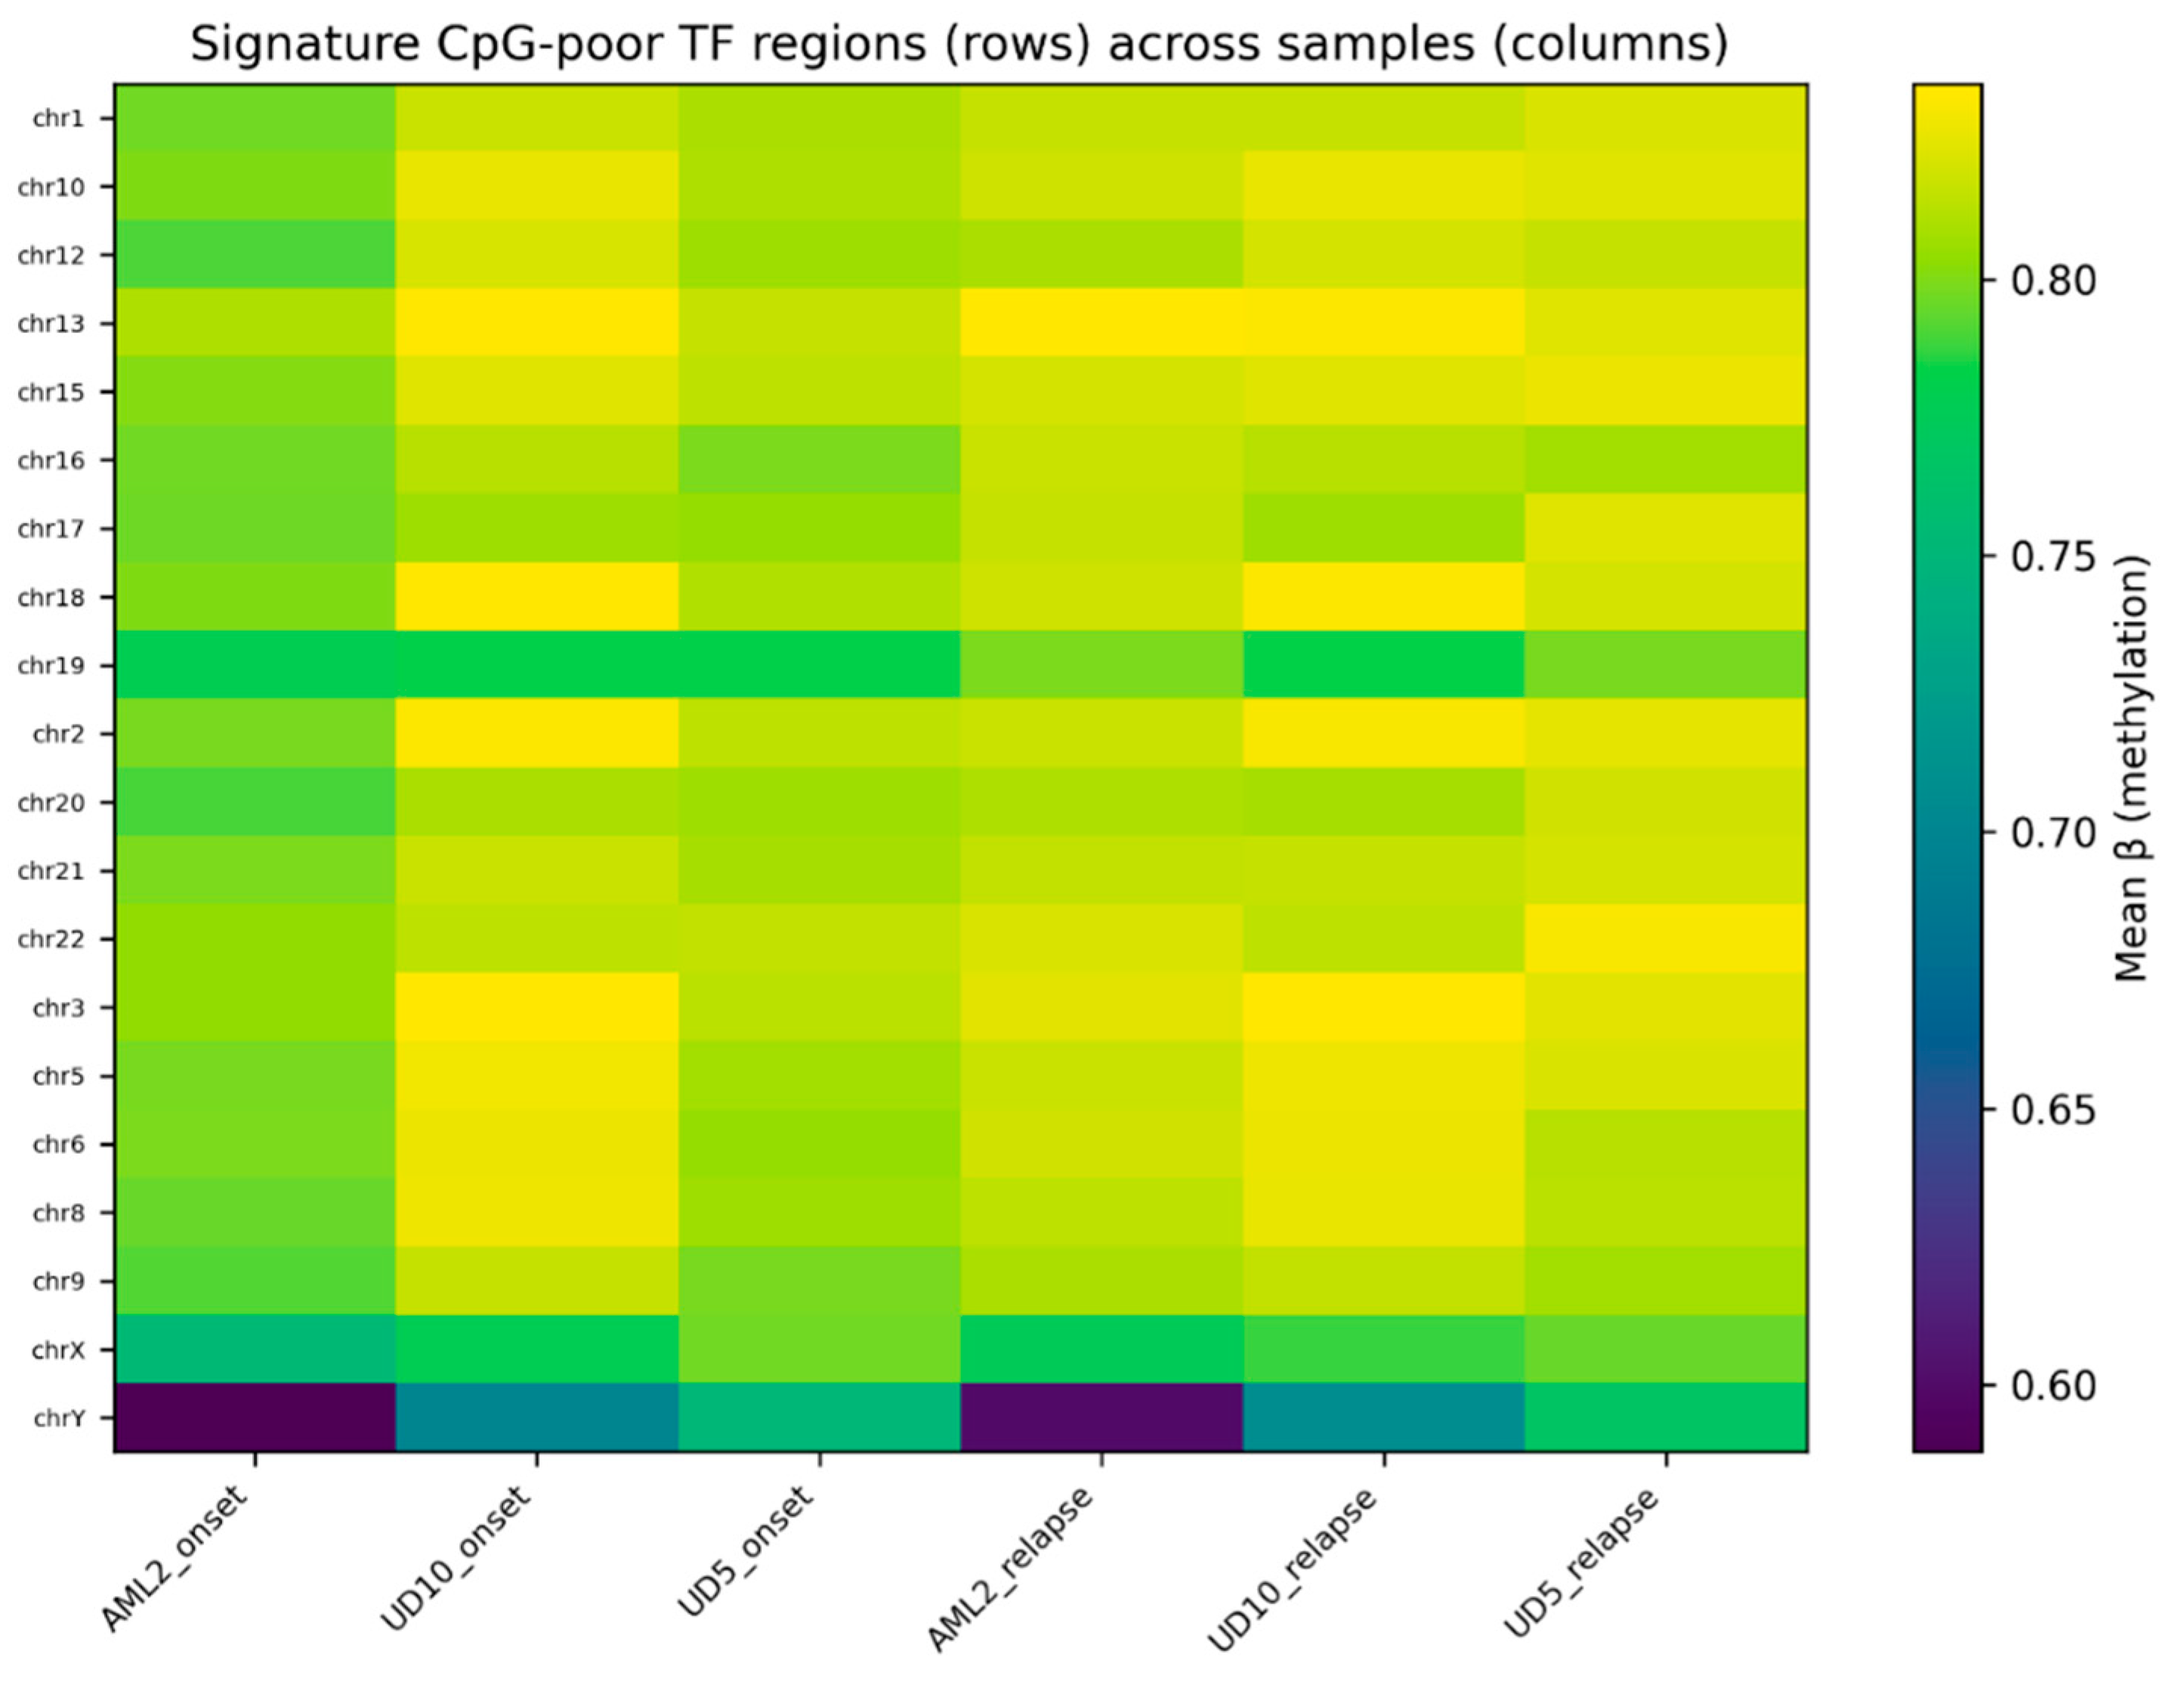
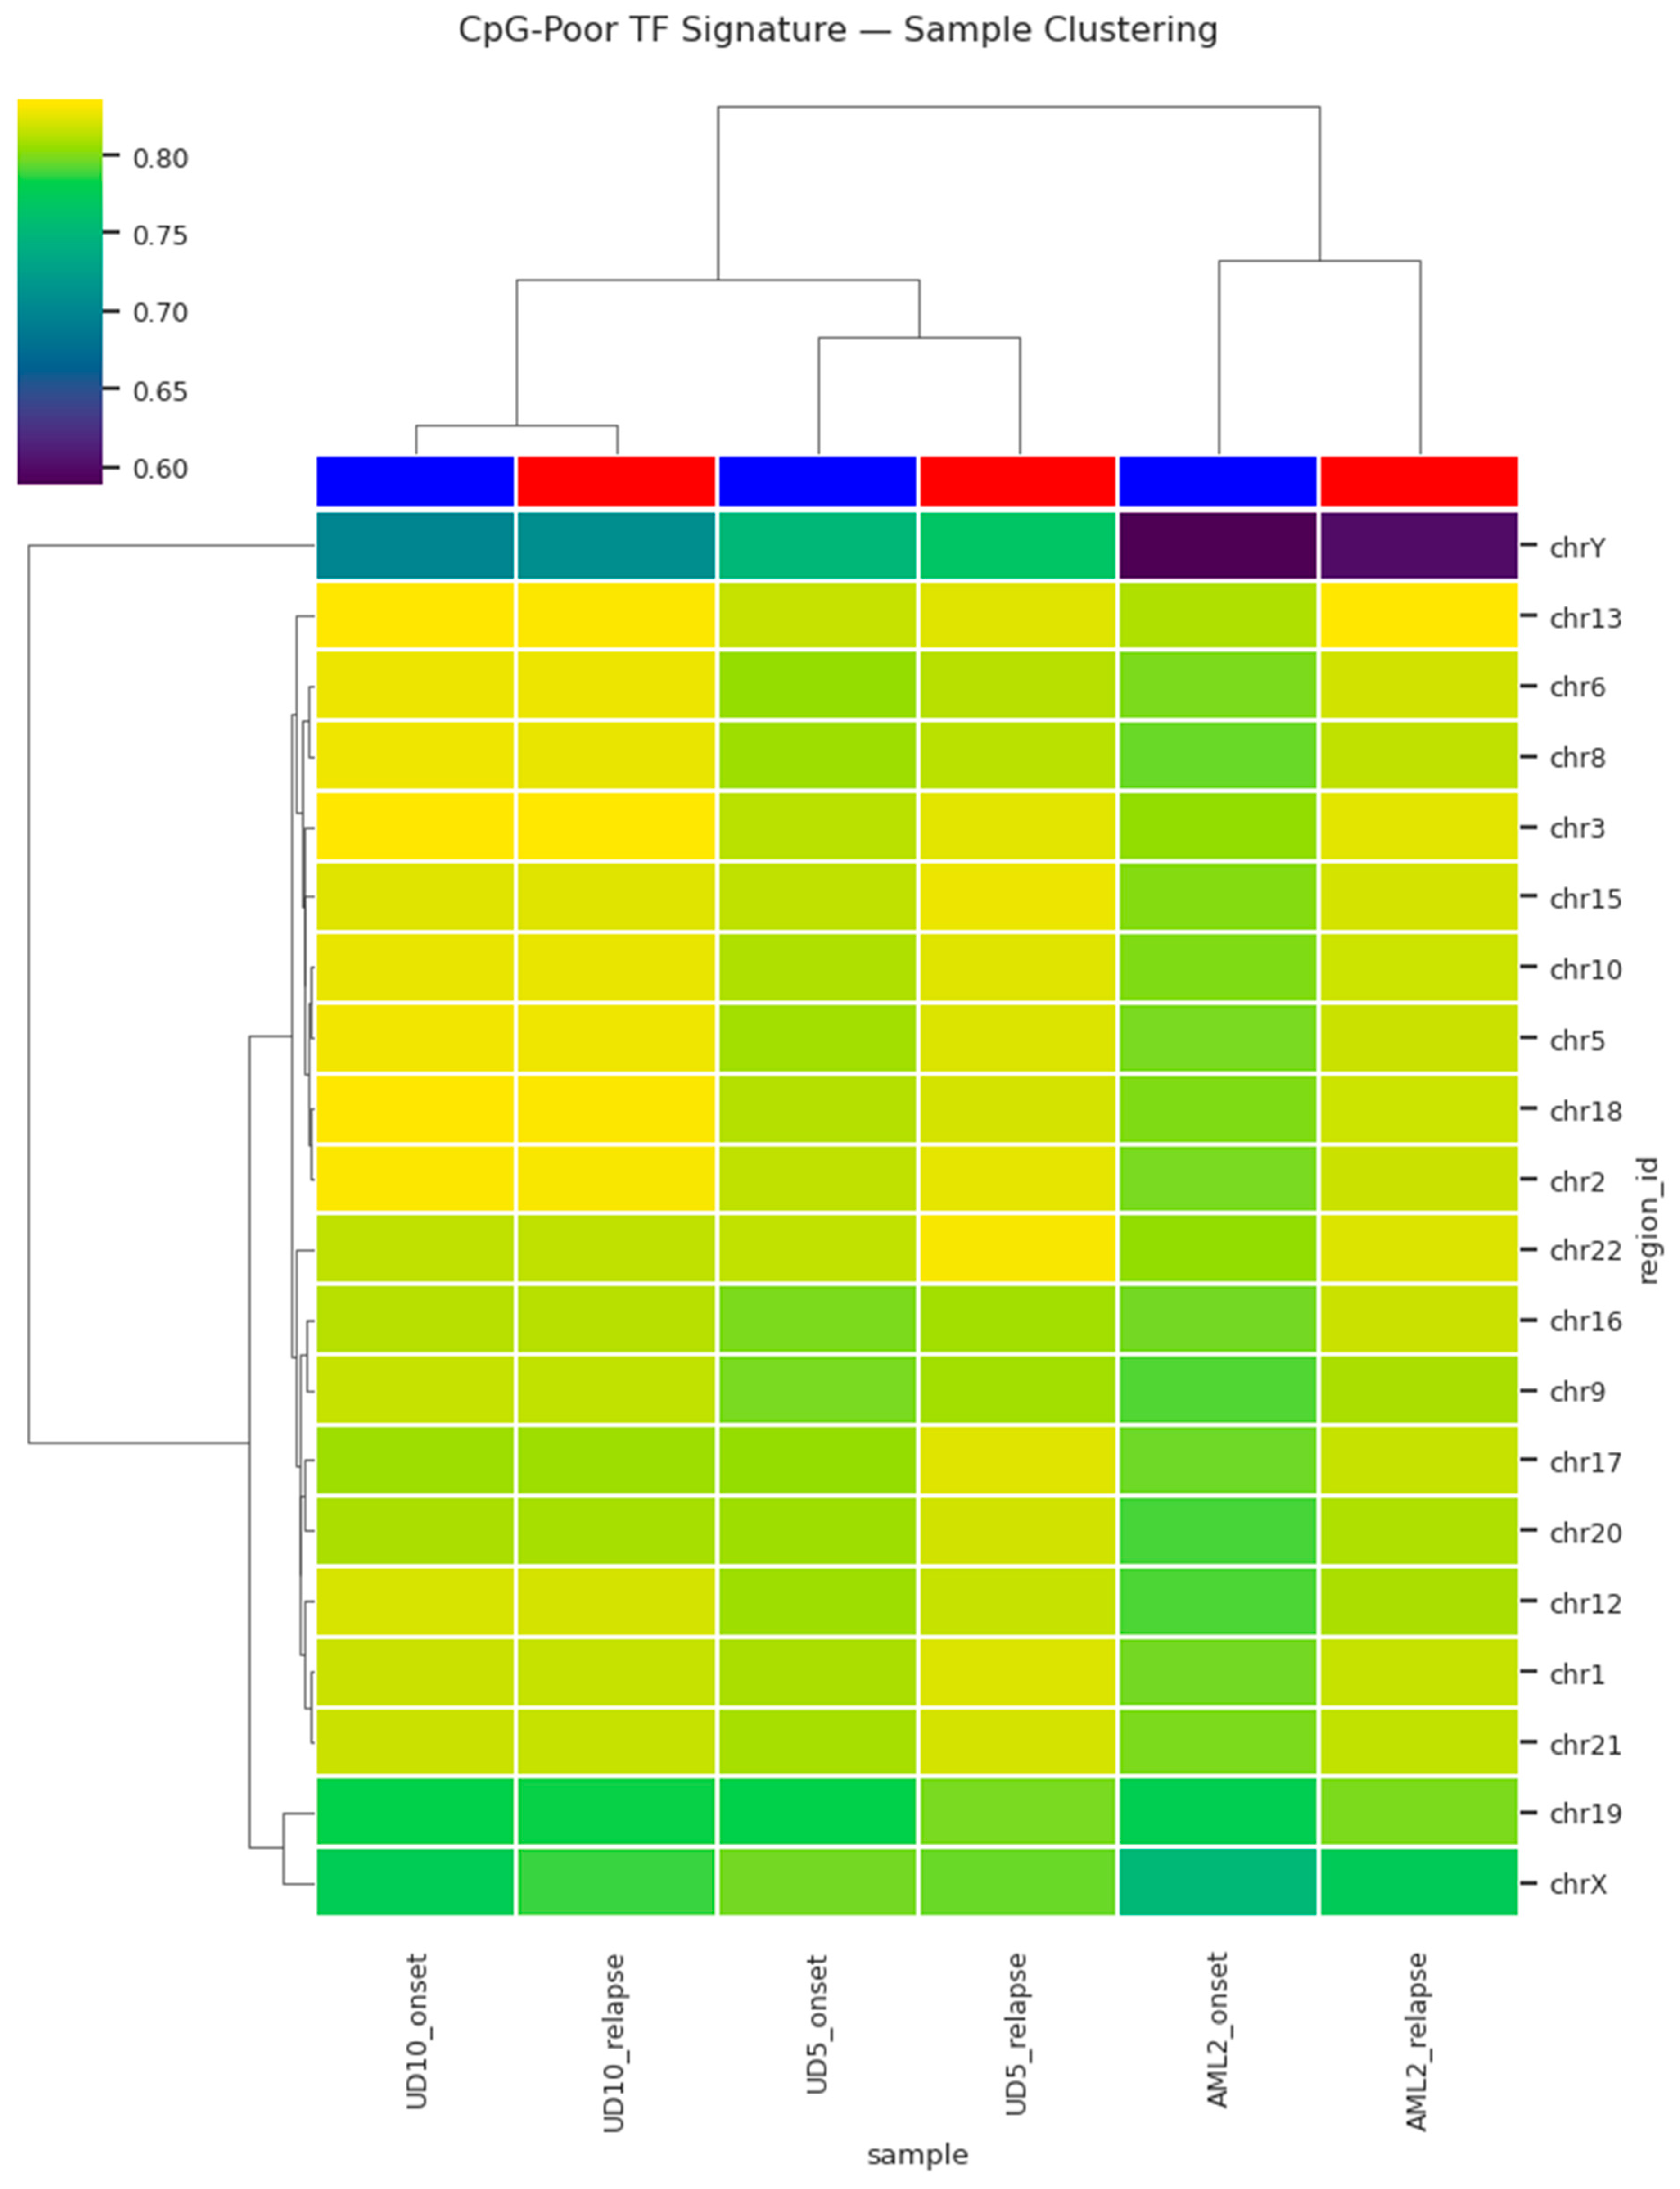
Relapse in acute myeloid leukemia (AML) is frequently associated with chemoresistance, yet the molecular mechanisms driving this transition remain incompletely understood. To explore relapse-associated epigenetic remodeling, we reanalyzed publicly available Nanopore whole-genome methylation data from three AML patients with matched onset and relapse samples. We focused on CpG-poor transcription factor (TF)-associated regulatory regions, recently implicated as unconventional epigenetic hotspots in leukemia progression. Across all samples, relapse was characterized by a consistent gain in DNA methylation within CpG-poor TF regions, with all ranked loci demonstrating a positive mean Δβ shift. Heatmap visualization of the top-ranked regions revealed distinct clustering of relapse versus onset samples, supporting the presence of a coordinated epigenetic signature rather than random methylation drift. These findings suggest that relapse AML cells may acquire targeted methylation to suppress key regulatory networks involved in DNA repair, apoptosis, and growth control, thereby enabling therapeutic escape. This work highlights the potential utility of Nanopore methylation profiling as a real-time biomarker platform to detect relapse-associated epigenetic rewiring and guide precision treatment strategies.
Keywords:
1. Introduction
2. Methods
2.1. Dataset Acquisition
2.2. Basecalling and Methylation Calling
2.3. Feature Extraction and CpG Density-Based Filtering
- GENCODE v38 gene models
- A manually curated list of transcription factors from TFClass database
- Public regulatory annotation files from ENCODE
2.4. Differential Methylation Analysis
2.5. Data Visualization, Dimensional Reduction, and Clustering
- NumPy (v1.23.5)
- pandas (v1.5.3)
- SciPy (v1.9.3)
- matplotlib (v3.6.2)
- seaborn (v0.12.2)
- Euclidean distance metric
- Average linkage method
2.6. Reproducibility and Workflow Management
3. Results
4. Discussion
Conclusion
Acknowledgements
References
- Döhner, H., Weisdorf, D. J., & Bloomfield, C. D. (2015). Acute myeloid leukemia. New England Journal of Medicine, 373(12), 1136–1152. [CrossRef]
- Estey, E. H., & Döhner, H. (2006). Acute myeloid leukemia. The Lancet, 368(9550), 1894–1907. [CrossRef]
- Klco, J. M., Miller, C. A., Griffith, M., et al. (2015). Association between mutation clearance after induction therapy and outcomes in acute myeloid leukemia. JAMA, 314(3), 311–322. [CrossRef]
- Figueroa, M. E., Lugthart, S., Li, Y., et al. (2010). DNA methylation signatures identify biologically distinct subtypes in acute myeloid leukemia. Cancer Cell, 17(1), 13–27. [CrossRef]
- Ley, T. J., Miller, C., Ding, L., et al. (2013). Genomic and epigenomic landscapes of adult de novo acute myeloid leukemia. New England Journal of Medicine, 368(22), 2059–2074. [CrossRef]
- Bullinger, L., Döhner, K., Kranz, R., et al. (2017). Genomics of acute myeloid leukemia. Blood, 129(6), 679–691. [CrossRef]
- Lea, A. J., Vockley, C. M., Johnston, R. A., et al. (2018). Genome-wide quantification of DNA methylation variation. Proceedings of the National Academy of Sciences, 115(31), E7109–E7118. [CrossRef]
- Suzuki, M. M., & Bird, A. (2008). DNA methylation landscapes. Nature Reviews Genetics, 9(6), 465–476. [CrossRef]
- Whyte, W. A., Orlando, D. A., Hnisz, D., et al. (2013). Master transcription factors and super-enhancers in development and disease. Cell, 153(2), 307–319. [CrossRef]
- Simpson, J. T., Workman, R. E., Zuzarte, P. C., et al. (2017). Detecting DNA methylation using nanopore sequencing. Nature Methods, 14(4), 407–410. [CrossRef]
- Gene Expression Omnibus. (2022). GSE213685 dataset. https://www.ncbi.nlm.nih.gov/geo/query/acc.cgi?acc=GSE213685.
- Qu, J., Li, F., Helms, E., et al. (2022). Epigenetic drift contributes to relapse evolution in acute myeloid leukemia. Nature Communications, 13, Article 519. [CrossRef]
- Köster, J., & Rahmann, S. (2012). Snakemake: A scalable bioinformatics workflow engine. Bioinformatics, 28(19), 2520–2522. [CrossRef]
- Shlush, L. I., Mitchell, A., Heisler, L., et al. (2017). Tracing the origins of relapse in AML. Nature, 547(7661), 484–488. [CrossRef]
- Pabst, T., & Müller, B. U. (2007). Transcription factor dysregulation in acute myeloid leukemia. Annals of Hematology, 86(6), 393–405. [CrossRef]
- Levine, R. L., & Gilliland, D. G. (2008). Stem-like characteristics of relapse AML cells. Nature Medicine, 14(10), 1015–1016. [CrossRef]
- Hnisz, D., Abraham, B. J., Lee, T. I., et al. (2013). Super-enhancers in cell identity and disease. Cell, 155(4), 934–947. [CrossRef]
- Keenan, C., Coates, P., Nasrallah, R., et al. (2019). Epigenetic mechanisms of therapy resistance. Nature Reviews Cancer, 19(5), 279–292. [CrossRef]
- Challen, G. A., Sun, D., Jeong, M., et al. (2014). Epigenetic memory and hematopoiesis. Cell Stem Cell, 14(6), 810–822. [CrossRef]
- Mirzaei, R., Parhizkar, R., & Ghasemi, A. (2021). DNA methylation and relapse biology in AML. Frontiers in Oncology, 11, 668. [CrossRef]
Disclaimer/Publisher’s Note: The statements, opinions and data contained in all publications are solely those of the individual author(s) and contributor(s) and not of MDPI and/or the editor(s). MDPI and/or the editor(s) disclaim responsibility for any injury to people or property resulting from any ideas, methods, instructions or products referred to in the content. |
© 2025 by the authors. Licensee MDPI, Basel, Switzerland. This article is an open access article distributed under the terms and conditions of the Creative Commons Attribution (CC BY) license (http://creativecommons.org/licenses/by/4.0/).


