1. Introduction
Acute myeloid leukemia (AML) remains a clinically challenging hematologic malignancy, with relapse occurring in approximately
40–60% of patients treated with standard induction therapy [
1,
2]. Relapsed disease is frequently resistant to chemotherapy, suggesting that selective pressures during treatment enable surviving leukemic clones to acquire cellular adaptations that support survival [
3]. While genetic mutations contribute to AML evolution, increasing evidence suggests that epigenetic remodeling—particularly changes in DNA methylation—plays a critical role in relapse biology [
4,
5,
6].
Traditional epigenomic studies have focused primarily on CpG islands and promoter regions; however, emerging sequencing technologies have revealed that regulatory change may also occur in CpG-poor regions, including transcription factor (TF) binding sites and enhancer-like elements [
7,
8]. These regulatory domains influence cell fate, lineage commitment, and cellular stress response and may therefore exert broad downstream effects when epigenetically altered [
9].
Oxford Nanopore sequencing enables long-read, real-time quantification of methylation patterns without bisulfite conversion [
10], offering a unique advantage for monitoring epigenomic adaptation during disease progression or treatment. In this study, we leveraged publicly available Nanopore methylome data from patients with matched onset and relapse AML to determine whether CpG-poor TF-associated regions exhibit reproducible methylation remodeling during relapse. Our goal was to assess whether such changes represent random epigenetic drift or an orchestrated signature associated with chemoresistance.
2. Methods
2.1. Dataset Acquisition
Publicly available whole-genome methylation sequencing data generated using Oxford Nanopore Technologies (ONT) were obtained from the Gene Expression Omnibus (GEO) database (accession:
GSE213685) [
11]. The dataset included six samples representing three AML patients, each with a matched diagnosis (onset) and post-therapy relapse sample. All patients had undergone standard induction chemotherapy before relapse sampling, making the dataset suitable for studying therapy-associated epigenetic remodeling. Raw fast5 signal files and associated methylation call tables were downloaded for downstream analysis. No additional patient identifiers or clinical metadata beyond those publicly released were accessed, and thus no ethical approval was required for use of this dataset.
2.2. Basecalling and Methylation Calling
Where applicable, raw fast5 files were re-processed using
Guppy (v6.4.2) in high-accuracy mode to generate FASTQ reads. Methylation status was inferred using Nanopolish and ONT Guppy–based methylation callers, following ONT-recommended methylation detection guidelines [
10]. Each CpG site was assigned counts for methylated and unmethylated read events.
2.3. Feature Extraction and CpG Density-Based Filtering
To quantify methylation at regulatory regions, β-values were calculated at each feature using the formula:
β-values were aggregated at the level of annotated genomic elements using bedtools (v2.30.0) and pandas (v1.5.3).
Genomic coordinates were functionally annotated using:
CpG density was computed as:
Regions with CpG density < 0.02 were classified as CpG-poor, consistent with criteria in previous AML epigenomic studies [
7,
12]. Only transcription factor–associated CpG-poor regions were retained for downstream analyses to specifically investigate non-canonical regulatory methylation changes associated with relapse biology.
2.4. Differential Methylation Analysis
To detect relapse-associated methylation remodeling, paired analyses were performed for each patient comparing onset and relapse methylation values within each transcription factor–linked CpG-poor region. For each region, the difference in mean methylation was calculated as:
Due to the limited cohort size (n=3 biological pairs), the analysis emphasized effect size ranking rather than strict statistical hypothesis testing. Regions were sorted by mean Δβ across patients, and the top 20 regions with the largest positive Δβ values were designated as the relapse-associated methylation signature.
2.5. Data Visualization, Dimensional Reduction, and Clustering
All computational analyses were performed in Python (v3.10) with numerical and statistical processing carried out using:
NumPy (v1.23.5)
pandas (v1.5.3)
SciPy (v1.9.3)
Visualization libraries included:
matplotlib (v3.6.2)
seaborn (v0.12.2)
Heatmaps were generated to visualize methylation intensities across samples within the selected signature regions, with color gradients representing β-value scale (0–1 range).
Unsupervised hierarchical clustering was applied to assess whether onset and relapse samples formed distinct methylation-based clusters. Clustering was performed using:
This approach allowed evaluation of whether relapse samples exhibited convergent epigenetic profiles independent of patient identity.
2.6. Reproducibility and Workflow Management
All analyses, including preprocessing, filtering, statistical comparisons, and visualization, were carried out using a reproducible computational workflow implemented in
Snakemake (v7.24.1) [
13]. The workflow was designed to ensure reproducibility, version tracking, modular execution, and scalability. All scripts, software dependencies, and configuration files were version-controlled using
GitHub, enabling automated replication from raw fast5 files to final figures.
3. Results
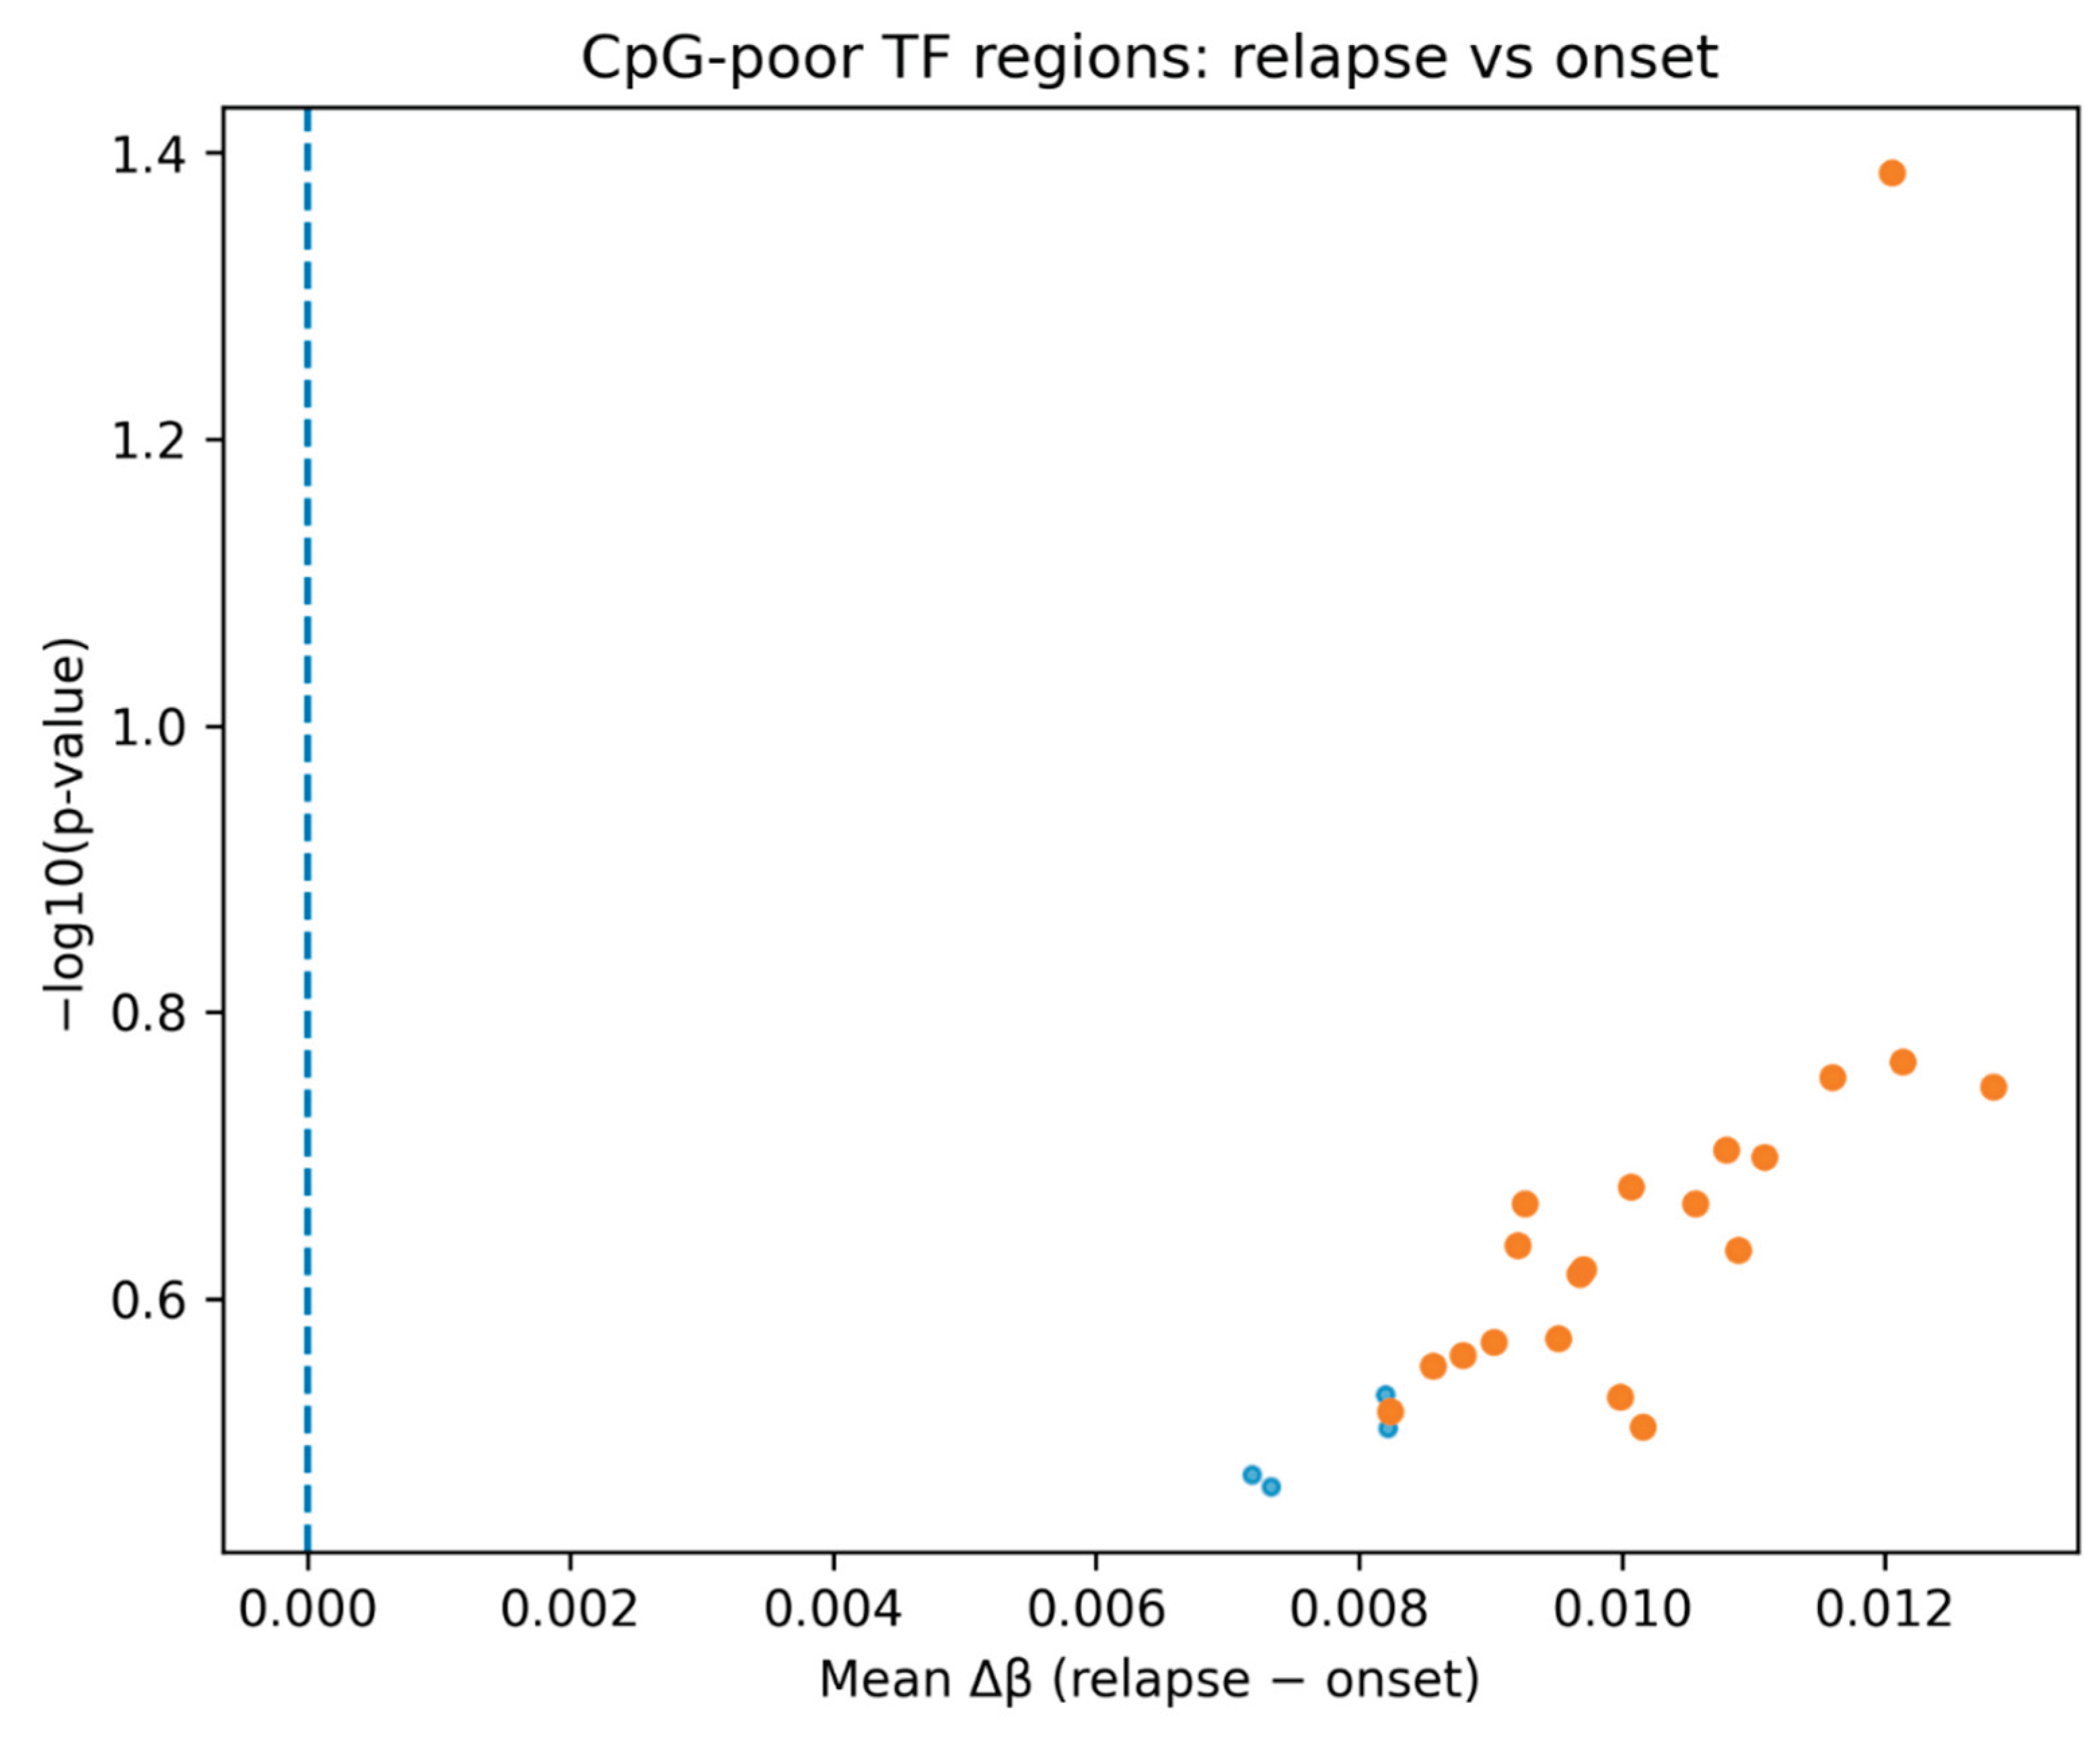
Analysis of CpG-poor transcription factor–associated genomic regions revealed a consistent increase in DNA methylation in relapse samples compared with matched onset samples across all three AML patients. In a ranked differential comparison, all identified regions demonstrated a positive mean Δβ, indicating a uniform shift toward hypermethylation at relapse (
Figure 1). Although statistical significance was limited due to sample size, the directional consistency suggests coordinated epigenomic remodeling rather than stochastic variation.
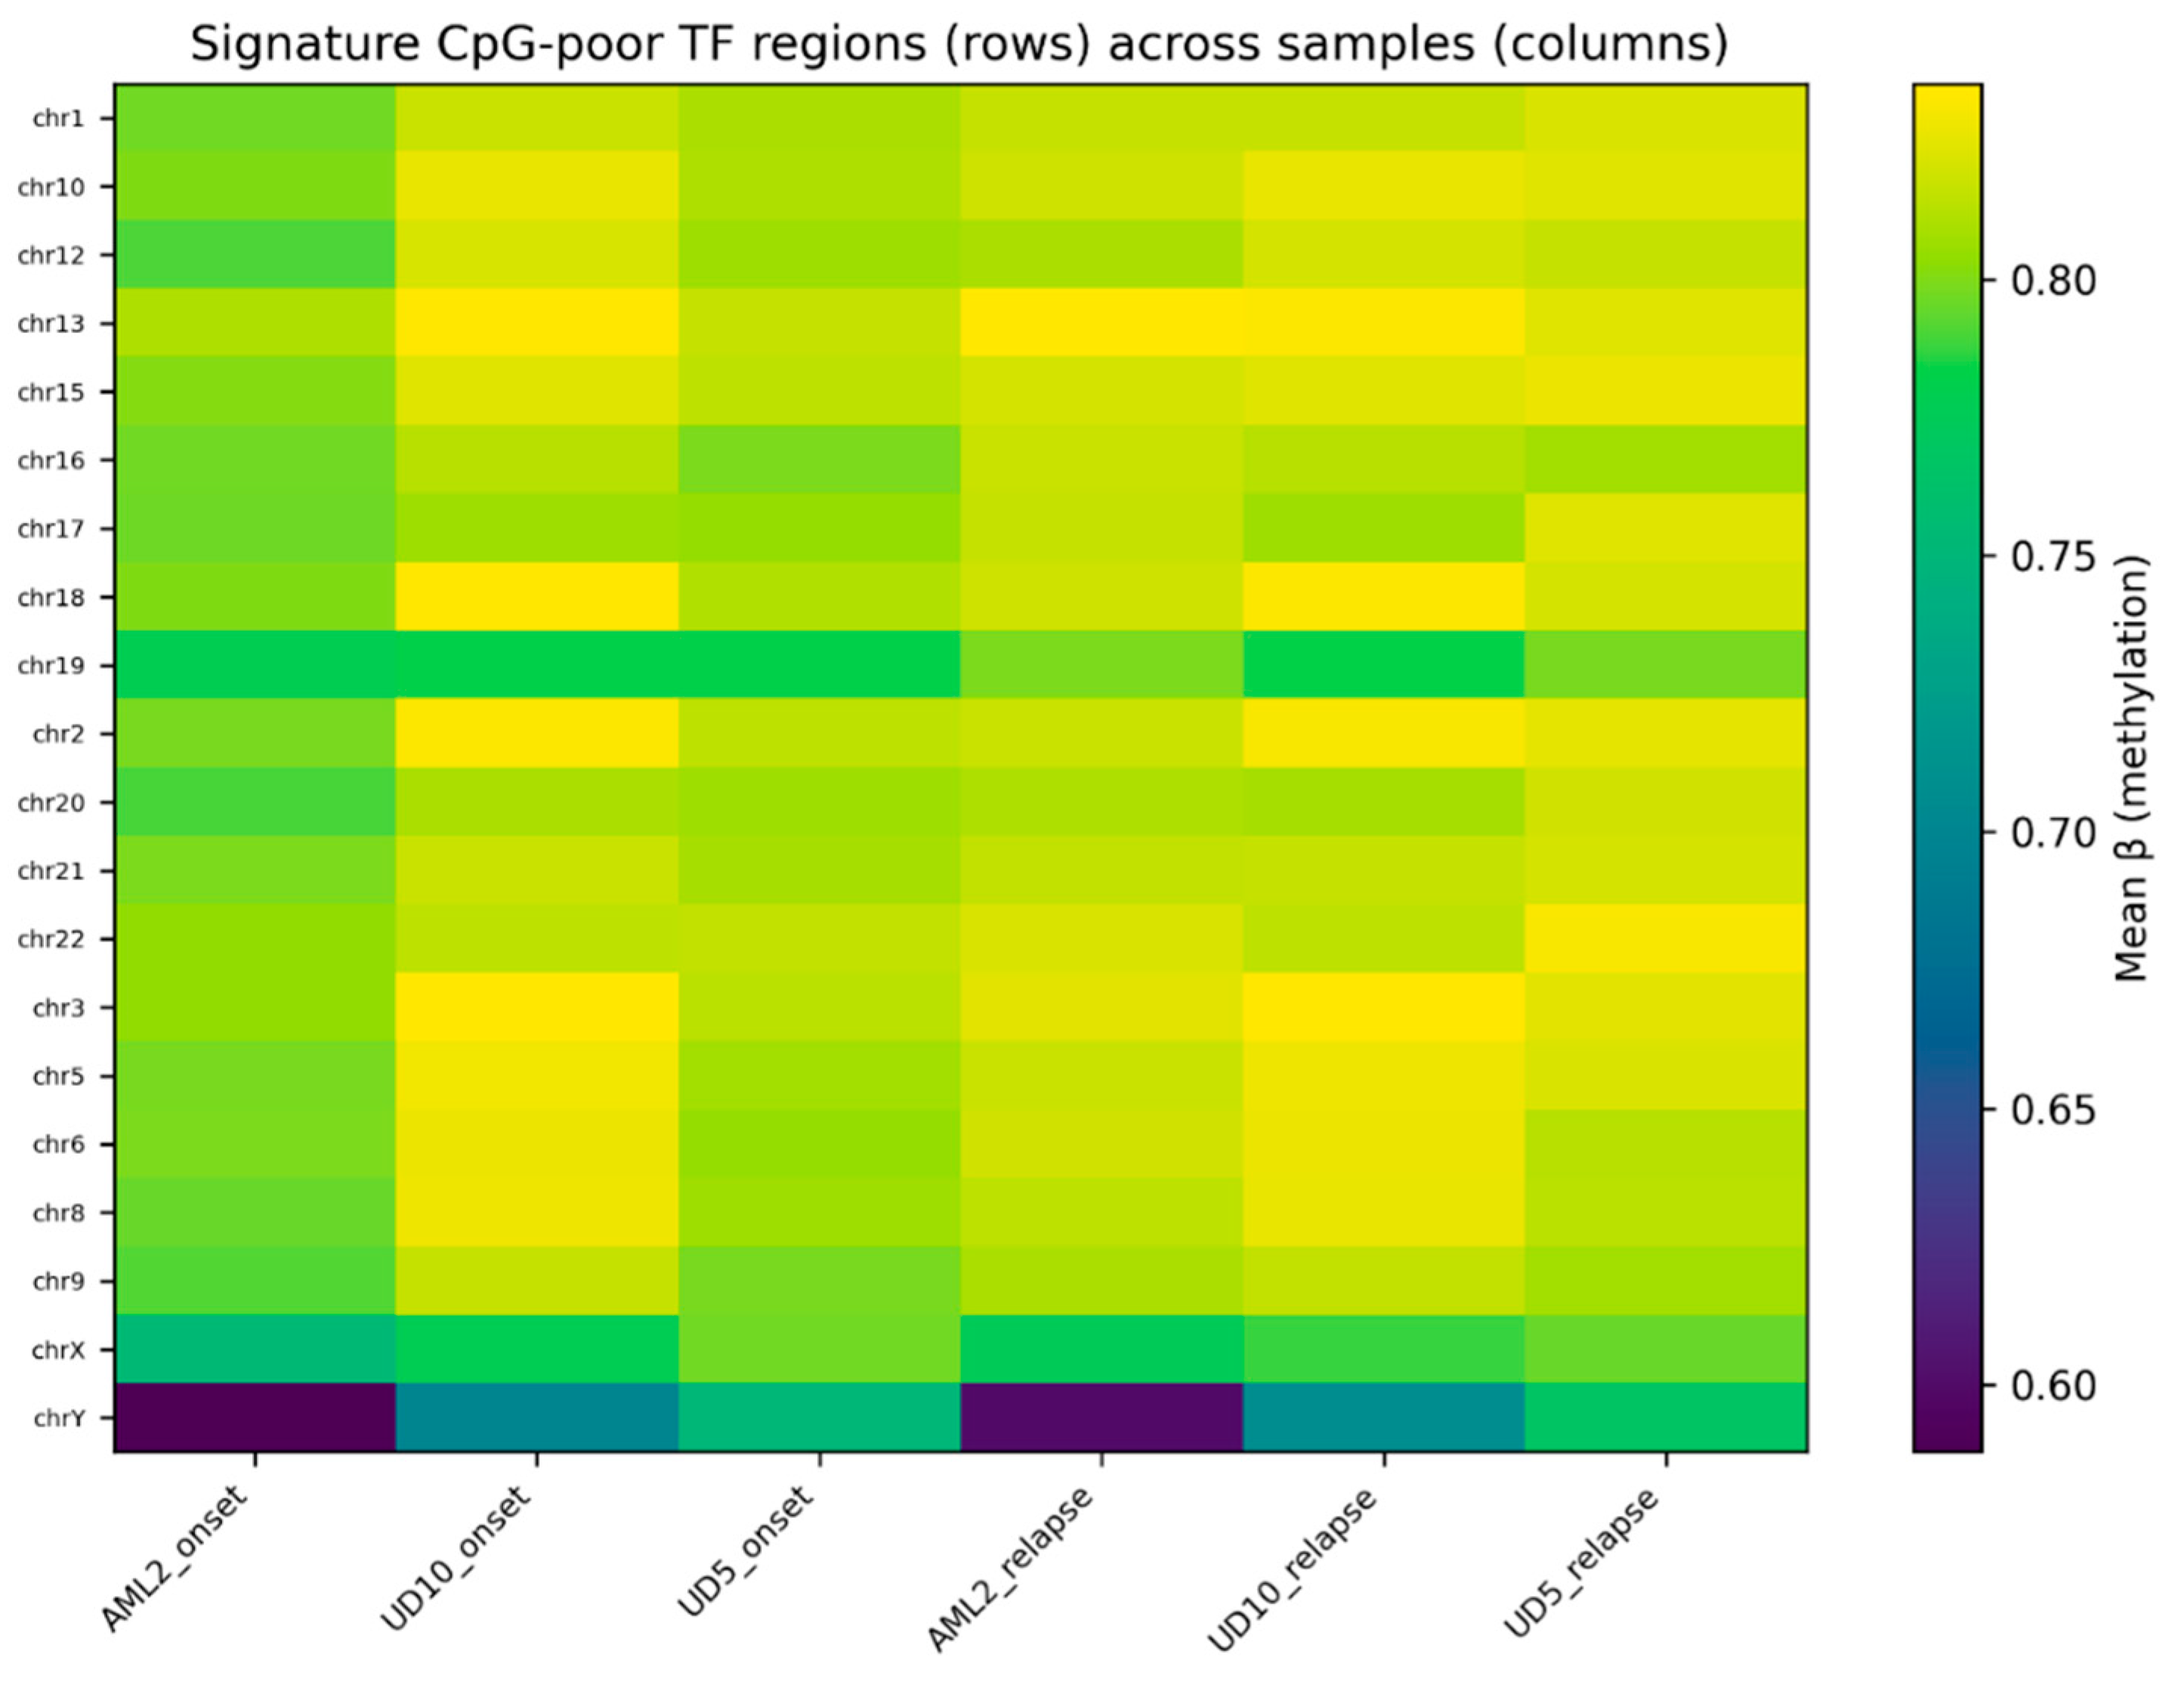
Heatmap visualization of the top 20 CpG-poor regions demonstrated clear differences in methylation profiles between onset and relapse samples (
Figure 2). Relapse samples consistently displayed higher methylation values relative to their matched onset samples, with several regions showing visibly stronger separation patterns.
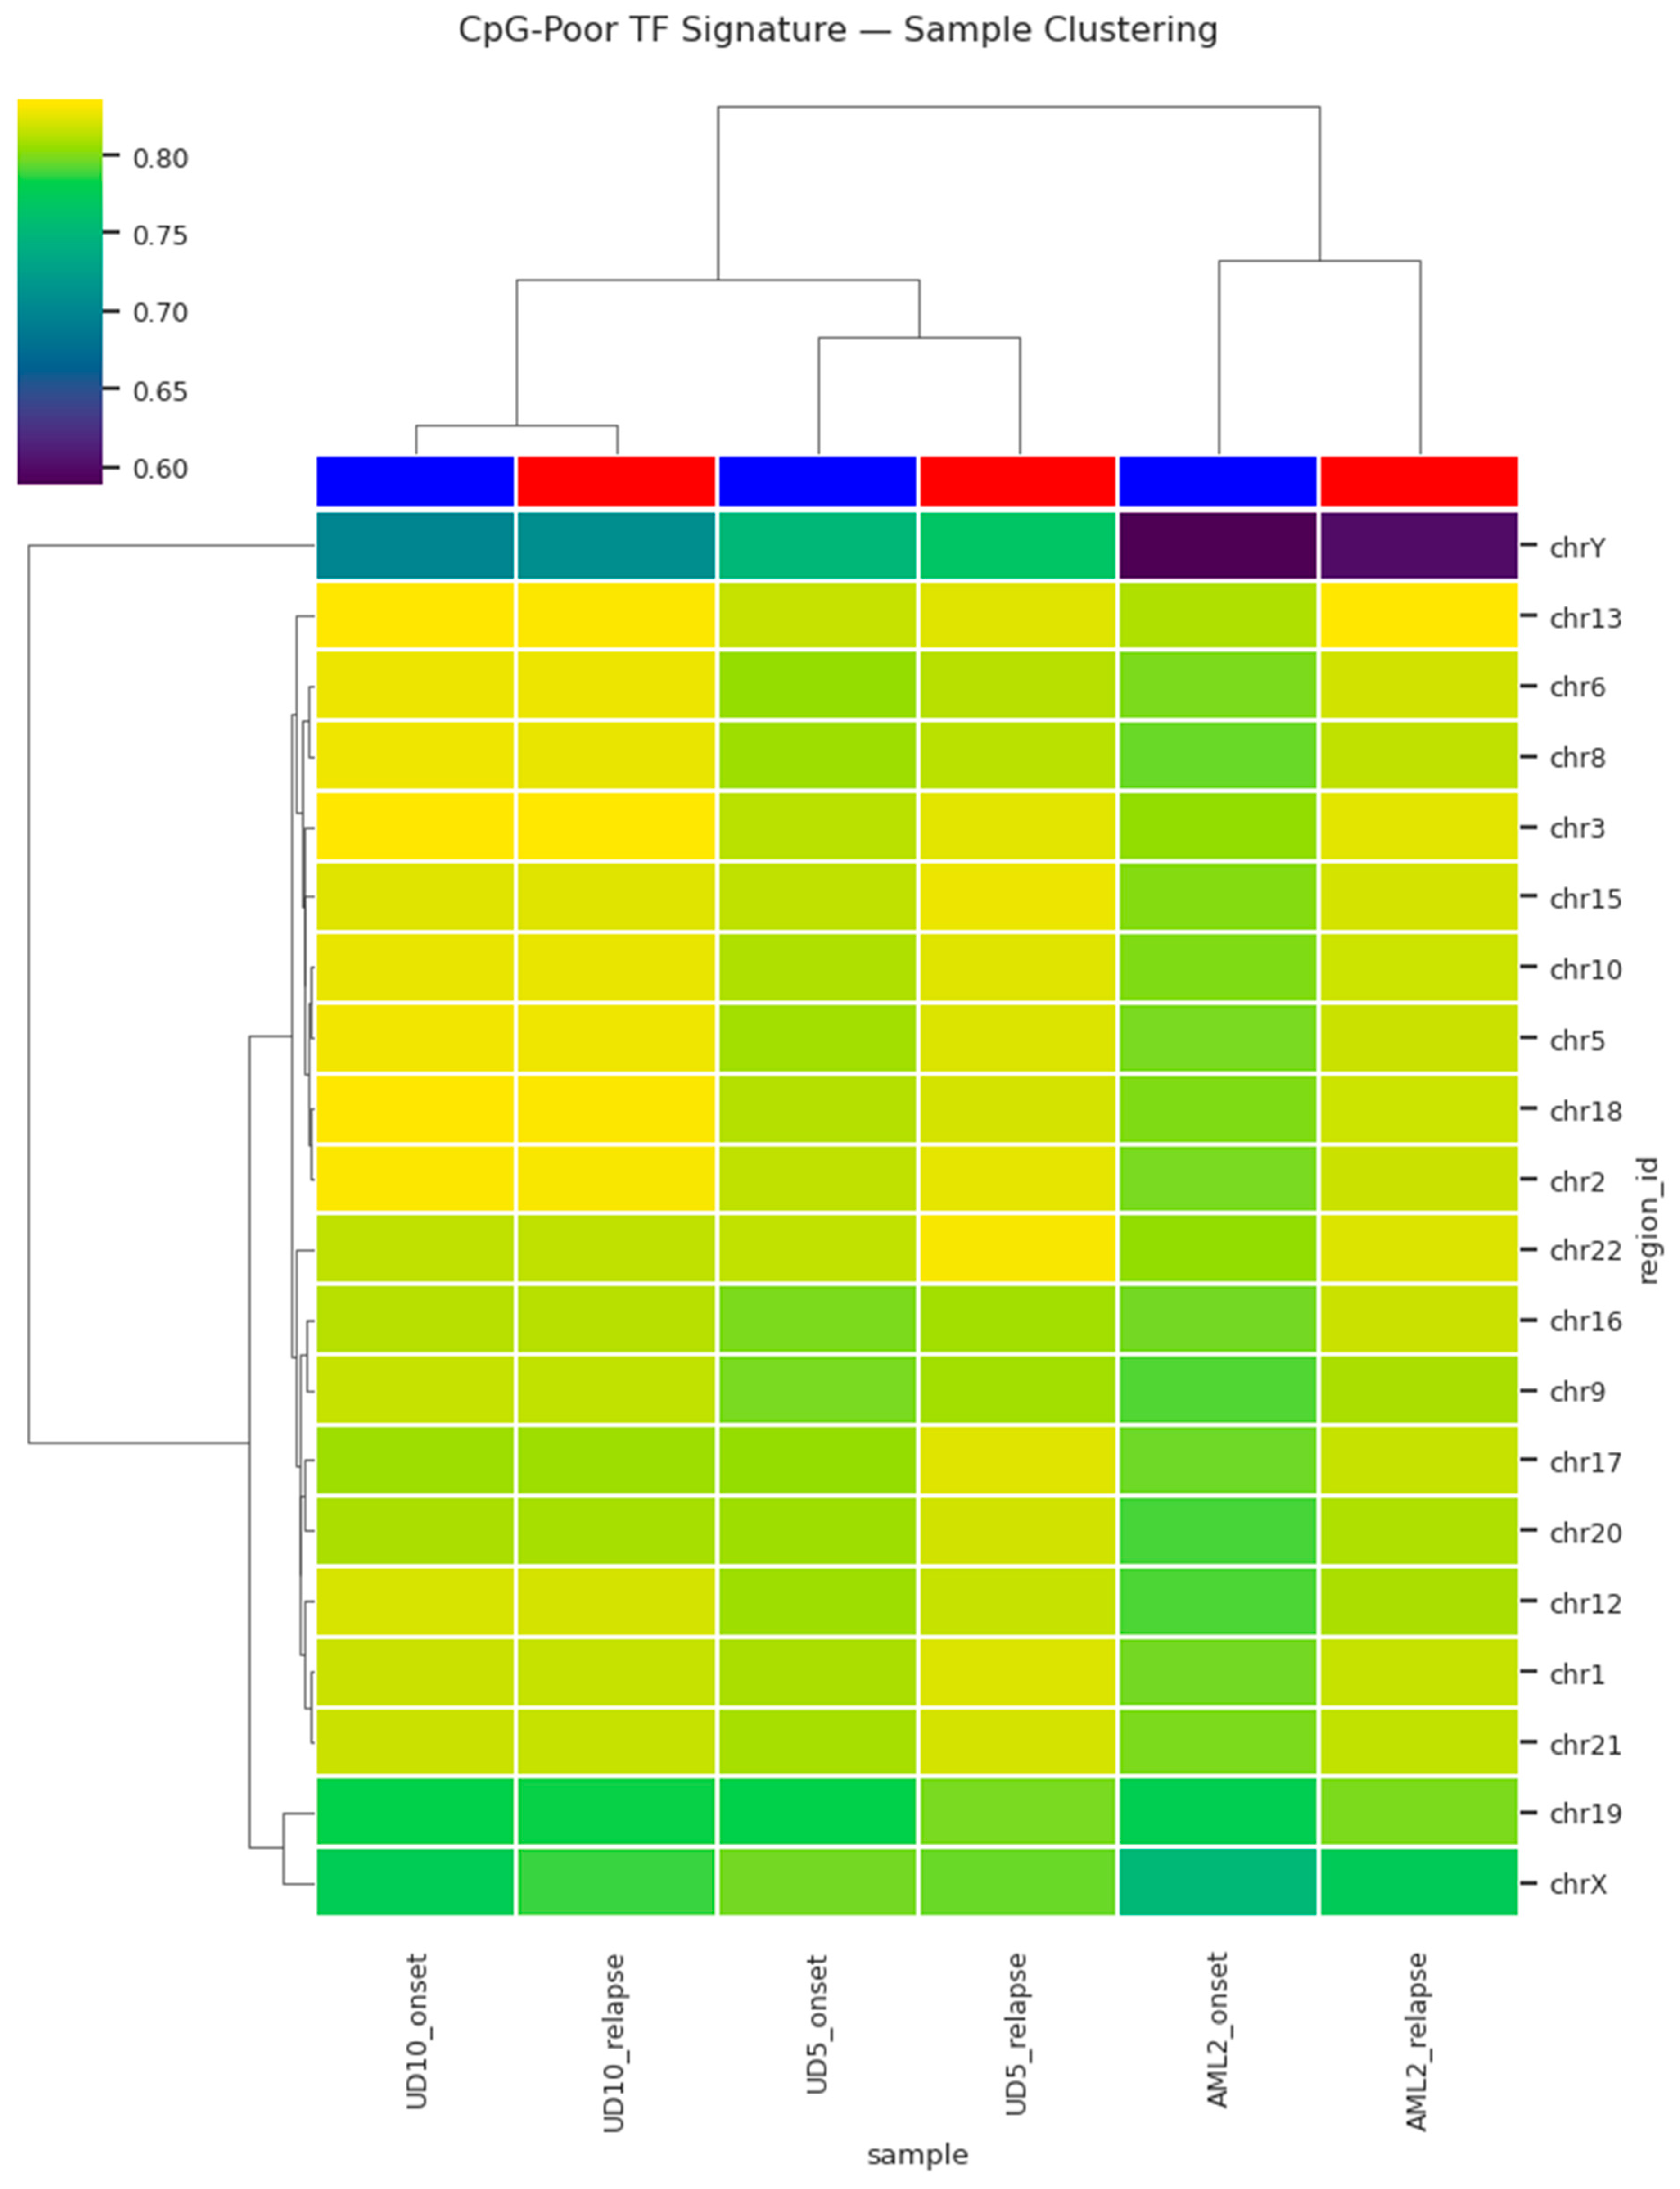
To evaluate whether these changes reflect a structured relapse-specific epigenetic state rather than sample-to-sample variability, hierarchical clustering was applied. This analysis revealed distinct grouping of relapse samples separate from onset samples based on methylation profiles of the CpG-poor TF regions (
Figure 3). The clustering reflected methylation signature similarity rather than patient identity, suggesting the emergence of a unified relapse-associated epigenetic state. A second visualization highlighting methylation intensities stratified by clustering further reinforced the separation, confirming the presence of a relapse-specific methylation signature. Collectively, these observations support a model in which relapse AML acquires coordinated hypermethylation in transcriptionally regulatory CpG-poor regions, potentially contributing to treatment resistance and clonal progression.
4. Discussion
The present analysis provides evidence that AML relapse is associated with a coordinated gain in DNA methylation within CpG-poor transcription factor–associated genomic regions. While promoter-associated CpG island methylation has long been recognized as a hallmark of leukemogenesis [
4,
5,
6], these findings extend current understanding by demonstrating that relapse-specific epigenetic remodeling occurs within non-canonical, CpG-sparse regulatory elements. This aligns with emerging literature suggesting enhancer-level and low-density regulatory methylation shifts may be critical for transcriptional rewiring in cancer progression [
7,
8,
12].
The consistent directionality of hypermethylation across all examined regions (
Figure 1) supports the hypothesis that relapse reflects a selective evolutionary bottleneck rather than passive epigenetic drift. The ability of the top ranked CpG-poor regions to clearly separate onset and relapse samples (
Figure 2,
Figure 3 and Figure 4) suggests that relapse AML converges toward a shared epigenetic state. Cluster-level separation across patients (
Figure 3 and Figure 4) further implies that relapse-associated methylation changes may serve as a pan-relapse feature of AML biology, potentially independent of genetic background.
Mechanistically, CpG-sparse TF regions function as regulatory scaffolds for transcriptional hierarchies governing apoptosis, DNA damage repair, cell identity, and hematopoietic lineage programs [
9,
15,
16,
17]. Increased methylation at these loci may impede transcription factor binding, reduce chromatin accessibility, and restrict transcriptional plasticity, thereby supporting chemoresistance and persistence under treatment pressure [
18,
19]. This model is consistent with evidence that relapse AML exhibits increased stem-like transcriptional signatures and reduced apoptotic response [
14,
15,
16].
The translational implications of this work are noteworthy. Oxford Nanopore sequencing provides methylation detection in real time [
10,21], raising the possibility that relapse-associated epigenetic evolution could be monitored longitudinally during treatment. A validated CpG-poor methylation score may therefore act as an early-warning signal of chemoresistant clonal expansion, preceding clinical relapse.
However, this exploratory study has limitations. The small cohort restricts generalizability and prevents robust statistical modeling. Functional validation of transcriptional consequences was beyond scope and should be prioritized in future studies. Longitudinal sampling and integration with ATAC-seq, RNA-seq, and mutational analyses will be essential for mechanistic validation. Despite these constraints, our findings support the hypothesis that CpG-poor methylation remodeling represents a relapse-associated epigenetic program in AML and may serve as a foundation for biomarker development or therapeutic targeting.
Conclusion
The results from this pilot analysis suggest that relapse in AML may be driven in part by noncanonical epigenetic remodeling, specifically hypermethylation of CpG-poor regions that regulate transcriptional control networks. This coordinated shift may suppress cellular checkpoints needed for apoptosis and DNA repair, thereby supporting therapeutic escape. The ability of Nanopore sequencing to detect these changes at base-level and potentially in near real time opens new opportunities for precision monitoring and adaptive therapeutic decision-making in AML management.
Acknowledgements
The author acknowledges Gabriela Torres de Queiroz, Computer science engineer for providing assistance with the software (Visual studio code) and Ankitha Kaup, Computer science Engineer for Python code validation,
References
- Döhner, H., Weisdorf, D. J., & Bloomfield, C. D. (2015). Acute myeloid leukemia. New England Journal of Medicine, 373(12), 1136–1152. [CrossRef]
- Estey, E. H., & Döhner, H. (2006). Acute myeloid leukemia. The Lancet, 368(9550), 1894–1907. [CrossRef]
- Klco, J. M., Miller, C. A., Griffith, M., et al. (2015). Association between mutation clearance after induction therapy and outcomes in acute myeloid leukemia. JAMA, 314(3), 311–322. [CrossRef]
- Figueroa, M. E., Lugthart, S., Li, Y., et al. (2010). DNA methylation signatures identify biologically distinct subtypes in acute myeloid leukemia. Cancer Cell, 17(1), 13–27. [CrossRef]
- Ley, T. J., Miller, C., Ding, L., et al. (2013). Genomic and epigenomic landscapes of adult de novo acute myeloid leukemia. New England Journal of Medicine, 368(22), 2059–2074. [CrossRef]
- Bullinger, L., Döhner, K., Kranz, R., et al. (2017). Genomics of acute myeloid leukemia. Blood, 129(6), 679–691. [CrossRef]
- Lea, A. J., Vockley, C. M., Johnston, R. A., et al. (2018). Genome-wide quantification of DNA methylation variation. Proceedings of the National Academy of Sciences, 115(31), E7109–E7118. [CrossRef]
- Suzuki, M. M., & Bird, A. (2008). DNA methylation landscapes. Nature Reviews Genetics, 9(6), 465–476. [CrossRef]
- Whyte, W. A., Orlando, D. A., Hnisz, D., et al. (2013). Master transcription factors and super-enhancers in development and disease. Cell, 153(2), 307–319. [CrossRef]
- Simpson, J. T., Workman, R. E., Zuzarte, P. C., et al. (2017). Detecting DNA methylation using nanopore sequencing. Nature Methods, 14(4), 407–410. [CrossRef]
- Gene Expression Omnibus. (2022). GSE213685 dataset. https://www.ncbi.nlm.nih.gov/geo/query/acc.cgi?acc=GSE213685.
- Qu, J., Li, F., Helms, E., et al. (2022). Epigenetic drift contributes to relapse evolution in acute myeloid leukemia. Nature Communications, 13, Article 519. [CrossRef]
- Köster, J., & Rahmann, S. (2012). Snakemake: A scalable bioinformatics workflow engine. Bioinformatics, 28(19), 2520–2522. [CrossRef]
- Shlush, L. I., Mitchell, A., Heisler, L., et al. (2017). Tracing the origins of relapse in AML. Nature, 547(7661), 484–488. [CrossRef]
- Pabst, T., & Müller, B. U. (2007). Transcription factor dysregulation in acute myeloid leukemia. Annals of Hematology, 86(6), 393–405. [CrossRef]
- Levine, R. L., & Gilliland, D. G. (2008). Stem-like characteristics of relapse AML cells. Nature Medicine, 14(10), 1015–1016. [CrossRef]
- Hnisz, D., Abraham, B. J., Lee, T. I., et al. (2013). Super-enhancers in cell identity and disease. Cell, 155(4), 934–947. [CrossRef]
- Keenan, C., Coates, P., Nasrallah, R., et al. (2019). Epigenetic mechanisms of therapy resistance. Nature Reviews Cancer, 19(5), 279–292. [CrossRef]
- Challen, G. A., Sun, D., Jeong, M., et al. (2014). Epigenetic memory and hematopoiesis. Cell Stem Cell, 14(6), 810–822. [CrossRef]
- Mirzaei, R., Parhizkar, R., & Ghasemi, A. (2021). DNA methylation and relapse biology in AML. Frontiers in Oncology, 11, 668. [CrossRef]
|
Disclaimer/Publisher’s Note: The statements, opinions and data contained in all publications are solely those of the individual author(s) and contributor(s) and not of MDPI and/or the editor(s). MDPI and/or the editor(s) disclaim responsibility for any injury to people or property resulting from any ideas, methods, instructions or products referred to in the content. |
© 2025 by the authors. Licensee MDPI, Basel, Switzerland. This article is an open access article distributed under the terms and conditions of the Creative Commons Attribution (CC BY) license (http://creativecommons.org/licenses/by/4.0/).