Preprint
Article

This version is not peer-reviewed.

Optimising Vaginal Microbiome Profiling for Clinical Translation: A Comparative Assessment of Sample Storage Methods and a Vagina-Specific 16S rRNA Gene Database

Submitted:

29 November 2025

Posted:

03 December 2025

You are already at the latest version

Abstract

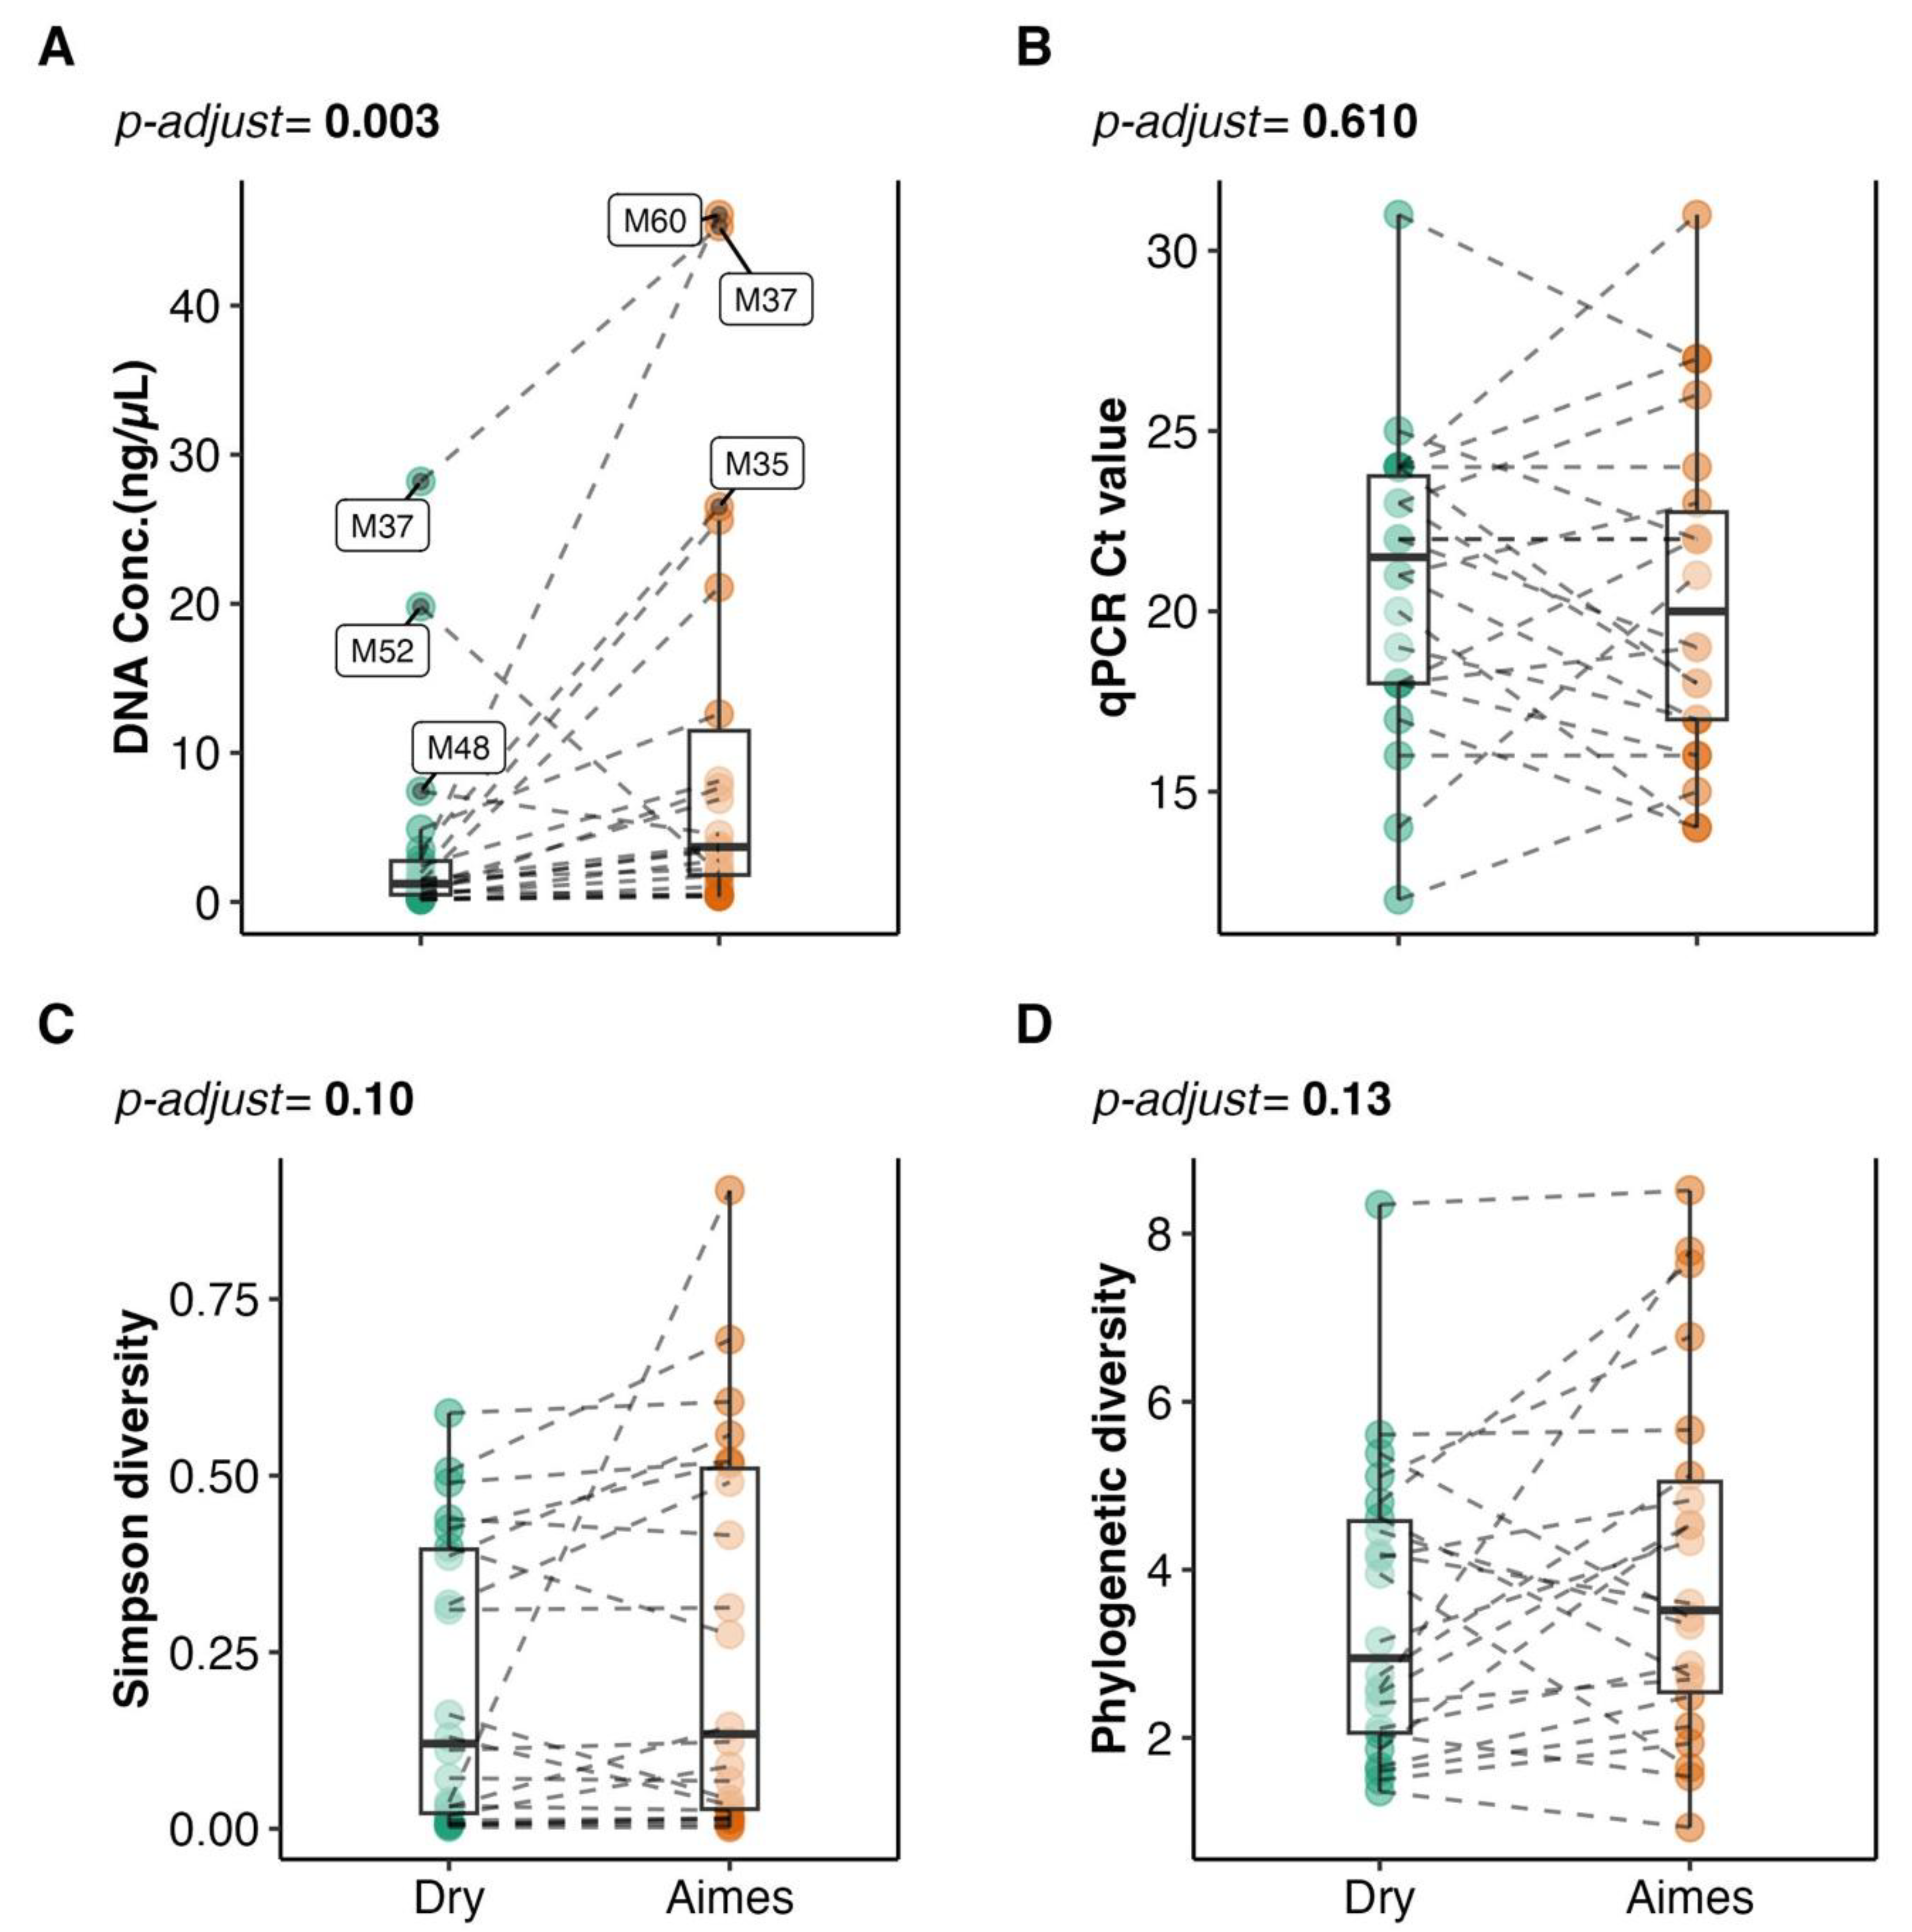
Vaginal microbiome composition has been linked to risk of preterm birth (PTB), a persistent global health challenge. 16S rRNA microbial profiling has identified specific vaginal community state types (CSTs) that have been associated with PTB risk. Diagnostic profiling requires standardised pre-analytical protocols. We evaluated two storage methods and validated a curated, vagina-specific 16S rRNA gene database (VagDB) to enhance annotation. Paired Copan FLOQ swabs from 22 women at high PTB risk were processed for either (a) dry/immediate freezing or (b) Amies-stabilisation/refrigeration. Amplicon sequence variants were generated via 16S rRNA gene (V4) PCR and Illumina sequencing. We assessed diversity, composition, and community state type (CST) allocation. Amies-stabilised samples yielded significantly higher DNA (p = 0.003), but this did not alter species richness, evenness, or community structure. VagDB enhanced species-level resolution. PCoA showed robust clustering by participant and CST (p < 0.001), irrespective of storage; CST concordance exceeded 90%. Routinely collected vaginal swabs in stabilisation medium with an 8–72-hour refrigeration window yields reliable data, supporting the integration of vaginal microbiome profiling into clinical PTB risk assessment.

Keywords: 
;  ;  ;  ;  ;  ;  

1. Introduction

The human cervicovaginal microbiome (CVM) plays a critical role in maintaining vaginal health and reproductive success [1]. A balanced CVM, often characterised by low microbial diversity and dominance by Lactobacillus species, contributes to a protective acidic environment that inhibits the growth of pathogens and reduces the risk of ascending intrauterine infection during pregnancy. Conversely, vaginal dysbiosis, characterised by a reduction in Lactobacillus abundance and an increase in microbial diversity, has been associated with adverse reproductive health outcomes, including increased susceptibility to sexually transmitted infections (STIs), pelvic inflammatory disease, and, importantly, preterm birth (PTB) [2,3].
In seminal work, Ravel and colleagues first established using 16S rRNA profiles that there were five distinct vaginal community state types (CSTs) in a multiethnic cohort of reproductive-age women [2]. These CSTs are broadly characterised by the dominance of specific Lactobacillus species (CST-I: L. crispatus; CST-II: L. gasseri; CST-III: L. iners; CST-V: L. jensenii) or by a diverse community of primarily anaerobic bacteria (CST-IV), often associated with bacterial vaginosis (BV) [4]. These CST classifications have proven remarkably robust across numerous studies, diverse populations, and varying sequencing methodologies [3,4,5,6,7,8,9,10,11,12,13,14,15,16,17].
Recent research has increasingly focused on the role of the CVM in the context of PTB, a leading cause of neonatal morbidity and mortality worldwide, affecting ~5–15% of deliveries depending on socio-geographic location [4,8,15,16,18,19,20,21,22,23]. Studies have consistently shown that the presence of CST-IV, and to a lesser extent CST-III (dominated by L. iners), during early pregnancy is associated with an increased risk of PTB [4,24,25,26]. This highlights the potential clinical utility of CST determination as a prognostic tool for identifying pregnancies at high risk of PTB. First-trimester screening offers the opportunity for early intervention and potentially improved outcomes [4,27,28].
Despite the growing appreciation of the importance of the CVM, translating microbiome analysis into diagnostic risk profiling has been hampered by several factors. These include the cost of sequencing-based analyses, lack of capacity for providing rapid results, and technical challenges related to sample collection, storage, and data analysis [29]. Unresolved issues at the critical steps of sample collection and storage can introduce biases and affect the accuracy of microbiome profiling [29,30,31,32,33], and because of low microbial biomass and high host DNA content, vaginal samples are particularly susceptible to such biases [21,34,35,36]. Furthermore, the lack of comprehensive, vagina-specific reference databases has historically limited the accuracy of genetic taxonomic assignments, hindering species-level resolution [3].
To mitigate such biases, best-practice recommendations often advocate for immediate freezing of cervicovaginal swabs at −80 °C after collection, prior to DNA extraction and sequencing [30,31]. However, this requirement presents significant logistical challenges for large-scale clinical implementation and epidemiological studies, particularly in resource-limited settings and/or when samples are collected at home or in remote locations. Commercially available stabilisation media, such as the Copan ESwab system with Amies transport medium, offer a potential solution. These systems are designed to preserve bacterial viability while inhibiting overgrowth or lysis, allowing for storage at refrigerated temperatures (4 °C) for several days prior to sample processing [31,37,38].
Previous studies have investigated the impact of sample storage conditions on the vaginal microbiome, but with some limitations. Bai and colleagues compared immediately processed ESwabs to those frozen for 4–6 weeks, but did not compare preservation medium to a dry, immediate-freeze condition [38]. Mattei and colleagues compared DNA extraction methods from ESwabs but did not assess the impact of storage in the preservation medium itself [36]. Thus, a crucial knowledge gap remains: the direct comparability between immediate freezing of dry swabs and preservation in medium.
A further unresolved issue in vaginal microbiome research is the accuracy when relying on generalist 16S rRNA gene databases for taxonomic assignment. Databases such as Greengenes, Silva, and even the Ribosomal Database Project (RDP) are comprehensive but often lack the resolution and specificity required to accurately identify key vaginal bacterial species, particularly within the complex Lactobacillus genus, but also amongst anaerobic taxa commonly associated with vaginal dysbiosis [39,40,41,42]. Many vaginal bacteria are closely related, sharing high degrees of 16S rRNA gene sequence similarity, making differentiation based on short hypervariable regions (like V4) challenging [43,44]. This can lead to misclassification or assignment to higher taxonomic levels (e.g., genus or family) rather than the species level, hindering our ability to fully understand the functional roles of specific bacteria in health and disease [12,45,46,47].
Recent efforts, such as the Vaginal Microbial Genome Collection (VMGC) and VIRGO projects have focused on developing curated, environment-specific databases to improve taxonomic resolution in vaginal microbiome studies [14,45]. They have developed a more comprehensive gene catalogue and reference genomes, significantly improving the accuracy of taxonomic and functional profiling in metagenomic studies. In this context, shotgun metagenomics approaches have been increasingly used as they can overcome some of the limitations of 16S rRNA gene sequencing [48]. This approach even in shallow sequencing depth allows for a more accurate identification of vaginal bacteria for better understanding of functional potential of the microbiota [49]. However, it remains cost prohibitive, computationally demanding and time consuming, making it unlikely to be adopted clinically in the short term [32,48,50].
The present study was undertaken to directly compare the impact of sample stabilisation in Amies medium (with 72-hour refrigeration) versus immediate freezing (dry swab) on the determination of vaginal community composition using 16S rRNA gene sequencing. The primary aim was to provide practical clinical and research guidance on optimal sample collection and preservation methods for vaginal microbiome studies. A secondary aim was to develop and explore the efficacy of a curated, vagina-specific bacterial species database to improve 16S rRNA taxonomic assignments, particularly for indicator species relevant to PTB risk.

2. Materials and Methods

2.1. Participants

Twenty-two women were randomly selected from a larger cohort of 244 participants enrolled in the Western Australian Pregnancy Biobank (WAPB) at King Edward Memorial Hospital (KEMH) in Perth, Western Australia. The WAPB is part of a multi-omics characterisation study of pregnancies at high risk of PTB. All participating women provided written informed consent, and the study was approved by the Women and Newborn Health Service Human Research Ethics Committee (EC00350) (RGS0000000705) and the Curtin University Human Research Ethics Committee (HRE2018-0071).

2.2. Sample Collection

Cervicovaginal (CV) swabs were collected by a trained WAPB research midwife using a speculum during a routine visit to the KEMH Preterm Birth prevention clinic in the first trimester (9–16 weeks’ gestation). Speculum-assisted collection was employed to minimise potential contamination from the vulva and to ensure consistent sampling of the exocervix. Two pairs of exocervical Copan FLOQSwabs (Copan Diagnostics, Murrieta, CA, USA) were obtained simultaneously from each participant. One pair of swabs, designated as "dry and immediate" (DI), was immediately cut to fit into sterile 0.75 mL internal thread cryotubes (Micronic, Lelystad, Netherlands). These tubes were then immediately transferred to a −80 °C freezer for long-term storage. The second pair of swabs, designated as "stabilised and refrigerated" (SR), was immediately placed into the provided Copan ESwab tubes containing 1 mL of Amies transport medium. The swabs were vortexed vigorously to release the collected material into the medium. The Amies medium was then split into two equal aliquots (approximately 450 µL each) and transferred to 0.75 mL internal thread cryotubes. These aliquots were refrigerated at 4 °C for up to 72 hours before being transferred to long-term storage at −80 °C.

2.3. DNA Extraction

A total of 44 CV swabs (22 DI and 22 SR, matched to the 22 study participants) were retrieved from −80 °C storage for DNA extraction. For the DI swabs, 700 µL of sterile phosphate-buffered saline (PBS) was added directly to the cryotubes containing the frozen swab tips. The tubes were vortexed vigorously to dislodge biological material from the swabs prior to extraction and processing.
For both DI and SR samples, an unused sterile swab was processed alongside as an extraction control. This control swab was either washed with PBS (for DI) or Amies fluid (for SR). All samples (including controls) were then centrifuged at 13,000 RCF for 5 minutes to pellet the cellular material. DNA was extracted from the pelleted material using the PowerFecal DNA Isolation Kit (QIAGEN, Germany) on a QIACube automated platform (QIAGEN), following the manufacturer’s instructions with minor modifications. Briefly, the resuspended pellets were subjected to mechanical lysis using a TissueLyser II (QIAGEN) at 30 cycles/min for 5 minutes, repeated twice with inversion of the sample between cycles. DNA was eluted in approximately 80 µL of elution buffer. DNA concentrations were quantified using a Qubit 3.0 Fluorometer (Thermo Scientific, Australia) with the Qubit dsDNA HS Assay Kit. DNA extracts were also assessed for PCR inhibitors (see below) and stored at −20 °C until library preparation.
2.4. qPCR Screening
To assess the relative amount of amplifiable bacterial DNA and to detect the presence of PCR inhibitors, a real-time quantitative PCR (qPCR) assay was performed on all DNA extracts. The qPCR targeted the V4 hypervariable region of the 16S rRNA gene, using the broadly conserved primers recommended by the Earth Microbiome Project (EMP): 515F (5'-GTGCCAGCMGCCGCGGTAA-3') and 806R (5'-GGACTACHVGGGTWTCTAAT-3') [42,43].
qPCR reactions were carried out in 25 µL volumes, containing: 2 mM MgCl2 (Applied Biosystems Inc. [ABI], USA), 4U/µL AmpliTaq Gold DNA Polymerase (ABI), 1X Taq polymerase buffer (ABI), 0.4 µM dNTPs (Astral Scientific, Australia), 0.1 mg/mL bovine serum albumin (BSA; Fisher Biotec, Australia), 0.2X SYBR Green (Invitrogen, USA), 0.4 µM of each primer (Integrated DNA Technologies [IDT], Australia), and 4 µL of DNA template (either undiluted or diluted 1:2).
The qPCR cycling conditions were as follows: initial denaturation at 95 °C for 5 minutes, followed by 35 cycles of 95 °C for 30 seconds, 54 °C for 30 seconds, and 72 °C for 30 seconds, with a final extension at 72 °C for 10 minutes. Reactions were performed on a StepOnePlus Real-Time PCR System (ABI). Samples that did not amplify adequately (defined as a cycle threshold [Ct] value greater than 32 which is the lowest Ct value produced by a control sample) were not progressed to library preparation, even if DNA was detectable by Qubit.

2.5. Amplicon Generation and Sequencing

The EMP V4 primers (515F/806R) were modified to include a unique seven-base pair barcode sequence on the 3' end of the 806R primer, allowing for post amplification multiplexing. A combinatorial barcoding approach was used. The same qPCR reaction mixture described above was used. Reactions containing uniquely barcoded reverse primers were run for each sample using the StepOne plus with the same conditions described. Extraction controls, non-template PCR controls (NTCs), and an evenly distributed mock community (MSA-1002, ATCC, USA), consisting of 20 bacterial species, were included to evaluate PCR bias and potential contamination.
Samples with robust amplification (Ct < 32) were first pooled into "mini pools" of approximately equal amplicon concentrations (within a 5000 deltaRN range). These mini pools were then purified using a QIAquick PCR Purification Kit (Qiagen) according to the manufacturer’s instructions. The purified, tagged amplicons were eluted in 32 µL of elution buffer (EB) and quantified using a Qubit 3.0 Fluorometer. Finally, the mini pools were combined in equimolar concentrations to create a single library for sequencing.
To minimise PCR amplification bias, a PCR-free library preparation approach was employed. The NxSeq AmpFREE Low DNA Library Kit (Lucigen, CA, USA) was used to ligate Illumina P5, P7, and TruSeq sequencing adapters to the barcode-tagged amplicons, following the manufacturer’s instructions. Briefly, after ensuring a minimum of 100 ng of amplified DNA in each sample pool, the ligation reaction was performed. The ligated products were purified using the QIAquick PCR Purification Kit, eluted in 32 µL of EB, and size-selected using a Pippin Prep 2% agarose gel cassette (Sage Science, USA) to remove any residual adapter dimers or non-specifically ligated products. The size-selected amplicon pool was purified again (QIAquick PCR Purification) to remove residual ethidium bromide and eluted in 40 µL of EB. The final library was visualised and quantified using a QIAxcel capillary electrophoresis instrument (Qiagen) and a Qubit 3.0 Fluorometer.
The final amplicon library was sequenced on an Illumina MiSeq platform at the Trace and Environmental DNA Laboratory (TrEnD Lab) at Curtin University using paired-end 2x250bp reads with a 500-cycle V2 reagent kit and a standard flow cell, following the manufacturer’s protocols.

2.6. Bioinformatics

Preprocessing: Raw FASTQ files were downloaded and demultiplexed using the gotta split command from the SHI7 package [51]. Demultiplexed FASTQ files were assessed for quality and integrity using the FASTQC tool, as implemented in the fastqc r package. After manual inspection and quality assessment, the FASTQ files were further processed to remove all introduced non-biological sequences, including ligated adapters, barcodes, and primers. This was achieved using Cutadapt version 2.10 [52], with all possible primer sequence variants (including those with ambiguous base calls) provided as input. Cutadapt was configured to search for matches at both the 5' and 3' ends of the reads. Then primer-free reads were processed using the DADA2 pipeline (version 1.18) in R (version 4.1.0) to generate an amplicon sequence variant (ASV) table [29,53], refer to Supplementary Table S1.
Vaginal-Specific Database Development: To improve the accuracy of taxonomic assignments, we developed a curated, vagina-specific 16S rRNA gene database. To construct this database, referred to as VagDB, we leveraged the Genome Taxonomy Database release 207 (GTDBr207), a comprehensive and phylogenetically robust resource, as our primary source of reference sequences [54] which we have further formatted and made available publicly to be used for the DADA2 pipeline database found here https://zenodo.org/records/6655692. The VagDB construction began by compiling a list of 582 bacterial species previously reported to be present in the human vagina [3]. Using this species list, we extracted the corresponding 16S rRNA gene sequences from the GTDBr207 database. The extracted sequences were formatted to be compatible with the DADA2 assignTaxonomy and addSpecies functions. This involved creating a FASTA file containing the sequences and a separate taxonomy file mapping each sequence to its corresponding taxonomic lineage (Kingdom, Phylum, Class, Order, Family, Genus, Species). We used Silva database release 138 to cross-reference taxonomy assignations, employing the GTDB taxonomic nomenclature. The VagDB database is publicly available at https://zenodo.org/records/17452627.
Mock Community Analysis: To assess the robustness of our PCR workflows, we included a mock community sample. Resulting ASV generated through our bioinformatic pipeline was searched against the known composition of the ATCC 1002 20 species mock community [55]. A DADA2 formatted GTDB extracted 16S rRNA sequences can be found here https://zenodo.org/records/4781067.
CST Profile Determination and Allocation: Vaginal community state types (CSTs) were assigned to each sample using the VALENCIA (VAginal Community State Type Nearest Centroid ClassifiEr) method. VALENCIA is a nearest-centroid classifier that assigns samples to predefined CSTs based on their overall taxonomic composition. We used the updated VALENCIA reference database, which includes 13 sub-CSTs, providing finer-grained resolution than the original five CSTs defined by Ravel et al. [2,56] (Supplementary Table S2).

2.7. Statistical Analysis

All data exploration, statistical analyses, and visualisations were performed primarily using R (version 4.1.0) and the phyloseq package (version 1.38.0) [57]. A reproducible R Markdown document containing the complete analysis pipeline is available (Supplementary file). The decontam R package (version 1.14.0) was used to identify and remove potential contaminant ASVs, using the "combined" method, which considers both the frequency of ASVs in samples and their prevalence in negative controls [58].
Alpha diversity metrics (Shannon diversity and phylogenetic diversity) were calculated at the ASV level using the vegan (version 2.5-7) and picante (version 1.8.2) R packages. Prior to alpha diversity calculations, ASVs with zero counts across all samples were removed. Differences in alpha diversity between the two storage conditions (DI and SR) were assessed using paired Wilcoxon signed-rank tests, with Bonferroni correction for multiple comparisons. The ggstatsplot R package (version 0.9.0) was used for statistical testing and visualisation [59].
Beta diversity, reflecting the differences in community composition between samples, was calculated using the Bray-Curtis dissimilarity metric on species-level, proportion-normalised data. Principal Coordinates Analysis (PCoA) was performed using the phyloseq package to visualise the beta diversity patterns. Permutational Multivariate Analysis of Variance (PERMANOVA) using the adonis function in the vegan package was used to test for significant differences in community composition between storage conditions, with 999 permutations.

3. Results

3.1. Impact of Storage Condition on DNA Yield and PCR Amplification

A total of 48 samples was sequenced, including 44 vaginal swabs (22 DI and 22 AS), two extraction blanks (one for each storage condition), one non-template PCR control (NTC), and one ATCC mock community sample. All samples, except for the extraction blanks and NTC, had detectable DNA concentrations, defined as a Qubit dsDNA concentration greater than 0.1 ng/µL.
As shown in Figure 1A, the mean DNA concentration was significantly higher in the AS samples compared to the DI samples (p = 0.003, paired Wilcoxon signed-rank test). This difference is likely attributable to the more efficient release of biological material from the swab tip in the liquid Amies medium compared to the dry-frozen swab, where material may have adhered more strongly to the swab tip.
Despite the difference in DNA yield, all barcoded samples, except for the extraction blanks and NTC, amplified successfully during the initial qPCR screening (Figure 1B). Ct values were not significantly different between the DI and AS groups (p = 0.610, paired Wilcoxon signed-rank test), indicating that the storage condition did not substantially impact PCR amplification efficiency.

3.2. Sample Read Counts and Alpha Diversity Comparisons

After demultiplexing, a total of 4,705,194 reads were obtained across the 48 samples. Following quality filtering, processing, and removal of reads from the extraction blanks and NTC, 81% of the initial reads (3,814,012) remained. The minimum number of reads per sample was 19,836, the maximum was 255,012, and the mean was 86,682. These reads were distributed across 330 ASVs, representing putative bacterial species. Approximately 13% of the ASVs (represented by only 63 reads) were identified as singletons or doubletons. ASVs that were preferentially detected in the negative controls and clearly not of human vaginal origin were identified as contaminants and removed from the dataset prior to downstream analyses. Analysis of the mock community sample revealed that 19 out of the 20 expected species were successfully detected, demonstrating the sensitivity of the PCR and sequencing approach (Supplementary Figure S1).
Despite the significant difference in DNA yield between the DI and AS samples, there were no statistically significant differences in alpha diversity metrics (Shannon diversity and phylogenetic diversity) between the two storage groups (p ≥ 0.01, paired Wilcoxon signed-rank tests with Bonferroni correction). Figure 1C shows the Simpson alpha diversity index, and Figure 1D shows Faith's phylogenetic diversity index. Although not statistically significant, a trend towards slightly greater richness in the AS group was observed.

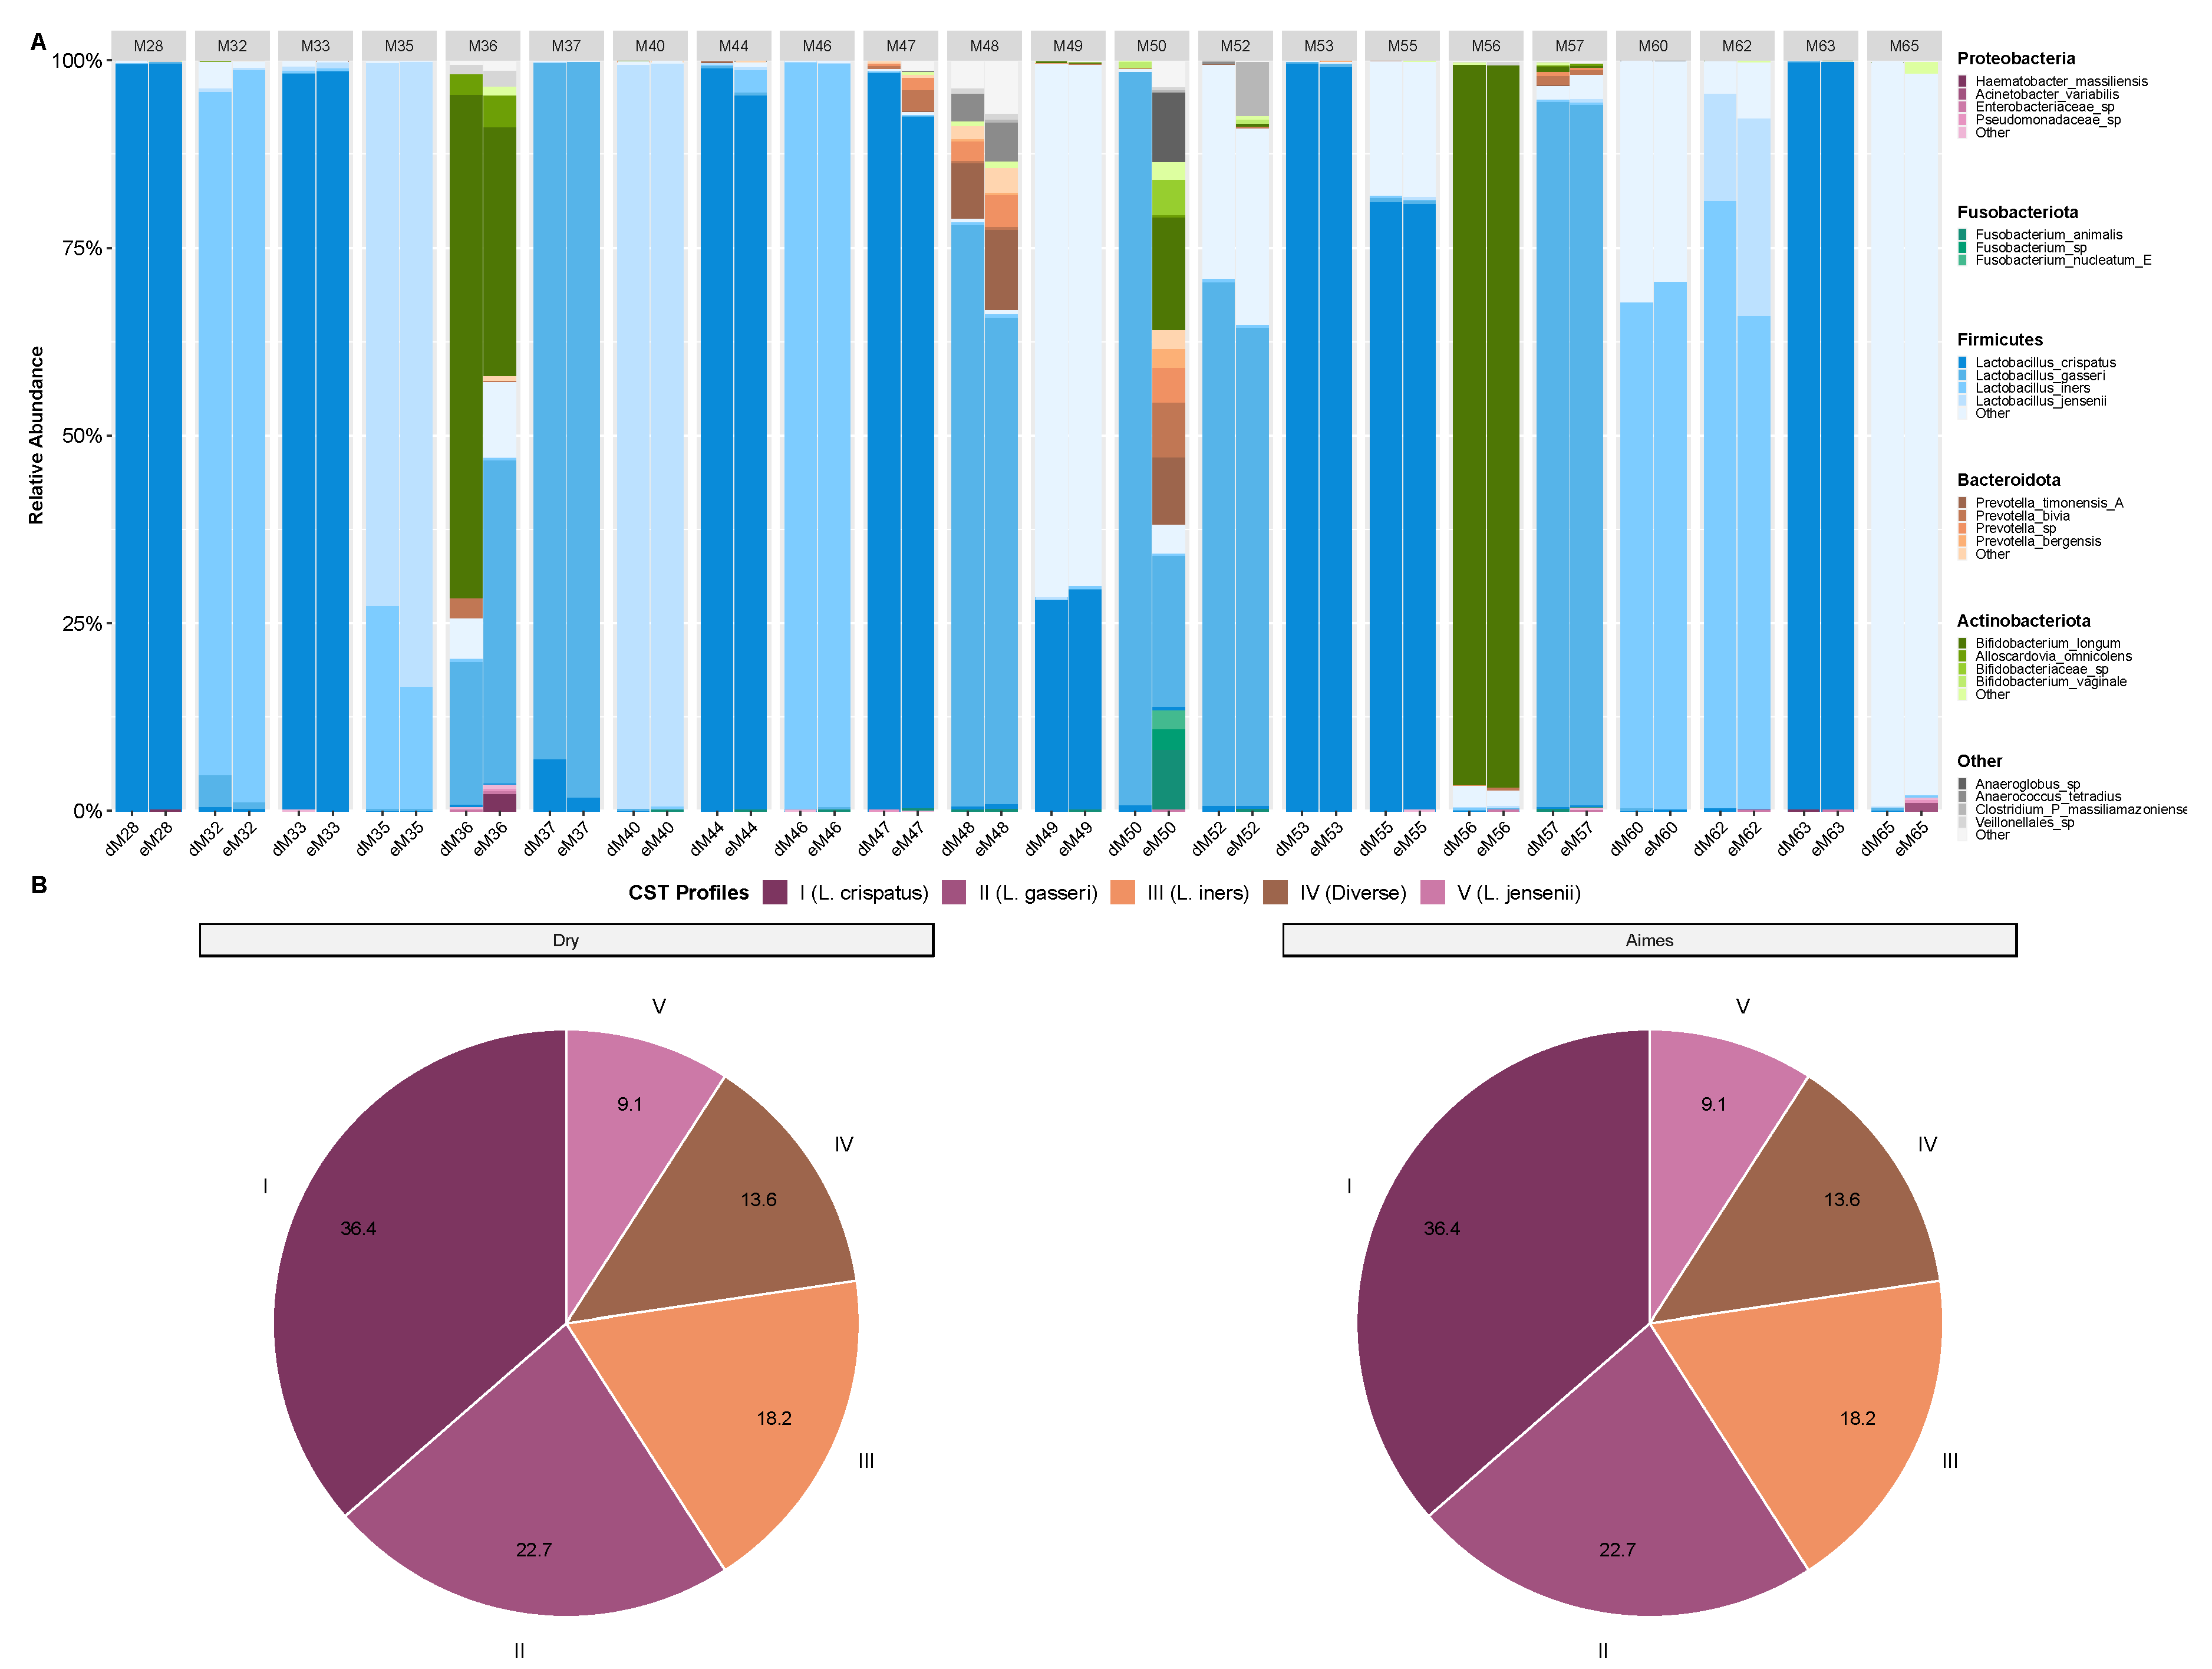
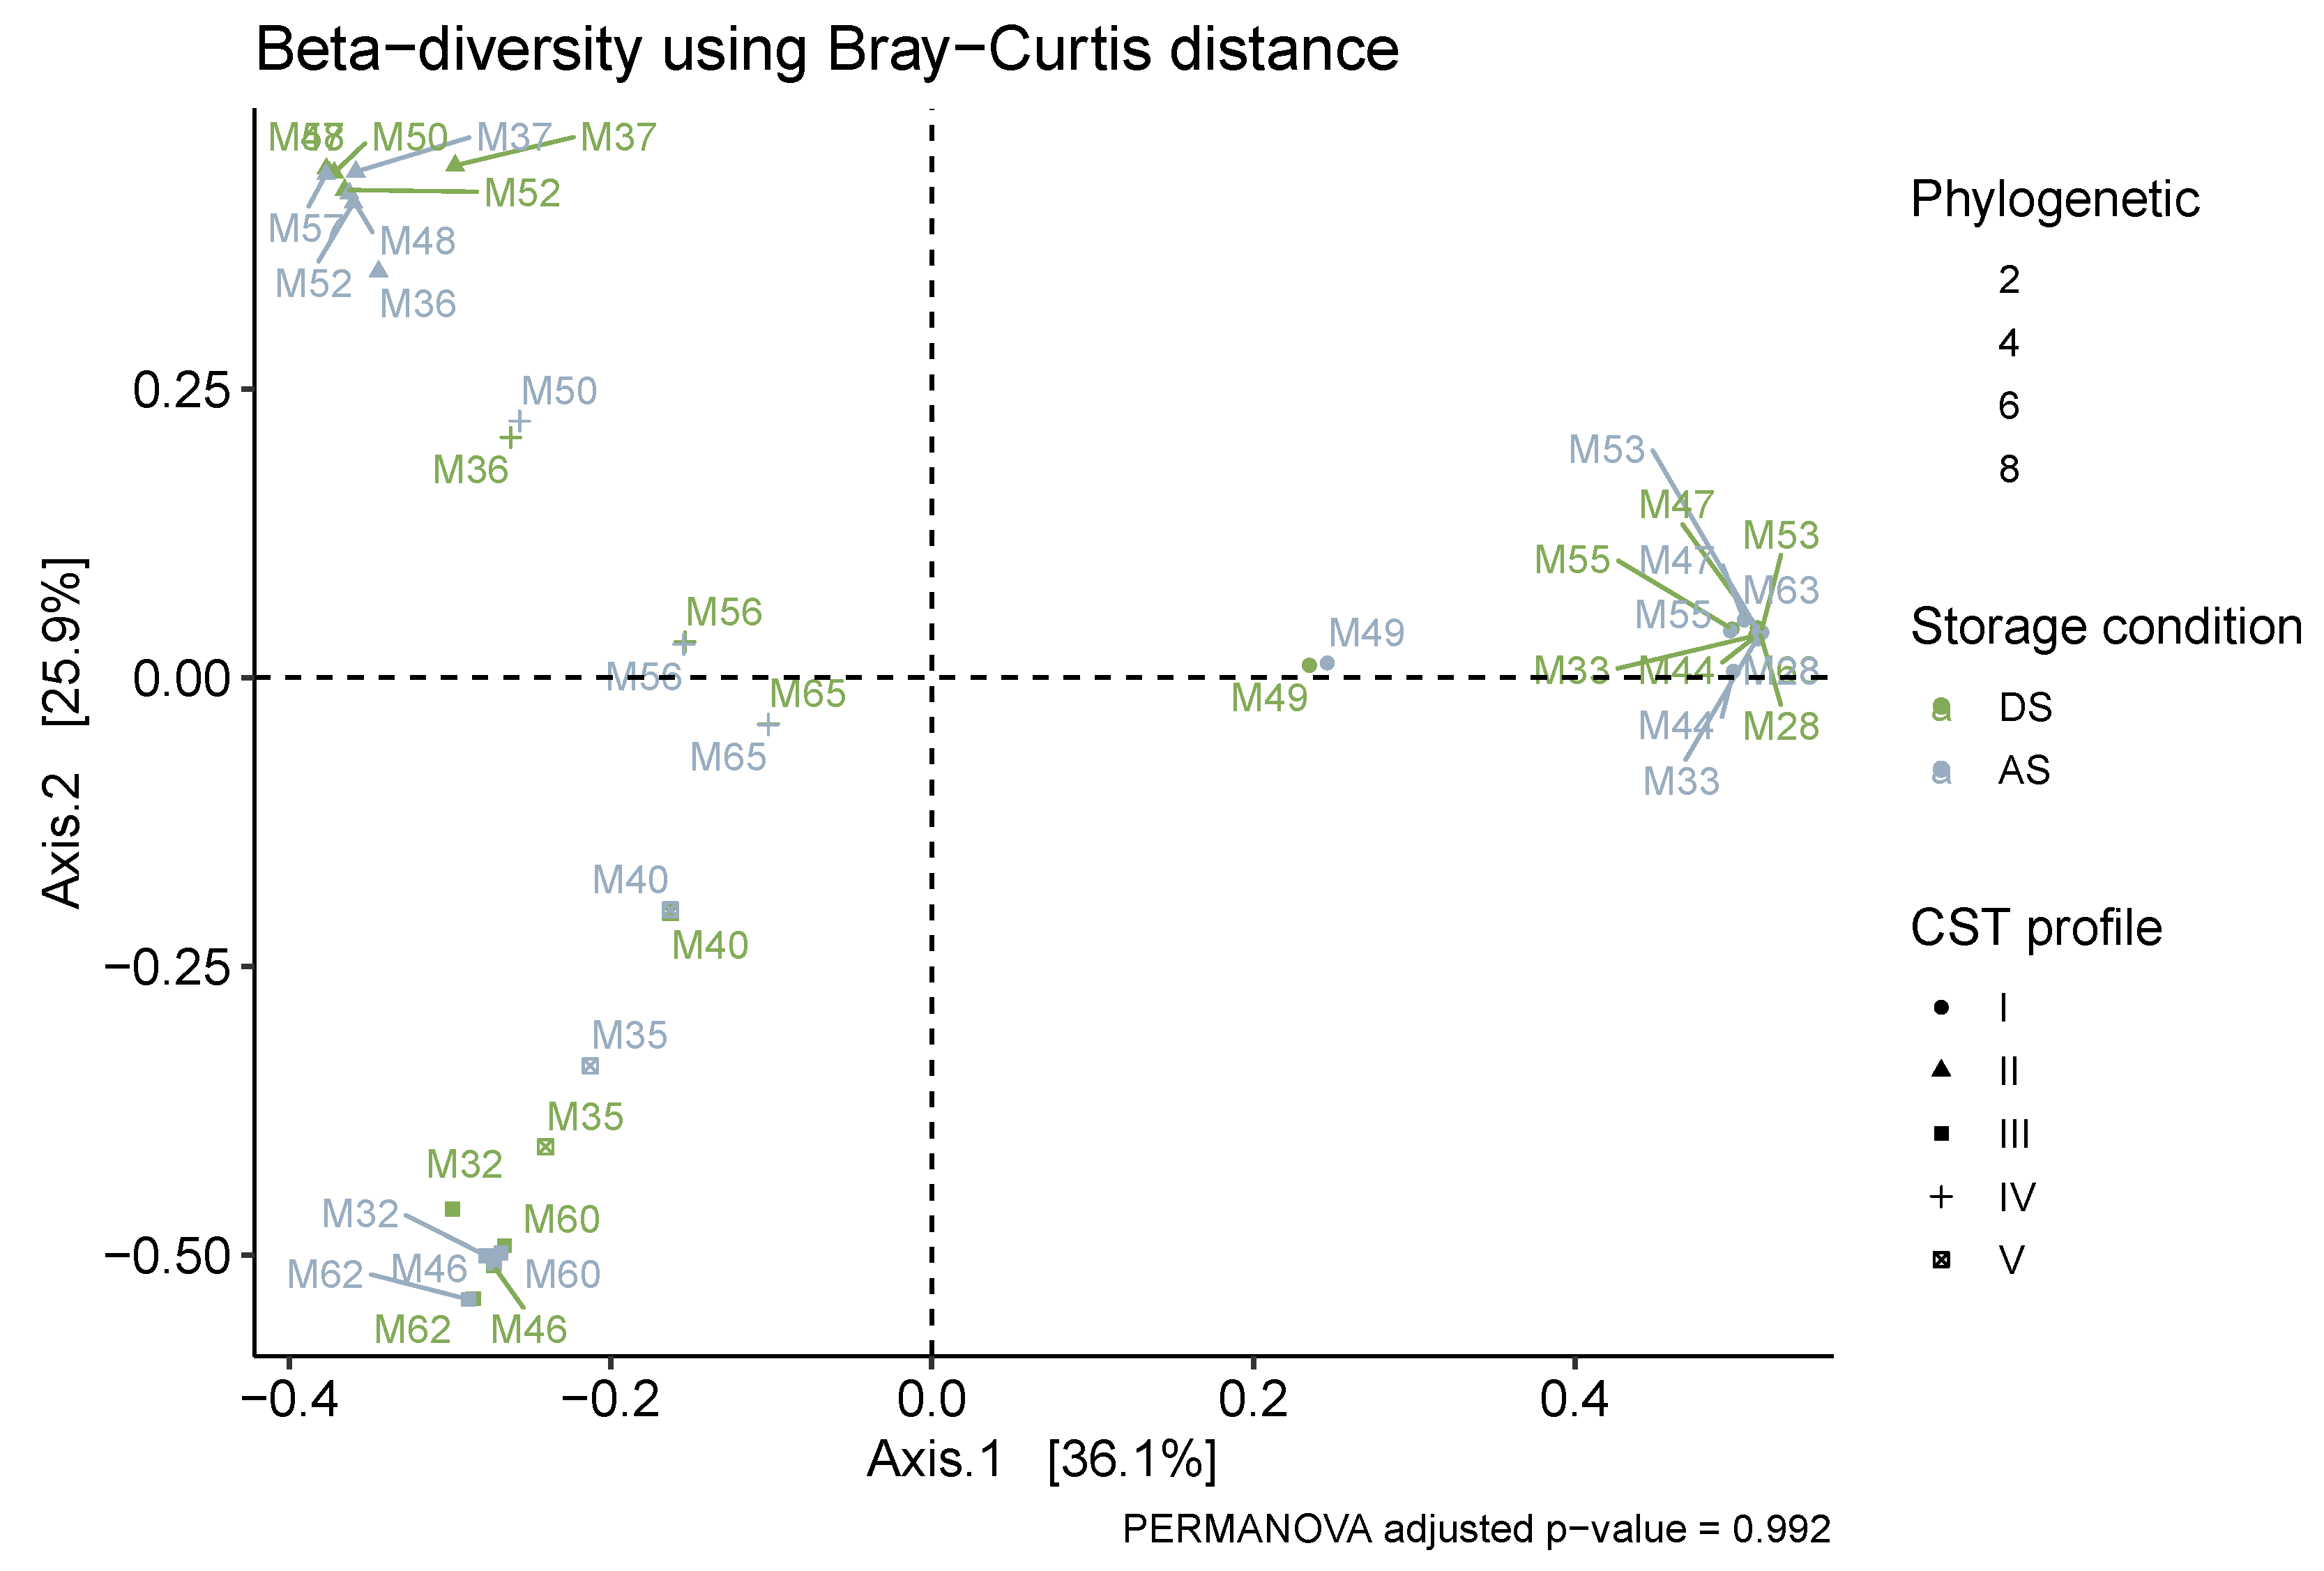
3.3. Microbiota Composition and CST Accuracy

Overall, there was minimal impact of storage condition (DI vs. AS) on the detection and relative abundance of vaginal bacterial species commonly found in pregnant women. The relative abundance profiles for each sample pair (DI and AS from the same woman) are shown in Figure 2A. In most cases, the relative abundance of major bacterial taxa was comparable and consistent between the two storage conditions. However, for two participants (M36 and M50), the relative abundance profiles showed some discrepancies between the DI and AS samples.
CST allocation was 91% similar between the DI and AS samples. For all samples, L. crispatus (CST-I) dominated in 36.4%, L. gasseri (CST-II) in 22.7%, L. iners (CST-III) in 18.2%, anaerobic bacteria or high alpha-diversity (CST-IV) in 13.6%, and L. jensenii (CST-V) in 9.1%. However, for the two discordant samples (M36 and M50), these were assigned conflicting CSTs. For participant M36, the DI sample was classified as CST-IV with an 89% confidence score, while the AS sample was classified as CST-II with a 64% confidence score. For participant M50, the opposite pattern was observed: the DI sample was classified as CST-II with an 84% confidence score, while the AS sample was classified as CST-IV with a 33% confidence score.
Beta diversity analysis, expressed as the Bray-Curtis dissimilarity and visualised with PCoA (Figure 3), showed no distinct clustering of samples based on storage condition. Instead, samples clustered strongly by participant ID at the individual level and by CST at the broader community level. This indicates that the inter-individual differences in vaginal microbiome composition were far greater than any differences introduced by the storage method. PERMANOVA analysis confirmed the lack of a significant effect of storage condition on overall community composition (p = 0.992). However, as expected, CST was a highly significant predictor of community composition (R2 = 0.81, p < 0.0001). While the DI and AS samples from participants M36 and M50 showed some separation on the PCoA plot, this occurs within the context of principal coordinates 1 and 2 explaining 62% of total variation. This separation is explained largely by Axis 1 (36.1% of variation) and a large but reduced explanation by Axis 2 (25.9%). While some differences are observable between storage conditions in these two patients, they are insignificant in explaining overall sample variance than the substantial community differences that is brought about by CSTs community structure.

4. Discussion

The relationship between the cervicovaginal microbiome (CVM) and reproductive health outcomes is increasingly recognised, with implications for conditions ranging from sexually transmitted infections [60] and cancer [61] to conception [62] and preterm birth [63]. Specifically, a shift in CVM composition during early pregnancy from a low-diversity, Lactobacillus-dominated state to a high-diversity, dysbiotic state is a well-established risk factor for adverse outcomes [23,24,48,64,65].
Despite the growing body of evidence, CVM analysis has not yet been widely adopted in routine clinical practice. This is partly due to the cost and technical complexities associated with microbiome sequencing, as well as the challenges of standardisation and minimising bias at various stages of the workflow, from sample collection and storage to DNA extraction, PCR amplification, and bioinformatics analysis [29]. Recent literature has highlighted the cumulative nature of microbiome bias, with upstream steps, such as sample storage, potentially having a significant impact on downstream results [36]. This is particularly relevant for low-biomass samples, such as cervicovaginal swabs, where even small variations in sample handling can introduce substantial bias. Furthermore, accurate species-level taxonomic identification, crucial for understanding the functional roles of different vaginal bacteria, remains a challenge due to limitations in commonly used 16S rRNA gene sequence databases [3,14].
Routine collection of CV swabs for microbiome studies would be significantly more practical and economical if simple dry swabs could be collected and stored at readily accessible temperatures, such as those found in standard household freezers [66,67]. The primary aim of this study was to determine whether CV samples collected in Amies stabilisation medium and refrigerated for up to 72 hours yield comparable vaginal DNA yields and microbiome profiles to those obtained from dry swabs immediately frozen at −80 °C.
Our results demonstrated that while DNA yield was significantly higher in the Amies-stabilised swabs (p < 0.003), the difference did not significantly influence the relative abundance of bacterial taxa, the overall community composition (beta diversity), or the assignment of samples to CSTs. This result suggests that the Amies medium effectively preserves the integrity of the vaginal microbiome profile, even with a delay in freezing. The higher DNA yield in the Amies samples is likely due to the more efficient release of cells and DNA from the swab tip in the liquid medium compared to the dry-frozen swabs. The difficulty of dislodging biological material from the dry swab, requiring PBS solution, highlighted deficiencies in the method.
Although we observed some discrepancies in CST allocation for two sample pairs (M36 and M50), these differences were relatively minor and likely attributable to low DNA yield and potential amplification bias in the DI samples [29,36,68,69]. Importantly, beta-diversity analysis showed that these samples still clustered more closely with each other and with other samples from the same CST than with samples from different CSTs, indicating that the overall community structure was preserved.
While most CVM profiles in our cohort fell within the expected common CSTs, one participant (M65) was assigned to CST-IV despite having a community dominated by Lactobacillus. Further analysis revealed that this sample was classified as sub-CST IV-B, which is characterised by a moderate abundance of anaerobic bacteria, such as Bifidobacterium vaginale (AKA Gardnerella vaginalis) and Fannyhessea vaginae (AKA Atopobium vaginae), alongside Lactobacillus. This highlights the importance of using refined CST classifications and accurate taxonomic assignments to distinguish between potentially different functional states within the broader CST categories [14,70].

4.1. Strengths and Limitations

A key strength of this study is its direct comparison of two commonly used sample storage methods (immediate dry freezing vs. stabilisation medium with refrigeration) under conditions that are relevant to both clinical and research settings. It addresses the gap in the literature with a direct comparison and demonstrates the accuracy. To our knowledge, only one other study, by Bai et al., has examined the impact of vaginal sample storage conditions [38]. While their work was valuable, it focused on a comparison between immediately processed ESwabs and frozen ESwabs, and did not include a direct comparison to dry, immediately frozen swabs, thus it cannot deduce any storage method differences.
Another strength is our use of a rigorous bioinformatics pipeline, including single-round PCR amplification followed by adapter ligation and paired-end sequencing, to minimise amplification bias, tag jumping and contamination [71]. We also developed and implemented a curated, vagina-specific 16S rRNA gene database (VagDB) to improve the accuracy of taxonomic assignments, addressing a critical limitation of previous studies that relied on more generalist databases [45]. The identification of key genotypes for the diagnosis of CST could open the door for more rapid point-of-need sample processing and detection.
However, this study also has limitations. We did not compare our samples to freshly collected samples (i.e., those processed immediately without any storage). While this would have provided an absolute "gold standard," it was not logistically feasible within the context of this study. Our swabs were stored for a significant period (6–12 months) at −80 °C, which may have introduced some changes, although previous studies suggest that long-term storage at −80 °C is generally effective for preserving microbiome profiles [30,31]. Another limitation is the relatively small sample size (n = 22), which may have limited our power to detect subtle differences between storage conditions, particularly within specific subgroups. Finally, while we used a rigorous bioinformatics pipeline and a curated database, taxonomic assignments based on 16S rRNA gene sequencing, particularly the V4 region, still have inherent limitations in resolving closely related species—a limitation that could potentially be resolved using longer read and/or shotgun approaches as we have shown in other works [48,72].

4.2. Addressing the Taxonomic Database Issue

A significant challenge in microbiome research, particularly in specialised niches is the accurate taxonomic assignment of sequence reads. Generalist 16S rRNA gene databases, such as Greengenes, Silva, and RDP often lack the resolution and specificity required to accurately identify vaginal bacterial species [40]. This is because many vaginal bacteria, particularly within the Lactobacillus genus and among anaerobic taxa associated with dysbiosis, are closely related and share high degrees of 16S rRNA gene sequence similarity. This can lead to misclassification or assignment to higher taxonomic levels (e.g., genus or family) instead of the species level, hindering our ability to fully understand the functional roles of specific bacteria.
To address this, we developed VagDB, a curated, vagina-specific 16S rRNA gene database. VagDB was built upon the robust framework of the Genome Taxonomy Database (GTDB) [54], which uses a phylogenomic approach to define bacterial taxonomy, providing a more accurate and stable classification than traditional 16S rRNA gene-based approaches. We extracted 16S rRNA gene sequences from GTDB for 582 bacterial species previously reported to be present in the human vagina [3], creating a curated database that will enhance taxonomic assignment confidence at species level. We further cross-referenced and validated our taxonomic assignments using a secondary database built upon the Silva 138 release. This dual-database approach enhanced the reliability of our species-level identifications. The use of VagDB, in conjunction with the stringent 100% sequence identity criterion for species assignment in DADA2, significantly improved the resolution and accuracy of our taxonomic assignments, allowing us to distinguish between closely related Lactobacillus species and other vaginal taxa. The VagDB database is formatted for compatibility with DADA2 and is freely available.

5. Conclusions

In conclusion, our study demonstrates that immediate freezing of dry cervicovaginal swabs is not strictly necessary for accurate vaginal microbiome profiling using 16S rRNA gene sequencing. Collection and storage of swabs in a stabilisation medium, such as Copan ESwab with Amies, followed by refrigeration for up to 72 hours and subsequent freezing at −80 °C, yields comparable results. While DNA yield is significantly higher with the stabilisation medium, this does not introduce significant bias in terms of community composition, alpha diversity, beta diversity, or CST allocation.
This finding has important implications for both clinical and research applications of vaginal microbiome analysis. It allows for greater flexibility in sample collection and storage, facilitating the integration of microbiome profiling into routine clinical workflows and large-scale epidemiological studies, including those conducted in resource-limited settings or involving self-collection of samples at home. The ability to refrigerate samples for up to 72 hours before freezing provides a practical window for both transport and processing, without compromising the integrity of the microbiome data. Additionally, our development and implementation of a curated, vagina-specific 16S rRNA gene database (VagDB) significantly enhances the accuracy and resolution of taxonomic assignments, enabling more precise characterisation of the vaginal microbiome and a better understanding of the roles of specific bacterial species in health and disease, particularly in the context of preterm birth risk stratification.
While our protocol is robust for amplicon sequencing, the benefits must be balanced against unintentional obstacles created for other downstream applications such metagenomics or metatranscriptomicsthat can be caused by delay in freezing. In our previous work we demonstrate that metagenomics, even with shallow depth of sequencing, offers better taxonomic resolution across all DNA lifeforms than 16S metabarcoding [48]. Future use of samples in multi-omics studies and especially long-read sequencing must consider the long-term viability of high-molecular weight DNA; in addition, labile RNA maybe better preserved via immediate freezing. Consequently, while sample stabilisation is effective in potentially enabling microbiome integration within clinical practice, immediate freezing maybe preferred to maximize nucleic acid integrity for multi-omic studies.
Future research should focus on validating these findings in larger and more diverse populations, including longitudinal studies that track changes in the vaginal microbiome over the course of pregnancy and during the menstrual cycle. Further refinement of the VagDB by incorporating new whole-genome sequence derived full-length 16S rRNA, will improve taxonomic resolution to subspecies levels. Ultimately, the integration of vaginal microbiome analysis into routine clinical practice, facilitated by the removal of rigid cold chain logistics and design of rapid and robust laboratory workflow, holds great promise for a range of clinical applications with benefits to women’s health.

Supplementary Materials

The following supporting information can be downloaded at the website of this paper posted on Preprints.org” Table S1: Modified DADA2 Pipeline Parameters for ASV Inference and Taxonomic Assignment; Table S2: Vaginal Community State Type (CST) Classifications and Characteristics; Figure S1: Stacked bar chart showing DNA based ATCC evenly distributed (5%) mock community results.

Author Contributions

Conceptualisation, A.A., J.A.K., M.B. and C.T.C.; methodology, A.A., M.B. and C.T.C.; formal analysis, A.A., M.B. and C.T.C.; investigation, A.A. and B.P.-V.; resources, J.A.K., M.B. and C.T.C.; data curation, A.A.; writing—original draft preparation, A.A.; writing—review and editing, A.A., J.A.K., M.B., C.T.C. and M.A.; visualization, A.A.; supervision, J.A.K., M.B., C.T.C. and M.A.; project administration, A.A. and J.A.K.; funding acquisition, J.A.K., M.B., C.T.C. and M.A. All authors have read and agreed to the published version of the manuscript.

Funding

This research was supported by funding provided by the Western Australian Human Microbiome Collaboration Centre (WAHMCC), Curtin University, Channel 7 Telethon Trust, Western Australia Pregnancy Biobank (WAPB), and the Women & Infants Research Foundation.

Institutional Review Board Statement

The study was conducted in accordance with the Declaration of Helsinki and approved by the Women and Newborn Health Service Human Research Ethics Committee (EC00350, RGS0000000705, date 5 January 2015) and the Curtin University Human Research Ethics Committee (HRE2018-0071).

Informed Consent Statement

Informed consent was obtained from all subjects involved in the study.

Data Availability Statement

The datasets generated and analysed during the current study are available in the NCBI Sequence Read Archive (SRA) under BioProject accession number PRJNA1348951. The VagDB database is available at https://zenodo.org/records/17452627.

Acknowledgments

We thank the King Edward Memorial Hospital research midwives (especially the WAPB research midwife who collected the samples), laboratory facilities, and researchers who assisted with the study in the TrEnD Lab.

Conflicts of Interest

The authors declare no conflict of interest.

References

  1. Belizário, J.E.; Napolitano, M. Human microbiomes and their roles in dysbiosis, common diseases, and novel therapeutic approaches. Front. Microbiol. 2015, 6, 1050. [Google Scholar] [CrossRef]
  2. Ravel, J.; Gajer, P.; Abdo, Z.; Schneider, G.M.; Koenig, S.S.; McCulle, S.L.; Karlebach, S.; Gorle, R.; Russell, J.; Tacket, C.O.; et al. Vaginal microbiome of reproductive-age women. Proc. Natl. Acad. Sci. USA 2011, 108, 4680–4687. [Google Scholar] [CrossRef]
  3. Diop, K.; Dufour, J.C.; Levasseur, A.; Fenollar, F. Exhaustive repertoire of human vaginal microbiota. Hum. Microbiome J. 2019, 11, 100051. [Google Scholar] [CrossRef]
  4. Haque, M.M.; Merchant, M.; Kumar, C.N.S.; Jayaram, A.; Jeyaseelan, L.; K, J. First-trimester vaginal microbiome diversity: A potential indicator of preterm delivery risk. Sci. Rep. 2017, 7, 16145–16155. [Google Scholar] [CrossRef]
  5. Parker, J.; MacIntyre, D.A.; Bennett, P.R.; Kyrgiou, M.; Terzidou, V. Cervicovaginal microbiome and metabolite profiles are altered remote from term in women who subsequently deliver preterm. BJOG 2016, 123, 45. [Google Scholar]
  6. Miller, E.; Beasley, D.E.; Dunn, R.R.; Archie, E.A. Lactobacilli Dominance and Vaginal pH: Why is the Human Vaginal Microbiome Unique? Front. Microbiol. 2016, 7, 1936. [Google Scholar] [CrossRef] [PubMed]
  7. Romero, R.; Hassan, S.S.; Gajer, P.; Tarca, A.L.; Fadrosh, D.W.; Nikita, L.; Galuppi, M.; Lamont, R.F.; Chaemsaithong, P.; Miranda, J.; et al. The composition and stability of the vaginal microbiota of normal pregnant women is different from that of non-pregnant women. Microbiome 2014, 2, 4. [Google Scholar] [CrossRef] [PubMed]
  8. Romero, R.; Hassan, S.S.; Gajer, P.; Tarca, A.L.; Fadrosh, D.W.; Bieda, J.; Chaemsaithong, P.; Miranda, J.; Chaiworapongsa, T.; Ravel, J. The vaginal microbiota of pregnant women who subsequently have spontaneous preterm labor and delivery and those with a normal delivery at term. Microbiome 2014, 2, 18. [Google Scholar] [CrossRef]
  9. Romero, R.; Hassan, S.S.; Gajer, P.; Tarca, A.L.; Fadrosh, D.W.; Bieda, J.; Chaemsaithong, P.; Miranda, J.; Chaiworapongsa, T.; Ravel, J. The composition and stability of the vaginal microbiota of normal pregnant women is different from that of non-pregnant women. Microbiome 2014, 2, 4. [Google Scholar] [CrossRef]
  10. Ravel, J.; Brotman, R.M.; Gajer, P.; Fadrosh, D.; Zhou, X.; McCulle, S.L.; Abdo, Z.; Forney, L.J. Daily temporal dynamics of vaginal microbiota before, during and after episodes of bacterial vaginosis. Microbiome 2013, 1, 29. [Google Scholar] [CrossRef]
  11. Aagaard, K.; Riehle, K.; Ma, J.; Segata, N.; Mistretta, T.A.; Coarfa, C.; Raza, S.; Rosenbaum, S.; Van den Veyver, I.; Milosavljevic, A.; et al. A metagenomic approach to characterization of the vaginal microbiome signature in pregnancy. PLoS ONE 2012, 7, e36466. [Google Scholar] [CrossRef] [PubMed]
  12. Fettweis, J.M.; Brooks, J.P.; Serrano, M.G.; Sheth, N.U.; Girerd, P.H.; Edwards, D.J.; Strauss, J.F., 3rd; Jefferson, K.K.; Buck, G.A. Species-level classification of the vaginal microbiome. BMC Genomics 2012, 13, S17. [Google Scholar] [CrossRef] [PubMed]
  13. Lamont, R.F.; Sobel, J.D.; Akins, R.A.; Hassan, S.S.; Chaiworapongsa, T.; Kusanovic, J.P.; Romero, R. The vaginal microbiome: new information about genital tract flora using molecular based techniques. BJOG 2011, 118, 533–549. [Google Scholar] [CrossRef]
  14. Ma, B.; France, M.T.; Crabtree, J.; Holm, J.B.; Humphrys, M.S.; Brotman, R.M.; Ravel, J. A comprehensive non-redundant gene catalog reveals extensive within-community intraspecies diversity in the human vagina. Nat. Commun. 2020, 11, 940. [Google Scholar] [CrossRef] [PubMed]
  15. Callahan, B.J.; DiGiulio, D.B.; Goltsman, D.S.A.; Sun, C.L.; Costello, E.K.; Jeganathan, P.; Biggio, J.R.; Wong, R.J.; Druzin, M.L.; Shaw, G.M.; et al. Replication and refinement of a vaginal microbial signature of preterm birth in two racially distinct cohorts of US women. Proc. Natl. Acad. Sci. USA 2017, 114, 9966–9971. [Google Scholar] [CrossRef]
  16. Kindinger, L.M.; Bennet, P.R.; Lee, Y.S.; MacIntyre, D.A.; Marchesi, J.R.; Smith, A.; Cacciatore, S.; Terzidou, V. The interaction between vaginal microbiota, cervical length, and vaginal progesterone treatment for preterm birth risk. Microbiome 2017, 5, 6. [Google Scholar] [CrossRef]
  17. Ma, B.; Forney, L.J.; Ravel, J. Vaginal microbiome: rethinking health and disease. Annu. Rev. Microbiol. 2012, 66, 371–389. [Google Scholar] [CrossRef]
  18. Dunn, A.B.; Jordan, S.; Baker, B.J.; Carlson, S.E. The Microbiome and Complement Activation: A Mechanistic Model for Preterm Birth. Biol. Res. Nurs. 2017, 19, 295–307. [Google Scholar] [CrossRef]
  19. Nadeau, H.C.; Subramaniam, A.; Andrews, W.W. Infection and preterm birth. Semin. Fetal Neonatal Med. 2016, 21, 100–105. [Google Scholar] [CrossRef]
  20. Keelan, J.A.; Payne, M.S. Vaginal microbiota during pregnancy: Pathways of risk of preterm delivery in the absence of intrauterine infection? Proc. Natl. Acad. Sci. USA 2015, 112, E6414. [Google Scholar] [CrossRef]
  21. Petricevic, L.; Domig, K.J.; Nierscher, F.J.; Sandhofer, M.J.; Fidesser, M.; Krondorfer, I.; Husslein, P.; Kneifel, W.; Kiss, H. Characterisation of the vaginal Lactobacillus microbiota associated with preterm delivery. Sci. Rep. 2014, 4, 5712. [Google Scholar] [CrossRef]
  22. Blencowe, H.; Cousens, S.; Oestergaard, M.Z.; Chou, D.; Moller, A.B.; Narwal, R.; Adler, A.; Vera Garcia, C.; Rohde, S.; Say, L.; et al. Born Too Soon: The global epidemiology of 15 million preterm births. Reprod. Health 2013, 10, S2. [Google Scholar] [CrossRef]
  23. Tabatabaei, N.; Eren, A.M.; Barreiro, L.B.; Yotova, V.; Dumaine, A.; Allard, C.; Fraser, W.D. Vaginal microbiome in early pregnancy and subsequent risk of spontaneous preterm birth: a case–control study. BJOG 2019, 126, 349–358. [Google Scholar] [CrossRef]
  24. Fettweis, J.M.; Serrano, M.G.; Brooks, J.P.; Edwards, D.J.; Girerd, P.H.; Parikh, H.I.; Huang, B.; Arodz, T.J.; Edupuganti, L.; Glascock, A.L.; et al. The vaginal microbiome and preterm birth. Nat. Med. 2019, 25, 1012–1021. [Google Scholar] [CrossRef]
  25. Freitas, A.C.; Chaban, B.; Bocking, A.; Rocco, M.; Yang, S.; Hill, J.E.; Money, D.M. Increased richness and diversity of the vaginal microbiota and spontaneous preterm birth. Microbiome 2018, 6, 117. [Google Scholar] [CrossRef]
  26. Jean, S.; Brochu, V.; M, D. Multi-omic Microbiome Profiles in the Female Reproductive Tract in Early Pregnancy. Infect. Microbes Dis. 2019, 1, 49–60. [Google Scholar] [CrossRef]
  27. Donders, G.G.; Van Calsteren, K.; Bellen, G.; Reybrouck, R.; Van den Bosch, T.; Riphagen, I.; Van Lierde, S. Predictive value for preterm birth of abnormal vaginal flora, bacterial vaginosis and aerobic vaginitis during the first trimester of pregnancy. BJOG 2009, 116, 1315–1324. [Google Scholar] [CrossRef] [PubMed]
  28. Ralph, S.G.; Rutherford, A.J.; Wilson, J.D. Influence of bacterial vaginosis on conception and miscarriage in the first trimester: cohort study. BMJ 1999, 319, 220–223. [Google Scholar] [CrossRef] [PubMed]
  29. Brooks, J.P.; Edwards, D.J.; Harwich, M.D., Jr.; Rivera, M.C.; Fettweis, J.M.; Serrano, M.G.; Reris, R.A.; Sheth, N.U.; Huang, B.; Girerd, P.; et al. The truth about metagenomics: quantifying and counteracting bias in 16S rRNA studies. BMC Microbiol. 2015, 15, 66. [Google Scholar] [CrossRef] [PubMed]
  30. Bjerre, R.D.; Raaby, M.; Funch, P.; Puetz, A. Effects of sampling strategy and DNA extraction on human skin microbiome investigations. Sci. Rep. 2019, 9, 17287. [Google Scholar] [CrossRef]
  31. Hugerth, L.W.; Andersson, A.F. Analysing Microbial Community Composition through Amplicon Sequencing: From Sampling to Hypothesis Testing. Front. Microbiol. 2017, 8, 1561. [Google Scholar] [CrossRef]
  32. Boers, S.A.; Jansen, R.; Hays, J.P. Understanding and overcoming the pitfalls and biases of next-generation sequencing (NGS) methods for use in the routine clinical microbiological diagnostic laboratory. Eur. J. Clin. Microbiol. Infect. Dis. 2019, 38, 1059–1070. [Google Scholar] [CrossRef] [PubMed]
  33. Berman, H.; McLaren, M.; Callahan, B. Understanding and interpreting community sequencing measurements of the vaginal microbiome. BJOG 2020, 127, 139–146. [Google Scholar] [CrossRef] [PubMed]
  34. Marotz, C.; Cavagnero, K.J.; Song, S.J.; McDonald, D.; Wandro, S.; Humphrey, G.; Knight, R. Evaluation of the Effect of Storage Methods on Fecal, Saliva, and Skin Microbiome Composition. mSystems 2021, 6, e01329-20. [Google Scholar] [CrossRef] [PubMed]
  35. Van Horn, K.G.; Audette, C.D.; Sebeck, D.; Tucker, K.A. Comparison of 3 swab transport systems for direct release and recovery of aerobic and anaerobic bacteria. Diagn. Microbiol. Infect. Dis. 2008, 62, 471–473. [Google Scholar] [CrossRef]
  36. Mattei, V.; Vici, F.; Sisti, D.; Rocchi, M.; Bulli, L.; Citterio, B. Evaluation of Methods for the Extraction of Microbial DNA From Vaginal Swabs Used for Microbiome Studies. Front. Cell. Infect. Microbiol. 2019, 9, 197. [Google Scholar] [CrossRef] [PubMed]
  37. Bassis, C.M.; Erb-Downward, J.R.; Young, V.B.; Huffnagle, G.B. Comparison of stool versus rectal swab samples and storage conditions on bacterial community profiles. BMC Microbiol. 2017, 17, 78. [Google Scholar] [CrossRef]
  38. Bai, G.; Gajer, P.; Nandy, M.; Ma, B.; Yang, H.; Sakamoto, J.; Blanchard, M.H.; Ravel, J.; Brotman, R.M. Comparison of storage conditions for human vaginal microbiome studies. PLoS ONE 2012, 7, e36934. [Google Scholar] [CrossRef]
  39. Edgar, R. Taxonomy annotation and guide tree errors in 16S rRNA databases. PeerJ 2018, 6, e5030. [Google Scholar] [CrossRef]
  40. Balvočiūtė, M.; Huson, D.H. SILVA, RDP, Greengenes, NCBI and OTT — how do these taxonomies compare? BMC Genomics 2017, 18, 114. [Google Scholar] [CrossRef]
  41. Yilmaz, P.; Parfrey, L.W.; Yarza, P.; Gerken, J.; Pruesse, E.; Quast, C.; Schweer, T.; Peplies, J.; Ludwig, W.; Glöckner, F.O. The SILVA and "All-species Living Tree Project (LTP)" taxonomic frameworks. Nucleic Acids Res. 2014, 42, D643–D648. [Google Scholar] [CrossRef]
  42. McDonald, D.; Price, M.N.; Goodrich, J.; Nawrocki, E.P.; DeSantis, T.Z.; Probst, A.; Andersen, G.L.; Knight, R.; Hugenholtz, P. An improved Greengenes taxonomy with explicit ranks for ecological and evolutionary analyses of bacteria and archaea. ISME J. 2012, 6, 610–618. [Google Scholar] [CrossRef]
  43. Edgar, R.C. Accuracy of microbial community diversity estimated by closed- and open-reference OTUs. PeerJ 2017, 5, e3889. [Google Scholar] [CrossRef]
  44. Walters, W.; Hyde, E.R.; Berg-Lyons, D.; Ackermann, G.; Humphrey, G.; Parada, A.; Gilbert, J.A.; Jansson, J.K.; Caporaso, J.G.; Fuhrman, J.A.; et al. Improved Bacterial 16S rRNA Gene (V4 and V4-5) and Fungal Internal Transcribed Spacer Marker Gene Primers for Microbial Community Surveys. mSystems 2015, 1, e00009-15. [Google Scholar] [CrossRef]
  45. Huang, L.; et al. A multi-kingdom collection of 33,804 reference genomes for the human vaginal microbiome. Nat. Microbiol. 2024, 9, 2185–2200. [Google Scholar] [CrossRef] [PubMed]
  46. Overgaard, C.K.; et al. Application of ecosystem-specific reference databases for increased taxonomic resolution in soil microbial profiling. Front. Microbiol. 2022, 13, 969460. [Google Scholar] [CrossRef] [PubMed]
  47. Kaehler, B.D.; Bokulich, N.A.; McDonald, D.; Knight, R.; Caporaso, J.G.; Huttley, G.A. Species abundance information improves sequence taxonomy classification accuracy. Nat. Commun. 2019, 10, 4643. [Google Scholar] [CrossRef]
  48. Ali, A.; Christophersen, C.T.; Keelan, J.A. Vaginal microbial profiling in a preterm birth high-risk cohort using shallow shotgun metagenomics. Microbiol. Aust. 2021, 42, 69–74. [Google Scholar] [CrossRef]
  49. Hillmann, B.; Al-Ghalith, G.A.; Shields-Cutler, R.R.; Zhu, Q.; Gligor, K.; Holt, J.M.; Hansen, A.J.; Knights, D. Evaluating the Information Content of Shallow Shotgun Metagenomics. mSystems 2018, 3, e00069-18. [Google Scholar] [CrossRef]
  50. Santiago-Rodriguez, T.M.; et al. Metagenomic Information Recovery from Human Stool Samples Is Influenced by Sequencing Depth and Profiling Method. Genes 2020, 11, 1380. [Google Scholar] [CrossRef] [PubMed]
  51. Al-Ghalith, G.A.; Montassier, E.; Ward, H.N.; Knights, D. SHI7 Is a Self-Learning Pipeline for Multipurpose Short-Read DNA Quality Control. mSystems 2018, 3, e00202-17. [Google Scholar] [CrossRef] [PubMed]
  52. Martin, M. Cutadapt removes adapter sequences from high-throughput sequencing reads. EMBnet. J. 2011, 17, 10–12. [Google Scholar] [CrossRef]
  53. Cole, J.R.; Wang, Q.; Fish, J.A.; Chai, B.; McGarrell, D.M.; Sun, Y.; Brown, C.T.; Porras-Alfaro, A.; Kuske, C.R.; Tiedje, J.M. Ribosomal Database Project: data and tools for high throughput rRNA analysis. Nucleic Acids Res. 2014, 42, D633–D642. [Google Scholar] [CrossRef]
  54. Parks, D.H.; Chuvochina, M.; Waite, D.W.; Rinke, C.; Skarshewski, A.; Chaumeil, P.A.; Hugenholtz, P. A standardized bacterial taxonomy based on genome phylogeny substantially revises the tree of life. Nat. Biotechnol. 2018, 36, 996–1004. [Google Scholar] [CrossRef]
  55. Lopera, J.; et al. Development and Evaluation of Whole Cell-and Genomic DNA-based Microbiome Reference Standards. Preprint 2021.
  56. France, M.T.; Ma, B.; Gajer, P.; Brown, S.; Humphrys, M.S.; Holm, J.B.; Waetjen, L.E.; Brotman, R.M.; Ravel, J. VALENCIA: a nearest centroid classification method for vaginal microbial communities based on composition. Microbiome 2020, 8, 166. [Google Scholar] [CrossRef]
  57. McMurdie, P.J.; Holmes, S. phyloseq: An R Package for Reproducible Interactive Analysis and Graphics of Microbiome Census Data. PLoS ONE 2013, 8, e61217. [Google Scholar] [CrossRef] [PubMed]
  58. Davis, N.M.; Proctor, D.M.; Holmes, S.P.; Relman, D.A.; Callahan, B.J. Simple statistical identification and removal of contaminant sequences in marker-gene and metagenomics data. Microbiome 2018, 6, 226. [Google Scholar] [CrossRef]
  59. Patil, I. Visualizations with statistical details: The 'ggstatsplot' approach. J. Open Source Softw. 2021, 6, 3167. [Google Scholar] [CrossRef]
  60. Lewis, F.M.T.; Bernstein, K.T.; Aral, S.O. Vaginal Microbiome and Its Relationship to Behavior, Sexual Health, and Sexually Transmitted Diseases. Obstet. Gynecol. 2017, 129, 643–654. [Google Scholar] [CrossRef] [PubMed]
  61. Mitra, A.; MacIntyre, D.A.; Lee, Y.S.; Smith, A.; Marchesi, J.R.; Le-Re, T.; Kote-Jarai, Z.; Kyrgiou, M. Comparison of vaginal microbiota sampling techniques: cytobrush versus swab. Sci. Rep. 2017, 7, 9802. [Google Scholar] [CrossRef]
  62. Tomaiuolo, R.; Veneri, C.; Nucci, F.; D'Alessandro, A.; Pesapane, F.; Sarno, L.; De Guida, M. Microbiota and Human Reproduction: The Case of Female Infertility. High-Throughput 2020, 9, 12. [Google Scholar] [CrossRef] [PubMed]
  63. Bayar, E.; Bennett, P.R.; Chan, D.; Sykes, L.; MacIntyre, D.A. The pregnancy microbiome and preterm birth. Semin. Immunopathol. 2020, 42, 487–499. [Google Scholar] [CrossRef]
  64. Payne, M.S.; et al. A specific bacterial DNA signature in the vagina of Australian women in midpregnancy predicts high risk of spontaneous preterm birth (the Predict1000 study). Am. J. Obstet. Gynecol. 2021, 224, 206.e1–206.e23. [Google Scholar] [CrossRef] [PubMed]
  65. Hočevar, K.; Maver, A.; Vidmar, R.; Hodžić, A.; Kušar, D.; Verdenik, I. Vaginal microbiome signature is associated with spontaneous preterm delivery. Front. Med. 2019, 6, 201. [Google Scholar] [CrossRef] [PubMed]
  66. Casals-Pascual, C.; et al. Microbial Diversity in Clinical Microbiome Studies: Sample Size and Statistical Power Considerations. Gastroenterology 2020, 158, 1524–1528. [Google Scholar] [CrossRef]
  67. Li, T.; et al. Evaluation of the vaginal microbiome in clinical diagnosis and management of vaginal infectious diseases. Chin. Med. J. 2019, 132, 1100–1103. [Google Scholar] [CrossRef]
  68. Gohl, D.M.; Vangay, P.; Garbe, J.; MacLean, A.; Hauge, A.; Becker, A.; Gould, T.J.; Clayton, J.B.; Johnson, T.J.; Hunter, R.; et al. Systematic improvement of amplicon marker gene methods for increased accuracy in microbiome studies. Nat. Biotechnol. 2016, 34, 942–949. [Google Scholar] [CrossRef]
  69. Virtanen, S.; et al. Comparative analysis of vaginal microbiota sampling using 16S rRNA gene analysis. PLoS ONE 2017, 12, e0181477. [Google Scholar] [CrossRef]
  70. France, M.; et al. VALENCIA: A nearest centroid classification method for vaginal microbial communities based on composition. Research Square 2020.
  71. Qian, X.-B.; et al. A guide to human microbiome research: study design, sample collection, and bioinformatics analysis. Chin. Med. J. 2020, 133, 1844–1855. [Google Scholar] [CrossRef] [PubMed]
  72. Callahan, B.J.; Wong, J.; Heiner, C.; Oh, S.; Theriot, C.M.; Gulati, A.S.; McGill, S.K.; Dougherty, M.K. High-throughput amplicon sequencing of the full-length 16S rRNA gene with single-nucleotide resolution. Nucleic Acids Res. 2019, 47, e103. [Google Scholar] [CrossRef] [PubMed]
Figure 1. Swab storage condition impacts DNA yield and alpha diversity but not amplification efficiency. (A) Boxplot plot representing DNA concentration (ng/µL) on y-axis and storage condition on x-axis. (B) Boxplot comparing qPCR Ct values between storage groups. (C) Simpson alpha diversity measuring impact of storage condition on species richness and evenness of the sample. (D) Within sample diversity measured according to Faith’s phylogenetic distance measured by the total branch length between species in the tree. Each point represents a patient sample with the colour indicating storage condition. Dotted lines link paired samples from the same patient. A paired Wilcoxon ranked sum test is used to compare means. Significance is assumed if Bonferroni adjusted p < 0.05.
Preprints 187343 g001
Figure 2. Relative abundance of top bacterial species and Cohort CST breakdown. (A) Stacked bar chart is organised by participant number; sample category is denoted on the x-axis (letter d or e in front of patient id is to denote Dry or Aimes group, respectively). Y-axis is the relative abundance from 0–100%. Bars are coloured according to species composition. (B) Pie chart representing CST composition according to storage type. Segments are coloured by CST type. External labels show CST name and internal values are percentage of all CST profiles.
Preprints 187343 g002
Figure 3. Beta-diversity calculated based on the Bray-Curtis dissimilarity metric on proportion normalized counts. Most inter-sample compositional variation was explained by the first 2 dimensions that were visualized on the PCoA plot. Samples are coloured by storage condition, diversity indicated by point size and CSTs are indicated by symbol type. FDR-adjusted statistical significance (p < 0.05) was tested using Wilcoxon for alpha-diversity and PERMANOVA stratified on patient ID for beta-diversity. 
Preprints 187343 g003
Disclaimer/Publisher’s Note: The statements, opinions and data contained in all publications are solely those of the individual author(s) and contributor(s) and not of MDPI and/or the editor(s). MDPI and/or the editor(s) disclaim responsibility for any injury to people or property resulting from any ideas, methods, instructions or products referred to in the content.
Copyright: This open access article is published under a Creative Commons CC BY 4.0 license, which permit the free download, distribution, and reuse, provided that the author and preprint are cited in any reuse.
Prerpints.org logo

Preprints.org is a free preprint server supported by MDPI in Basel, Switzerland.

Subscribe

Disclaimer

Terms of Use

Privacy Policy

Privacy Settings

© 2025 MDPI (Basel, Switzerland) unless otherwise stated