
Submitted:
12 June 2025
Posted:
13 June 2025
You are already at the latest version
Abstract
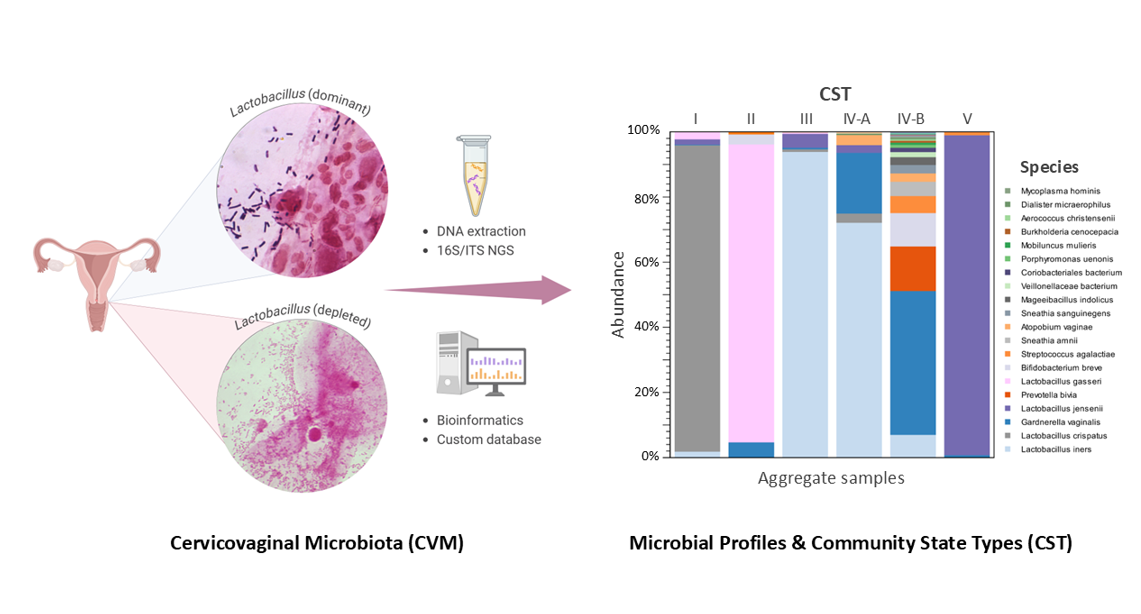
16S rRNA next-generation sequencing (NGS) has significantly advanced cervicovaginal microbiome profiling, offering insights into the relationship between vaginal dysbiosis and HPV-associated carcinogenesis. However, reliance on a limited set of 16S hypervariable regions introduces inherent biases that impact results. This study developed standardized workflows for 16S/ITS NGS, with a focus on identifying methodological biases that influence microbial abundance and taxonomic specificity. Commercial NGS tools were employed, including the 16S/ITS QIAseq V1–V9 screening panel, ATCC vaginal microbial standard, and CLC Genomics Workbench integrated with a customized database (VAGIBIOTA) for analysis. The microbial communities of 66 cervical cytology samples were characterized. Among the regions tested, V3V4 exhibited the least quantitative bias, while V1V2 offered the highest specificity. Microbial profiles and Community State Types (CST) (I–V) were broadly consistent with prior studies, with Lactobacillus abundance clustering into three states: L.-dominant (CST I–III, V), L-diminished (CST IV-A), and L.-depleted (CST IV-B). Differential abundance analysis revealed that anaerobic opportunistic pathogens dominant in CST IV-B (dysbiosis) were also enriched in HSIL and HPV-16 positive samples. Our findings highlight the importance of standardizing workflows by incorporating the 16S/ITS screening panel for microbial community profiling and elucidating their contributions to HPV-associated carcinogenesis.
Keywords:
16S rRNA sequencing
; bioinformatics
; cervical cancer
; human papillomavirus
; ITS sequencing
; next generation sequencing
; taxonomic classification
; vaginal microbiome
1. Introduction
Gardnerella vaginalis was first isolated by Leopold in 1953 and later ascribed as the “causative agent” in bacterial vaginitis (BV) by Gardner and Dukes in 1955 [1,2,3,4,5]. They famously described this common gynecologic infection as producing a “gray, thin, homogeneous, odorous, and less acidic” vaginal discharge [2,6]. Over the years, G. vaginalis has become central to our understanding of BV, with a global prevalence rate of 23-29% among women of reproductive age [6]. Studies have shown that G. vaginalis can form biofilms that promote the growth of a polymicrobial community and contribute to vaginal dysbiosis by displacing the usually dominant Lactobacillus species [7,8,9,10]. In 2011, Ravel et al. advanced our understanding of the vaginal microbiome by introducing the Community State Types (CST) classification [11]. This system emerged from an extensive analysis of vaginal samples from asymptomatic North American women using 16S rRNA gene pyrosequencing targeting the V1V2 hypervariable regions [11]. Their groundbreaking study categorized the vaginal microbiome into five distinct microbial clusters, known as CST, each characterized by the dominance of specific Lactobacillus species: CST I (Lactobacillus crispatus), CST II (Lactobacillus gasseri), CST III (Lactobacillus iners), CST IV (diverse anaerobic bacteria dominated by G. vaginalis with depleted Lactobacillus species), and CST V (Lactobacillus jensenii) [11]. This classification not only transformed our understanding of microbial ecology but also elucidated the adverse sequela of dysbiosis, including increased susceptibility to sexually transmitted infections (STIs), Human Immunodeficiency Virus (HIV), Human Papillomavirus (HPV), and preterm birth, all of which impose significant burdens on global health [6]. Further studies refined this classification and revealed correlations between CST IV and adverse health outcomes, highlighting the importance of a stable, Lactobacillus-dominant microbiome [12,13,14,15,16,17,18,19]. Since its introduction, the CST classification has become a crucial framework for exploring the relationship between vaginal dysbiosis and various gynecological conditions [6,12,13,14,15,16,17,18,19].
Vaginal dysbiosis has emerged as a significant factor influencing the persistence and progression of human papillomavirus (HPV)-associated cervical dysplasia and cancer [20,21,22,23,24,25]. Dysbiosis fosters a pro-inflammatory environment fueled by cytokines and immune cell recruitment, which damages the cervical epithelium to promote viral persistence and integration [5,20,21,22,23,24,25,26]. Dysbiosis extends beyond mere susceptibility to HPV infection; it induces chronic inflammation, which is exacerbated by G. vaginalis-mediated cytolysis and cytokine responses [4,5,26]. Inflammation-induced carcinogenesis has long been acknowledged as a complex, multifactorial process [27]. Chronic inflammation creates a tumorigenic environment through the combined actions of proinflammatory cytokines, oxidative stress, and altered cellular signaling pathways [28,29,30,31]. At the molecular level, inflammatory stimuli trigger immune cells like macrophages and neutrophils to generate reactive oxygen and nitrogen species. This leads to oxidative DNA damage and genomic instability, making tissues more susceptible to malignant transformation [28,29,30,31]. Mechanistically, nitric oxide, superoxide, and other free radicals can induce point mutations and epigenetic modifications that impact critical tumor suppressor genes and oncogenes. [30,31]. Collectively, the inflammatory mediators, genomic damage, and disrupted signaling pathways drive the process of carcinogenesis [27,28,29,30,31].
Metagenomic 16S rRNA gene sequencing has been crucial for investigating vaginal microbial communities [11,13]. However, focusing solely on 1-2 sets of 16S hypervariable regions (e.g., V1V2 or V3V4) introduces several inherent biases and limitations that can affect research results and their interpretations [32,33,34,35,36]. One major bias is primer specificity (primer bias), where the choice of primers can preferentially amplify certain taxa over others [32,33,34,35,36]. This may result in certain microorganisms being under- or overrepresented, distorting conclusions about the community structure [32,33,34,35,36]. Commonly used primers may not effectively target all relevant vaginal microbial taxa, resulting in incomplete assessments of microbial diversity [32,33,34,35,36]. Moreover, the V3V4 region might lack the resolution needed to distinguish closely related bacterial species, especially within the Gardnerella genus, potentially resulting in misidentification [37]. Sequencing technologies and platforms can also introduce variability, affecting observed microbiome profiles due to differences in sequencing depth and accuracy [35,36]. While 16S rRNA gene sequencing has been pivotal in the study of microbiomes, it is important to recognize and address its inherent biases. Standardizing laboratory methods and employing complementary approaches can minimize biases and enhance result accuracy [35,36]. This study aimed to develop and test a standardized workflow for 16S/ITS metagenomic sequencing of cervicovaginal microbiota (CVM), focusing on identifying biases that could affect the correlation between microbial communities and HPV in cervical cytology specimens. To ensure quality, reproducibility, and applicability, we utilized widely accessible, commercial off-the-shelf next-generation sequencing (NGS) products, including the 16S/ITS QIAseq V1-V9 screening panel, ATCC vaginal microbial genomic standard, and CLC Genomics Workbench for bioinformatics analysis [38,39,40].
2. Results
2.1. Taxonomic Classification and Visualization of Cervicovaginal Microbiomes
A total of 70 unique clinical samples and 2 (replicate) ATCC vaginal microbial genomic standards were submitted for NGS. Four clinical samples (ID nos.: 30663-026, -031, -035, -048) failed the library preparation with very low DNA concentrations within the 600-670 bp range and were excluded from downstream sequencing. The remaining 66 cytology samples formed the clinical NGS dataset, classified as Negative for Intraepithelial Lesion or Malignancy (NILM) (n = 10) (ID no.: 30856-001 to -012), Atypical Squamous Cells of Undetermined Significance (ASCUS) (n = 12 ) (ID no.: 30856-012 to -022), Low-grade Squamous Intraepithelial Lesions (LSIL) (n = 24) (ID no.: 30663-001 to -024), and High-grade Squamous Intraepithelial Lesions (HSIL) (n = 20) (ID no.: 30663-025 to -048 exclusive of the 4 failed samples). The replicate vaginal microbiome standards (n = 2) (ID no.: 30856-023 to -024) were sequenced alongside the clinical samples.
Following sequencing, the NGS reads (FASTQ files) were demultiplexed using the CLC QIAseq 16S/ITS demultiplexer tool to generate sequence lists corresponding to each specific 16S/ITS region. Figure 1A displays a boxplot illustrating the distribution of read counts across the 16S hypervariable regions (V-regions) for all 66 clinical samples. Median read counts for the V-regions (V1V2, V2V3, V3V4, V4V5, V5V7, V7V9) were 293,288; 394,547; 250,331; 289,505; 233,063, and 215,039 respectively. Using V1V2 as the reference, the V2V3 region exhibited significantly higher read counts, whereas V7V9 showed lower counts (Wilcoxon rank-sum test, *p < 0.05), indicating primer bias. Figure 1B depicts the right-skewed distribution of ITS read counts across 66 samples, with a median of 2 (range: 0 to 18,708). Only 15 samples had sufficient read counts (≥100) for downstream analysis.
The demultiplexed 16S/ITS reads from each sample were processed through the “Data Quality Control (QC) and Taxonomic Profiling” workflow, which generated two key outputs: (1) a graphical QC report and supplementary QC report, and (2) an Abundance Table. The graphical report provided a summary of the total number of sequences and nucleotides per sample, along with analyses such as per-sequence and per-base metrics. Overall, forward and reverse reads showed high-quality scores (PHRED ≥ 30) across all samples, with R1 ≥ 94% and R2 ≥ 80% of reads scoring between 30 and 38. Due to the large size of the QC reports, a representative sample (30856-002) is included in Supplementary Table S1. Detailed QC metric descriptions are available in the CLC Microbial Genomics Module manual [41]. The taxonomic profiling workflow generated individual abundance tables that display the names of the identified taxa, 7-level taxonomic nomenclature, coverage estimate, and abundance value (raw or relative number of reads found in the sample associated with the taxon). The merged abundance tables, which compile data across all samples, includes summary statistics such as total reads per taxon, as well as the minimum, maximum, mean, median, and standard deviation (see Supplementary Table S2). The metadata is presented separately in Supplementary Table S3. Graphical representations of these tables are described below.
The taxonomic profile of the ATCC vaginal microbiome standard is illustrated in Figure 2A. The stacked bars represent six microbial species included in the ATCC standard, each contributing equally at 16.7%, sequenced in replicates across various V-regions. Species-level specificity varied depending on the V-region sequenced; notably, L. gasseri was identified only in V1V2, while L. jensenii was not detected in V4V5. Among the sequenced regions, V3V4 exhibited the least bias in the proportions of the six microbial species (chi-square, p-value > 0.05) and demonstrated high reproducibility across technical replicates (chi-square, p-value > 0.05). Figure 2B presents the taxonomic profiles of six cytology samples representing CST I-V, dominated by L. crispatus, L. gasseri, L. iners, mixed anaerobic bacteria, and L. jensenii, respectively. Variations in species-level specificity based on the targeted V-region were observed in clinical samples. In CST I, L. crispatus was uniquely identified in the V1V2 and V7V9 regions. For CST II, L. gasseri was detected only in the V1V2 region, whereas L. iners was identified across all V-regions in CST III. In CST IVA and V, L. jensenii was found in all regions except for V4V5.
Following taxonomic profiling, ambiguous Lactobacillus reads were resolved as L. paragasseri via read mapping. Lactobacillus abundance (%) was then quantified per sample. Partition clustering grouped samples into three Lactobacillus states: L.-dominant (CST I–III, V), L.-diminished (CST IV-A), and L.-depleted (CST IV-B), based on Lactobacillus levels (Figure 3A). Mean abundances with 95% confidence intervals distinguished the CST, with reference lines marking 93% (L.-dominant threshold) and 50% (L.-depleted threshold).
Figure 3B displays a stacked bar chart of microbial species abundance per sample. To ensure species-level accuracy, the most suitable V-region was selected for each sample. The bar charts for species-level abundance across V1-V9 regions for individual samples are provided in Supplementary Figure S1. 16S V-region sequencing detected 30 unique species, with the top 17 highlighted in the legend and their composition (%) calculated based on the proportion of mapped reads (n) to the total mapped reads (Figure 3B). The CST distribution across the 66 samples included CST I (24%), II (5%), III (36%), IV-A (6%), IV-B (23%), and V (6%). Among the samples, L. iners was the most abundant species, particularly in CST III and IV-A. Four samples (30856-007 and 30663-013, -034, and -040) containing ambiguous Lactobacillus reads were identified as L. paragasseri by read mapping (Figure 3B). Figure 3C presents a merged stacked bar chart displaying the 66 samples grouped by CST. Grouping clearly highlighted the dominant species within the mixed microbial communities of CST IV-A and IV-B, identified as L. iners and G. vaginalis, respectively.
The differential abundance of species across CST groups is depicted in a Venn diagram (Figure 3D). Using the taxonomic profiling table as input and CST I as the reference, pairwise comparisons identified species unique to CST II–V, as well as those meeting the criteria of an absolute fold change greater than 1.5 and a false discovery rate (FDR) p-value < 0.05 (Supplementary Table S4). Unique species are displayed in the arms of the “starfish” Venn diagram, while those with significant fold changes are indicated in parentheses. Notably, CST IV-B exhibited the highest number of unique species (n = 18) and the greatest number of species with significant fold changes (n = 27) compared to the other CST.
Reads classified as “Lactobacillus spp. unknown” by taxonomic profiling were resolved by read mapping. The reads were initially extracted from the taxonomic profiling output and subsequently processed through the Read Mapping workflow to generate a tabulated report. The ambiguous Lactobacillus reads (n, %) identified in four samples: 30856-007 (134,698; 25%) and 30663-013 (31,659; 9%), -034 (253,079; 74%), and -040 (146,466; 99%) were mapped to L. paragasseri and L. gasseri. The read proportions for L. paragasseri and L. gasseri varied between 51-56% and 44-49%, respectively. Furthermore, the ambiguous Lactobacillus reads mapped to one or more of the expected 16S rRNA genome locations in L. paragasseri and L. gasseri, as illustrated in Figure 4A. The inability of taxonomic profiling to differentiate and classify these reads is due to the nearly identical 16S rRNA sequences (99.9%) of L. gasseri and L. paragasseri [42,43]. Ene et al. found that the two species cannot be distinguished by short-read sequencing of the 16S rRNA gene, as they differ only by two nucleotides at positions 95 (C/T) in the V1 region and 1046 (A/T) in the V6 region [43]. Additionally, these positions and nucleotides may vary between unique strains of L. paragasseri and L. gasseri [43]. In our samples, V1V2 and V5V7 consensus sequences (derived from mapped reads) aligned with L. paragasseri (NR179257) over L. gasseri (NR975051). This alignment was confirmed by distinguishing nucleotides at positions 101 (G/A) and 1052 (T/A) (Figure 4B).
Fungal species were generally rare and detected at very low reads abundance. Taxonomic analysis of ITS sequences identified Candida albicans as the sole fungal species in 7 of 66 samples (11%). The sample IDs along with their corresponding CST were as follows: 30663-001 (III), 30663-010 (III), 30856-002 (IV-B), 30856-006 (IV-A), 30856-008 (IV-A), 30856-009 (III), and 30856-017 (I). The respective mapped read counts for these samples were 1,136; 462; 194; 316; 10,911; 88; and 112, as illustrated in Supplementary Figure S2 (bar chart). Only sample 30856-008 (CST IV-A) exhibited a significantly elevated ITS read count compared to all other samples, suggesting a potential infection rather than typical low-level commensal presence.
2.2. Diversity Analysis and Visualization of Microbial Communities
The “Merge and Estimate Alpha and Beta Diversities” workflow produced the following outputs: (1) an alpha diversity rarefaction table and plots, and (2) a beta diversity distance matrix alongside principal coordinate analysis (PCoA) plots. The alpha diversity metric is calculated by sub-sampling abundances at varying depths (number of reads) for each sample. As illustrated in Figure 5A, the rarefaction curves for Simpson’s and Shannon indices reached a plateau at 28,000 reads, signifying adequate sampling depth. This indicates that at 28,000 reads, most species have been captured, with minimal gain from further sampling. Figure 5B presents box plots for grouped samples classified by CST, accompanied by the auto-calculated statistical results. Notably, CST IV-A and IV-B demonstrated significantly higher species richness (Simpson’s index) and species evenness (Shannon entropy) in comparison to the reference group, CST I.
The beta diversity analysis produced a Bray-Curtis distance matrix and a visual representation in the form of a 3D PCoA plot, where each sample is represented as a point in three-dimensional space. The Bray-Curtis statistic quantifies the compositional dissimilarity between samples. The PCoA plot (Figure 6) highlights the dissimilarities in microbial composition across all samples, with L. crispatus, G. vaginalis, and L. iners identified as the key species influencing these differences, as represented along the principal coordinates. When grouped by CST, the most influential microbial communities were CST I, IV-B, and III, accounting for 36%, 17%, and 9% of the variance, respectively, as illustrated in Figure 5B.
2.3. Differential Abundance Analysis and Visualization Using Hierarchical Clustering Heatmaps
The “Create Heat Map for Abundance Table” workflow generated a two-way hierarchical clustering heatmap, organizing both the rows (samples) and columns (species) based on their similarity (Figure 7A). The accompanying dendrogram illustrates the grouping patterns among items, while the heatmap itself uses a two-color gradient to visually represent variations in species abundance across the dataset. Figure 7A illustrates the clustering of 66 samples based on CST. Samples dominated by Lactobacillus spp., characterized by high relative abundance, are distributed along the blue-to-red gradient of the heatmap. In contrast, Lactobacillus-depleted samples (CST IV-B) are predominantly located within the red spectrum. To aid interpretation, Lactobacillus spp. are highlighted in blue along the y-axis, while major clusters of anaerobic bacteria are highlighted in pink. Figure 7B presents aggregated heatmaps categorized by CST profiles, Pap smear diagnoses, and HPV genotype or status, categorized as HPV-negative, HPV-positive (non-16), and HPV-16. These visualizations enable direct comparison of microbial compositions across groups, revealing that the dominant anaerobic species associated with CST IV-B (vaginal dysbiosis) are also prevalent in samples diagnosed with HSIL and those positive for HPV-16.
3. Discussion
In this study, we developed and tested a standardized workflow for 16S/ITS metagenomic sequencing of CVM. The goal was to detect biases in the workflow that could impact the correlation between microbial communities and HPV. Bias in the 16S rRNA V-region was detected, as revealed by the uneven distribution of metagenomic reads among the six microbial species that were equally represented in the genomic standard. This discrepancy could be attributed to primer or sequencing bias. The amplified and sequenced V3V4 region was the most evenly distributed among all V-regions but failed to detect L. gasseri. The V1V2 region detected L. gasseri, though the proportions of G. vaginalis and Mycoplasma hominis were lower compared to other species. Clinical samples further revealed that species detection varied across the V1 to V9 regions. L. crispatus was only identified in the V1V2 and V7V9 regions, while L. jensenii was detected in all V-regions except V4V5. Finally, ambiguous Lactobacillus reads were mapped to L. paragasseri due to its nearly identical 16S rRNA sequence to L. gasseri, which required analysis using the V1V2 and V5V7 regions. Our results demonstrated inherent amplification biases in 16S rRNA metagenomic sequencing, ranging from non-detection to skewed microbial abundance levels. Therefore, to enhance accuracy, sequencing data from the V1V2 region for species identification and the V3V4 region for abundance estimation were used in a complementary manner for each sample. This multi-V-region approach to microbiome analysis is supported by other researchers in the field [44,45]. In summation, the 16S rRNA screening panel and mock community standard were critical for detecting bias and ensuring accurate microbiome profiling, thereby supporting robust downstream association analyses.
Among the 66 cytology-derived CVM, 30 unique species were identified. The microbial community characteristics and distribution were highly consistent with the CST I-V categories defined by Ravel and Gajer, et al. [11,13]. Specifically, the CST distribution across the 66 samples were as follows: CST I (24%), CST II (5%), CST III (36%), CST IV-A (6%), CST IV-B (23%), and CST V (6%). Unique to this study, we clustered the Lactobacillus abundance levels within each sample to quantify three Lactobacillus states: L.-dominant (CST I-III and V), L.-diminished (CST IV-A), and L.-depleted (CST IV-B). Quantifying Lactobacillus states made CST classification objective and readily automatable through algorithmic approaches, in contrast to earlier studies [11,13,14]. For all the L.-diminished (CST IV-A) and L.-depleted (CST IV-B) samples, the dominant Lactobacillus spp. was L. iners, while the dominant opportunistic pathogen was G. vaginalis. L. iners is known to be associated with other opportunistic pathogens and episodes of dysbiosis [46]. A comprehensive review by Vaneechoutte [46] highlighted several unusual characteristics of L. iners compared to other commensal Lactobacillus spp. to include the lack of D-lactic acid production (resulting in high pH), limited hydrogen peroxide production, production of inerolysin (a cytotoxin), and adherence to vaginal epithelial cells, as well as promotion of adherence by G. vaginalis [46]. In contrast, L. crispatus is regarded as a key defender against vaginal dysbiosis, characterized by a substantially larger genome and enhanced metabolic capabilities [46,47,48]. It adheres to the vaginal epithelium, promotes competitive exclusion of other bacteria, produces D-lactic acid (lowering vaginal pH), generates hydrogen peroxide, and inhibits opportunistic pathogens [46,47,48]. As for L. gasseri and L. jensenii, these species are less effective than L. crispatus in maintaining eubiosis [46,47,48]. Bifidobacterium breve was also detected at low abundances in samples dominated by Lactobacillus. Freita et al. demonstrated that all vaginal Bifidobacterium species can produce and tolerate lactic acid and low pH, although only about one-third generate hydrogen peroxide [49]. Consequently, Bifidobacterium is also recognized as a contributor to the protective functions of the vaginal microbiome [49].
As Lactobacillus dominance declined from the diminished to the depleted state, species diversity, richness, and evenness increased significantly. Essentially, the dominion of Lactobacillus within the vagina was eradicated by a plethora of anaerobic, opportunistic pathogens. Beta-diversity analysis revealed three key species associated with the most influential microbial communities across all samples: L. crispatus (CST I), G. vaginalis (CST IV-B), and L. iners (CST III). Within CST IV-B, hierarchical clustering identified five distinct species clusters among the 19 species. The top seven anaerobes (G. vaginalis, P. bivia, A. vaginae, S. sanguinegens, S. amnii, M. indolicus, and Coriobacteriales bacterium) were predominantly associated with CST IV-B, HSIL and HPV-16 positive samples. In particular, the three most abundant species (G. vaginalis, Prevotella bivia and Atopobium vaginae) are well-documented microbial co-occurrents. Di Paola et al. identified sialidase-producing strains of G. vaginalis that form biofilms for survival in symbiotic relationships with Atopobium and Prevotella [50]. Moreover, the sialidase-encoding gene in G. vaginalis was significantly more abundant in CST IV-B samples and in samples from the HPV-persistent cohort compared to those in the HPV-cleared group [50]. Mechanistically, the biofilm produced by G. vaginalis traps anaerobic pathobionts like Atopobium and Prevotella, promotes their overgrowth, which leads to inflammation, epithelial breakdown, and HPV persistence [50]. Beyond dysbiosis, Zhou et al. highlighted the pivotal role of inflammation, along with its associated cytokines, signaling pathways, and oxidative/nitrative stress in promoting HPV infection, tumor proliferation, and carcinogenesis [51]. Conversely, HPV infection itself can trigger inflammatory responses, activating macrophages and natural killer (NK) cells, and inducing the release of pro-inflammatory cytokines, thereby contributing to a state of dysbiosis [51]. Together, HPV and dysbiosis work in concert in a milieu of inflammation to promote carcinogenesis.
The facultative and anaerobic pathogens identified in CST IV-B of this study are implicated in clinically significant polymicrobial infections and chronic inflammation, which predisposes host tissues to malignant transformation. The virulence and diseases associated with each infectious agent are highlighted below. First, G. vaginalis, Atopobium vaginae and Prevotella bivia have all been associated with both lower and upper female genital tract infections, including bacterial vaginosis (BV), pelvic inflammatory disease (PID), endometritis, and preterm birth [52,53]. Sneathia sanguinegens and Sneathia amnii are emerging pathogens connected to BV, cervical intraepithelial neoplasia (CIN), and preterm birth [54,55,56]. Mageeibacillus indolicus, a relatively novel member of the order Clostridiales, has been isolated from the endometrium of women with PID [57]. Coriobacteriales bacterium has been found in higher abundance in BV cases and in the gut and skin microbiota of postmenopausal women with vulvar lichen sclerosus [58,59]. Porphyromonas uenonis has been linked to CIN as well as oral and esophageal squamous cell carcinoma [60]. Mobiluncus mulieris frequently co-occurs with Gardnerella and Atopobium in BV cases [61,62]. Campylobacter ureolyticus is an underrecognized pathogen implicated in soft tissue infections, abscesses, and infective endocarditis [63,64]. Peptoniphilus koenoeneniae is an emerging opportunistic pathogen associated with abscesses and chronic sinusitis [65,66]. In a case-control study of pregnant women, Veillonellaceae bacterium was associated with BV and linked to early preterm birth [67]). Aerococcus christensenii is a commensal organism isolated from cases of urinary tract infections (UTIs), polymicrobial infections, abscesses, and soft tissue infections [68]. Parvimonas micra, another commensal bacterium, has been associated with infective endocarditis, osteomyelitis, empyema, and infections in immunocompromised individuals [69,70,71]. Mycoplasma hominis colonizes the urogenital tract and is linked to urethritis, BV, PID, and infertility [72,73]. Burkholderia cenocepacia is a well-known opportunistic pathogen capable of causing severe respiratory infections, particularly in immunocompromised patients [74,75]. Anaerococcus vaginalis is a biofilm-forming bacterium associated with BV, ovarian abscesses, and other anaerobic infections, often within polymicrobial environments [76]. Dialister propionicifaciens has been linked to BV, while Dialister micraerophilus has been identified in polymicrobial infections, abscesses, and pyometra [77,78,79]. Finally, Group B Streptococcus (GBS), or Streptococcus agalactiae, is a leading cause of invasive infections in newborns, pregnant women, and immunocompromised adults [80,81,82,83,84]. In neonates, it’s the primary cause of early-onset sepsis, pneumonia, and meningitis [80,81,82,83,84]. In pregnancy, GBS can lead to UTIs, chorioamnionitis, preterm labor, and postpartum infections [80,81,82,83,84]. In non-pregnant adults, it’s linked to bacteremia, skin infections, and endocarditis [84]. Collectively, the opportunistic pathogens identified in CST IV-B have the potential to cause serious infections and substantial morbidity under conducive environmental and host conditions.
Fungal ITS sequencing detected Candida albicans in 7 out of 66 samples (11%). Notably, one sample (30856-008) classified as microbial CST IV-A showed a significantly elevated ITS read count, indicating a potential infection rather than mere commensal presence. These findings are consistent with a previous study that utilized combined 16S rRNA and ITS sequencing, which reported that ITS reads constituted only a small proportion of the total sequences and identified Candida albicans as the predominant fungal species in healthy women [85]. Although the overall number of Candida albicans-positive samples was low, three of the seven (43%) were associated with CST IV profiles. Candida albicans has been linked to vaginal dysbiosis and shows an inverse relationship with Lactobacillus species [86,87,88]. In fact, Lactobacilli have demonstrated inhibitory effects on Candida through a variety of mechanisms [86,87,88]. Finally, chronic inflammation resulting from candidiasis has been implicated in HPV persistence, cervical cancer, and carcinogenesis in multiple studies [89].
The strength of this study lies in our use of the 16S/ITS screening panel and a streamlined, wet-to-dry lab workflow, which enabled us to identify variable region bias effectively. By employing genomic standards alongside clinical samples, we were able to pinpoint both qualitative and quantitative biases in taxonomic profiling. Additionally, our study characterized three distinct Lactobacillus states and identified the dominant pathogenic microbial species associated with the Lactobacillus-depleted state (CST IV-B), which may contribute to a microenvironment conducive to carcinogenesis. This comprehensive approach underscores the robustness of our findings in elucidating microbial contributions to HPV-associated carcinogenesis.
We recognize several limitations in our study. First, the vaginal genomic standard included a limited number of microbial species. Expanding this panel to incorporate L. crispatus, L. iners, L. paragasseri, and Atopobium vaginae would enhance taxonomic resolution by providing a more comprehensive set of quantifiable reference species, encompassing both commensals and pathogens. Second, due to the cross-sectional design of our study, we are unable to infer causality between CST IV-B-associated microbial pathogens and HPV infection or high-grade cervical cytopathology. Longitudinal studies are necessary to investigate these associations over time.
4. Materials and Methods
4.1. Clinical Samples, Mock Genomic Standard and Deep Sequencing
A subset of 70 unique cervical cytology samples classified as NILM (n = 10), ASCUS (n = 12 ), LSIL (n = 24), and HSIL (n = 24) were randomly selected from a larger (3,000+ samples) Congressionally Directed Medical Research Programs (CDMRP) grant-funded project to test our workflow-based methods described herein. The residual liquid-based cervical cytology samples were procured consecutively from the Department of Pathology after completion of cytological diagnosis. Demographic and cytological data were abstracted from the electronic health record (AHLTA) as metadata for association with taxonomic profiling results. The subjects of the current samples had a median age of 28 years, with an interquartile range (IQR) of 24 to 32 years. The HPV deep sequencing data, previously published [90], were utilized to explore associations with the microbiome.
Total DNA extraction was performed after off-board cellular lysis using the QIAsymphony DSP DNA Midi Kit (96) in a QIAsymphony robotic workstation (Qiagen, Germantown, MD, USA). The extracted DNA from each sample (20 uL with concentration of ≥ 20 ng/uL) was submitted to Qiagen Genomic Services (QIAGEN, Germantown, MD) for 16S/ITS amplicon NGS. The QIAseq 16S/ITS Screening Panel (Germantown, MD) was used for DNA library target enrichment and downstream microbial classification [38]. Per manufacturer’s protocol, the QIAseq 16S/ITS Panel utilizes a 2-stage PCR workflow briefly described and shown below (Figure 8A). The first round of PCR amplifies and enriches the 16S rRNA variable (V1V2, V2V3, V3V4, V4V5, V5V7, V7V9) and ITS regions of the extracted DNA (Figure 8B). The second round of PCR adds library adapters to the ends of amplicons to serve as barcodes for multiplexing samples. The libraries were normalized quantitatively for equimolar representation from each sample prior to pooling and sequencing. Paired-end bi-directional sequencing (2 × 300 bp) was performed on the MiSeq instrument (Illumina, San Diego, CA, USA) using the MiSeq Reagent Kit v3 (600-cycles) for bridge amplification.
The ATCC Vaginal Microbiome Genomic Mix (ATCC MSA-1007) was used as a mock standard to mimic metagenomic samples and assess PCR and/or sequencing bias [39]. The product includes an even mixture of genomic DNA from six bacteria (16.7% G. vaginalis (ATCC 14019D-5), 16.7% L. gasseri (ATCC 33323D-5), 16.7% M. hominis (ATCC 23114D-5), 16.7% P. bivia (ATCC 29303D-5), 16.7% S. agalactiae (ATCC BAA-611D-5), and 16.7% L. jensenii (ATCC 25258D-5). The genomic specification range was: 1.2x10⁸ genome copies/50 uL vial ± 1 log. Two (10uL) replicate samples of the ATCC vaginal genomic mix with a DNA concentration of 7.5 ng/uL were submitted for concurrent 16S/ITS NGS as described above.
4.2. Customized Vaginal Microbiota Reference Database for CLC Workflows
The comprehensive SILVA rRNA gene database (https://www.arb-silva.de/) provides sequences for both small (16S/18S, SSU) and large (23S/28S, LSU) rRNA subunits across Bacteria, Archaea, and Eukarya [91]. The SILVA SSU 99% (v138.1) dataset, comprising 510,508 sequences (accessed on June 12, 2022), was imported into CLC and tailored for use as a reference database for vaginal microbiota studies. The customization process excluded sequences with broad or unclear taxonomic classifications at the species level, filtering out terms like “Archaea,” “Eukaryota,” “Uncultured,” “Unidentified,” and “metagenome.” Furthermore, the top 10 species from vaginal community state types (CST) I-V, as identified by the Human Microbiome Project [92], were included to ensure representation of essential vaginal commensal and pathogenic bacteria. An additional 10 pathogenic bacterial genomes, referenced in the literature, were downloaded from NCBI and incorporated into the database. The final Vaginal Microbiota Reference Database was categorized into three main sequence groups: Lactobacillus (n = 319), non-Lactobacillus (n = 882), and Gonorrhea (n = 31)/Chlamydia (n = 53), encompassing a total of 1,284 unique rRNA sequences (Supplementary Table S5). The customized Vaginal Microbiota Reference Database was renamed as VAGIBIOTA for simplicity.
The SILVA database organizes taxonomic information into seven ranks [91]. For instance, L. crispatus is classified as follows: Domain: Bacteria; Phylum: Firmicutes; Class: Bacilli; Order: Lactobacillales; Family: Lactobacillaceae; Genus: Lactobacillus; Species: Crispatus. Additional genomes obtained from NCBI were annotated using the same taxonomy. The annotated genome sequences were then compiled into three distinct CLC database formats: (1) Vaginal Microbiome Taxonomic Profiling Index, (2) Vaginal Microbiome Sequence List, and (3) Vaginal Microbiome BLAST database (Figure 9A) [41]. The CLC tools used for this process included Create Taxonomic Profiling Index, Sequence List, and Create BLAST Database [41]. These three reference databases were subsequently integrated and applied in specific workflows and tools, namely: (1) Taxonomic Profiling, (2) Map Reads to Reference, and (3) multi-BLAST tool.
4.3. Data Quality Control (QC), Taxonomic Profiling, and Read Mapping
For this project, CLC Genomics Workbench versions 22.0.2 to 25.0.1 [40] and CLC Microbial Genomics Module (MGM) versions 22.1 to 25.0.1 [41] (Redwood City, CA, USA) were installed on an HP notebook equipped with an Intel i7-7500U dual-core processor running at 2.70 GHz and 8 GB of RAM. The MGM provides a range of pre-built workflows and tools, as depicted in Figure 9A. Initially, the QIAseq 16S/ITS demultiplexer tool was employed to segregate NGS reads based on the barcodes of bacterial 16S rRNA variable regions (V1V2, V2V3, V3V4, V4V5, V5V7, V7V9) and fungal ITS regions, as obtained using the QIAGEN QIAseq 16S/ITS screening panel. The tool generated sequence lists for each region, which were subsequently fed into the Data QC and Taxonomic Profiling workflow. Taxonomic Profiling then aligned each input read to a reference sequence, accompanied by qualification and quantification data to create an abundance table. The abundance table was utilized in abundance analysis workflows or tools for visualization and statistical analyses [41].
The pre-built “Data QC and Taxonomic Profiling” workflow, including its input/output data, processing steps, and directional flow (arrows), is depicted in Figure 9B. The analysis involved four main steps: Data Import, Data QC, Taxonomic Profiling, and Visualization of the Abundance Table. The process began with the import of FASTQ files generated from sequencing as paired-end (forward and reverse) reads, which were merged using the “Import Illumina” tool and placed into a newly created “input” folder. Next, the workflow was launched by selecting “Run,” initiating the following tasks: (1) selecting input files, (2) preprocessing reads through quality trimming (with a quality score cutoff of 0.05, ambiguity limit ≤ 2, and adapter trimming), (3) mapping and assigning 16S or ITS reads to the respective VAGIBIOTA or UNITE reference index, and (4) quantifying and generating an abundance table for each sample after filtering out low-abundance Operational Taxonomic Units (OTUs), defined as those with fewer than 50 reads or representing less than 1.0% of total reads.
Reads classified as “Lactobacillus species unknown” by taxonomic profiling were extracted and mapped to the VAGIBIOTA reference sequence list using the “Map Reads to Reference” workflow (Figure 9C). The mapping process involved three key steps: importing paired-end reads, aligning reads to reference genomes, and generating a read mapping output file. The resulting table displayed the identified microbial species along with their corresponding read counts. To validate the mapping results, the “Extract Consensus” tool was employed to retrieve the consensus sequence from the reads for BLAST analysis [41].
Following taxonomic profiling and speciating Lactobacillus spp. unknown reads, the vaginal microbial composition of each sample was classified into the five community state types (CST I-V) as defined by Ravel et al. [11]. CST I, II, III, and V are dominated by Lactobacillus spp., accounting for more than 50% of the total species. Specifically, CST I-III and V are dominated by L. crispatus, L. gasseri, L. iners, and L. jensenii, respectively. In contrast, CST IV is predominantly composed of gram-negative, non-Lactobacillus species, with Lactobacillus spp. making up less than 50%. Gajer et al. further divided CST IV into subcategories IV-A and IV-B, with IV-A characterized by “modest proportions” of Lactobacillus spp. and low levels of anaerobic bacteria [13]. To quantify the proportions of Lactobacillus spp. among the CSTs, cluster analysis was performed to broadly group all samples into three Lactobacillus states: L.-dominant (CST I-III and V), L.-diminished (IV-A), and L.- depleted (CST IV-B). Partition clustering with k-means (k = 3) and Euclidean distance was employed to group samples based on the abundance levels (%) of Lactobacillus spp. The mean and 95% confidence intervals were then calculated to determine the abundance levels (%) of Lactobacillus spp. for each cluster, distinguishing between CST.
The final steps of taxonomic profiling were as follows. First, the taxonomic tables from all samples were combined into a single table using the “Merge Abundance Tables” tool. Next, clinical metadata, including CST classification in .xlsx format, was integrated into the merged taxon table with the “Add Metadata to Abundance Table” tool. Finally, the merged abundance table was grouped by features such as “CST,” “HPV,” and “Pap” using the “Aggregate feature” option for grouped analysis.
4.4. Estimate Alpha and Beta Diversities Workflow
The pre-built “Merge and Estimate Alpha and Beta Diversities” workflow (Figure 9C) was employed to analyze and compare vaginal microbial communities within samples and between groups. The analysis included three main steps: importing and merging abundance tables, conducting alpha and beta diversity analyses, and visualizing diversity plots. The workflow began by selecting “Run” to execute the following tasks: (1) selecting cleaned microbial abundance tables with appended metadata, (2) merging the abundance tables, (3) calculating α-diversity to evaluate within-sample variation, and (4) calculating β-diversity to assess variation between samples. For this study, two α-diversity measures were computed, i.e., Simpson’s index [41]: SI = 1 , and Shannon entropy [41]: H = log2pi, where n was the number of microbial species found in the sample, and pi was the proportion of reads that were identified as the ith microbial species. The workflow produced rarefaction curves, boxplots, and automated Mann-Whitney U statistical results, which compared alpha diversity indices across groups.
β-diversity, reflecting differences in microbial composition (proportion) between groups, was assessed using Bray-Curtis distances which is a metric of dissimilarity based on species abundance. The resulting distance matrix quantified inter-sample variation. Principal Coordinate Analysis (PCoA) was used to visualize these differences in 3D space. Statistical significance between group centroids and dispersion was evaluated using the permutational multivariate analysis of variance (PERMANOVA) tool.
4.5. Differential Abundance and Heatmap Analysis of Cervicovaginal Microbiota
The “Differential Abundance Analysis” tool was employed to analyze vaginal microbial abundance across CST groups using CST I as the reference. The merged abundance table served as input for pairwise comparisons, generating fold changes, p-values, and adjusted p-values (FDR or Bonferroni) via the Wald test [41]. A Venn diagram was auto-generated to visualize overlaps in the pairwise comparisons. The “Create Heat Map for Abundance Table” tool was employed to generate a hierarchically clustered heat map, illustrating variations in microbial species composition across individual or grouped samples. Parameters were set with 1-Pearson correlation for distance and average linkage for clustering [41].
4.6. Statistical Analysis
Data were summarized using means with 95% CI, medians with interquartile ranges (IQRs), and proportions. Non-parametric hypothesis tests, namely, Wilcoxon rank-sum, Kruskal-Wallis, and PERMANOVA were applied to numerical, ordinal, and multivariate data, respectively. The Wald test assessed differential abundance, and chi-square was used for categorical comparisons. Significance was set at p < 0.05. Analyses were performed using the built-in functions of CLC tools and STATA/IC 17.0 (StataCorp LP).
5. Conclusions
In conclusion, this study highlighted the importance of a standardized workflow using the 16S rRNA V1–V9 screening panel and a mock genomic standard to detect bias and enhance accuracy in HPV-related microbiome analysis. By systematically identifying sources of methodological bias, we established a robust framework for reliable microbiome research. These insights not only address current challenges but also open new avenues for exploring HPV-associated microbiomes across diverse anatomical econiches. Continued advancements in sequencing technologies will be essential for overcoming methodological limitations and improving analytical precision. Ultimately, this work will contribute meaningfully to advancing our understanding of carcinogenesis driven by HPV and microbe-associated inflammation.
Supplementary Materials
The following supporting information can be downloaded at the website of this paper posted on Preprints.org, Figure S1: Taxon Profiles 16S V1-V9, N-66; Figure S2: Fungal ITS Reads, N-7; Table S1: Supplementary QC Report 30856-002; Table S2: Taxon Profiles, N-66; Table S3: Metadata, N-72; Table S4: Differential Abundance CST I-V, N-66; Table S5: VAGIBIOTA Database, N-1,284.
Author Contributions
Conceptualization, J.S.-G. and Y.W.; methodology, J.S.-G, Q.X. and Y.W.; database, J.S.-G.; validation, J.S.-G. and Y.W.; formal analysis, J.S.-G. and Y.W.; investigation, J.S.-G., Q.X.; resources, J.S.-G. and Y.W.; data curation, J.S.-G., Q.X., H.C., and Y.W.; writing—original draft preparation, J.S.-G.; writing—review & editing, J.S.-G., Q.X., H.C. and Y.W.; visualization, J.S.-G. and Y.W.; supervision, J.S.-G. and Y.W.; project administration, J.S.-G. and Y.W.; funding acquisition, J.S.-G. All authors have read and agreed to the published version of the manuscript.
Funding
This research was funded in part by the DoD Congressionally Directed Medical Research Programs (CDMRP) grant to J.SG (#CDMRPL-16-0-DM160469).
Institutional Review Board Statement
This study was conducted according to the guidelines of the Declaration of Helsinki and approved by the institutional review board of Brooke Army Medical Center (protocol code C.2017.090d, approval date 9 June 2017).
Informed Consent Statement
Patient consent was waived due to research involving no more than minimal risk to subjects, the waiver will not adversely affect the rights and welfare of the subjects, and research could not practicably be carried out without the waiver.
Data Availability Statement
The dataset (demultiplexed V1V2 and V3V4 FASTQ files) presented in this study are openly available in the NCBI Sequence Read Archive (SRA). Title: Cervicovaginal microbiome and HPV: A standardized workflow from 16S/ITS NGS to microbial community profiling. BioProject Accession Number: PRJNA1270007; BioSample Accession Numbers: SAMN48809336 to 48809403.
Use of Artificial Intelligence
We acknowledge the assistance of Microsoft Copilot (https://www.microsoft.com/en-us/microsoft-365/copilot/copilot-for-work (accessed on 6 June 2025)) for providing language and grammar editing support.
Acknowledgments
The following figures, created using BioRender, are available online either in full or in part. Graphical Abstract: https://BioRender.com/hvc17su; Figure 8A: https://BioRender.com/ji7ocl4; Figure 8B: https://BioRender.com/wioqi11. The bacterial and fungal icons were created using BioRender.com.
Conflicts of Interest
No potential conflicts of interest were disclosed by the authors. The funders had no role in the design of the study; in the collection, analyses, or interpretation of data; in the writing of the manuscript, or in the decision to publish the results.
Author’s Note
This paper has undergone PAO review at Brooke Army Medical Center and was cleared for publication. The view(s) expressed herein are those of the authors and do not reflect the official policy or position of Brooke Army Medical Center, the United States Army Medical Department, the United States Army Office of the Surgeon General, the Department of the Army, the Department of the Air Force, or the Department of Defense or the United States Government.
Abbreviations
ASCUS, Atypical Squamous Cells of Undetermined Significance; BV, bacterial vaginitis or vaginosis; CIN, Cervical Intraepithelial Neoplasia; CSM, cervicovaginal microbiota; CST, Community State Types; GBS, Group B Streptococcus; HSIL, High-grade Squamous Intraepithelial Lesion; IQR, interquartile range; LSIL, Low-grade Squamous Intraepithelial Lesion; MGM, CLC Microbial Genomics Module; NGS, next-generation sequencing; NILM, Negative for Intraepithelial Lesion or Malignancy; PCoA, principal coordinate analysis; PID, Pelvic Inflammatory Disease; QC, Quality Control; UTI, urinary tract infection
References
- Dunkelberg, WE. First isolation of Gardnerella vaginalis. J Clin Microbiol. 1991 Dec;29(12):2911. [CrossRef]
- Gardner HL, Dukes CD. New etiologic agent in nonspecific bacterial vaginitis. Science. 1954 Nov 19;120(3125):853. [CrossRef]
- Gardner HL, Dukes CD. Haemophilus vaginalis vaginitis: a newly defined specific infection previously classified non-specific vaginitis. Am J Obstet Gynecol. 1955 May;69(5):962-76.
- Paramel Jayaprakash T, Schellenberg JJ, Hill JE. Resolution and characterization of distinct cpn60-based subgroups of Gardnerella vaginalis in the vaginal microbiota. PLoS One. 2012;7(8):e43009. [CrossRef]
- Gelber SE, Aguilar JL, Lewis KL, Ratner AJ. Functional and phylogenetic characterization of Vaginolysin, the human-specific cytolysin from Gardnerella vaginalis. J Bacteriol. 2008 Jun;190(11):3896-903. [CrossRef]
- World Health Organization (WHO). Bacterial vaginosis. Available online: https://www.who.int/news-room/fact-sheets/detail/bacterial-vaginosis (accessed on 06 June 2025).
- Shvartsman E, Hill JE, Sandstrom P, MacDonald KS. Gardnerella Revisited: Species Heterogeneity, Virulence Factors, Mucosal Immune Responses, and Contributions to Bacterial Vaginosis. Infect Immun. 2023 May 16;91(5):e0039022. [CrossRef]
- Swidsinski S, Moll WM, Swidsinski A. Bacterial Vaginosis-Vaginal Polymicrobial Biofilms and Dysbiosis. Dtsch Arztebl Int. 2023 May 19;120(20):347-354. [CrossRef]
- Castro J, Rosca AS, Cools P, Vaneechoutte M, Cerca N. Gardnerella vaginalis Enhances Atopobium vaginae Viability in an in vitro Model. Front Cell Infect Microbiol. 2020 Mar 4;10:83. [CrossRef]
- Janulaitiene M, Gegzna V, Baranauskiene L, Bulavaitė A, Simanavicius M, Pleckaityte M. Phenotypic characterization of Gardnerella vaginalis subgroups suggests differences in their virulence potential. PLoS One. 2018 Jul 12;13(7):e0200625. [CrossRef]
- Ravel J, Gajer P, Abdo Z, Schneider GM, Koenig SS, McCulle SL, Karlebach S, Gorle R, Russell J, Tacket CO, Brotman RM, Davis CC, Ault K, Peralta L, Forney LJ. Vaginal microbiome of reproductive-age women. Proc Natl Acad Sci U S A. 2011 Mar 15;108 Suppl 1(Suppl 1):4680-7. [CrossRef]
- Callahan BJ, DiGiulio DB, Goltsman DSA, Sun CL, Costello EK, Jeganathan P, Biggio JR, Wong RJ, Druzin ML, Shaw GM, Stevenson DK, Holmes SP, Relman DA. Replication and refinement of a vaginal microbial signature of preterm birth in two racially distinct cohorts of US women. Proc Natl Acad Sci U S A. 2017 Sep 12;114(37):9966-9971. [CrossRef]
- Gajer P, Brotman RM, Bai G, Sakamoto J, Schütte UM, Zhong X, Koenig SS, Fu L, Ma ZS, Zhou X, Abdo Z, Forney LJ, Ravel J. Temporal dynamics of the human vaginal microbiota. Sci Transl Med. 2012 May 2;4(132):132ra52. [CrossRef]
- Ma ZS, Li L. Quantifying the human vaginal community state types (CSTs) with the species specificity index. PeerJ. 2017 Jun 27;5:e3366. [CrossRef]
- Du L, Dong X, Song J, Lei T, Liu X, Lan Y, Liu X, Wang J, Yue B, He M, Fan Z, Guo T. Temporal and spatial differences in the vaginal microbiome of Chinese healthy women. PeerJ. 2023 Dec 1;11:e16438. [CrossRef]
- Cocomazzi G, Contu V, De Stefani S, Del Pup L, Buccheri M, Antinori M, Parmegiani L, De Ruvo D, Marino F, Virgili E, Allen C, Palini S, Ciampaglia W, Cerboneschi M, Baldini D, Baldini GM, Pazienza V. Refining Unfavorable Vaginal Microbial Community in Infertile Women Subjected to Precision Probiotic Intervention: An Exploratory Single-Arm, Prospective, Open-Label, Interventional Study. Microorganisms. 2025 Feb 28;13(3):547. [CrossRef]
- Molina MA, Andralojc KM, Huynen MA, Leenders WPJ, Melchers WJG. In-depth insights into cervicovaginal microbial communities and hrHPV infections using high-resolution microbiome profiling. NPJ Biofilms Microbiomes. 2022 Sep 28;8(1):75. [CrossRef]
- Leon-Gomez P, Romero VI. Human papillomavirus, vaginal microbiota and metagenomics: the interplay between development and progression of cervical cancer. Front Microbiol. 2025 Jan 22;15:1515258. [CrossRef]
- Alizhan D, Ukybassova T, Bapayeva G, Aimagambetova G, Kongrtay K, Kamzayeva N, Terzic M. Cervicovaginal Microbiome: Physiology, Age-Related Changes, and Protective Role Against Human Papillomavirus Infection. J Clin Med. 2025 Feb 24;14(5):1521. [CrossRef]
- Norenhag J, Du J, Olovsson M, Verstraelen H, Engstrand L, Brusselaers N. The vaginal microbiota, human papillomavirus and cervical dysplasia: a systematic review and network meta-analysis. BJOG. 2020 Jan;127(2):171-180. [CrossRef]
- Nicolò S, Tanturli M, Mattiuz G, Antonelli A, Baccani I, Bonaiuto C, Baldi S, Nannini G, Menicatti M, Bartolucci G, Rossolini GM, Amedei A, Torcia MG. Vaginal Lactobacilli and Vaginal Dysbiosis-Associated Bacteria Differently Affect Cervical Epithelial and Immune Homeostasis and Anti-Viral Defenses. Int J Mol Sci. 2021 Jun 17;22(12):6487. [CrossRef]
- Musa J, Maiga M, Green SJ, Magaji FA, Maryam AJ, Okolo M, Nyam CJ, Cosmas NT, Silas OA, Imade GE, Zheng Y, Joyce BT, Diakite B, Morhason-Bello I, Achenbach CJ, Sagay AS, Ujah IAO, Murphy RL, Hou L, Mehta SD. Vaginal microbiome community state types and high-risk human papillomaviruses in cervical precancer and cancer in North-central Nigeria. BMC Cancer. 2023 Jul 20;23(1):683. [CrossRef]
- Mitra A, MacIntyre DA, Lee YS, Smith A, Marchesi JR, Lehne B, Bhatia R, Lyons D, Paraskevaidis E, Li JV, Holmes E, Nicholson JK, Bennett PR, Kyrgiou M. Cervical intraepithelial neoplasia disease progression is associated with increased vaginal microbiome diversity. Sci Rep. 2015 Nov 17;5:16865. [CrossRef]
- Sharifian K, Shoja Z, Jalilvand S. The interplay between human papillomavirus and vaginal microbiota in cervical cancer development. Virol J. 2023 Apr 19;20(1):73. [CrossRef]
- Wu M, Li H, Yu H, Yan Y, Wang C, Teng F, Fan A, Xue F. Disturbances of Vaginal Microbiome Composition in Human Papillomavirus Infection and Cervical Carcinogenesis: A Qualitative Systematic Review. Front Oncol. 2022 Jul 12;12:941741. [CrossRef]
- Garcia EM, Kraskauskiene V, Koblinski JE, Jefferson KK. Interaction of Gardnerella vaginalis and Vaginolysin with the Apical versus Basolateral Face of a Three-Dimensional Model of Vaginal Epithelium. Infect Immun. 2019 Mar 25;87(4):e00646-18. [CrossRef]
- Hussain SP, Harris CC. Inflammation and cancer: an ancient link with novel potentials. Int J Cancer. 2007 Dec 1;121(11):2373-80. [CrossRef]
- Okada F, Fujii J. Molecular mechanisms of inflammation-induced carcinogenesis. Journal of Clinical Biochemistry and Nutrition 2006;39(3):103-113. [CrossRef]
- Wu Y, Antony S, Meitzler JL, Doroshow JH. Molecular mechanisms underlying chronic inflammation-associated cancers. Cancer Lett. 2014 Apr 10;345(2):164-73. [CrossRef]
- Lonkar P, Dedon PC. Reactive species and DNA damage in chronic inflammation: reconciling chemical mechanisms and biological fates. Int J Cancer. 2011 May 1;128(9):1999-2009. [CrossRef]
- Singh N, Baby D, Rajguru JP, Patil PB, Thakkannavar SS, Pujari VB. Inflammation and cancer. Ann Afr Med. 2019 Jul-Sep;18(3):121-126. [CrossRef]
- Poretsky R, Rodriguez-R LM, Luo C, Tsementzi D, Konstantinidis KT. Strengths and limitations of 16S rRNA gene amplicon sequencing in revealing temporal microbial community dynamics. PLoS One. 2014 Apr 8;9(4):e93827. [CrossRef]
- Graspeuntner S, Loeper N, Künzel S, Baines JF, Rupp J. Selection of validated hypervariable regions is crucial in 16S-based microbiota studies of the female genital tract. Sci Rep. 2018 Jun 26;8(1):9678. [CrossRef]
- Weinroth MD, Belk AD, Dean C, Noyes N, Dittoe DK, Rothrock MJ, Ricke SC, Myer PR, Henniger MT, Ramírez GA, Oakley BB, Summers KL, Miles AM, Ault-Seay TB, Yu Z, Metcalf JL, Wells JE. Considerations and best practices in animal science 16S ribosomal RNA gene sequencing microbiome studies. J Anim Sci. 2022 Feb 1;100(2):skab346. [CrossRef]
- Abellan-Schneyder I, Matchado MS, Reitmeier S, Sommer A, Sewald Z, Baumbach J, List M, Neuhaus K. Primer, Pipelines, Parameters: Issues in 16S rRNA Gene Sequencing. mSphere. 2021 Feb 24;6(1):e01202-20. [CrossRef]
- Regueira-Iglesias A, Balsa-Castro C, Blanco-Pintos T, Tomás I. Critical review of 16S rRNA gene sequencing workflow in microbiome studies: From primer selection to advanced data analysis. Mol Oral Microbiol. 2023 Oct;38(5):347-399. [CrossRef]
- Hill, J. and Albert A. Resolution and cooccurrence patterns of gardnerella leopoldii, g. swidsinskii, g. piotii, and g. vaginalis within the vaginal microbiome. Infection and Immunity 2019;87(12). [CrossRef]
- Qiagen: QIAseq 16S/ITS Screening Panels and Index Kits. Available online: https://www.qiagen.com/us/products/next-generation-sequencing/metagenomics/targeted-metagenomics/qiaseq-16s-its-screening-panels-and-index-kits (accessed on 06 June 2025).
- American Type Culture Collection (ATCC). Vaginal Microbiome Genomic Mix. Available online: https://www.atcc.org/products/msa-1007 (accessed on 06 June 2025).
- Qiagen Digital Insights. CLC Genomics Workbench 25.0.1. Available online: https://resources.qiagenbioinformatics.com/manuals/clcgenomicsworkbench/current/index.php?manual=Introduction_CLC_Genomics_Workbench.html (accessed on 06 June 2025).
- Qiagen Digital Insights. CLC Microbial Genomics Module 25.0.1. Available online: https://resources.qiagenbioinformatics.com/manuals/clcmgm/current/index.php?manual=Introduction.html (accessed on 08 May 2025).
- Tanizawa Y, Tada I, Kobayashi H, Endo A, Maeno S, Toyoda A, Arita M, Nakamura Y, Sakamoto M, Ohkuma M, Tohno M. Lactobacillus paragasseri sp. nov., a sister taxon of Lactobacillus gasseri, based on whole-genome sequence analyses. Int J Syst Evol Microbiol. 2018 Nov;68(11):3512-3517. [CrossRef]
- Ene A, Stegman N, Wolfe A, Putonti C. Genomic insights into Lactobacillus gasseri and Lactobacillus paragasseri. PeerJ. 2022 Jun 7;10:e13479. [CrossRef]
- Katiraei S, Anvar Y, Hoving L, Berbée JFP, van Harmelen V, Willems van Dijk K. Evaluation of Full-Length Versus V4-Region 16S rRNA Sequencing for Phylogenetic Analysis of Mouse Intestinal Microbiota After a Dietary Intervention. Curr Microbiol. 2022 Jul 30;79(9):276. [CrossRef]
- Graham AS, Patel F, Little F, van der Kouwe A, Kaba M, Holmes MJ. Using short-read 16S rRNA sequencing of multiple variable regions to generate high-quality results to a species level. Front Bioinform. 2025 Mar 17;5:1484113. [CrossRef]
- Vaneechoutte, M. Lactobacillus iners, the unusual suspect. Res Microbiol. 2017 Nov-Dec;168(9-10):826-836. [CrossRef]
- Vaneechoutte, M. The human vaginal microbial community. Res Microbiol. 2017 Nov-Dec;168(9-10):811-825. [CrossRef]
- France MT, Mendes-Soares H, Forney LJ. Genomic Comparisons of Lactobacillus crispatus and Lactobacillus iners Reveal Potential Ecological Drivers of Community Composition in the Vagina. Appl Environ Microbiol. 2016 Nov 21;82(24):7063-7073. [CrossRef]
- Freitas AC, Hill JE. Quantification, isolation and characterization of Bifidobacterium from the vaginal microbiomes of reproductive aged women. Anaerobe. 2017 Oct;47:145-156. [CrossRef]
- Di Paola M, Sani C, Clemente AM, Iossa A, Perissi E, Castronovo G, Tanturli M, Rivero D, Cozzolino F, Cavalieri D, Carozzi F, De Filippo C, Torcia MG. Characterization of cervico-vaginal microbiota in women developing persistent high-risk Human Papillomavirus infection. Sci Rep. 2017 Aug 31;7(1):10200. [CrossRef]
- Zhou ZW, Long HZ, Cheng Y, Luo HY, Wen DD, Gao LC. From Microbiome to Inflammation: The Key Drivers of Cervical Cancer. Front Microbiol. 2021 Nov 15;12:767931. [CrossRef]
- Horrocks V, Hind CK, Wand ME, Fady PE, Chan J, Hopkins JC, Houston GL, Tribe RM, Sutton JM, Mason AJ. Nuclear Magnetic Resonance Metabolomics of Symbioses between Bacterial Vaginosis-Associated Bacteria. mSphere. 2022 Jun 29;7(3):e0016622. [CrossRef]
- Haggerty CL, Totten PA, Tang G, Astete SG, Ferris MJ, Norori J, Bass DC, Martin DH, Taylor BD, Ness RB. Identification of novel microbes associated with pelvic inflammatory disease and infertility. Sex Transm Infect. 2016 Sep;92(6):441-6. [CrossRef]
- Peng Y, Tang Q, Wu S, Zhao C. Associations of Atopobium, Garderella, Megasphaera, Prevotella, Sneathia, and Streptococcus with human papillomavirus infection, cervical intraepithelial neoplasia, and cancer: a systematic review and meta-analysis. BMC Infect Dis. 2025 May 16;25(1):708. [CrossRef]
- Zhao F, Chen Y, Gao J, Wu M, Li C, Wang Z, Huang N, Cui L, Du M, Ying C. Characterization of Vaginal Microbiota in Women with Recurrent Spontaneous Abortion That Can Be Modified by Drug Treatment. Front Cell Infect Microbiol. 2021 Aug 19;11:680643. [CrossRef]
- Gruwier L, Sprenkels A, Hulsbosch S, Vankeerberghen A, Cartuyvels R. Sneathia amnii bacteraemia and chorioamnionitis leading to second trimester abortion: a case report. Access Microbiol. 2021 Dec 9;3(12):000290. [CrossRef]
- Austin MN, Rabe LK, Srinivasan S, Fredricks DN, Wiesenfeld HC, Hillier SL. Mageeibacillus indolicus gen. nov., sp. nov.: a novel bacterium isolated from the female genital tract. Anaerobe. 2015 Apr;32:37-42. [CrossRef]
- Gao J, Peng Y, Jiang N, Shi Y, Ying C. High-Throughput Sequencing-Based Analysis of Changes in the Vaginal Microbiome during the Disease Course of Patients with Bacterial Vaginosis: A Case-Control Study. Biology (Basel). 2022 Dec 10;11(12):1797. [CrossRef]
- Ma X, Wen G, Zhao Z, Lu L, Li T, Gao N, Han G. Alternations in the human skin, gut and vaginal microbiomes in perimenopausal or postmenopausal Vulvar lichen sclerosus. Sci Rep. 2024 Apr 10;14(1):8429. [CrossRef]
- Zhu H, Yip HC, Cheung MK, Chan HC, Ng C, Lau EHL, Yeung ZWC, Wong EWY, Leung L, Qu X, Wang D, Cai L, Chan PKS, Chan JYK, Chen Z. Convergent dysbiosis of upper aerodigestive microbiota between patients with esophageal and oral cavity squamous cell carcinoma. Int J Cancer. 2023 May 1;152(9):1903-1915. [CrossRef]
- Chen I, Kelkar YD, Gu Y, Zhou J, Qiu X, Wu H. High-dimensional linear state space models for dynamic microbial interaction networks. PLoS One. 2017 Nov 15;12(11):e0187822. [CrossRef]
- Machado A, Cerca N. Influence of Biofilm Formation by Gardnerella vaginalis and Other Anaerobes on Bacterial Vaginosis. J Infect Dis. 2015 Dec 15;212(12):1856-61. [CrossRef]
- Obregon M, Khan A. Cardiac Tamponade Caused by Campylobacter ureolyticus Purulent Effusion. Cureus. 2024 Mar 12;16(3):e56051. [CrossRef]
- Maki JJ, Howard M, Connelly S, Pettengill MA, Hardy DJ, Cameron A. Species Delineation and Comparative Genomics within the Campylobacter ureolyticus Complex. J Clin Microbiol. 2023 May 23;61(5):e0004623. [CrossRef]
- Jung MY, Cho JH, Shin Y, Paek J, Park IS, Kim JS, Kim W, Ma JY, Park SJ, Chang YH. Peptoniphilus rhinitidis sp. nov., isolated from specimens of chronic rhinosinusitis. Anaerobe. 2014 Dec;30:30-4. [CrossRef]
- Beye M, Bakour S, Le Dault E, Rathored J, Michelle C, Cadoret F, Raoult D, Fournier PE. Peptoniphilus lacydonensis sp. nov., a new human-associated species isolated from a patient with chronic refractory sinusitis. New Microbes New Infect. 2018 Feb 28;23:61-69. [CrossRef]
- Tabatabaei N, Eren AM, Barreiro LB, Yotova V, Dumaine A, Allard C, Fraser WD. Vaginal microbiome in early pregnancy and subsequent risk of spontaneous preterm birth: a case-control study. BJOG. 2019 Feb;126(3):349-358. [CrossRef]
- Carlstein C, Marie Søes L, Jørgen Christensen J. Aerococcus christensenii as Part of Severe Polymicrobial Chorioamnionitis in a Pregnant Woman. Open Microbiol J. 2016 Mar 10;10:27-31. [CrossRef]
- Aziz M, Hartley K, Chadha D. Recurrent Cerebral Embolic Infarcts in a Patient with a Mechanical Valve: A Rare Case of Infective Endocarditis Caused by Parvimonas micra. Cureus. 2024 Oct 15;16(10):e71521. [CrossRef]
- Itagaki S, Kenzaka T. Pyogenic Spondylitis Caused by Parvimonas micra: A Case Report. Cureus. 2023 Nov 11;15(11):e48665. [CrossRef]
- Higashi DL, Krieger MC, Qin H, Zou Z, Palmer EA, Kreth J, Merritt J. Who is in the driver’s seat? Parvimonas micra: An understudied pathobiont at the crossroads of dysbiotic disease and cancer. Environ Microbiol Rep. 2023 Aug;15(4):254-264. [CrossRef]
- Ma C, Du J, Dou Y, Chen R, Li Y, Zhao L, Liu H, Zhang K. The Associations of Genital Mycoplasmas with Female Infertility and Adverse Pregnancy Outcomes: a Systematic Review and Meta-analysis. Reprod Sci. 2021 Nov;28(11):3013-3031. [CrossRef]
- Hong X, Yin J, Wang W, Zhao F, Ding X, Yu H, Zhang X, Wang B. The associations between low abundance of Mycoplasma hominis and female fecundability: a pregnancy-planning cohort study. BMC Microbiol. 2022 May 5;22(1):121. [CrossRef]
- Periaiah P, Antony T, Samuel S. Identification of Burkholderia cepacia Complex: Comparing Conventional, Automated, and Molecular Methods in a Tertiary Care Center. Cureus. 2024 Oct 4;16(10):e70847. [CrossRef]
- Ganesan S, Sajjan US. Host evasion by Burkholderia cenocepacia. Front Cell Infect Microbiol. 2012 Jan 11;1:25. [CrossRef]
- Hugon P, Mishra AK, Robert C, Raoult D, Fournier PE. Non-contiguous finished genome sequence and description of Anaerococcus vaginalis. Stand Genomic Sci. 2012 Jul 30;6(3):356-65. [CrossRef]
- Jumas-Bilak E, Jean-Pierre H, Carlier JP, Teyssier C, Bernard K, Gay B, Campos J, Morio F, Marchandin H. Dialister micraerophilus sp. nov. and Dialister propionicifaciens sp. nov., isolated from human clinical samples. Int J Syst Evol Microbiol. 2005 Nov;55(Pt 6):2471-2478. [CrossRef]
- Eastment MC, Balkus JE, Richardson BA, Srinivasan S, Kimani J, Anzala O, Schwebke J, Fiedler TL, Fredricks DN, McClelland RS. Association Between Vaginal Bacterial Microbiota and Vaginal Yeast Colonization. J Infect Dis. 2021 Mar 3;223(5):914-923. [CrossRef]
- Kitagawa H, Tadera K, Omori K, Nomura T, Shigemoto N, Ohge H. A case of bacteremia caused by Dialister micraerophilus with Enterocloster clostridioformis and Eggerthella lenta in a patient with pyometra. BMC Infect Dis. 2024 Jan 24;24(1):128. [CrossRef]
- WHO: Group B Streptococcus infection causes an estimated 150,000 preventable stillbirths and infant deaths every year. Available online: https://www.who.int/news/item/05-11-2017-group-b-streptococcus-infection-causes-an-estimated-150-000-preventable-stillbirths-and-infant-deaths-every-year (accessed on 06 June 2025).
- Yuan XY, Liu HZ, Liu JF, Sun Y, Song Y. Pathogenic mechanism, detection methods and clinical significance of group B Streptococcus. Future Microbiol. 2021 Jun;16:671-685. [CrossRef]
- ACOG Committee Opinion. Prevention of Group B Streptococcal Early-Onset Disease in Newborns No. 797. Feb 2020. Available online: https://www.acog.org/clinical/clinical-guidance/committee-opinion/articles/2020/02/prevention-of-group-b-streptococcal-early-onset-disease-in-newborns. (accessed on 06 June 2025).
- Raabe VN, Shane AL. Group B Streptococcus (Streptococcus agalactiae). Microbiol Spectr. 2019 Mar;7(2):10.1128/microbiolspec.gpp3-0007-2018. [CrossRef]
- Takeda S, Tanaka Y, Takeichi Y, Hirata H, Tabuchi A. A rare case of right-sided infective endocarditis caused by group B Streptococcus complicated with septic knee arthritis and subcutaneous abscess in the lower extremity. Acute Med Surg. 2019 Sep 17;7(1):e456. [CrossRef]
- Virtanen S, Saqib S, Kanerva T, Ventin-Holmberg R, Nieminen P, Holster T, Kalliala I, Salonen A. Metagenome-validated combined amplicon sequencing and text mining-based annotations for simultaneous profiling of bacteria and fungi: vaginal microbiota and mycobiota in healthy women. Microbiome. 2024 Dec 28;12(1):273. [CrossRef]
- Valentine M, Wilson D, Gresnigt MS, Hube B. Vaginal Candida albicans infections: host-pathogen-microbiome interactions. FEMS Microbiol Rev. 2025 Jan 14;49:fuaf013. [CrossRef]
- Sun Z, Ge X, Qiu B, Xiang Z, Jiang C, Wu J, Li Y. Vulvovaginal candidiasis and vaginal microflora interaction: Microflora changes and probiotic therapy. Front Cell Infect Microbiol. 2023 Feb 3;13:1123026. [CrossRef]
- Pedro NA, Mira NP. A molecular view on the interference established between vaginal Lactobacilli and pathogenic Candida species: Challenges and opportunities for the development of new therapies. Microbiol Res. 2024 Apr;281:127628. [CrossRef]
- de Souza AC, Rodrigues Paula C, da Silva Ruiz L, Ramos Margarido PF, Ereno Auler M, Paula Cristina Lorenzi N, Moreira D, Oliveira dos Santos RL, Tacla M, Crosato EM, Domaneschi C. Relation between CANDIDA species isolated from vaginal mucosa and lesions caused by high-risk human papillomavirus hpv for cervical cancer. Revista De Patologia Tropical / Journal of Tropical Pathology 2021;50(3):212-222. [CrossRef]
- Shen-Gunther J, Xia Q, Cai H, Wang Y. HPV DeepSeq: An Ultra-Fast Method of NGS Data Analysis and Visualization Using Automated Workflows and a Customized Papillomavirus Database in CLC Genomics Workbench. Pathogens. 2021 Aug 13;10(8):1026. [CrossRef]
- Quast C, Pruesse E, Yilmaz P, Gerken J, Schweer T, Yarza P, Peplies J, Glöckner FO. The SILVA ribosomal RNA gene database project: improved data processing and web-based tools. Nucleic Acids Res. 2013 Jan;41(Database issue):D590-6. [CrossRef]
- Human Microbiome Project Consortium. Structure, function and diversity of the healthy human microbiome. Nature. 2012 Jun 13;486(7402):207-14. [CrossRef]
Figure 1.
16S/ITS NGS read counts. (A) Boxplot showing read count distribution across 16S hypervariable regions for 66 clinical samples. With V1V2 as the comparator, V2V3 showed higher and V7V9 lower read counts (Wilcoxon rank-sum test, *p < 0.05), suggesting primer bias. (B) ITS read counts across 66 samples had a median of 2 (range: 0–18,708) with a right-skewed distribution; only 15 samples had sufficient reads (≥100) for downstream taxonomic profiling.
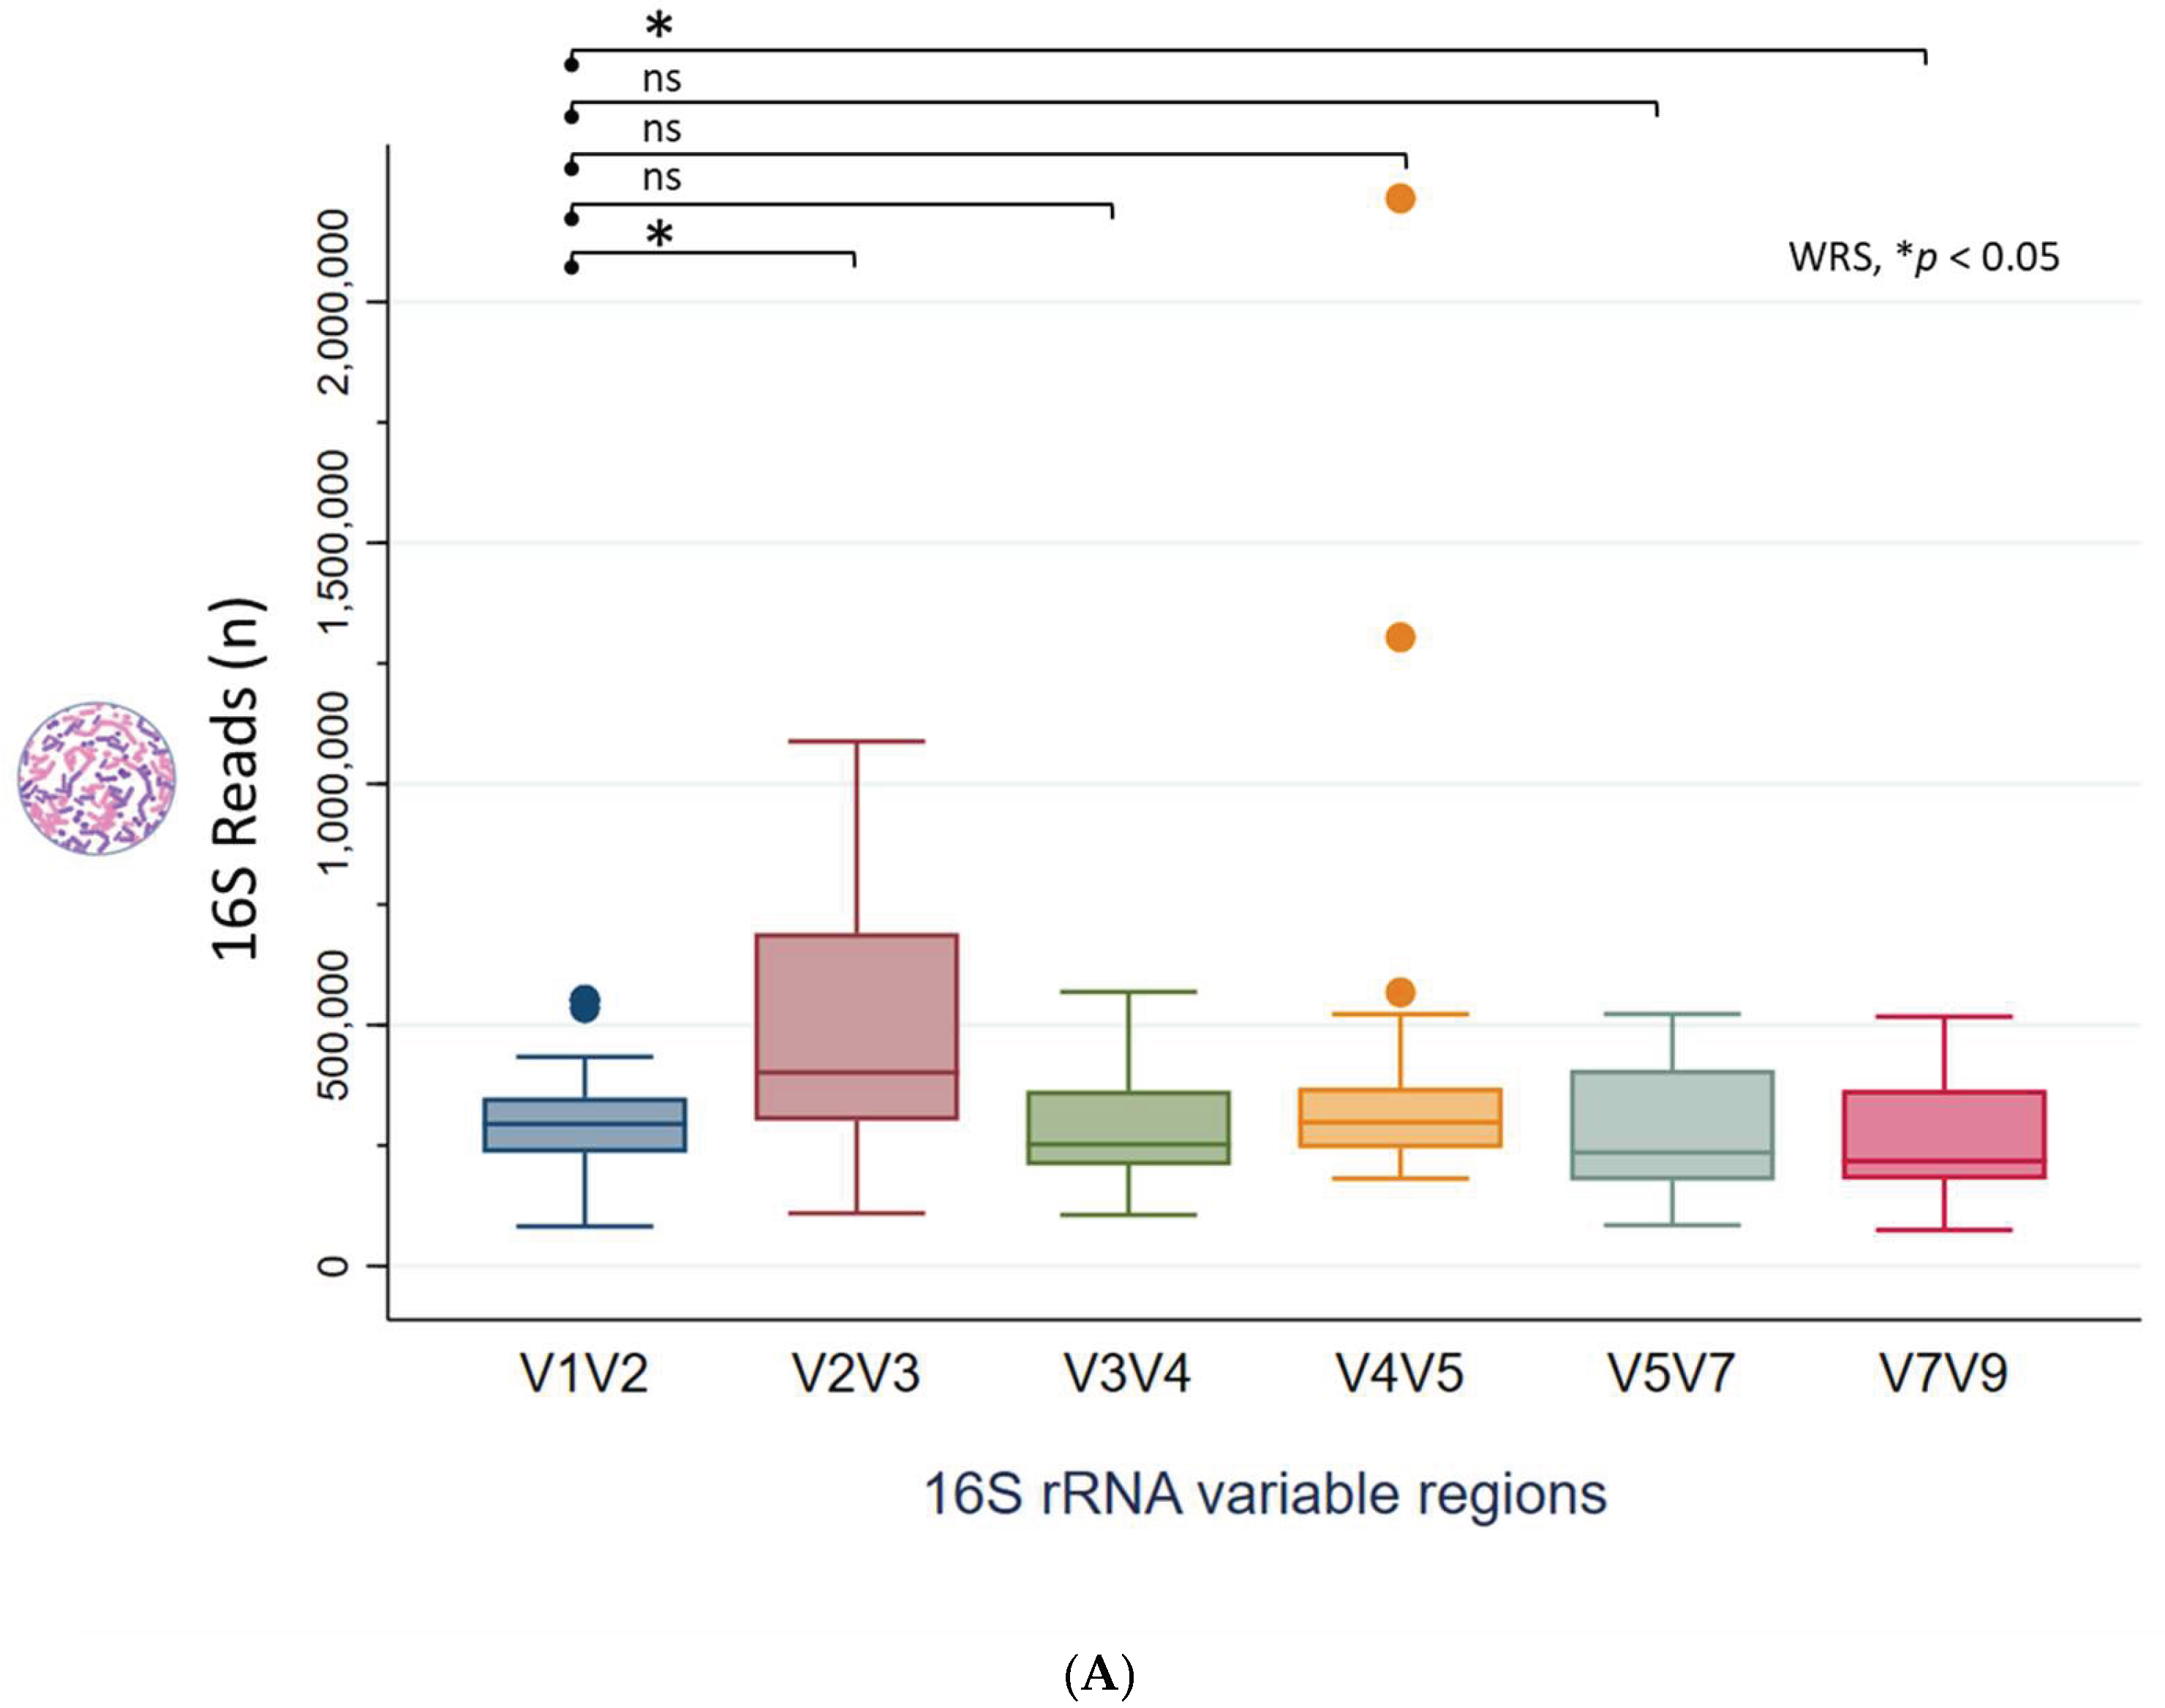
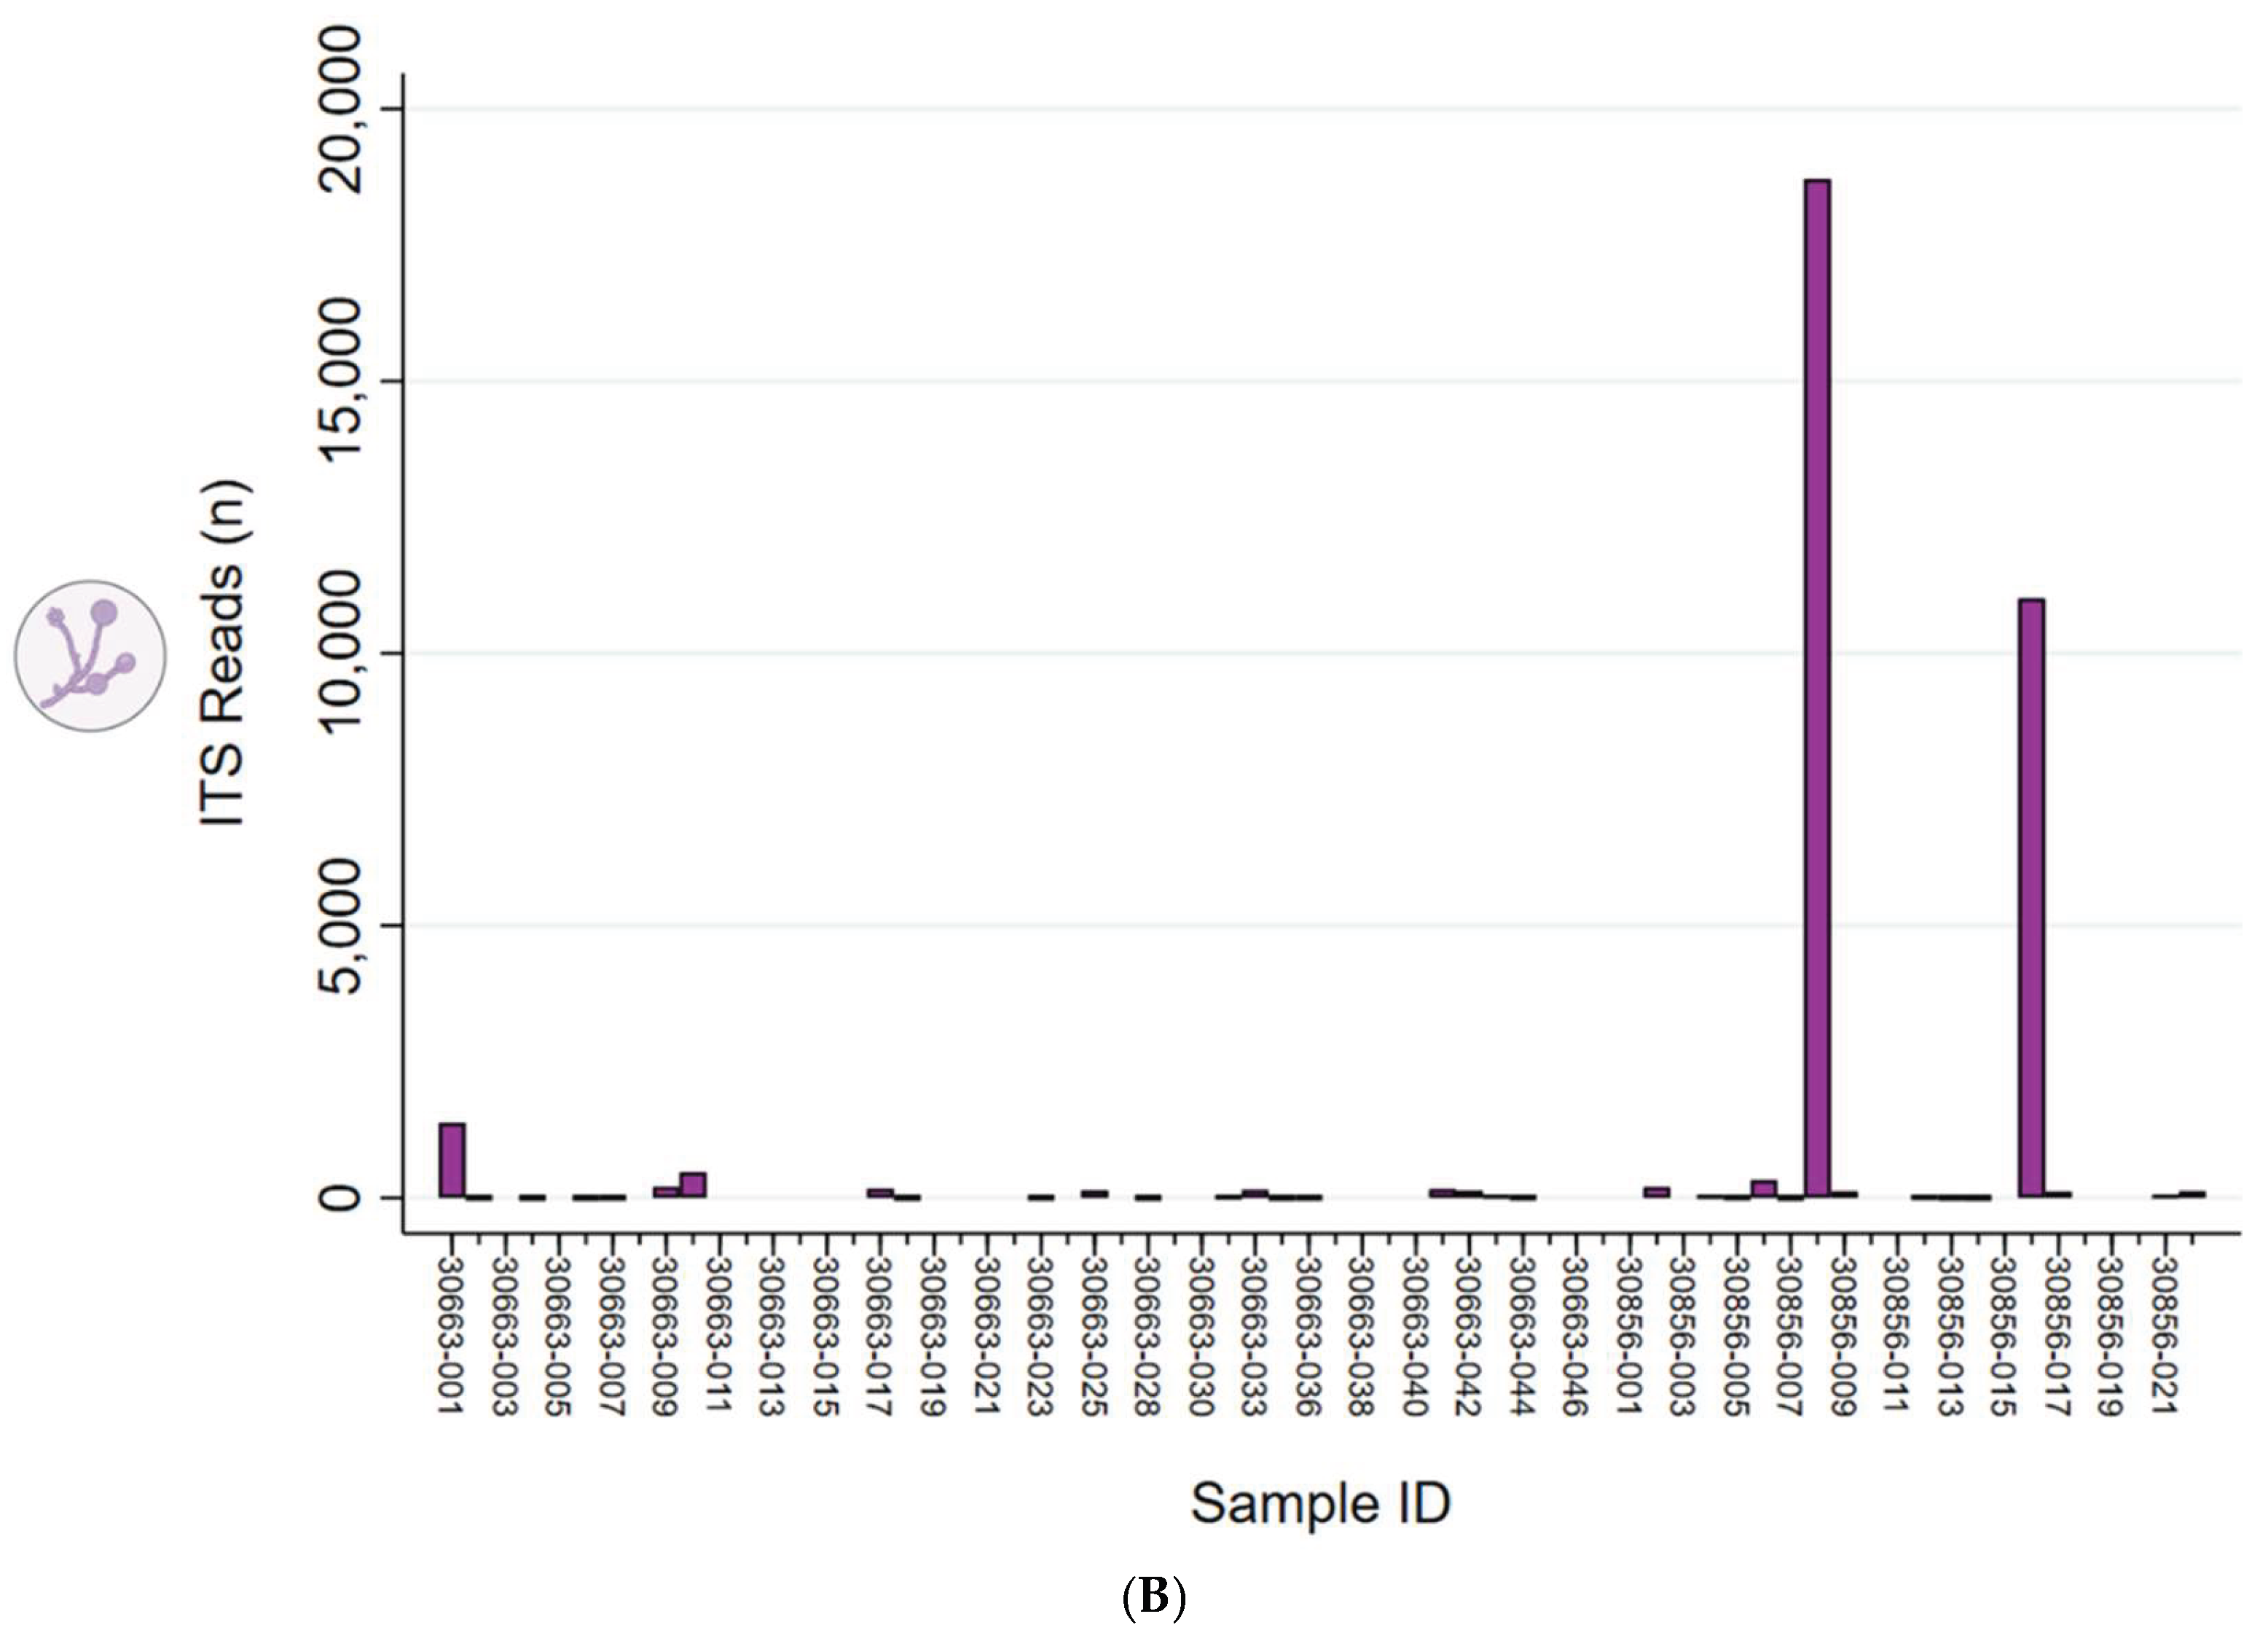
Figure 2.
Taxonomic profiles of the ATCC vaginal microbiome standard and six cytology samples representing Community State Types (CST) I-V. (A) Six microbial species in the ATCC standard (each at 16.7%) were sequenced in replicate across V-regions and shown as stacked bars. Species-level specificity varied by region: only V1V2 detected L. gasseri, while V4V5 missed L. jensenii. V3V4 showed the most balanced representation across replicates. (B) Stacked bar plots show taxonomic profiles from six cytology samples representing CST I–V, each dominated respectively by L. crispatus, L. gasseri, L. iners, mixed anaerobic bacteria, and L. jensenii. Species-level detection varied by V-region: L. crispatus (CST I) was identified only by V1V2 and V7V9; L. gasseri (CST II) only by V1V2; L. iners (CST III) was consistently detected across all regions; and L. jensenii (CST IV-A and V) was absent in V4V5.
Figure 3.
Cervicovaginal microbiome profiles of 66 cytology samples. (A). The dot plot shows Lactobacillus abundance per sample. Clustering identified three Lactobacillus states: L.-dominant (CST I–III, V), L.-diminished (IV-A), and L.-depleted (IV-B) based on abundance levels. Mean values with 95% CI and red reference lines distinguish these states. (B). The stacked bar chart shows microbial composition (%) per sample, based on the proportion of mapped reads. Of 30 species identified by 16S sequencing, the top 17 are shown in the legend. For each sample, the V-region with the best species-level resolution is displayed. (C) The merged stacked bar chart shows microbial composition by CST, highlighting the dominant species within each group. (D) The Venn diagram compares species abundance across CST, using CST I as the reference. Unique species in CST II–V appear in the “starfish” arms, with those showing >1.5-fold change noted in parentheses. CST IV-B had the most unique (n = 18) and significantly shifted species (n = 27).
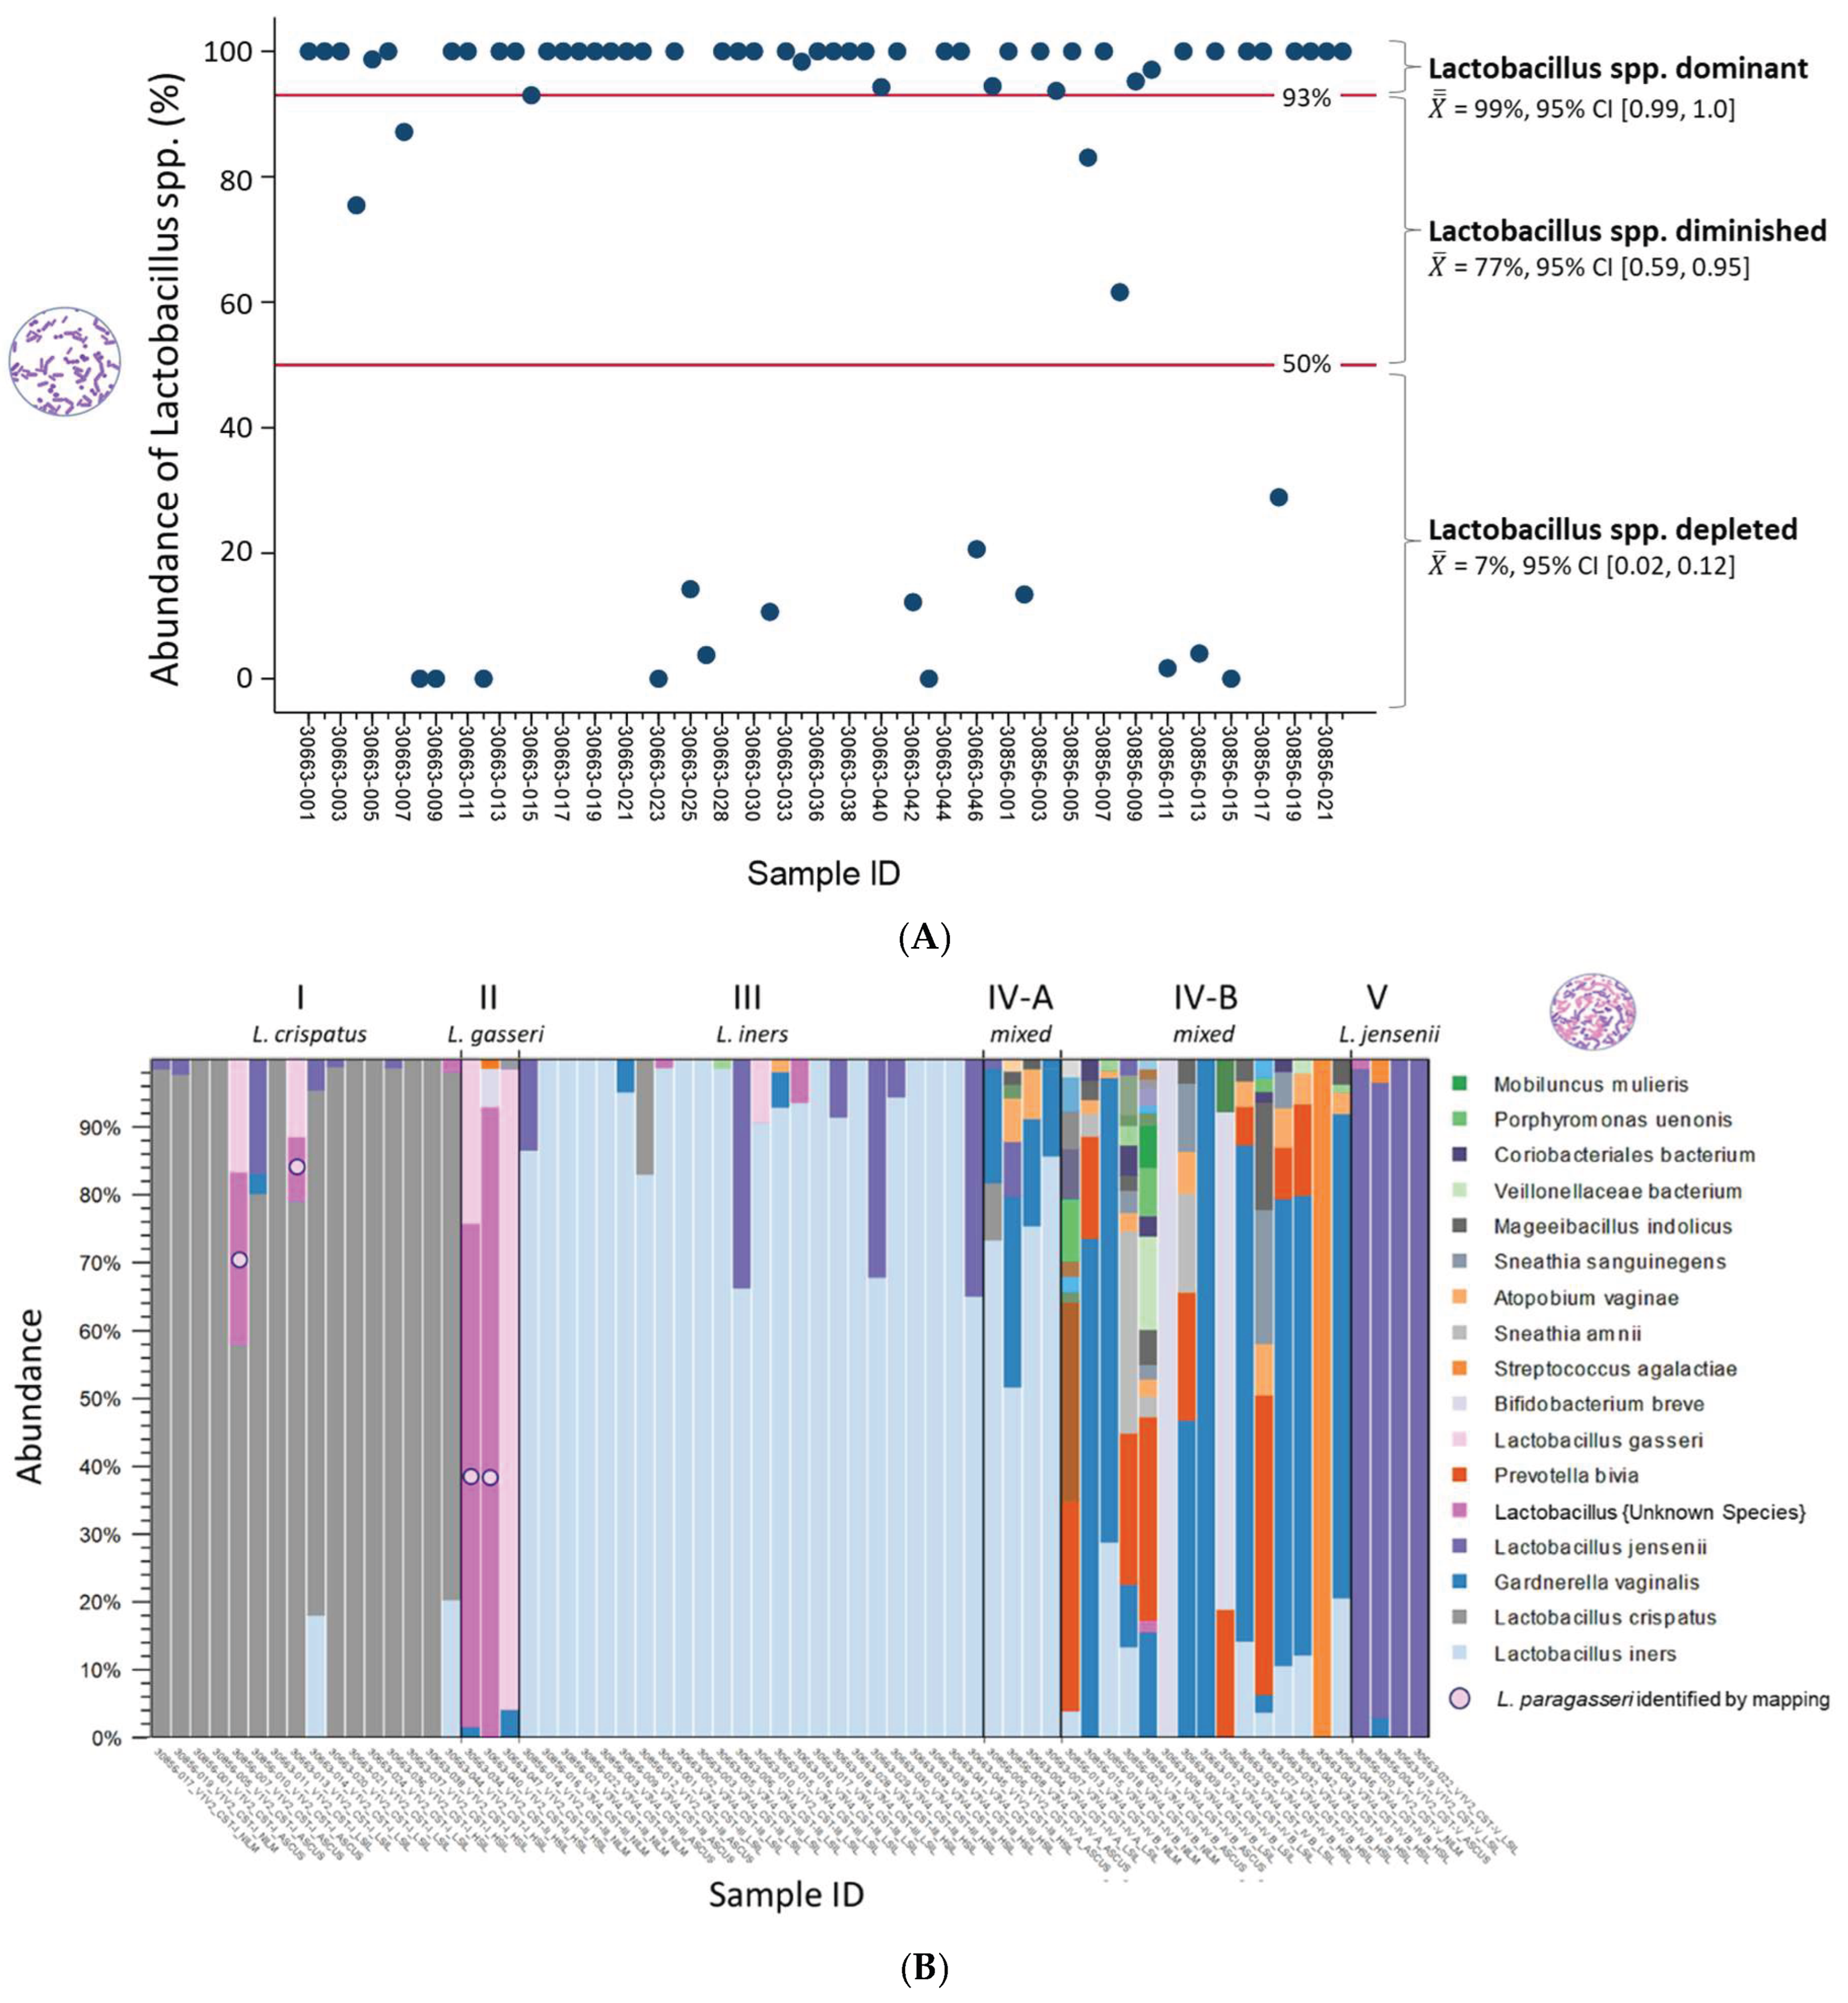
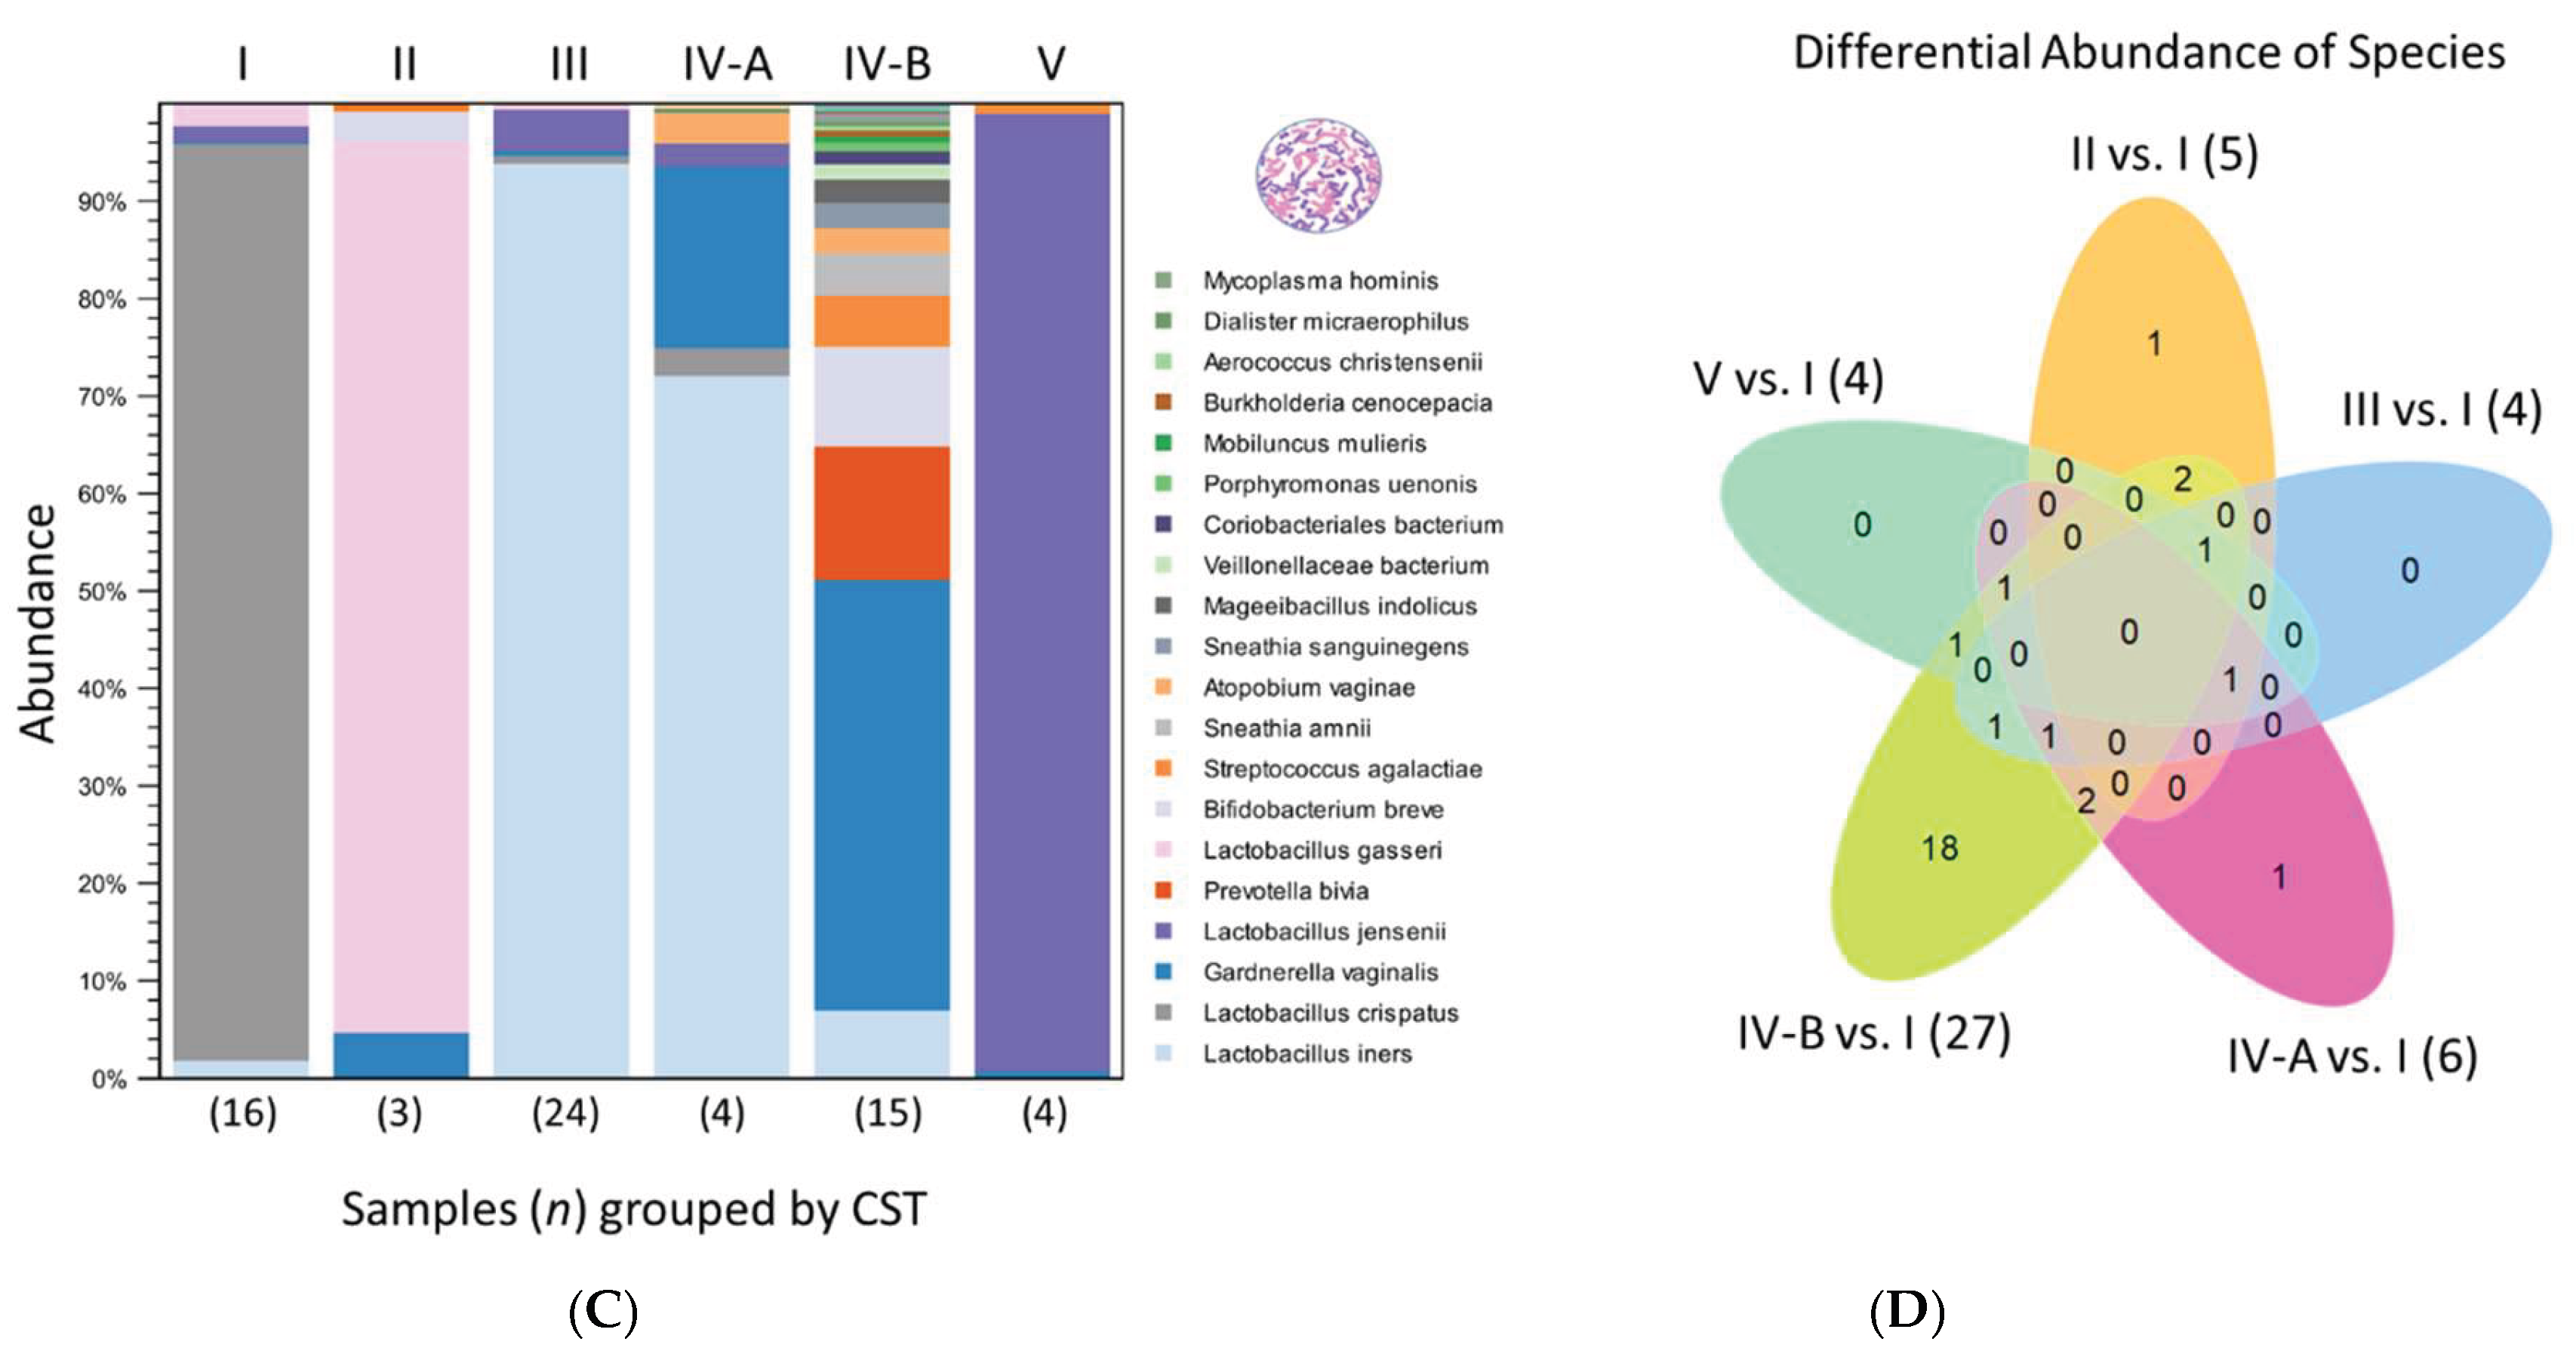
Figure 4.
Alignment of reads classified as “Lactobacillus spp. unknown” to L. paragasseri and L. gasseri 16S rRNA genes. (A) Representative L. gasseri and L. paragasseri genomes show multiple 16S loci, with ambiguous reads mapping to expected locations. (B) In four samples containing ambiguous Lactobacillus spp. reads (30856-007; 30663-013, -034, -040), the V1V2 and V5V7 consensus sequences matched L. paragasseri (NR179257), distinguished from L. gasseri (NR975051) by SNPs at positions 101 (G/A) and 1052 (T/A), marked by red arrows.
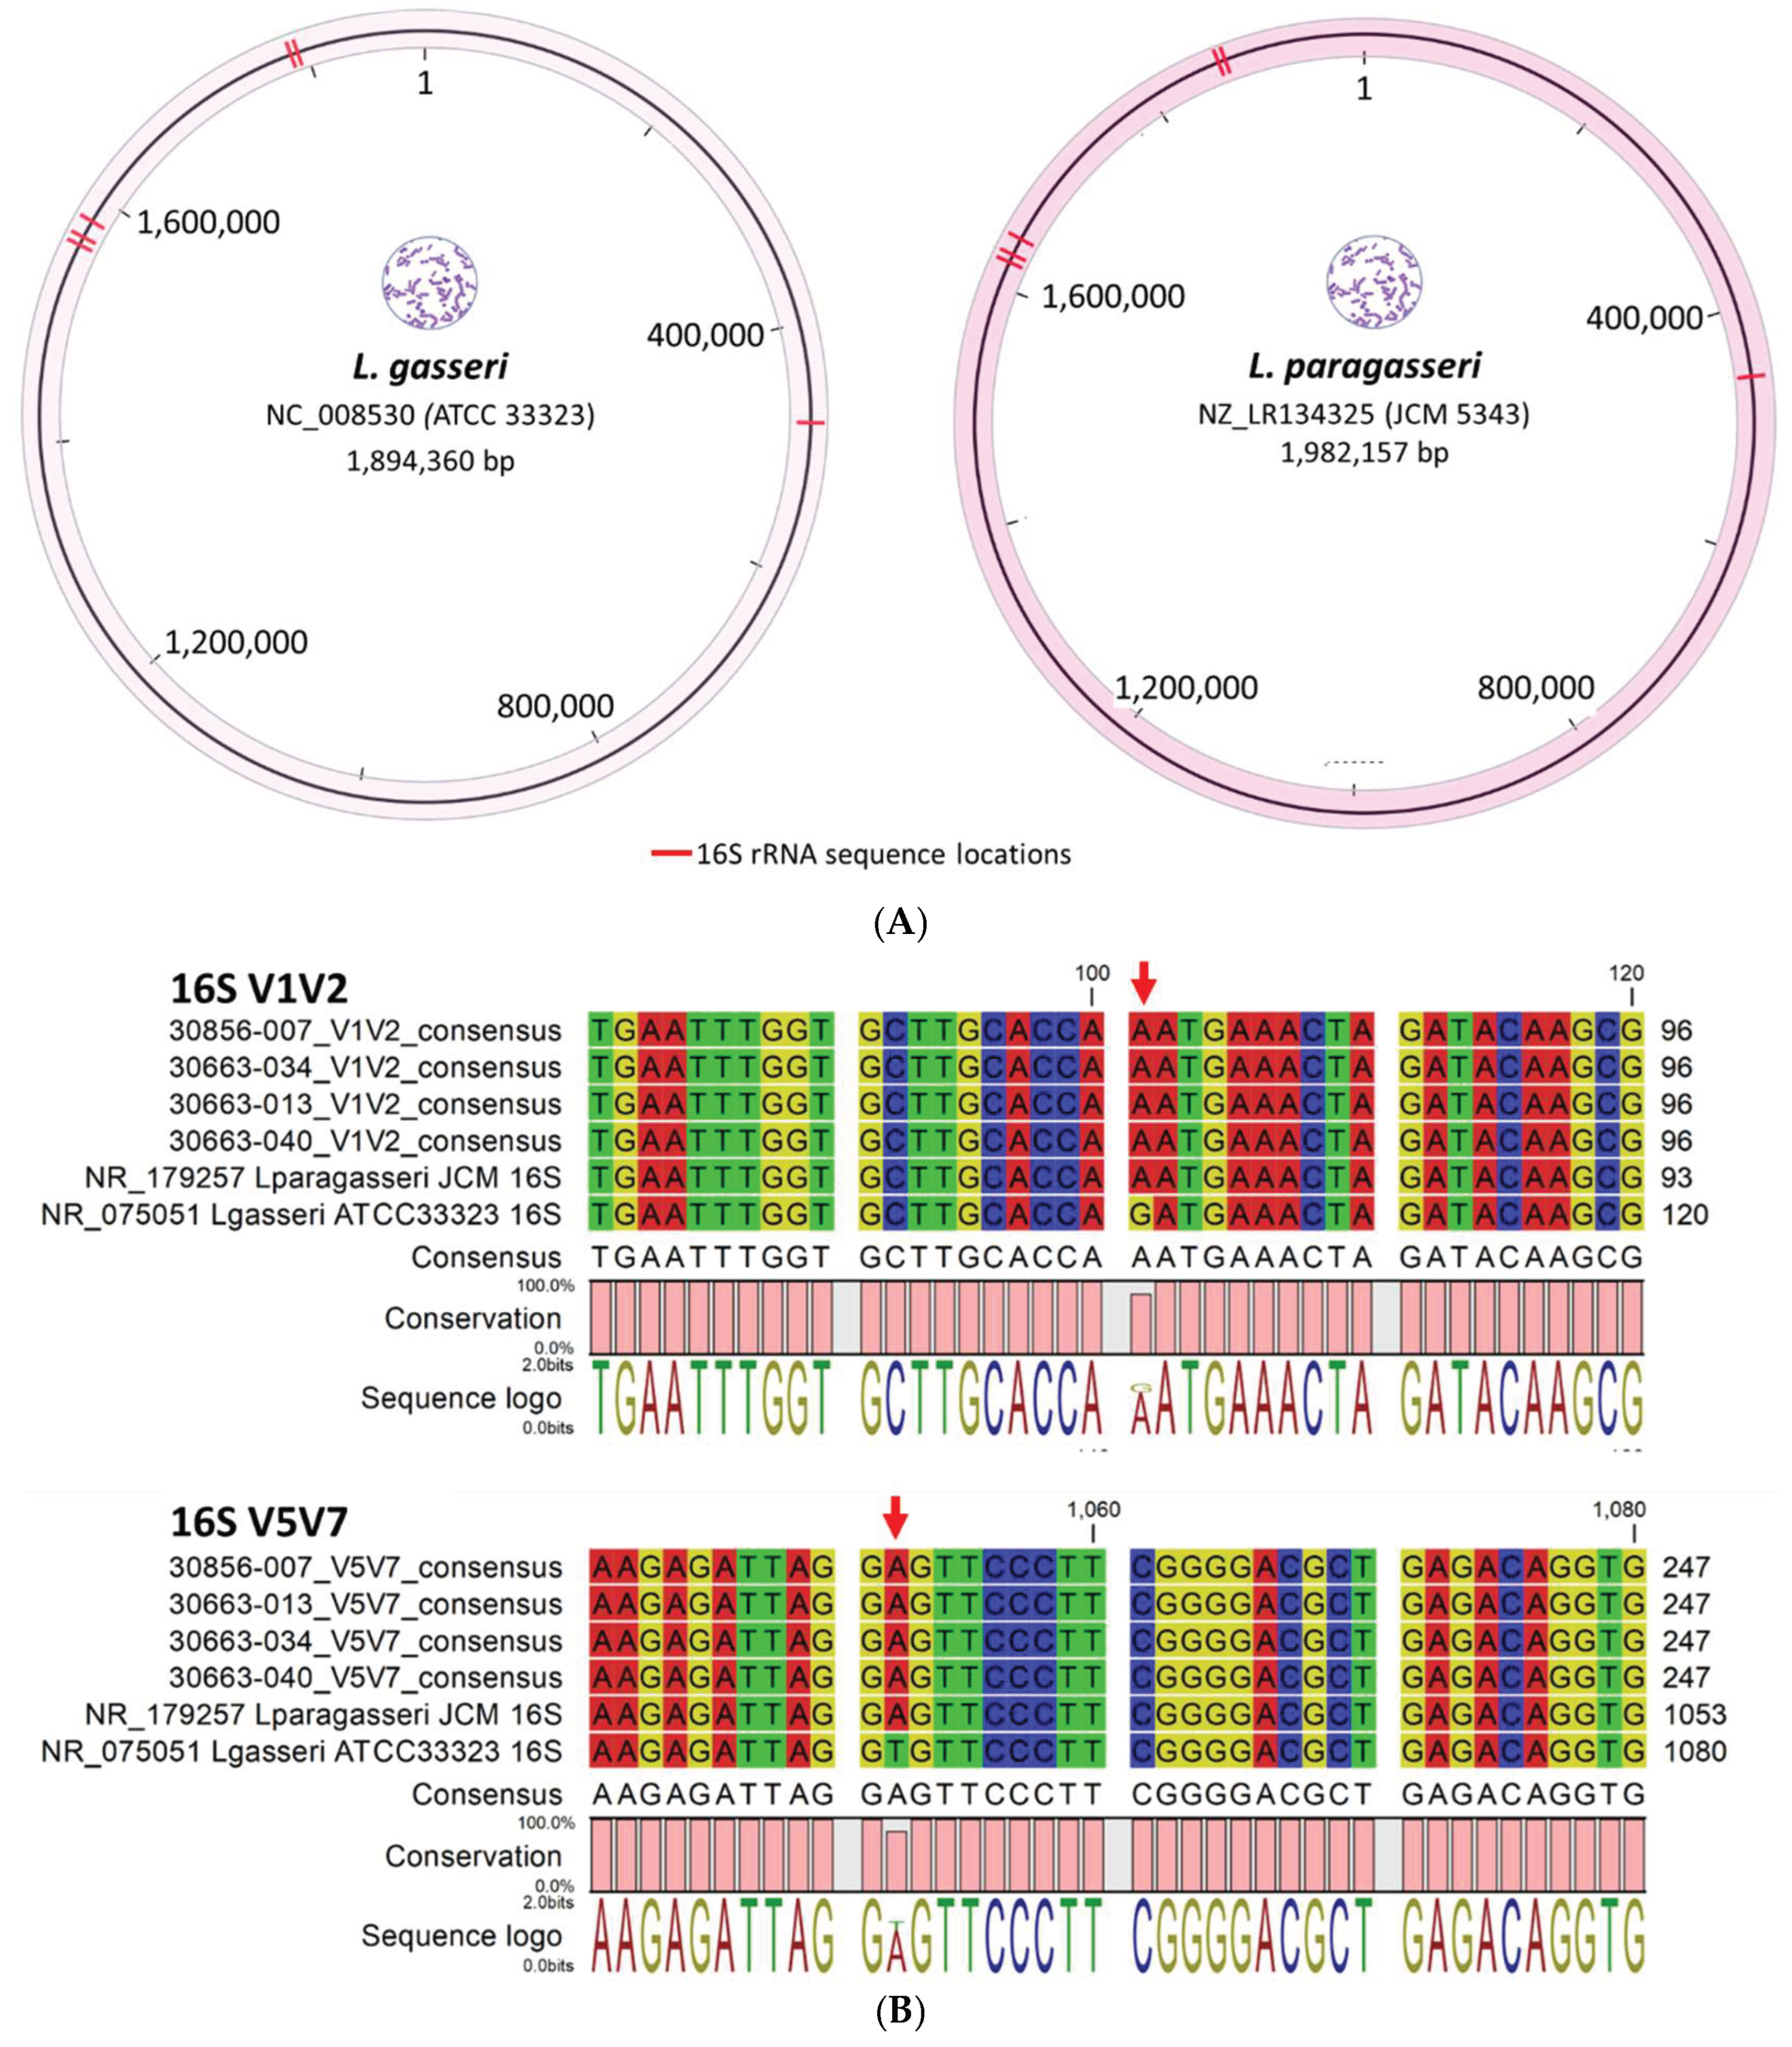
Figure 5.
Diversity analysis of microbial species in liquid cytology samples by Community State Types (CST). (A) Simpson and Shannon rarefaction curves plateaued at 28,000 reads, indicating sufficient sampling depth across all 66 samples. (B) Boxplots summarize CST-grouped samples. Species richness (Simpson’s index) and evenness (Shannon entropy) significantly increased from Lactobacillus-dominant (CST I–III, V) to L.-diminished and L.-depleted states (CST IV-A, IV-B). MWU: Mann–Whitney U test.
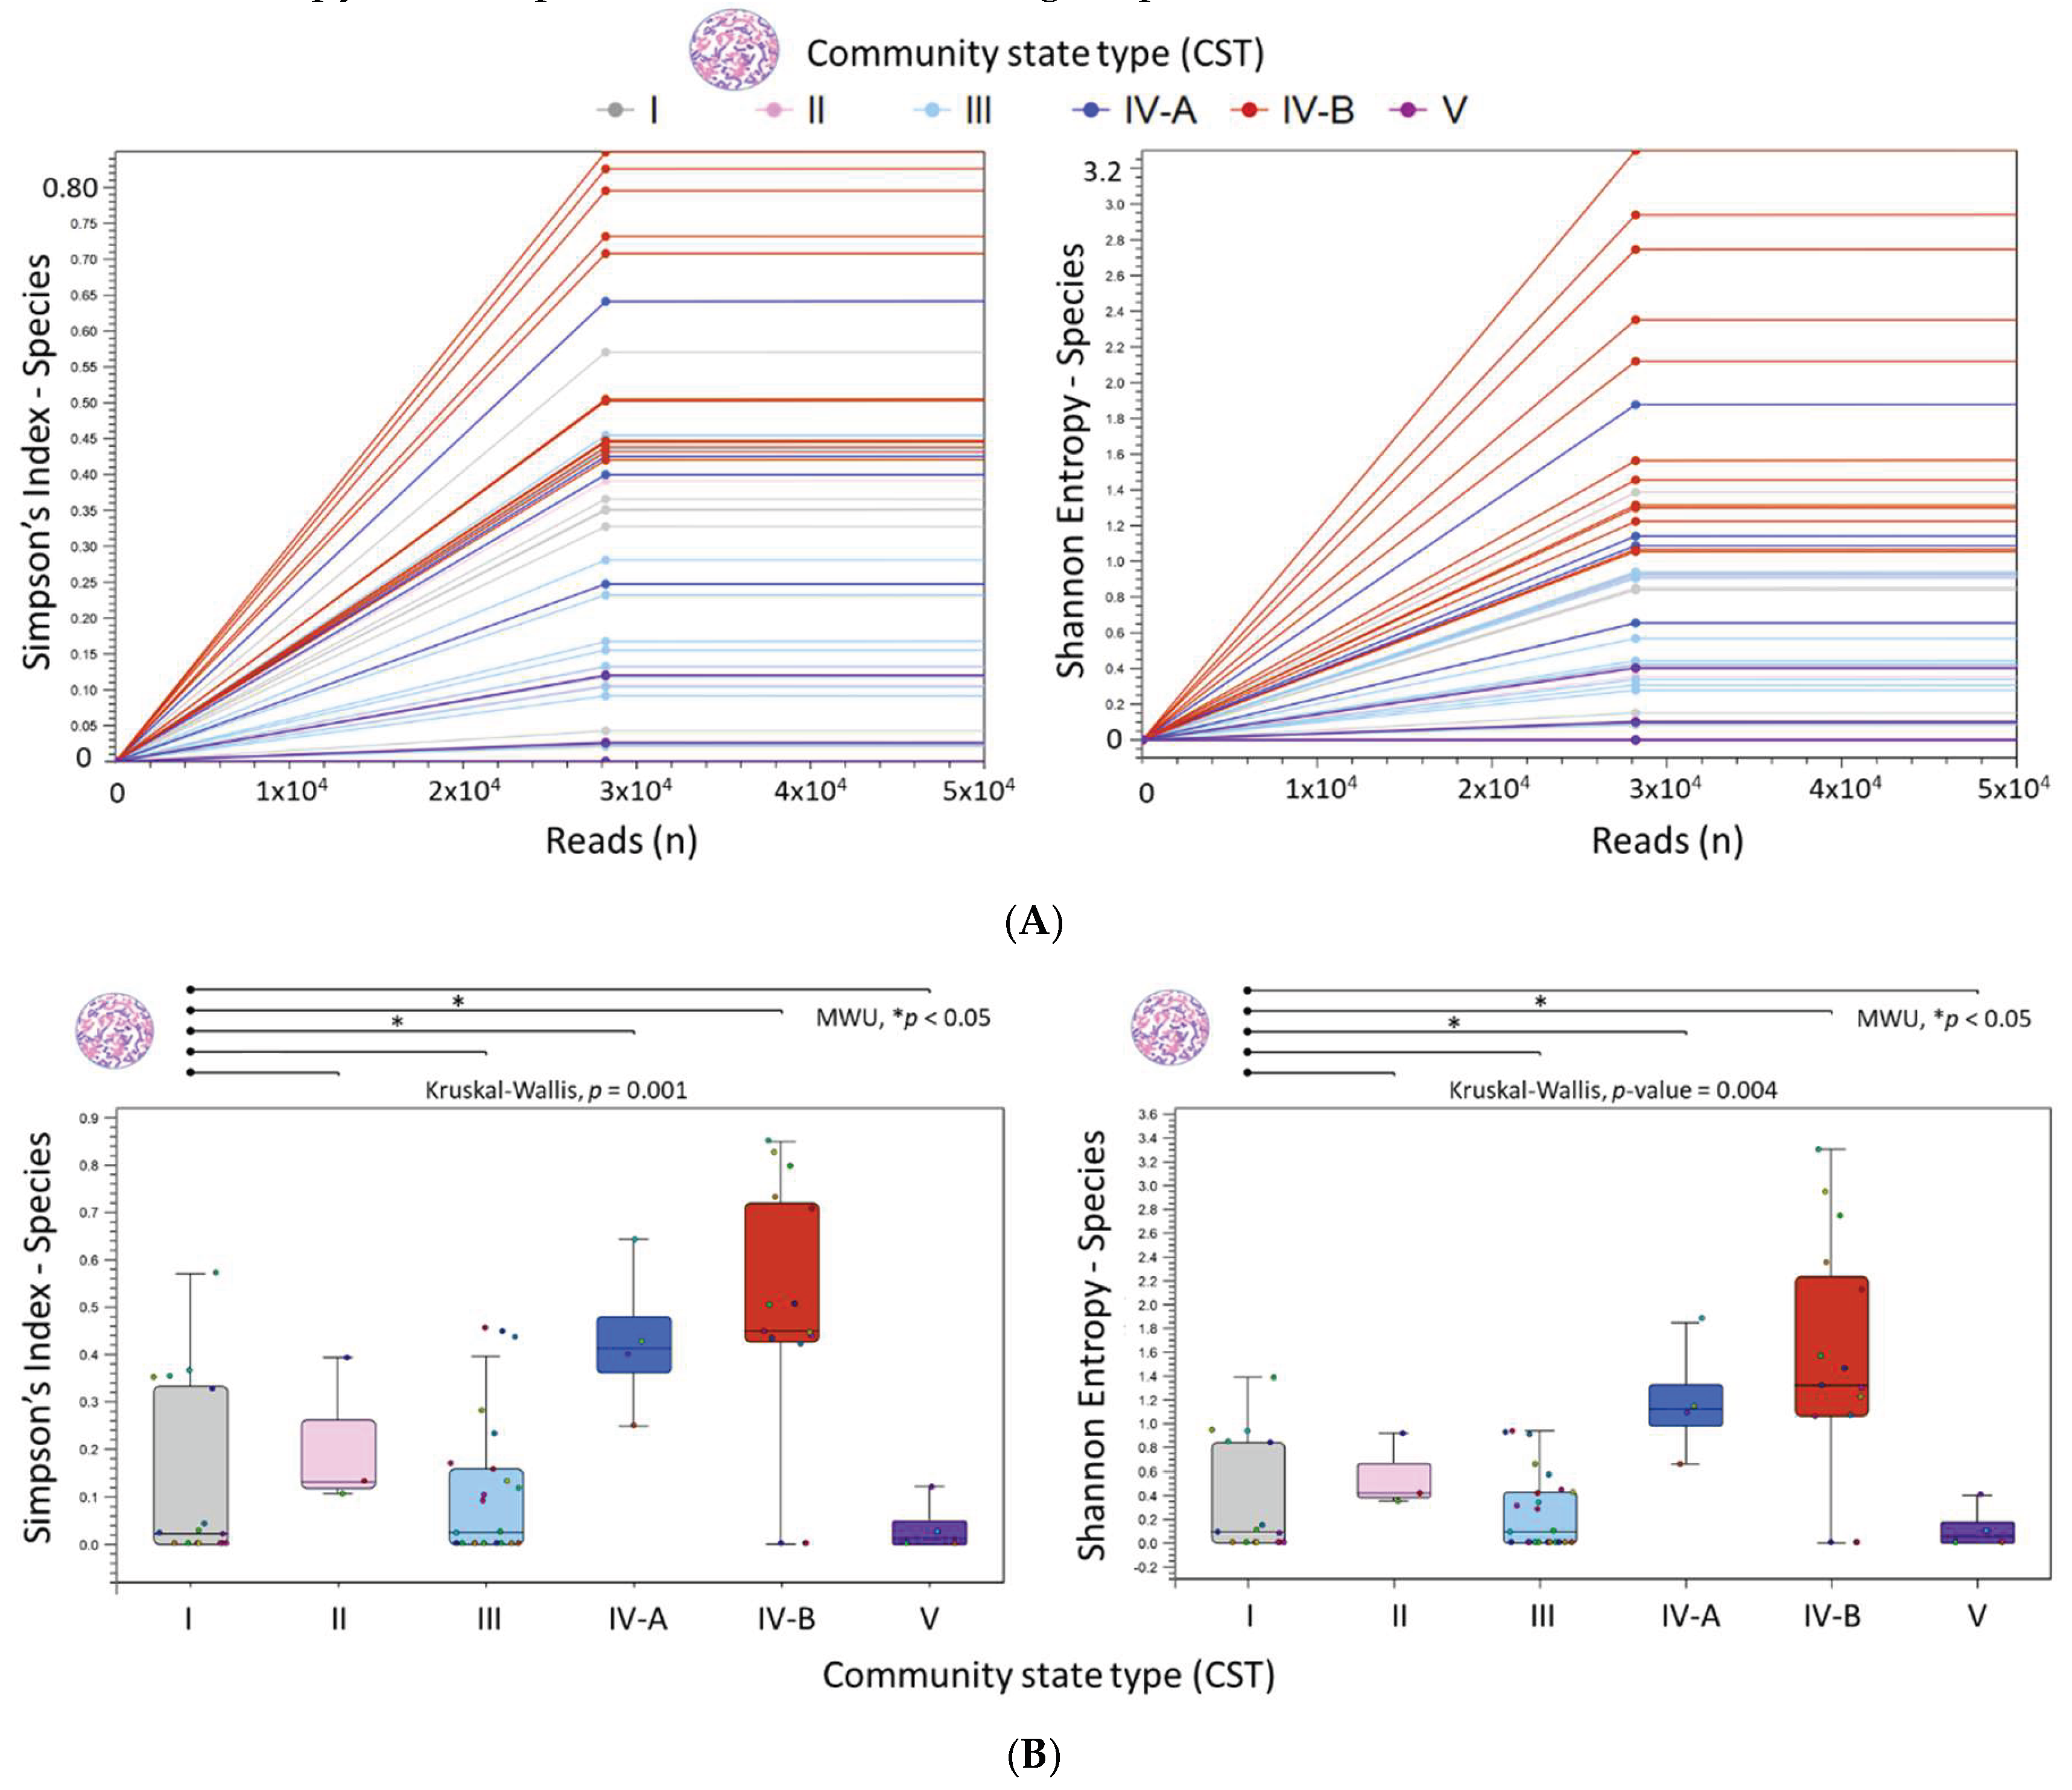
Figure 6.
Cervicovaginal microbial community structures. (A) 3D PCoA plot of 66 samples (color-coded by species) highlights L. crispatus, G. vaginalis, and L. iners as key drivers of microbial variation. (B) 3D PCoA plot grouped by CST shows CST I, IV-B, and III as major contributors to variance (36%, 17%, and 9%, respectively). β-diversity was assessed using Bray-Curtis (PERMANOVA, p < 0.05).
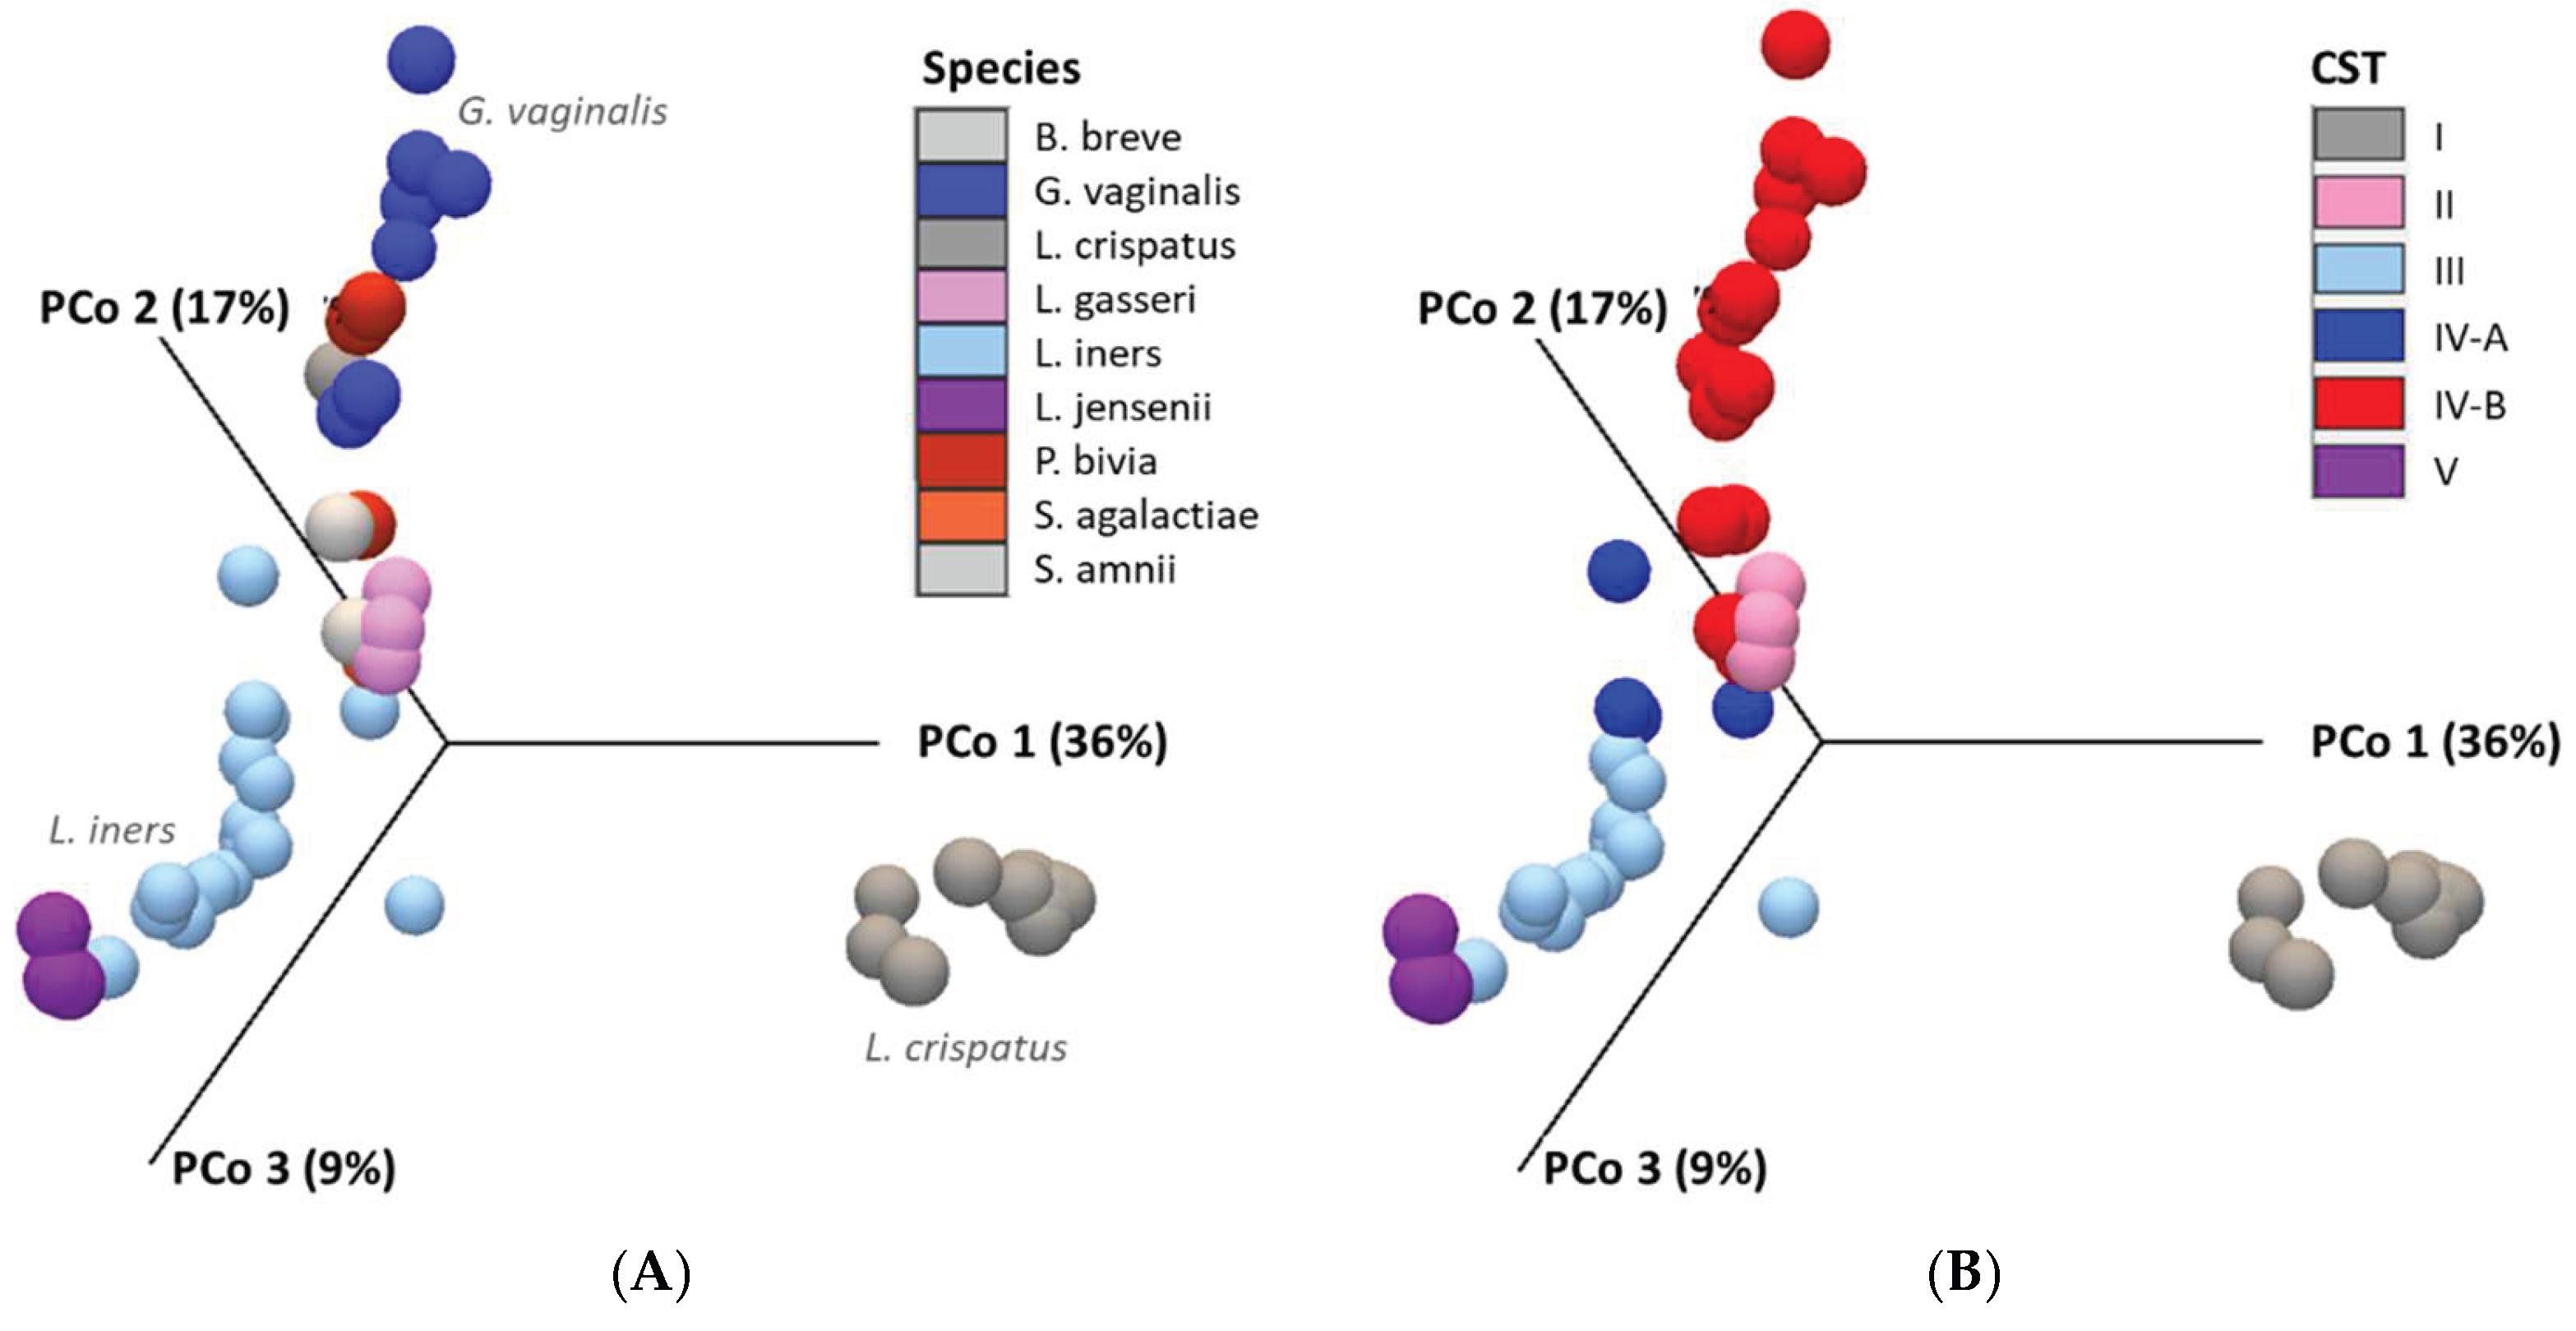
Figure 7.
Clustered Heatmap of Microbial Abundance in Liquid Cytology Samples. (A) Two-way hierarchical clustering of 66 samples and microbial species reveals distinct CST patterns. L. iners formed the earliest clusters, with a shift toward a diverse, anaerobic community in CST IV-B. Lactobacillus species (blue overlay) cluster with CST I–III and V, while anaerobes (pink overlay) associate with CST IV-A and IV-B. Differences in species abundance are quantified using Pearson’s distance metric. (B) Aggregated heatmaps grouped by CST, HPV type/status and Pap smear diagnosis highlight distinct microbial signatures. Notably, the seven most abundant anaerobic pathogens (pink overlay) in CST IV-B (rectangular outline) are also enriched in HPV-16 positive and HSIL samples.

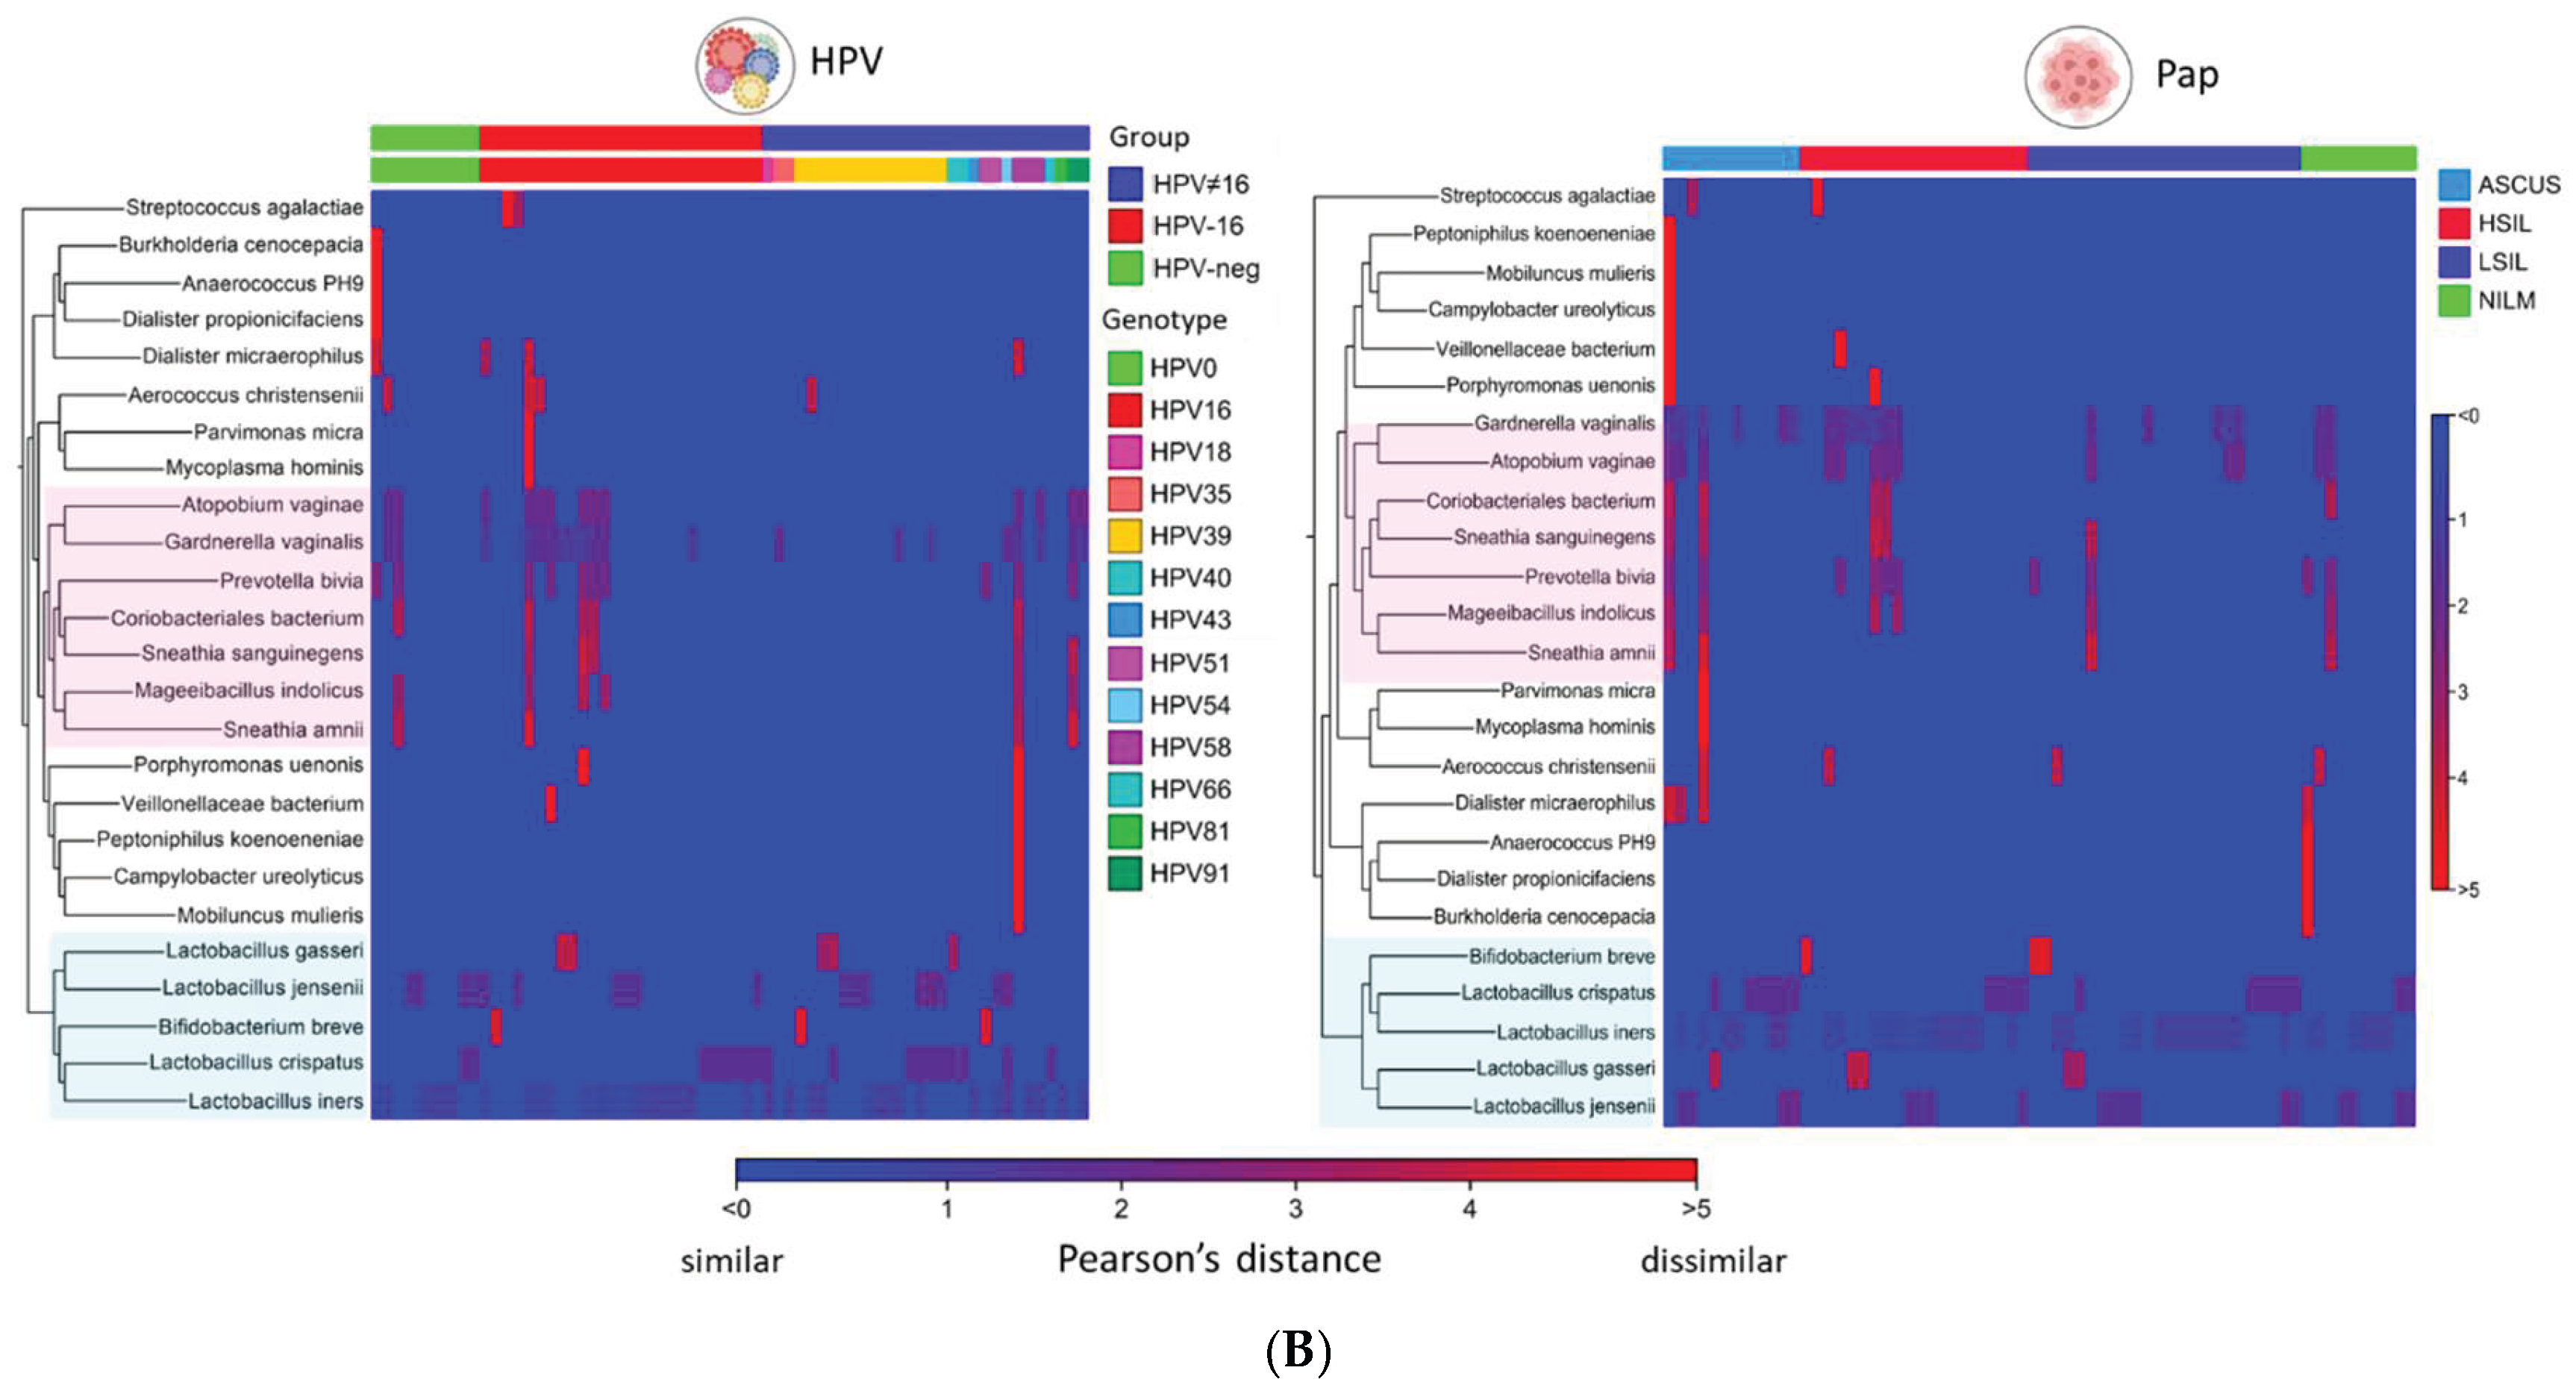
Figure 8.
Workflow for 16S/ITS metagenomic sequencing. (A) DNA extracted from liquid cytology samples underwent two-step PCR: first, amplification of 16S rRNA and ITS regions using three primer pools; second, barcode addition for sample identification. Libraries were pooled and sequenced on the MiSeq platform. (B) The diagram shows bacterial 16S rRNA and fungal ITS gene regions targeted by the QIAseq 16S/ITS Screening Panel, highlighting coverage by three primer pools used for library enrichment. (Figure created in BioRender).
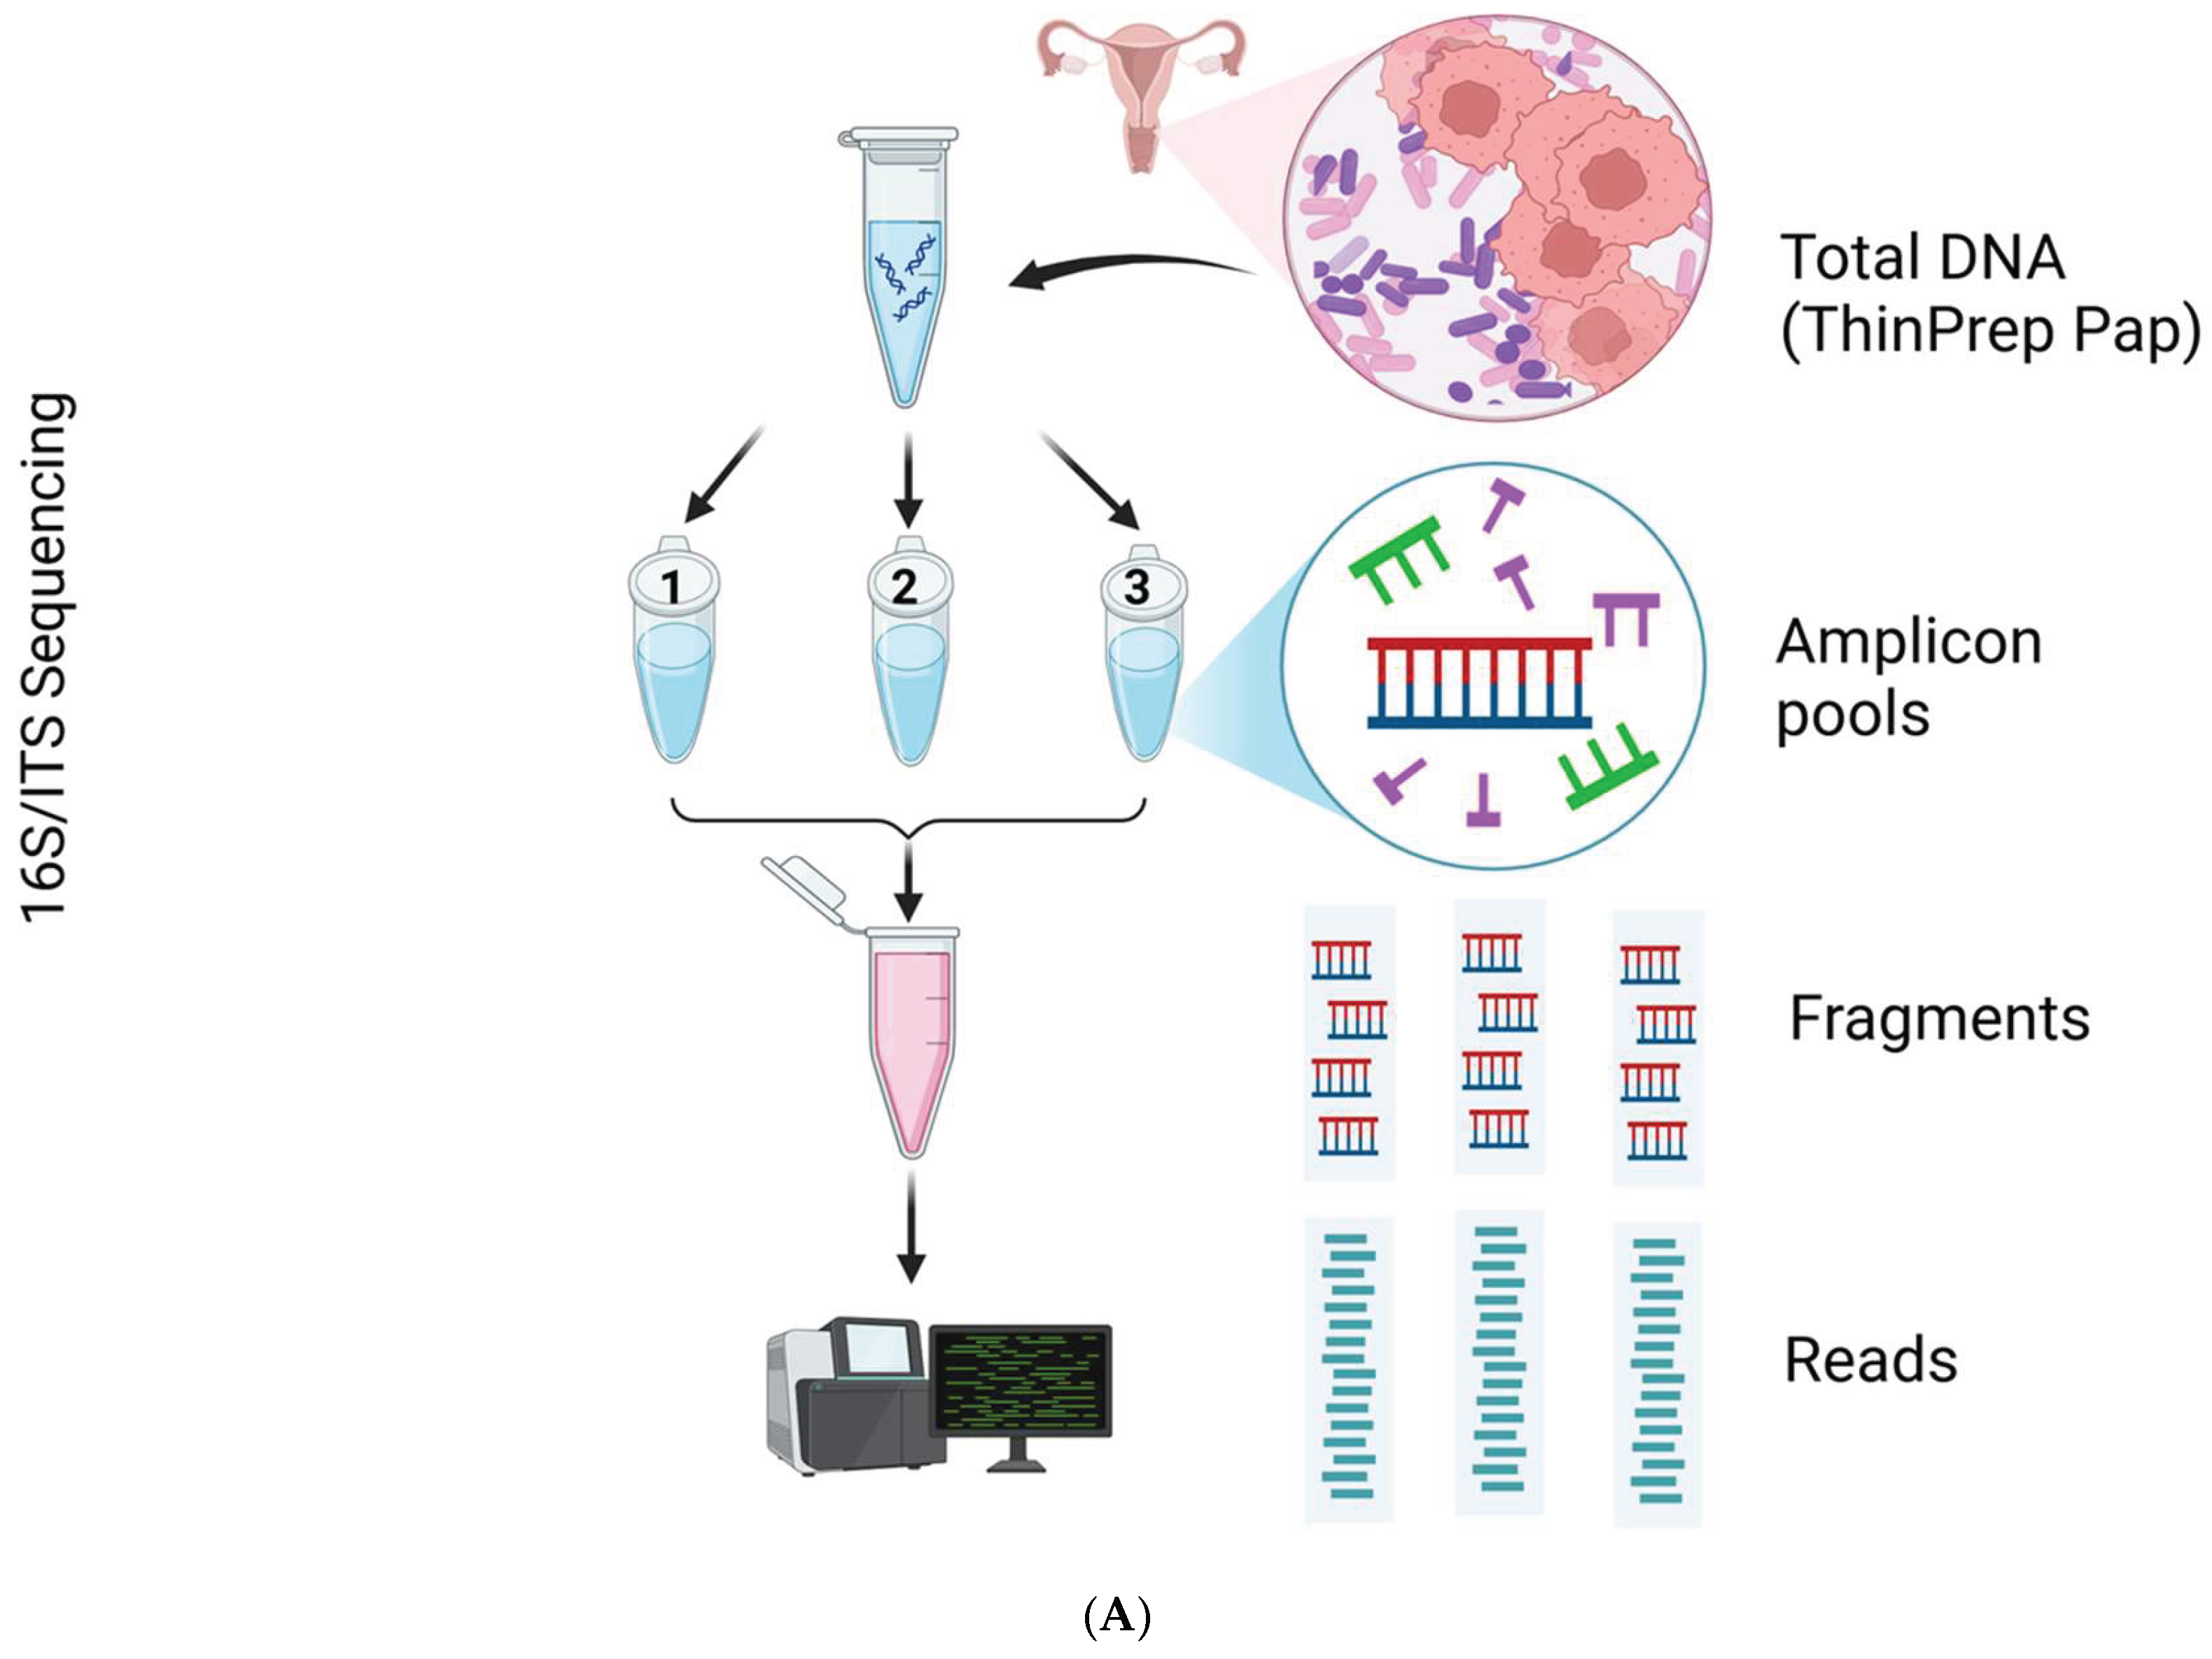
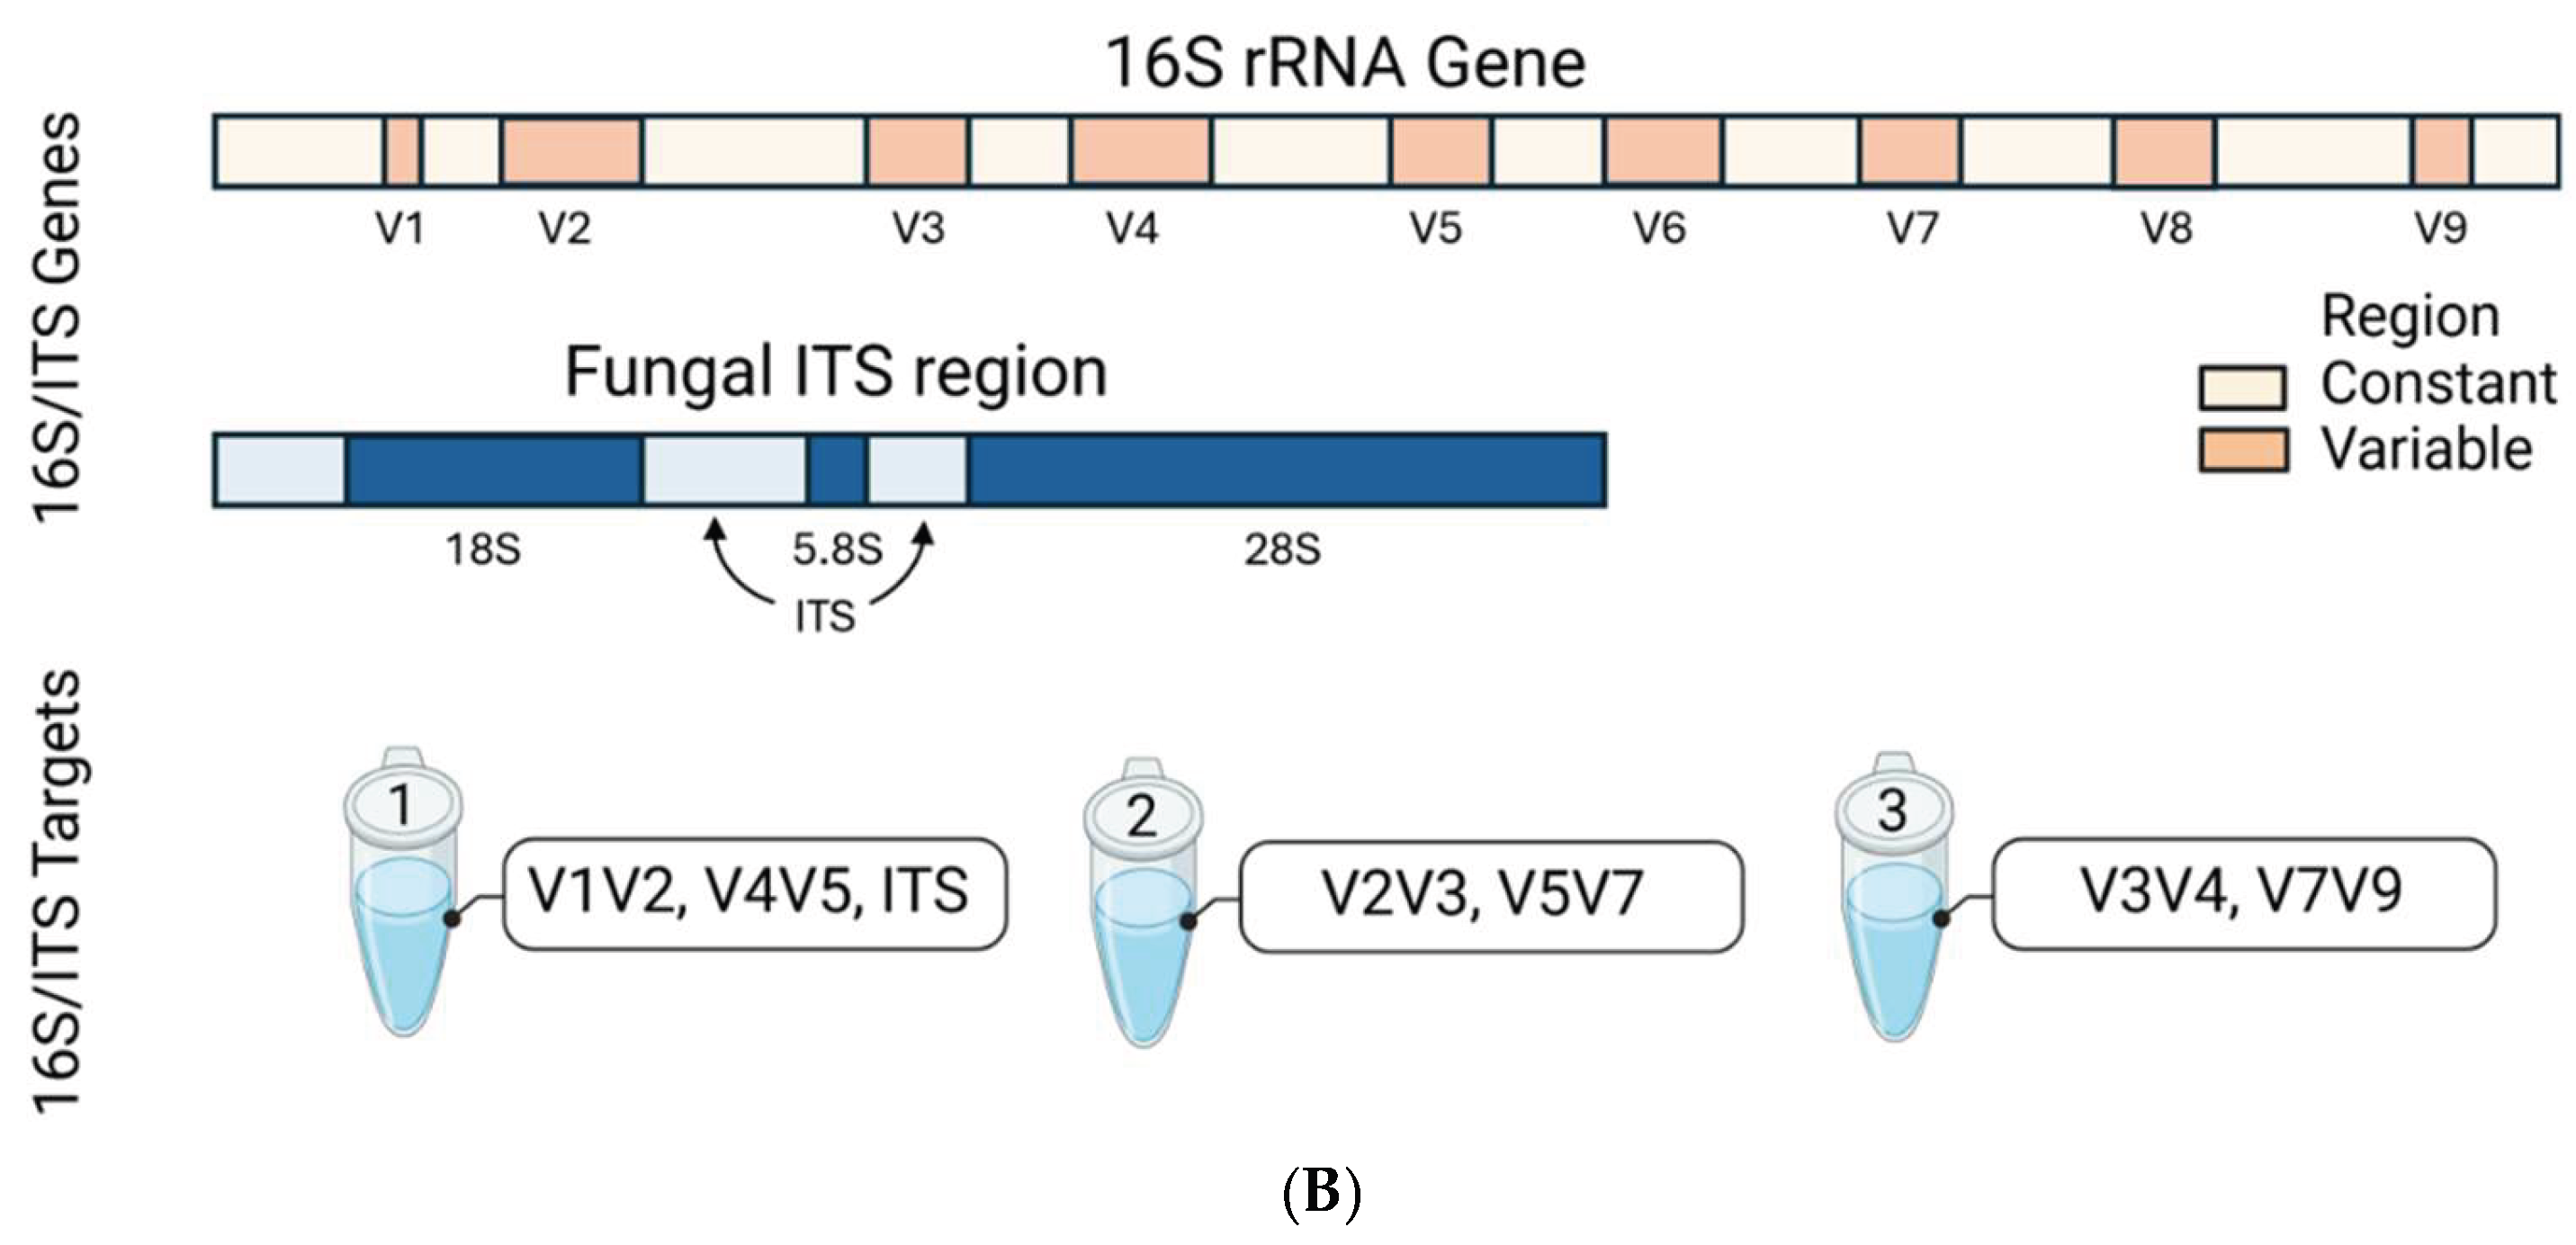
Figure 9.
CLC Workflows, Tools, and Databases. (A) The Microbial Genomics Module offers workflows (blue arrow) and tools (black arrow) for taxonomic and diversity analysis (left), alongside the databases and dataset used in this study (right). (B) The Data QC and Taxonomic Profiling workflow uses the customized VAGIBIOTA or UNITE Reference Index (red outline) to generate QC reports and Abundance Tables from NGS reads obtained from clinical samples. These tables feed into the diversity analysis workflow. (C) Reads identified as “Lactobacillus spp. unknown” are further analyzed using the Map Reads to Reference workflow which incorporates the VAGIBIOTA Sequence List for species identification (left). The Merge and Estimate Alpha and Beta Diversities workflow produces diversity plots and statistics (right).
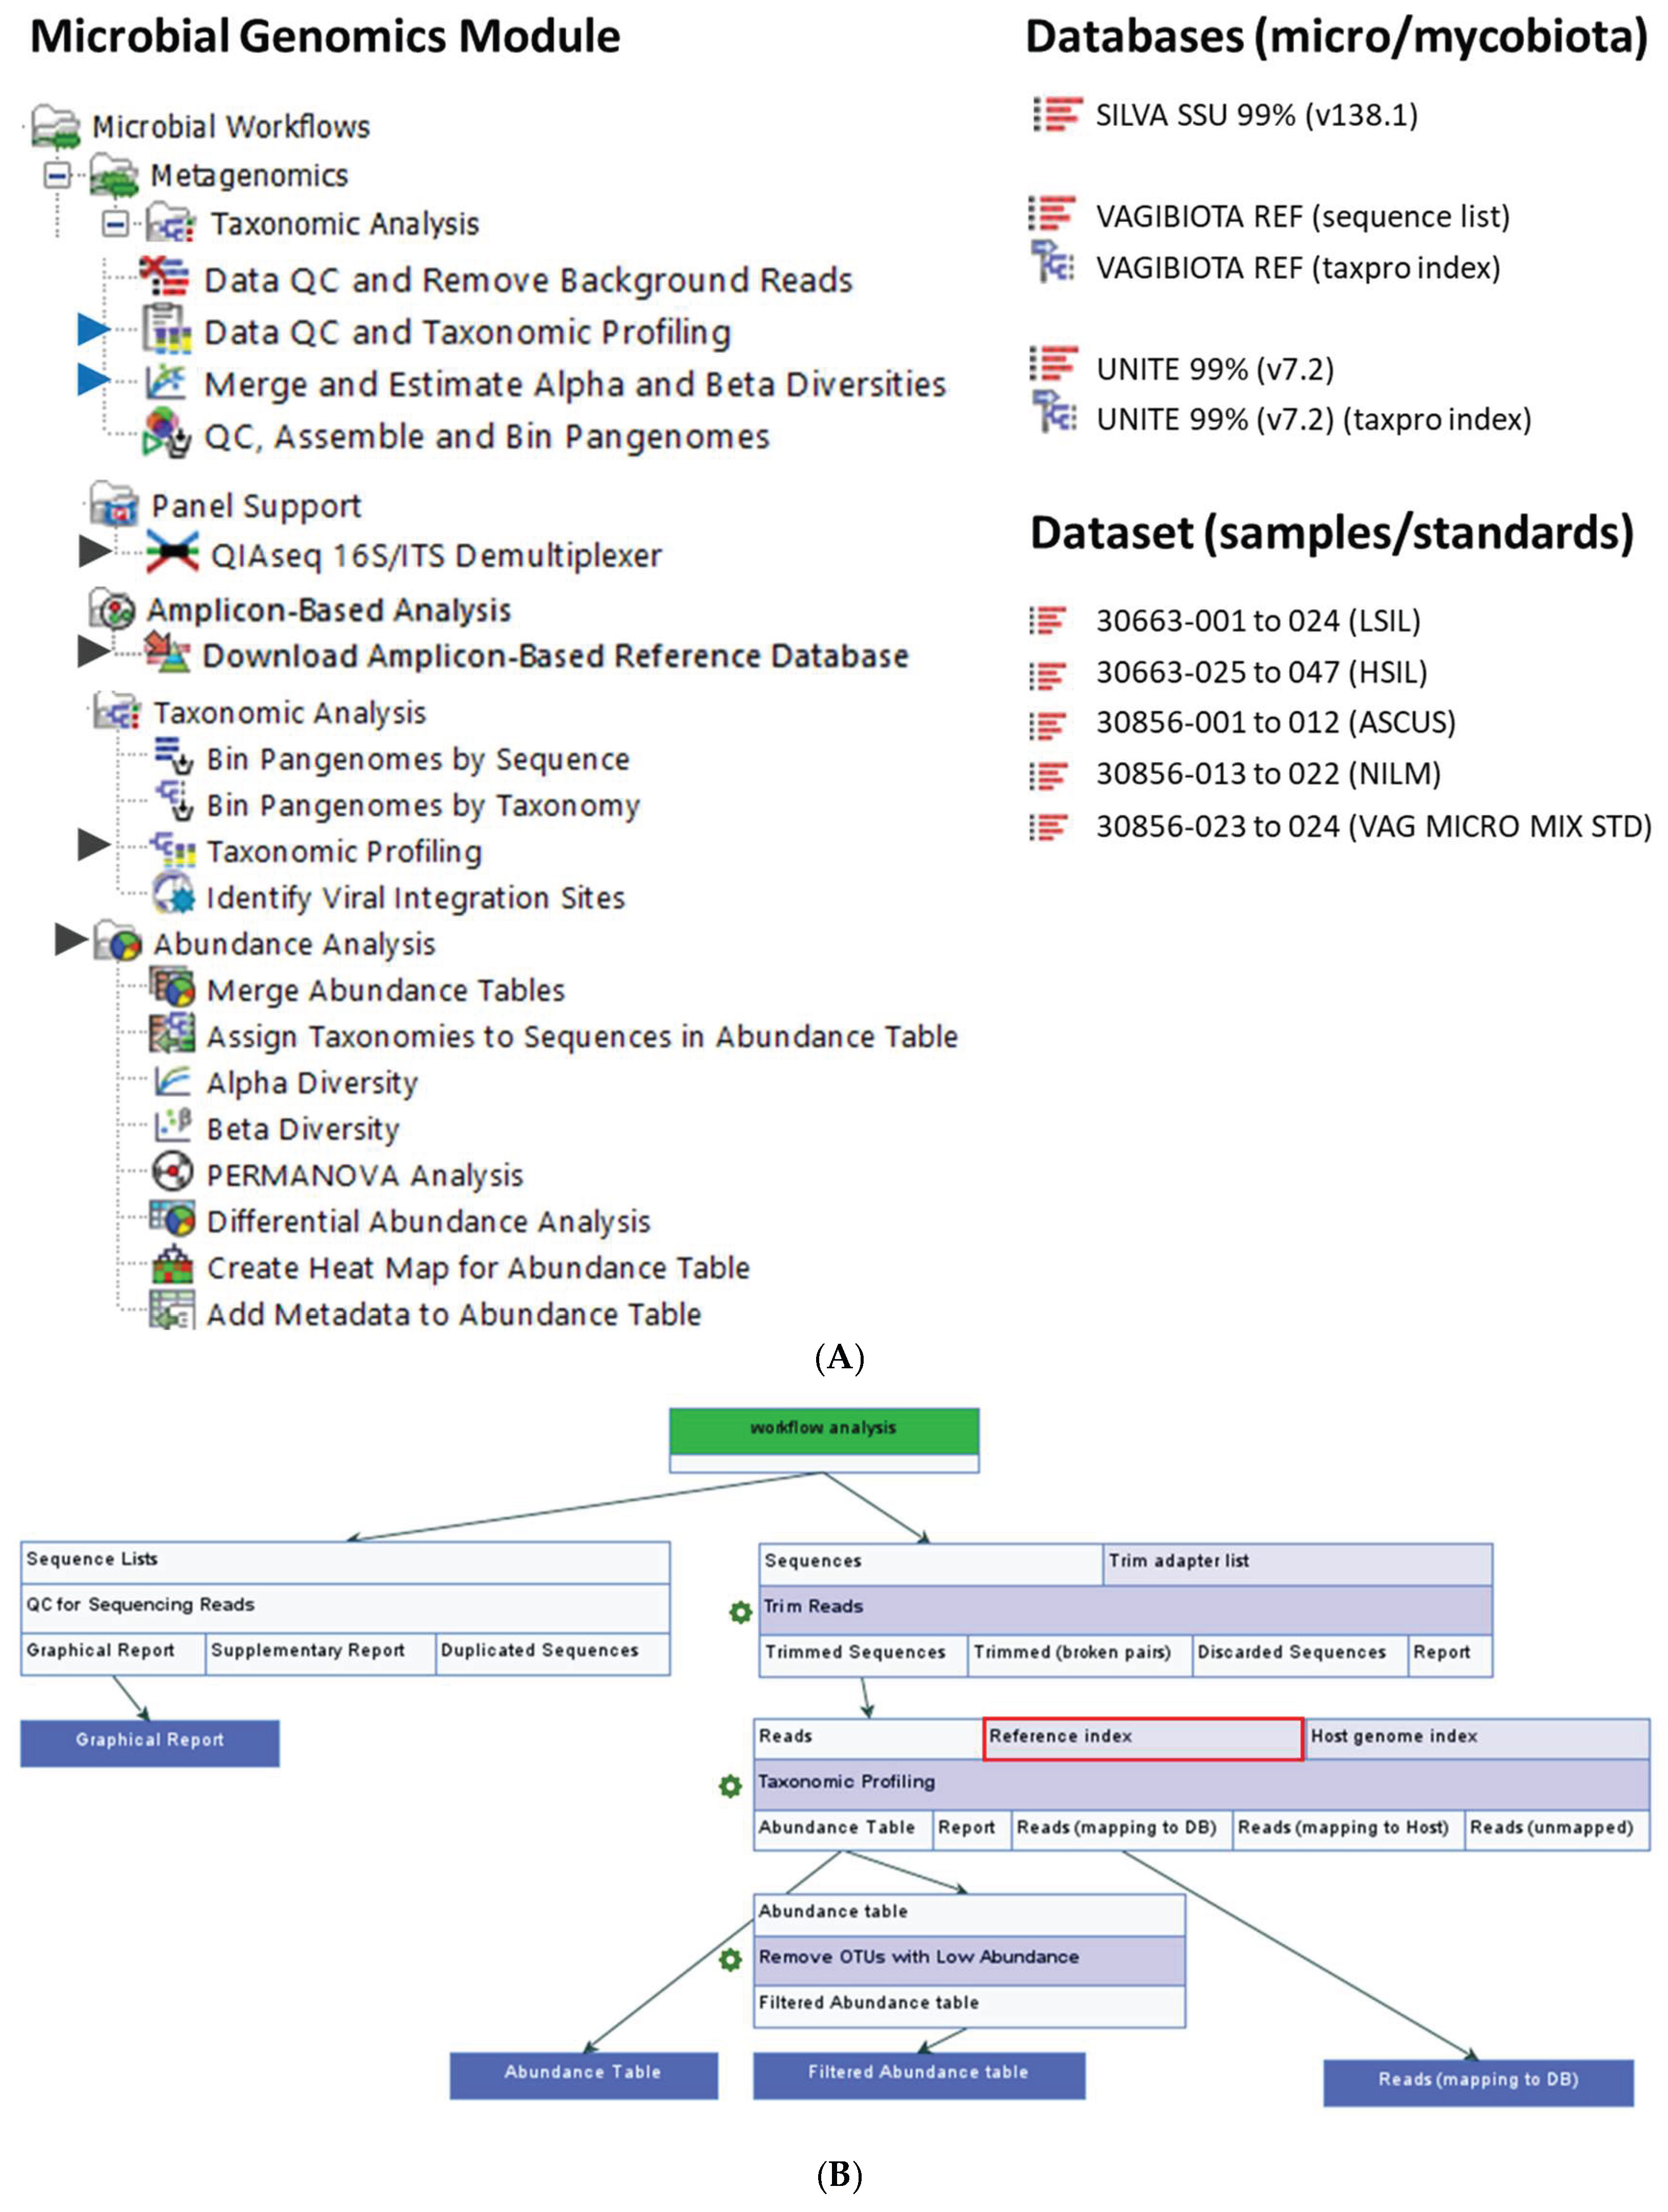
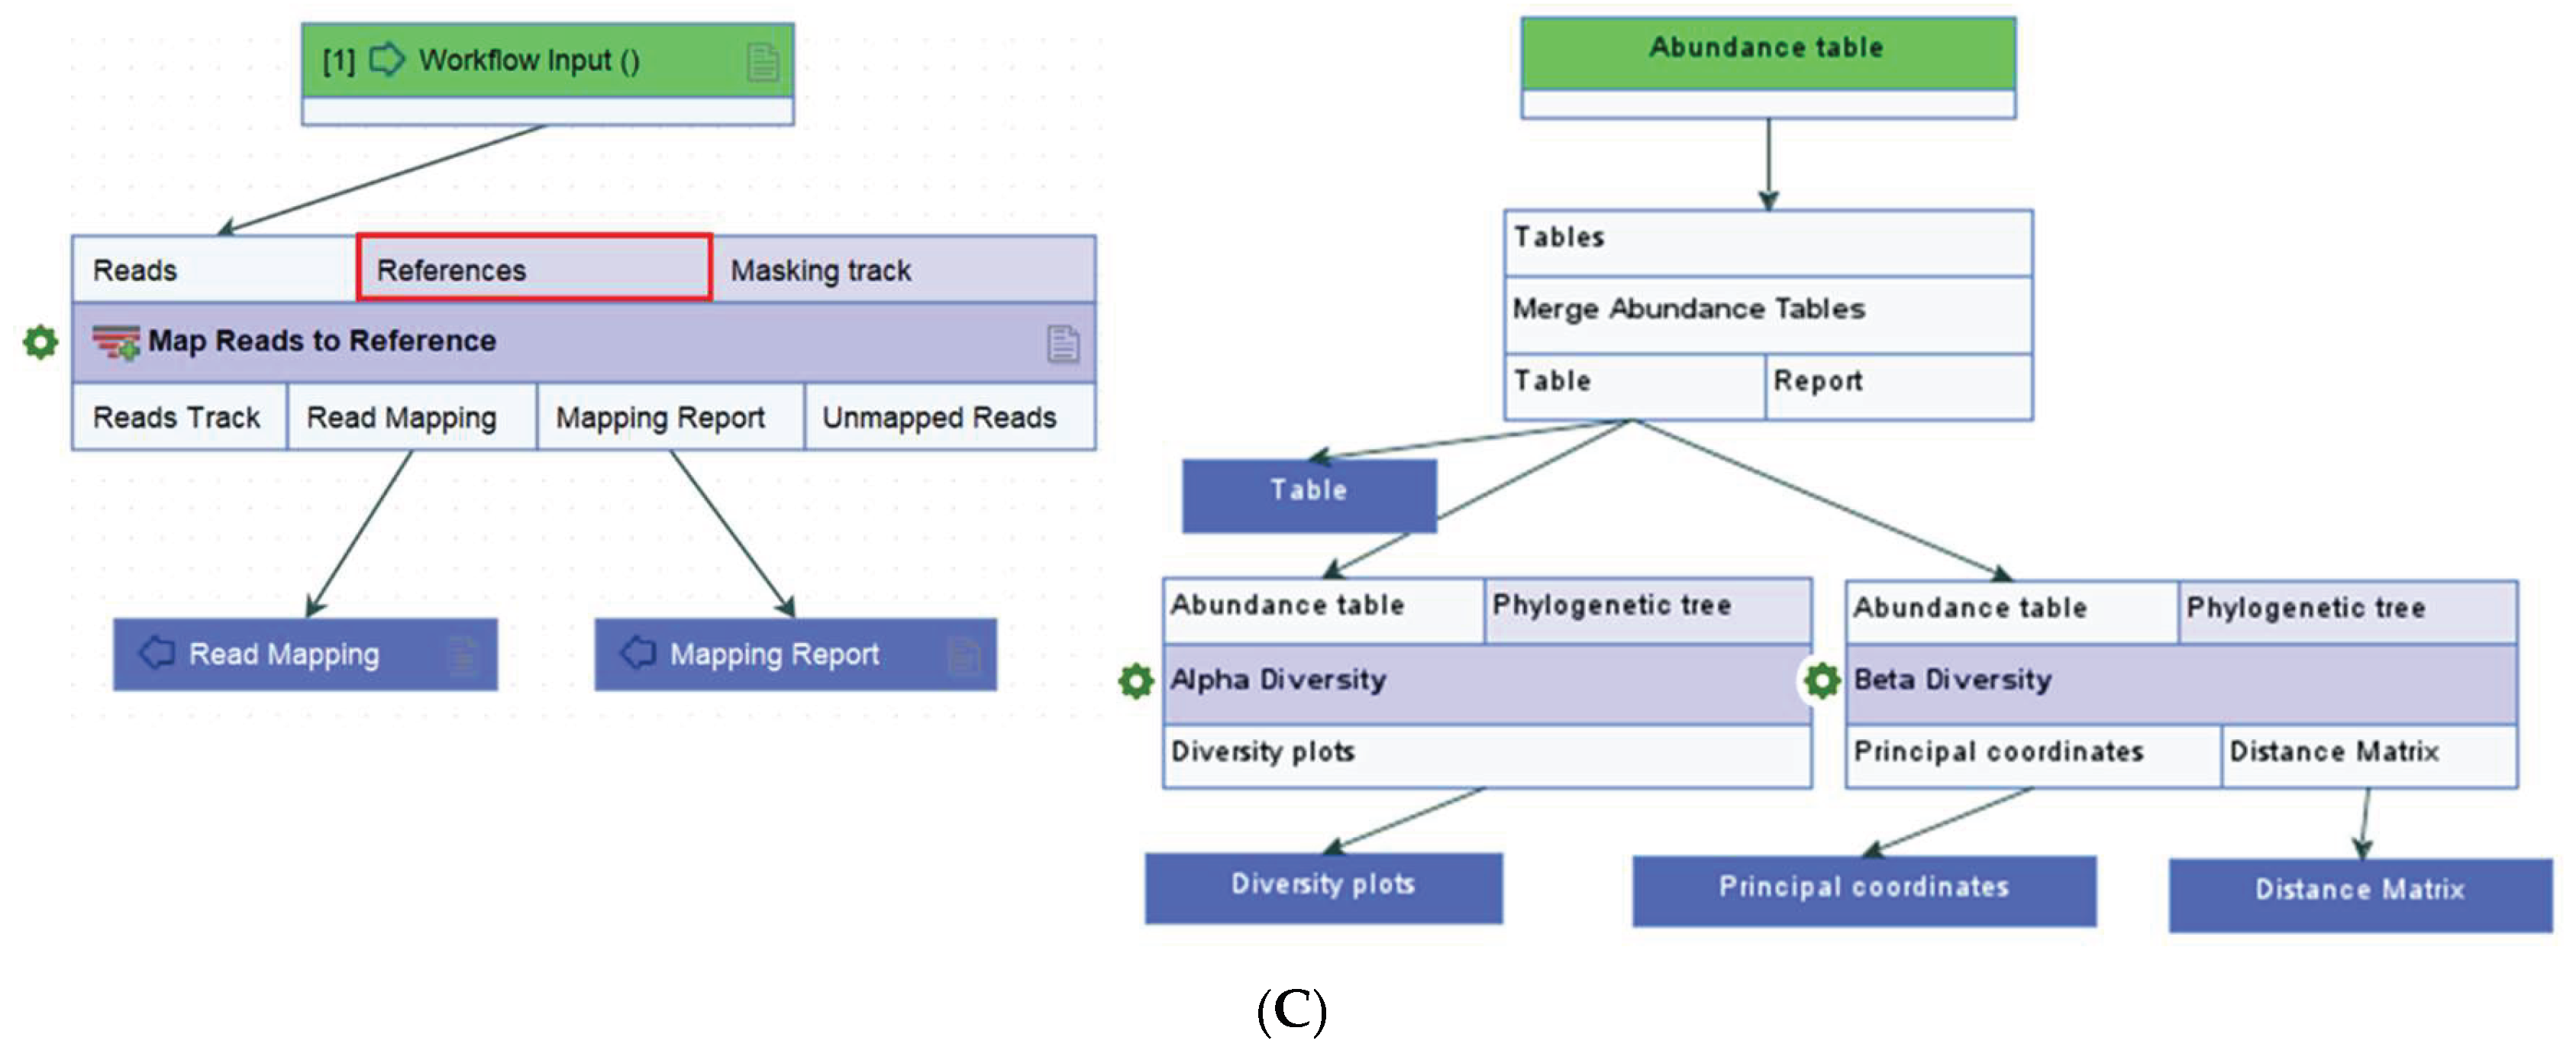
Disclaimer/Publisher’s Note: The statements, opinions and data contained in all publications are solely those of the individual author(s) and contributor(s) and not of MDPI and/or the editor(s). MDPI and/or the editor(s) disclaim responsibility for any injury to people or property resulting from any ideas, methods, instructions or products referred to in the content. |
© 2025 by the authors. Licensee MDPI, Basel, Switzerland. This article is an open access article distributed under the terms and conditions of the Creative Commons Attribution (CC BY) license (http://creativecommons.org/licenses/by/4.0/).
Copyright: This open access article is published under a Creative Commons CC BY 4.0 license, which permit the free download, distribution, and reuse, provided that the author and preprint are cited in any reuse.


