
Submitted:
07 May 2025
Posted:
08 May 2025
You are already at the latest version
Abstract
Bacterial vaginosis (BV) affects approximately 30% of women annually, with recurrence rates of 50% within 3-6 months despite initial antibiotic treatment. This study evaluates outcomes from a metagenomic-based vaginal microbiome (VMB) test used to personalize BV treatment. A total of 1,159 patients diagnosed with BV received tailored treatment, including antibiotics and adjunctive therapies. Vaginal swabs and symptom data were collected before and after treatment (average 4.4 months). Patients were categorized as responders (symptom improvement) or non-responders (no change or worsening symptoms) based on post-treatment questionnaires. Personalized treatment resulted in a 75.5% response rate, with a recurrence rate of 29.7%. Responders showed a significant reduction in symptom scores (5.2 to 2.4, p< 0.0001). Both groups experienced increased Lactobacillus abundance (responders: 31.1% to 49.9%, p< 0.0001; non-responders: 38.5% to 44.0%, p< 0.05), and decreased BV-associated genera (responders: Gardnerella from 45.1% to 35.2%, p< 0.0001; non-responders: from 43.8% to 37.3%, p< 0.001). Treatment adherence was linked to positive outcomes, with mild adverse events. This study demonstrates that personalized, microbiome-informed therapy improves symptoms and restores vaginal microbiome balance in BV management.
Keywords:
bacterial vaginosis
; telemedicine
; vaginitis
; metagenomics
; diagnostics
; vaginalmicrobiome
1. Introduction
Bacterial vaginosis (BV) represents the most prevalent vaginal infection, affecting approximately 30% of individuals with vaginas each year [1]. Clinically, it is characterized by vaginal irritation and excessive malodorous discharge [2]. BV can also have a significant psychosocial impact, with patients reporting a substantially diminished quality of life, higher levels of depression and anxiety, as well as profound interpersonal and social distress [3]. Beyond its immediate symptomatology, BV exemplifies a complex microbiological dysbiosis associated with long-term clinical ramifications, such as increased susceptibility to sexually transmitted infections [4,5], impacts on fertility [6,7,8], increased risk of adverse pregnancy outcomes [9,10,11], and cervical cancer progression [12,13].
Standard treatment for BV includes either topical or oral antibiotic treatment with metronidazole or clindamycin. These treatments result in 70-85% response rate within 1 month [14]. However, recurrence rates are notably high with 45% recurring within 3 months [15], and 50% recurring within 6 months [14]. The persistent cyclical nature of treatment and recurrence underscores the therapeutic limitations of current interventional strategies, potentially reflecting an incomplete understanding of the complex microbiological dynamics underlying vaginal dysbiosis.
The vaginal microbiome (VMB) comprises a complex community of bacteria and fungi colonizing the vaginal environment. These microorganisms function as a critical protective barrier inhibiting pathogens and maintaining homeostasis [16,17]. An optimal VMB is canonically characterized by a predominance of Lactobacillus species (primarily L. crispatus, L. jensenii, L. gasseri, L. paragasseri, and L. mulieris) [17]. In the absence of protective lactobacilli, a diverse anaerobic community microbiome emerges which can include Gardnerella species (G. vaginalis, G. leopoldii, G. piotii, and G. swidinskii), Prevotella, Fannyhessea (previously Atopobium), Mobiluncus, Megasphaera, Fingoldia, Fusobacterium, Mycoplasma, Ureaplasma, Porphyromonas, Sneathia, and others [18,19].
Due to the polymicrobial nature of BV, no single organism has been conclusively identified as the primary etiological agent [20]. Instead, various microbiome profiles can manifest similar symptomatic presentations, rendering accurate diagnosis and treatment challenging. Consequently, current standard-of-care protocols relying solely on antibiotics such as clindamycin and metronidazole to target a wide range of bacterial species [2]. While these interventions may resolve immediate symptoms, they are unlikely to provide definitive long-term resolution, particularly if comprehensive pathogen eradication is not achieved or if a protective lactobacilli-dominant microbiome is not restored.
In this study, we present a novel diagnostic and therapeutic approach that uses shotgun metagenomic sequencing paired with patient symptom profiling to diagnose BV and comprehensively characterize the vaginal microbiome prior to initiating treatment. This high-resolution molecular profiling enables the development of precision treatment strategies that simultaneously target pathogenic organism eradication while maintaining protective bacterial communities. Treatment protocols are tailored based on each patient’s unique microbiome signature and clinical presentation, and these individualized care pathways incorporate targeted adjunctive therapies addressing specific symptoms.
We hypothesize that this precision-medicine approach to BV management will achieve both symptomatic improvement and significant restructuring of the vaginal microbiome toward a more protective state. Here we present an analysis of clinical outcomes in patients receiving personalized BV treatment through Evvy’s testing and telemedicine platform. Reported measurements include patient perceived treatment response rate, observed recurrence rate, changes in a 14 metric symptom score, and changes in the VMB community structure, which include specific genera (Lactobacillus, Gardnerella, Prevotella, and Fannyhessea) as well as overall community composition.
2. Materials and Methods
2.1. Patient Selection
All study participants provided informed consent, and study procedures were conducted in accordance with protocols approved by a federally accredited Institutional Review Board (IRB# 20220118.evvy).
Study inclusion required patients to have undergone vaginal microbiome characterization via shotgun metagenomic sequencing and received a diagnosis of BV between Nov 2022 to July 2024. BV diagnosis was established based on presenting symptomatology aligned with the established literature, primarily malodorous vaginal discharge, in conjunction with metagenomic evidence of moderate relative abundance of BV-associated organisms, such as Gardnerella or Prevotella [19]. Eligible patients-initiated treatment through Evvy’s telemedicine platform, receiving either metronidazole or clindamycin along with other personalized treatments, and completed follow up metagenomic testing within one year of initial treatment.
Due to telemedicine practice limitations and safety considerations, patients with diabetes, a current cancer diagnosis, breastfeeding, HIV, immunocompromised status, or pregnancy were excluded from the platform and directed to seek in-person clinical care. These populations were consequently not represented in the study cohort.
2.2. Description of Clinical Care Protocols
Patients presenting with vaginal symptoms and a dysbiotic vaginal microbiome are eligible for clinical care through Evvy’s telehealth platform. The platform integrates comprehensive metagenomic data analysis with patient reported medical history to generate evidence based, personalized treatment protocols. While the platform serves patients with various forms of vaginitis (including vulvovaginal candidiasis, aerobic vaginitis, and genitourinary syndrome of menopause), this study specifically focuses on BV treatment outcomes.
Given our symptomatic patient population, BV prevalence is notably high. Treatment protocols are individually tailored, comprising both primary antibiotic therapy and targeted adjunctive interventions. Antibiotic selection is guided by dual objectives: suppression of pathogenic microorganisms while preserving existing beneficial Lactobacillus communities. Evidence based adjunctive treatments, such as boric acid, vaginal estrogen, probiotics, and prophylactic antifungals, are included based on the patient’s history, symptoms and microbiome profile. All prescriptions are prescribed at the discretion of the provider, are made with medical-grade compounds, and are dispensed through an accredited compounding pharmacy.
Research indicates that patients with recurrent vaginitis experience significant psychosocial isolation, potentially compromising treatment outcomes [21]. The platform addresses this through comprehensive patient support, including evidence-based educational resources, symptom monitoring, and individualized health coaching sessions. Preliminary analyses demonstrate marked improvement in patient experience, with 96% of patients reporting feeling understood by our care team compared to 4% in traditional care settings (unpublished data [22]).
2.3. Measuring Observed Response and Recurrence Rate - Treatment Response Evaluation
Treatment response was assessed through patient reported post-treatment questionnaires using a 5-point-Likert scale [23]. Patients were asked, “Since the start of treatment how have your vaginal symptoms changed?” on a scale of 1 (significantly better) to 5 (significantly worse). Patients were stratified into responders, who reported significant or moderate improvement, and non-responders, who reported unchanged or worsened symptoms. Response data was collected on average 4.4 months post-initial treatment during post-treatment assessment.
2.4. Symptom Severity Assessment
Symptom severity was quantitatively evaluated at each sampling timepoint using a 14-parameter symptom questionnaire that includes the following symptoms: excessive discharge, odorous discharge, vaginal pain, vulvar pain, vulvar erythema, vaginal edema, external and internal itchiness, vaginal dryness, vaginal burning, vulvar burning, dyspareunia, and dysuria. Patients rated each symptom on a scale of 0-3 (0 = absent, 1 = mild, 2 = moderate, 3 = severe). These ratings were aggregated to generate a comprehensive symptom score. Therapeutic efficacy was determined by calculating the absolute change in symptom scores between pre and post treatment testing.
2.5. Recurrence Monitoring
Recurrence data was collected through multiple channels: direct platform re-engagement, structured follow-up questionnaires, and systematic review of clinical documentation. Recurrence in Evvy’s platform was defined as subsequent prescription of metronidazole or clindamycin for vaginitis. Additionally, 193 post-care clinical notes were systematically reviewed for documentation of external antibiotic prescriptions or provider consultations. Finally, a supplementary email-based follow-up survey captured whether patients sought treatment outside our platform.
2.6. Treatment Adherence Measurement
Treatment adherence was evaluated using a patient-reported 5-point scale, where 5 represented strict protocol adherence and 1 indicated significant protocol deviation. For analytical purposes, scores were dichotomized: scores of 1-3 were classified as non-adherent, while scores of 4-5 indicated high adherence.
2.7. Sample Collection and Sequencing Methodology
Vaginal specimens were self-collected using standardized collection kits (Copan, Murrieta, CA, USA) following previously established protocols 24. Shotgun metagenomic sequencing was performed using a CLIA/CAP/CLEP certified analytical pipeline (Microgen DX, Lubbock, TX, USA). Patient data collection included questionnaires documenting symptomatology, relevant clinical diagnoses, demographic information, and treatment response metrics at post-treatment assessment.
2.8. Bioinformatics Analysis
Metagenomic data analysis was conducted according to previously published protocols [24]. Briefly, Evvy’s proprietary bioinformatics pipeline incorporates rigorous quality control measures, host sequence depletion, and high-resolution taxonomic profiling. Species-level classification is achieved through alignment with a curated vaginal-specific genomic signature database. To ensure analytical robustness, only taxonomic classifications demonstrating relative abundance exceeding 0.75% are included in the final analyses.
2.9. Statistical Analysis
Genus-level taxonomic analyses were performed by calculating combined relative abundances of key bacterial genera (Gardnerella, Lactobacillus, Prevotella, and Fannyhessea) and broader biological groups (aerobic and anaerobic bacteria). Species-level analyses were conducted for individual Gardnerella and Lactobacillus species. Between-group comparisons of responders and non-responders were evaluated using Mann-Whitney U tests. Distribution patterns of combined taxa and individual species were visualized using enhanced box plots (boxen plots). Mean values are reported in the main text, with corresponding medians and interquartile ranges (IQRs) provided in Supplementary Table S3.
Temporal changes between baseline and follow-up timepoints were assessed using Wilcoxon signed-rank tests on taxa abundances for paired samples. To address potential bias arising from cohort size disparity, we used a bootstrapping approach to assess the robustness of our p-values to sampling effects. In this approach, we repeated the Wilcoxon paired sample analysis for 1,000 iterations, such that in each iteration, a random subsample of the responder group was chosen to create a cohort that was size matched to the non-responder group. Within each subsampled cohort, the same set of Wilcoxon-signed rank tests as in the full cohort were performed to generate a p-value for each taxa comparison. This process was repeated 1,000 times, yielding a distribution of bootstrapped p-values for each taxa comparison. In Figure 4-6, statistical significance for responders was defined as having at >75% of the bootstrapped p-values maintaining statistical significance at p<0.05.
Overall microbial community structure differentiation between pre- and post-treatment samples was assessed using permutation testing of uniform manifold approximation and projection (UMAP) coordinates [25], analogous to PERMANOVA [26] methodology. A pseudo-F statistic was computed from the pairwise distances between points in the 2D UMAP space, comparing the ratio of between-group to within-group variance. A null distribution was approximated by randomly shuffling the group labels 1000 times. The p-value was calculated as (n+1)/(N+1), where N is the total number of permutations, and n is the number of permuted pseudo-F statistics greater than or equal to the original, non-permuted pseudo-F statistic.
Demographic and clinical variables were analyzed using R (Version 4.4.2). For continuous variables such as age, BMI, and quality of life, normality was assessed using the Shapiro-Wilk test. If normality was violated, the Mann–Whitney U test was used for hypothesis testing to compare group medians, with medians and IQR reported. Because this was a retrospective observational study, no power analysis was done [27].
For categorical variables, contingency tables were constructed to analyze the frequencies of membership in health history categories. For single-category membership variables, Fisher’s Exact Test with simulation (B=10,000) was performed, and multiple comparisons were corrected using the Bonferroni adjustment. For multiple-category membership variables, the Rao-Scott corrected chi-square test [28] was applied to account for within-group correlations and complex sample structures. All statistical tests were two-tailed, with significance set at p < 0.05.
3. Results
3.1. Treatment Response Analysis
This retrospective observational study included 1,159 patients that were stratified based on their response to an outcomes survey on symptom resolution. Responders were defined as those who reported significant or moderate improvement (N=875), and non-responders as those with no change or moderate or significant worsening of symptoms (N=284) (Figure 1). The overall response rate was 75.5% (875/1159, Figure 1, Table 1).
3.2. Demographics
Demographic analysis revealed no significant differences between responder and non-responder cohorts in age, BMI, race/ethnicity, menopausal status, pregnancy status, number of sexual partners, contraceptive use, or use of any vaginal products in the 30 days prior to treatment (Table 2, Supplementary Table S1). There was no difference in the number of non-menopausal responders who had a period in the last 30 days compared to non-responders (Supplementary Table S1). Comorbidity profiles were comparable between cohorts (p=0.14, Supplementary Table S2). Baseline quality of life assessments demonstrated a small but significant difference, with non-responders reporting lower scores compared to responders (mean 7.5 versus 7.16, respectively; p=0.014) (Table 2).
3.3. Clinical Symptom Resolution
Patients were asked to rate 14 urogenital symptoms on a scale of 0-3 (not experiencing to severe). Pre-treatment symptom assessment revealed a modest but statistically significant difference between cohorts: non-responders demonstrated a higher initial symptom burden (mean score 6.2) compared to responders (mean score 5.3, p<0.05, Figure 2). Post-treatment, responders exhibited significant clinical improvement, with mean symptom scores decreasing from 5.3 to 2.4 (p<0.0001). In contrast, non-responders showed no meaningful change in symptom burden (mean score 6.2 to 6.3, p=0.55). This resulted in responders having significantly fewer symptoms than non-responders post treatment (mean 2.4 vs 6.3, p<0.0001, Figure 2).
3.4. Recurrence Rate Analysis
Post-treatment follow-up care data was obtained for 31.7% (367/1159) of the study cohort through multiple sources: clinical documentation review, subsequent care episodes, and survey responses. Of these patients, 310 sought continued care through Evvy’s platform, 34 reported receiving treatment from external providers, and 23 have clinical documentation or survey results indicating that they did not receive additional care.
The average interval between care and post-treatment testing was 4.4 months, with recurrence rates stratified by follow up timeframe. Comparable recurrence rates were observed across early follow-up periods: <3 months (24.4%), 3-4 months (28.7%), and 4-5 months (26.7%) post-treatment initiation (Table 3). A notably lower recurrence rate (17.9%) was documented in patients evaluated between 5-6 months. This corresponds with previous literature demonstrating peak recurrence risk within 3-6 months post-treatment [14]. The aggregate observed recurrence rate at post-treatment assessment was 29.7%.
3.5. Differential Microbiome Profiles Between Response Groups
Microbial community analysis revealed distinct changes between responder and non-responder cohorts between pre- and post-treatment testing. Responders demonstrated significant reduction in vaginal microbiome diversity post-treatment (median 1.71 to 1.56, p<0.0001), while non-responders maintained consistent diversity metrics (median 1.63 to 1.60, p=0.75) (Figure 3A, Supplementary Table S3). Although both groups exhibited decreased abundance of anaerobic pathogens, the magnitude of reduction was substantially greater in responders (median 0.67, IQR 0.47 to 0.52, p<0.0001) compared to non-responders (p=0.015, Figure 3B, Supplementary Table S3). As expected, given that this patient population was diagnosed with BV, not aerobic vaginitis, aerobic bacterial abundance was low and remained stable across both cohorts after treatment (Figure 3B, Supplementary Table S3).
3.5.1. Lactobacillus Species Analysis
Lactobacillus genera, recognized as the primary protective taxa in vaginal health, demonstrated treatment-associated increases in both cohorts (Figure 4A). Responders exhibited a more significant increase in total Lactobacillus abundance (31.1% to 49.9%, p<0.0001) compared to non-responders (38.5% to 44.0%, p<0.05; Figure 4A, Supplementary Table S3). Non-responders showed selective species-specific improvements, limited to L. crispatus (14.3% to 17.7%, p<0.01) and L. rhamnosus (0.1% to 0.4%, p<0.01) (Figure 4B, Supplementary Table S3).
In contrast, responders demonstrated significant increases across all major vaginal Lactobacillus species: L. crispatus (12.1% to 21.0%, p<0.0001), L. iners (14.8% to 21.8%, p<0.0001), L. jensenii (1.1% to 2.2%, p<0.0001), and L. gasseri (1.7% to 3.2%, p<0.0001). Additionally, the probiotic species L. rhamnosus showed significant expansion (0.1% to 0.9%, p<0.0001) (Figure 4B, Supplementary Table S3). While initial analyses suggested significance for secondary Lactobacillus species (L. reuteri and L. paragasseri), these findings did not meet bootstrapping validation thresholds (Supplementary Table S3). This suggests that changes in the abundances of these taxa were present in some individuals but were not common across the full cohort. Therefore, the bootstrapped p-values did not reach the significance threshold in a large portion of the subsampled cohorts.
3.5.2. Analysis of BV-Associated Taxa
Three primary taxa associated with bacterial vaginosis, Gardnerella, Prevotella, and Fannyhessea (formerly Atopobium), demonstrated distinct response patterns post-treatment. Prevotella abundance decreased significantly in responders (7.7% to 4.0%, p<0.0001) while remaining stable in non-responders (5.1% to 6.7%, p=0.66) (Figure 5A, Supplementary Table S3). Fannyhessea demonstrated reduction in both cohorts, with responders showing more pronounced depletion (4.7% to 1.8%, p<0.0001) compared to non-responders (3.0% to 1.7%, p=0.05) (Figure 5B, Supplementary Table S3).
3.5.3. Gardnerella Species Analysis
While overall Gardnerella abundance decreased across both cohorts, responders exhibited more substantial reduction (45.1% to 35.2%, p<0.0001) compared to non-responders (43.8% to 37.3%, p<0.001) (Figure 5C, Supplementary Table S3). Species-level analysis revealed that non-responders showed no significant changes in individual Gardnerella species post-treatment (Figure 5D, Supplementary Table S3). In contrast, responders demonstrated significant reductions in two Gardnerella species: G. swidsinskii (17.8% to 11.8%, p<0.0001) and G. leopoldii (4.4% to 3.1%, p<0.0001), while G. piotii remained stable (8.3% to 7.6%, p=0.06) (Figure 5D, Supplementary Table S3). Although initial analysis suggested significant reduction in G. vaginalis among responders (14.7% to 11.8%), these findings did not meet bootstrap validation thresholds.
3.5.4. Community Composition Shifts
Given that bacterial vaginosis represents a community-level dysbiosis of the VMB, a comprehensive analysis that goes beyond individual taxa was done. A Uniform Manifold Approximation and Projection (UMAP) dimensionality reduction was done for each response group color coded by pre- and post-treatment samples (Figure 6A-B).
There was a significant restructuring of vaginal microbiome profiles following treatment for responders (p=0.001, Figure 6A). Post-treatment samples predominantly clustered into two distinct communities, characterized by either L. crispatus or L. iners dominance (Figure 6, Supplementary Figure S1). In contrast, non-responders demonstrated only modest alterations in community composition post-treatment (p=0.018, Figure 6), evidenced by diffuse distribution patterns without clear post-treatment community convergence.
3.6. Treatment Adherence and Adverse Events
Adverse event frequency was comparable between response groups and antimicrobial treatment arms (Table 4 and Table 5). The majority of patients (>50%) reported no adverse events, with this proportion remaining consistent across response groups (Table 4). Primary reported adverse events included vaginal/vulvar irritation and alterations in vaginal discharge (Supplementary Table S5).
Multiple adverse events were reported in 10-15% of patients (Table 4), with no significant differences observed between response groups or antimicrobial treatment arms (p=0.11, Table 5). All reported adverse events were non-life threatening and included vaginal, vulvar, or skin irritation, or GI upset. The most commonly co-occurring side effects were abnormal or increased discharge with vaginal or vulvar irritation (Supplementary Table S5).
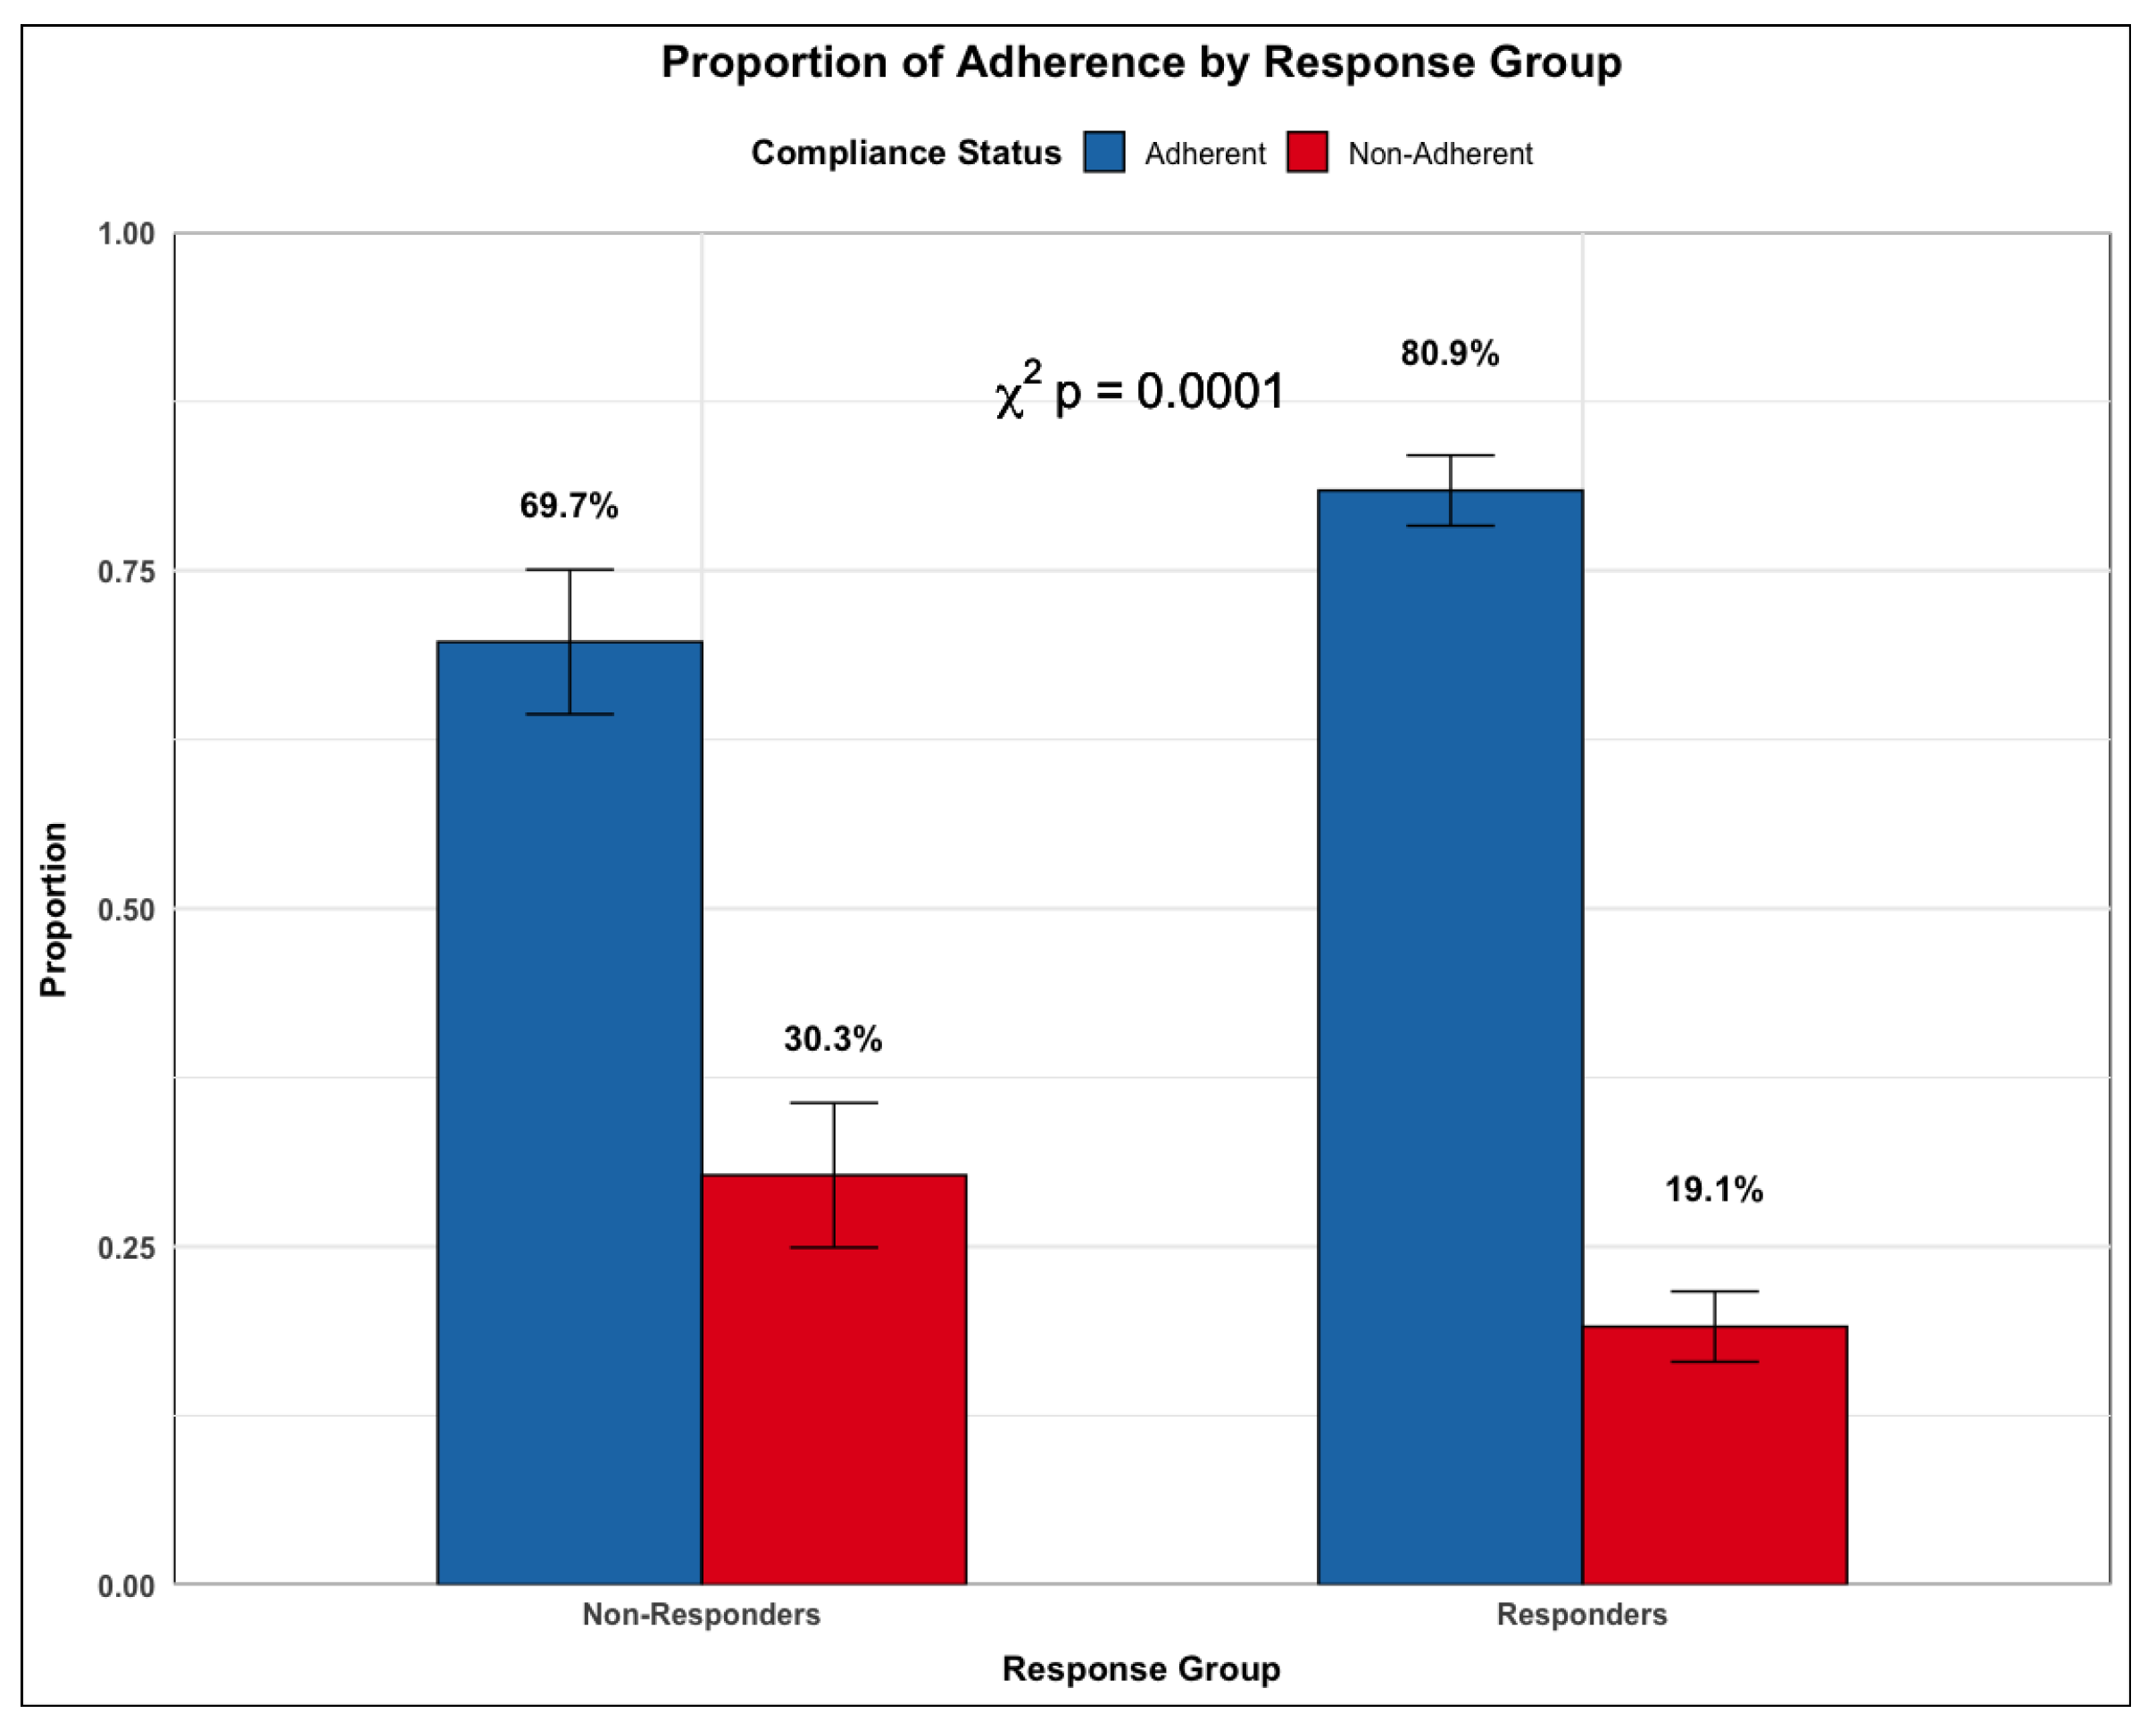
More patients in the non-responder group report greater deviation from the clinical protocol than those in the response group (p<0.0001, Figure 5). This suggests that for a subset of patients, their lack of treatment response may be due to how well they adhered to the treatment protocol.
Figure 7.
Rates of Compliance by Response Subgroup.The proportion of users that were adherent (blue) or non-adherent (red) to the treatment protocol in the Responders and Non-responders cohorts.
Figure 7.
Rates of Compliance by Response Subgroup.The proportion of users that were adherent (blue) or non-adherent (red) to the treatment protocol in the Responders and Non-responders cohorts.
4. Discussion
This large-scale analysis of real-world data provides compelling evidence for microbiome-informed approaches to bacterial vaginosis management. The platform’s integration of high-resolution metagenomic sequencing with tailored therapeutic protocols achieved a 75.5% response rate, comparable to or exceeding traditional care outcomes [14]. It is important to note that treatment response was reported at the post-treatment assessment which happens at an average of 4.4 months from starting treatment. Treatments described in the literature use an earlier follow up window of one month [14]. The sustained treatment response suggests that this platform’s treatment response is even more robust than other published protocols.
Additionally, we demonstrate that those that respond to these treatment pathways show symptom improvement across 14 different symptoms, not just the traditional BV-related symptoms of excessive and odorous discharge.
All patients who went through personalized treatment had an increase in protective organisms and a decrease in disruptive organisms. Notably, responders exhibited a more significant improvement in their VMB. This pattern could be seen at the level of the whole microbiome (Figure 6), as well as across specific species of interest (Figure 4 and Figure 5) such as increased Lactobacillus dominance and marked reduction in dysbiosis-associated taxa.
Additionally, the current standard of care for treating BV is limited to prescribing a single antibiotic. There is no personalization in terms of approach, specific symptom resolution, and no attempt at rebuilding a protective microbiome. In contrast, the testing and telemedicine platform described here, uses a patient’s individual microbiome to drive treatment, as well as prescribes more comprehensive treatment regimens to increase symptom resolution as well as the relative abundance of protective microbes.
Although there were limitations to our recurrence rate calculations, this analysis remains highly suggestive that evidence-based approaches targeting both symptom resolution and microbiome restoration may provide improved clinical outcomes. The observed 27.5% recurrence rate (at an average of 4.4 months) represents an improvement over historical rates of 45-50% reported in the literature that were measured at shorter follow up windows [14,15]. Our findings demonstrate the clinical utility of comprehensive vaginal microbiome characterization in therapeutic decision-making, advancing beyond conventional empiric antibiotic selection.
We found that a high adherence to Evvy’s treatment protocols correlated with better outcomes, reinforcing the importance of patient engagement in long-term vaginal health. Importantly, reported adverse events were mild and consistent across response groups, with no significant differences between the two antibiotic options.
Taken together this data suggests that patients who went through personalized and comprehensive treatment experienced improved symptom reduction, an improved vaginal microbiome composition, and a reduced recurrence rate. Additionally, if a patient felt better after treatment, they were more likely to have a highly significant improvement in their microbiome.
This study, representing the largest analysis of personalized, microbiome-based approaches to BV treatment to date, provides evidence supporting a data-driven approach to management where high-resolution diagnostics enable targeted care pathways. By utilizing shotgun metagenomic sequencing and systematic bioinformatic analysis, clinicians can implement evidence-based decisions that account for each patient’s distinct microbial profile. This precise approach addresses both immediate symptoms and potentially reduces recurrence risk through strategic microbiome modulation. Further research is needed to study long term monitoring of these patients, and to compare recurrence rates to the standard of care.
4.1. Limitations
Several limitations of this real-world evidence study warrant discussion. The observational nature of the study design introduced variability in follow-up windows, preventing standardization of sampling timepoints. Follow-up data were available for only 31.7% of patients, potentially introducing bias in recurrence rate estimates. No validated questionnaires exist to assess BV symptoms, and while standard questionnaire formats were used in this study [23], future research would benefit from a validated BV questionnaire. The telemedicine-based approach, while enabling broad accessibility, limited direct clinical assessment. Additionally, concurrent treatment from external providers could not be definitively excluded.
Despite these limitations, these findings have important implications for clinical practice, suggesting that optimization of BV treatment outcomes may be achieved through microbiome-guided therapeutic strategies. As our understanding of the vaginal microbiome’s role in health and disease continues to expand, integration of comprehensive diagnostics with personalized treatment protocols may enhance the standard of care in managing vaginal dysbiosis.
4.2. Future Directions
This comprehensive analysis of microbiome-guided BV treatment establishes a foundation for several critical areas of future investigation. Identification of predictive microbial signatures at baseline could further refine treatment selection and optimize therapeutic outcomes. Such biomarker discovery could enhance the precision of personalized treatment protocols.
Understanding recurrence patterns requires deeper investigation of both microbial and clinical factors. Among the 310 individuals who received follow-up care, systematic analysis of strain-level microbial dynamics and metabolic pathways may reveal mechanisms underlying treatment failure. Additionally, investigation of environmental and behavioral factors—including stress, sexual activity, and concurrent antibiotic exposure—could elucidate triggers for microbiome perturbation and inform strategies for maintaining vaginal ecosystem stability. Recent research has highlighted that BV can be sexually transmitted [29] and that partner treatment is effective at reducing BV recurrence rates [30]. While partner treatment was not an available option at the time of this study, future studies should include using this personalized treatment methodology alongside partner treatment to decrease recurrence even further.
Lastly, longitudinal studies are essential to evaluate whether microbiome-guided, personalized treatment approaches confer protection against adverse reproductive health outcomes. Specifically, investigation of the relationship between restored vaginal microbiome composition and risks of preterm birth, assisted reproductive technology outcomes, and sexually transmitted infection acquisition would establish the broader clinical impact of this therapeutic strategy.
5. Conclusions
This study demonstrates that integration of high-resolution microbial analysis with personalized therapeutic protocols achieves both symptomatic improvement and restoration of vaginal microbiome homeostasis in bacterial vaginosis management.
Supplementary Materials
The following supporting information can be downloaded at: https://www.mdpi.com/article/10.3390/plants14101483/s1, Supplementary Figure S1: UMAP analysis of all samples with samples color coded based on dominant taxa.; Supplementary Table S1: Additional Demographics Data Supplementary Table S2: Comorbidities; Supplementary Table S3: Statistics for all species presented in Figure 2-4; Supplementary Table S4: Pathogenic aerobes and anaerobes; Supplementary Table S5: Specific Symptom Catagories for Patient Reported Adverse Events
Author Contributions
Conceptualization, K.TW., K.M., and P.N.; software, D.L. and G.O.; formal analysis, K.TW., D.L, and G.O; data curation, G.O.; writing—original draft preparation, K.TW.; writing—review and editing, K.TW., D.L., P.N., and K.M.; visualization, G.V. and D.L.; supervision, P.N., and K.M; All authors have read and agreed to the published version of the manuscript.
Funding
All study participants provided informed consent. The study was conducted in accordance with the Declaration of Helsinki, and study procedures were conducted in accordance with protocols approved by a federally accredited Institutional Review Board (IRB# 20220118.evvy). Patients provided written informed consent prior to be included in the study.
Informed Consent Statement
Informed consent was obtained from all subjects involved in the study.
Data Availability Statement
This research was sponsored by Evvy and the authors of the paper who have access to the data are employees or scientific collaborators of Evvy who have signed contracts with Evvy to be bound by Evvy’s privacy policy and access restrictions. Additional data can be made available through a Data Transfer Agreement that protects the privacy of participants’ data; interested researchers may make requests by contacting kthomasw@evvy.com. The information provided by interested researchers will be used to generate a Data Transfer Agreement (DTA). The DTA protects the privacy of the participants’ data and will need to be signed by both the institution and Evvy before data can be transferred.
Acknowledgments
The authors acknowledge the rest of the Evvy team for their support. We note that the figures were created using Seaborn and BioRender.com. And finally, we acknowledge and appreciate all the women who suffer from vaginal infections and have shared their stories with us.
Conflicts of Interest
All authors (Thomas-White, Lyttle, Olmschen, Markowitz, Navarro, and McLean) are employees of Allora Health (dba Evvy).
Abbreviations
The following abbreviations are used in this manuscript:
| BV | Bacterial Vaginosis |
| VMB | Vaginal Microbiome |
References
- Peebles, K.; Velloza, J.; Balkus, J. E.; McClelland, R. S.; Barnabas, R. V. High Global Burden and Costs of Bacterial Vaginosis: A Systematic Review and Meta-Analysis. Sex Transm Dis 2019, 46, 304–311. [Google Scholar] [CrossRef] [PubMed]
- Kairys, N.; Carlson, K.; Garg, M. Bacterial Vaginosis. In StatPearls; StatPearls Publishing: Treasure Island (FL), 2024. [Google Scholar]
- Thomas-White, K.; Navarro, P.; Wever, F.; King, L.; Dillard, L. R.; Krapf, J. Psychosocial impact of recurrent urogenital infections: a review. Womens Health (Lond) 2023, 19, 17455057231216537. [Google Scholar] [CrossRef] [PubMed]
- Schwebke, J. R.; Nyirjesy, P.; Dsouza, M.; Getman, D. Vaginitis and risk of sexually transmitted infections: results of a multi-center U.S. clinical study using STI nucleic acid amplification testing. J Clin Microbiol 2024, 62, e0081624. [Google Scholar] [CrossRef]
- Torcia, M. G. Interplay among Vaginal Microbiome, Immune Response and Sexually Transmitted Viral Infections. Int J Mol Sci 2019, 20, 266. [Google Scholar] [CrossRef] [PubMed]
- Skafte-Holm, A.; Humaidan, P.; Bernabeu, A.; Lledo, B.; Jensen, J. S.; Haahr, T. The Association between Vaginal Dysbiosis and Reproductive Outcomes in Sub-Fertile Women Undergoing IVF-Treatment: A Systematic PRISMA Review and Meta-Analysis. Pathogens 2021, 10, 295. [Google Scholar] [CrossRef]
- Vitale, S. G.; Ferrari, F.; Ciebiera, M.; Zgliczyńska, M.; Rapisarda, A. M. C.; Vecchio, G. M.; Pino, A.; Angelico, G.; Knafel, A.; Riemma, G.; De Franciscis, P.; Cianci, S. The Role of Genital Tract Microbiome in Fertility: A Systematic Review. Int J Mol Sci 2021, 23, 180. [Google Scholar] [CrossRef]
- Ravel, J.; Moreno, I.; Simón, C. Bacterial vaginosis and its association with infertility, endometritis, and pelvic inflammatory disease. Am J Obstet Gynecol 2021, 224, 251–257. [Google Scholar] [CrossRef]
- Zhou, Q.; Yu, Y.; Zhou, J.; Liu, J.; Gao, J. Relationship of Lactobacillus Vaginal Microbiota Changes and the Risk of Preterm Birth: A Systematic Review and Meta-Analysis. J Womens Health (Larchmt) 2024, 33, 228–238. [Google Scholar] [CrossRef] [PubMed]
- Dunlop, A. L.; Satten, G. A.; Hu, Y. J.; Knight, A. K.; Hill, C. C.; Wright, M. L.; Smith, A. K.; Read, T. D.; Pearce, B. D.; Corwin, E. J. Vaginal Microbiome Composition in Early Pregnancy and Risk of Spontaneous Preterm and Early Term Birth Among African American Women. Front Cell Infect Microbiol 2021, 11, 641005. [Google Scholar] [CrossRef]
- Kosti, I.; Lyalina, S.; Pollard, K. S.; et al. Meta-Analysis of Vaginal Microbiome Data Provides New Insights Into Preterm Birth. Front Microbiol 2020, 11, 476. [Google Scholar] [CrossRef]
- Maarsingh, J. D.; Laniewski, P.; Herbst-Kralovetz, M. M. Immunometabolic and potential tumor-promoting changes in 3D cervical cell models infected with bacterial vaginosis-associated bacteria. Commun Biol 2022, 5, 725. [Google Scholar] [CrossRef] [PubMed]
- Sharifian, K.; Shoja, Z.; Jalilvand, S. The interplay between human papillomavirus and vaginal microbiota in cervical cancer development. Virol J 2023, 20, 73. [Google Scholar] [CrossRef]
- Vodstrcil, L. A.; Muzny, C. A.; Plummer, E. L.; Sobel, J. D.; Bradshaw, C. S. Bacterial vaginosis: drivers of recurrence and challenges and opportunities in partner treatment. BMC Med 2021, 19, 194. [Google Scholar] [CrossRef]
- Cohen, C. R.; Wierzbicki, M. R.; French, A. L.; Morris, S.; Newmann, S.; Reno, H.; Green, L.; Miller, S.; Powell, J.; Parks, T.; Hemmerling, A. Randomized Trial of Lactin-V to Prevent Recurrence of Bacterial Vaginosis. N Engl J Med 2020, 382, 1906–1915. [Google Scholar] [CrossRef] [PubMed]
- Manhanzva, M. T.; Abrahams, A. G.; Gamieldien, H.; Froissart, R.; Jaspan, H.; Jaumdally, S. Z.; Barnabas, S. L.; Dabee, S.; Bekker, L. G.; Gray, G.; Passmore, J. S.; Masson, L. Inflammatory and antimicrobial properties differ between vaginal Lactobacillus isolates from South African women with non-optimal versus optimal microbiota. Sci Rep 2020, 10, 6196. [Google Scholar] [CrossRef]
- Amabebe, E.; Anumba, D. O. C. The Vaginal Microenvironment: The Physiologic Role of Lactobacilli. Front Med (Lausanne) 2018, 5, 181. [Google Scholar] [CrossRef]
- De Seta, F.; Campisciano, G.; Zanotta, N.; Ricci, G.; Comar, M. The Vaginal Community State Types Microbiome-Immune Network as Key Factor for Bacterial Vaginosis and Aerobic Vaginitis. Front Microbiol 2019, 10, 2451. [Google Scholar] [CrossRef] [PubMed]
- Amabebe, E.; Anumba, D. O. C. Mechanistic Insights into Immune Suppression and Evasion in Bacterial Vaginosis. Curr Microbiol 2022, 79, 84. [Google Scholar] [CrossRef]
- Hickey, R. J.; Forney, L. J. Gardnerella vaginalis does not always cause bacterial vaginosis. J Infect Dis 2014, 210, 1682–1683. [Google Scholar] [CrossRef]
- Thomas-White, K.; Wever, F.; Navarro, P. Incidence and Symptom Profiling of Vaginitis Containing Aerobic and Anaerobic Pathogens. AJOG 2023. [Google Scholar]
- Navarro, P.; Thomas-White, K.; Wever, F.; et al. Evvy’s Innovative Care Platform for Personalized, Integrative, & Supportive Vaginal Healthcare. 2022. [Google Scholar]
- Sullivan, G. M.; Artino, A. R., Jr. Analyzing and interpreting data from likert-type scales. J Grad Med Educ 2013, 5, 541–542. [Google Scholar] [CrossRef] [PubMed]
- Thomas-White, K.; Hilt, E. E.; Olmschenk, G.; Gong, M.; Phillips, C. D.; Jarvis, C.; Sanford, N.; White, J.; Navarro, P. A Metagenomics Pipeline to Characterize Self-Collected Vaginal Microbiome Samples. Diagnostics (Basel) 2024, 14, 20240913. [Google Scholar] [CrossRef]
- McInnes, L.; Haely, J.; Saul, N.; et al. UMAP: Uniform Manifold Approximation and Projection. Journal of Open Source Software 2018, 3, 861. [Google Scholar] [CrossRef]
- Anderson, M. Permutational Multivariate Analysis of Variance (PERMANOVA). In Wiley StatsRef: Statistics Reference Online; Balakrishnan, N., Colton, T., Everitt, B., et al., Eds.; 2017. [Google Scholar]
- Jiroutek, M. R.; Turner, J. R. Why it is nonsensical to use retrospective power analyses to conduct a postmortem on your study. J Clin Hypertens (Greenwich) 2018, 20, 408–410. [Google Scholar] [CrossRef]
- K., R. J. N.; Scott, A. J. The Analysis of Categorical Data From Complex Sample Surveys: Chi-Squared Tests for Goodness of Fit and Independence in Two-Way Tables. Journal of the American Statistical Association 1981, 76, 221–230. [CrossRef]
- Muzny, C. A.; Balkus, J.; Mitchell, C.; Sobel, J. D.; Workowski, K.; Marrazzo, J.; Schwebke, J. R. Diagnosis and Management of Bacterial Vaginosis: Summary of Evidence Reviewed for the 2021 Centers for Disease Control and Prevention Sexually Transmitted Infections Treatment Guidelines. Clin Infect Dis 2022, 74, S144–S151. [Google Scholar] [CrossRef]
- Vodstrcil, L. A.; Plummer, E. L.; Fairley, C. K.; Hocking, J. S.; Law, M. G.; Petoumenos, K.; Bateson, D.; Murray, G. L.; Donovan, B.; Chow, E. P. F.; Chen, M. Y.; Kaldor, J.; Bradshaw, C. S.; StepUp Team. Male-Partner Treatment to Prevent Recurrence of Bacterial Vaginosis. N Engl J Med 2025, 392, 947–957. [Google Scholar] [CrossRef]
Figure 1.
Study Design and Response Rates.
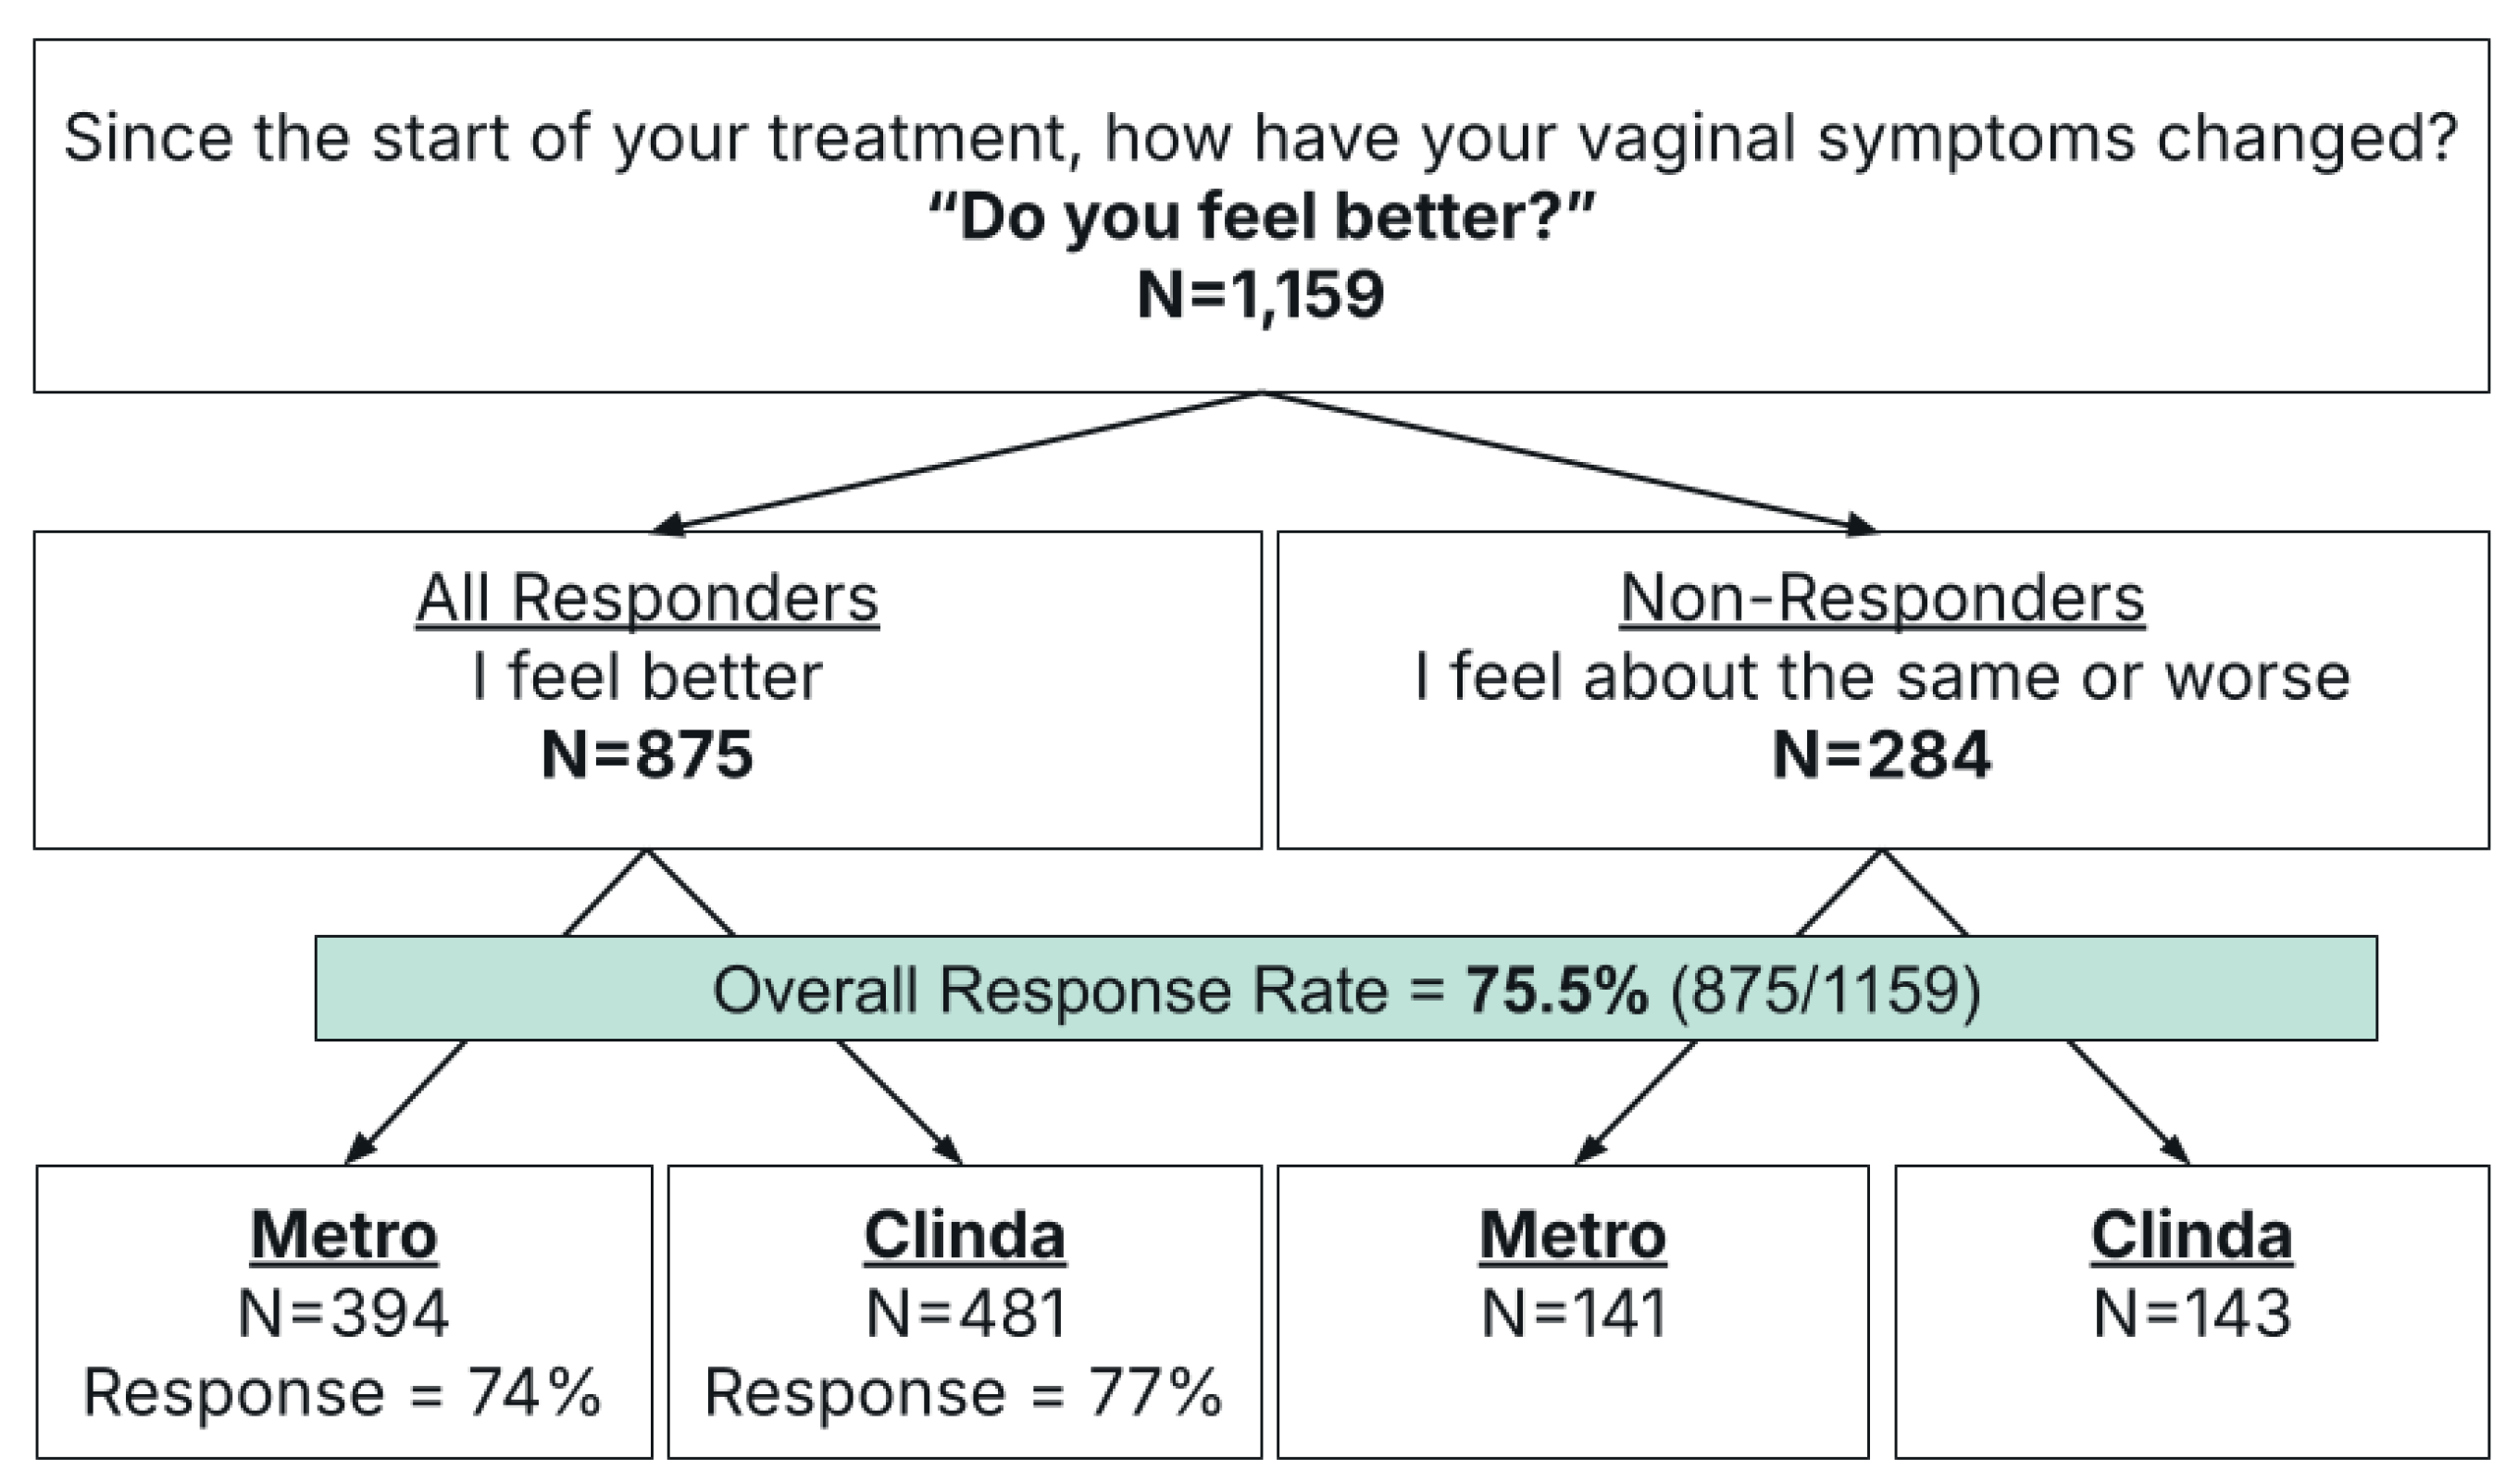
Figure 2.
Symptom Scores Pre- and Post-Treatment for Responders and Non-responders. (a) Baseline and (b) follow up samples for responders and non-responders. Full p-values are listed in Supplementary Table S3. * < 0.05, ** <0.001, *** <0.0001 by Wilcoxon Rank test.
Figure 2.
Symptom Scores Pre- and Post-Treatment for Responders and Non-responders. (a) Baseline and (b) follow up samples for responders and non-responders. Full p-values are listed in Supplementary Table S3. * < 0.05, ** <0.001, *** <0.0001 by Wilcoxon Rank test.
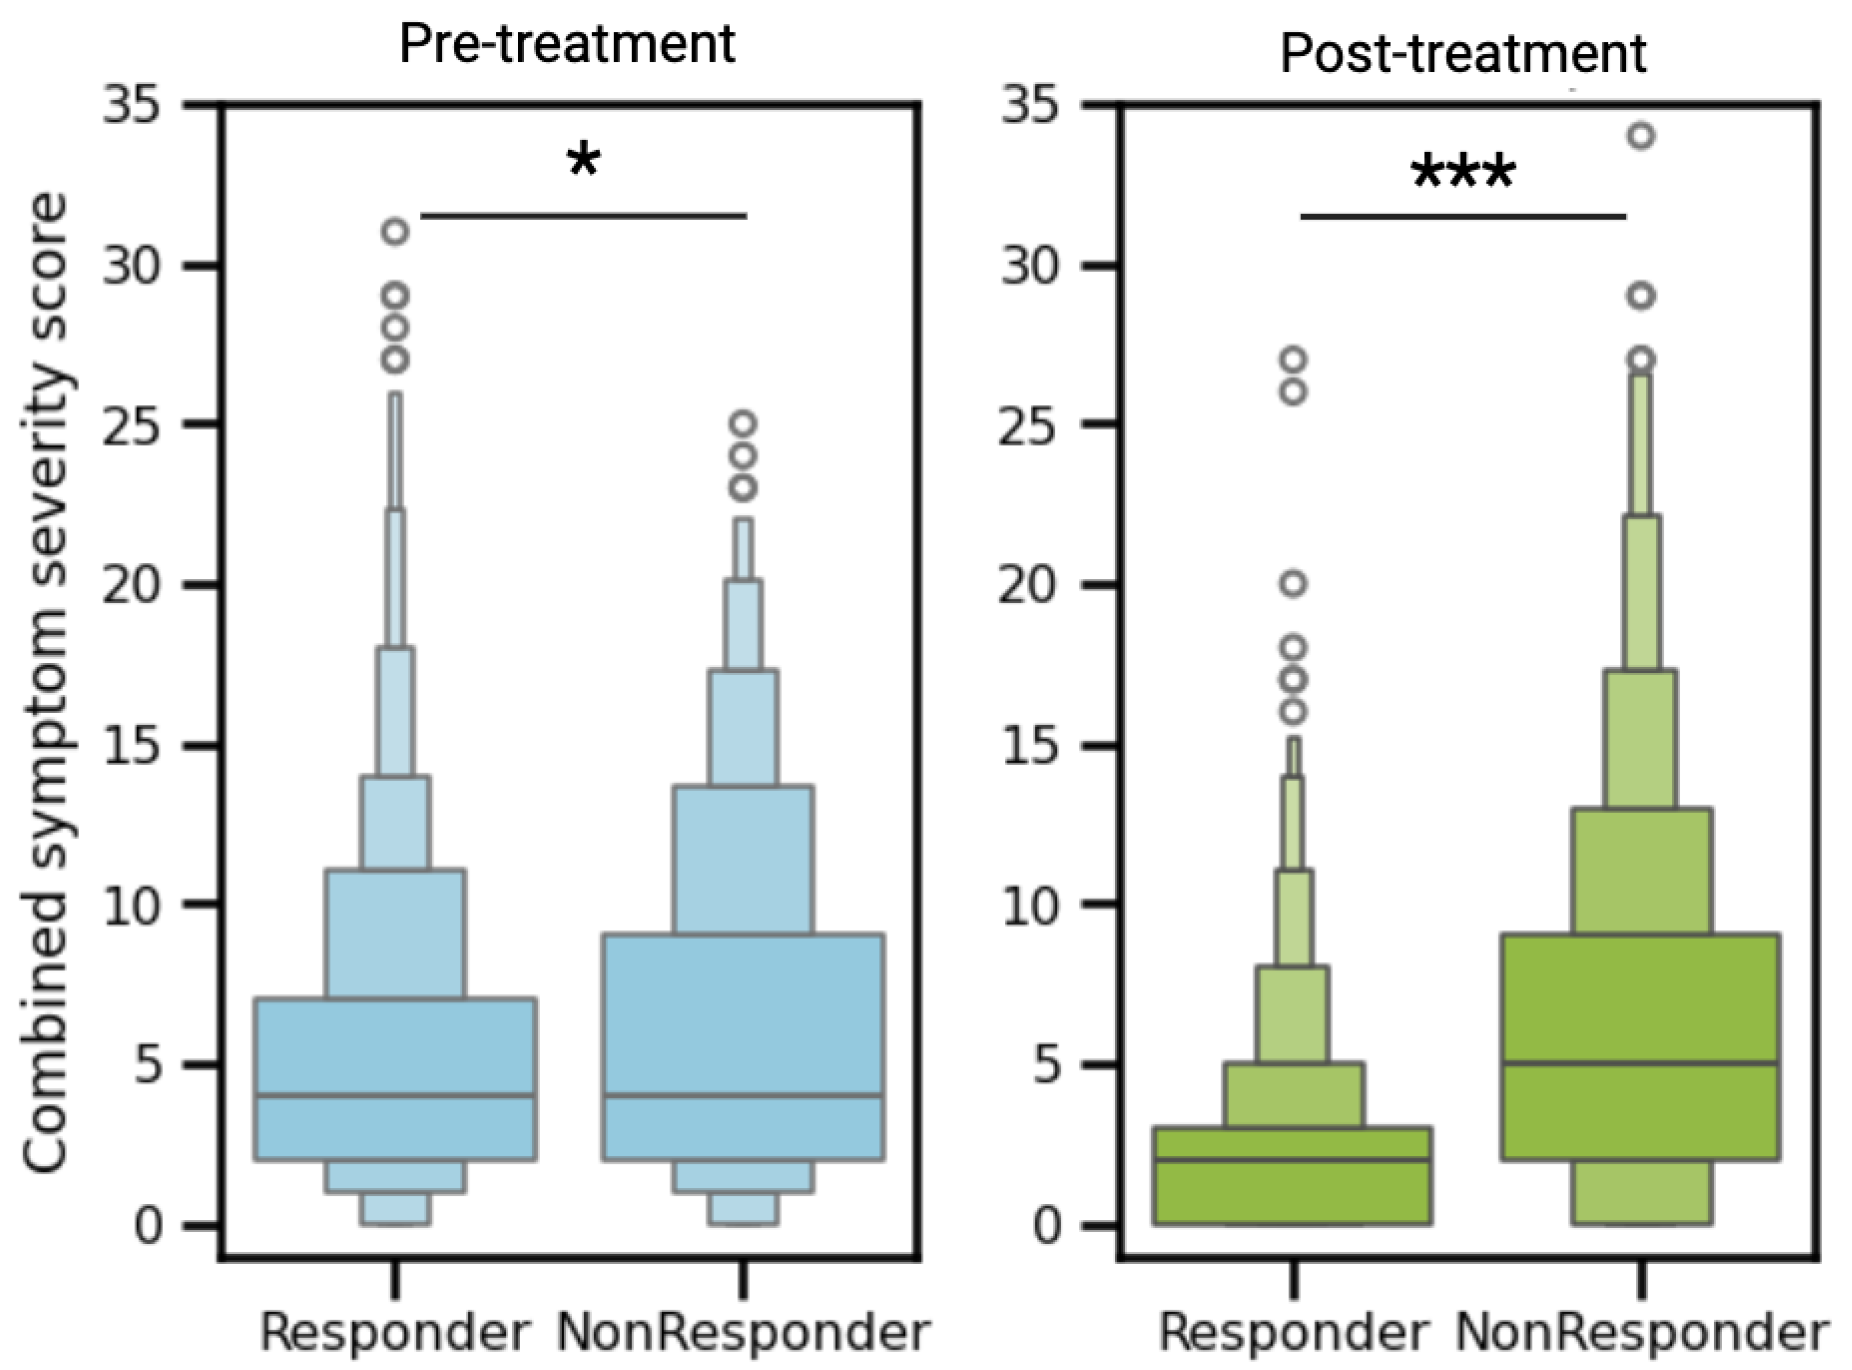
Figure 3.
Comparative Analysis of Microbial Community Characteristics Pre- and Post- Treatment in Responder and Non-responder Cohorts (a) Shannon diversity indices, (b) pathogenic anaerobe abundance, and (c) pathogenic aerobe abundance at baseline and follow-up assessment. Organisms classified as aerobes or anaerobes are detailed in the appendix. Complete statistical analyses are provided in Supplementary Table S3. Statistical significance: *p<0.05, **p<0.001, ***p<0.0001 (Wilcoxon Rank test).
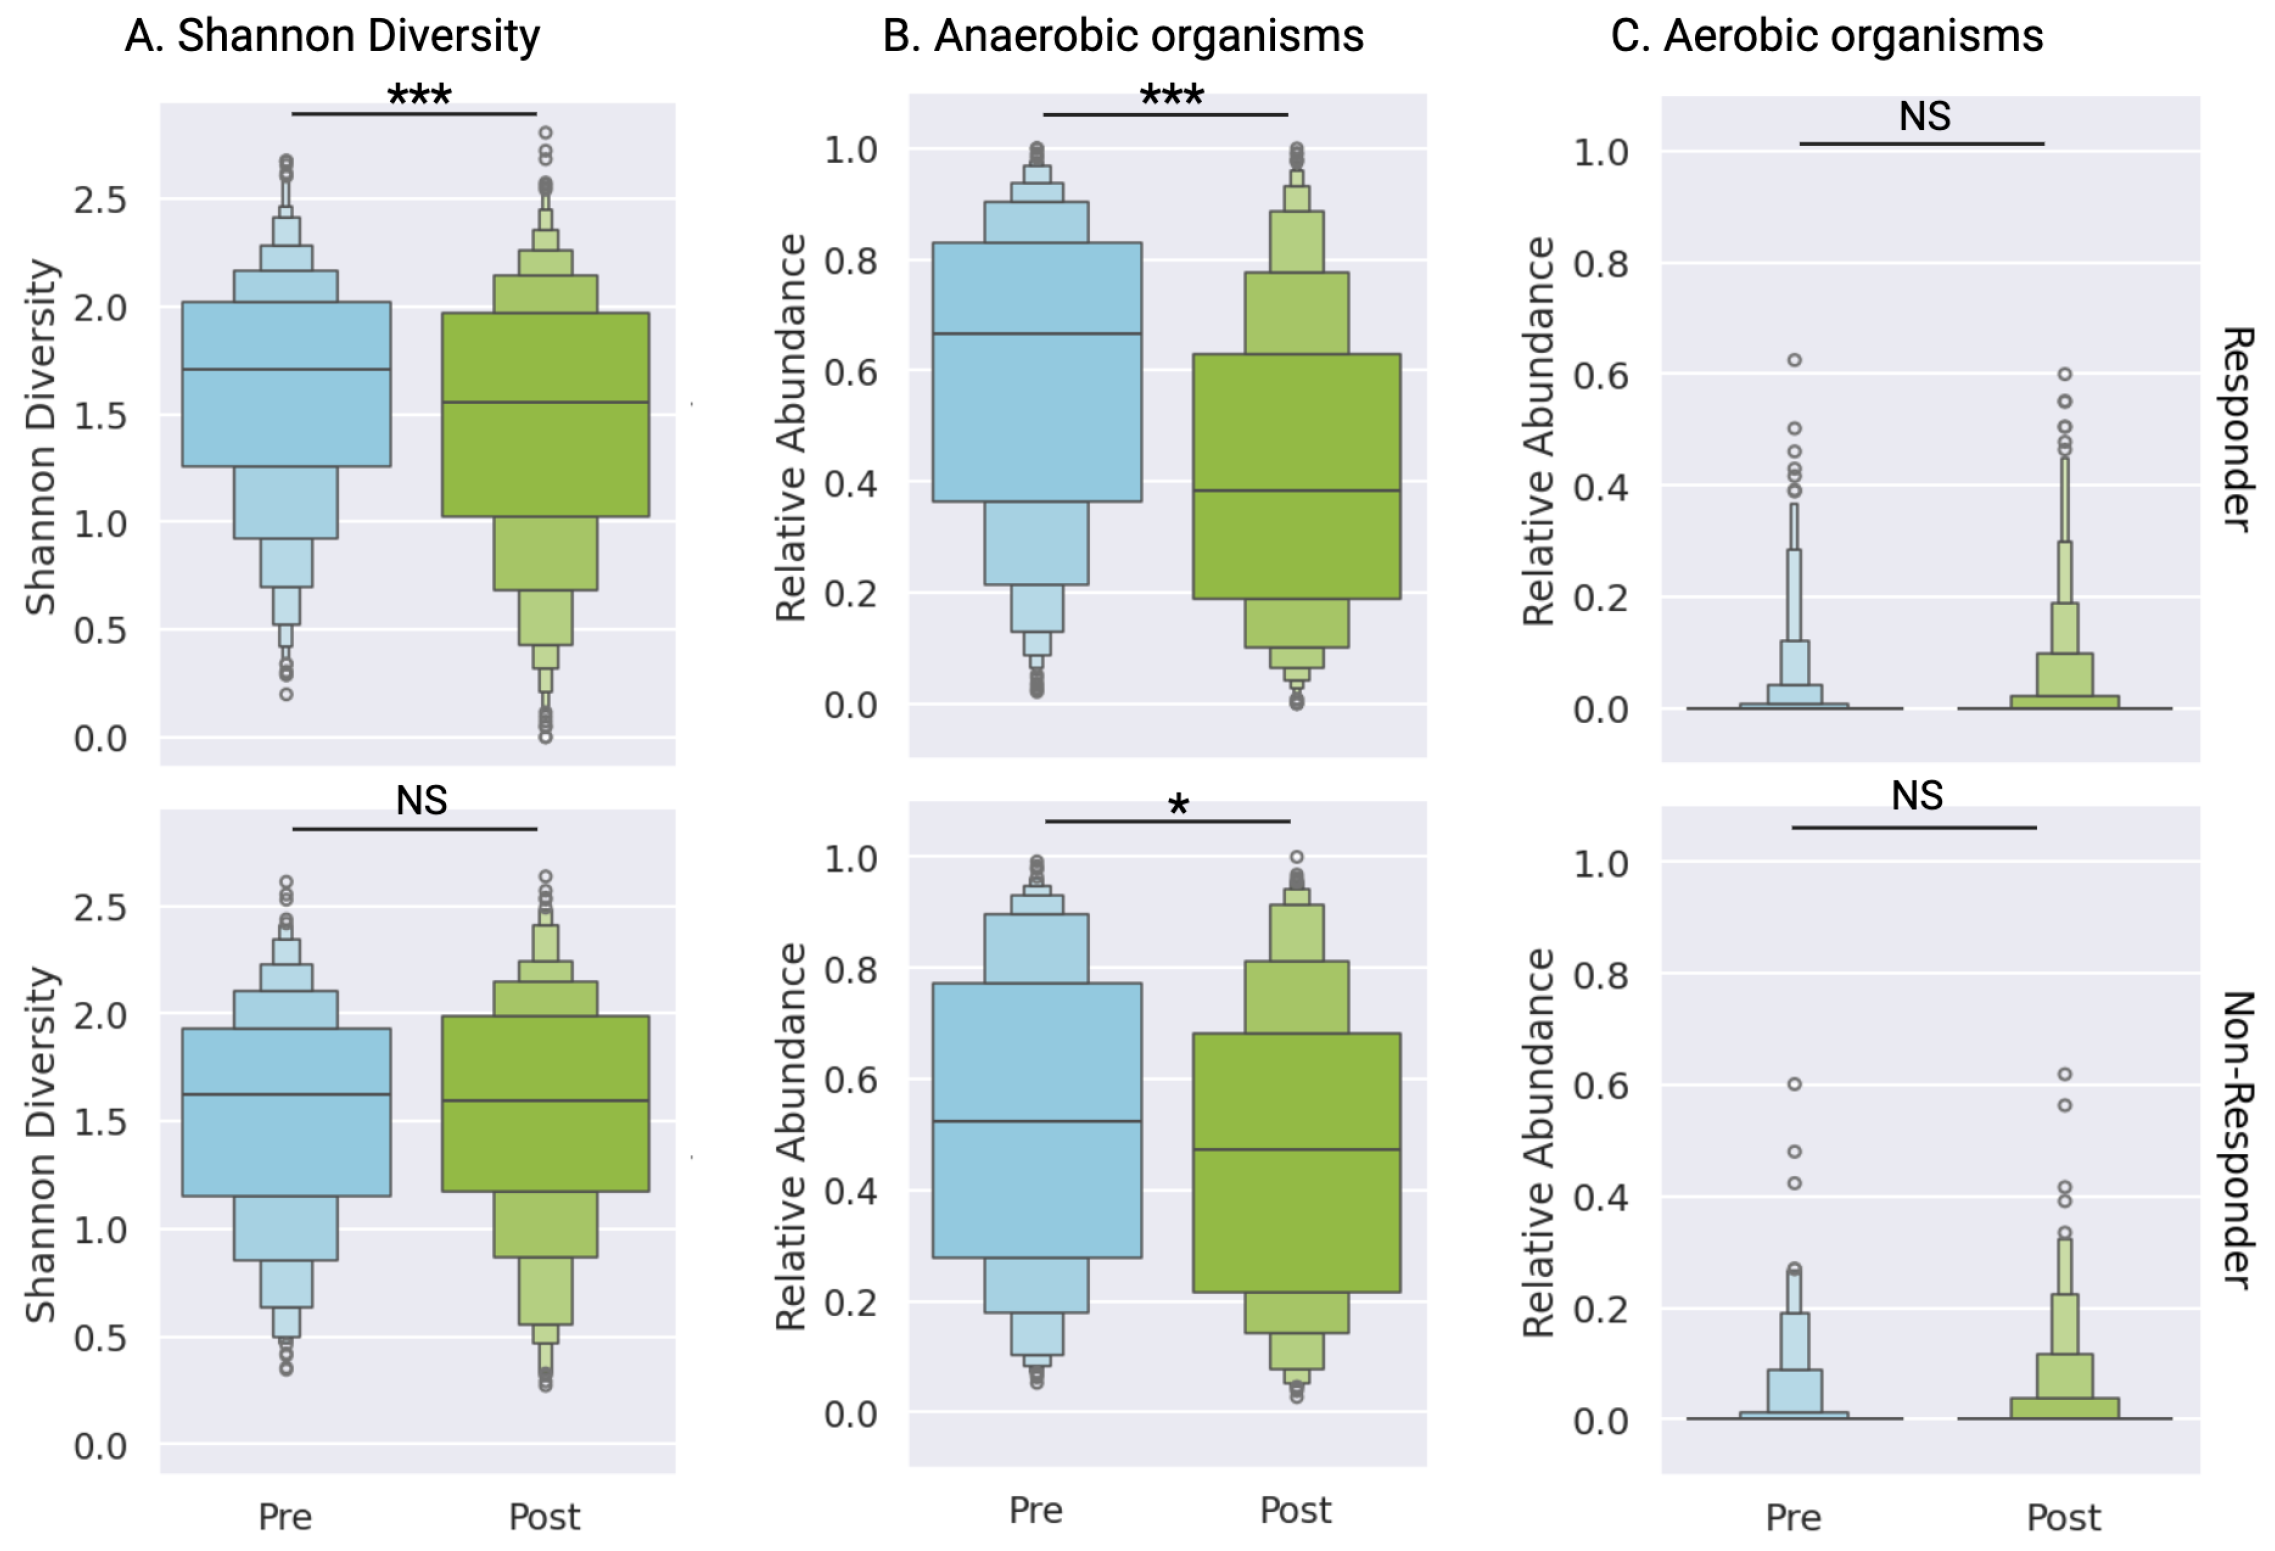
Figure 4.
Comparative Analysis ofLactobacillusAbundance Pre- and Post-Treatment Stratified by Treatment Response (a) Total Lactobacillus genus abundance and (b) species-specific abundance of vaginal-associated Lactobacillus taxa at baseline and follow-up assessment. Complete statistical analyses are provided in Supplementary Table S3. Statistical significance: *p<0.05, **p<0.001, ***p<0.0001 (Wilcoxon Rank test).
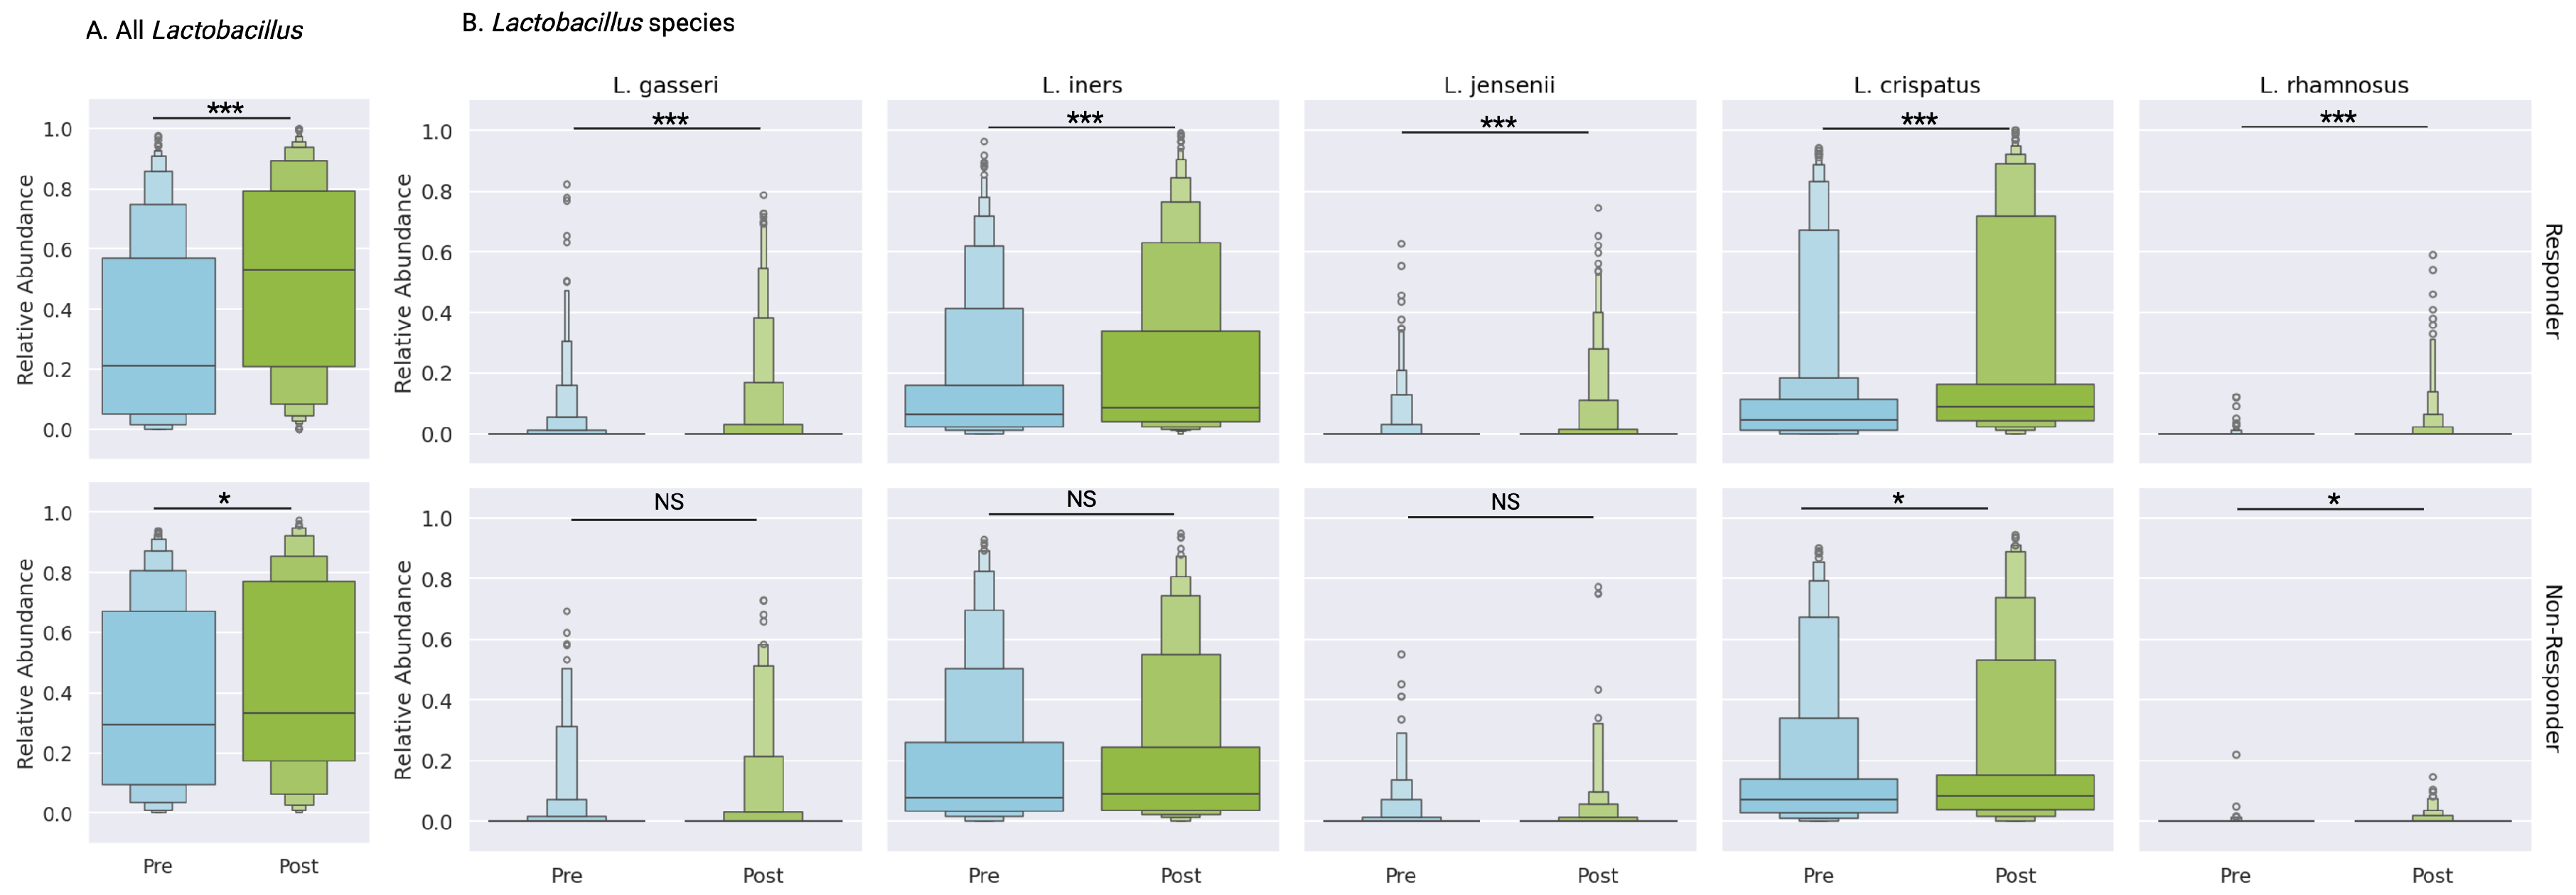
Figure 5.
Quantitative Analysis of BV-Associated Taxa Pre- and Post-Treatment in Treatment Response Cohorts. Comparative abundance of (a) Prevotella, (b) Fannyhessea, and (c) Gardnerella genera at baseline and follow-up baseline, with (d) species-level analysis of Gardnerella taxa. Complete statistical analyses are provided in Supplementary Table S3. Statistical significance: *p<0.05, **p<0.001, ***p<0.0001 (Wilcoxon Rank test).
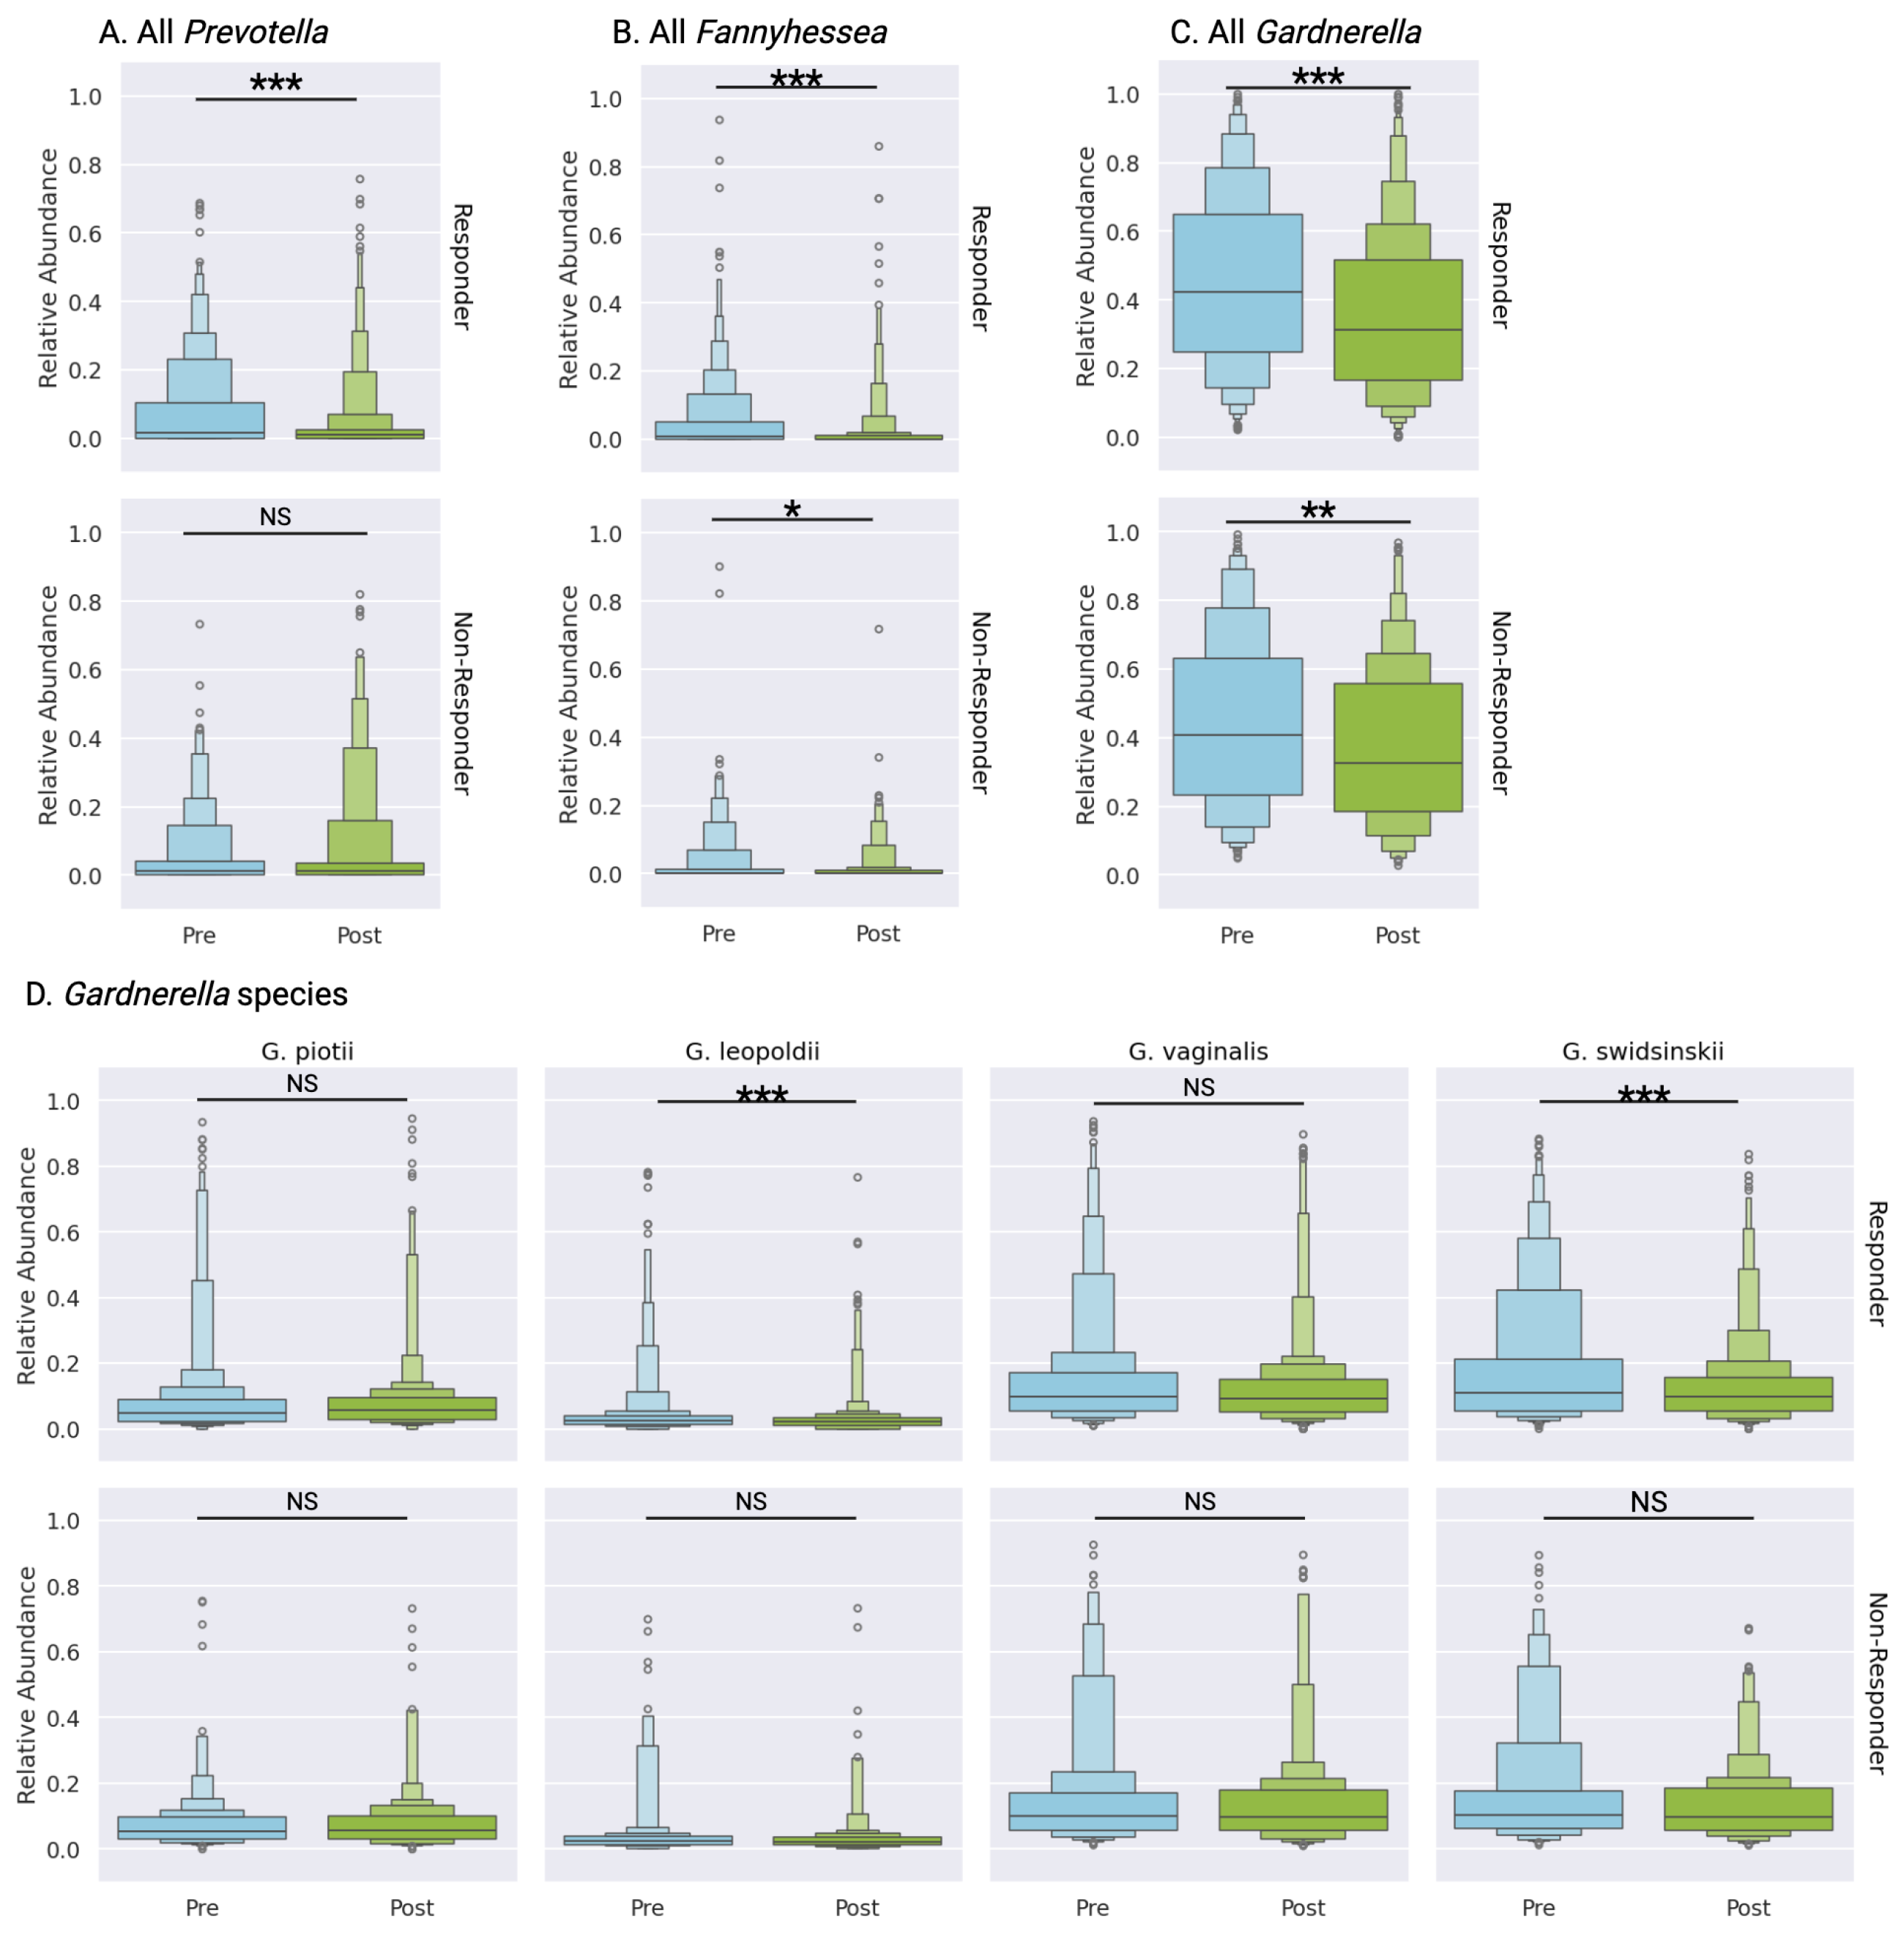
Figure 6.
Dimensionality Reduction (UMAP) Analysis of Vaginal Microbiome Community Dynamics Stratified by Treatment Response. UMAP analysis demonstrating microbiome compositional shifts in (a) responders (F-statistic 1892, Effect size 0.520) and (b) non-responders (F-statistic 571, Effect size 0.502). Sample timepoints are color-coded: baseline (blue) and follow-up (green).
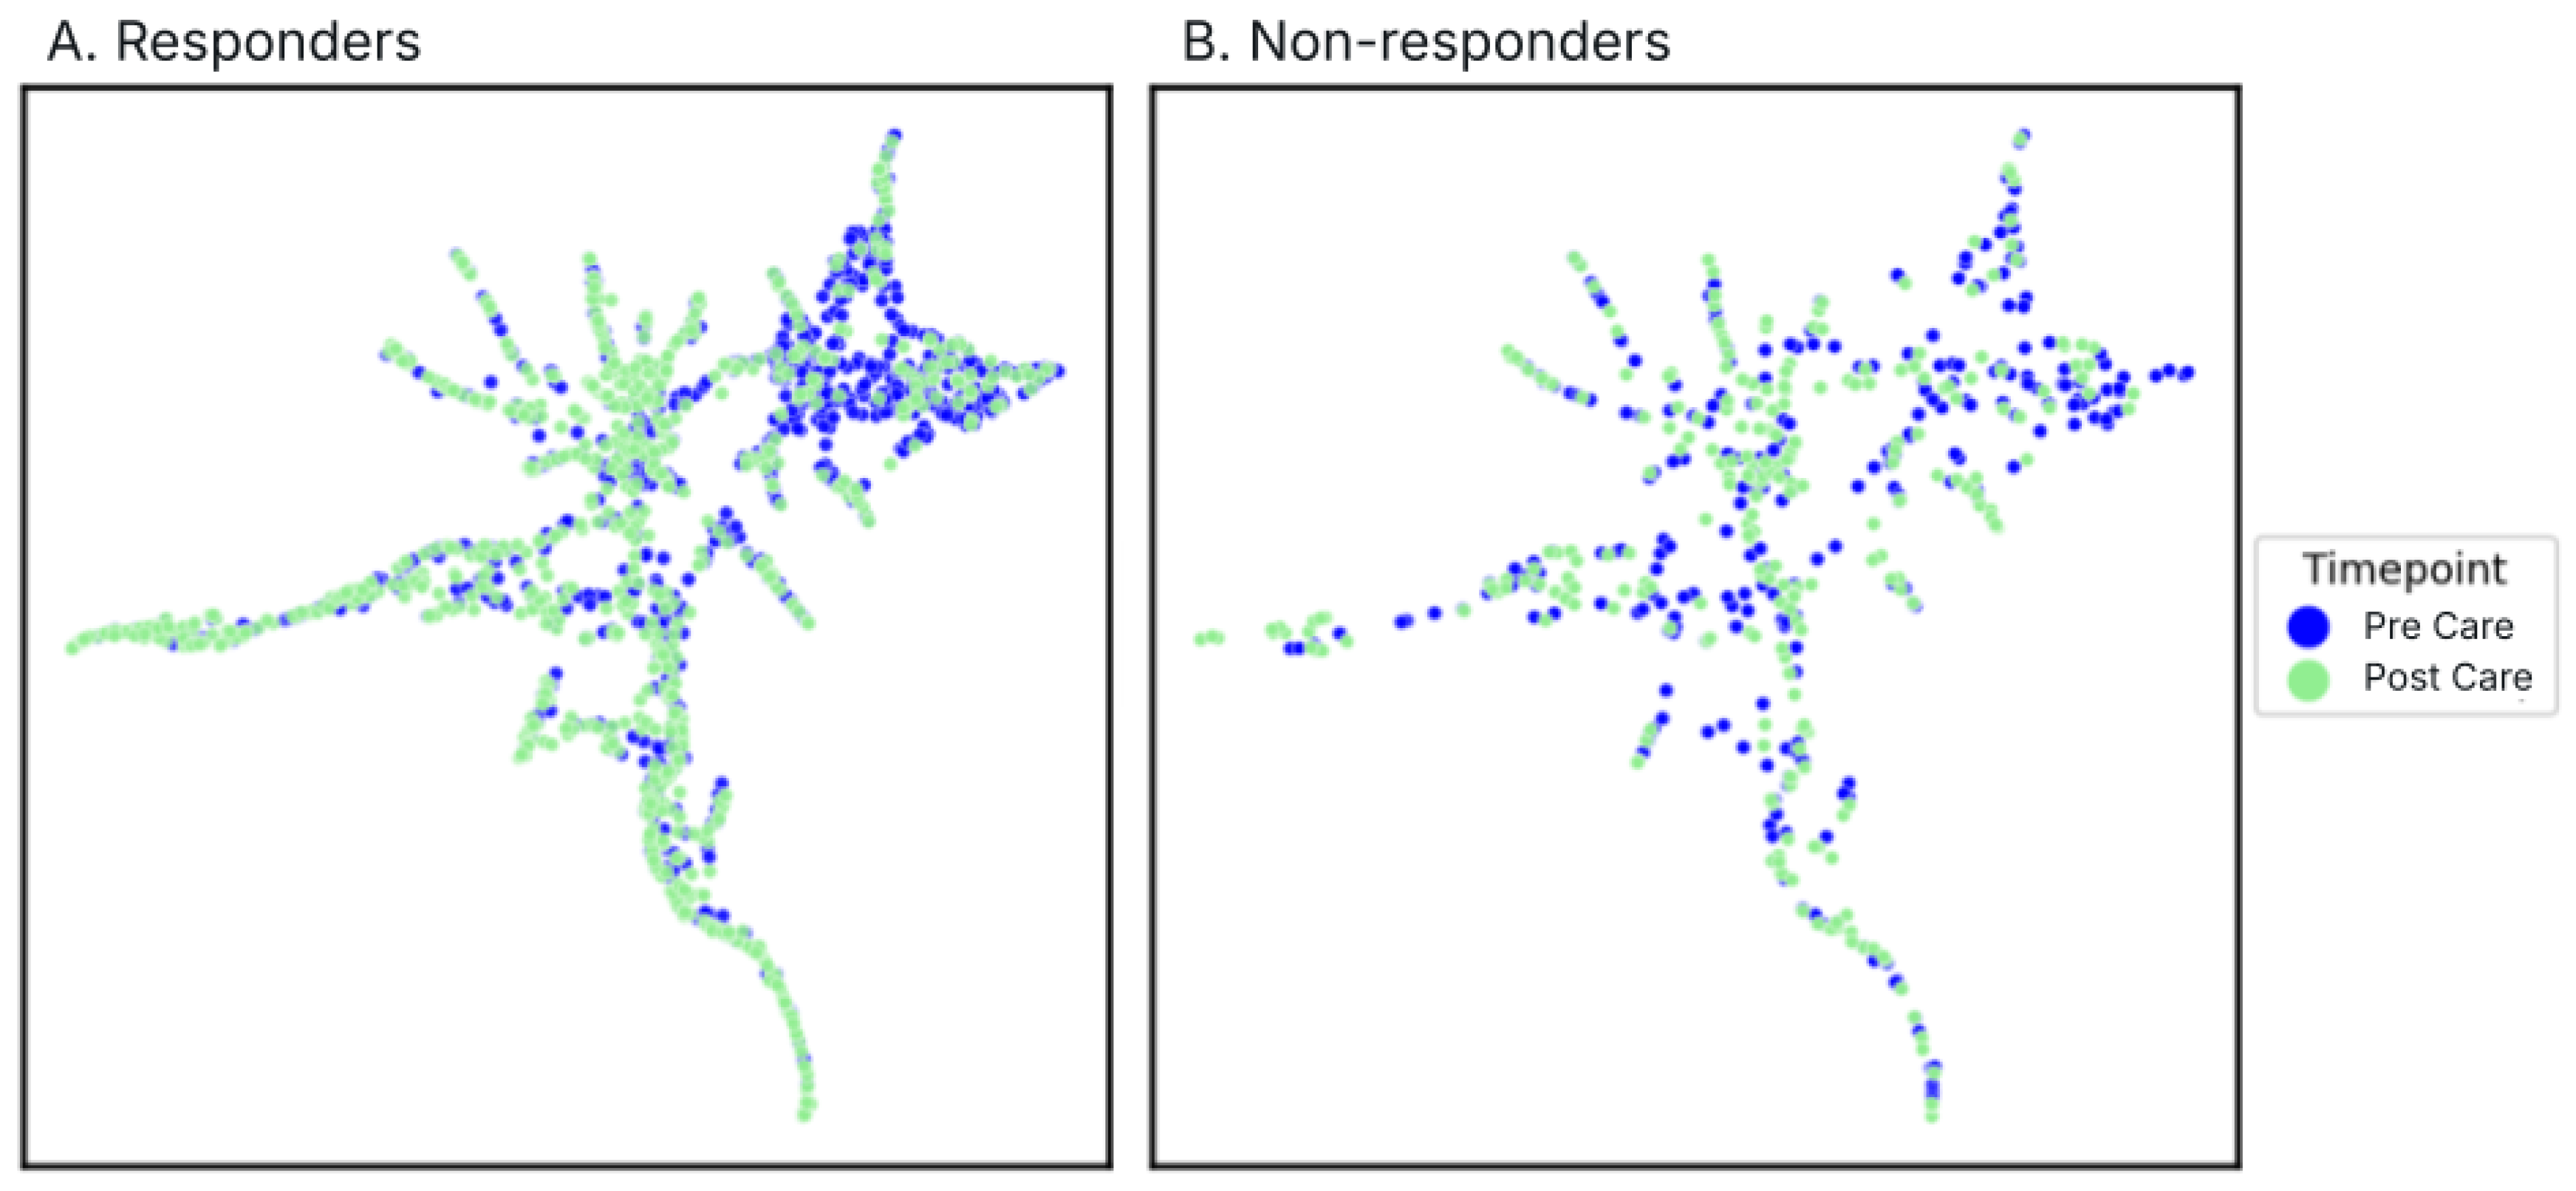

Table 1.
Samples Sizes for Each Response Cohort Overall and Split by Antibiotic Treatment Type.
| N (%) | Metro | Clinda | |
|---|---|---|---|
| Total Overall | 1159 | 535 | 624 |
| Non-Responders | 284 (24.5%) | 141 (26.4%) | 134 (22.9%) |
| Responders | 875 (75.5%) | 394 (73.6%) | 481 (77.1%) |
Table 2.
Demographics.
| Non-Responder (N=284) | Responder (N=875 | p-value | |
|---|---|---|---|
| Age (ave) | 38.1 | 38.9 | 0.42 1 |
| BMI (ave) | 25.4 | 25.2 | 0.77 1 |
| Gender Identity | 0.37 2 | ||
| Woman | 98.9% (281) | 99.5% (871) | |
| Non-binary | 1.1% (3) | 0.3% (3) | |
| Prefer not to say | 0 | 0.1% (1) | |
| Race/Ethnicity | 0.92 3 | ||
| White | 77.1% (219) | 78.6% (688) | |
| Hispanic/Latino | 12.3% (35) | 12.8% (112) | |
| Black or African American | 9.2% (26) | 9.3% (81) | |
| Asian | 5.6% (16) | 3.9% (34) | |
| Middle Eastern | 1.4% (4) | 1.5% (13) | |
| American Indian or Alaskan Native | 1.4% (4) | 1.4% (12) | |
| South Asian | 0.4% (1) | 0.8% (7) | |
| Southeast Asian | 1.1% (3) | 0.5% (4) | |
| Native Hawaiian or Other Pacific Islander | 0.7% (2) | 0.3% (3) | |
| Prefer not to say | 1.8% (5) | 1.8% (16) | |
| Other | 1.1% (3) | 0.8% (7) | |
| Menopause Status | 0.12 2 | ||
| Premenopausal | 81.3% (231) | 77.5% (678) | |
| Menopausal | 5.3% (15) | 9.7% (85) | |
| Perimenopausal | 11.6% (33) | 10.2% (89) | |
| Other menopausal statuses4 | 1.8% (5) | 2.6% (23) | |
| Quality of Life | 7.5 | 7.16 | 0.014 1 |
| Median (Q1, Q3) | 8(6, 10) | 7 (6, 9) |
1 Mann Whitney U test; 2 Fischer’s exact test; 3 Rao Scott Chi-Sq adjustment; 4 This includes individuals who had a hysterectomy, uterine ablation, primary ovarian insufficiency, and chemotherapy.
Table 3.
Temporal Analysis of BV Recurrence Following Initial Treatment.
| Testing Time Frame | Recurred - took an antibiotic for BV* | Did not recur - no antibiotic for BV* | Unknown | Total | Recurrence Rate (excluding unknowns) | Recurrence Rate (including unknowns) |
|---|---|---|---|---|---|---|
| Overall | 321 | 815 | 23 | 1159 | 27.7 | 29.7 |
| <3 Months (<12 weeks) | 33 | 96 | 6 | 135 | 24.4 | 28.8 |
| 3-4 months (12-16 weeks) | 142 | 343 | 9 | 494 | 28.7 | 30.6 |
| 4-5 months (16-20 weeks) | 68 | 183 | 4 | 255 | 26.7 | 28.2 |
| 5-6 months (20-24 weeks) | 19 | 86 | 1 | 106 | 17.9 | 18.9 |
| >6 months (>24 weeks) | 59 | 107 | 3 | 169 | 34.9 | 36.7 |
*Time-stratified recurrence rates of bacterial vaginosis, defined by subsequent antimicrobial prescription (metronidazole or clindamycin) at follow-up evaluation. Data predominantly reflects care episodes within our telemedicine platform, with additional documentation of external treatment when reported. Follow-up intervals are calculated from initial treatment initiation to subsequent assessment
Table 4.
Patient Reported Adverse Events. Specific symptoms are listed in Supplementary Table S5.
Table 4.
Patient Reported Adverse Events. Specific symptoms are listed in Supplementary Table S5.
| No Side Effects | Only 1 Side Effect | More than 1 Side Effect | |
|---|---|---|---|
| Non-responders | 53.2% (151/284) | 32.4% (92/284) | 14.4% (41/284) |
| Clinda | 54.6% (78/143) | 26.6% (38/143) | 18.9% (27/143) |
| Metro | 51.8% (73/141) | 38.3% (54/141) | 9.9% (14/141) |
| Responders | 58.9% (515/875) | 27.7% (242/875) | 13.5% (118/875) |
| Clinda | 57.8% (278/481) | 29.9% (144/481) | 12.3%(59/481) |
| Metro | 60.2% (237/394) | 24.9% (98/394) | 15.0%(59/394) |
Table 5.
Side effects per group.
| Group | Number of Side Effects | Frequency | |
|---|---|---|---|
| Non-Responder Clinda | Less than 2 | 116 | 0.111 |
| 2 or more | 27 | ||
| Non-Responder Metro | Less than 2 | 127 | |
| 2 or more | 14 | ||
| Responder Clinda | Less than 2 | 420 | |
| 2 or more | 61 | ||
| Responder Metro | Less than 2 | 336 | |
| 2 or more | 58 |
1 Fischer’s exact test
Disclaimer/Publisher’s Note: The statements, opinions and data contained in all publications are solely those of the individual author(s) and contributor(s) and not of MDPI and/or the editor(s). MDPI and/or the editor(s) disclaim responsibility for any injury to people or property resulting from any ideas, methods, instructions or products referred to in the content. |
© 2025 by the authors. Licensee MDPI, Basel, Switzerland. This article is an open access article distributed under the terms and conditions of the Creative Commons Attribution (CC BY) license (http://creativecommons.org/licenses/by/4.0/).
Copyright: This open access article is published under a Creative Commons CC BY 4.0 license, which permit the free download, distribution, and reuse, provided that the author and preprint are cited in any reuse.


