1. Introduction
Additive manufacturing, particularly through three-dimensional (3D) printing, has become a promising and economically viable approach for the development of customized electrochemical sensors. This technology enables the geometric integration of multiple components, cost reduction, and rapid prototyping of electrodes and analytical devices, thus promoting the advancement of functional platforms with tailored designs. [
1,
2,
3,
4,
5]
Among the various available techniques, Fused Deposition Modeling (FDM) stands out due to its operational simplicity, wide accessibility, and compatibility with conductive materials based on thermoplastic polymers. [
6,
7,
8,
9] The use of conductive filaments composed of poly(lactic acid) (PLA) incorporated with carbon black (CB) or graphene fillers allows the direct fabrication of functional electrodes whose electrochemical properties can be comparable to those of conventional electrodes, especially when combined with suitable activation and post-processing treatments. [
10,
11,
12,
13,
14]
Despite the great potential of FDM, the electrochemical performance of 3D-printed electrodes strongly depends on the printing parameters and the intrinsic properties of the conductive filament. Variables such as extrusion temperature, layer height and width, printing speed, and the number of deposited layers directly influence the surface morphology, electrical conductivity, and electroactive area of the electrodes. These factors have a direct impact on faradaic current, charge transfer resistance, and reproducibility. Several studies have shown that the precise adjustment of these printing parameters can lead to significant improvements in electrochemical performance, evidenced by higher peak currents and smaller separations between anodic and cathodic peaks. [
15,
16,
17,
18,
19,
20]
Shergill et al. (2023) investigated the effect of instrumental parameters such as extrusion temperature, nozzle diameter, and heated bed temperature on the electrochemical activity of PLA/CB composite electrodes. The authors observed that higher extrusion temperatures (230–240 °C) resulted in improved electrochemical performance, attributed to increased surface roughness and reduced voids between deposited particles. Furthermore, they found that nozzle diameter and bed temperature did not exert a significant influence on electrochemical activity, highlighting extrusion temperature as a critical parameter for controlling the quality of printed electrodes. [
18]
Complementarily, Rocha et al. (2022) systematically analyzed the influence of printing orientation, layer thickness, number of perimeters, and printing speed on the electrochemical behavior of sensors fabricated with PLA/CB filament. Using cyclic voltammetry and electrochemical impedance spectroscopy with the [Ru(NH₃)₆]²⁺/³⁺ (10 mmol L⁻¹) redox probe, the authors demonstrated that electrodes printed in the vertical orientation, with a layer thickness of 0.05 mm, a printing speed of 30 mm s⁻¹, and two layers, exhibited superior electrochemical performance, reflected by higher faradaic peak currents and smaller peak separations. These results reinforce that rigorous control of printing parameters is essential for obtaining 3D electrochemical devices with enhanced and reproducible responses. [
19]
Moreover, although most studies focus on electrochemical properties, related works have shown that printing parameters also influence the mechanical and structural properties of composite materials. Valvez et al. (2022) applied multivariate optimization methods to maximize the mechanical properties of polyethylene terephthalate glycol (PETG) composites reinforced with carbon fibers (PETG+CF) and aramid fibers (PETG+KF). The authors found that specific combinations of extrusion temperature, printing speed, layer height, and infill density are critical for the mechanical performance of printed parts, corroborating the importance of precise parameter definition in additive manufacturing processes. [
20]
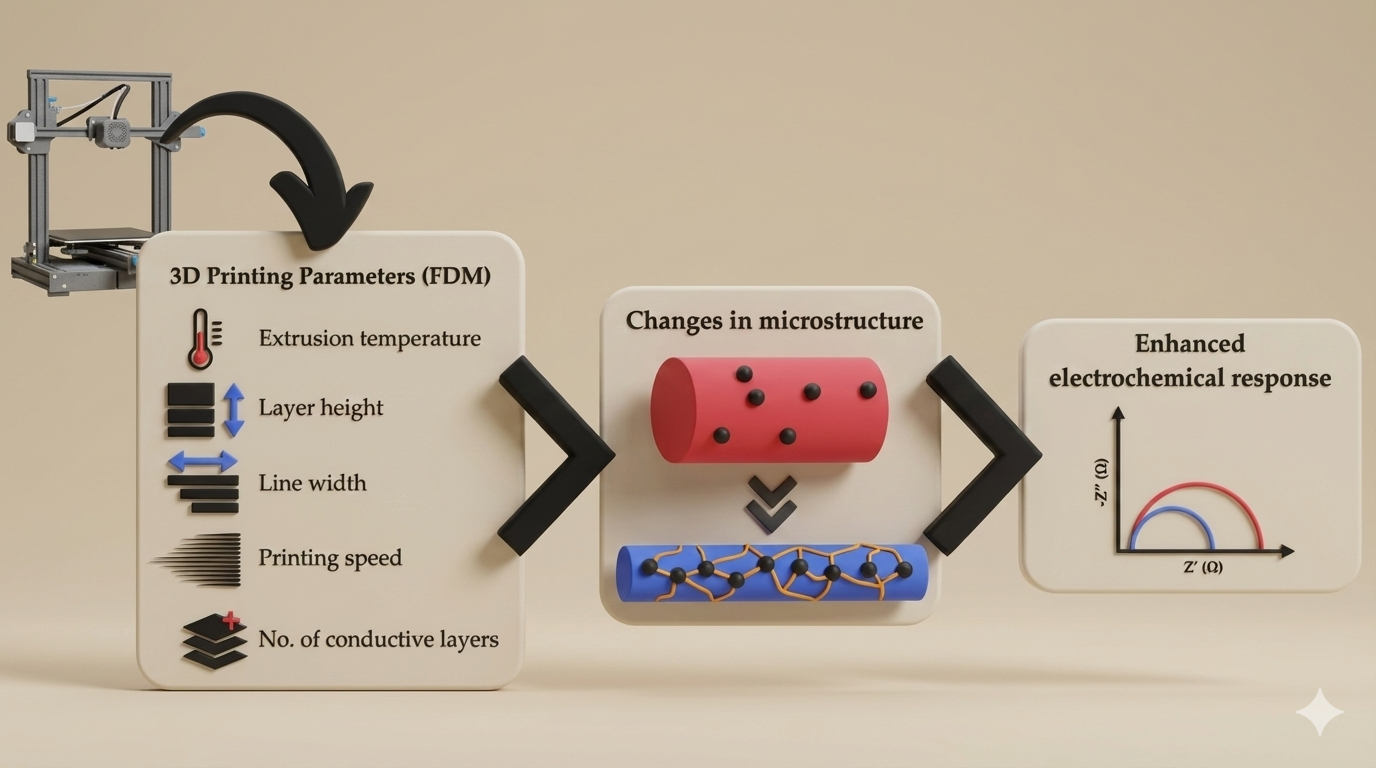
In this context, the present study systematically investigated the influence of key printing parameters, including extrusion temperature, layer height and width, printing speed, and number of conductive layers, on the electrochemical performance of electrodes fabricated via FDM using a commercially available PLA/CB conductive filament. The principal contribution of this study is the establishment of an optimized set of FDM printing parameters that substantially enhances the analytical performance of 3D-printed electrochemical sensors. The proposed approach elucidates the mechanisms through which printing conditions affect electrode morphology, conductivity, and electrochemical behavior, thereby providing reproducible guidelines for the fabrication of high-performance sensing devices. Collectively, these findings advance the rational design and manufacturing of additively produced electrochemical sensors and broaden their applicability in chemical and bioanalytical determinations.
2. Materials and Methods
2.1. Materials and Reagents
Potassium chloride was purchased from Êxodo Científica (Brazil); sodium hydroxide, potassium ferrocyanide (K₄[Fe(CN)₆]), and potassium ferricyanide (K₃[Fe(CN)₆]) were obtained from Dinâmica Química (Brazil). The conductive PLA/Carbon Black (PLA/CB) filament was acquired from Protopasta® (USA), and the poly(lactic acid) (PLA) filament was purchased from 3D Lab (Brazil). Waterproof sandpapers with a 320-grit size were obtained from the local market. All chemical reagents used were of analytical grade. All solutions were prepared using water purified in a Milli-Q® system.
2.2. Design Development for 3D Printing of the Sensor
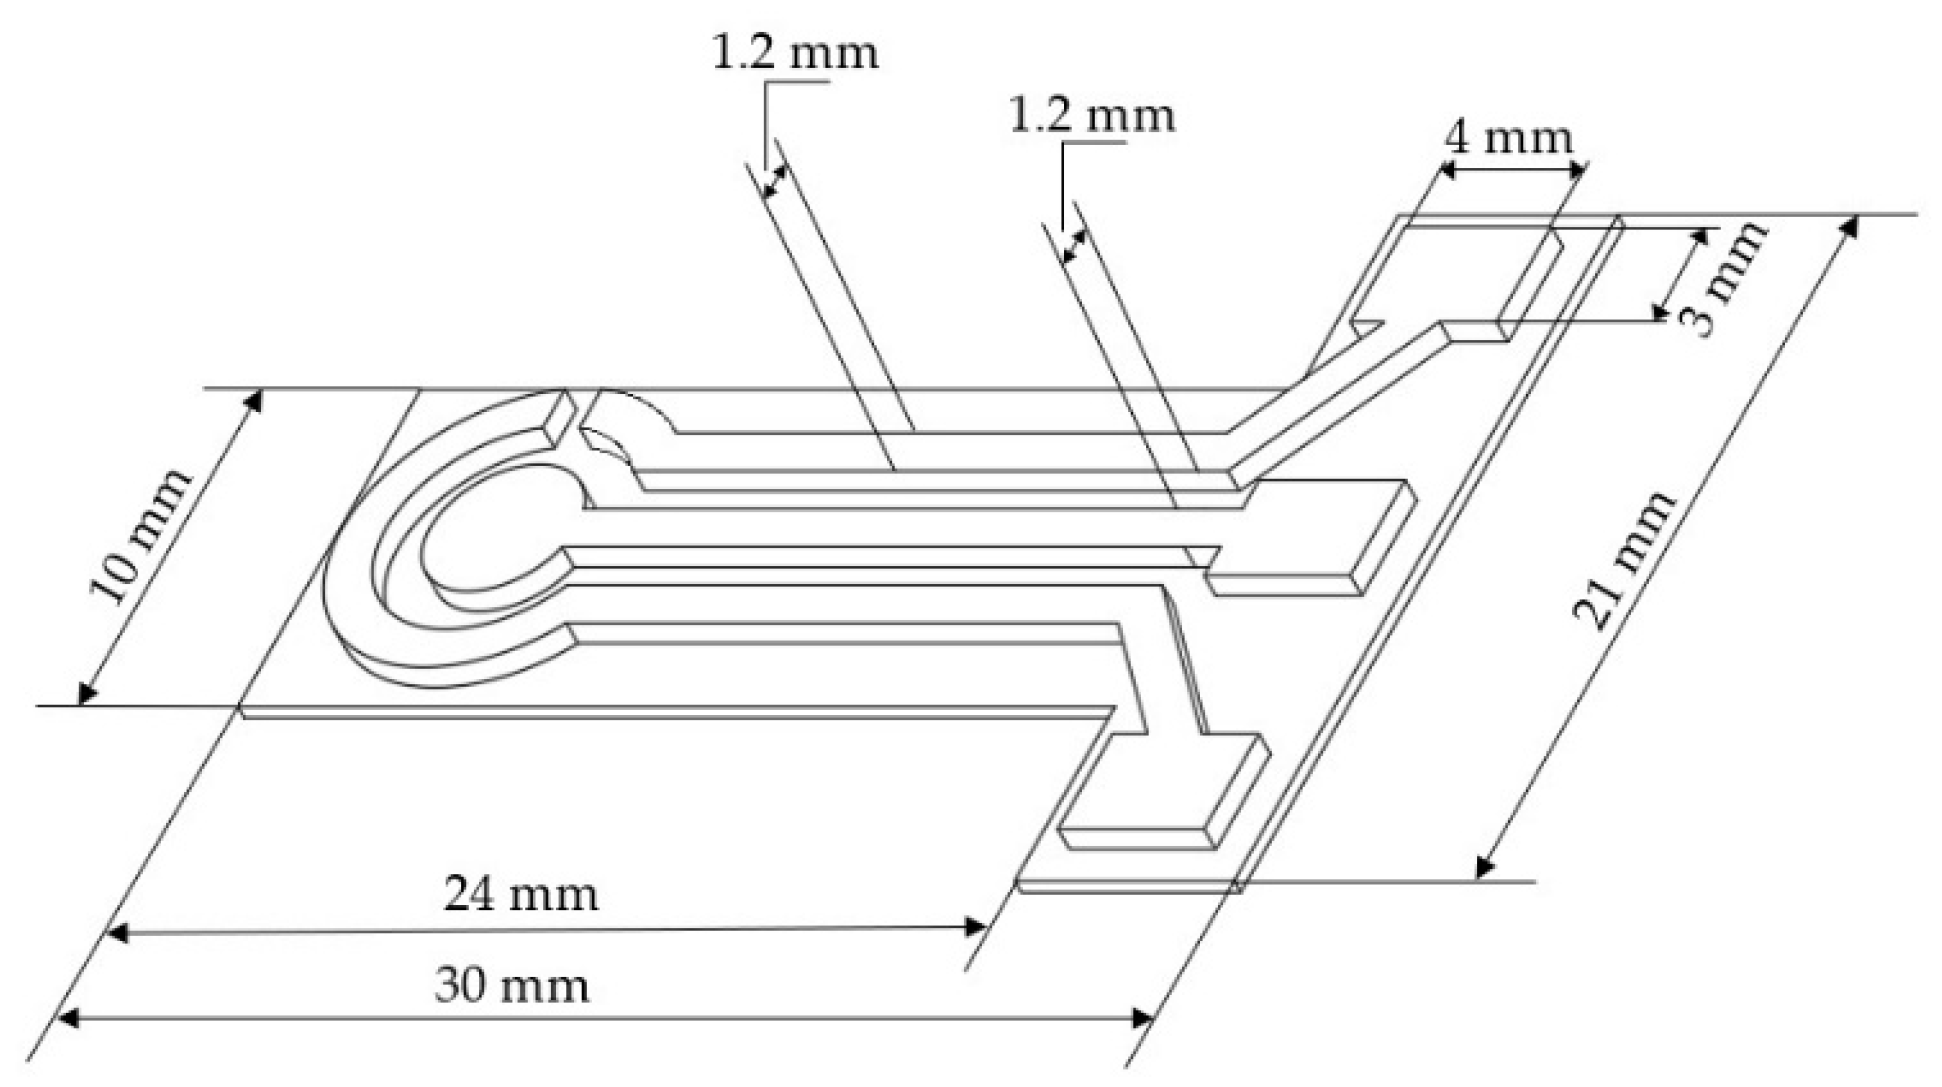
The electrochemical sensor was designed using Autodesk Fusion 360 software. The overall geometry was inspired by a commercial on-drop electrochemical platform, maintaining a circular working electrode with a 2 mm radius, surrounded by a semi-circular counter electrode and a linear path for the quasi-reference electrode. The lower portion of the layout was modified to include three square terminals measuring 3 × 4 mm, allowing secure connection with alligator clips and ensuring stable electrical contact during measurements (
Figure 1).
The device was fabricated using a two-stage printing strategy on a Creality Ender 3 V2 single-extruder printer. In the first stage, a thin PLA base was printed solely to serve as a substrate for the conductive elements. The non-conductive substrate layer, with a height of 0.2 mm, ensured mechanical stability. To maintain electrical isolation, intentional gaps of 1.2 mm were left between the printed conductive regions, which also have a width of 1.2 mm.
The exact height at which the conductive structures would be printed, as well as the pause command for filament change, were defined in the Ultimaker Cura slicing software. After the base was completed, the printer paused automatically, allowing manual replacement of the PLA filament with the conductive PLA/CB filament. At this point, nozzle cleaning was performed to ensure complete removal of the non-conductive filament, preventing heterogeneous dispersion of residual material with the conductive filament. Printing then resumed, depositing the working, counter, and quasi-reference electrodes directly onto the pre-printed PLA base with precise alignment.
This hybrid dual-material approach enabled the rapid fabrication of a compact and tough sensor, integrating all electrodes into a single printed platform. A key aspect of this process is that the entire device was produced using a single-extruder printer without multimaterial capabilities, demonstrating that functional electrodes can be fabricated using simpler and low-cost equipment. The digital workflow, combining CAD design, precise slicing control, and manual filament switching, provided reproducibility and design flexibility for customized electrochemical devices, even under accessible fabrication conditions.
2.3. Development of a 3D-Printed Electrochemical Sensor
Initially, a PLA filament was used to print the electrode support. The support was printed using a single PLA layer, with a nozzle temperature of 215 °C, printing speed of 20 mm s⁻¹, extrusion width of 0.2 mm, and layer height of 0.2 mm. To produce the electrodes (auxiliary, working, and quasi-reference), a PLA/CB (carbon black/poly(lactic acid)) filament from Protopasta® was used. For these printing parameters, four PLA/CB layers were printed with a nozzle temperature of 220 °C, printing speed of 20 mm s⁻¹, extrusion width of 0.2 mm, and layer height of 0.16 mm. The printing of both the base and the electrodes was performed with a 0.4 mm nozzle and a bed temperature of 60 °C.
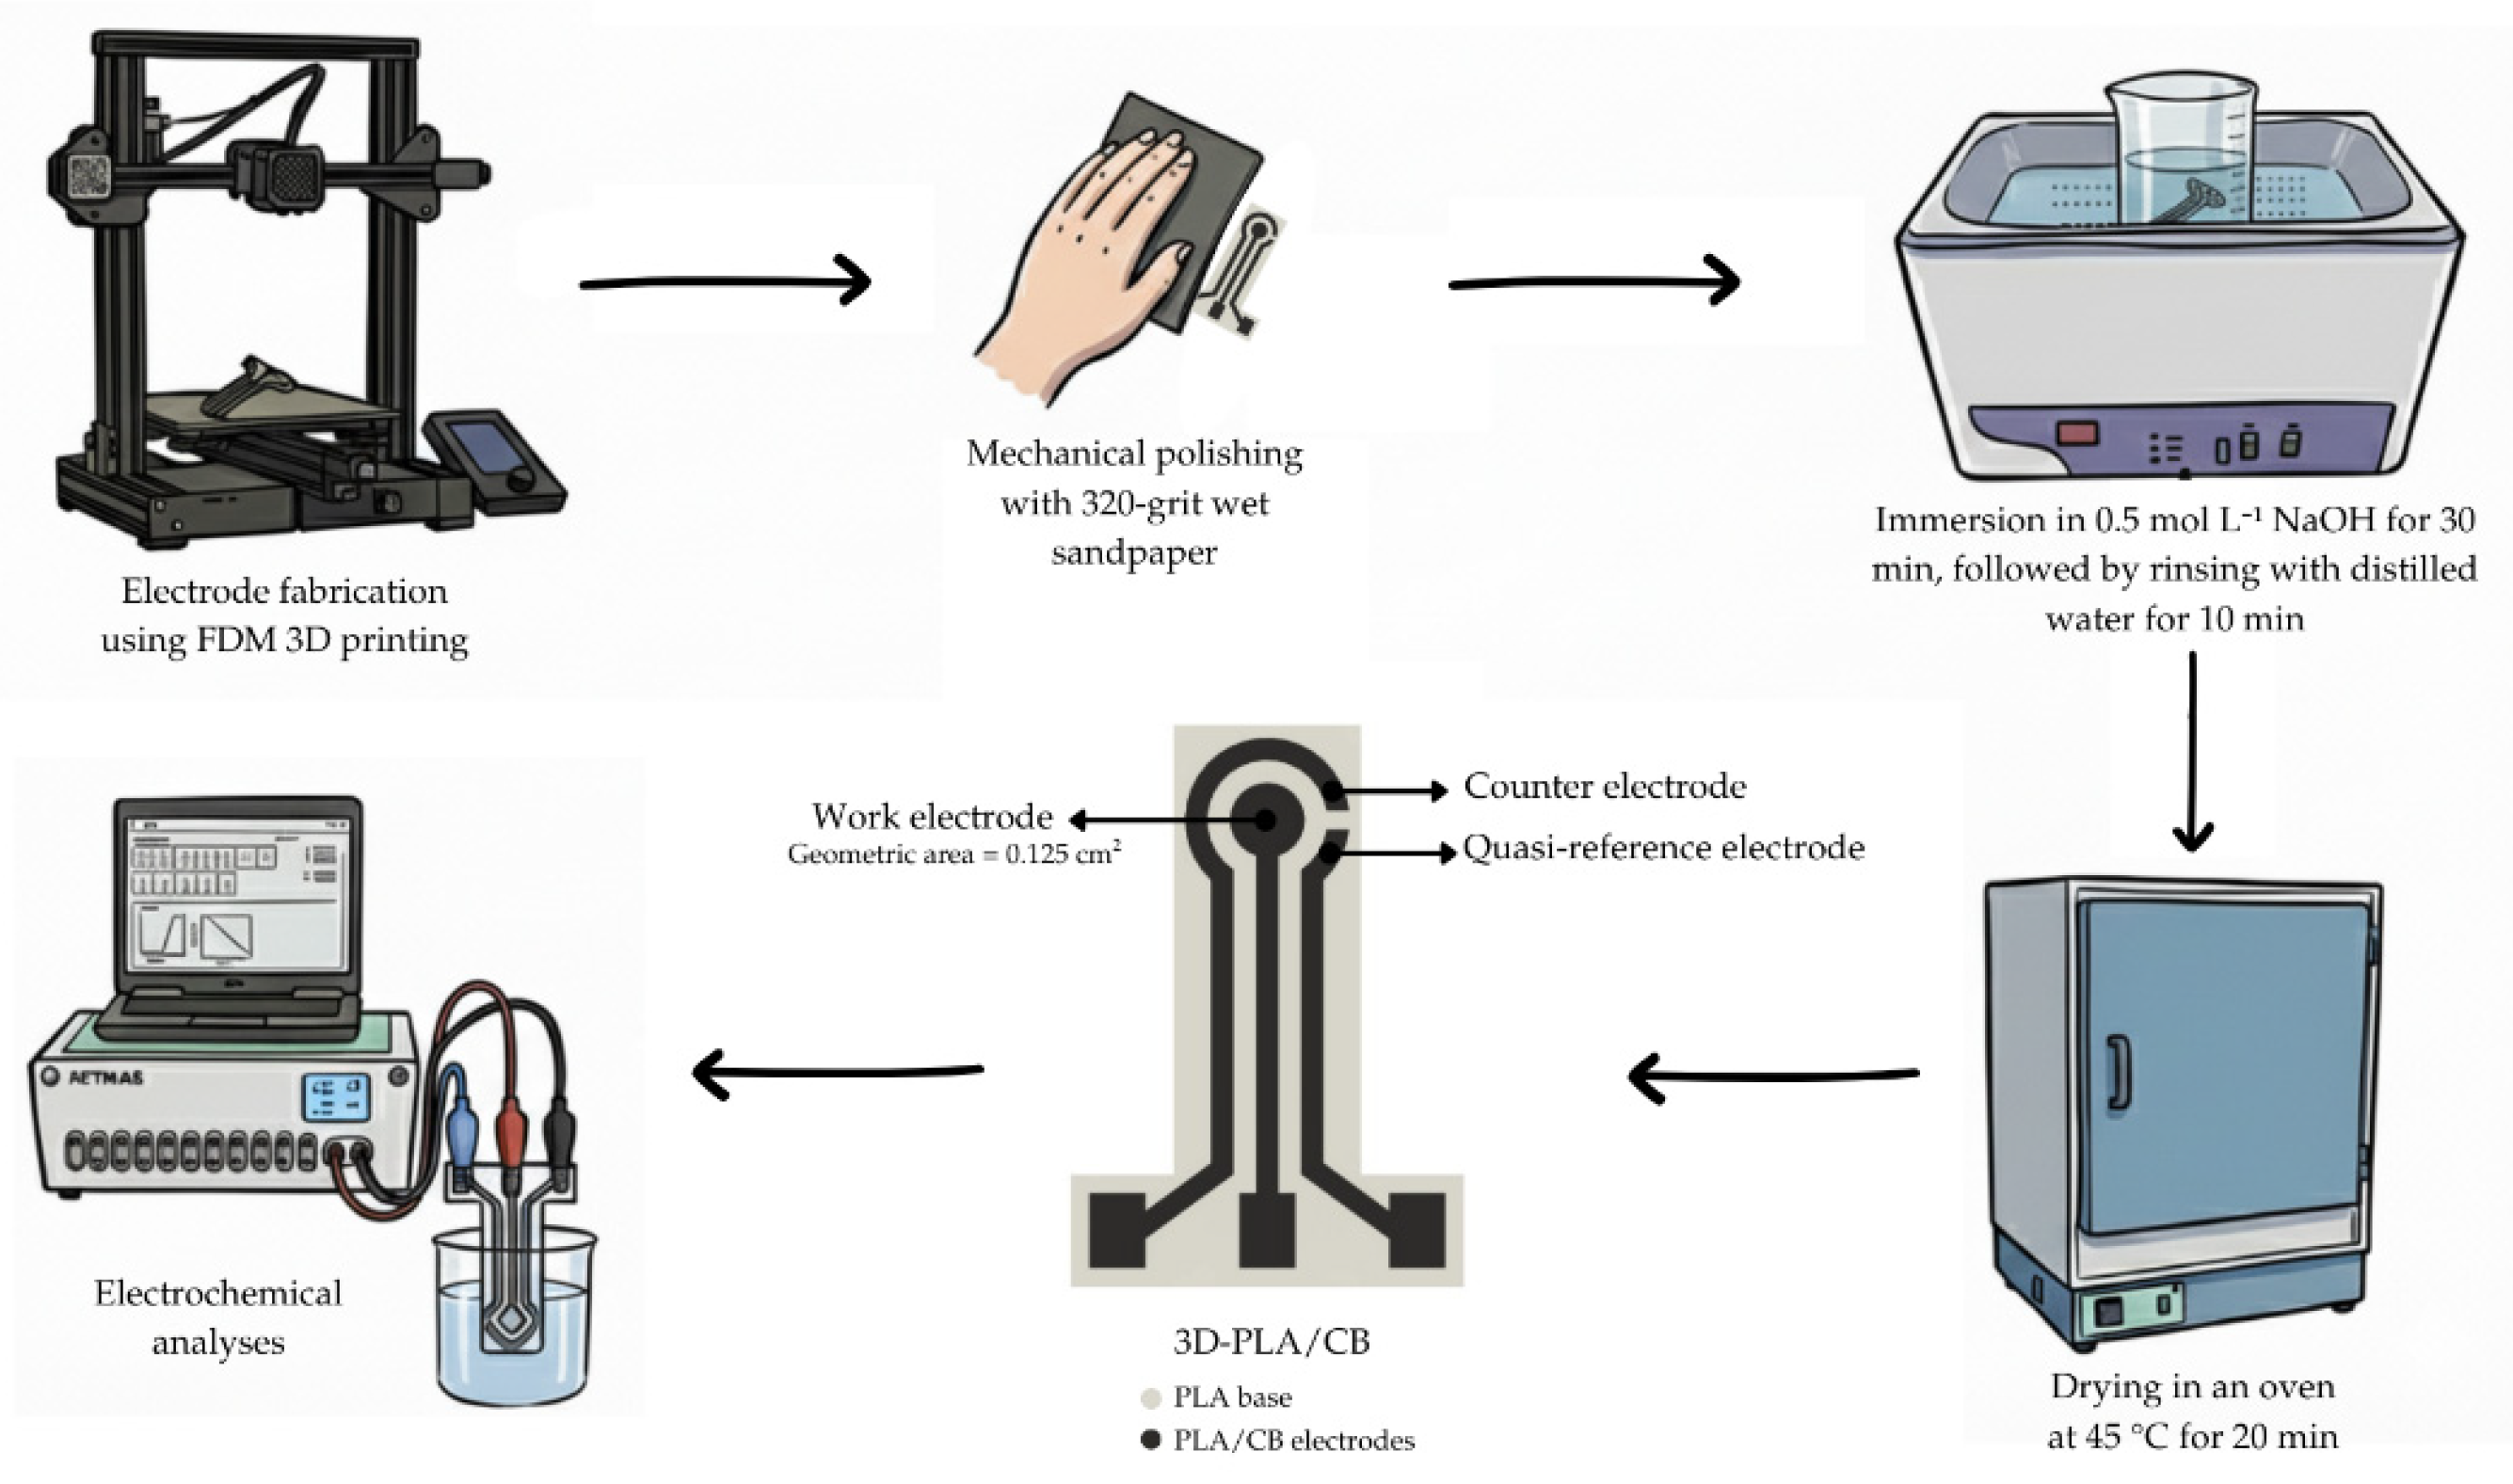
Before conducting experimental studies, the 3D-printed sensors were polished and treated with NaOH to remove excess polymeric material and to enhance their electrochemical performance. The post-printing treatment conditions were performed as described by Rodrigues and collaborators. [
16] Initially, the sensors were sanded with 320-grit sandpaper to remove the residual filament from the printing process. The samples were then immersed in a 0.5 mol L⁻¹ NaOH solution for 30 min under ultrasonic agitation. Subsequently, the sensors were rinsed with distilled water for 10 min in an ultrasonic bath and dried in an oven at 45 °C for 20 min. After this treatment, the sensors were ready for electrochemical analysis.
Figure 2 presents a schematic representation of the fabrication of the 3D-printed electrodes.
To investigate the impact of nozzle temperature, a range between 210 °C and 240 °C was evaluated. The working temperature range selected for PLA/CB printing followed the manufacturer’s recommendations. The ranges for extrusion width (0.2–0.6 mm), layer height (0.12–0.24 mm), and printing speed (20–60 mm s⁻¹) were chosen according to the operational specifications of the printer used. The number of layers was evaluated between two and five. At each optimization step, the parameter under investigation was varied while all others were kept constant.
2.4. Scanning Electron Microscopy (SEM)
The surfaces of the 3D printed electrodes were characterized using scanning electron microscopy (SEM). SEM images were obtained using a Hitachi TM-3000 microscope. The samples were mounted on a sample holder using double-sided conductive carbon tapes. Images were acquired at an accelerating voltage of 15 kV.
2.5. Electrochemical Characterization of 3D-Printed Electrodes
All electrochemical measurements were performed using a Metrohm Autolab PGSTAT204 potentiostat/galvanostat controlled by NOVA 2.1.8 software. Electrochemical Impedance Spectroscopy (EIS) was employed to determine the charge transfer resistance (R
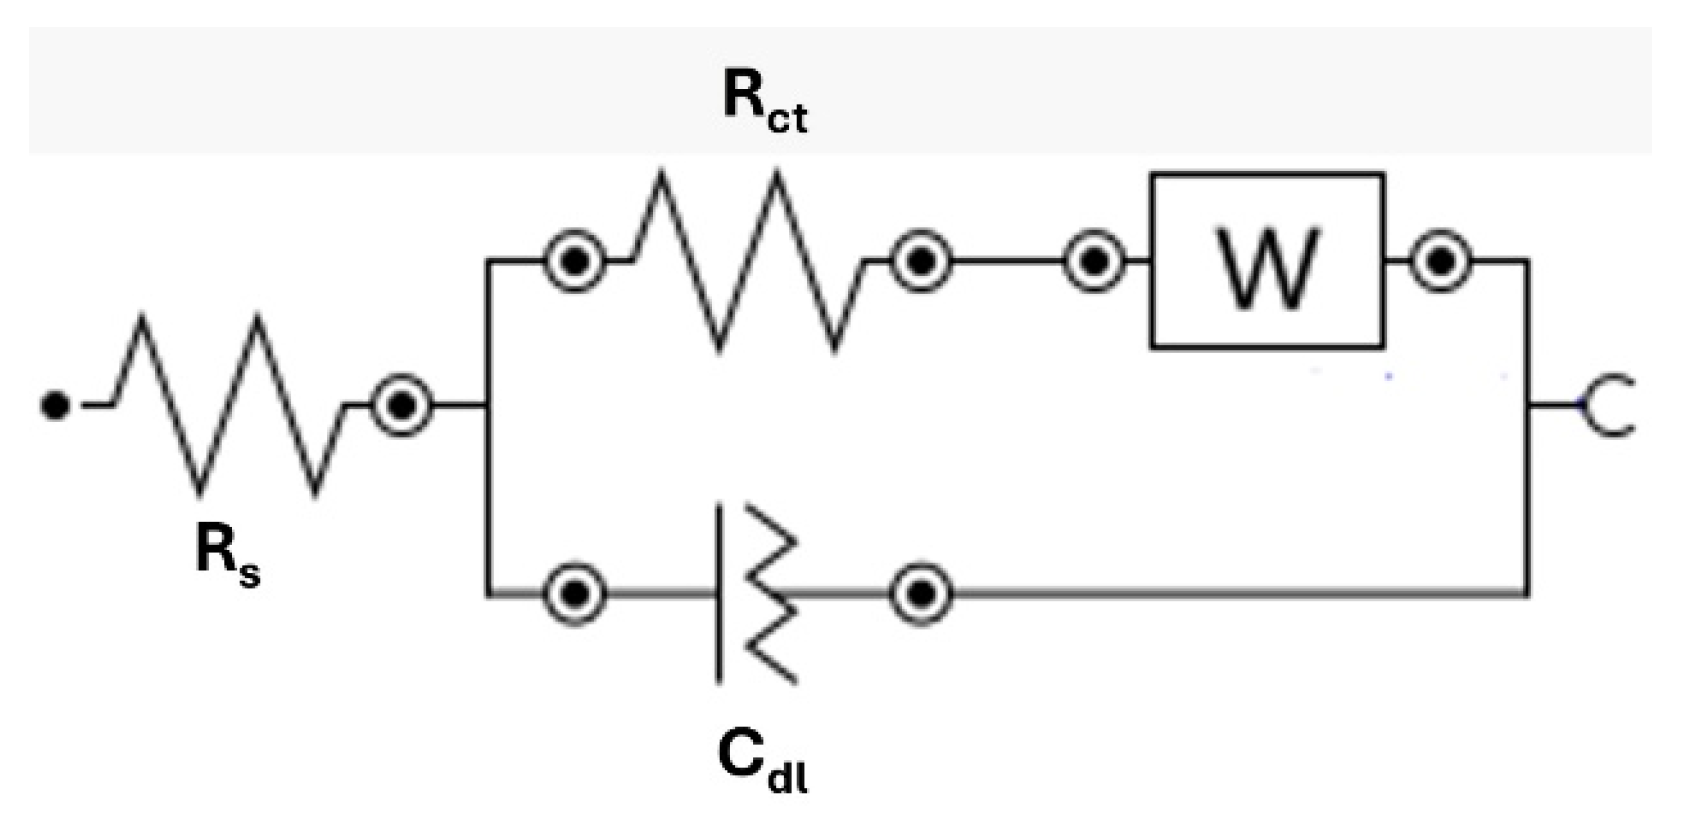
ct). The measurements were conducted in an electrochemical cell containing 10 mL of 0.1 mol L⁻¹ KCl with 2.5 mmol L⁻¹ equimolar [Fe(CN)₆]³⁻/⁴⁻, using a frequency range from 10⁵ to 10⁻² Hz and an amplitude of 0.01 V under open-circuit potential (OCP) conditions at 0 V. To interpret the impedance spectra, an equivalent electrical circuit was used to quantify the relevant electrochemical parameters and enable comparison across the different experimental conditions. The circuit adopted in this study, shown in
Figure 3, is composed of the following elements:
Rs (series resistance): ohmic resistance of the electrolyte and electrical connections in series;
Rct (charge transfer resistance): ohmic resistance associated with the redox reaction on the electrode surface, in parallel with Cdl;
Cdl (double-layer capacitance): represents the capacitive behavior of the ion layer ad-jacent to the electrode;
W (Warburg impedance): Impedance generated by the diffusive characteristics of the system.
To evaluate the reproducibility of the proposed sensor, cyclic voltammetry (CV) measurements were performed. The experiments were carried out in an electrochemical cell containing 10 mL of 0.1 mol L⁻¹ KCl with 2.5 mmol L⁻¹ equimolar [Fe(CN)₆]³⁻/⁴⁻, using a scan rate of 30 mV s⁻¹. These analyses were conducted with six independent replicates (n = 6).
CV measurements were also performed for dopamine evaluation, using an electrochemical cell containing 10.0 mL of 0.1 mol L⁻¹ phosphate buffer (pH 7.0) with 10.0 µmol L⁻¹ dopamine and a scan rate of 50 mV s⁻¹. These analyses were carried out in triplicate (n = 3).
2.6. Analytical Curve
After optimizing the printing parameters, an analytical curve was constructed for the determination of dopamine by adding different known concentrations (0.5–10 µM). All analyses were performed in triplicate, and the performance of the 3D-printed electrode in detecting dopamine was evaluated based on analytical parameters including the limit of detection (LOD), limit of quantification (LOQ), linearity, and sensitivity obtained from the calibration curve. Square Wave Voltammetry (SWV) was employed using an electrochemical cell containing 10.0 mL of 0.1 mol L⁻¹ phosphate buffer (pH 7.0), with operational parameters set as a step potential of 1 mV, a modulation amplitude of 100 mV, and a frequency of 10 Hz.
3. Results and Discussion
The parameters of the 3D printing process have a direct impact on the electrochemical performance of the electrodes, due to their correlation with the microstructure and conductivity of the printed structure. Therefore, in this study, the effects of different 3D printing parameters on the electrochemical behavior of PLA/CB electrodes were evaluated, particularly extrusion temperature, layer height, line width, printing speed, and the number of conductive layers.
Initially, the default parameters of the Ultimaker Cura slicing software were adopted as a starting point. The following conditions were fixed: a layer height of 0.2 mm, a layer thickness of 0.4 mm, a printing speed of 60 mm s⁻¹, and three conductive layers. Extrusion temperature was selected as the first parameter to be investigated and was evaluated in the range of 210 to 240 °C, according to the specifications provided by the manufacturer of the conductive PLA/CB filament. To evaluate this and the other parameters, Electrochemical Impedance Spectroscopy (EIS) measurements were performed.
The results demonstrate that the extrusion temperature exerts a significant influence on the charge transfer resistance (R
ct), directly affecting the efficiency of the electron-transfer process between the electrode and the electrolyte solution. A summary of the R
ct values obtained at each temperature is presented in
Table 1.
As shown in
Table 1, increasing the extrusion temperature from 210 °C to 220 °C led to a substantial decrease in R
ct values, indicating an improvement in the performance of the printed electrode. However, when the temperature was further increased to 230 °C and 240 °C, R
ct rose again, suggesting a decline in electrochemical efficiency. These variations highlight the strong influence of extrusion temperature on the organization of the material during printing.
To better interpret these results, one can refer to the percolation model, commonly used to describe conductivity in thermoplastic polymers. In this model, electrical transport occurs when conductive particles form a continuous network capable of allowing electron flow. Consequently, small variations in particle distribution, compaction, or interparticle contact can shift the system closer to or farther from the percolation threshold, significantly affecting electrochemical parameters such as Rct. Such microstructural variations are especially important in FDM-printed materials, where printing conditions play a decisive role in determining how the conductive phase is organized within the polymer matrix.
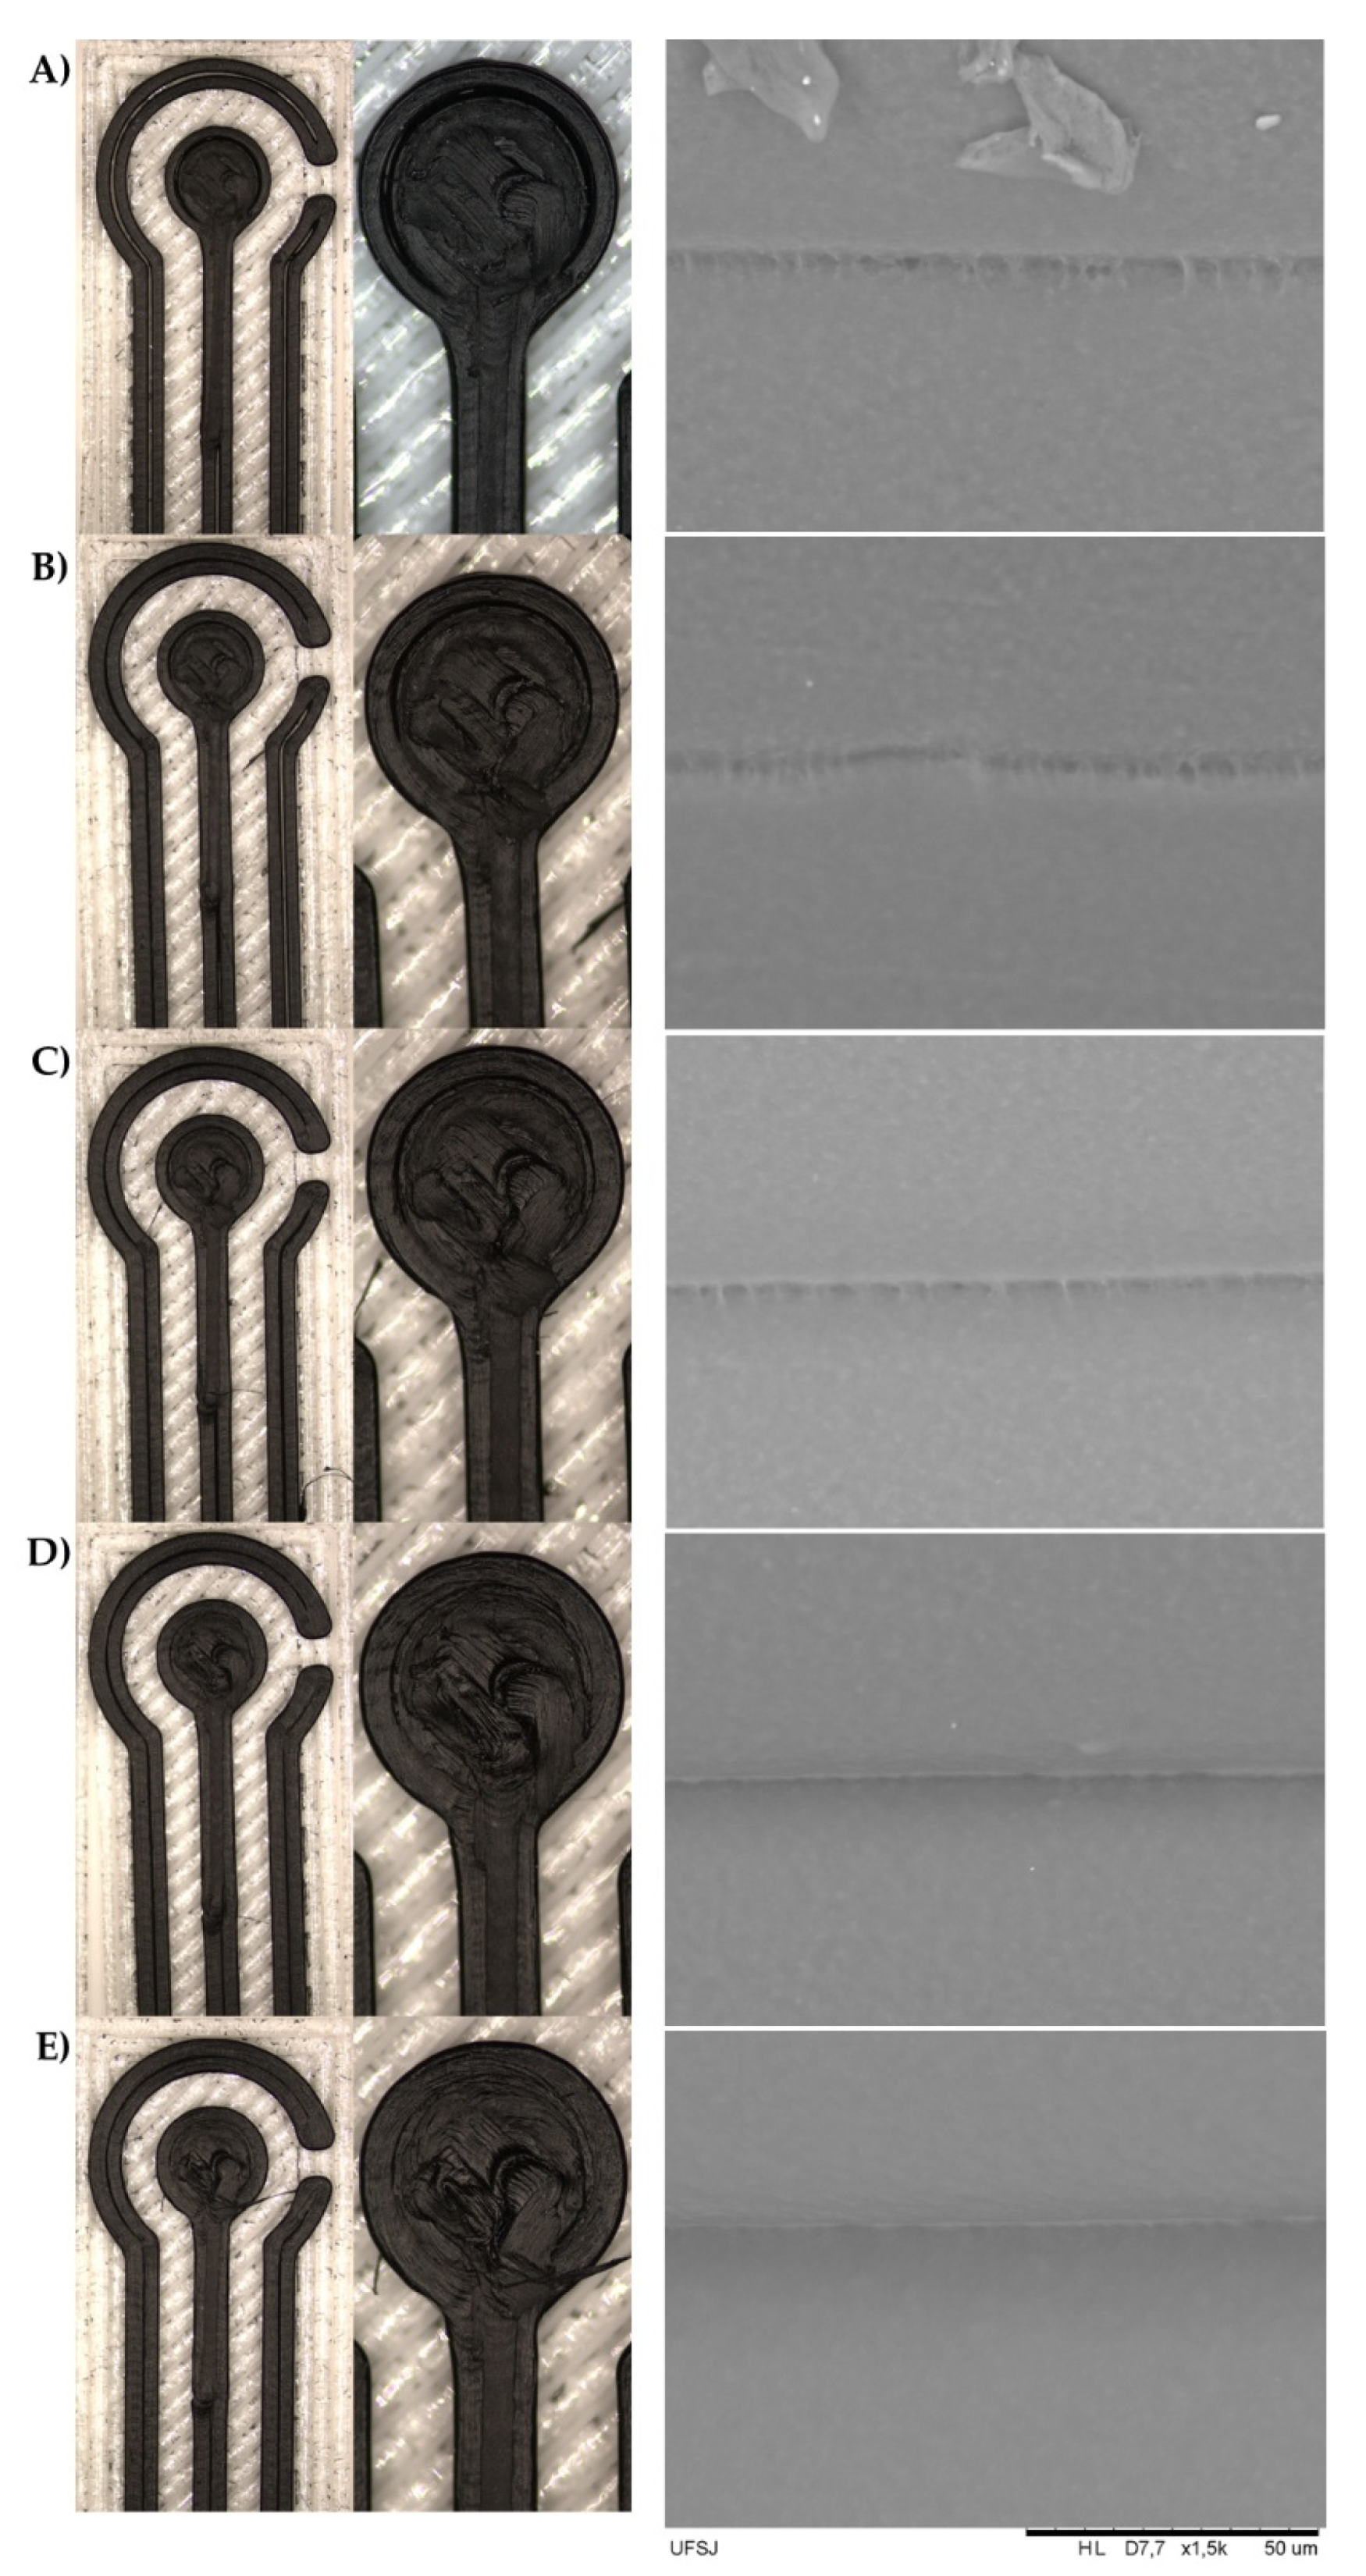
At lower temperatures (≤ 215 °C), incomplete extrusion (under-extrusion) occurs, generating voids and printing defects, as observed in
Figure 4.A and 4.B. These defects interrupt the continuity of conductive pathways and increase electrode resistance. At higher temperatures (≥ 230 °C), the filament becomes overly fluid, promoting over-extrusion and uncontrolled deposition (
Figure 4.D and 4.E). Under these conditions, the excess PLA accumulates around the carbon particles, disrupting the conductive network and leading to higher R
ct values [
21,
22]. Thus, both excessively low and excessively high temperatures negatively impact the structural organization required for efficient electron transport.
SEM analysis further corroborates these effects by providing direct morphological evidence of how temperature influences interlayer adhesion. At 210 and 215 °C, lateral-view micrographs reveal microvoids and regions indicative of incomplete polymer fusio, typical features of under-extrusion. At 220 °C, however, the layers appear more cohesive, with subtle interfacial transitions and no visible delamination, suggesting effective thermal fusion and a more uniform, well-defined deposition process. This morphology is consistent with the lowest Rct value obtained at this temperature, reinforcing the link between structural integrity and electrochemical behavior.
At temperatures above 220 °C (230 and 240 °C), SEM images show deformation of the printed layers, material accumulation, and reduced dimensional control. Although increased melt fluidity could theoretically favor improved layer merging, the observed distortion of extruded lines and excessive polymer deposition indicate the opposite effect. This disproportionate amount of PLA disrupts the continuity of conductive pathways, explaining the higher Rct values obtained in this temperature range.
In summary, the morphological and electrochemical findings demonstrate that 220 °C provides the optimal balance between material fluidity, interlayer adhesion, and conductive particle distribution, resulting in superior electrochemical performance.
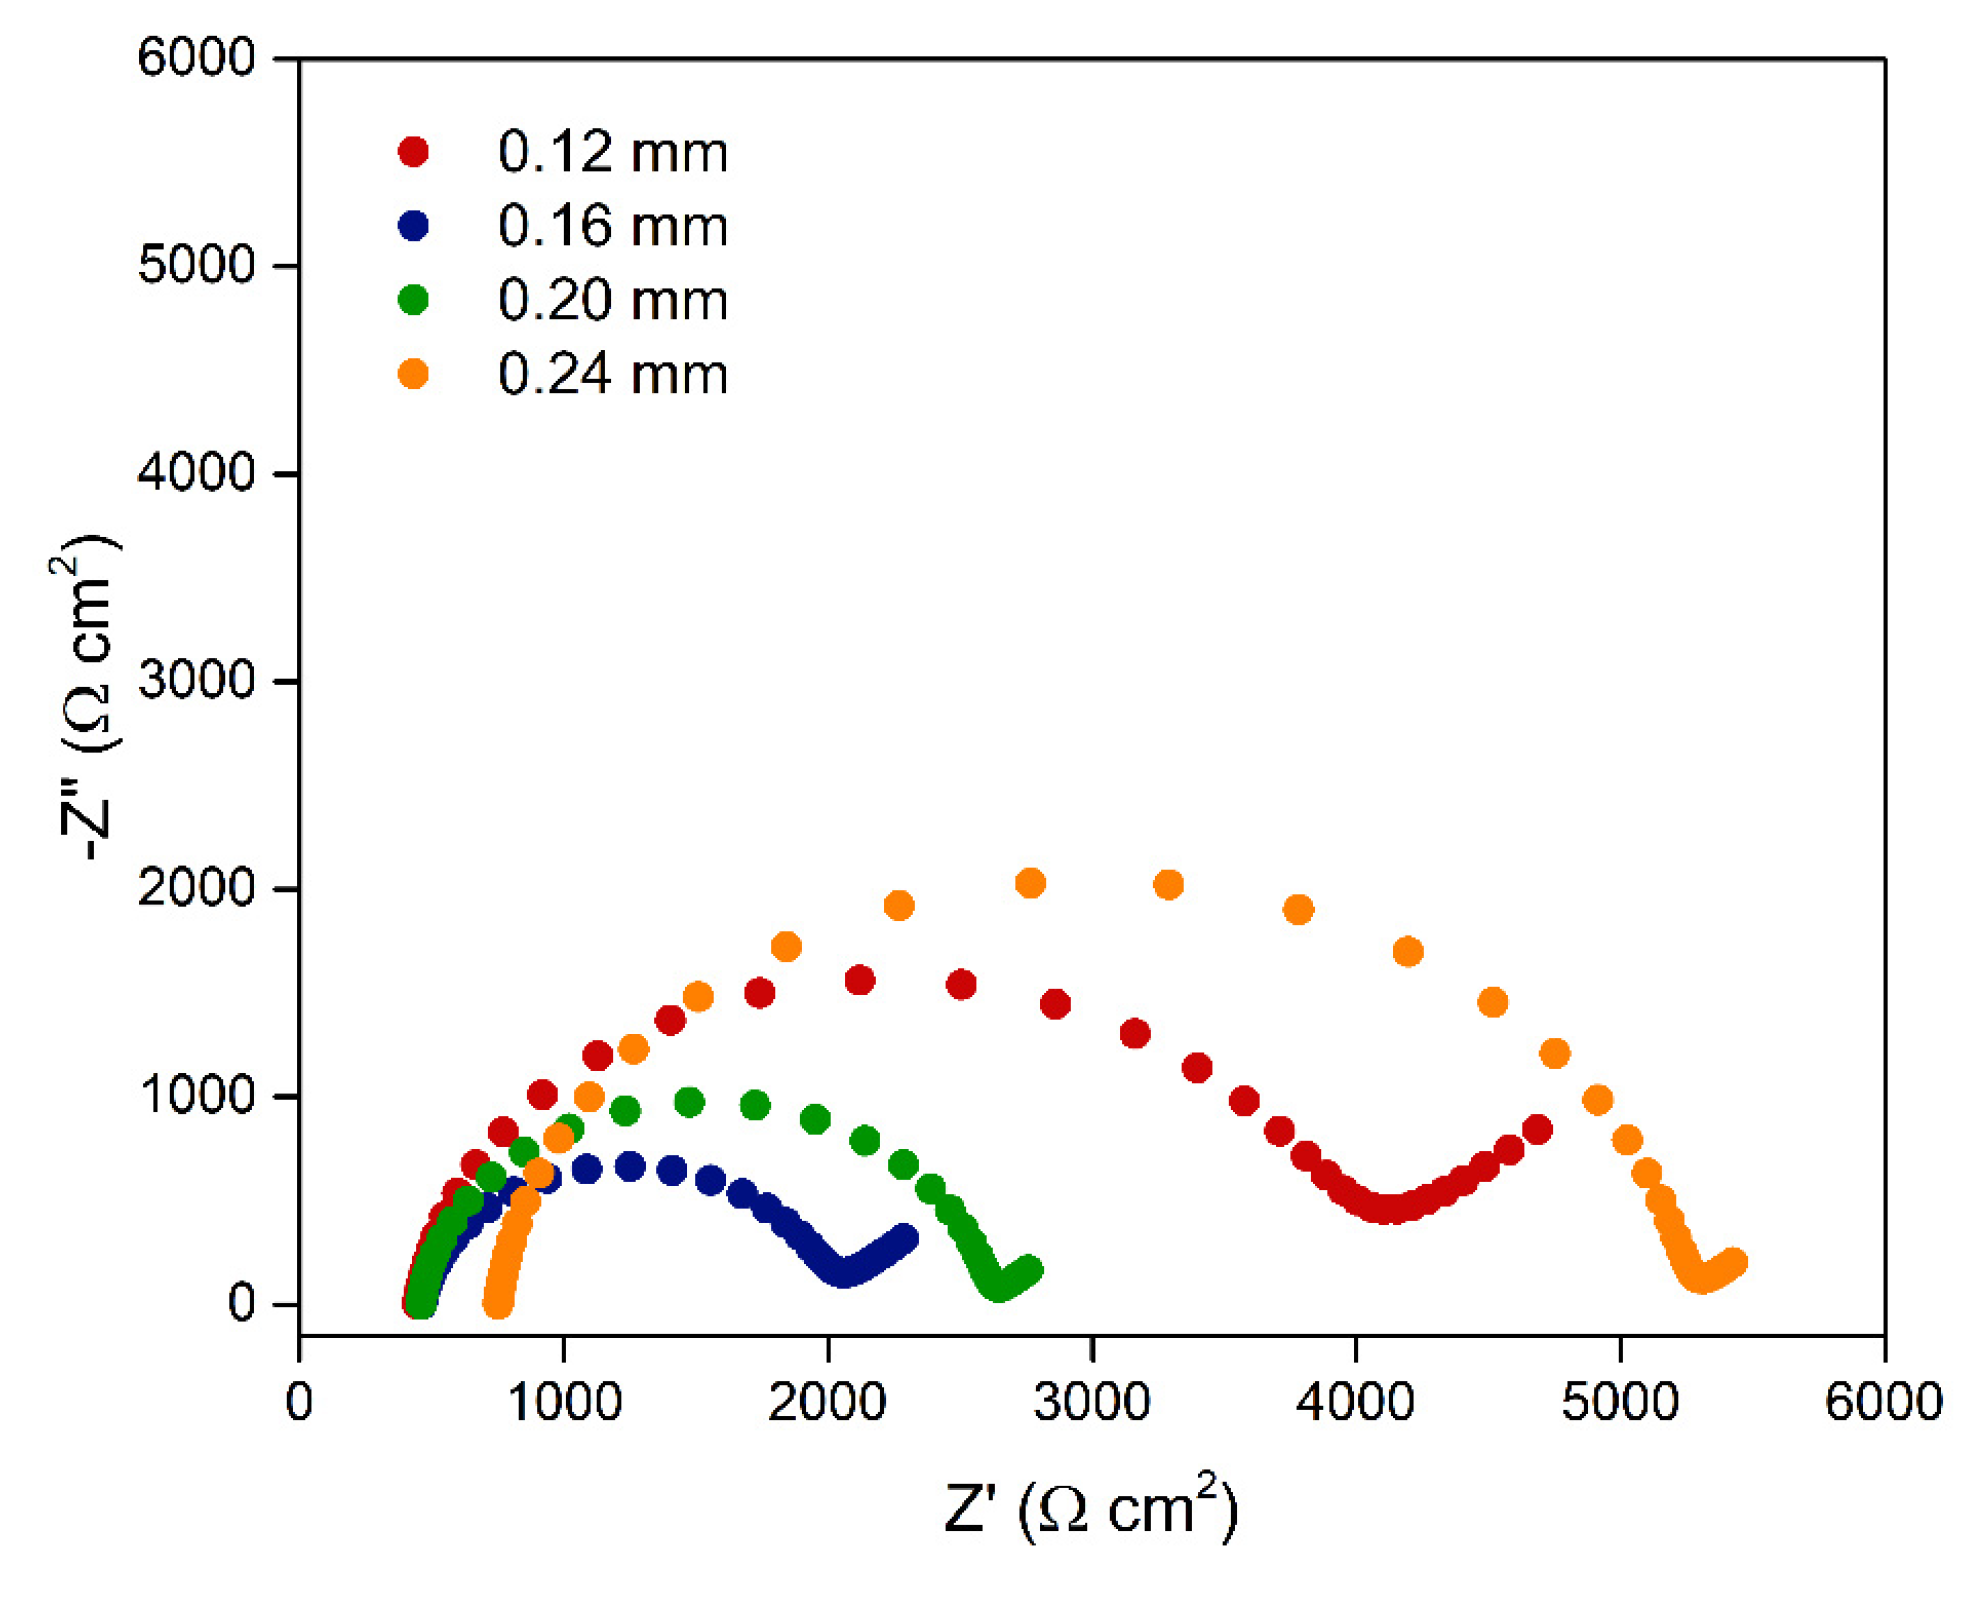
The next parameter investigated was the layer height, and the corresponding results are presented in
Figure 5.
Similar to extrusion temperature, the layer height directly influences the organization of conductive particles within the polymer matrix after printing. Thinner layers promote the rearrangement and compaction of CB particles during extrusion, increasing their contact density and, consequently, the formation of continuous conductive pathways. In contrast, thicker layers result in greater spacing between particles, with PLA (an insulating material) intercalating between them, which impairs electrical connectivity and increases R
ct. [
23,
24]
These tendencies were confirmed experimentally. The 0.16 mm layer height exhibited the lowest Rct (1.51 ± 0.11 kΩ.cm²), whereas the 0.20 and 0.24 mm settings produced higher values (2.14 ± 0.40 and 4.49 ± 0.19 kΩ.cm2, respectively). Although the 0.12 mm layer was the thinnest and theoretically the most favorable, it showed a high Rct (3.45 ± 0.04 kΩ.cm²), likely due to physical limitations associated with the 0.4 mm nozzle, which hinder the stable deposition of very thin filaments and may lead to adhesion failures and microstructural defects capable of compromising conductivity.
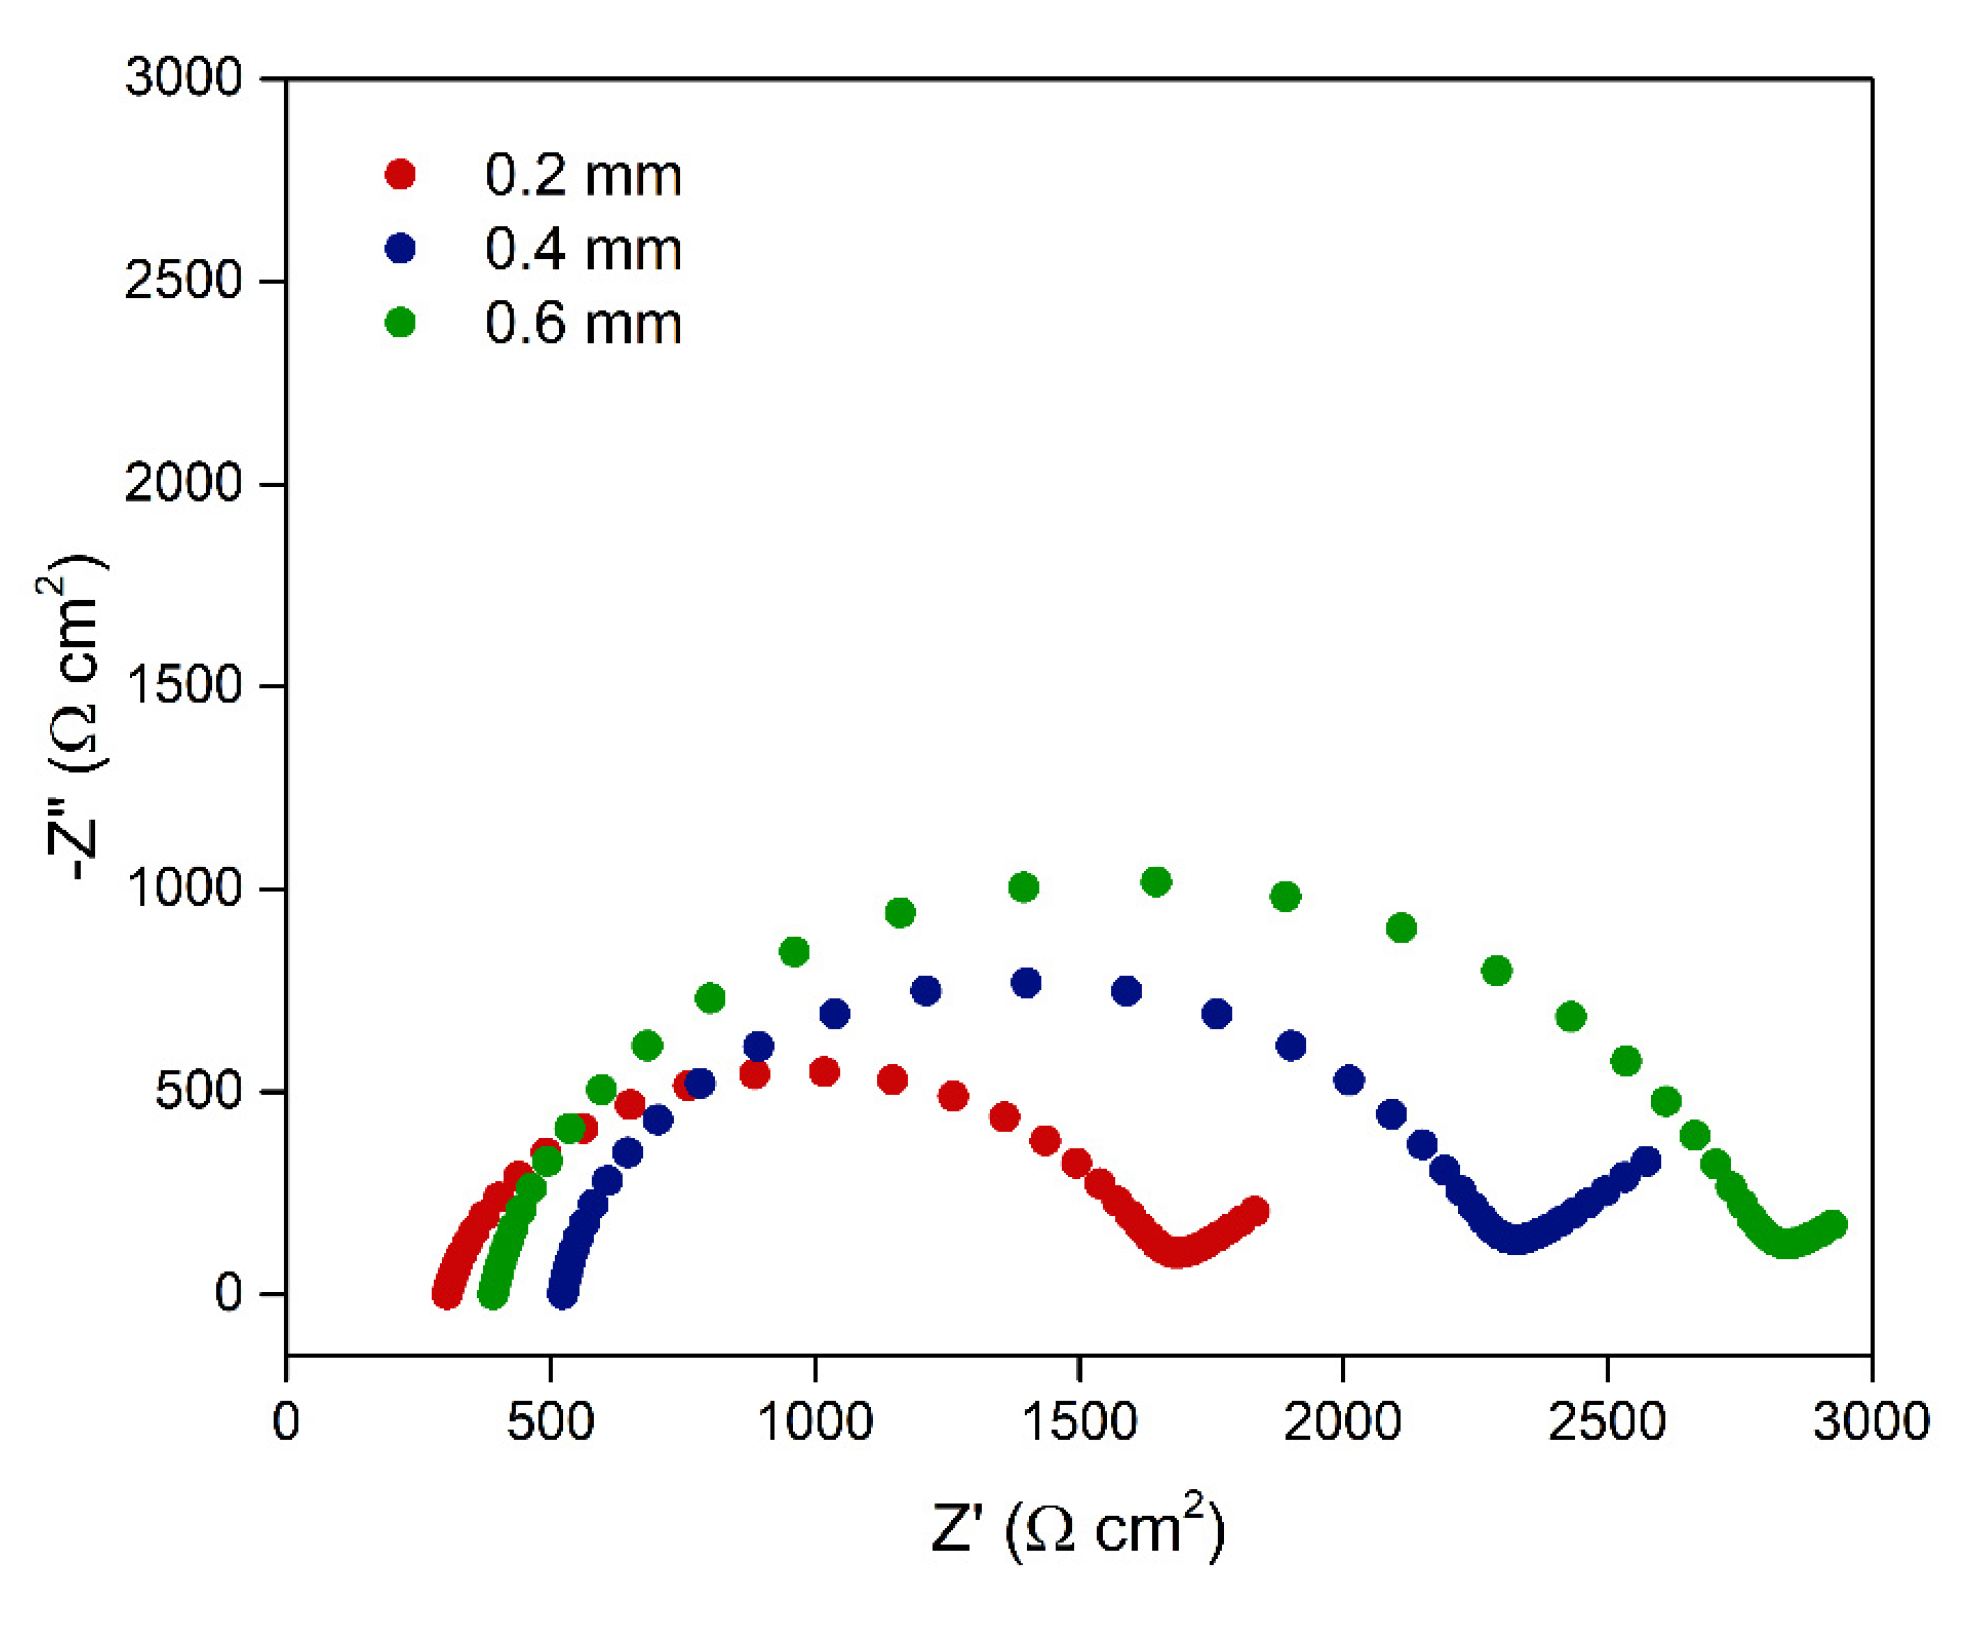
Next, the line width was evaluated (
Figure 6), a parameter that also influences the organization of CB particles, but in the horizontal plane. Narrower printed lines tend to keep CB particles closer together and more uniformly distributed, favoring the formation of efficient conductive pathways. In contrast, wider lines promote excessive dispersion of CB particles within the PLA matrix, compromising interparticle contact and, consequently, hindering the formation of an effective percolative network. [
25] This effect becomes experimentally evident through the progressive increase in R
ct values as the line width increases. The condition with a 0.2 mm line width yielded the lowest R
ct (1.34 ± 0.08 kΩ·cm²), indicating the formation of well-connected conductive pathways (
Figure 6). Conversely, larger line widths, such as 0.4 mm (1.73 ± 0.24 kΩ·cm²) and 0.6 mm (2.38 ± 0.18 kΩ·cm²), resulted in lines with more dispersed CB particles, which is reflected in the higher R
ct values and confirms the reduced efficiency of the percolative network
.
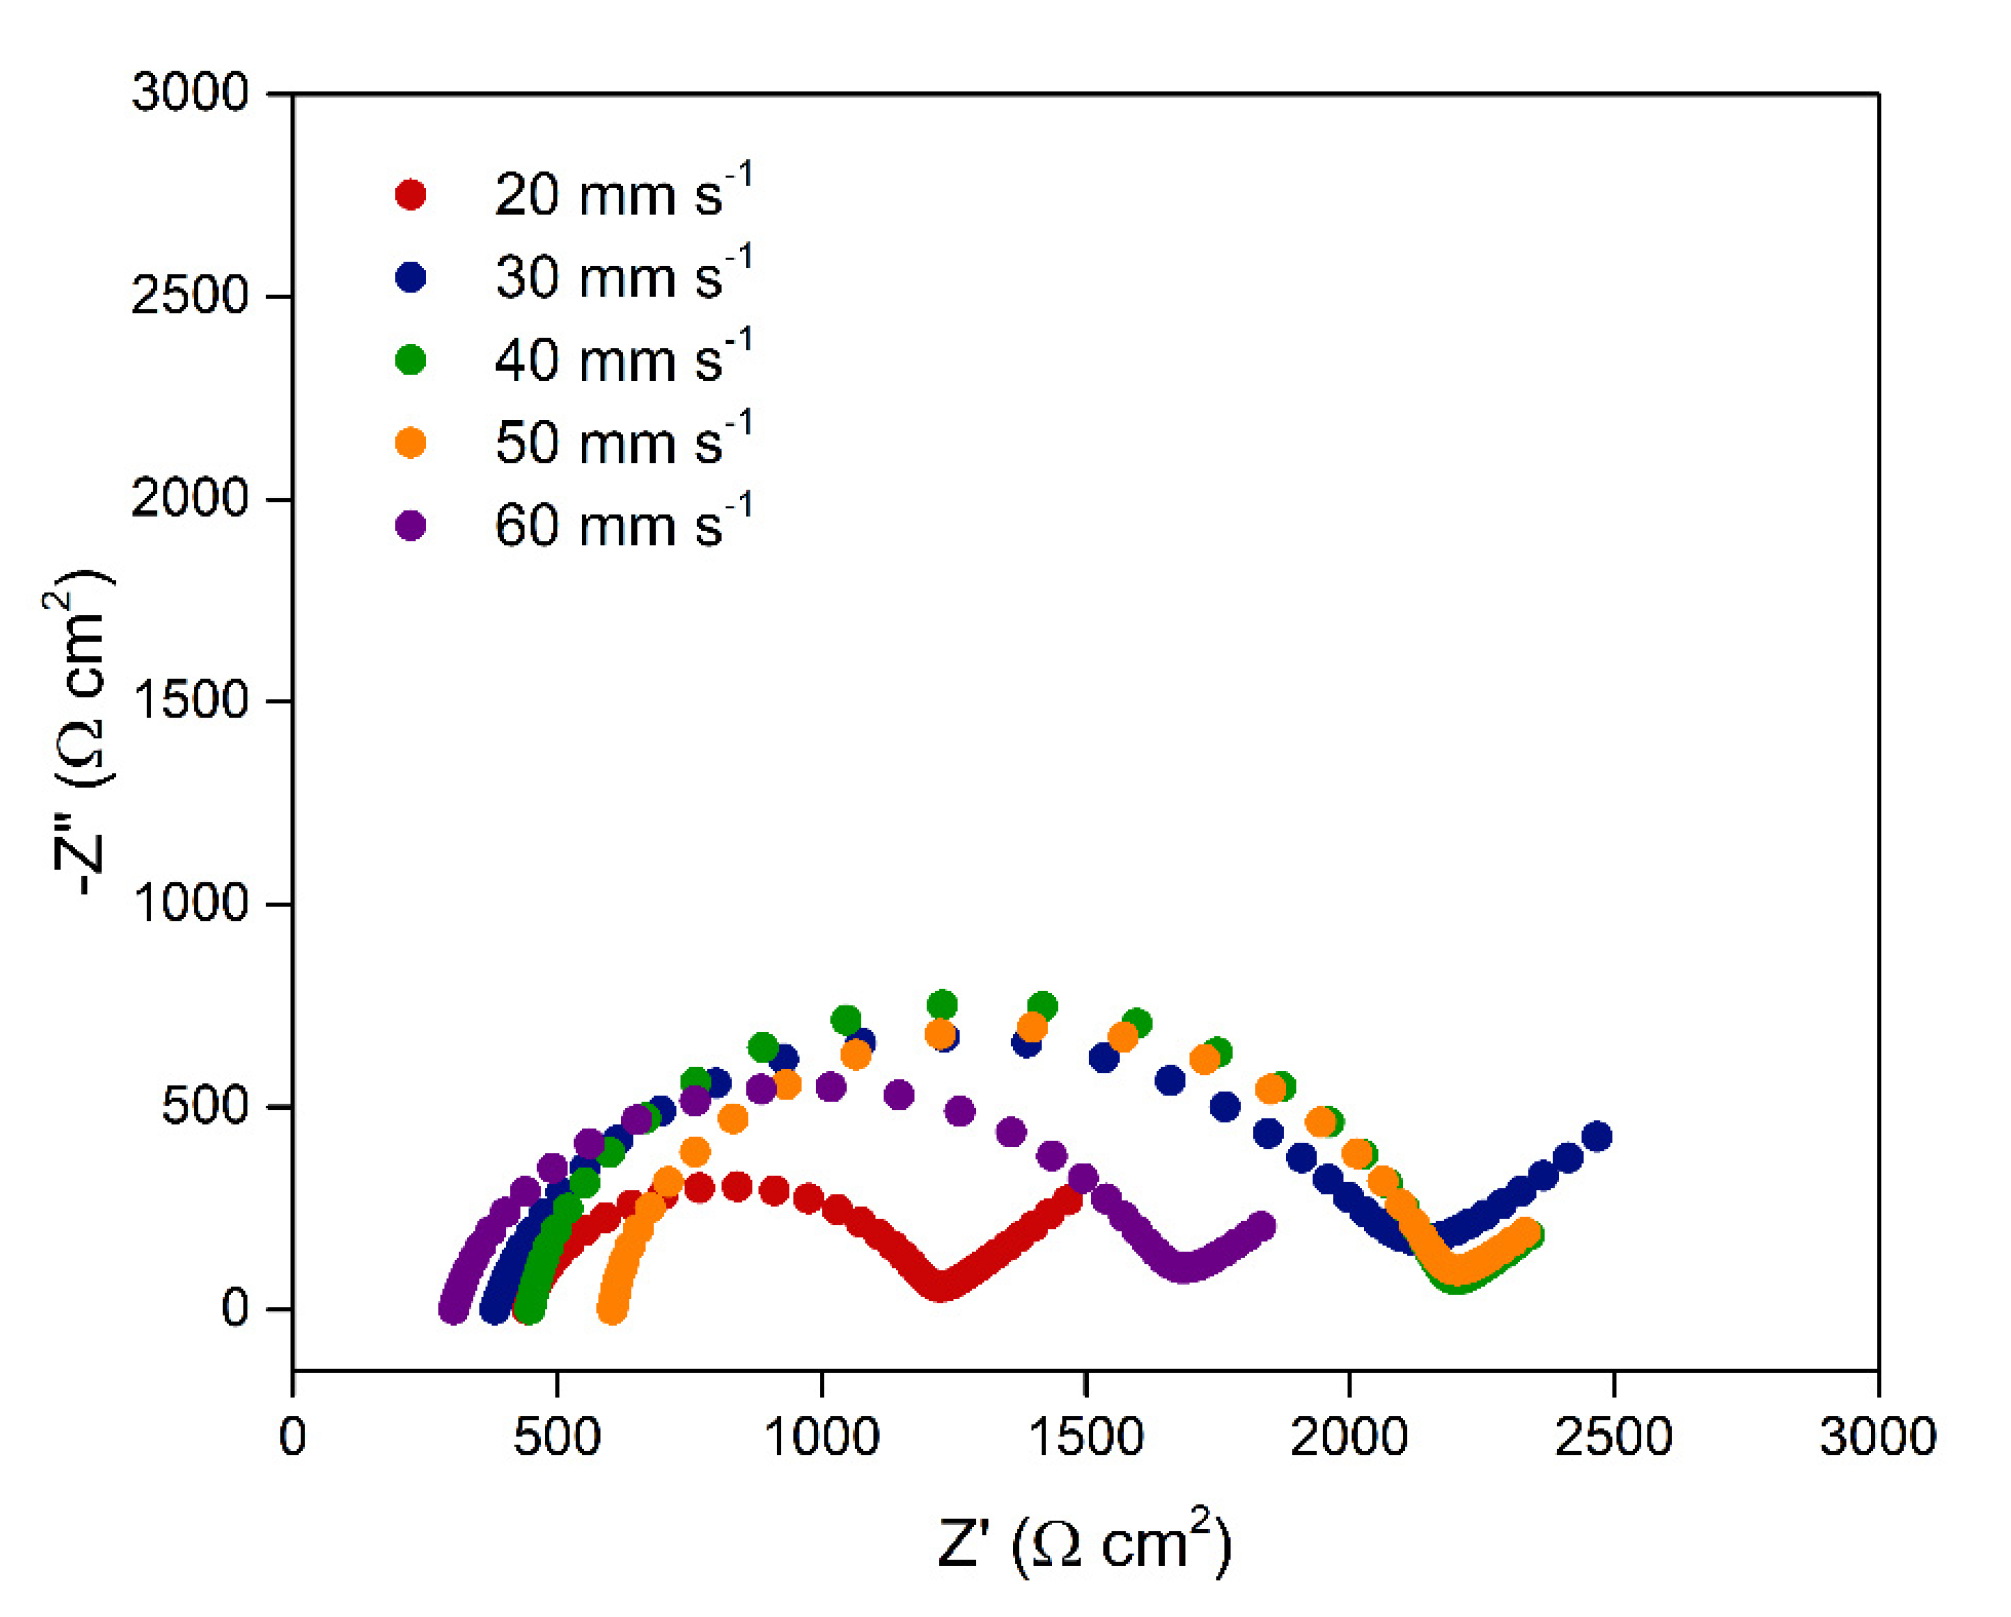
The effect of printing speed on the electrode electrochemical response was also evaluated, as illustrated in
Figure 7. Although this parameter is often associated primarily with process productivity, it directly influences the microstructure of the printed material and, consequently, the quality of the electrode.
Lower printing speeds allow greater precision in material deposition and promote improved adhesion between successive layers, as there is sufficient time for thermal fusion between them. This results in electrodes with better geometric definition and higher structural uniformity, while also enabling a more efficient organization of CB particles within the polymer matrix, thereby enhancing the formation of conductive pathways and reducing R
ct. However, it is important to consider that excessively slow speeds compromise the practical viability of the process, particularly in large-scale manufacturing contexts. [
25]
In contrast, higher printing speeds, although significantly reducing fabrication time, tend to compromise filament deposition. Increasing the speed may lead to incomplete extrusions, imprecise layer overlap, or poor fusion between adjacent filaments. Furthermore, the reduced contact time between the extruded material and the adhesion surface hinders the proper accommodation of conductive particles within the matrix and increases the likelihood of void formation or regions with excess insulating PLA, ultimately impairing electrical conductivity.
The lowest Rct was obtained at 20 mm s⁻¹ (0.76 ± 0.01 kΩ.cm²). From 30 mm s⁻¹ onward, a gradual increase in resistance was observed, reaching 1.68 ± 0.28 and 1.71 ± 0.25 kΩ.cm² at 30 and 40 mm s⁻¹, respectively, indicating reduced deposition control and poorer interlayer adhesion. Printing speeds of 50 and 60 mm s⁻¹ resulted in Rct values of 1.55 ± 0.02 and 1.34 ± 0.22 kΩ.cm², respectively, which were lower than expected but accompanied by greater variation among replicates, suggesting reduced reproducibility and a higher susceptibility to defects related to imprecise layer stacking. Thus, the results indicate that 20 mm s⁻¹ represents the most suitable condition, offering the best balance between deposition quality, conductive particle organization, and sample-to-sample consistency.
Finally, an evaluation of the number of conductive layers was performed to determine its influence on the resistance of the printed electrodes. For this assessment, the height of individual layers (0.16 mm) was kept constant, while the total height of the conductive region was varied. Considering a fixed 0.2 mm PLA base, the configurations of the conductive region are presented in
Table 2.
Significant variations in Rct were observed among the different configurations, directly reflecting the effect of the number of conductive layers on the electrochemical performance of the material.
An initial increase in the number of conductive layers promoted a consistent reduction in Rct, reaching its minimum value with four layers. This behavior is consistent with the percolation model applied to FDM-fabricated electrodes: the addition of successive layers increases the thickness of the conductive region, enhancing the continuity of conductive pathways and consequently increasing the contact density among CB particles. However, the use of five layers increased Rct, indicating the presence of an optimal limit for the thickness of the conductive region.
This effect can be attributed to several structural factors associated with the printing process: (i) greater accumulation of internal stresses and variations in interlayer adhesion; (ii) less efficient distribution of conductive tracks throughout the total height; and (iii) possible introduction of microdefects due to increased extrusion time and the overlap of multiple layers. [
26] Additionally, excessively thick conductive regions may generate structural gradients that reduce the effective exposure of conductive material at the surface, thereby decreasing the electroactive area.
Thus, the results indicate that four conductive layers constitute the most efficient configuration for the electrodes produced in this study, resulting in the lowest Rct and an appropriate structural balance between interlayer adhesion and conductivity. This optimization reinforces the importance of geometric control over the conductive region in FDM-printed electrodes, highlighting that not only layer height, but also the total thickness of the conductive zone, plays a crucial role in forming stable and highly interconnected percolative networks.
Accordingly, the optimized parameters selected were extrusion temperature of 220 °C, layer height of 0.16 mm, line width of 0.2 mm, printing speed of 20 mm s⁻¹, and four conductive layers. This combination yielded the lowest Rct values, reflecting the best electrochemical performance of the 3D-printed PLA/CB electrode.
3.1. Reproducibility
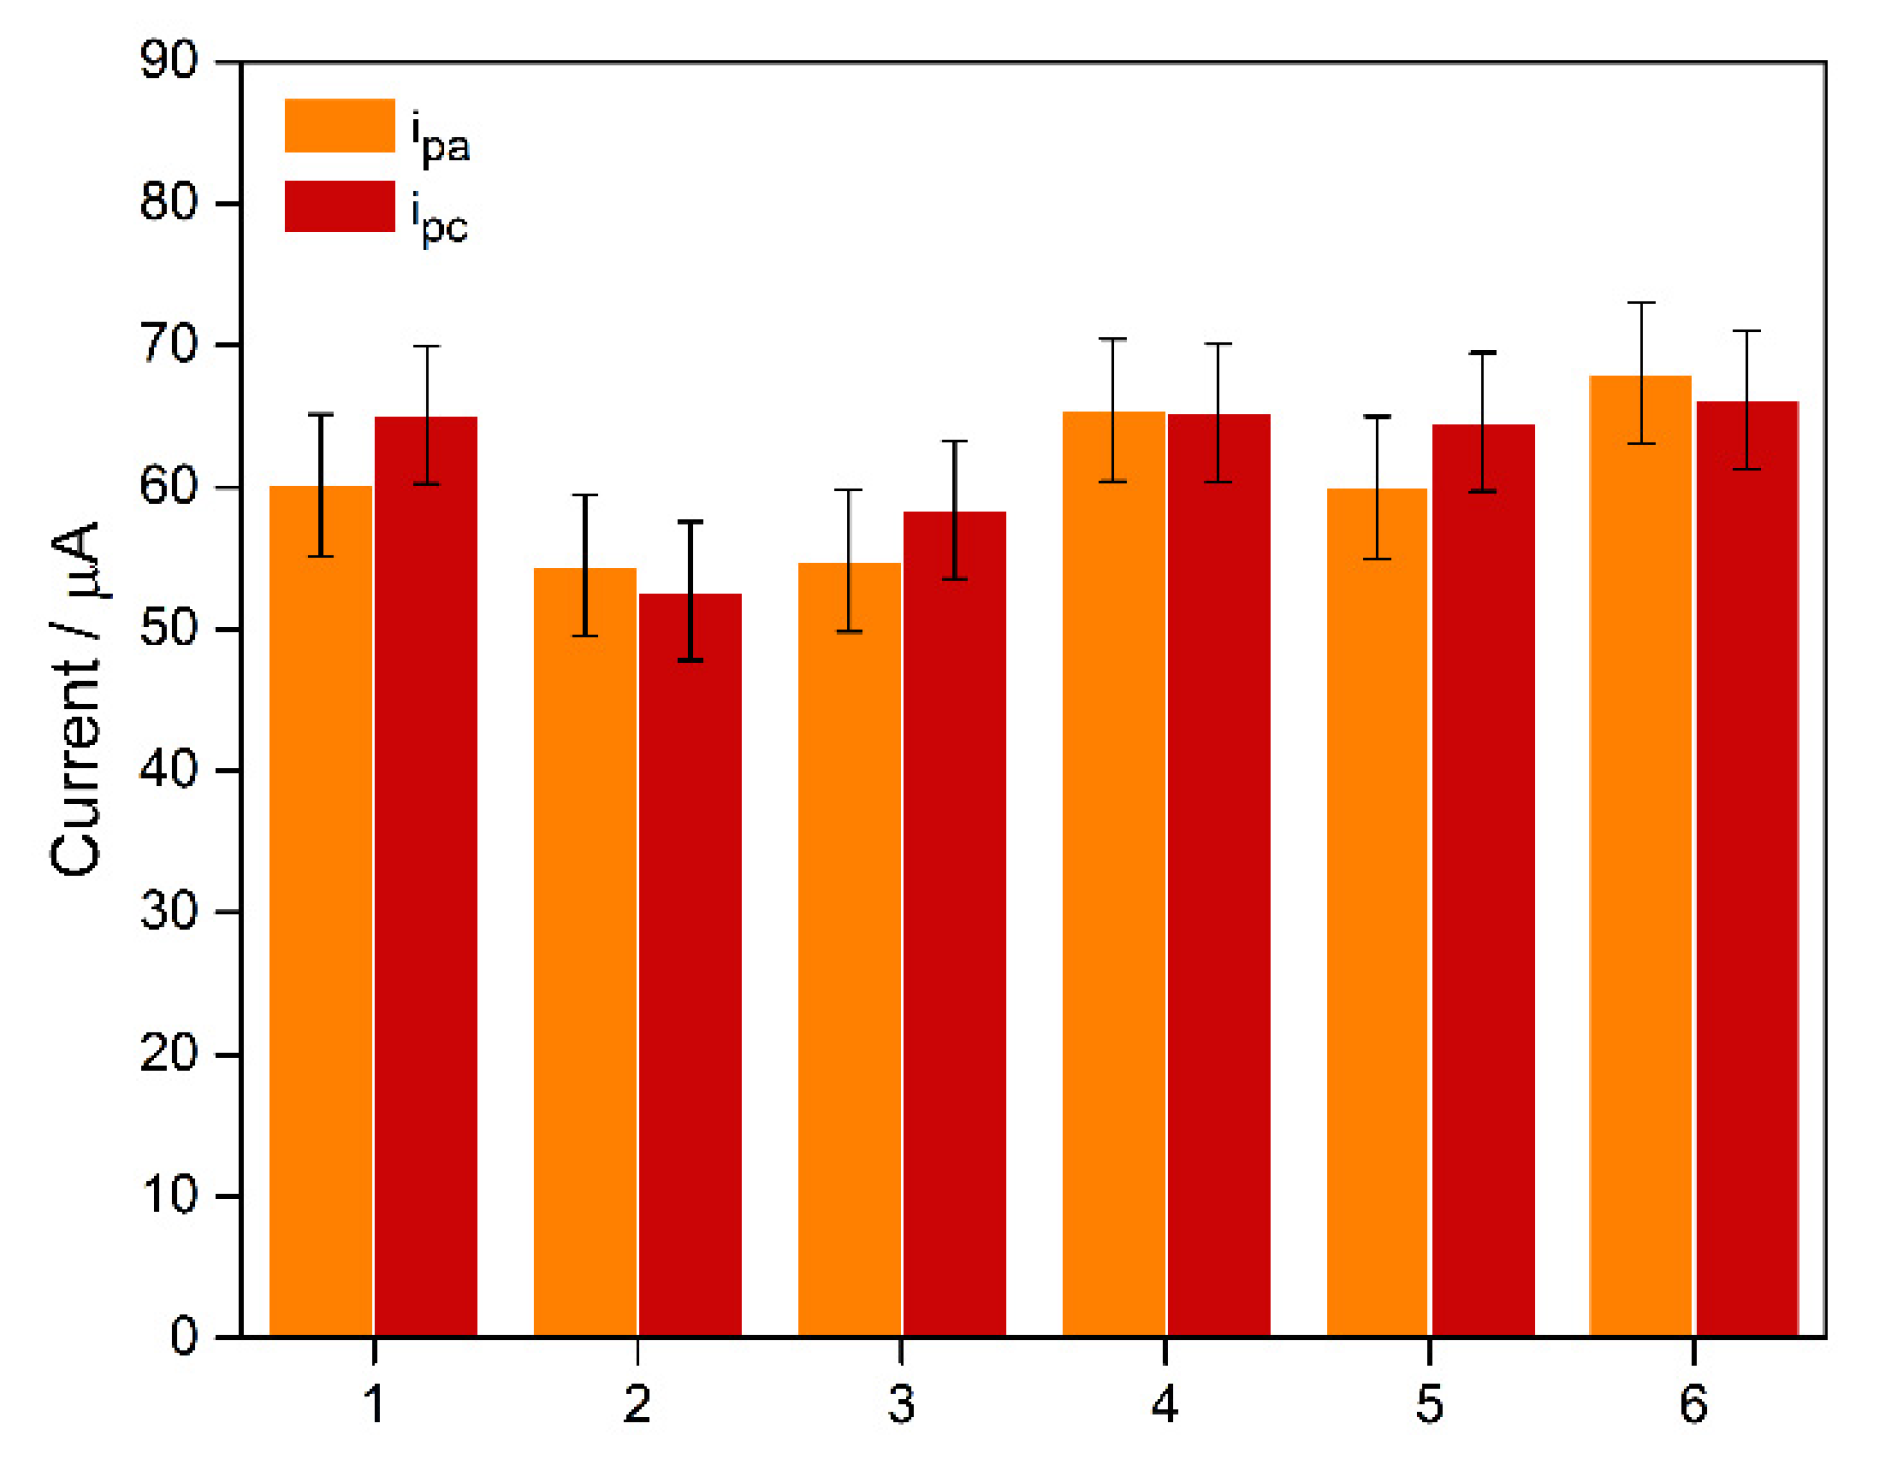
The reproducibility of the 3D-printed electrodes was evaluated using CV with six independent devices (n = 6), as shown in
Figure 8. The anodic (i
pa) and cathodic (i
pc) peak currents were 60.5 ± 0.5 µA and 62.0 ± 0.5 µA, respectively. Based on these results, the relative standard deviation (RSD) was calculated to be approximately 8% for both peaks, indicating moderate variability among the electrodes.
This dispersion mainly arises from the intrinsic heterogeneity of the conductive filament, in which the distribution and packing of conductive particles are not fully uniform. During extrusion, small fluctuations in particle organization and in the formation of percolative pathways can alter the electroactive area and charge-transfer resistance, leading to the differences observed among devices. Additionally, the additive manufacturing process itself, based on layer-by-layer deposition, introduces microstructural variations—such as local differences in interlayer adhesion and material density—that affect the electrical continuity of the electrode.
Despite these inherent limitations of additive manufacturing, the RSD < 10% demonstrates that the optimized printing parameters were effective in producing electrodes with consistent electrochemical performance suitable for analytical applications.
3.2. Dopamine Sensing Performance of the 3D-Printed PLA/CB Electrode
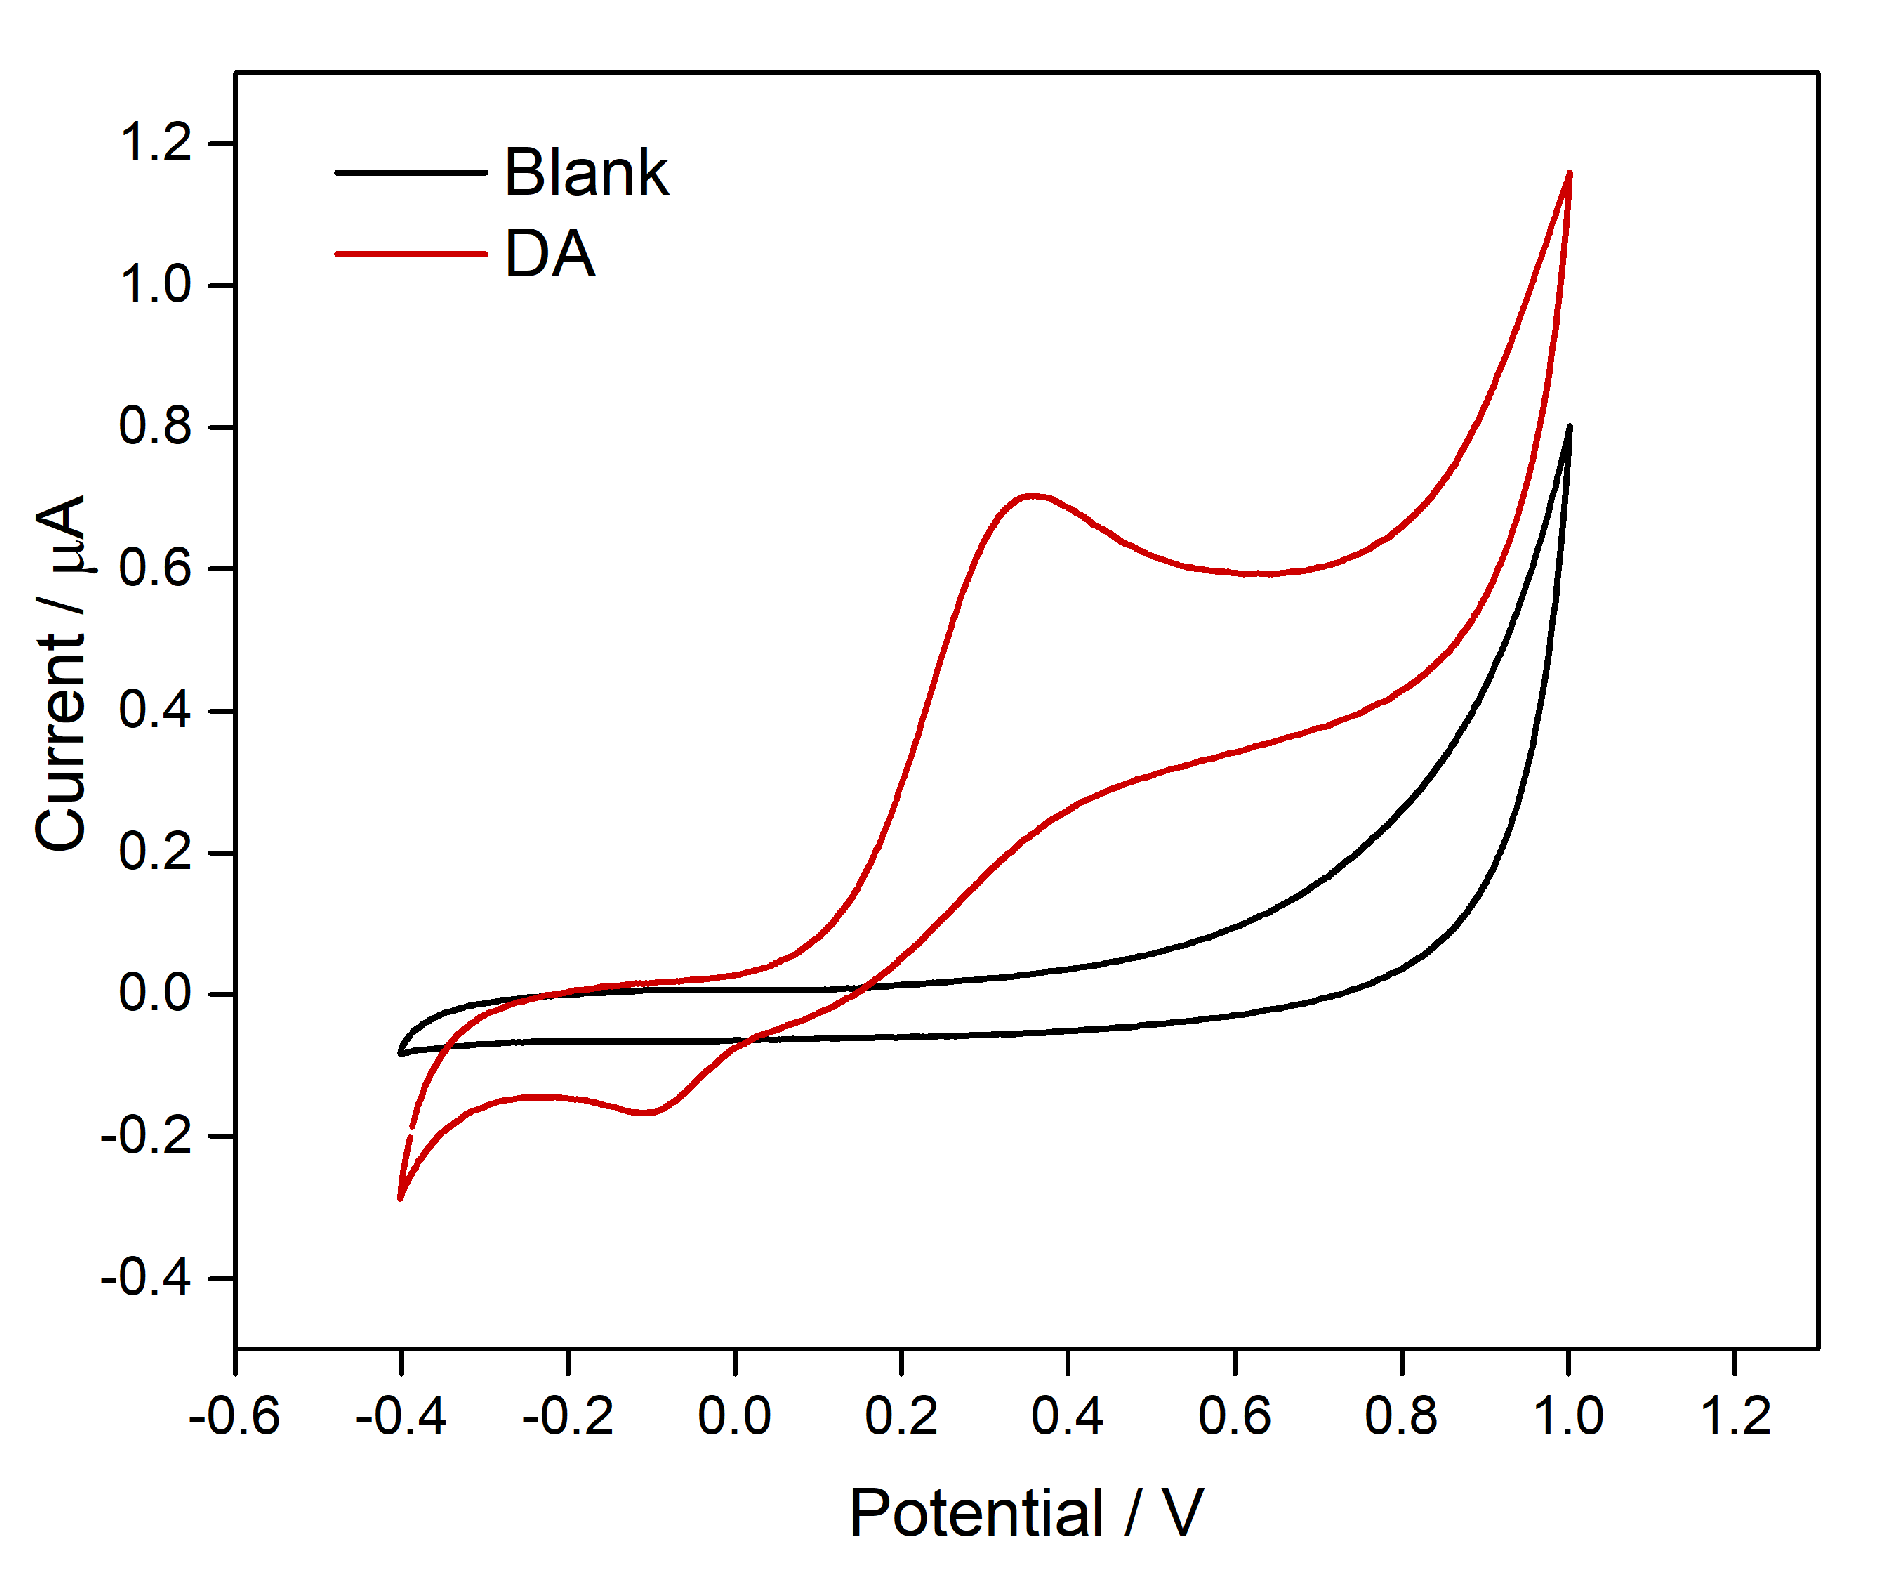
To demonstrate the applicability of the developed 3D-printed PLA/CB sensor, it was employed for the detection of dopamine (DA). Initially, the electrochemical behavior of DA was evaluated by cyclic voltammetry (CV) using a 10.0 µmol L⁻¹ DA solution in 0.1 mol L⁻¹ phosphate buffer (pH 7.0) as the supporting electrolyte, and the 3D-printed PLA/CB electrode prepared in this study.
Although the 3D-printed PLA/CB electrode responds to the presence of dopamine, the electron-transfer kinetics are limited, indicating low charge transfer efficiency in the redox process (
Figure 9). The study revealed a pronounced asymmetry between the anodic peak (+0.337 V) and the cathodic peak (–0.097 V), resulting in a peak-to-peak separation of 434 mV, which is characteristic of a system with limited reversibility. These limitations arise from the intrinsic properties of the composite material. The electrode is composed of a conductive CB phase dispersed within an insulating PLA matrix, forming, according to percolation theory, a heterogeneous network of electroactive microdomains randomly distributed throughout the structure. This arrangement differs substantially from the behavior of conventional metallic electrodes, whose homogeneous surfaces favor electronic conduction. [
27] Furthermore, the filament used contains only 20% CB, an insufficient amount for establishing a continuous conductive network, and incorporates insulating polymeric additives not specified by the manufacturer, which further disrupt conductive pathways and hinder electron transfer between the oxidized and reduced forms of dopamine.
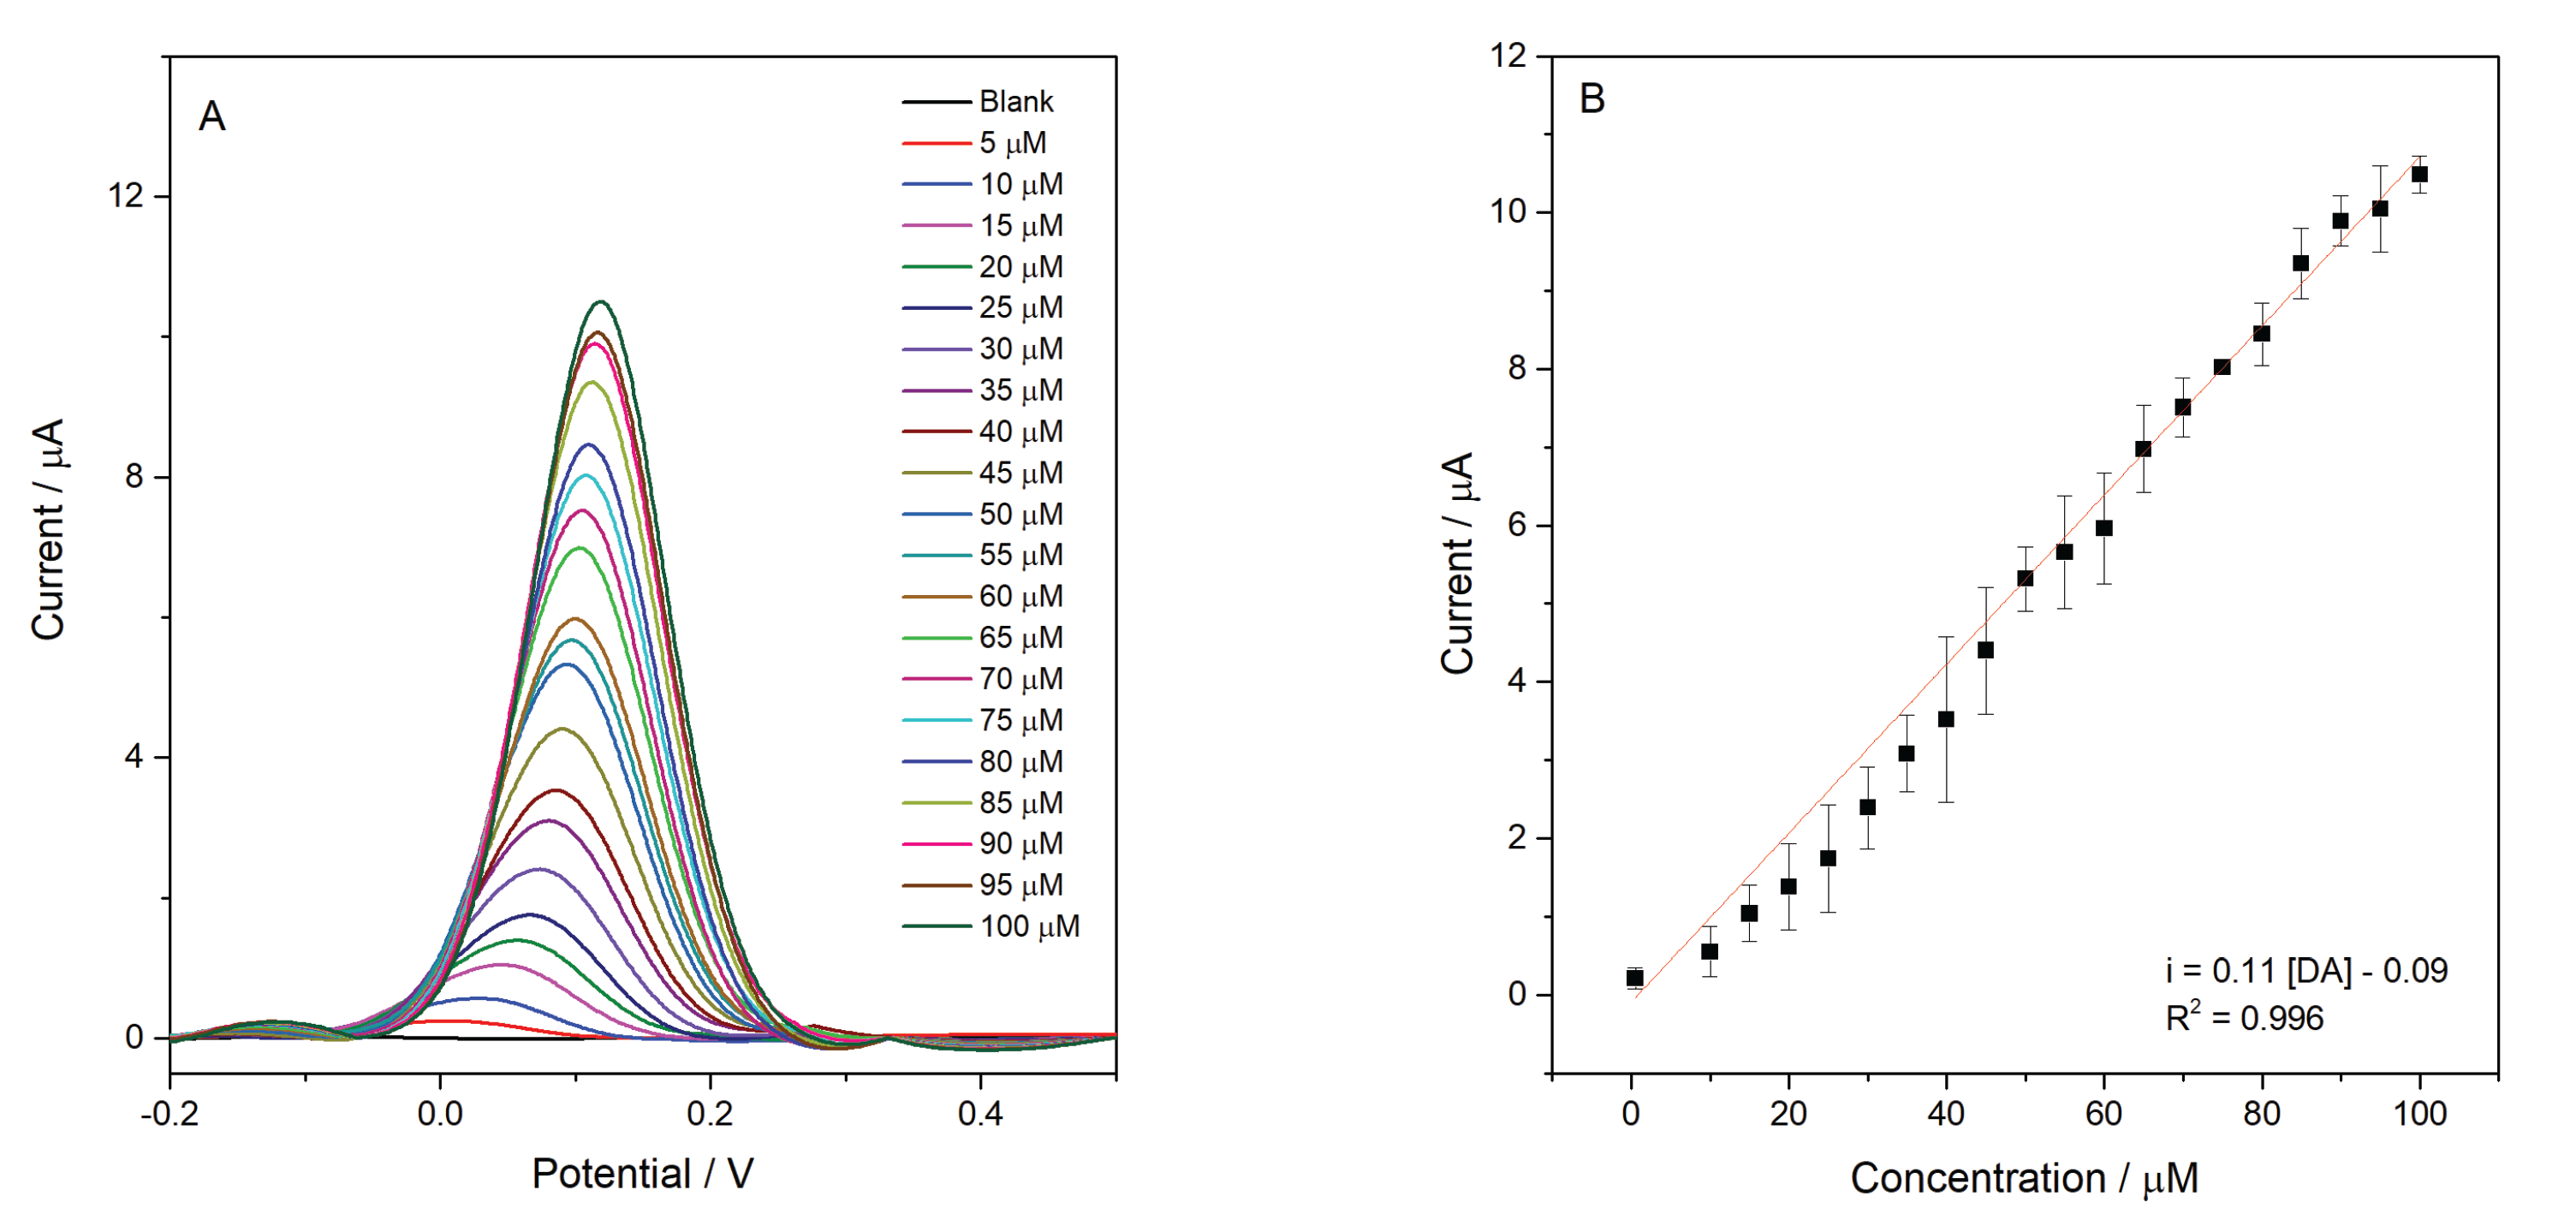
To further investigate its analytical performance, the 3D-printed PLA/CB electrode was employed for the quantification of DA using square wave voltammetry (SWV), reinforcing its viability as an electrochemical sensing platform. A linear range (LR) from 0.5 to 100.0 μmol L⁻¹ was obtained (R² = 0.996), as shown in
Figure 10. From the analytical curve, the LOD, LOQ, and sensitivity were determined, corresponding to 0.16 μmol L⁻¹, 0.50 μmol L⁻¹, and 0.11 μA/μmol L⁻¹, respectively. The LOD and LOQ calculations followed IUPAC recommendations, using 3.3 times the standard deviation of the blank divided by the slope of the calibration curve for LOD, and 10 times this value for LOQ.
The detection of DA using 3D-printed electrodes, as well as glassy carbon and screen-printed electrodes, has already been extensively reported in the literature.
Table 3 presents the LR and LOD values reported in several studies.
The ability of the optimized PLA/CB electrode to detect DA under minimal fabrication conditions demonstrates that the printing parameters themselves play a decisive role in determining electrochemical performance. Although the analytical response is lower than that of chemically modified or nanostructured electrodes, the results show that rigorous control over extrusion temperature, layer height, line width, printing speed, and number of conductive layer is a fundamental step toward producing a high-quality sensor.
In contrast to most reported systems, the sensor developed in this work was able to detect DA without any surface modification or activation step. Additionally, all three electrodes (working, quasi-reference, and counter) were fully 3D-printed using PLA/CB, eliminating the need for external components. This integrated configuration simplifies the setup and enables the fabrication of a complete electrochemical device in a single, low-cost and rapid printing process, highlighting the platform as an accessible alternative for 3D-printed sensing.
Figure 1.
Isometric view of the designed 3D-printed electrochemical sensor, showing the geometry of the working, counter, and quasi-reference electrodes, along with the main dimensional features, the conductive tracks and connection terminals. All measurements shown correspond to the CAD model and are expressed in millimeters. The radius of the working electrode is 2 mm.
Figure 2.
Schematic representation of the development of the 3D-printed electrochemical sensor composed of PLA/CB.
Figure 2.
Schematic representation of the development of the 3D-printed electrochemical sensor composed of PLA/CB.
Figure 3.
Equivalent circuit used for fitting the EIS data.
Figure 3.
Equivalent circuit used for fitting the EIS data.
Figure 4.
Photographs of the 3D-printed electrodes at different extrusion temperatures: A = 210 °C, B = 215 °C, C = 220 °C, D = 230 °C, and E = 240 °C. For each condition, images of the set of three electrodes (working, reference, and counter electrode) are shown, followed by a zoomed view of the working electrode. On the right, SEM micrographs of the lateral view of the working electrode highlight the differences in layer adhesion as a function of extrusion temperature.
Figure 5.
Nyquist diagram corresponding to the electrochemical response of the 3D-printed PLA/CB electrode fabricated with different layer heights (0.12 – 0.24). The analyses were performed in a solution containing 2.5 mmol L⁻¹ equimolar [Fe(CN)₆]³⁻/⁴⁻ in 0.1 mol L⁻¹ KCl, within the frequency range from 10⁵ to 10-2 Hz, under open-circuit potential (OCP) conditions.
Figure 6.
Nyquist diagram corresponding to the electrochemical response of the 3D-printed PLA/CB electrode fabricated with different line widths. The analyses were performed in a solution containing 2.5 mmol L⁻¹ equimolar [Fe(CN)₆]³⁻/⁴⁻ in 0.1 mol L⁻¹ KCl, within the frequency range from 10⁵ to 10-2 Hz, under open-circuit potential (OCP) conditions.
Figure 7.
Nyquist diagram corresponding to the electrochemical response of the 3D-printed PLA/CB electrode fabricated at different printing speeds (20 – 60 mm s-1). The analyses were performed in a solution containing 2.5 mmol L⁻¹ equimolar [Fe(CN)₆]³⁻/⁴⁻ in 0.1 mol L⁻¹ KCl, within the frequency range from 10⁵ to 10-2 Hz, under open-circuit potential (OCP) conditions.
Figure 8.
Anodic (ipa) and cathodic (ipc) peak currents for six independently printed 3D electrodes produced under optimized printing parameters. The error bars represent the standard deviation among the devices.
Figure 8.
Anodic (ipa) and cathodic (ipc) peak currents for six independently printed 3D electrodes produced under optimized printing parameters. The error bars represent the standard deviation among the devices.
Figure 9.
Cyclic voltammetric responses in the presence of 10.0 µmol L-1 dopamine at the 3D PLA/CB electrode. Experimental conditions: supporting electrolyte: 0.1 mol L-1 phosphate buffer, pH 7.0; scan rate: 50 mV s-1.
Figure 9.
Cyclic voltammetric responses in the presence of 10.0 µmol L-1 dopamine at the 3D PLA/CB electrode. Experimental conditions: supporting electrolyte: 0.1 mol L-1 phosphate buffer, pH 7.0; scan rate: 50 mV s-1.
Figure 10.
(A) SWV obtained at different DA concentrations (0.5 to 100.0 µmol L-1 in phosphate buffer 0,1 mol L-1, pH 7.0. (B) Calibration curve showing the relationship between DA concentration and current values. Operational parameters: step potential = 1 mV, modulation amplitude = 100 mV, frequency = 10 Hz.
Table 1.
Charge transfer resistance (Rct) values obtained by Electrochemical Impedance Spectroscopy for each extrusion temperature.
Table 1.
Charge transfer resistance (Rct) values obtained by Electrochemical Impedance Spectroscopy for each extrusion temperature.
| Temperature (°C) |
Rct (kΩ cm2) |
| 210 |
2.95 ± 0.48 |
| 215 |
2.56 ± 0.42 |
| 220 |
2.14 ± 0.07 |
| 230 |
3.56 ± 0.98 |
| 240 |
5.38 ± 0.95 |
Table 2.
Relationship between the number of conductive layers, the total height of the conductive region, and the corresponding Rct values.
Table 2.
Relationship between the number of conductive layers, the total height of the conductive region, and the corresponding Rct values.
| Number of conductive layers |
Total height of the conductive region (mm) |
Rct (kΩ.cm²) |
| 2 |
0.32 |
1.46 ± 0.14 |
| 3 |
0.48 |
0.95 ± 0.01 |
| 4 |
0.64 |
0.86 ± 0.19 |
| 5 |
0.80 |
1.10 ± 0.21 |
Table 3.
Comparison of reported DA sensors with our work.
Table 3.
Comparison of reported DA sensors with our work.
| Electrode |
LR
(µmol L-1) |
LOD
(µmol L-1) |
Reference |
| MIP-GCE/TiO2/(PPY-CTS) |
1-10 |
0.281 |
[28] |
| MWCNT-COOH/SPCE |
0-180 |
0.043 |
[29] |
| CeO2/BaMoO4/3DPE |
5-1000 |
2.77 |
[30] |
| Au@3DE |
0.01-20 |
0.084 |
[31] |
| DDA-ZnO/3DPE |
10-8000 |
8.56 |
[32] |
| Plasma g-PLA/AuNPs |
1-1200 x 10-4
|
0.83 x 10⁻⁴
|
[33] |
| MQDs@3DE |
0.01–20 |
0.003 |
[34] |
| 3D-PLA/CB |
0.5-100 |
0.16 |
This work |